
94% of researchers rate our articles as excellent or good
Learn more about the work of our research integrity team to safeguard the quality of each article we publish.
Find out more
ORIGINAL RESEARCH article
Front. Mar. Sci. , 17 July 2024
Sec. Marine Megafauna
Volume 11 - 2024 | https://doi.org/10.3389/fmars.2024.1403240
This article is part of the Research Topic Population Structure and Connectivity of Marine Turtles in the Pacific and Indian Oceans View all 13 articles
 Shawn K. Murakawa1*
 Alexander R. Gaos1
 Devin S. Johnson1
 Brian Peck2Mark MacDonald3
 Elyse Sachs4Frank Pendleton5
 Camryn D. Allen1
 Marylou K. Staman1Shelbie Ishimaru6
 Kyle S. Van Houtan7Alphina Liusamoa8
 T. Todd Jones1
 Summer L. Martin1
Sea turtles are a taxon of conservation concern and are highly migratory, exposing them to a variety of threats (e.g., fisheries bycatch, direct harvest) across their lifetime. Understanding the abundance of nesting females, hatchling production, and migratory movements - three of the most basic biological data needs for this species group - is imperative for population assessment. This study summarizes novel data most relevant to population assessments of the endangered central south Pacific (CSP) green turtle (Chelonia mydas) population, determined from annual rapid assessment surveys (mean survey duration=7.6 days year-1, n=61 survey days over 8 nesting seasons) and satellite telemetry at Rose Atoll, American Samoa, from 2012 to 2019. A minimum of 138 unique females nested in the Rose Atoll National Wildlife Refuge (RANWR) over the study period with 218 total females observed. Satellite tracks of post-nesting females suggest Fiji (n=33/48, 70.2%) is the primary foraging ground for turtles nesting at RANWR, though other areas throughout the south Pacific Ocean are also important. Limited data suggest hatchling production was high (average hatching success=92.3%) and nest temperature data collected from 2017-2019 suggest primary sex ratios were likely balanced during this time. These are positive signs for the resilience of this nesting population, but climate change poses threats to RANWR and other low-lying tropical islands throughout the central south Pacific, as nesting areas are potentially exposed to beach erosion, tidal inundations, and increasing temperatures leading to sex bias and embryonic death.
Effective wildlife management requires an understanding of the basic biological attributes (e.g., reproductive rates and hatching success) of the species to be managed (Beissinger and Westphal, 1998; Meretsky et al., 2011). Sea turtles are a taxon of conservation concern and are highly migratory, exposing them to a variety of anthropogenic threats (e.g., fisheries bycatch and direct harvest, Lewison et al., 2014; Fuentes et al., 2023) across their lifetime (Wallace et al., 2010; Seminoff et al., 2015). Sea turtle population status is commonly assessed by quantifying the number of nesting females in a population and incorporating key productivity parameters such as annual nester abundance (e.g., Mazaris et al., 2017), number of clutches laid (e.g., Broderick et al., 2006), hatchling production (e.g., Brost et al., 2015), and threats (e.g., NRC, 2010). Given this context, understanding the abundance of nesting females, hatchling production, and migratory movements - three of the most basic biological data needs for this species group - is imperative for population assessment.
The green turtle (Chelonia mydas) is found in tropical and temperate regions of the world’s oceans (Seminoff, 2023). The high consumptive and economic value of green turtle eggs, meat, and skin has resulted in severe population declines in many regions (Hirth, 1993; Grant et al., 1997; Craig, 2002; McClenachan et al., 2006), leading to the listing of the species as threatened or endangered (Seminoff et al., 2015) under the United States Endangered Species Act (ESA) in 1978, and as endangered on the International Union for Conservation of Nature (IUCN) Red List of Threatened Species (Allen et al., 2023) in 1982 (Groombridge and Wright, 1982). Subsequent to historical overexploitation (McClenachan et al., 2006; Kittinger et al., 2013), management and conservation efforts executed since the enactment of those pieces of legislation have led to important regional population recoveries (Chan, 2006; Chaloupka et al., 2008; Dutton et al., 2008; Mortimer et al., 2011; Seminoff et al., 2015), highlighting resilience of the species. Still, the conservation challenges confronting the species vary widely across the globe (Wallace et al., 2010; Seminoff et al., 2015).
To recognize these differences, distinct population segments (DPS) were developed under the ESA and regional management units (RMU) under the IUCN that allow for regional adaptations of management approaches (USFWS and NOAA, 1996; Seminoff et al., 2015; Wallace et al., 2023). A total of 11 green turtle DPS units and 17 RMUs are currently recognized globally, including the central south Pacific (CSP) DPS/RMU, which extends north from New Zealand to Fiji, Tuvalu, and Kiribati and east to include French Polynesia (Wallace et al., 2010; Seminoff et al., 2015). Despite little information of nesting abundance, a recent assessment estimates there are 3,000 nesters in the entire CSP DPS that are primarily threatened through persistent harvest of adults and eggs (Seminoff et al., 2015). Despite these general descriptions of the CSP DPS, green turtle nesting levels and trends remain poorly understood for many rookeries in the region (Craig et al., 2004; Seminoff et al., 2015). Scilly Atoll, French Polynesia has had the highest number of green turtle nesters recorded for the CSP DPS, which was estimated at 300-400 annually in the 1990s (Balazs et al., 1995; Allen et al., 2023), followed by (in rank order) Tokelau, Cook Islands, Kiribati, American Samoa, Fiji, Tuvalu, Tonga, and UK overseas territory (Seminoff et al., 2015). Previous research carried out at Rose Atoll National Wildlife Refuge (RANWR) in American Samoa (e.g., Tuato`o-Bartley et al., 1993; Grant et al., 1997; Craig et al., 2004) suggested the area may host one of the most important rookeries in the CSP DPS, but more data are needed as reliable information on nesting levels and post-nesting migrations remains limited (Tuato`o-Bartley et al., 1993; Craig et al., 2004; Seminoff et al., 2015).
In this study we present the results of rapid-assessment nesting beach surveys conducted annually at RANWR from 2012 to 2019 to determine nesting female abundance and hatchling production, as well as the findings from satellite tags deployed on post-nesting females and drifting buoys (“drifters”) to elucidate distant foraging habitats and hatchling dispersal pathways. In doing so, we provide the most comprehensive dataset on green turtle nesting, productivity, and spatial ecology for this data-poor population. We also present information on the importance of Rose Atoll, which can inform future assessment and management endeavors.
Established in 1973, RANWR is part of American Samoa, which is a U.S. Territory located east of the nation of Samoa, in the CSP (Figure 1). The RANWR is located within the Rose Atoll Marine National Monument, which was established in 2009. Rose Atoll, also known by its Samoan names Muliāva (the end of the reef) or Motu o Manu (island of seabirds), is a remote and uninhabited atoll made up of two separate islets, non-vegetated Sand Island and highly densely vegetated Rose Island (Figure 1). Combined, these two islets account for approximately 21 acres (0.085 sq. km.) of terrestrial habitat, with a maximum height of four meters above sea level. The islets are connected by a submerged fringe reef that surrounds a central lagoon with a single access channel along its northern extent. RANWR is an important, federally protected habitat for 17 species of seabirds and shorebirds and green and hawksbill sea turtles (Peck et al., 2016). There are six types of vegetation on Rose: open canopy; coconuts; Heliotropium scrub; young Heliotropium forest; mature Heliotopium forest; and mixed forest (American Samoa Department of Marine and Wildlife Resources unpublished data). The beach consists of loose basalt but is mainly made up of sand and shell/coral rubble (Pendleton, 2014). Public access to the refuge is prohibited and no permanent structures exist on the atoll except for a sign discouraging trespassing. Researchers used mid-size charter vessels (11-14 m) to travel to Rose Atoll from Pago Pago, Tutuila (276 km; 8-12 hours) (Figure 1).
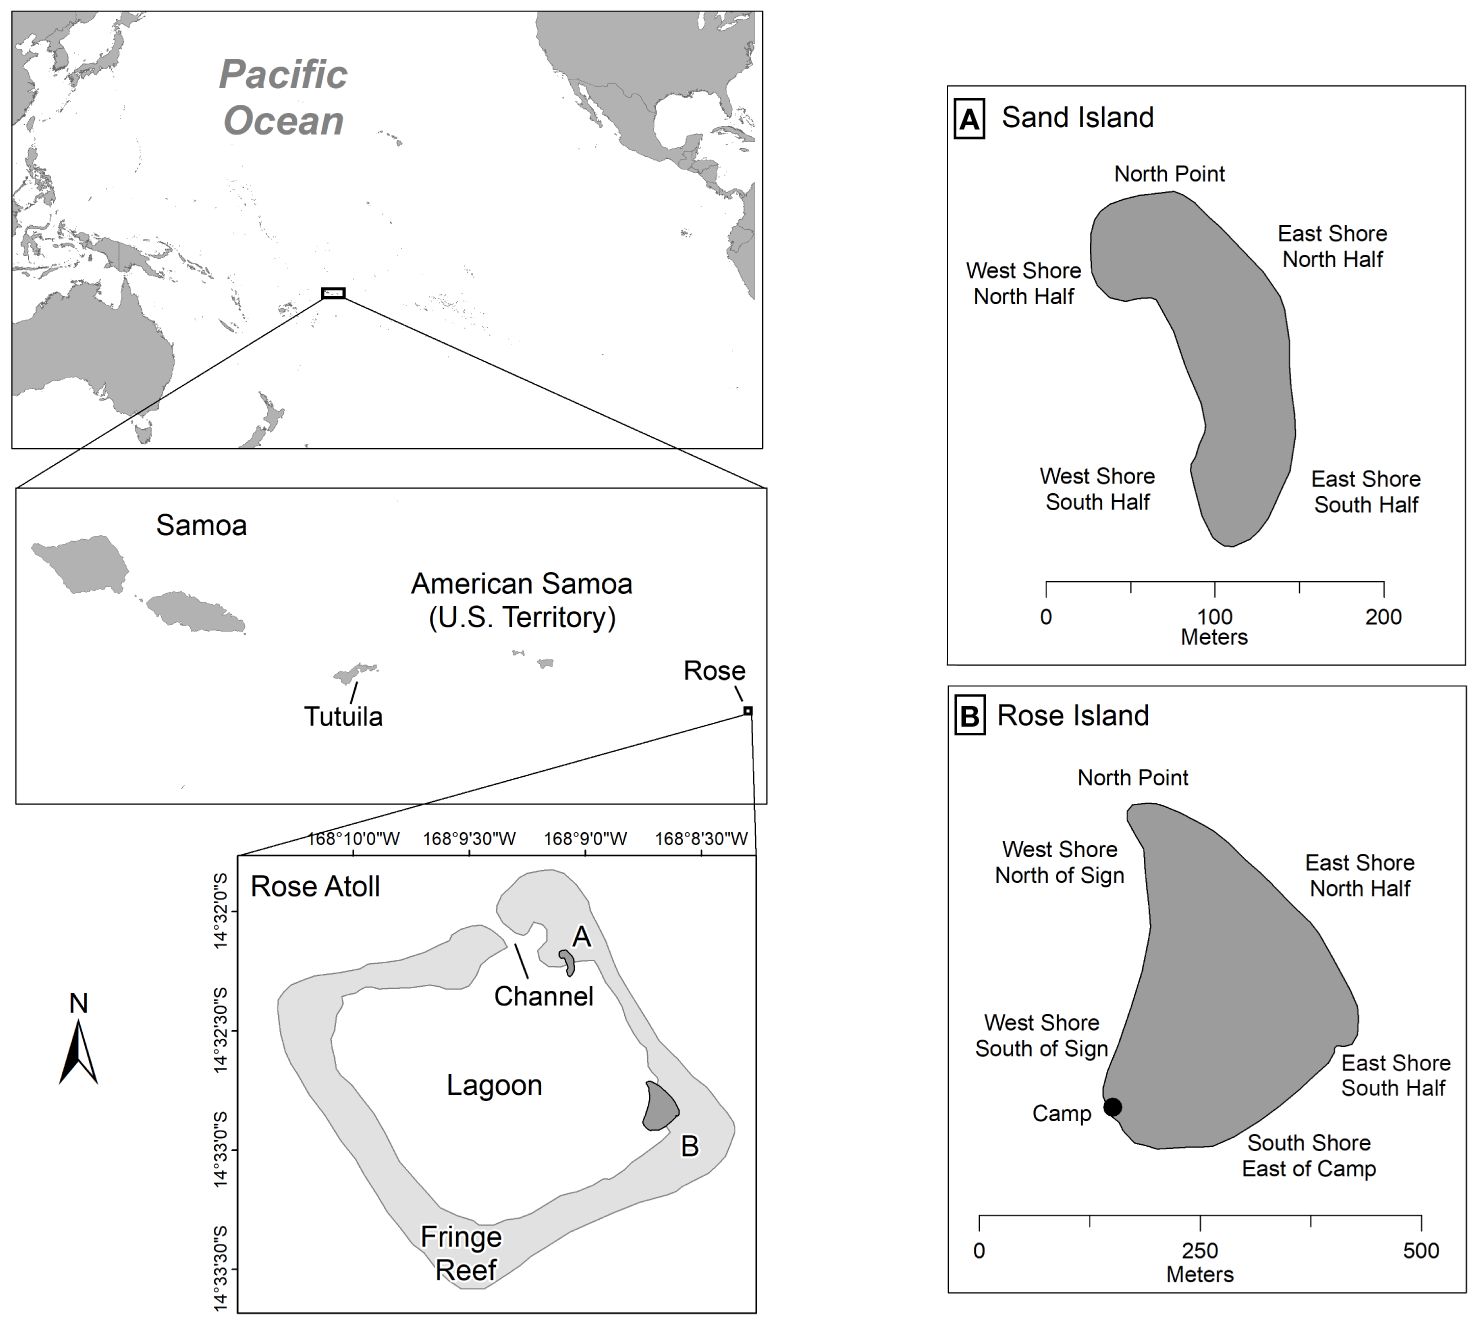
Figure 1 Map depicting the location of Rose Atoll, American Samoa in the Central South Pacific, with insets of (A) Sand Island and (B) Rose Island, including beach sector names.
Fourteen annual rapid assessment surveys of nesting activity consisted of temporary camps (3-7 nights) on Rose Island with up to six researchers conducting night surveys. Additional opportunistic trips occurred throughout the year by the United States Fish and Wildlife Service (USFWS) Refuge Manager. The peak nesting period was estimated to be November through December, similar to Scilly Atoll, French Polynesia which estimated their peak from November through January (Touron et al., 2018). NOAA tide predictions (https://bit.ly/3GTfEZT) were reviewed prior to scheduling each trip to allow for optimum high tide night surveying for the week on Rose Island. The high tide allows the nesters to easily swim or climb over the shallow coral reef that surrounds the island and crawl ashore to nest. Due to the logistical challenges associated with accessing Sand Island from the base camp on Rose Island, monitoring on Sand Island was conducted opportunistically during the day and limited to documenting evidence of nesting (i.e., not encountering females). Seven beach sections were established for Rose Island and five beach sections for Sand Island (Figure 1) to facilitate the recording of nesting activity locations. Sporadic sea turtle monitoring at RANWR was conducted from 1971 to 1992 (NMFS, unpublished data), and although we do not include the results of those efforts here, we reference their findings (Tuato`o-Bartley et al., 1993; Grant et al., 1997) throughout the manuscript.
Night nesting surveys consisted of beach walks circumnavigating Rose Island to encounter nesting turtles and document nesting activity. Surveys were initiated prior to dusk and ended either 1) at sunrise, 2) when no nesting activity was observed for two consecutive hours after midnight, or 3) if severe weather or a tsunami warning arose. When turtles were first encountered, either crawling up the beach or returning to the ocean, the primary goal was to assign a temporary unique alpha-numeric identification code to the carapace using non-toxic appliance paint (Rustoleum® Appliance Epoxy Touch Up Paint, Vernon Hills, IL, United States) in order to count the total number of turtles encountered each year. The secondary goal was to permanently tag turtles if time permitted upon first sighting or if turtles were resighted (with temporary caparace identifiers) upon subsequent days within the same survey year in order to assess population abundance.
Once a turtle completed nesting or was in the process of returning to the ocean without nesting, attempts were made to restrain the turtle with a portable wooden box or with two people, to collect morphometrics, skin samples, and apply permanent tags. Morphometrics included curved carapace length (CCL) and curved carapace width (CCW). Skin samples were collected from the hind flipper, shoulder, or neck region following established protocols (Dutton, 1996). Metal Inconel self-piercing tags (National Band and Tag Company, Newport, KY, United States) were applied to either the front or hind flippers and preloaded sterile passive integrated transponder (PIT) tags (Biomark®, Boise ID, United States) were inserted into the muscle of both shoulder areas of each turtle. Additional data collected for each turtle included species, date, time, site, tumor presence, injuries, and GPS coordinates.
Data were also recorded on which nesting activity (crawl, body pit, chamber, lay, cover, or return) the turtle was engaged in at the time of first observation, as well as the ultimate determination of whether a clutch was successfully laid or not (false crawl, unconfirmed nest, or confirmed nest). For the observed nesting activities: “Crawl” is moving out of the water onto sand or moving around the beach and not heading back into the water; “Body Pit” is the use of the front flippers and body to create a depression in the sand; “Chamber” is the use of the hind flippers to dig a hole in the Body Pit to contain the eggs; “Lay” is the observation of eggs; “Cover” is the hind flippers filling the chamber with sand, sand is being patted down over the chamber, or the front flippers were sweeping large amounts of sand in the Body Pit; and “Return” is heading down from the beach into the water. For nesting success determinations, we define a “False Crawl” as a turtle emerging to nest, but later returning to the water without laying eggs; an “Unconfirmed Nest” references a turtle not observed laying eggs but covering an area repeatedly using her front or hind flippers to spread sand over the body pit; and “Confirmed Nest” is when eggs were observed.
When possible, eggs were counted during oviposition (n=67 nests, Supplementary Table 1) and a temperature data logger (Onset HOBO® TidbiT®, Bourne, MA, United States; n=51, Supplementary Table 2) was placed into the middle of the nest approximately midway through the egg laying process. The temperature loggers were programmed to collect the temperature every two hours (accuracy ± 0.21°C, resolution 0.02°C). The retrieval of the loggers occurred periodically throughout the year during additional visits to the atoll by the USFWS Refuge Manager; nest excavations (see below) were initiated by the USFWS Refuge Manager in 2017.
Hatchlings found during the survey period were measured and weighed. Most hatchlings were opportunistically encountered scurrying near the field camp and were, therefore, not linked to an identified nest. In one instance, 13 individuals were sampled from a single nest. The CCL and CCW were collected with a flexible measuring tape, straight carapace length (SCL, cm) and straight carapace width (SCW, cm) were obtained with a caliper, and weight (g) was measured with a digital scale. Once morphometrics were collected the hatchling was then released (Supplementary Table 3).
Morning or early afternoon surveys were also conducted at Sand Island when feasible. We counted all tracks encountered and traced the tracks back to a nest or “Body Pit”, if possible. Additional data collected included date, time, site, and GPS coordinates of all nesting activity. All turtle tracks were subsequently raked or cleared manually to ensure they were not recounted during subsequent surveys. Day observations were suspended if the team encountered severe weather conditions.
Daytime surveys also included locating and excavating nests, either with known GPS coordinates from previous years, or incidentally encountering an unknown nest. Due to time limitations, excavations were conducted opportunistically by the USFWS Refuge Manager upon return to RANWR to conduct other research projects. The date, time, site, ID of the nester (if known), GPS coordinates, shade cover over the nest (i.e., vegetation cover), and surface substrate of the nest were recorded. In brief, sand and coral rubble were slowly swept away from the top of the egg chamber until the nest remains were encountered. All nest remains were carefully removed and placed on the surface for further evaluation.
Nest contents were then categorized as follows (Miller, 1999): “S” for shells that were >50% whole; “L” for live hatchlings still in the nest; “D” for dead hatchlings found out of the shell and still in the nest; “UD” for unhatched eggs that were undeveloped with no embryo present; “UH” for unhatched eggs with embryo present; “UHT” for unhatched egg with full-term embryo present (see Miller, 1999 for detailed description); “P” for eggs that have nearly whole shells but have been opened (i.e., predated); and “E” for emerged hatchlings that have left the nest. Using these terms and the following formulas from Miller (1999), hatching and emergence success were calculated as follows (see Table 1):
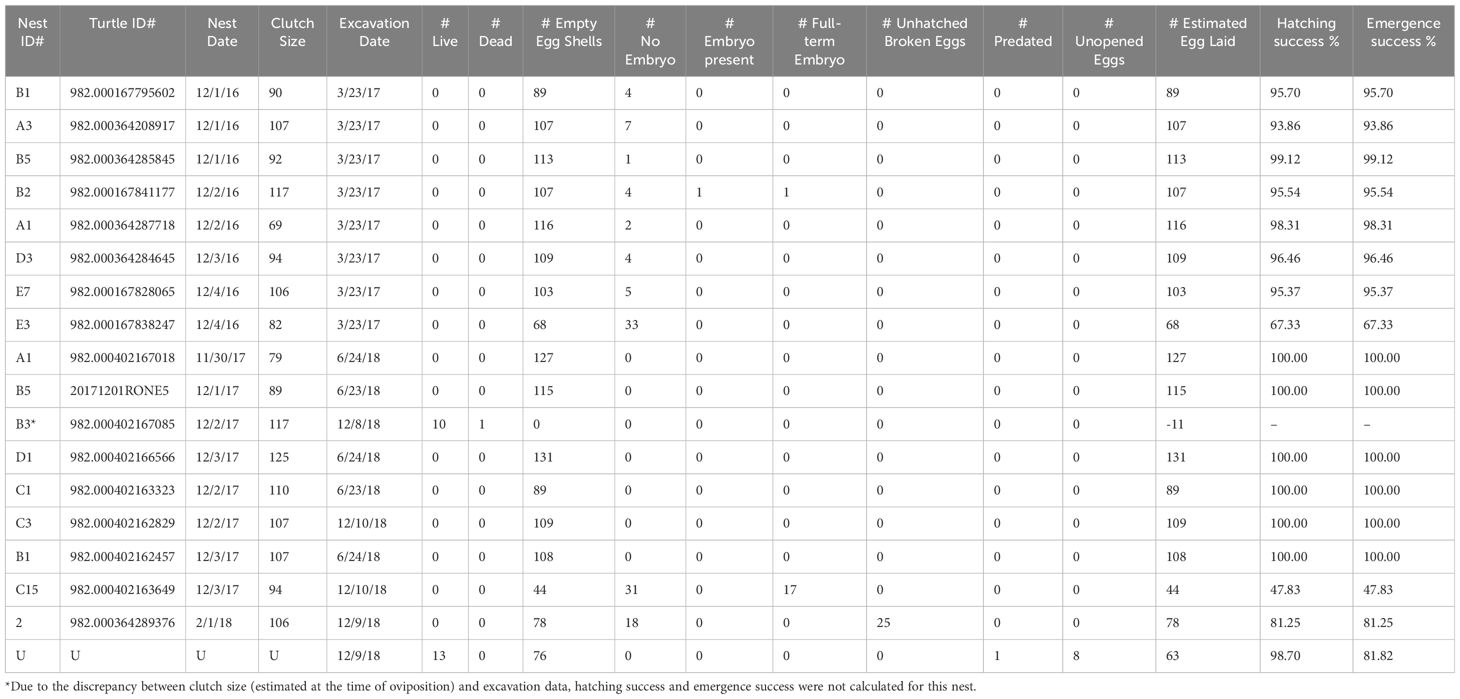
Table 1 Reproductive success data including nest lay date, # of eggs laid, nest excavation date, nest content inventory, and hatching and emergence successes (n=18).
All live hatchlings encountered (n=28) during nest excavation were placed into a container with wet sand and then released into the ocean after dusk to decrease the risk of predation. Starting in 2018, additional information such as hatchling entrapment, debris found in the nest, whether photos or video were taken, and samples collected were also recorded (Supplementary Table 4). If samples were collected, they were stored in vials or plastic bags filled with saturated salt.
Nest temperature data were downloaded from the data loggers with an Onset® Optic USB Base Station shuttle (Onset Computer Corporation, Bourne, MA, United States) using HOBOware® v.3.7.23. All data were tabulated, analyzed, and graphed using Microsoft Excel v.14.16.2 to determine whether the data were downloadable, and then further processed in R (R Core Team, 2022). We used the maximum nest temperature to infer hatching date, as nest eruption was not observed, and excavations were conducted weeks or months after the nest hatched. Nest temperatures typically increase throughout the incubation period as metabolic heating is generated by embryonic growth (Fleming et al., 2020; Gammon et al., 2020). The temperature peaks as the hatchlings emerge from their shells, causing the temperature in the nest to steadily drop as the hatchlings move towards the surface. Thus, we calculated the incubation period as the lay date through the date with the maximum nest temperature. We computed summary statistics on temperature data falling within the middle third of the incubation period, as there is evidence for that being the critical window for sex determination in marine turtles (Mrosovsky, 1980; Rees et al., 2016; Girondot et al., 2018).
We equipped post-nesting female turtles with satellite transmitters (“tags”) manufactured by Wildlife Computers (SPLASH, SPOT, MK-10; Redmond, WA, United States) or Desert Star Systems (Sea Tag-MOD™; Marina, CA, United States). The goal was to deploy five to ten transmitters per year on turtles with good body condition. Turtles were enclosed in a portable wood box (1.3 cm plywood, dimensions: 121.9 cm x 121.9 cm x 60.9 cm) throughout the tag application process. Transmitters were attached to the highest point of each turtle’s carapace using a two-part epoxy (Hart et al., 2015).
We also deployed solar-powered surface-drifting buoys equipped with satellite tags (SeaTag-GEO™; Desert Star Systems, LLC, Marina, California, USA) to gain insights into potential hatchling dispersal pathways. These tags (n=12) were deployed from a vessel just inside (n=2) or outside (n=2) the channel along the northern edge of Rose Atoll’s fringe reef in 2013, 2018, and 2019.
Satellite tag locations (both drifter and animal-borne) were acquired and transmitted via Argos (Landover, Maryland) satellites. This included both Fastloc® GPS locations (when equipped) as well as Argos locations derived using the Kalman geoprocessing algorithm, the latter being categorized into one of six location classes (LCs). To exclude biologically unrealistic locations (i.e., extreme location error) we applied the SDA (speed, distance, angle) filter of Freitas et al. (2008) using the R package trip (Sumner et al., 2009; Sumner and Luque, 2011; sdafilter() function). The running average speed threshold used was (18 km h−1). Following removal of extreme outliers, animal locations were separated into movement phases - inter-nesting, migration, and foraging phases - by identifying the inflection points of the individual displacement curves of the turtle (see Gaos et al., 2012 and references therein). To do so, the distances of all transmitted locations from the initial location were plotted. For inter-nesting and foraging phases, the plot is very flat, but for the migration phase there is a rapid increase in distance from the initial location. The migration phase is then determined to be those locations that fall between the inflection points at the start and end of the rapid dispersal portion of the time series. To automate the determination of the inflection points we fit an adaptive penalized generalized additive model (GAM) to the dispersal time series data using the R package mgcv (Wood, 2003). Using daily differences of the fitted values we obtained estimated daily rates of dispersal. A time interval was a migration interval if the estimated daily dispersal rate was >10 km d-1 and significantly different from 0 km d-1. To avoid unrealistic rapid switching between movement phases, we also imposed the constraint that a phase must be >7 days in length. The cu_migration_det() function for performing this analysis is available in the R package crawlUtils (https://github.com/dsjohnson/crawlUtils). After processing, dispersal plots color coded by movement state were examined by hand to make sure phases were appropriately delineated by the procedure. Drifter borne tags were not processed for migration periods, but they were speed filtered in the same manner.
After speed filtering and the movement behavior portions of the deployments were determined, a continuous-time correlated random walk model was fitted to the remaining locations with the crawl package (Johnson et al., 2008) using the crawlUtils package as an interface. For animal borne tags, the model was parameterized with a different movement process for each of the three phases. For drifter tags, only a single movement type was modeled. After fitting, locations were estimated on an hourly basis. Travel distances were calculated for each individual using the hourly locations and the R package sf (Pebesma, 2018). The modeling and prediction allowed us to account for the location error of the telemetry devices so that travel distance is not artificially inflated by simple linear interpolation between the observed points with location error. In the case of the animal-borne tags, the full track was modeled, as opposed to just the migration portions, to allow observations during inter-nesting and foraging portions to help inform estimates of location error. The separate movement parameters were used to more accurately model differences in movement within each phase.
Animal-borne tag data were used to estimate inter-nesting interval (days between consecutive nests), nesting season duration (days between first and last nest for individuals), and timing of peak nesting activity for this population. First, we visually inspected haul out locations by plotting coordinates to confirm that they were indeed on land and representative of nesting activity. For cases in which there were multiple days of nesting attempts, we used the final date as the lay date. For any period, greater than 18 days but less than 27 days, we assumed there was a single nesting event missed by the satellites, and split it into two even intervals (9.5-13.5 days); all periods representing more than one missed nest were eliminated. We applied a linear mixed model to the calculated periods to account for individual variation across nesters (R Core Team, 2022). The product of the modeled mean inter-nesting interval and an assumed clutch frequency of 6 clutches per season (based upon a range of 5-7 nests in the nearby Central West Pacific population, Summers et al., 2018) yielded an estimate of nesting duration within a season. A starting date for each nester was estimated using the post-nesting departure date (confirmed using satellite tag locations) and back-calculating the estimated nesting season duration. Timing of peak nesting was then determined via a density plot of the number of females nesting across a range of dates.
During 2012-2019, a total of 14 research trips to Rose Atoll occurred, including one trip annually from 2012-16, followed by two trips in 2017, five trips in 2018, and two trips in 2019. U.S. Fish and Wildlife Service (USFWS), American Samoa Department of Marine and Wildlife Resources (AS DMWR), and U.S. National Park Service participated in collecting the data, therefore, data collection efforts may have differed slightly as trips were not specifically focused on turtle surveys. Monitoring effort consisted of an average of 4.7 ± 1.9 days (range 1-7 days) per trip, for a combined total of 61 days (Table 2).
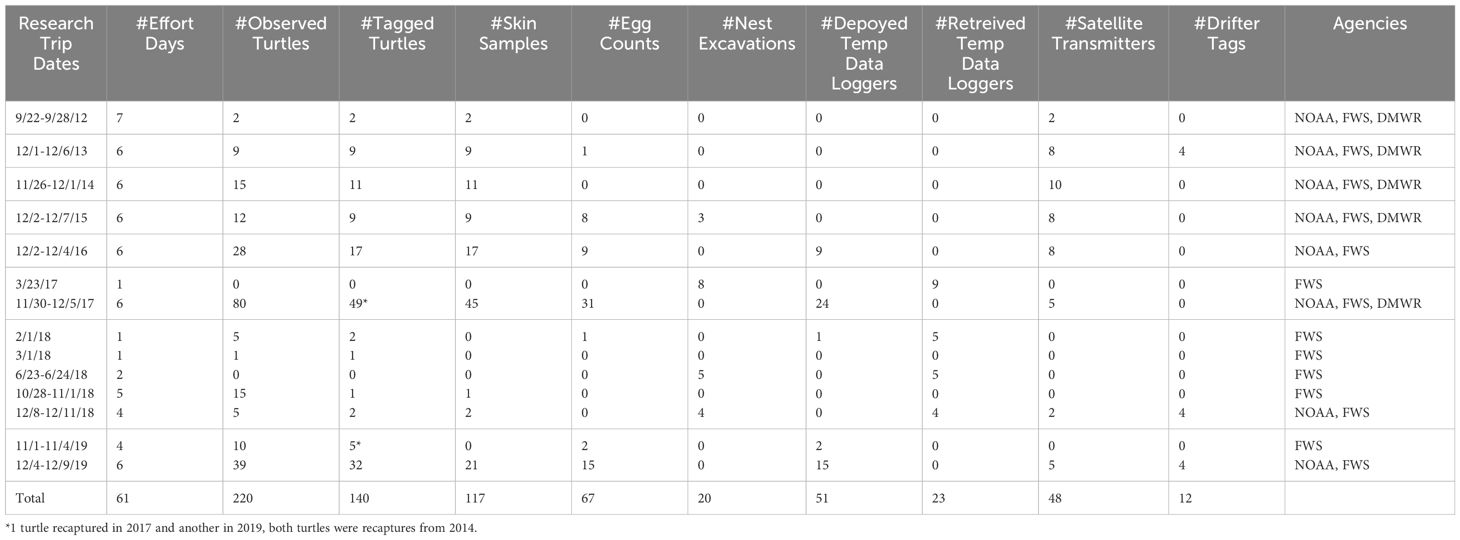
Table 2 Annual summary of green sea turtles observed, tagged, and skin sampled; egg counts and nest excavations conducted, temperature data loggers deployed and retrieved from nests, satellite transmitters attached to nesting females, and drifter tags released at Rose Island, Rose Atoll, American Samoa, 2012-2019.
We identified a median of nine turtles per research trip (range 0-80 turtles), and a total of 218 turtles across all trips (Table 2). No turtles were identified during one trip each in 2017 (1 day) and in 2018 (2 days), and the most turtles (n=80) were identified during the six-day trip in 2017. Unique permanent identification tags were applied to 138 of the 218 turtles, and 80 turtles were not uniquely identified across years. On several occasions, we encountered turtles at different sections of the island within the same survey period; those turtles were given temporary alpha-numeric identifiers on their carapace. Then, surveying was ceased to observe the nesting activities of specific turtles. Once surveys resumed, additional turtles that were observed received temporary or permanent identification tags as time permitted. The mean CCL size was 101.6 cm (range 85.0-114.7 cm, sd=5.6 cm, Figure 2A). While only two of the permanently tagged turtles were recaptured in later years, 3- and 5-year remigration intervals within this study, we do not know how many of the 80 unidentified turtles were recaptures. Thus, the empirical minimum estimate of nester abundance at Rose Atoll for 2012-2019 from annual one-week surveys is 138. Of the 218 turtles encountered across all years, 26 were observed crawling, 15 were digging a body pit, 9 were digging an egg chamber, 106 were laying eggs, 13 were covering, 39 were returning to the ocean; and the nesting activity was unknown for 12 turtles. Supplementary Table 1 includes the data on each observed nesting activity and determination of nesting success.
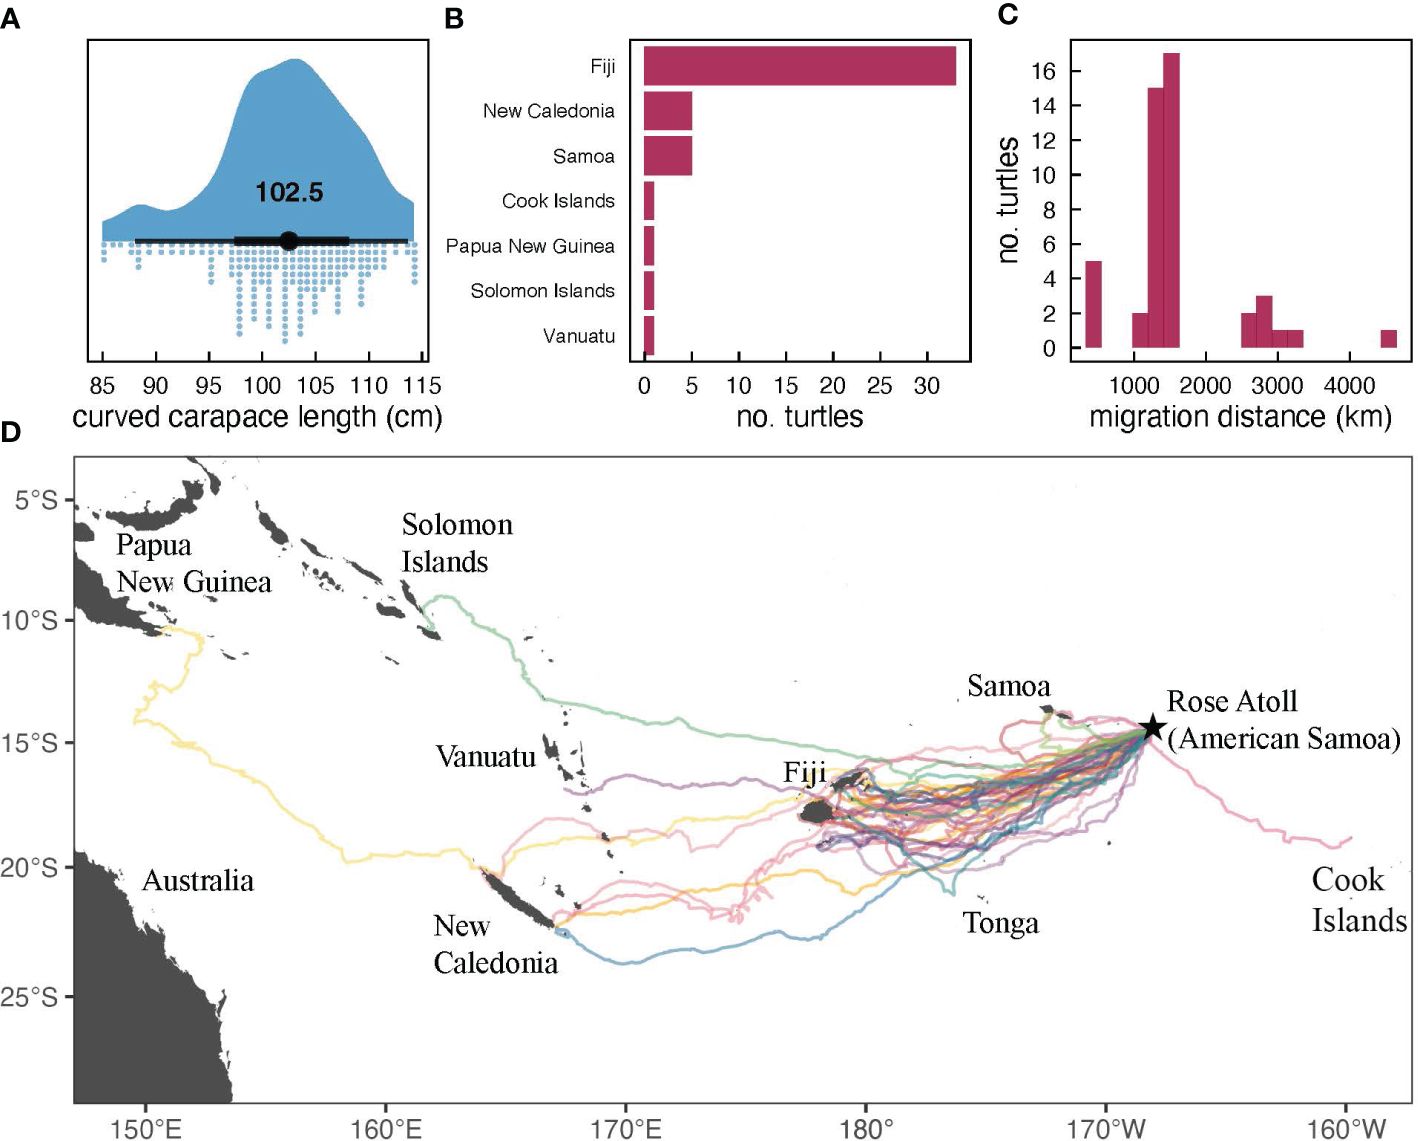
Figure 2 Migration of 48 post-nesting green turtles tagged at Rose Atoll, American Samoa between 2012 and 2019: (A) histogram of nester curved carapace length (CCL); (B) bar graph of destination country; (C) histogram of distance traveled; and (D) map of final locations including Fiji (n=33), New Caledonia (n=5), Western Samoa (n=5), Cook Islands (n=1), Papua New Guinea (n=1), Solomon Islands (n=1), and Vanuatu (n=1). In addition, one transmitter stopped receiving data 27 days after deployment.
At Sand Island, sand pits and paired tracks, when possible, were counted and the locations were recorded. In total, 967 sand pits were observed and recorded. The annual number of sand pits recorded were: unknown for 2012 and 2013; 102 for 2014; 143 for 2015; 271 for 2016; 265 for 2017; 21 for 2018; and 165 for 2019. Additionally, there were 159 paired and 111 single tracks recorded for 2012-2019.
A total of 51 temperature data loggers were deployed in nests from 2016-2019, of which 36 were recovered with usable data (Supplementary Table 6), 11 were not recovered (displaced by severe weather events or by subsequent nesting female turtles), and 4 were recovered but the data were corrupt, and therefore unusable. Median nest temperatures during incubation were similar across years: 29.8°C in 2016, 29.5°C in 2017, and 29.2°C in 2019 (Table 3). Median temperatures in the middle third of the incubation period (when sex is determined) were slightly lower than the overall temperatures: 29.2°C in 2016, 29.4°C in 2017, but was slightly higher in 2019 at 30.7°C (Table 3). The mean incubation period, (calculated from data loggers), was 48.0 d for clutches laid in 2016 (n=8), 52.7 d for 2017 (n=9), and 53.9 d for 2019 (n=13). Mean hatching success was relatively high: 92.7% (sd=10.4%) for 2016 (n=8), 92.5% (sd=19.7%) for 2017 (n=8), unknown for 2018 due to poor weather limiting data collection, and unknown for 2019, since nest excavations were not performed (Table 1). Emergence success mirrored hatching success for the 2016 and 2017 seasons with the temperature data suggesting that all hatchlings emerged from the nest (Table 1).
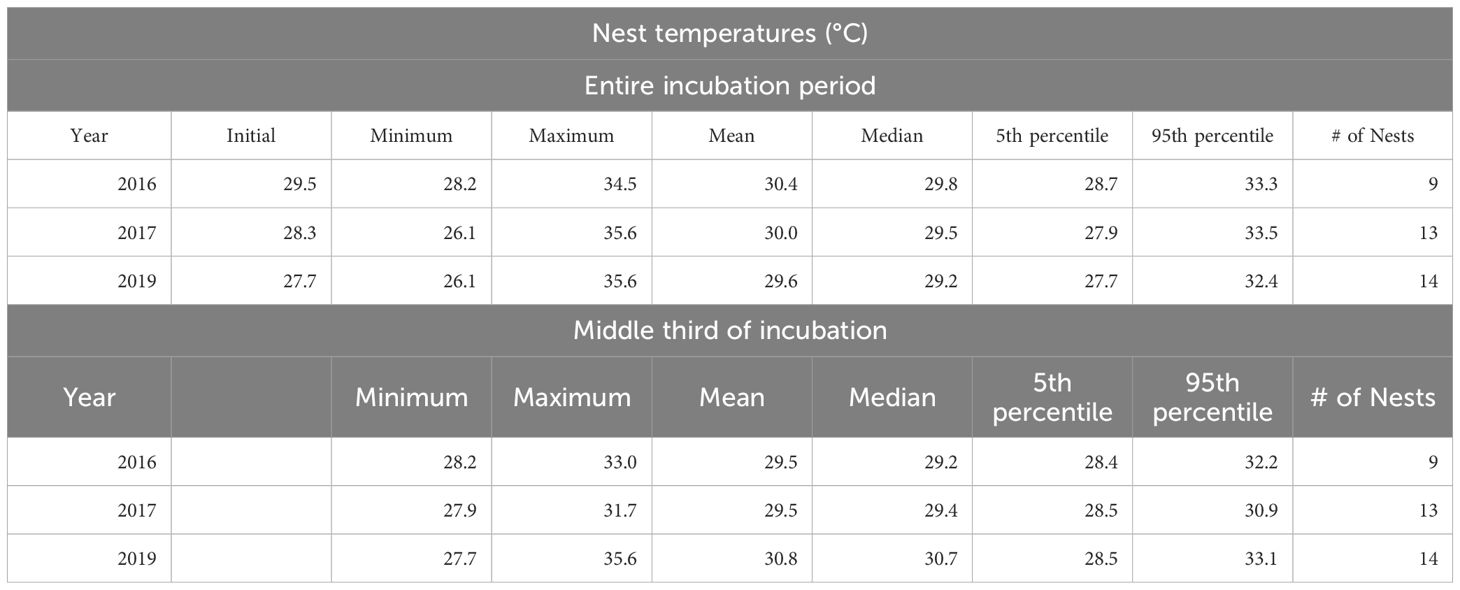
Table 3 Nest temperatures (°C) from temperature data loggers deployed into green sea turtle nests during oviposition on Rose Island in the Rose Atoll National Wildlife Refuge from 2016-2019.
During the annual surveys, encountering hatchlings was an opportunistic occurrence. No hatchlings were observed in 2012-2013. From 2014-2019, a total of 112 were observed. Three hatchlings were found dead on shore in 2014. In 2015, seven were seen crawling through camp but one was later found dead due to crab (Ocypode sp.) predation. In 2016, 39 hatchlings were found scurrying through the campsite, out of which three were found dead. In 2017, 46 were observed alive crawling through the campsite, while one was found dead near the sign on Rose and another dead hatchling was found on Sand. A skin sample was collected from the latter. In 2018, one was found alive in October and in December, 12 were found alive, while one was found dead. No measurements were collected. Lastly, in December 2019, one hatchling was found at the campsite, captured, and released into the lagoon after collecting morphometrics and a skin sample (see Supplementary Table 3 for details).
We equipped between zero and ten green turtles with satellite transmitters per nesting season, for a total of 48 equipped turtles, as some research trips were only for data logger retrieval or nest excavation (Table 2; Supplementary Table 5). Tags transmitted for an average of 231.6 ± 171.0 d with the longest tag lasting 857 days. The shortest tag duration was 27 days as the tag stopped transmitting while the nester was still at Rose Atoll.
Turtles traveled an average distance of 2123.4 ± 1188.2 km once departing Rose Atoll, with the shortest migration consisting of 522.4 km and the longest of 7778.7 km (Figure 2). The majority (n=33, 70.2%) of post-nesting females migrated to foraging grounds in Fiji. Other destinations included New Caledonia (n=5), Western Samoa (n=5), Cook Islands (n=1), Papua New Guinea (n=1), Solomon Islands (n=1), and Vanuatu (n=1).
The estimated nesting season duration was 71.0 days based upon the modeled mean inter-nesting duration of 11.84 days. The earliest inferred arrival to Rose was September 26, and the latest confirmed departure was March 8. Peak nesting occurred in mid-November to mid-December (Figure 3), and 47 (97.9%) of the satellite tagged turtles nested during that time frame.
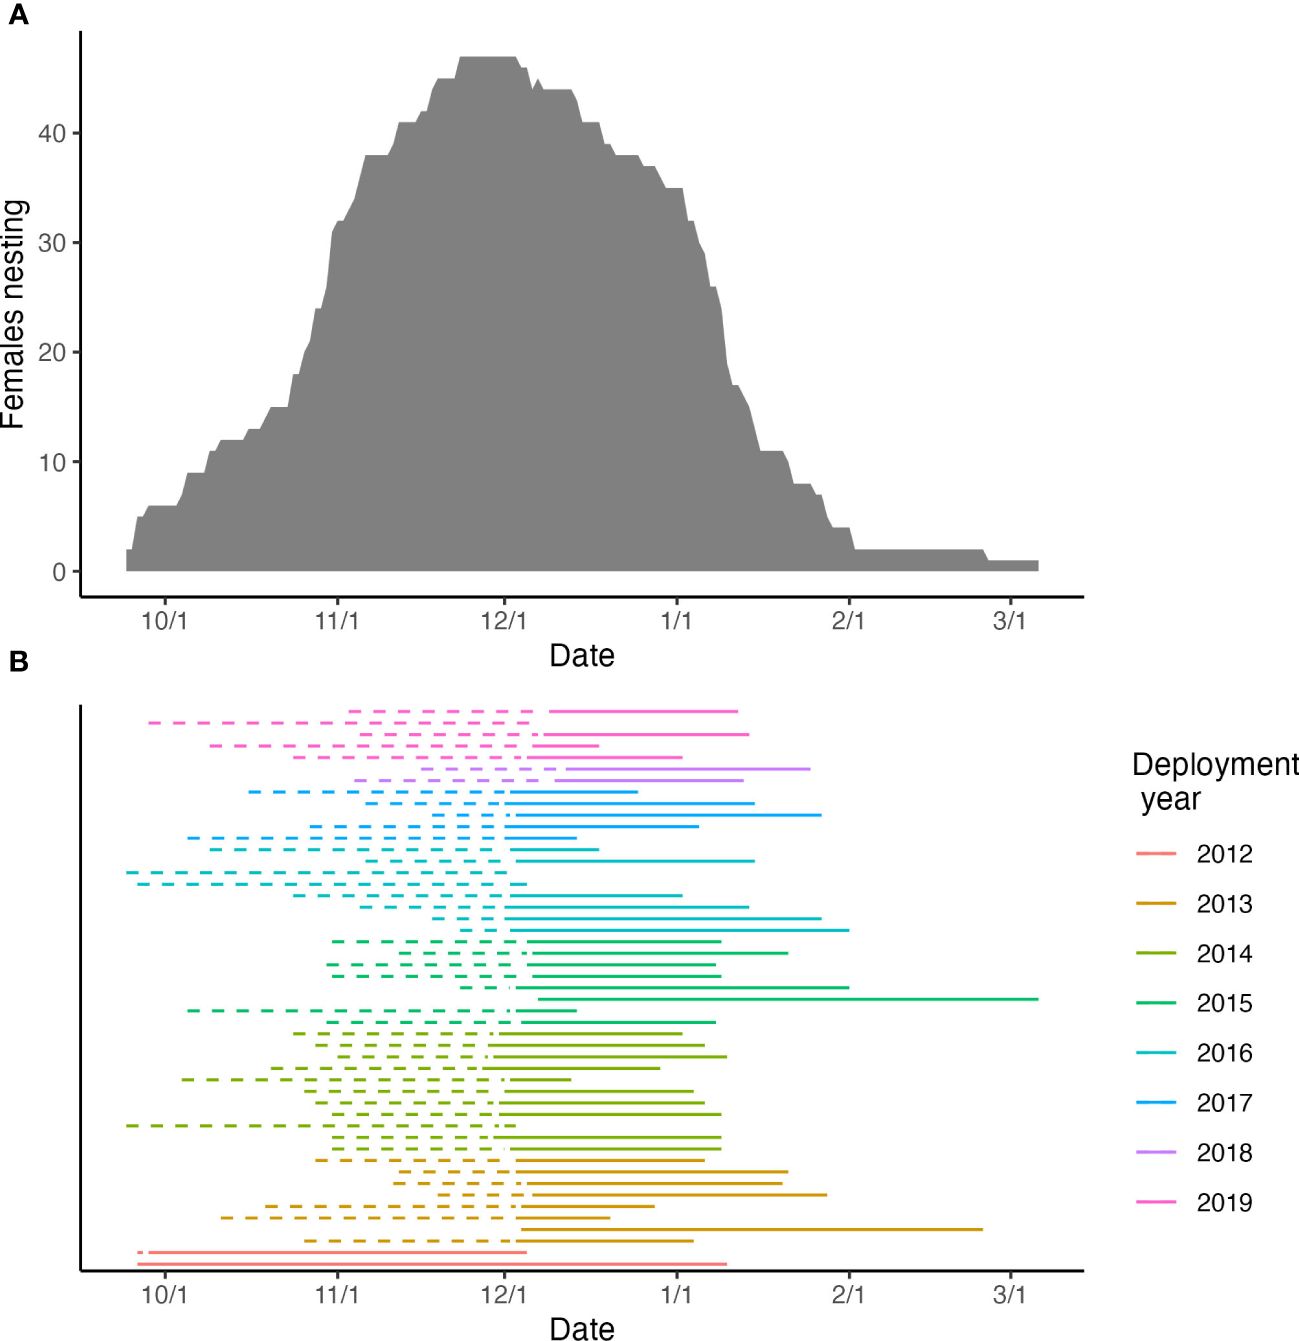
Figure 3 Nesting period for 43 post-nesting green turtles at Rose Atoll, American Samoa between 2012 and 2019 based on haul out satellite tag locations (5 post-nesters did not have data): (A) Peak nesting period based the number of nesters by month; (B) Nesting duration by year, dashed lines represent the back-calculated clutches based on calculated inter-nesting interval and clutch frequency and solid lines represent the actual haul out data.
We deployed a total of 12 drifter tags, four each year in 2013, 2018, and 2019. The drifters transmitted for an average 223.7 ± 114.9 d with the longest lasting 414 days. The drifters traveled an average distance of 3922.8 km ± 3311.1 km with the shortest distance consisting of 1044.7 km and the longest of 11842.5 km (Figure 4). The drifters last transmitted in the vicinity of Tonga (n=5), Fiji (n=4), southwest of American Samoa (n=1), Cook Islands (n=1), and southwest of Niue (n=1).
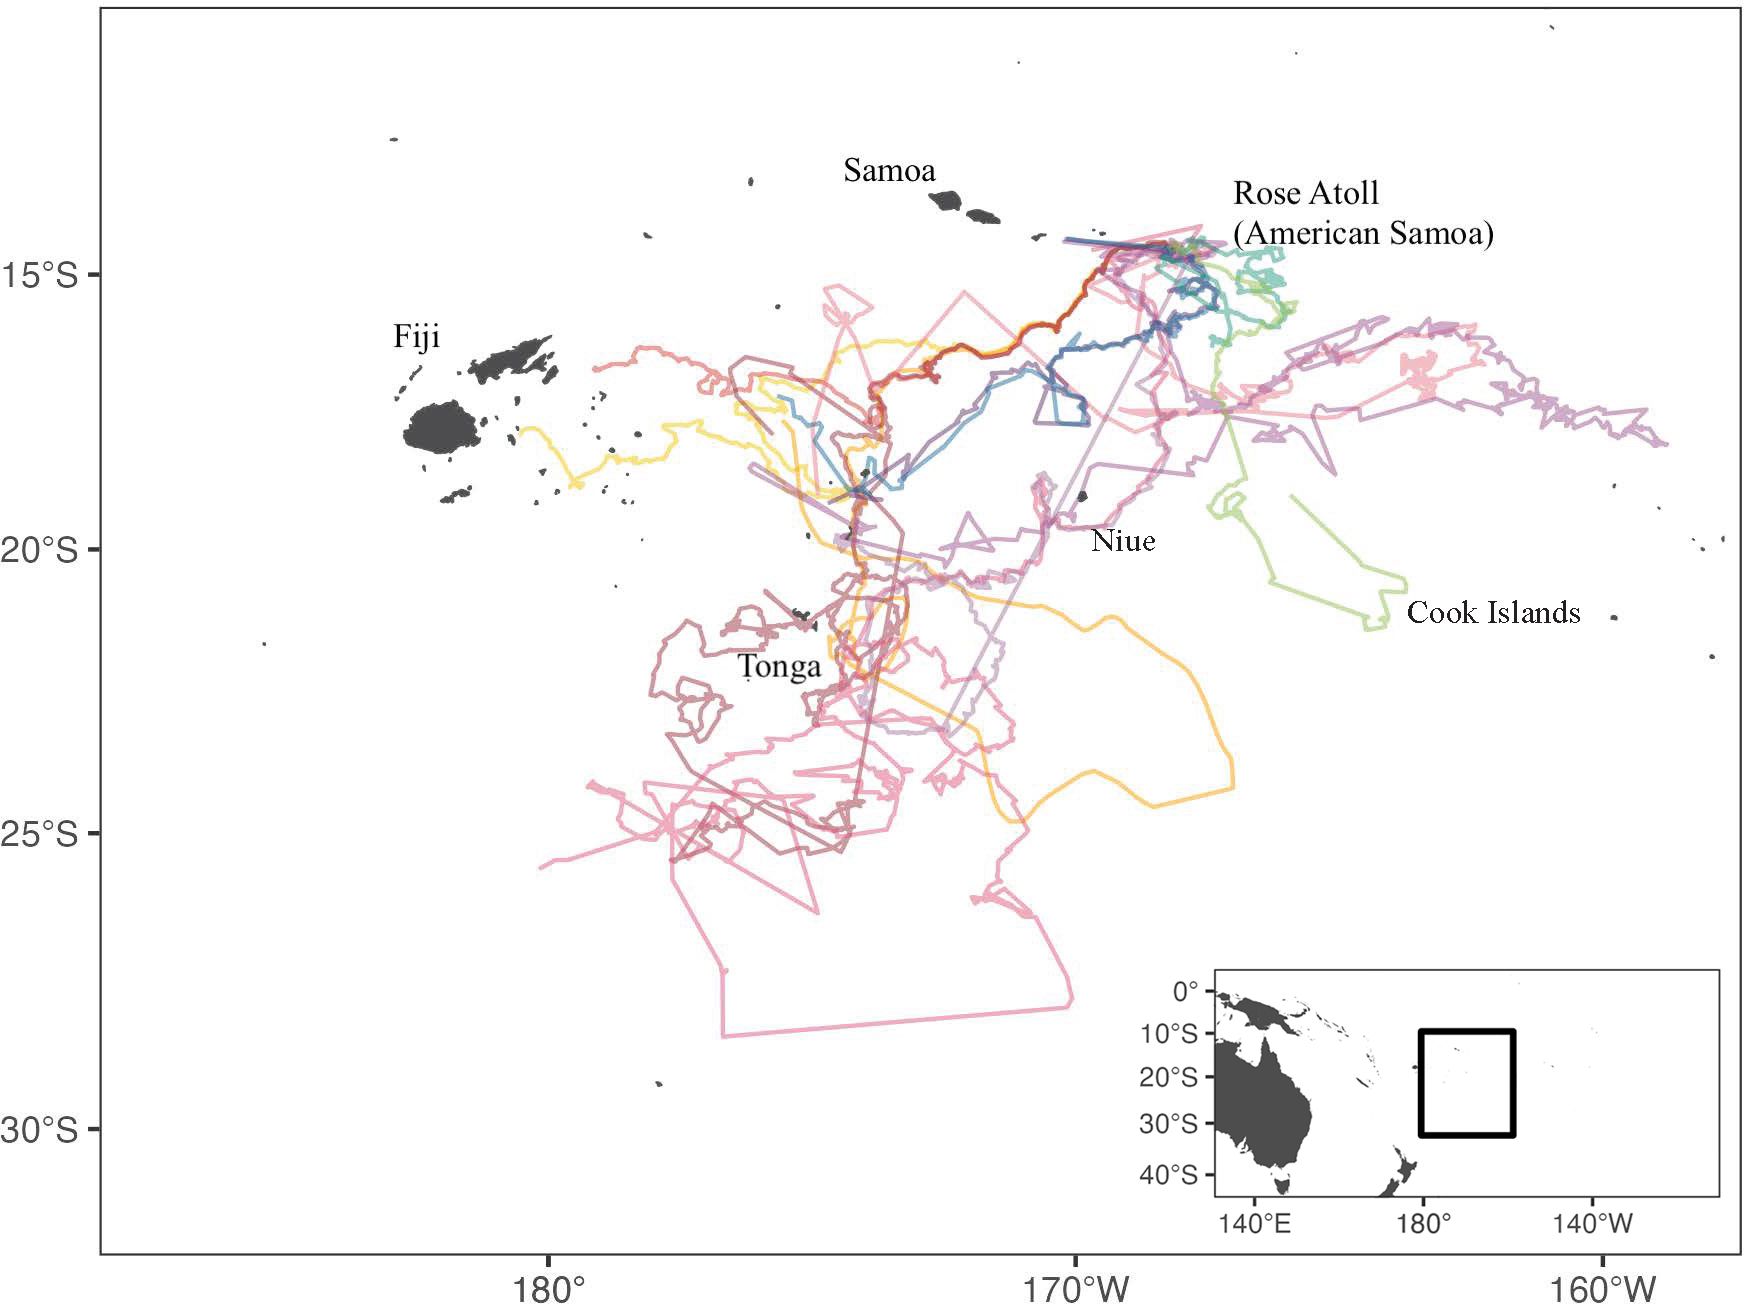
Figure 4 Migration tracks of 12 drifter tags released at Rose Atoll, American Samoa in 2013, 2018, and 2019. Final locations included Tonga (n=5), Fiji (n=4), American Samoa (n=1), Cook Islands, (n=1), and Niue (n=1).
As with many remote islands in the CSP, data for nesting green turtles at RANWR are difficult to obtain and thus limited, making it challenging to accurately assess the population status. The lack of consistent historical surveys further complicates our ability to put recent nesting counts into context. Although “great numbers’’ of green turtles would reportedly come ashore to nest at Rose Atoll in the 1800s (Graeffe, 1873), and nesting pits and tracks were plentiful in the early 1970s (Amerson et al., 1982), actual numbers of annual nesters were not reported until the early 1990s, during which 24-36 females were estimated to nest annually (Tuato`o-Bartley et al., 1993). The annual number of nesting females recorded during this study (mean 27.5 ± 25.5 turtles) was similar to the historical range (Table 2). The timeframe of each expedition was scheduled to coincide with the putative peak of nesting activity but each survey was limited to 1-7 days. When combined with natural variations in the timing of annual nesting cohorts (Seminoff et al., 2015), it is likely that our monitoring efforts missed the peak nesting activity during some years (e.g., 2012) and thus the overall annual number of nesting females is likely higher.
Despite the limited timeframe of our annual monitoring expeditions, we identified a total of 218 nesting turtles during this eight-year study and this likely represents the minimum number of females present in the contemporary nesting population. Only two (1.4%) of the 138 confirmed unique females (permanently tagged) were resighted across years, further supporting this assertion. Given that each research trip lasted between 1-7 days, it is likely that previously tagged nesters were missed due to the timing of the survey period or nesting may have occurred on a nearby island. For future surveys, a minimum of 12 days, during the peak of the season, would aid in mitigating missed nesters. The overall mean CCL for this population was 101.6 cm which was similar to CNMI (102.2 cm; Summers et al., 2018), smaller than Australia (107.0 cm; Limpus, 2009), and larger than Hawaii (97.0 cm, Balazs et al., 2015), Malaysia (98.5 cm; Pilcher and Basintal, 2000), and the Philippines (99.5 cm; Burton, 2012) nesting populations. The annual mean CCL increased from 91.5 to 100.7 cm suggesting that Rose nesters are possibly nearing the peak of an aging population. Whether this is an increase or decrease from historical numbers remains unclear, but this study provides a baseline for future monitoring and assessment efforts.
The two turtles that were resighted were originally tagged in 2014, and re-observed in 2017 and 2019, indicating remigration intervals of three and five years, although it is possible the latter turtle renested (when researchers were not present) prior to resighting. This remigration interval is similar to those reported for green turtles in the Central North and Central West Pacific Oceans (4 years, Balazs et al., 2015; 4.6 years, Summers et al., 2018). However, it may be longer than the remigration intervals for other regions (e.g., 1.8-3 years in the East Pacific, and 2-3 years in the North Atlantic; Seminoff et al., 2015).
Although we conducted surveys during the putative peak of the nesting season, doubts remained regarding the peak and overall duration of the nesting season at RANWR due to lack of survey effort across an entire nesting season. However, based upon satellite tag locations, we were able to calculate the estimated peak period of mid-November to mid-December and an estimated nesting duration of 71 days. The earliest hatchling encountered during this study was found in October 2018 and the latest a female was recorded nesting was in March. Assuming a nest incubation period of 48-54 days, as determined by temperature data logger data analyzed in this study, the hatchlings were the result of a nesting event that occurred in August, suggesting overall nesting time frames extend from at least August to March of each season. Our satellite tag data suggested a late arrival in September and late departure in March, essentially corroborating that timeframe. Although this coincides with reports of green turtle nesting between August and September on the island of Tutuila (American Samoa; Hirth, 1970), villagers from American Samoa report nesting year-round (Tuato`o-Bartley et al., 1993) also observed at Kosgoda, Sri Lanka (Ekanayake et al., 2010), the Comoros Archipelago in Africa (Bourjea et al., 2015), Perak, Malaysia (Salleh et al., 2018), and Aldabra Atoll, Republic of Seychelles (Pritchard et al., 2022).
The nesting surveys at RANWR were primarily concentrated on Rose Island, but we did encounter a total of 967 nesting pits at Sand Island, indicating it hosts an important number of nesting green turtles as well. These findings coincide with former report of many pits, tracks, and nesting turtles on Sand Island as well (Hirth, 1970). Allocating more time to survey Sand Island would be prudent to better understand the relative importance of the site and to generate a more informed estimate of annual counts of nesting females at RANWR. Consistently surveying both islands during the peak nesting period would allow researchers to focus on a specific period to collect data from most annual nesters and more holistically evaluate the population. Technological solutions for data collection from this remote nesting site may include game cameras and infrared detection which could facilitate refinement of the rapid assessment surveys (Sellés-Roís et al., 2022). Nearby land masses with potential green turtle nesting habitat within the CSP primarily consist of islets and atolls spread over a vast area, making surveys logistically difficult. As a result, there is limited information available on nesting green turtles or annual nest numbers (Seminoff et al., 2015; Dolfo et al., 2023). According to estimates, Fiji has 50-75 annual nesters (Piovano and Batibasaga, 2020), while French Polynesia had approximately 1000 annual breeding females in 1989 (Dolfo et al., 2023). Given that very little nesting reportedly occurs on most other isolated atolls, Rose Atoll serves as an important nesting site for the CSP DPS/RMU.
Although post-nesting green turtles migrated to various locations (Figure 2), our tracking efforts revealed that the majority (n=33, 70.2%) of satellite tagged turtles migrated to Fiji, indicating that the country is the primary foraging ground for green turtles nesting at Rose Atoll. Our findings coincide with previous research conducted at Rose Atoll during which six of seven post-nesting green turtles migrated to Fiji (Craig et al., 2004). Recent genetic research revealed that 72% (n=150) of juvenile green turtles sampled at two foraging grounds in Fiji originate from the RANWR breeding stock (Piovano et al., 2019), further highlighting the connectivity between these two locales. In Fiji, sea turtles are protected by national legislation and as cultural permitted resources (Kitolelei et al., 2022). As a U.S. territory, turtles within American Samoa are protected under the Endangered Species Act (Kitolelei et al., 2022) and territorial government regulations (Maison et al., 2010). A survey conducted in 2020, with Fijian fishermen, found that both the turtle (green and hawksbill) and eggs were still being harvested for subsistence and cultural ceremonies (Kitolelei et al., 2022). Based on these surveys, Kitolelei et al., 2022, also found that there was an 88% reduction in the number of green turtles harvested between 2000 and 2015. Historically, turtles were harvested in American Samoa for special occasions (Craig et al., 1993; Tuato`o-Bartley et al., 1993), but there are no publications that have current statistics or numbers. Our findings suggest that the collaboration between the governments of Fiji and American Samoa (USA) is necessary for the effective conservation of this population.
Post-nesting females from RANWR established foraging ranges in New Caledonia (n=5), Western Samoa (n=5), Cook Islands (n=1), Papua New Guinea (n=1), Solomon Islands (n=1), and Vanuatu (n=1) (Figure 2; Supplementary Table 5). One satellite tag also ceased transmitting prior to the turtle establishing foraging grounds, but did so in the vicinity of French Polynesia (Figure 2), suggesting potential connectivity with this country as well. A nesting female previously equipped with metal flipper tags at RANWR in November 1993 was also subsequently encountered (dead) in Vanuatu in April 1994 (Grant et al., 1997). These findings reveal the connectivity of Rose Atoll to nations throughout the south Pacific region. Considering that CSP green turtles are listed as an endangered DPS and considered to be in severe decline (Allen et al., 2023), our results of connectivity throughout the region highlight the importance of RANWR to the population.
This study found that post-nesting green turtles from Rose Atoll travel long distances to their foraging habitats. Such long distances have also been reported in other ocean regions, including the Red Sea, Galápagos Islands, and Taiwan. The nesting green turtles in the northern Red Sea traveled up to 1100 km to their foraging habitats in multiple other nations (Tanabe et al., 2023). Similarly, three post-nesting greens from the Galápagos Islands, Ecuador, traveled 2136–2524 km north to their foraging grounds in Pacific Central America (Seminoff et al., 2008). Seven post-nesting greens were monitored from their nesting site in Taiwan, and 4 traveled 1130–1909 km to their foraging grounds in mainland China (1) and Japan (3) (Cheng, 2000).
The dispersal pathways and foraging ground destinations of post-hatchling green turtles can be influenced by both active swimming (Putnam and Mansfield, 2015; Hoover et al., 2020) and wind-driven surface currents (Okuyama et al., 2009; Hays et al., 2010; Naro-Maciel et al., 2014; Suhaimi et al., 2020). According to Mozón-Argűello et al. (2010) and Scott et al. (2014), hatchlings that allow the current to dictate their migration could also impact their adult migrations. Additionally, Suhaimi et al. (2020) revealed that passive drifters had a greater chance of reaching faraway foraging areas. In this study, all of the final drifter locations were south of RANWR and included Fiji and the Cook Islands, which were two of the post-nesting migration locations. The 12 drifter tags deployed, via this study, suggest currents could support hatchling dispersal across long distances to nations throughout the CSP (Figure 4), further highlighting the potential importance of RANWR to maintaining green turtle populations throughout the region.
Hatching and emergence successes were both high (93%) in this study (n=18 nests, 2016-2017 seasons) indicating high reproductive output at RANWR, and there was little evidence of hatchling predation or entrapment, threats that are problematic at other green turtle nesting beaches (e.g., Zárate et al., 2013; Summers et al., 2018). High hatchling productivity may confer some resilience on population with respect to climate change impacts (e.g., extreme weather events could wipe out an entire season’s cohort, Patrício et al., 2021).
However, air temperatures in American Samoa are at 28.3°C during October-May and 27.2°C from June-September (Craig, 2009), and rising temperatures can have implications for hatchling sex ratios and embryonic development. Results from this study show the sex ratio of hatchlings being produced may still be fairly balanced, as the annual median nest temperatures (29.3°-29.6°C) were close to the pivotal temperature of 29.4°C for 50:50 male:female sex ratios for other green turtle populations (e.g., 29.4-29.5°C, Godfrey and Mrosovsky, 2006; 29.5°C, Bentley et al., 2020). This was particularly true for the middle-third of the incubation period (when sex is determined, Wibbels et al., 2003; Lolavar and Wyneken, 2020), in which the annual median temperatures were 28.8°-29.4°C, which suggests there could even be a slight male bias if the pivotal temperature for this population is 29.4°C. With Rose Atoll’s generally warm climate, the recorded nesting temperatures suggest that it may not be female-biased. This may be attributable to factors such as reflectivity of the sand (i.e., cooling albedo effect of light-colored coral rubble sand), moisture from rain, vegetation, and aeration of nests (Hays et al., 2001; Bentley et al., 2020; Laloë et al., 2020; Matthews et al., 2021; Tűrkozan et al., 2021; Gravelle and Wyneken, 2022).
The primary threats to RANWR are beach erosion due to sea level increases, tidal inundation of nests, and uneven (female-biased) sex ratios from increased incubation temperatures (Seminoff et al., 2015; Albert et al., 2016; Rivas et al., 2023). Similar to the many other low-lying islands that host nesting of CSP green turtles (Craig et al., 2004; Seminoff et al., 2015), RANWR is extremely vulnerable to severe weather systems, which can alter nesting habitat and destroy nests (Mimura, 1999; Storlazzi et al., 2015; Patrício et al., 2021). Cyclones (hurricanes) are common during November-April (USFWS, 2014) in the vicinity of RANWR, which coincides with the green turtle nesting period at Rose Atoll. There have been six cyclones from 1980-2011, which damaged both the forest and reef at Rose Atoll (USFWS, 2014), and destroyed nests and scattered turtle eggs across the island (https://www.fisheries.noaa.gov/pacific-islands/habitat-conservation/rose-atoll-marine-national-monument). Moreover, there is the possibility that the impact and potential increase of tropical cyclones will lead to nest inundation causing poor hatching success and high hatchling mortality (Van Houtan and Bass, 2007).
In conclusion, our study presents the first comprehensive assessment of nesting green turtles in American Samoa, specifically Rose Atoll National Wildlife Refuge (RANWR). Between 2012-2019, there were at least 138 nesters observed and, although our data were limited, the hatching success was high at 92.3% and the sex ratios appear to be balanced. Our data suggest that RANWR is an important nest site for the south Pacific post-nesting green turtles as 70% returned to Fiji. Our data provides baseline parameters for the data deficient central south Pacific region, which can inform population modelling for this endangered population (Seminoff et al., 2015).
The datasets presented in this study can be found in online repositories. Metadata of satellite tracking are available on the Animal Telemetry Network and requests for data can be directed to Pacific Islands Fisheries Science Center (PIFSC). Other data are presented within the article and Supplementary Material.
The animal study was approved by National Marine Fisheries Service IUCAC. The study was conducted in accordance with the local legislation and institutional requirements.
SKM: Conceptualization, Data curation, Investigation, Methodology, Project administration, Resources, Supervision, Writing – original draft, Writing – review & editing, Visualization. AG: Conceptualization, Formal analysis, Visualization, Writing – original draft, Writing – review & editing. DJ: Formal analysis, Writing – original draft, Writing – review & editing. BP: Data curation, Investigation, Writing – review & editing. MM: Investigation, Writing – review & editing. ES: Investigation, Writing – review & editing. FP: Investigation, Writing – review & editing. CA: Investigation, Writing – review & editing. MS: Investigation, Writing – review & editing. SI: Formal analysis, Writing – review & editing. KH: Conceptualization, Data curation, Formal analysis, Investigation, Writing – review & editing. AL: Writing – review & editing. TJ: Conceptualization, Data curation, Investigation, Writing – review & editing. SLM: Conceptualization, Formal analysis, Writing – original draft, Writing – review & editing.
The author(s) declare financial support was received for the research, authorship, and/or publication of this article. This research did not receive any specific grant from funding agencies in the public, commercial, and not-for-profit sectors. This project was primarily funded by NOAA in support of mandated research, and secondarily by USFWS.
Gratitude to our colleagues: from NOAA, Lindsey Bull, Frank Parrish, Jan Willem Staman; from DMWR, Puamanogi Leasoon; from NPS, Carlo Caruso, Ricky Misa`alefua, John Mua Utuga, and Valentine Sina; from USFWS, Aisha Rickli-Rahman and Kimberly Trust; and from Pago Pago, Marine Charters, Andy Wearing and Russ Cox for the dedication and assistance in the field. Jeff Maynard and Dieter Tracey contributed to processing and analysis of the temperature logger data.
The authors declare that the research was conducted in the absence of any commercial or financial relationships that could be construed as a potential conflict of interest.
The author(s) declared that they were an editorial board member of Frontiers, at the time of submission. This had no impact on the peer review process and the final decision.
All claims expressed in this article are solely those of the authors and do not necessarily represent those of their affiliated organizations, or those of the publisher, the editors and the reviewers. Any product that may be evaluated in this article, or claim that may be made by its manufacturer, is not guaranteed or endorsed by the publisher.
The Supplementary Material for this article can be found online at: https://www.frontiersin.org/articles/10.3389/fmars.2024.1403240/full#supplementary-material
Albert S., Leon J. X., Grinham A. R., Church J. A., Gibbes B. R., Woodroffe C. D. (2016). Interactions between sea-level rise and wave exposure on reef island dynamics in the Solomon Islands. Env. Res. Lett. 11, 54011. doi: 10.1088/1748-9326/11/5/054011
Allen C. D., Martin S. L., Jones T. T. (2023). Chelonia mydas (Central South Pacific subpopulation). In: The IUCN Red List of Threatened Species 2023 (Accessed 29 February 2024).
Amerson A. B. Jr., Whistler W. A., Schwaner T. D. (1982). Wildlife and wildlife habitat of American Samoa. II. Environment and ecology (Washington, D.C: U.S. Fish and Wildlife Service).
Balazs G. H., Siu P., Landret J. P. (1995). “Ecological aspects of green turtles nesting at Scilly Atoll in French Polynesia,” in Twelfth Annual Symposium on Sea Turtle Biology and Conservation p. 7–10. Eds. Richardson J. I., Richardson T. H. (NOAA Tech. Memo, Jekyll Island, Georgia). NMFS-SEFSC-528.
Balazs G. H., Van Houtan K. S., Hargrove S., Brunson S. M., Murakawa S. K. K. (2015). A review of the demographic features of Hawaiian green turtles (Chelonia mydas). Chelonian Conserv. Biol. 14, 119–129. doi: 10.2744/CCB-1172.1
Beissinger S. R., Westphal M. I. (1998). On the use of demographic models of population viability in endangered species management. J. Wildl. Manage. 63, 821.841. doi: 10.2307/3802534
Bentley B. P., Stubbs J. L., Whiting S. D., Mitchell N. J. (2020). Variation in thermal traits describing sex determination and development in Western Australia sea turtle populations. Funct. Ecol. 34, 2302–2314. doi: 10.1111/1365-2435.13645
Bourjea J., Dalleau M., Derville S., Beudard F., Marmoex C., M’Soili A., et al. (2015). Seasonality, abudance, and fifteen-year trend in green turtle nesting activity at Itsamia, Moheli, Comoros. Endang. Species Res. 27, 265–276. doi: 10.3354/esr00672
Broderick A. C., Frauenstein R., Glen F., Hays G. C., Jackson A. L., Pelembe T., et al. (2006). Are green turtles globally endangered? Global Ecol. Biogeogr. 15, 21–26. doi: 10.1111/j.1466-822X.2006.00195.x
Brost B., Witherington B., Meylan A., Leone E., Ehrhart L., Bagley D. (2015). Sea turtle hatchling production from Florida (USA) beaches 2002-2012, with recommendations for analyzing hatching success. Endang. Species Res. 27, 53–68. doi: 10.3354/esr00653
Burton A. (2012). Glad tidings for sea turtles. Front. Ecol. Environ. 10, 998. doi: 10.2307/41479998
Chaloupka M. Y., Bjorndal K. A., Balazs G. H., Bolten A. B., Ehrhart L. M., Limpus C. J., et al. (2008). Encouraging outlook for recovery of a once severely exploited marine megaherbivore. Glob. Ecol. Biogeogr. 17, 297–304. doi: 10.1111/j.1466-8238.2007.00367.x
Chan E. H. (2006). Marine turtles in Malaysia: on the verge of extinction? Aquat. Ecosyst. Health Manage. 9, 175–184. doi: 10.1080/14634980600701559
Cheng I.-J. (2000). Post-nesting migrations of green turtles (Chelonia mydas) at Wan-An Island, Penghu Archipelago, Taiwan. Mar. Biol. 137, 747–754. doi: 10.1007/s002270000375
Craig P. (2002). “Rapidly approaching extinction: sea turtles in the central South Pacific,” in Proceedings of the Western Pacific Sea Turtle Cooperative Research and Management Workshop, vol. 271-273 . Ed. Kelly I. (Western Pacific Regional Fishery Management Council, Honolulu, Hawaii).
Craig P. (2009). Natural history guide to American Samoa. 3rd edition (National Park of American Samoa, Pago Pago, American Samoa), 134 p.
Craig P., Parker D., Brainard R., Rice M., Balazs G. (2004). Migrations of green turtles in the central South Pacific. Biol. Conserv. 116, 433.438. doi: 10.1016/S0006-3207(03)00217-9
Craig P., Trail P., Grant G., Craig J., Itano D. (1993). American Samoa: natural history and conservation topics, Volume 1. (Department of Marine and Wildlife Resources, Pago Pago, American Samoa). Biological Report Series, Report No. 42, 65 p.
Dolfo V., Gaspar C., Bourjea J., Tatarata M., Planes S., Boissin E. (2023). Population genetic structures and mixed stock analysis of green sea turtle, Chelonia mydas, reveal reproductive isolation in French Polynesia. Front. Mar. Sci. 10. doi: 10.3389/fmars.2023.1201384
Dutton P. H. (1996). “Methods for collection and preservation of samples for sea turtle genetic studies,” in Proceedings of the International Symposium on Sea Turtle Conservation Genetics p. 17–24. Eds. Bowen B. W., Witzell W. N. (NOAA Tech. Memo, Miami, Florida).
Dutton P. H., Balazs G. H., LeRoux R. A., Murakawa S. K. K., Zárate P., Martínez L. S. (2008). Composition of Hawaiian green turtle foraging aggregations: mtDNA evidence for a distinct regional population. Endang. Species Res. 5, 37–44. doi: 10.3354/esr00101
Ekanayake E. M. L., Rajakaruna R. S., Kapurusinghe T., Saman M. M., Rathnakumara D. S., Samaraweera P., et al. (2010). Nesting behaviour of the green turtle at Kosgoda rookery, Sri Lanka. Cey. J. Sci. (Bio. Sci.) 39, 109–120. doi: 10.4038/cjsbs.v39i2.2997
Fleming K. A., Perrault J. R., Stacy N. I., Coppenrath C. M., Gainsbury A. M. (2020). Heat, health and hatchlings: associations of in situ nest temperatures with morphological and physiological characteristics of loggerhead sea turtle hatchlings from Florida. Conserv. Physiol. 8, coaao46. doi: 10.1093/conphys/coaa046
Freitas C., Lydersen C., Fedak M. A., Kovacs K. M. (2008). A simple new algorithm to filter marine mammal Argos locations. Mar. Mamm. Sci. 24, 315–325. doi: 10.1111/j.1748-7692.2007.00180.x
Fuentes M. P. B., McMichael E., Kot C. Y., Silver-Gorges I., Wallace B. P., Godley B. J., et al. (2023). Key issues in assessing threats to sea turtles: knowledge gaps and future directions. Endang. Species Res. 52, 303–341. doi: 10.3354/esr01278
Gammon M., Fossette S., McGrath G., Mitchell N. (2020). A systematic review of metabolic heat in sea turtle nests and methods to model its impact on hatching success. Front. Ecol. Evol. 8. doi: 10.3389/fevo.2020.556379
Gaos A. R., Lewison R. L., Wallace B. P., Yañez I. L., Liles M. J., Nichols W. J., et al. (2012). Spatial ecology of critically endangered hawksbill turtles Eretmochelys imbricata: implications for management and conservation. Mar. Ecol. Prog. Ser. 450, 181–194. doi: 10.3354/meps09591
Girondot M., Monsinjon J., Guillon J.-M. (2018). Delimitation of the embryonic thermosensitive period for sex determination using an embryo growth model reveals a potential bias for sex ratio prediction in turtles. J. Therm. Biol. 73, 32–40. doi: 10.1016/j.jtherbio.2018.02.006
Godfrey M. H., Mrosovsky N. (2006). Pivotal temperature for green sea turtles, Chelonia mydas, nesting in Suriname. Herpetol. J. 16, 55–61. Available at: https://www.researchgate.net/publication/233563022_Pivotal_Temperature_for_green_sea_turtles_Chelonia_mydas_nesting_in_Suriname#fullTextFileContent.
Graeffe E. (1873). Samoa oder die Schifferinsln. I: Topographie von Samoa. J. Des. Museum Godeffroy 1, 1–32.
Grant G. S., Craig P., Balazs G. H. (1997). Notes on juvenile hawksbill and green turtles in American Samoa. Pac. Sci. 51, 48–53. Available at: http://hdl.handle.net/10125/3095.
Gravelle J., Wyneken J. (2022). Resilient eggs: highly successful loggerhead sea turtle nesting sites vary in their characteristics. Front. Ecol. Evol. 10. doi: 10.3389/fevo.2022.853835
Groombridge G., Wright L. (1982). The IUCN amphibia – reptilia Red Data book, Part 1: Testudines, Crocodylia, Rhynchocephalia (Gland, Switzerland and Cambridge UK: IUCN). Available at: https://portals.iucn.org/library/node/5840.
Hart K. M., Sartain A. R., Fujisaki I. (2015). Bahamas connection: residence areas selected by breeding female loggerheads tagged in Dry Tortugas National Park, USA. Anim. Biotel. 3, 3. doi: 10.1186/s40317-014-0019-2
Hays G. C., Ashworth J. S., Barnsley M. J., Broderick A. C., Emery D. R., Godley B. J., et al. (2001). The importance of sand albedo for the thermal conditions on sea turtle nesting beaches. OIKOS 93, 87–94. doi: 10.1034/j.1600-0706.2001.930109.x
Hays G. C., Fossette S., Katselidis K. A., Mariani P., Schofield G. (2010). Ontogenetic development of migration: Lagrangian drift trajectories suggest a new paradigm for sea turtles. J.R. Soc Interface 7, 1319–1327. doi: 10.1098/rsif.2010.0009
Hirth H. F. (1970). South Pacific islands – marine turtle resources. (Rome, Report prepared for the Fisheries Development Agency Project, FAO). Available at: https://openknowledge.fao.org/items/e9fce714-f451-4f62-a395-3304a5cd1d11.
Hirth H. F. (1993). “Chapter 10, Marine turtles,” in Nearshore Marine Resources of the South Pacific. Eds. Wright A., Hill L. (Forum Fisheries Agency (Honiara), Institute of Pacific Studies (Suva) and International Centre for Ocean Development, Canada), 329–370.
Hoover A. L., Shillinger G. L., Williamson S. A., Reina R. D., Bailey H. (2020). Nearshore neonate dispersal of Atlantic leatherback turtles (Dermochelys coriacea) from a non-recovering subpopulation. Sci. Rep. 10, 18748. doi: 10.1038/s41598-020-75769-0
Johnson D. S., London J. M., Lea M.-A., Durban J. W. (2008). Continuous-time correlated random walk model for animal telemetry data. Ecology 89, 1208–1215. doi: 10.1890/07-1032.1
Kitolelei S., Soderberg A., Qaqara N., Prakash S. S., Tuiono M., Veitayaki J., et al. (2022). Conservation status and cultural values of sea turtles leading to (un)written parallel management systems in Fiji. Ambio 51, 2431–2444. doi: 10.1007/s13280-022-01766-4
Kittinger J. N., Van Houtan K. S., McClenachan L. E., Lawrence A. L. (2013). Using historical data to assess the biogeography of population recovery. Ecography 36, 686–872. doi: 10.1111/j.1600-0587.2013.00245.x
Laloë J.-O., Monsijon J., Gaspar C., Touron M., Genet Q., Stubbs J., et al. (2020). Production of male hatchlings at a remote South Pacific green sea turtle rookery: conservation implications in a female-dominated world. Mar. Biol. 167, 70. doi: 10.1007/s00227-020-03686-x
Lewison R. L., Crowder L. B., Wallace B. P., Moore J. E., Cox T., Zydelis R., et al. (2014). Global patterns of marine mammal, seabird, and sea turtle bycatch reveal taxa-specific and cumulative megafauna hotspots. Proc. Natl. Acad. Sci. 111, 5271–5276. doi: 10.1073/pnas.1318960111
Limpus C. J. (2009). A biological review of Australian marine turtles. 2. Green turtle, Chelonia mydas (Linnaeus) (Brisbane, QLD: Queensland Environmental Protection Agency).
Lolavar A., Wyneken J. (2020). The impact of sand moisture on the temperature-sex ratio responses of developing loggerhead (Caretta caretta) sea turtles. Zool 138, 125739. doi: 10.1016/j.zool.2019.125739
Maison K. A., Kelly I. K., Frutchey K. P. (2010). Green turtle nesting sites and sea turtle legislation throughout Oceania (U. S. Dep. Commer., NOAA Tech. Memo). NMFS-F/SPO-110, 52 p.
Matthews B. L., Gatto C. R., Reina R. D. (2021). Effects of moisture during incubation on green sea turtle (Chelonia mydas) development, morphology and performance. Endang. Species Res. 46, 253–268. doi: 10.3354/esr01159
Mazaris A. D., Schofield G., Gkazinou C., Almpanidou V., Hays G. C. (2017). Global sea turtle conservation successes. Sci. Adv. 3, 31600730. doi: 10.1126/sciadv.1600730
McClenachan L., Jackson J. B. C., Newman M. J. H. (2006). Conservation implications of historic sea turtle nesting beach loss. Front. Ecol. Environ. 4, 290–296. doi: 10.1890/1540-9295(2006)4[290:CIOHST]2.0.CO;2
Meretsky V. J., Atwell J. W., Hyman J. B. (2011). Migration and conservation: frameworks, gaps, and synergies in science, law, and management. Environ. Law 41, 447–534. Available at: https://pubmed.ncbi.nlm.nih.gov/29332970/
Miller J. (1999). “Determining clutch size and hatching success,” in Research and Management Techniques for the Conservation of Sea Turtles. Eds. Eckert K. K., Bjorndal K. A., Abreu-Grobois F. A., Donnelly M. (IUCN/SSC Marine Turtle Specialist Group, Publication No. 4, Washington, D.C), 124–129.
Mimura N. (1999). Vulnerability of island countries in the South Pacific to sea level rise and climate change. Clim. Res. 12, 137–143. doi: 10.3354/cr012137
Mortimer J. A., Von Brandis R. G., Liljevik A., Chapman R., Collie J. (2011). Fall and rise of nesting green turtles (Chelonia mydas) at Aldabra Atoll, Seychelles: positive response to four decades of protection, (1968-2008). Chelonian Conserv. Biol. 10, 165–176. doi: 10.2744/CCB-0872.1
Mozón-Argűello C., López-Jurado L. F., Rico C., Marco A., López P., Hays G. C., et al. (2010). Evidence from genetic and Lagrangian drifter data for transatlantic transport of small juvenile green turtles. J. Biogeogr. 37, 1752–1766. doi: 10.1111/j.1365-2699.2010.02326.x
Mrosovsky N. (1980). Thermal biology of sea turtles. Amer. Zool. 20, 531–547. doi: 10.1093/icb/20.3.531
Naro-Maciel E., Gaughran S. J., Putman N. F., Amato G., Arengo F., Dutton P., et al. (2014). Predicting connectivity of green turtles at Palmyra Atoll, central Pacific: a focus on mtDNA and dispersal modelling. J. R. Soc Interface 11, 20130888. doi: 10.1098/rsif.2013.0888
National Research Council (NRC) (2010). Assessment of sea-turtle status and trends: integrating demography and abundance (Washington, D. C: The National Academies Press).
Okuyama J., Abe O., Nishizawa H., Kobayashi M., Yoseda K., Arai N. (2009). Ontogeny of the dispersal migration of green turtle (Chelonia mydas) hatchlings. J. Exp. Biol. 379, 43–50. doi: 10.1016/j.jembe.2009.08.008
Patrício A. R., Hawkes L. A., Monsinjon J. R., Godley B. J., Fuentes M. M. P. B. (2021). Climate change and marine turtles: recent advances and future directions. Endang. Species Res. 44, 363–395. doi: 10.3354/esr01110
Pebesma E. (2018). Simple features for R: standardized support for spatial vector data. R J. 10, 439–446. doi: 10.32614/RJ-2018-009
Peck B., Banko P., Pendleton F., Schmaedick M. A., Ernsberger K. (2016). Anthropods of Rose Atoll with special reference to ants and Pulvinaria urbicola scales (Hemiptera: coccidae) on Pisonia grandis trees (Hawaii Cooperative Studies Unit, University of Hawaii at Hilo, Tech. Rep). HCSU-057, 25 p.
Pendleton F. (2014). Research and management of Rose Atoll National Wildlife Refuge & Marine National Monument (January 2011 – December 2013) (U. S. Fish and Wildlife Service). 39 p.
Pilcher N., Basintal P. (2000). Reproductive biology of the green turtle Chelonia mydas in Sabah, Malaysia. Asian J. Trop. Biol. 4, 59–66.
Piovano S., Batibasaga A. (2020). “Fiji,” in Sea Turtles in Oceania - MTSG Annual Regional Report. Eds. Work T. J., Parker D. M., Balazs G. H. (IUCN/SSC Marine Turtle Specialist Group Publication), 152–166.
Piovano S., Batibasaga A., Ciriyawa A., LaCasella E. L., Dutton P. (2019). Mixed stock analysis of juvenile green turtles aggregating at two foraging grounds in Fiji reveals major contribution from the American Samoa Management Unit. Nat. Sci. Rep. 9, 3150. doi: 10.1038/s41598-019-39475-w
Pritchard A. M., Sanchez C. L., Bunbury N., Burt A. J., Currie J. C., Doak N., et al. (2022). Green turtle population recovery at Aldabra Atoll continues after 50 yr of protection. Endang. Species Res. 47, 205–215. doi: 10.3354/esr01174
Putnam N. F., Mansfield K. L. (2015). Direct evidence of swimming demonstrates active dispersal in the sea turtle “Lost Years. Curr. Biol. 25, 1221–1227. doi: 10.1016/j.cub.2015.03.014
R Core Team (2022). R: a language and environment for statistical computing (Vienna, Austria: R Foundation for Statistical Computing).
Rees A. F., Alfaro-Shigueto J., Barata P. C. R., Bjorndal K. A., Bolten A. B., Bourjea J., et al. (2016). Review: are we working towards global research priorities for management and conservation of sea turtles? Endang. Species Res. 31, 337–382. doi: 10.3354/esr00801
Rivas M. L., Rodríguez-Caballero E., Esteban N., Carpio A. J., Barrera-Vilarmau B., Fuentes M. M. P. B., et al. (2023). Uncertain future for global sea turtle populations in face of sea level rise. Sci. Rep. 13, 5277. doi: 10.1038/s41598-023-31467-1
Salleh S. M., Sah S. A. M., Chowdhury A. J. K. (2018). Assessing nesting status of green turtles, Chelonia mydas in Perak, Malaysia. Trop. Life Sci. Res. 29, 155–171. doi: 10.21315/tlsr2018.29.1.11
Scott R., March R., Hays G. C. (2014). Ontogeny of long-distance migration. Ecology 95, 2840–2850. doi: 10.1890/13-2164.1
Sellés-Roís B., Flatt E., Ortiz-García J., García-Colome J., Latour O., Whitworth A. (2022). Warm beach, warmer turtles: using drone-mounted thermal infrared sensors to monitor sea turtle nesting activity. Front. Conserv. Sci. 3. doi: 10.3389/fcosc.2022.954791
Seminoff J. A. (2023). Chelonia mydas (amended version of 2004 assessment). In: The IUCN Red List of Threatened Species 2003 (Accessed March 1, 2024).
Seminoff J. A., Allen C. D., Balazs G. H., Dutton P. H., Eguchi T., Haas H., et al. (2015). Status review of the green turtle (Chelonia mydas) under the Endangered Species Act. La Jolla, CA: U.S. Department of Commerce, National Oceanic and Atmospheric Administration, National Marine Fisheries Service, NMFS-SWFSC-539. Available at: https://repository.library.noaa.gov/view/noaa/4922.
Seminoff J. A., Zárate P., Coyne M., Foley D. G., Parker D., Lyon B. N., et al. (2008). Post-nesting migrations of Galápagos green turtles Chelonia mydas in relation to oceanographic conditions: integrating satellite telemetry with remotely sensed ocean data. Endang. Species Res. 4, 57–72. doi: 10.3354/esr00066
Storlazzi C. D., Elias E. P. L., Berkowitz P. (2015). Many atolls may be uninhabitable within decades due to climate change. Sci. Rep. 5, 14546. doi: 10.1038/srep14546
Suhaimi N. S., Daud N. R., Akhir M. F., Rusli M. U. (2020). Oceanic dispersal model of green turtle hatchlings in the South China Sea. Malays. Appl. Biol. 49, 41–55. doi: 10.55230/mabjournal.v49i4.1566
Summers T. M., Martin S. L., Hapdei J. R., Ruak J. K., Jones T. T. (2018). Endangered green turtles (Chelonia mydas) of the Northern Mariana Islands: nesting ecology, poaching, and climate concerns. Front. Mar. Sci. 4. doi: 10.3389/fmars.2017.00428
Sumner M. D., Wotherspoon S. J., Hindell M. A. (2009). Bayesian estimation of animal movement from archival and satellite tags. PloS One 4, e732. doi: 10.1371/journal.pone.0007324
Tanabe L. K., Cochran J. E. M., Berumen M. L. (2023). Inter-nesting, migration, and foraging behaviors of green turtles (Chelonia mydas) in the central-southern Red Sea. Nat. Sci. Rep. 13, 11222. doi: 10.1038/s41598-023-37942-z
Touron M., Quentin G., Gaspar C. (2018). Final report on the green sea turtle egg-laying season of 2017-2018 (Chelonia mydas) on the atoll of Tetiaroa, French Polynesia. Faaa, French Polynesia: Te mana o te moana. Available at: https://www.temanaotemoana.org/wp-content/uploads/2019/03/EN_2017_2018S_Green_sea_turtles_nesting_sites_Tetiaroa_FINAL_REPORT.pdf.
Tuato`o-Bartley N., Morrell T. E., Craig P. (1993). Status of sea turtles in American Samoa in 1991. Pac. Sci. 47, 215–221. Available at: http://hdl.handle.net/10125/1762.
Tűrkozan O., Almpanidou V., Yilmaz C., Mazaris A. D. (2021). Extreme thermal conditions in sea turtle nests jeopardize reproductive output. Clim. Change 167, 30. doi: 10.1007/s10584-021-03153-6
United States Fish and Wildlife Service (USFWS) (2014). Rose Atoll National Wildlife Refuge comprehensive conservation plan (Rose Atoll National Wildlife Refuge c/o National Park Service, Pacific Reefs and Hawaiian and Pacific Islands Planning Team). Available at: https://www.fws.gov/sites/default/files/documents/Rose%20Atoll%20NWR%20Final%20CCP_May%202014%281%29.pdf.
United States Fish and Wildlife Service (USFWS), National Marine Fisheries Service (NMFS) (1996). Policy regarding the recognition of distinct vertebrate population segments under the Endangered Species Act. Available online at: https://www.govinfo.gov/content/pkg/FR-1996-02-07/pdf/96-2639.pdf.
Van Houtan K. S., Bass O. L. (2007). Stormy oceans are associated with declines in sea turtle hatching. Curr. Biol. 17, R590–R591. doi: 10.1016/j.cub.2007.06.021
Wallace B. P., DiMatteo A. D., Hurley B. J., Finkbeiner E. M., Bolten A. B., Chaloupka M. Y., et al. (2010). Regional management units for marine turtles: a novel framework for prioritizing conservation and research across multiple scales. PloS One 5, e15465. doi: 10.1371/journal.pone.0015465
Wallace B. P., Posnik Z. A., Hurley B. J., DiMatteo A. D., Bandimere A., Rodriguez I., et al. (2023). Marine turtle regional management units 2.0: an updated framework for conservation and research of wide-ranging megafauna species. Endang. Species Res. 52, 209–223. doi: 10.3354/esr01243
Wibbels T., Lutz P. L., Musick J. A., Wyneken J. (2003). “Critical approaches to sex determination in sea turtles,” in The Biology of Sea Turtles Volume II. Eds. Lutz P. L., Musick J. A. (CRC Pres, Boca Raton, FL), 103–134.
Wood S. N. (2003). Thin plate regression splines. J. R. Statist. Soc B. 65, 95–114. doi: 10.1111/1467-9868.00374
Keywords: Chelonia mydas, population assessment, nesting ecology, spatial ecology, hatching success, nest temperature, climate change, conservation
Citation: Murakawa SK, Gaos AR, Johnson DS, Peck B, MacDonald M, Sachs E, Pendleton F, Allen CD, Staman MK, Ishimaru S, Van Houtan KS, Liusamoa A, Jones TT and Martin SL (2024) Abundance, production, and migrations of nesting green turtles at Rose Atoll, American Samoa, a regionally important rookery in the Central South Pacific Ocean. Front. Mar. Sci. 11:1403240. doi: 10.3389/fmars.2024.1403240
Received: 19 March 2024; Accepted: 18 June 2024;
Published: 17 July 2024.
Edited by:
Graeme Clive Hays, Deakin University, AustraliaReviewed by:
Donna Jill Shaver, National Park Service, United States Department of the Interior, United StatesCopyright © 2024 Murakawa, Gaos, Johnson, Peck, MacDonald, Sachs, Pendleton, Allen, Staman, Ishimaru, Van Houtan, Liusamoa, Jones and Martin. This is an open-access article distributed under the terms of the Creative Commons Attribution License (CC BY). The use, distribution or reproduction in other forums is permitted, provided the original author(s) and the copyright owner(s) are credited and that the original publication in this journal is cited, in accordance with accepted academic practice. No use, distribution or reproduction is permitted which does not comply with these terms.
*Correspondence: Shawn K. Murakawa, U2hhd24uTXVyYWthd2FAbm9hYS5nb3Y=
Disclaimer: All claims expressed in this article are solely those of the authors and do not necessarily represent those of their affiliated organizations, or those of the publisher, the editors and the reviewers. Any product that may be evaluated in this article or claim that may be made by its manufacturer is not guaranteed or endorsed by the publisher.
Research integrity at Frontiers
Learn more about the work of our research integrity team to safeguard the quality of each article we publish.