 David W. Perkey
 Lenore P. Tedesco
 Kelsey A. Fall3
 Thomas P. Huff
- 1Engineer Research and Development Center, Coastal and Hydraulics Laboratory, U.S. Army Corps of Engineers, Vicksburg, MS, United States
- 2The Wetlands Institute, Stone Harbor, NJ, United States
- 3Department of Civil and Environmental Engineering, University of Delaware, Newark, DE, United States
- 4Engineer Research and Development Center, Environmental Laboratory, U.S. Army Corps of Engineers, Vicksburg, MS, United States
- 5Philadelphia District, U.S. Army Corps of Engineers, Philadelphia, PA, United States
Due to observed impacts of sea level rise, many sediment management strategies in coastal settings are seeking ways to beneficially use locally dredged sediment in restoration, nourishment, and construction projects. The placement of sediment in shallow, near-marsh areas is a promising application of dredged material to both increase accretion and provide protection to marshes and intertidal flats in back bay areas. However, dredged material in these areas often include fine-grained (<63 μm) sediments (FGS), that frequently raise questions concerning dispersion, stability, and environmental impact of the placement project. In 2020, approximately 30,500 m3 of FGS from the New Jersey Intracoastal Waterway (NJIWW) was placed along the southern edge of Gull Island, New Jersey to evaluate the feasibility of using FGS for beneficial use projects in near marsh environments. Gull Island was experiencing extensive marsh edge erosion through margin collapse. The placement was unconfined and resulted in the formation of two intertidal muddy berm-like features up to 0.7 m thick along more than 500 m of marsh. Bathymetric surveys showed that approximately 60-70% of the berm volume remained 36 months after placement, however maximum berm thickness reduced to ~0.5 m. Field monitoring performed during construction found that turbidity plumes were localized to within 100 m of the placement site and sediment cores collected in June 2022 did not show systemic winnowing from the berm surface. Laboratory and field observations indicated that the berm material was cohesive in nature and produced large aggregates upon erosion, limiting the dispersal of FGS. Observations of current velocities and waves in the area indicate a low energy system such that the cohesive berm was largely resistant to erosion and that reduction in berm volume was largely due to consolidation and compaction. This suggests that shallow water features can be constructed with FGS in similar low energy environments with limited dispersal during and following construction, while being robust enough to help stabilize the marsh edge and improve marsh survivability against sea level rise.
1 Introduction
Tidal salt marshes are crucial ecosystems that provide habitats for wildlife, including up to 90% of recreational and commercial fisheries, and more than half of the threatened and endangered species of birds. They provide a range of ecosystem services including coastal flood risk reduction, wave attenuation, and carbon and nutrient sequestration and removal (Weis et al., 2021). Coastal wetlands are experiencing accelerating rates of fragmentation and degradation due to sea level rise, sediment deficits, and subsidence, reducing their ability to provide these ecosystem services.
Rates of eustatic sea level rise (SLR) have accelerated over the last several decades, increasing from 1.3 mm/yr between 1901-1971, to 1.9 mm/yr from 1971-2006, to 3.7 mm/yr from 2006-2018 (Lee et al., 2023). SLR now poses the largest climate-related threat to salt marshes across much of the globe. However, regional rates of SLR can differ significantly from the global average. In our study area of coastal New Jersey, long-term SLR rates are significantly higher than the global average rise rates. Over the last century, sea level in New Jersey has risen 0.45 m versus 0.18 m globally (Kopp et al., 2019) and over the next century, rates of SLR in New Jersey are expected to accelerate due to climate change with median projections for 2000-2100 ranging from 0.85 m to 1.19 m using low vs high emission scenarios, respectively (Kopp et al., 2019). The relative sea level rise (RSLR) is bleaker with a mean annual RSLR of 4 mm based on the NOAA Atlantic City tide records (gauge # 8534720) from 1914 to 2023.
To combat SLR, coastal managers are seeking to increase the practice of using locally sourced dredged sediment for beneficial use across various coastal environments for both storm protection and environmental restoration (e.g. Weinstein and Weishar, 2002; Yozzo et al., 2004; Bolam and Whomersley, 2005; Croft et al., 2006; Erwin et al., 2007; Mohan et al., 2007; ASBPA, 2023). However, beneficial use of dredged material (BUDM) requires that the dredged material have properties that are suitable for use in the project. Sediments dredged from coastal waterways, channels, and ports are commonly heterogenous mixtures of sand and mud (<63 µm). The use and application of sediment that contains substantial amounts of mud, also known as fine grained sediment (FGS), is often limited due to both geotechnical and environmental concerns (ASBPA, 2023). FGS is commonly perceived to be dispersive, largely due to the assumption that the fines will either remain suspended within the water column or be easily resuspended from the bed before they are able to consolidate. Uncertainties about the transport of fine-grained dredged materials out of the intended placement area can lead to reluctance of their use in BUDM projects. Further, water quality issues associated with increased turbidity due to the suspended sediment can result in environmental restrictions based on the grain size of the dredged material (ASBPA, 2023).
Research is needed that demonstrates and evaluates uses of FGS in wetland BUDM projects to improve and expand restoration practices in these critical areas. In 2019, the US Army Corps of Engineers (USACE), Philadelphia District (NAP), in conjunction with USACE’s Engineering Research and Development Center (ERDC), the State of New Jersey, and The Wetlands Institute (TWI), launched the Seven Mile Island Innovation Laboratory (SMIIL) to evaluate innovative dredged material management practices and alternatives in coastal New Jersey with the goal to advance and improve dredging and marsh restoration techniques through research, collaboration, knowledge sharing, and practical application (Chasten et al., 2022). The SMIIL is defined geographically within the coastal region between Townsends Inlet at the north end of Avalon to Hereford Inlet at the south end of Stone Harbor, Cape May, New Jersey (Figures 1A, B) and includes both the back bay and oceanfront areas. SMIIL’s back bay areas are shallow lagoons with average low tide depths of 0.6m (Faas and Carson, 1988). The area has no immediate freshwater input through rivers or streams (Kran, 1975), limiting sediment delivery to the back bay areas to either Townsend and Hereford Inlets or autochthonous production. Due to their distance from the coastal inlets (>5 km) sediments in the interior sounds are believed to be primary autochthonous in nature.
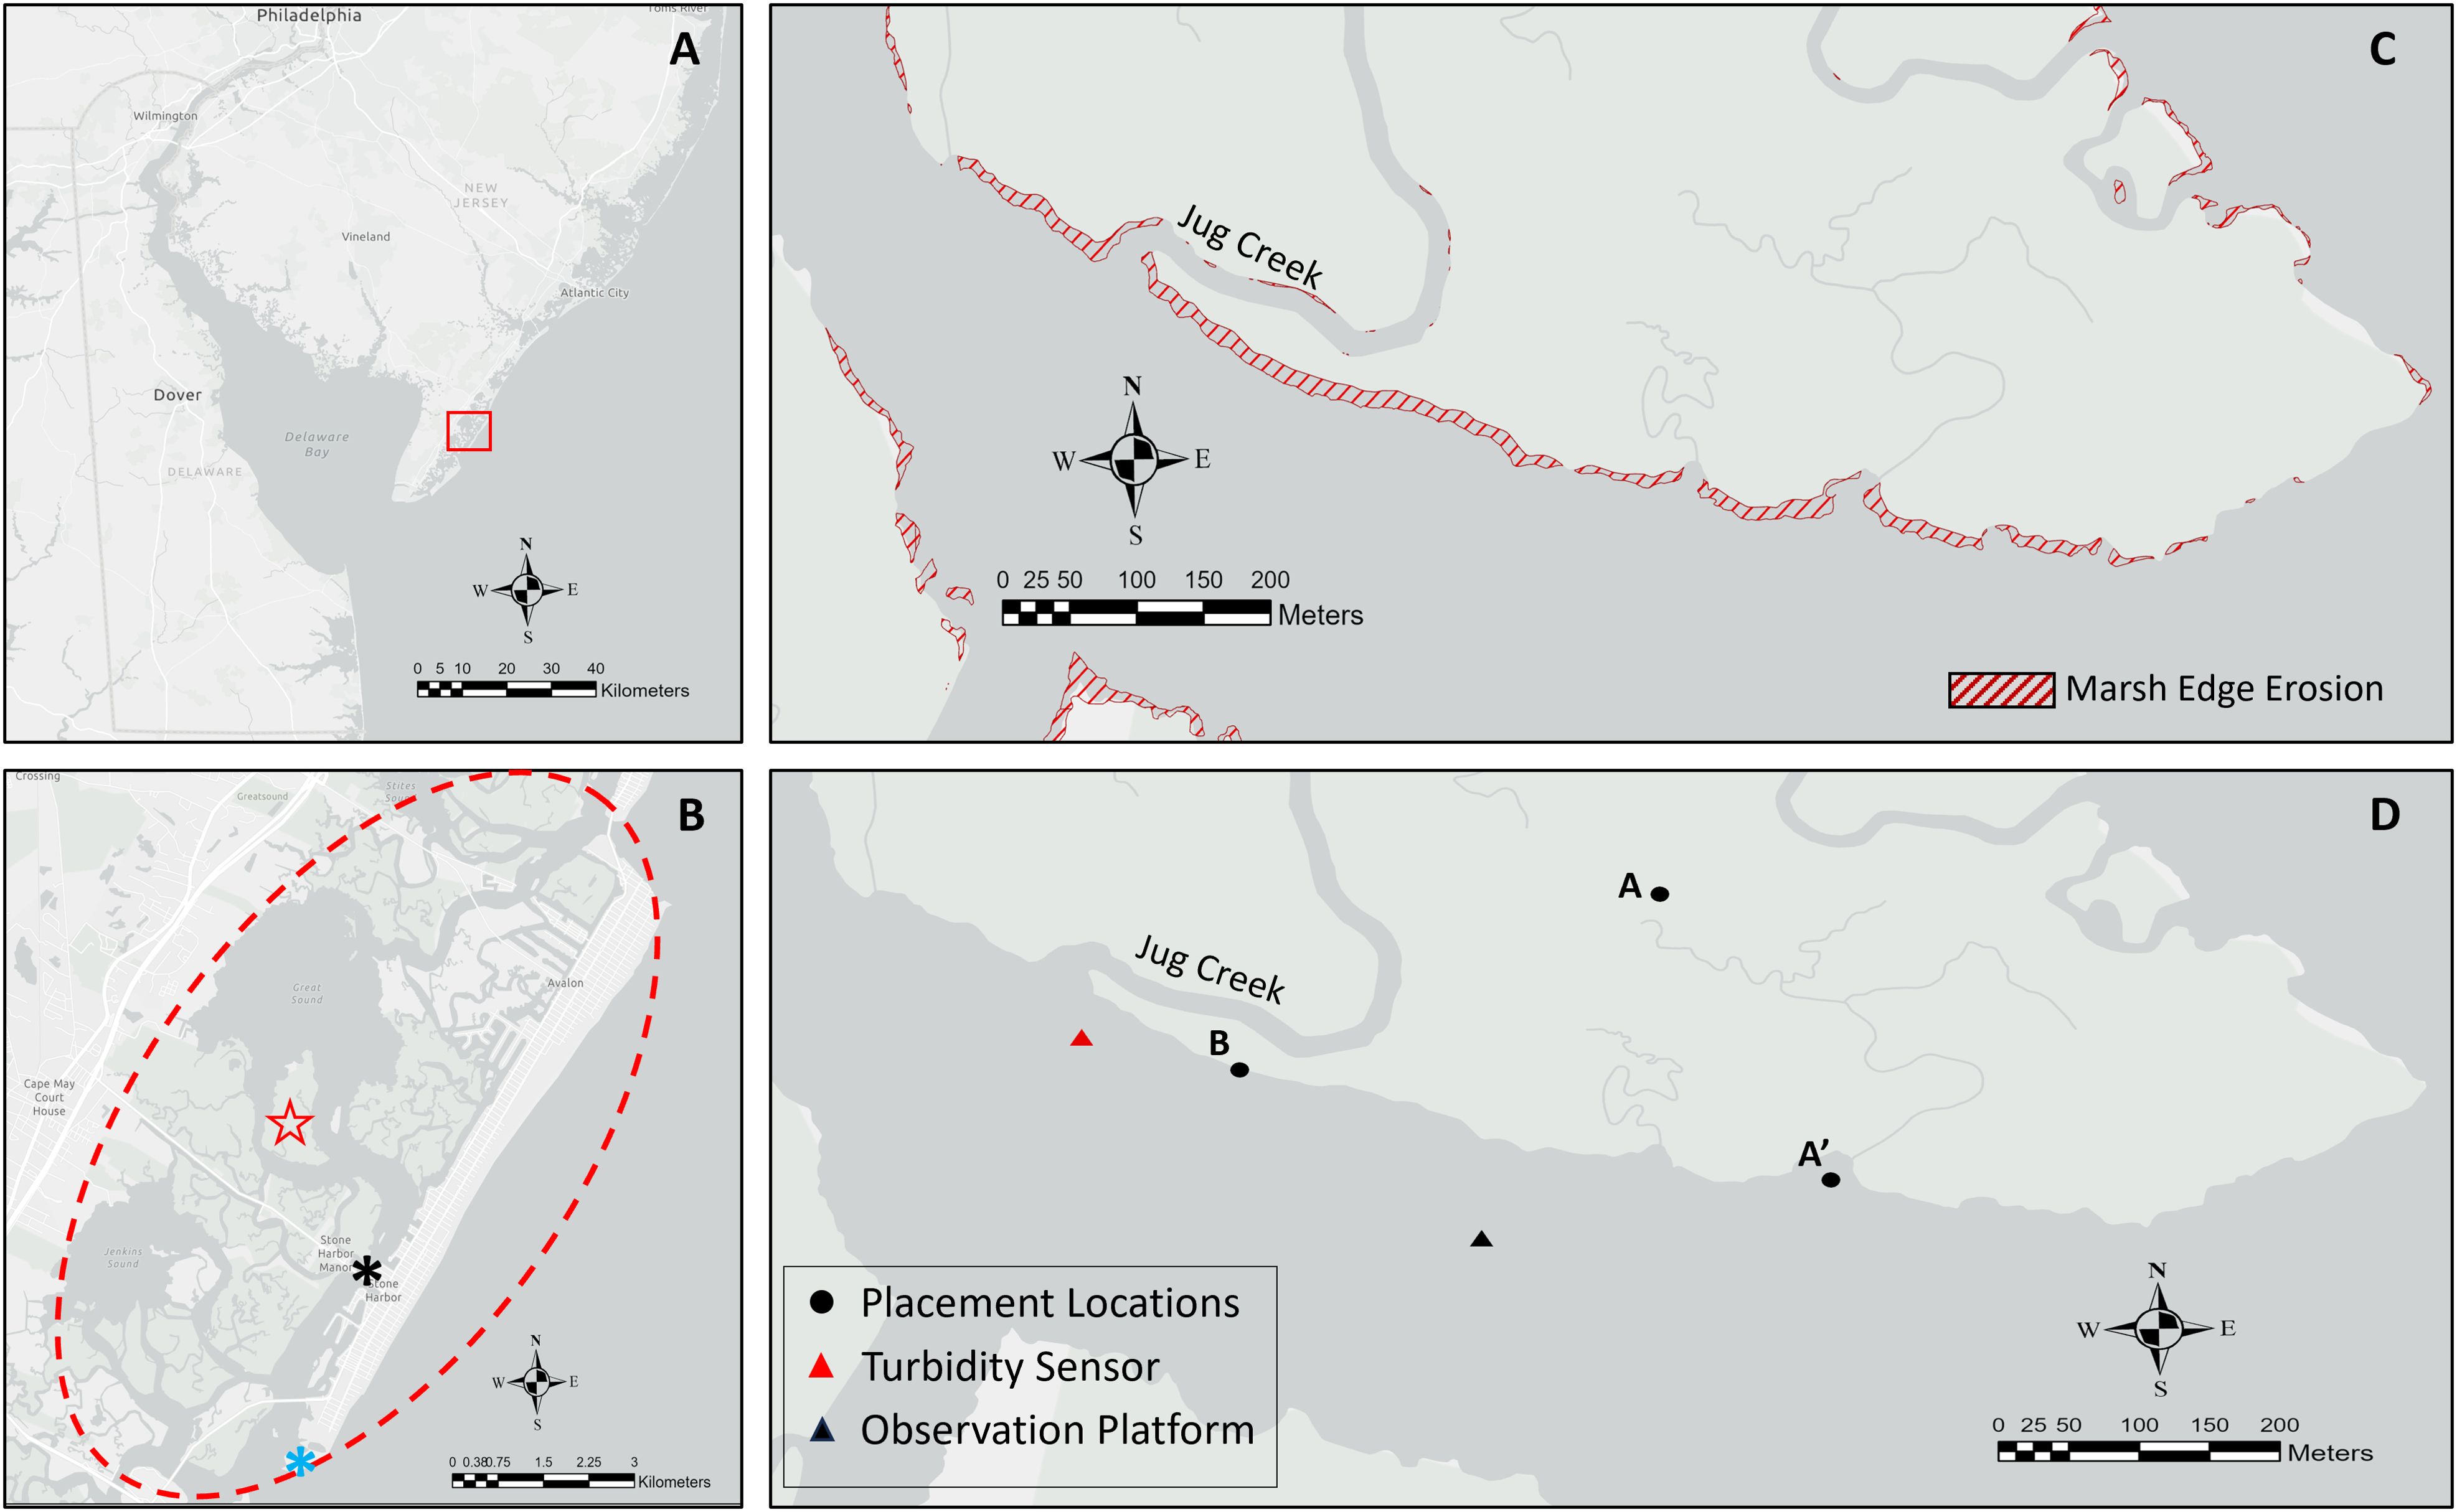
Figure 1. Study area map. The regional location of the study area is shown within the red box in (A). The area that constitutes SMIIL is shown in (B), with a red oval to highlight the area and Gull Island indicated by the red star. The USGS and NOAA tidal and weather stations are indicated by the black and blue asterisks, respectively. Marsh edge erosion that has occurred along the southern end of Gull Island from 1977-2012 is shown in (C). The locations of the placement areas and deployed instrumentation are indicated in (D). Locations of the placement pipes are indicated by black circles. Circle A’ marks the location of the deposition at the mouth of the unnamed tidal channel. Deployed instrument locations are indicated with triangles. Map imagery provided through Esri Community Maps Contributors, New Jersey Office of GIS, (c) OpenStreetMap, Microsoft, Esri, TomTom, Garmin, SafeGraph, Geotechnologies, Inc, METI/NASA, USGS,EPA,NPS, US Census Bureeau, USDA, USFWS.
In 2020, a BUDM placement project was conducted on Gull Island, a low-lying marsh island centrally located in SMIIL as indicated by the red start in Figure 1B. The southern margin of the island is erosional with block failure common along the marsh edge. Figure 1C presents the marsh edge erosion mapping developed by the Stockton University Coastal Research Center (2024). The red hashed regions indicate areas of marsh edge retreat from 1977-2012. While marsh edge loss along Southern Gull varied spatially, erosion was typically on the order of 5-15 m over the 35-year span. Additionally, surface elevations on Gull Island are largely below the tidal Mean Higher High Water (MHHW) level, resulting in frequent flooding, inundation, and deterioration of high marsh habitat. The 2020 restoration project used approximately 30,500 m3 of mixed fine sand and FGS dredged from the nearby New Jersey Intracoastal Waterway (NJIWW) channel that were hydraulically pumped and placed at two unconfined locations on the southern portion of the island (Figure 1D). Most of the dredged sediments were placed in the low-lying interior marsh at location A with the intent to increase marsh elevation. No containment structures were erected to allow for maximum dispersal of the placed dredged material and slurry discharged from the placement pipe was allowed to flow into nearby tidal channels and downstream to the southern marsh edge of the island, resulting in a berm-like deltaic deposit at the mouth of an unnamed tidal channel, here after referred to as site A’ (Figures 1D, 2). At location B, approximately 7,000 m3 of dredged material were directly placed on the intertidal flat immediately adjacent to the existing marsh edge with the intention of providing marsh edge protection along the southern edge of the island (Figures 1D, 2). The location of site B was specifically selected because it was in an area of pronounced marsh edge erosion that if unchecked posed a risk of breaching into Jug Creek and a large interior pool. The change in hydrodynamics associated with such a breach would have the potential to result in large-scale marsh loss. No containment structures were used at location B.
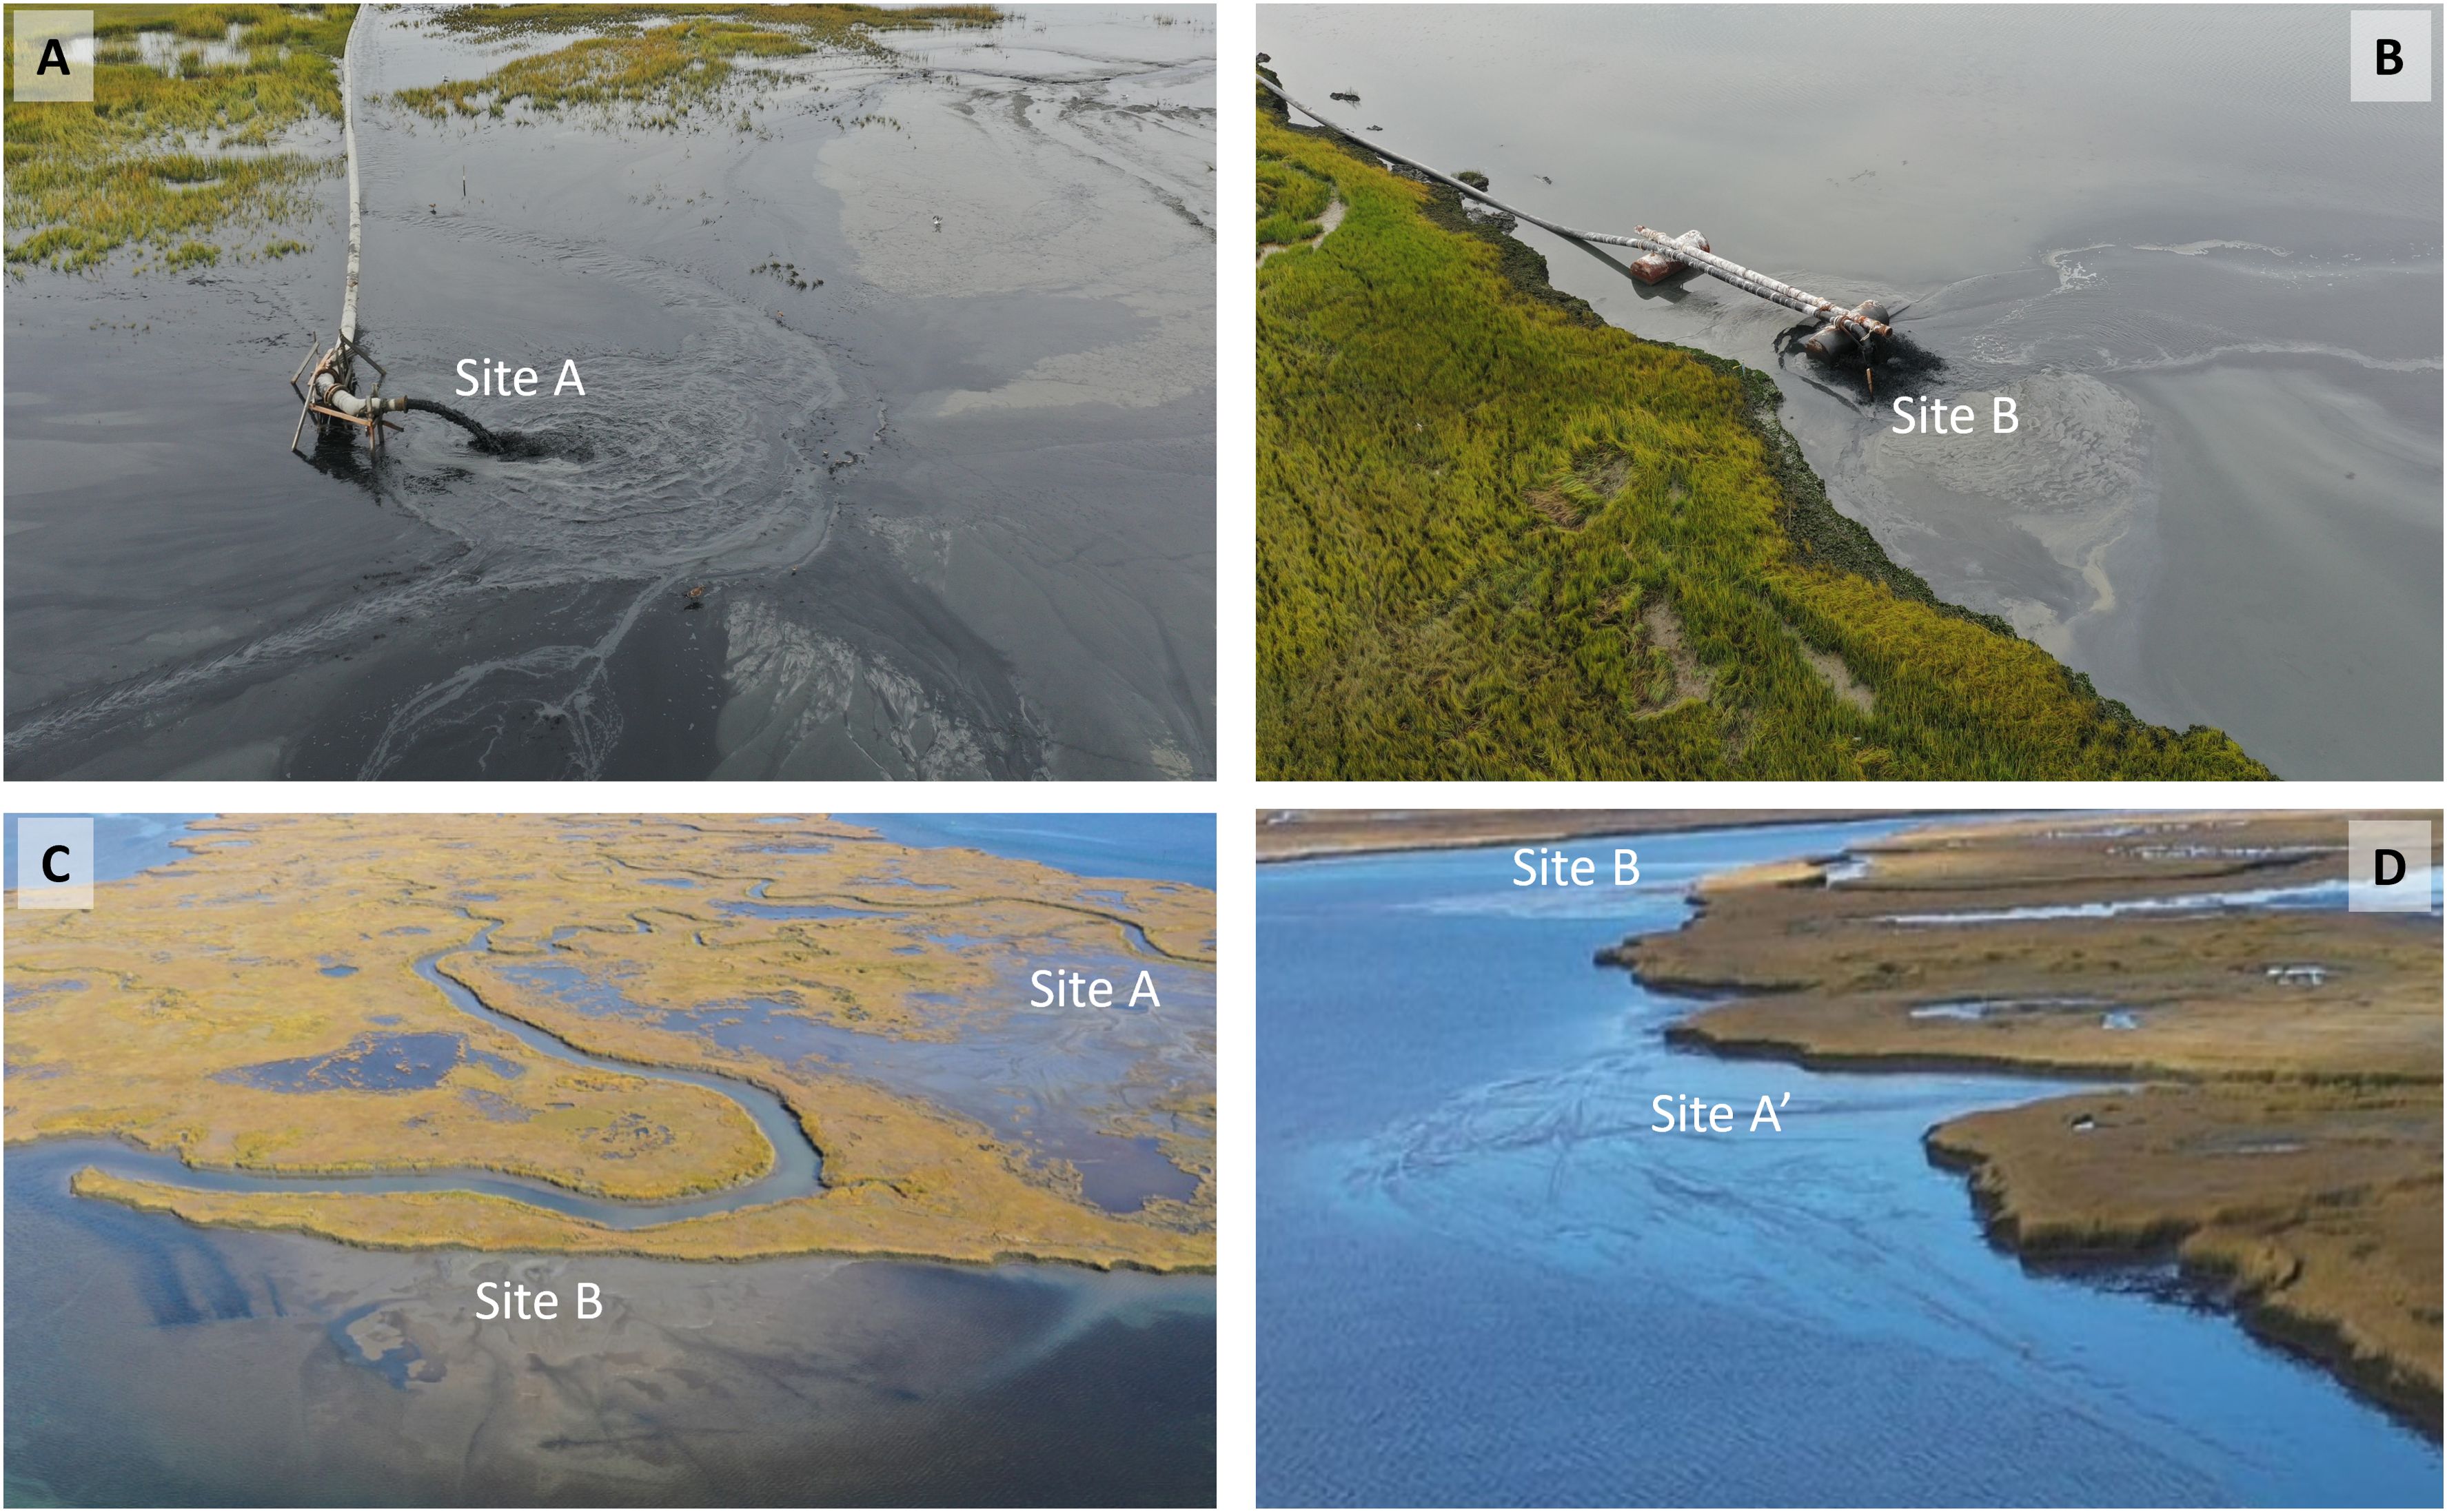
Figure 2. Active placement of dredge material from the discharge pipes on marsh (A) and in the nearshore (B). 1-month post placement photos are provided in (C, D). Placement sites A, A’, and B are labeled in each photograph. Photo credit Gary Paul, courtesy of Philadelphia District, USACE.
The primary goal of the research presented here is to document the construction and stability of muddy berms that were formed along the marsh edge of Gull Island, NJ (Figures 2C, D) as well has the geomorphic and hydrodynamic conditions that resulted in their stability. As previously stated, concerns associated with the dispersion of FGS during and after placement has limited the use of muddy sediment in many BUDM projects within the United States. To help address these concerns, this study will present turbidity data collected during placement to document the spatial extent of the suspended sediment plume during construction as well as turbidity data collected years following placement to evaluate potential long-term impacts on water clarity. Bathymetric data will also be presented that documents the morphology of the intertidal flat prior to placement and the marsh edge berms that formed as a result of placement. Changes in morphology are evaluated over a 36-month period to assess berm stability. In addition, basic grain size and hydrodynamic data will be presented that characterize the physical conditions of the environment and how these factored into the stability of the berms at Gull Island. These data are also used in conjunction with previous lab data to estimate current velocities that would be required to mobilize the mud berms following deposition and consolidation. These data not only describe the placement experiment conducted at the Gull Island field site but allow for inferences for other FGS BUDM applications in similar environments.
2 Methods
Data from field observations were collected over an approximate three-year period spanning August 2020 through September of 2023. Dredge material placement occurred from September 23, 2020 through October 27, 2020. Multiple surveys were conducted prior to, during, and post placement to record changes in bathymetry and turbidity that resulted from the dredged material placement. Additionally, and as part of a larger scoping research effort to obtain hydrodynamic and water quality data within the SMIIL, an observation platform was constructed in the shallow flats off the southern edge of Gull Island in June of 2021 (Figure 1D). Instrumentation deployed on this platform recorded turbidity, tidal currents, and waves in the study area. The below sections provide a detailing of the data collected during the study and the methodologies used to analyze those data.
2.1 Bathymetry
Three bathymetric surveys were performed in the waters off the southern edge of Gull Island. They consist of a pre-placement survey conducted in August of 2020, a 6-month post-placement survey conducted in March of 2021, and a final 36-month post-placement survey completed in September of 2023. Survey methods followed standards outlined in US Army Corps of Engineers hydrographic survey manual EM1110-2-1003 (USACE, 2013). Soundings are reported in meters and the vertical reference for all surveys was Corps of Engineers, Philadelphia District Mean Lower Low Water, which is 0.73 meters below NAVD88.
An Odom CV 100 echosounder operating at 200 kHz was used to collect single beam bathymetry data. The data string was recorded and monitored using HYPACK software. Horizontal line spacing was set at 30 m, but actual spacing varied due to wave and tidal stage conditions, as well as the need to occasionally navigate around other vessels and obstacles (Figure 3).
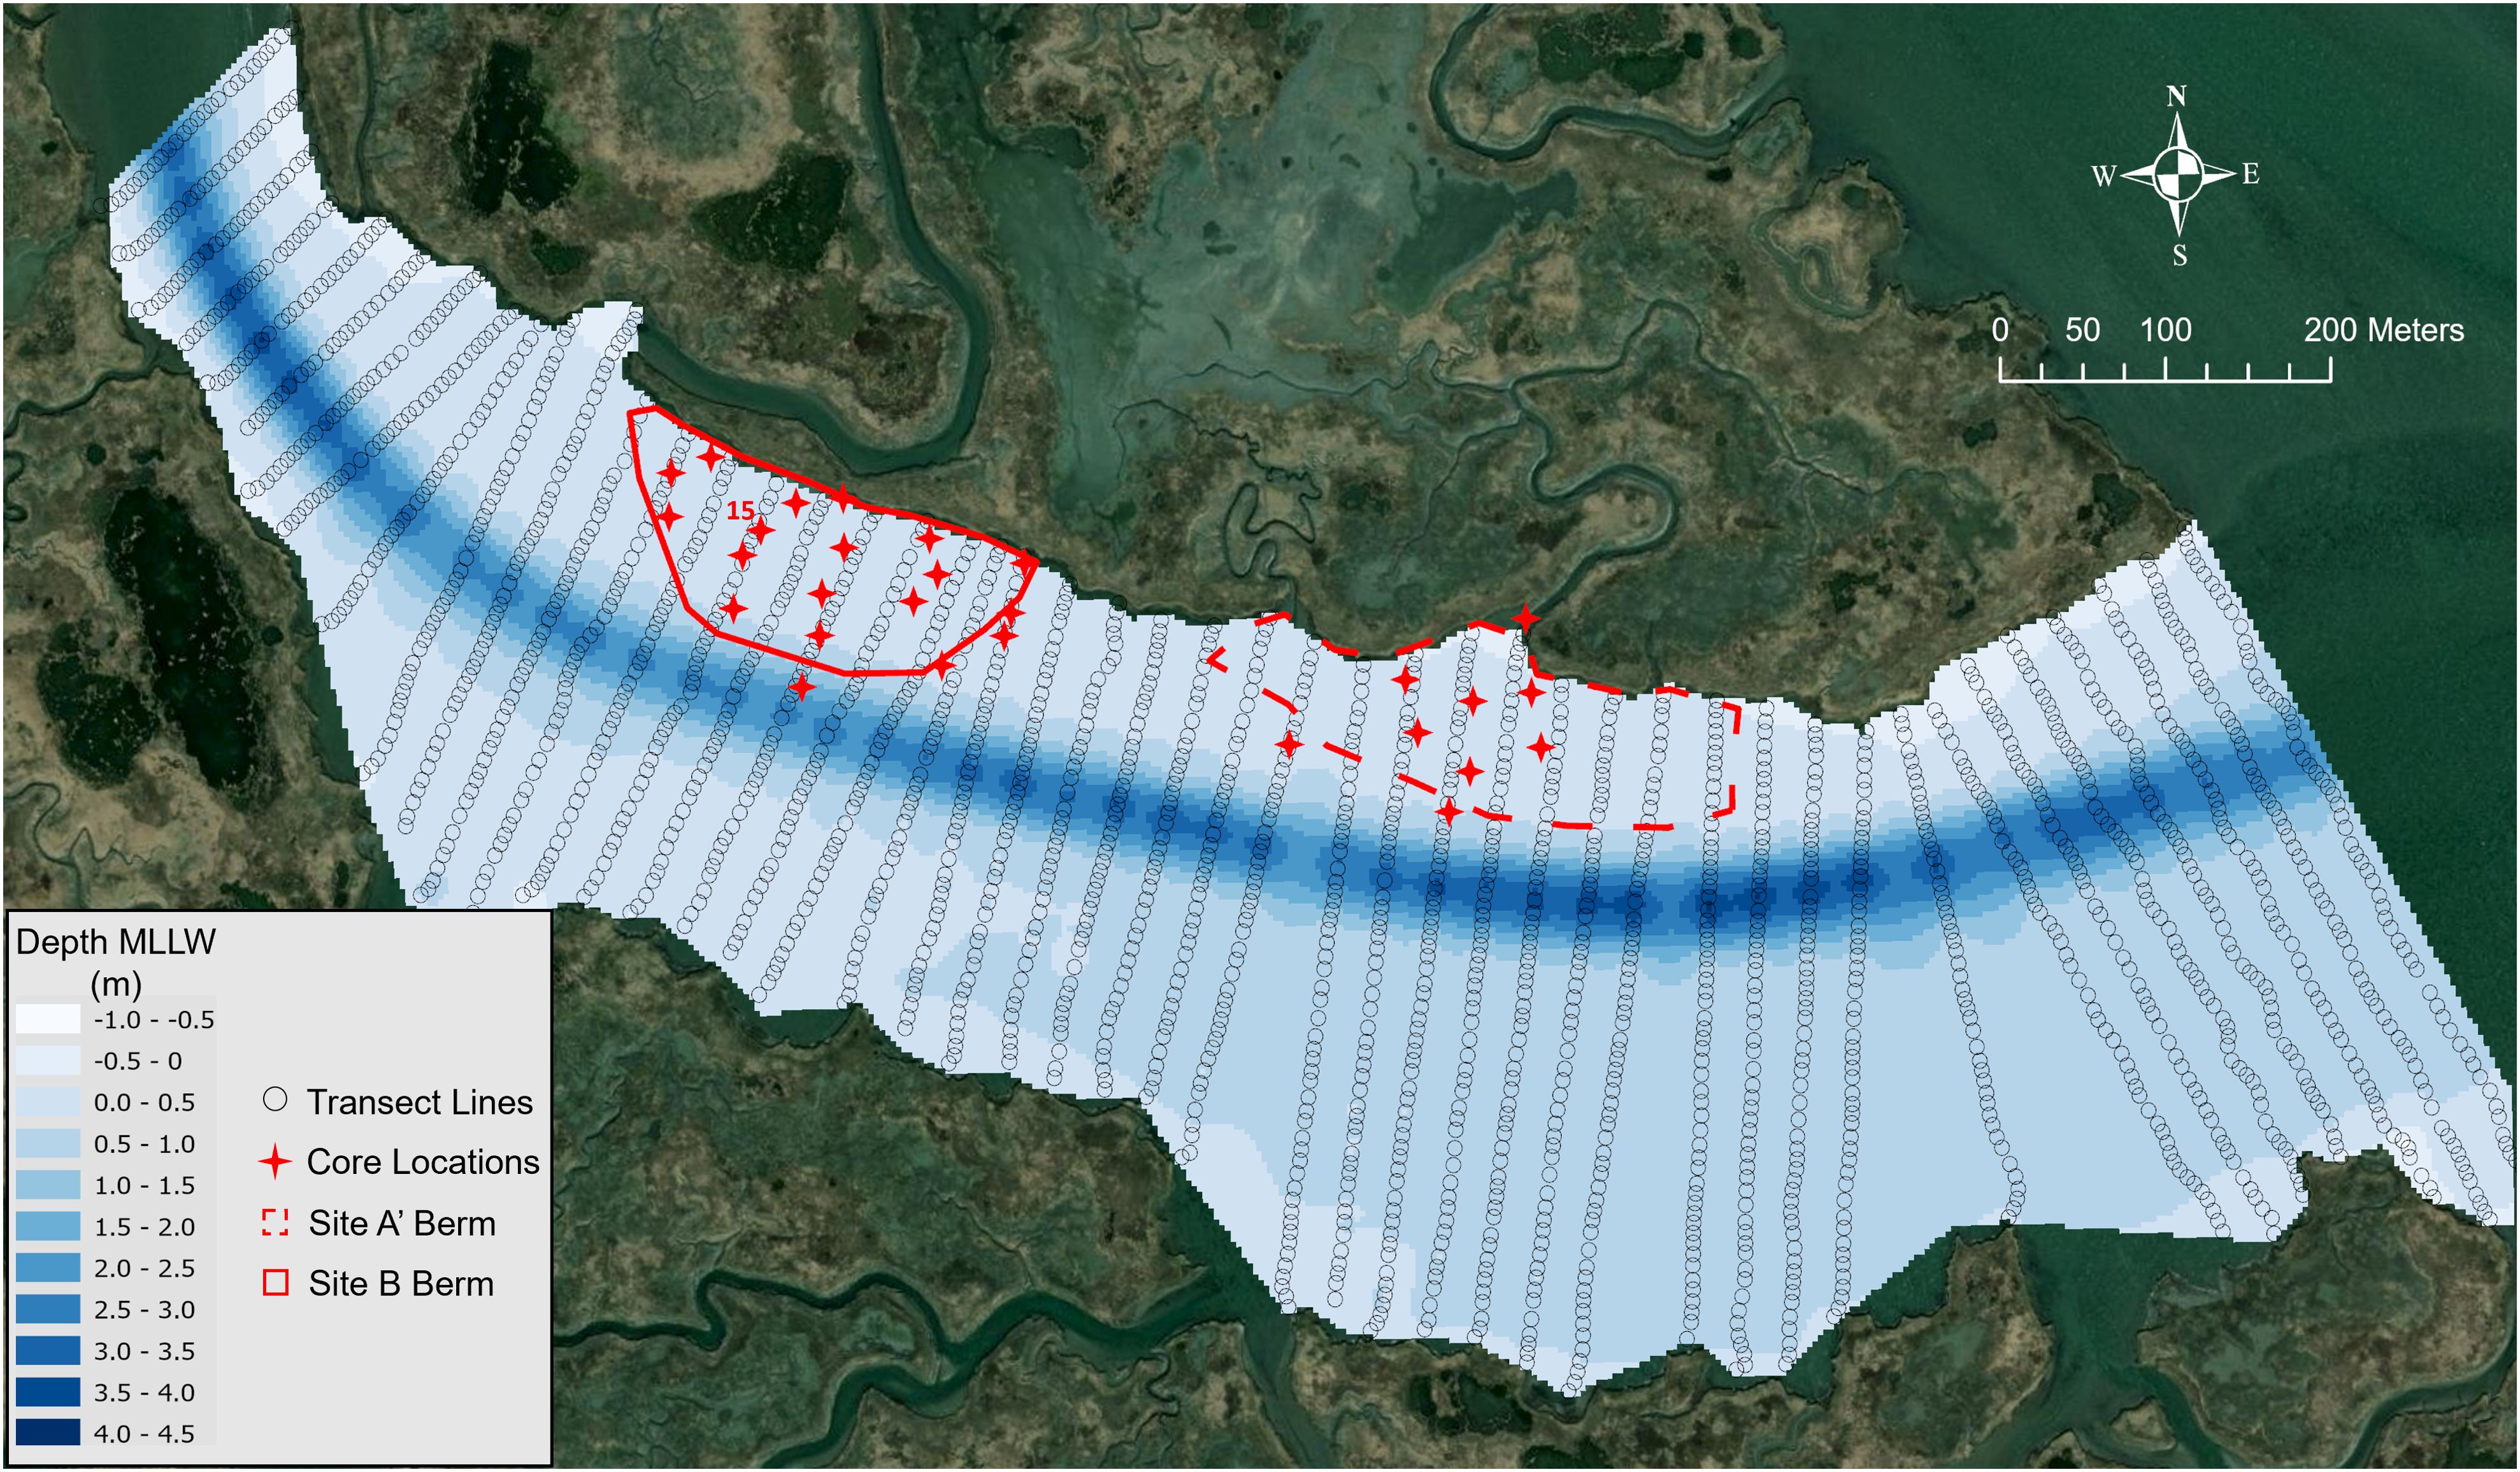
Figure 3. Pre-placement bathymetry map of southern Gull Island. Transect lines are marked with open black circles. Outlines of the berm locations at Site A’ and B are indicated with dashed and solid red lines, respectively. Locations of sediment cores collected in June of 2022 are indicated with red stars. Map imagery provided through Maxar.
Geospatial analysis of the single beam survey data was performed with ArcGIS Pro software using the Geoprocessing toolbox. Contour maps for each survey were created by importing point elevation data with drainage enforcement disabled. Analysis features within the Geoprocessing toolbox were used to identify change in bathymetry between pre- and post-placement surveys and identify the location, shape, area, and volume of the dredged material berms.
2.2 Sediment cores
To characterize the dredged sediments deposited along the southern edge of Gull Island following placement, a series of 5-cm diameter push cores were collected in June 2022 (Figure 3). The 6-month post-placement change in bathymetry map (Figure 4) was used to select core locations within and near the placement berms and locations were documented with a handheld Garmen GPS. Upon collection, cores were photographed, visually described, extruded, and sliced for grain size analysis. The upper 10 cm of each core was sliced at 1 cm intervals while sediment below a depth of 10 cm was extruded and sampled at 5 cm intervals. Core locations, descriptions and grain size characterization of the sediment are presented in Appendix A.
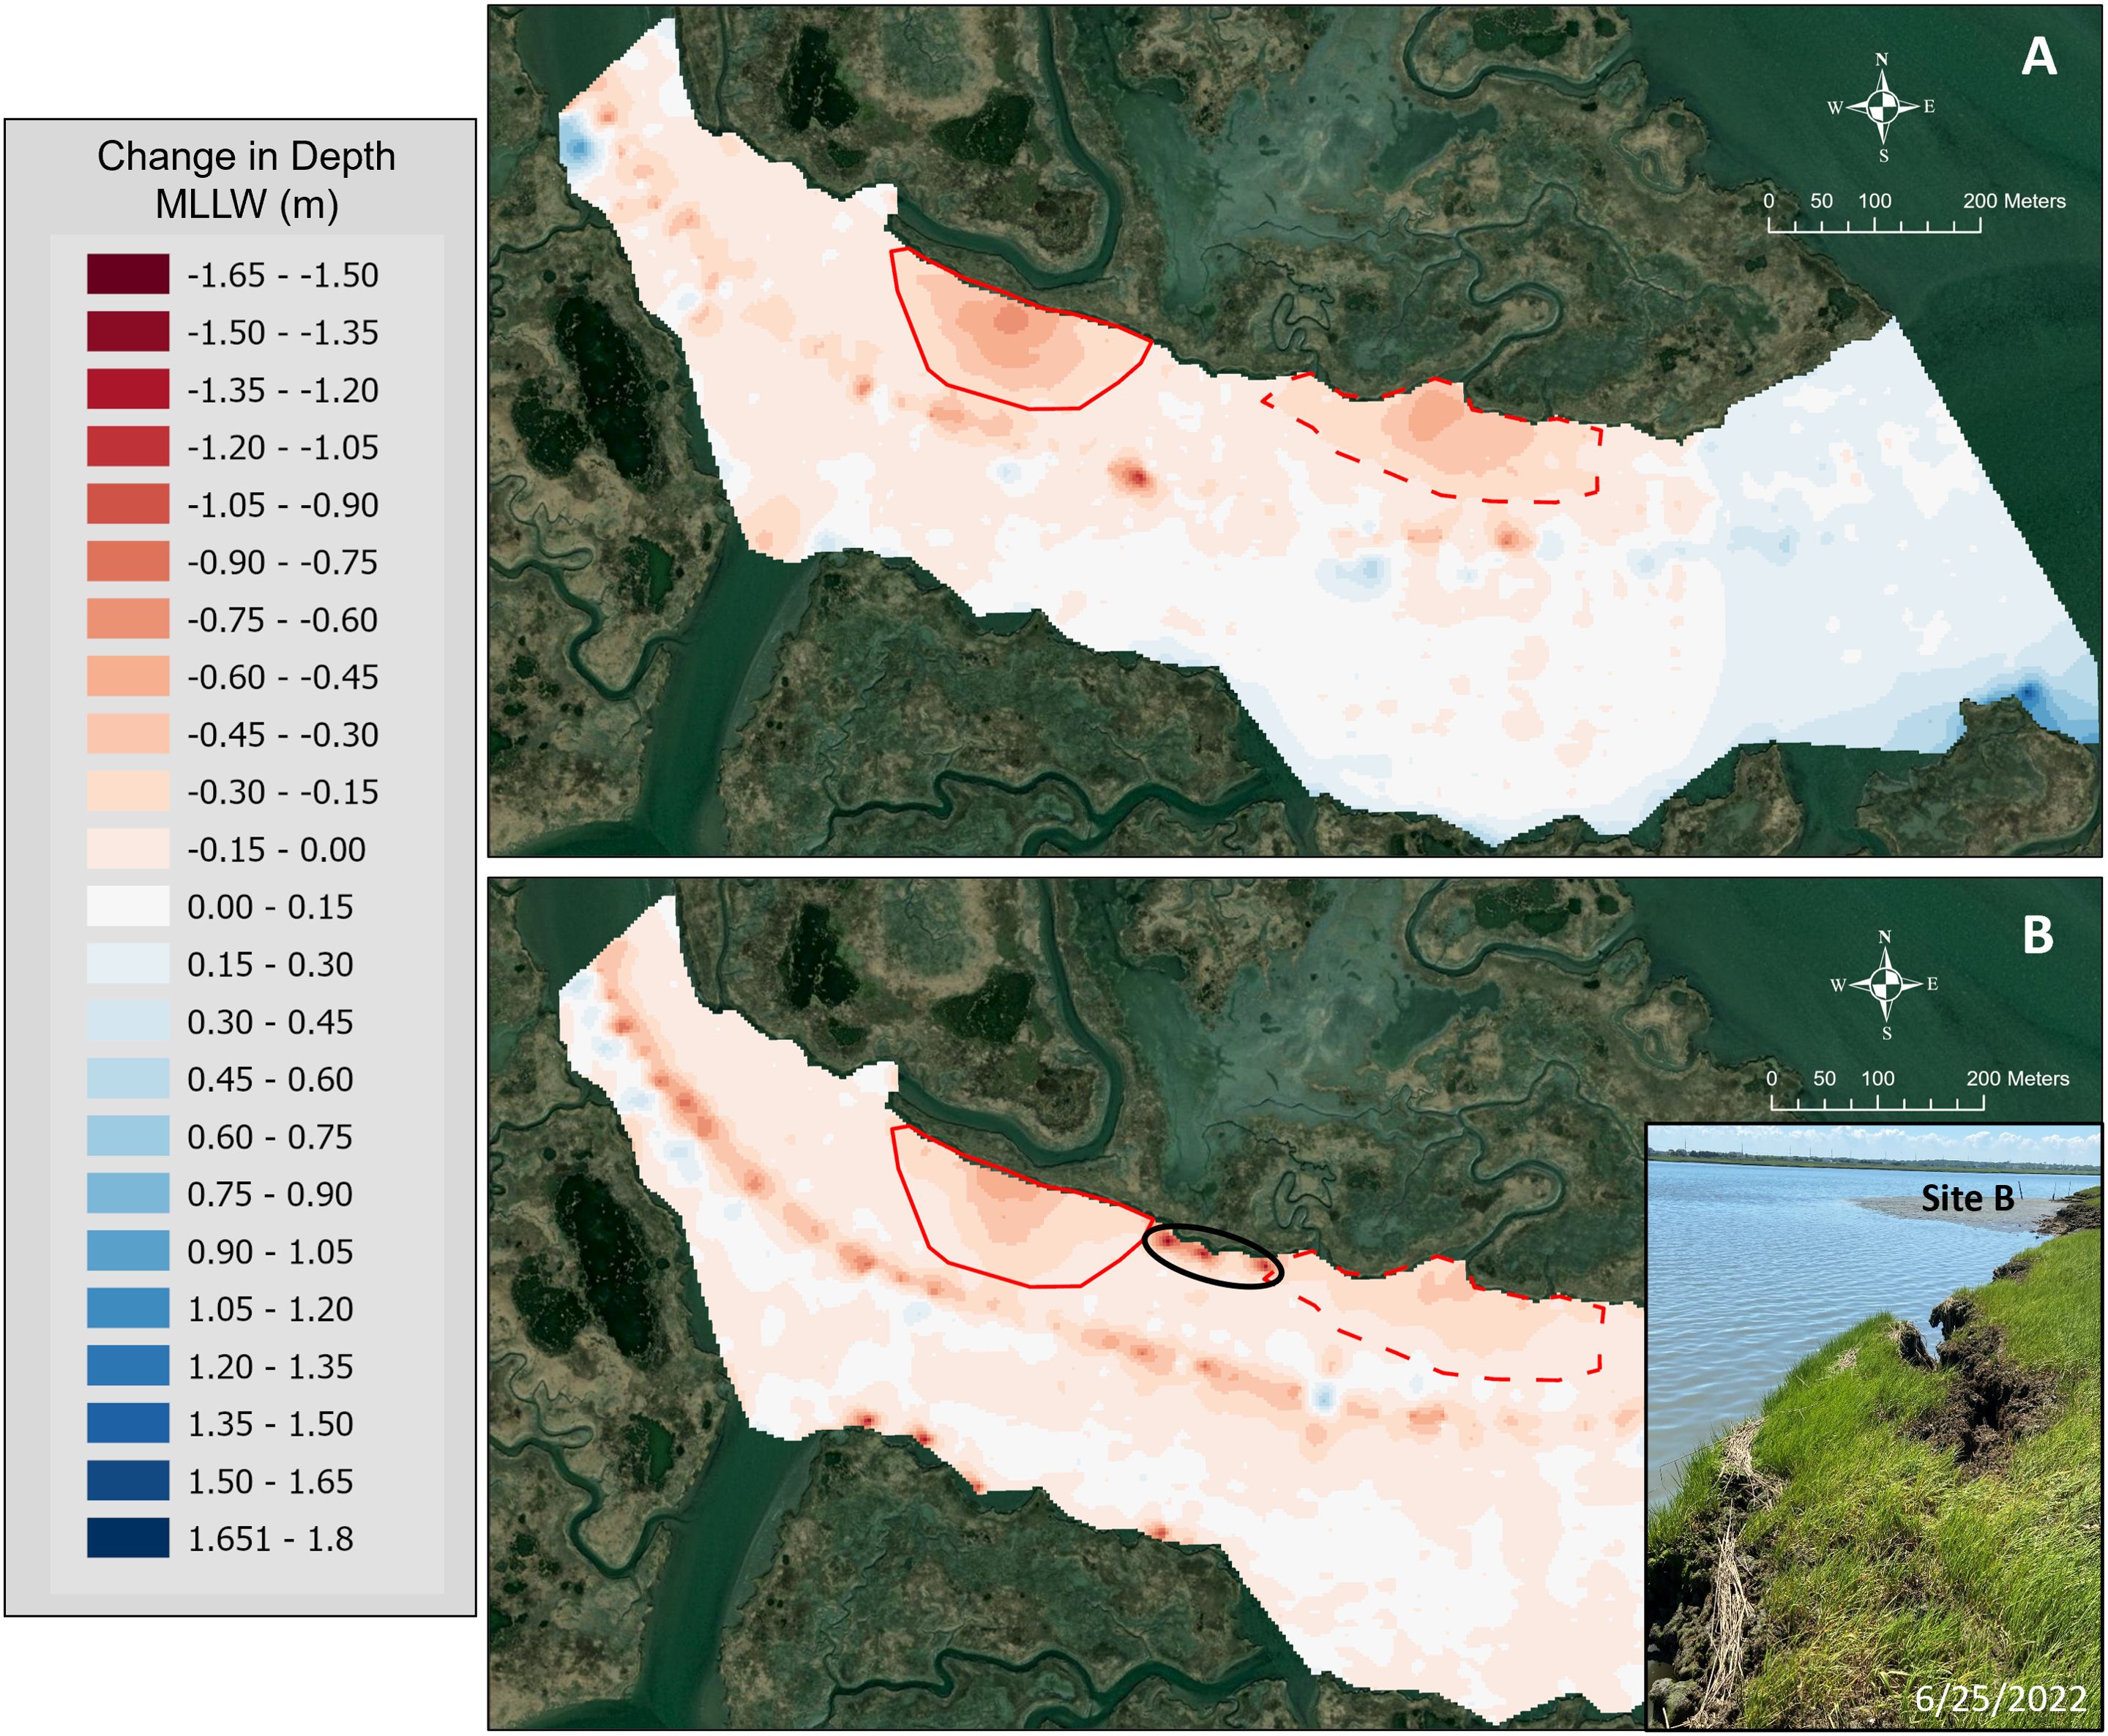
Figure 4. Maps showing the change in depth 6-months post placement (A) and 36-months post placement (B). Outlines of the berm locations at Site A’ and B are indicated with dashed and solid red lines, respectively. The black oval in (B) indicates where marsh edge slumping was observed as shown in the insert photograph taken in June of 2022. Map imagery provided through Maxar.
2.3 Grain size analysis
Disaggregated laser-diffraction grain-size distributions were obtained with a Malvern Mastersizer 3000 for a subset of depth intervals from the sediment cores. Sediments were homogenized and disaggregated overnight in a solution of sodium metaphosphate (40 g/L). Samples were transferred to the instrument’s reservoir and sonicated for 60 sec before analysis. Grain-size distributions produced from the instrument were used to determine the median grain size of disaggregated particles (D50). The Wentworth (1929) scale was used for the classification of the reported diameters as sand (> 63 µm) or FGS (<63 µm).
2.4 Turbidity measurements
To characterize turbidity plumes along the southern edge of Gull Island during dredge material placement, multiple roving surveys from two vessels were conducted from September 23, 2020, through September 29, 2020 using an In-Situ AquaTROLL 600 Multiparameter sonde and a YSI EXO2 Water Quality Sonde equipped with optical turbidity sensors sampling at a 1 Hz frequency. The sondes were pole mounted and deployed over the side of the vessels at a depth of 0.4 m–0.6 m. Turbidity surveys were limited to 3–4 hours before and after high water due to depth requirements of the vessel. Vessels operated at dead slow speed (approximately 1–2 knots) to prevent any prop-induced turbidity. A post-placement turbidity survey was conducted on November 4, 2020, with only the pole mounted YSI EXO2. Data from these roving surveys were screened to remove any values recorded when the instrument was positioned out of the water. The remaining data was used to make turbidity maps in the vicinity of the placement site.
In addition to the roving surveys, stationary observation points were established for monitoring turbidity at different periods in time throughout the study area. During and in the weeks immediately following dredged material placement, a pole mounted In-Situ was deployed approximately 0.3 m above the bed on the intertidal flat located 55 m off the marsh edge and 100 m west of the discharge pipe at site B (Figure 1D, red triangle). This location was selected because it was estimated to be close enough to placement area B to detect suspended dredged sediment without being buried by placed material. Because the instrument was deployed on an intertidal flat, turbidity data was screened to remove readings recorded when the sensor was not submerged. A 25-hour moving window average was calculated for the remaining dataset. Individual turbidity values that were more than 2 standard deviations from this mean were removed.
In June of 2021 an observation platform was constructed approximately 90 m off the southern edge of Gull Island (Figure 1D). An In-Situ AquaTROLL 600 Multiparameter sonde (In-Situ) equipped with an optical turbidity sensor was mounted 0.3 m above the bottom on this platform. To maintain the instrument through the deployment period, service trips were routinely made through February of 2023 to download data, replace batteries, clean the sensor, and perform other servicing as needed. As with the other stationary turbidity dataset, a 25-hour moving window mean was used to remove outliers that were more than 2 standard deviations from the moving mean.
2.5 Meteorological, tidal, wave and water current velocity data
Tidal stage data were obtained from the USGS Great Channel gauge station (#01411360) located in Stone Harbor, NJ, approximately 3 km southeast of the study area, indicated with the black asterisk in Figure 1B. The USGS gauge did not have a meteorological record covering the study period. Therefore, wind speed and direction records were obtained from NOAA gauge 8536110 located in Cape May, NJ, approximately 22 km southeast of Gull Island. Once downloaded, the data from both stations were matched and merged into a single database allowing for comparison against the field data.
To assess wave properties such as significant height (Hm0) and period (T) in the study area, the Gull Island instrument platform was equipped with RBR Virtuoso D wave 16 pressure sensors (RBRs) from December 2021 through February of 2023. The RBR Ruskin software was used to program the instruments to collect bursts of wave data every 20 minutes. Data for each burst was collected at 8 Hz for 4.25 minutes. The pressure signal associated with surface waves attenuates with depth, which can reduce the ability of the RBR pressure sensors to detect small (Hm0 < 0.5 m), short period (T = 1-2 s) waves anticipated in the study area. Tidal range at Gull Island is on the order of 2 m. To compensate for loss of wave data due to pressure attenuation, two RBRs were mounted directly above each other on a pole attached to the instrument platform. The “lower” sensor was positioned 0.8 m above the bottom, while the “upper” sensor was mounted 1.4 m above the bottom.
RBR Ruskin software calculates Hm0 and T using a time-based zero-Cross method (RBR, https://docs.rbr-global.com/support/ruskin/ruskin-features/waves/wave-processing). Initial processing found sporadic T between 5-10 seconds that corresponded to small (Hm0 <1 cm) waves. Though smaller waves may be present, we are not confident in our ability to quantitatively resolve them with the current instrument setup. Additionally, they likely aren’t contributing much to sediment transport and therefore, data was filtered to remove waves Hm0 < 1 cm and T > 5 s. Results from the “upper” and “lower” wave sensors reported similar Hm0 and T data. For general wave characterization a mean Hm0 and T was calculated from the two data sets. When plotting the mean wave period data, a 24-hour moving window average was also applied. Specific wave data from the “upper” and “lower” sensors are presented in Appendix B.
Water current velocities were measured near the instrument platform from June 2022 through February 2023 with an upward looking, bottom-mounted, Nortek 2 MHz Aquadopp acoustic doppler current profiler (ADCP). Nortek Storm software was used to program the ADCP to collect a velocity profile every 10 minutes. Each profile was collected for 1 minute and velocities were measured in 10 cm bins throughout the water column. Depth averaged velocity (ū) and direction reported by the instrument were used to characterize the currents near the southern end of Gull Island.
3 Results
3.1 Bathymetry
The bathymetric survey conducted prior to placement in August of 2020 showed a shallow flat with depths less than 1 m (MLLW) extended out approximately 50-100 m along the southern edge of the island to a shallow channel with depths ranging from 2-4 m (MLLW) (Figure 3). As a result of the dredged material placement that took place from September 2020 through October 2020, two depositional features were created along the southern edge of Gull Island (Figures 2C, D). The size and volume of these features were assessed with the 6-month post placement bathymetry. Changes in bathymetry that occurred between August 2020 and March 2021 are shown in Figure 4A, with decreases in depth shaded in red colors and increases in depth shaded in blue. The -0.15 m contour line (marked as solid/dashed red in Figures 3, 4) was used as a general guide for approximating the size and shape of the depositional features along the southern edge of Gull Island. The directly placed berm at site B covered 20,000 m2 and was up to 0.7 m thick near the discharge pipe. Volume calculations estimated the berm to contain 6,700 m3 of material. The berm at site A’ that resulted from outflow from the tidal creek covered just over 22,000 m2, was up to ~0.5 m thick, and had a total estimated volume of 6,100 m3.
Six months after placement, these two berm features account for approximately 40% of the 30,500 m3 of dredged material that was placed at Gull Island. Of particular note is the volume of the directly placed marsh edge berm at site B. More than 90% of the estimated volume placed at site B was accounted for in the berm 6 months after placement despite the lack of containment structures.
The bathymetric survey collected in September of 2023 was compared to the pre-placement survey to evaluate the 36-month stability of the berms (Figure 4B). Again, red shaded regions indicated a decrease in water depth compared to pre-placement conditions. The 36-month post-placement survey showed that the berms were still present along the southern edge of the island, but that both had reduced in thickness and volume when compared to the 6-month post-placement survey. At its thickest point near the discharge pipe, the directly placed berm at site B was ~0.5 m thick. Maximum berm thickness at site A’ had decreased to ~0.3 m. The volumes within the polygons used to mark the berm boundaries had decreased to ~4,500 m3 and 3,700 m3 at sites B and A’, respectively. This represents a 30% to 40% reduction in berm volume after 36 months.
While the berm morphologies were clearly altered in the 36-months, the Gull Island marsh edge located between the two berms showed a much greater shift in morphology. Three “hotspots” with >1 m of accretion can be seen within the 100 m stretch of shoreline between the berm boundaries, as indicated by the black oval in Figure 4B. A photograph taken at this location in June of 2022 (Figure 4B, insert) indicates that this change in water depth may be the result of slumping and marsh edge collapse along this portion of the island.
3.2 Sediment cores and grain size analysis
A total of 28 sediment cores were collected along the southern edge of Gull Island, however sediments from Core 22 were lost during the extrusion process. Visually distinct sediment layering was seen in nearly all the sediment cores and grain size analysis results produced consistent results across nearly all the cores. A detailing of the variability in layer thickness and sediment texture for each core is beyond the scope of this paper. Specific data from Core 15 is presented here as an example to illustrate the general trends observed in other cores. Core locations, descriptions and grain size characterization of the other sediment cores is presented in Appendix A.
In general, three layers were observed: 1) an oxidized surface layer within the upper 5 cm of the core, 2) a dark grey to black layer of sediment indicating the placed dredged material, and 3) a grey colored sediment at the bottom of the core representative of native sediment prior to placement. Grain size analysis showed that nearly all the sediment cores had a consistent muddy texture with no clear distinction in grain size between the layers within each core. Table 1 provides the grain size results from the individual sediment samples from the layers within Core 15. The FGS content in the surface, dredge material, and native sediment layers ranged from 66-69%, 50-76%, and 69-70%, respectively. Cores 18 and 20, located closest to the dredge material placement pipe at site B, were the only cores that demonstrated a distinct difference in sediment texture at the surface. Here surface sediments were > 50% sand, however, the dredge material layer below displayed a muddy texture like the other cores. Due to the consistency in sediment texture with depth, a mean % Sand, % Fines, and D50 was calculated for each core down to the interface with native sediment (Table 2). These mean values characterize the dredged material deposits within each core. Apart from Core 20 (44% Fines, D50 = 82 μm), all the sediment cores collected along the southern edge of Gull Island showed that the dredged material deposits had a muddy texture with mean fines content ranging from 59-73% and mean D50 values ranging from 29-56 μm.
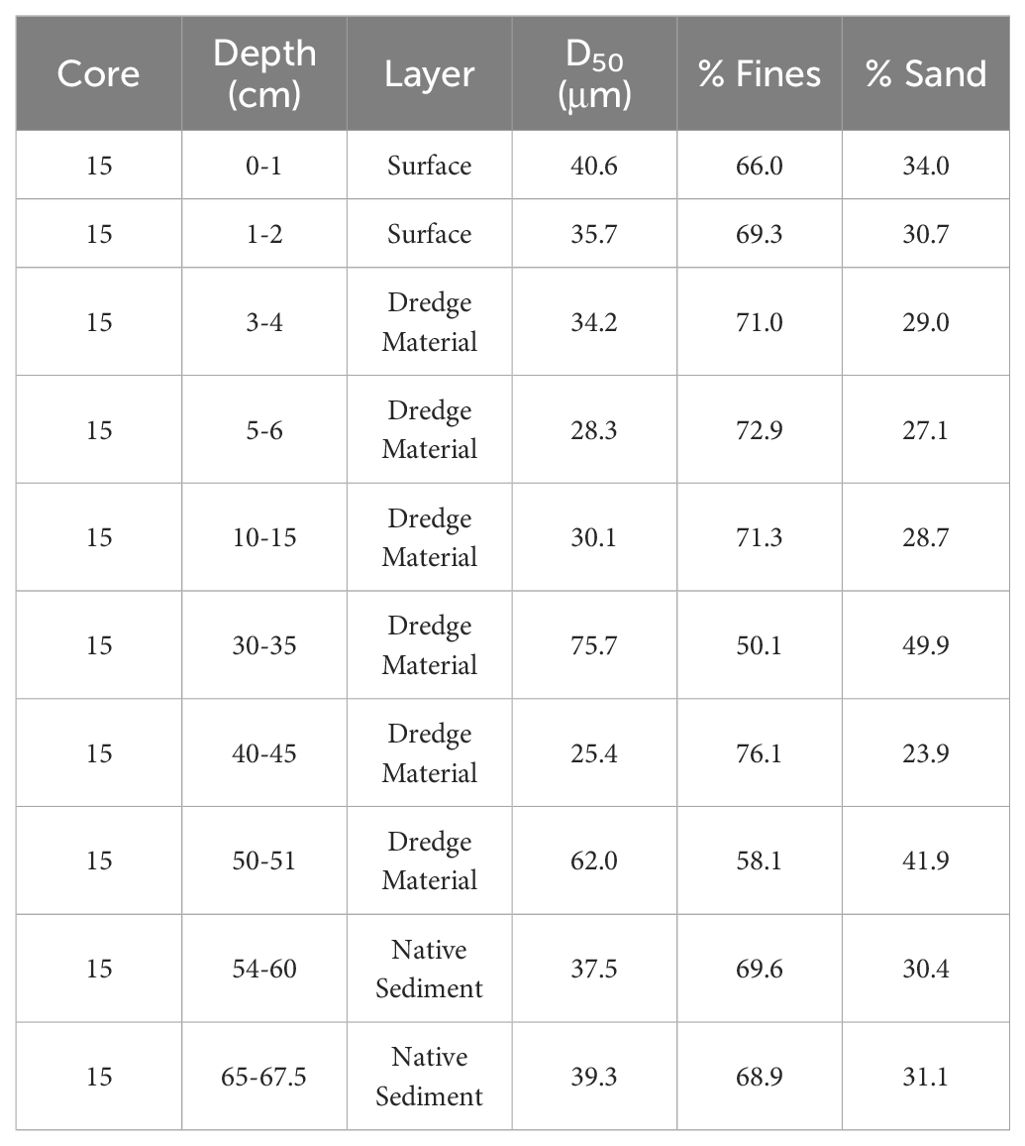
Table 1. Core 15 grain size data.

Table 2. Depth averaged grain size data.
3.3 Turbidity measurements
A summary of the roving and stationary turbidity data collected during and immediately following dredged material placement is presented in this manuscript. A more extensive reporting of these data is presented in Fall et al. (2022). The turbidity maps presented in Figures 5 and 6A are adapted from Fall et al. (2022).
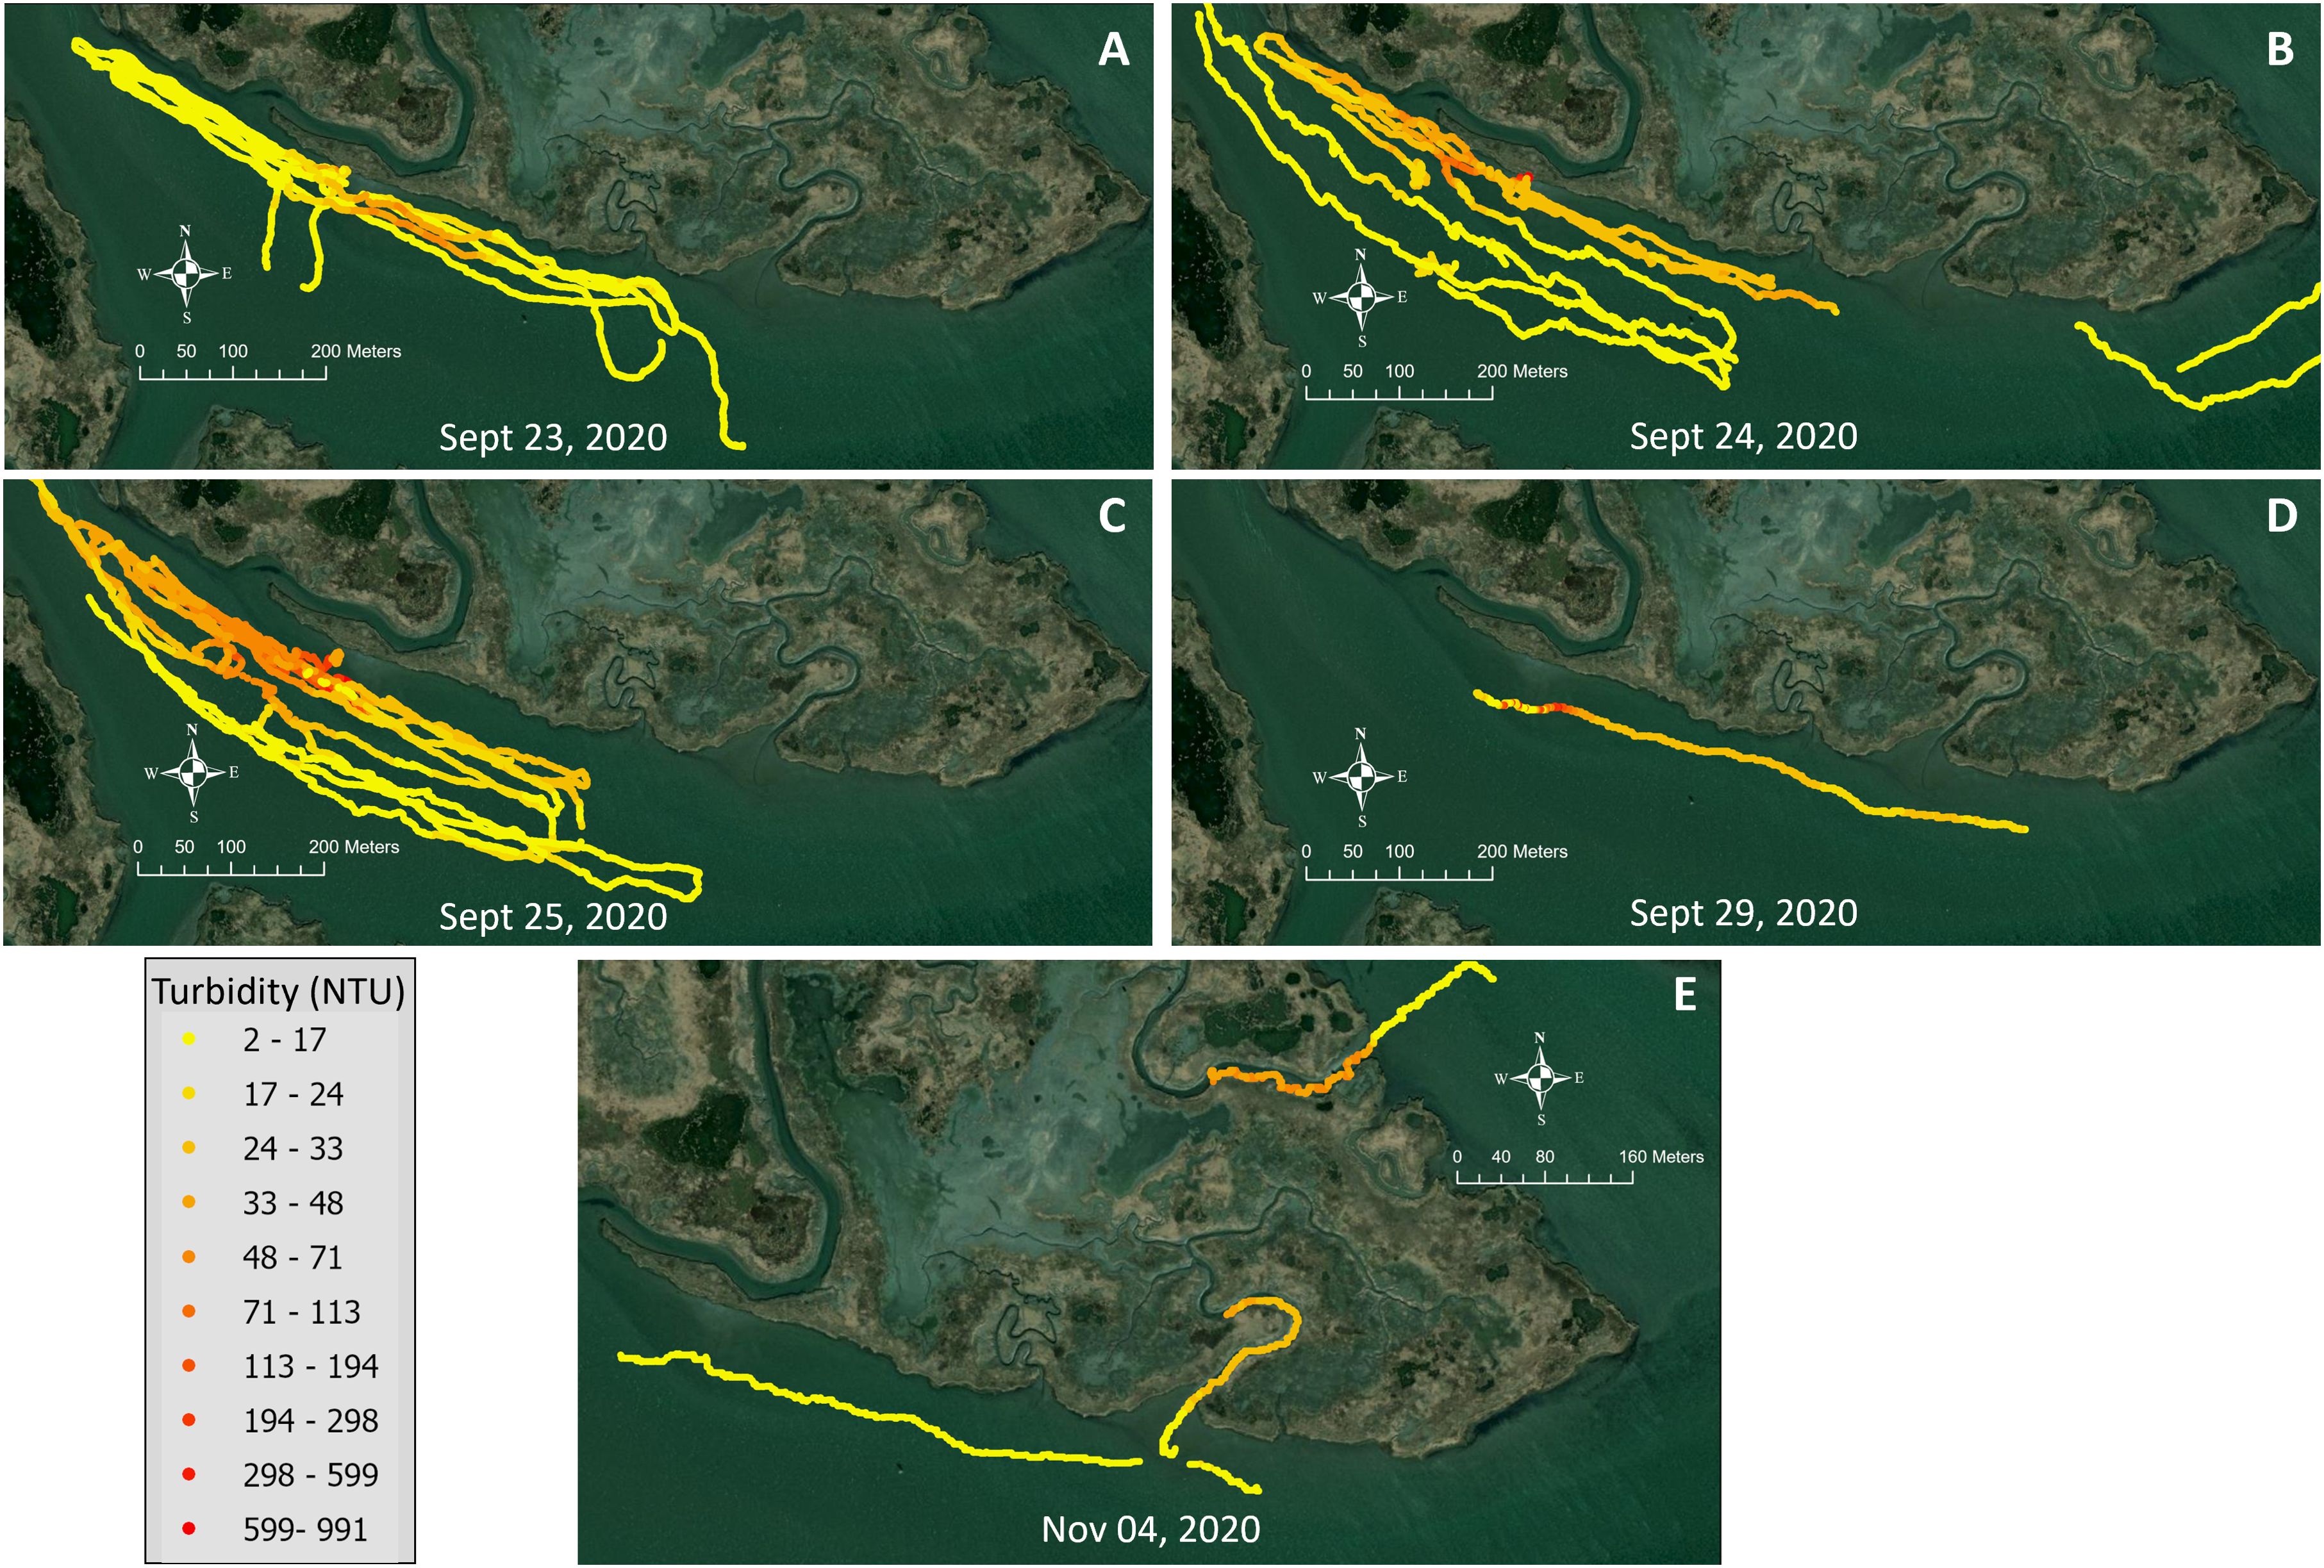
Figure 5. Roving turbidity data collected 0.5-0.6 meters below the surface during active placement on (A) 9/23/2020, (B) 9/24/2020, (C) 9/25/2020, and (D) 9/29/20. Post placement roving turbidity data collected 0.5-0.6 meters below the surface is shown in (E). Map imagery provided through Maxar.
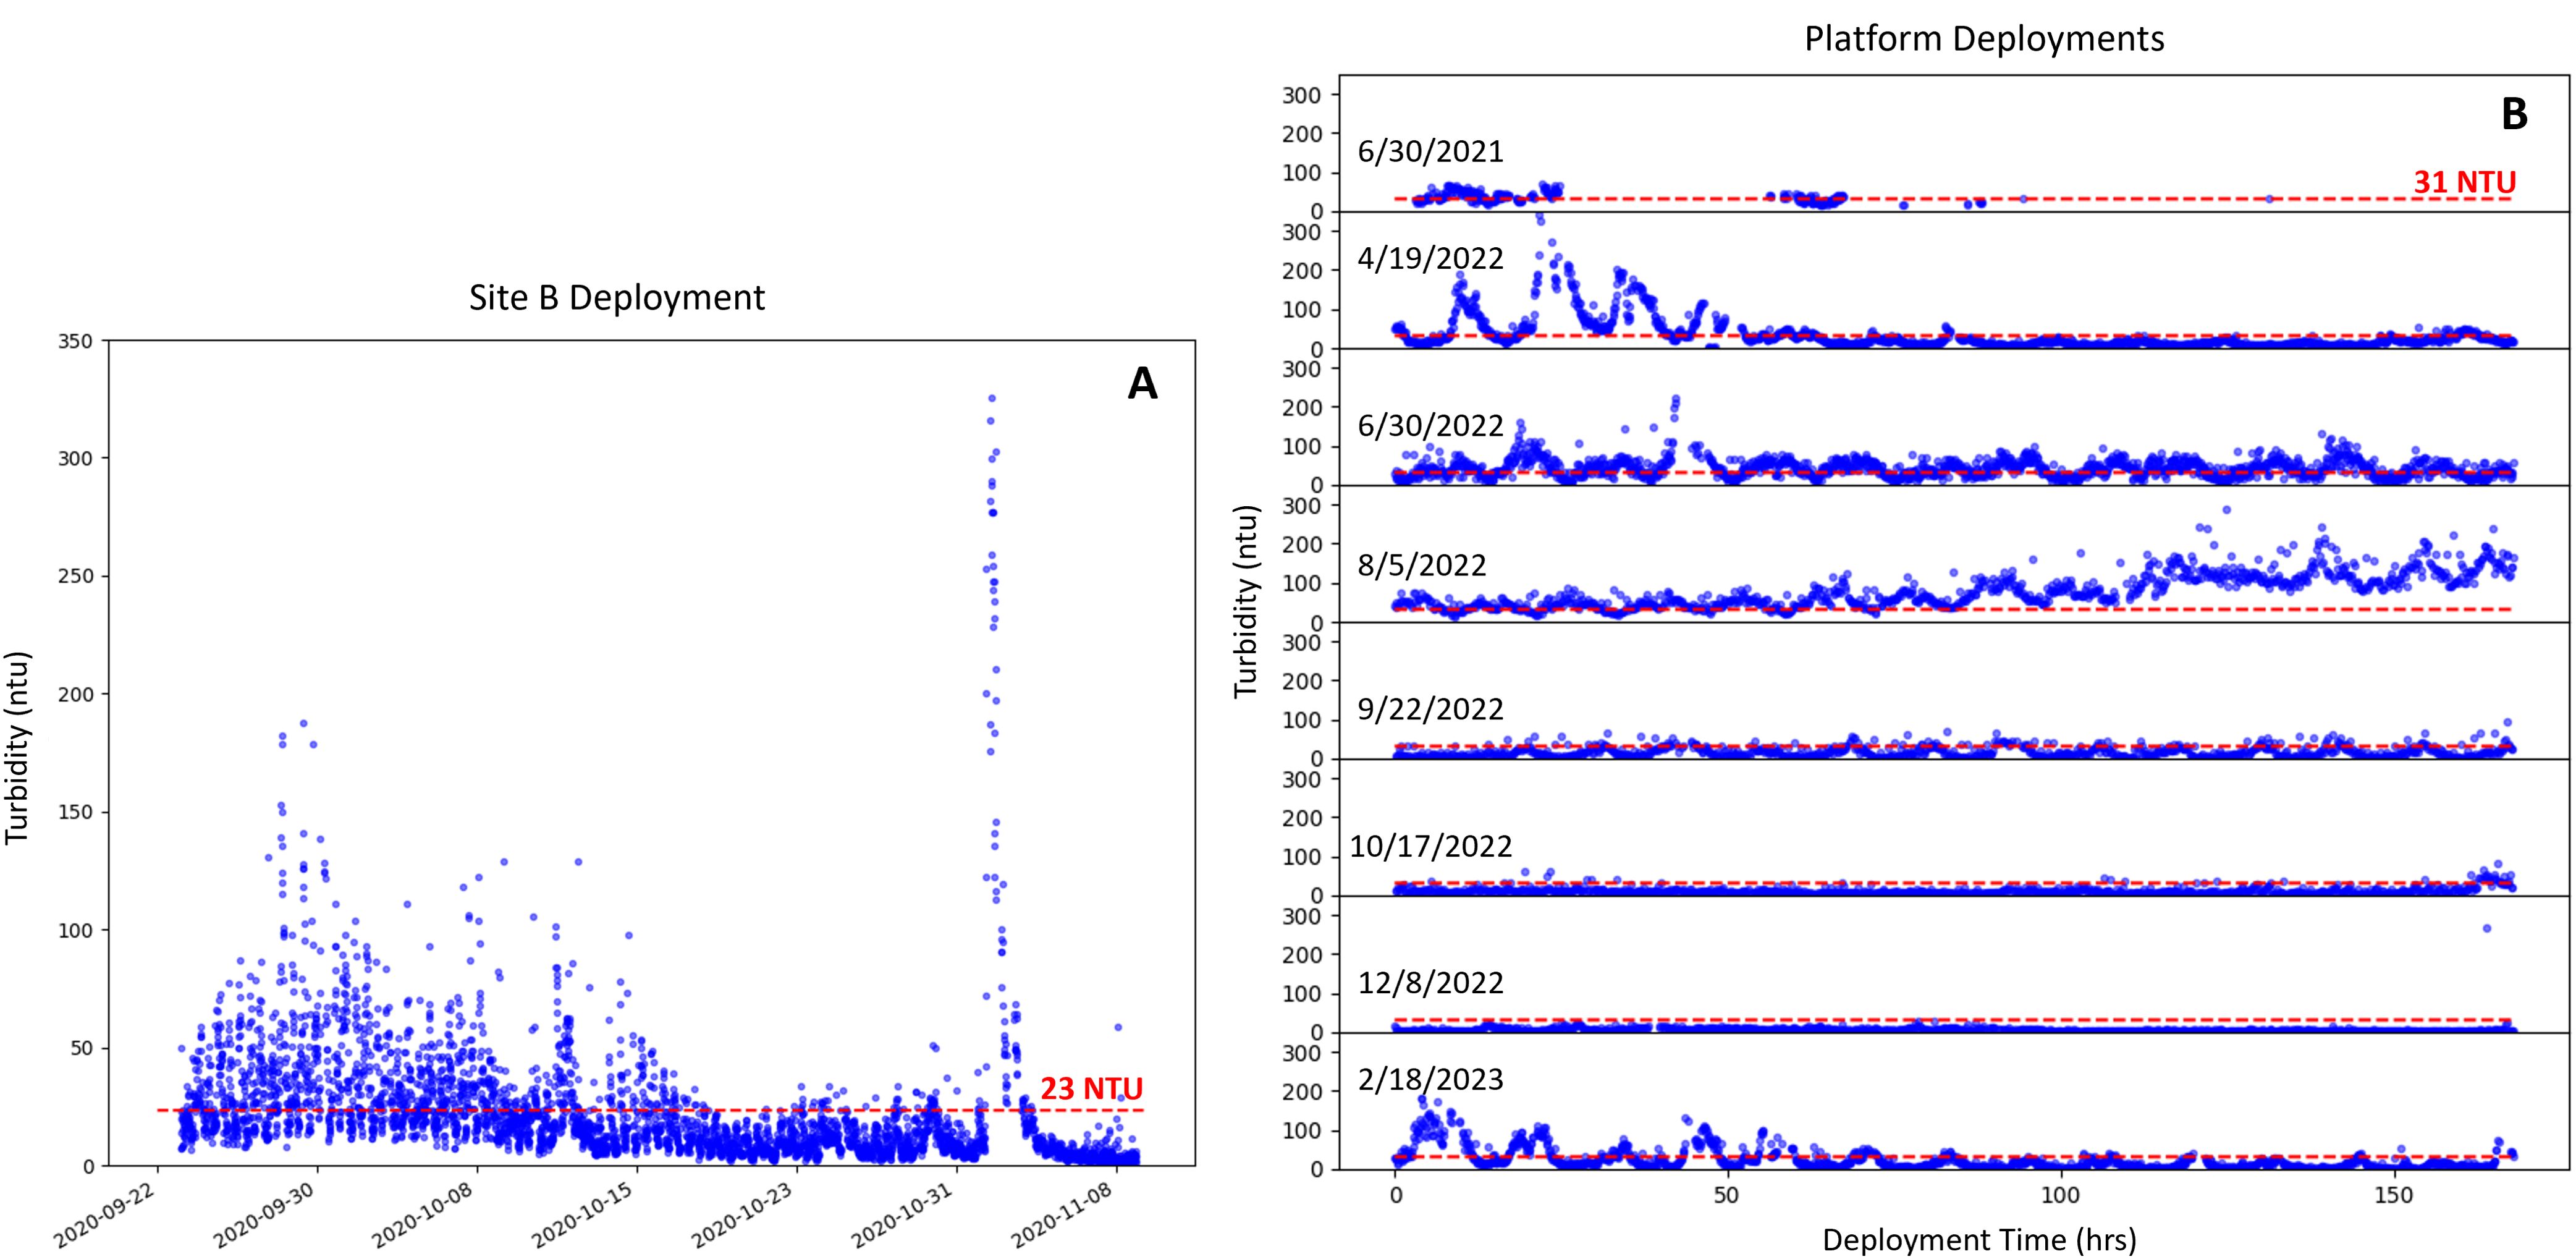
Figure 6. Turbidity measured about 0.3 m above the bed, approximately 100 meters west of placement pipe at site B (A). Stacked plots showing a time series of turbidity measured about 0.3 m above the bed at the platform south of Gull Island (B). Each time series in (B) is limited to the first week of deployment following an instrument cleaning and calibration. Red dashed lines in both (A, B) indicate the mean turbidity observed at each location.
Tidal conditions limited roving turbidity surveys during active placement to a period of 2-3 hours each day from September 23, 2020 through September 25, 2020 and for a brief 0.5 hour period on September 29, 2020. Turbidity maps during periods of active placement (Figures 5A–D) illustrated that the plume associated with the nearshore placement at site B was localized, extending less than 50 m from the marsh edge and 100-200 m along shore. Peak turbidity values of ~1000 NTUs were typically identified within 40 m of the placement pipe. Turbidity levels reduced to 50-100 NTUs at distances greater than 40 m from the discharge pipe and were consistently found to range between 10-20 NTUs when distance from the placement pipe exceeded 100-200 m. Previous turbidity monitoring conducted at similar tidal flat environments within the SMIIL have documented background turbidity levels on the order of 10-20 NTUs with periodic wind-wave events that produce turbidity levels on the order of 100-300 NTUs (Fall et al., 2021). This suggests that dredged material related turbidity levels only exceed natural conditions in areas within 40 m of the placement pipe.
A 3-hour roving turbidity survey was conducted on November 4, 2020, the week following completion of placement at Gull Island. A single line survey was run along the southern edge of Gull Island between placement site B and A’. Turbidity data was also collected into the upstream most navigable reaches of the tidal creeks near site A (Figure 5E). No turbidity signal above typical background conditions reported in Fall et al. (2021) was observed along the southern edge of Gull Island. Higher turbidity levels, ranging between 30-80 NTUs, were observed in the two tidal channels, however no pre-placement turbidity data was collected in these creeks to establish a baseline for comparison.
Stationary monitoring of turbidity 0.3 m above the bed and 100 m west of the placement pipe at site B showed variable turbidity levels (Figure 6A). The processed and screened turbidity data had a mean value of 23 NTUs across the entire period of collection. This mean, indicated with the red dashed line in Figure 6A, is equivalent to previously reported background levels for SMIIL (Fall et al., 2021, 2022). However, scatter in the data indicated that changes in turbidity conditions could be seen between periods of active placement and post placement. During periods of active dredging at site B (September 23, 2020 through October 7, 2020) turbidity values consistently ranged from ~10-180 NTUs. However, after placement activity at site B ceased on October 8, 2020, turbidity values rarely exceed 50 NTUs and were normally below 23 NTUs. While a few instances of elevated turbidity ranging from 100-325 NTUs were observed after placement, these instances were found to be associated with periods of stronger sustained winds and waves (Fall et al., 2022). Thus, while this area was impacted by elevated turbidity during dredge material placement, turbidity levels did not exceed those associated with wind driven events in the system. Further, turbidity levels immediately returned to background conditions after placement operations at site B ended.
Examination of the In-Situ data collected at the instrument platform off the southern edge of Gull Island revealed that a near continuous reporting of turbidity from June 2021 through February of 2023 would not be possible. Issues resulting from biofouling of the optical sensors were apparent, causing both upward drift in the turbidity signal and noisy data. The development of processing routines to remove the effects of biofouling from the turbidity data were not feasible due to the inconsistency of impacts observed to both NTU values and data drift with time. In general, turbidity data collected in the first week following an instrument service trip showed limited sign of biofouling (Figure 6B). Fall et al. (2021) reported similar observations with biofouling impacting turbidity sensors deployed within SMIIL. They also found that signals returned to anticipated levels immediately following instrument cleaning. Therefore, turbidity data presented here is limited to a period within 1 week of instrument servicing and cleaning.
A stacked series of eight turbidity plots showing data from the first week following a cleaning and servicing event is provided in Figure 6B. Though the instrument was programmed to record turbidity every 6 minutes, large amounts of data were found to be missing immediately following the June 2021 deployment. The mean turbidity for the entire data set was found to be 31 NTUs, as shown by the red dashed lines in the plots of Figure 6B. This value is similar to, but slightly greater than background values reported in Fall et al. (2021, 2022). Despite limiting data to the first week following cleaning, impacts of biofouling can be seen in the August 2022 data, where turbidity values steadily drifted upward to values >100 NTUs within the first 100 hours of deployment. Removing the August deployment from consideration resulted in a mean of 24 NTUs. The biofouling in the first 100 hours during the August deployment is likely artificially raising mean turbidity above previously reported background conditions. Additionally, numerous short periods of elevated turbidity on the order of 100-300 NTUs were observed in April 2022, June 2022, and February 2023. Past monitoring (Fall et al., 2021 and 2022) suggests elevated turbidity events may be associated with wind wave events. A weak, but statistically significant (p < 0.001, R2 = 0.21) correlation was found between the platform turbidity data and wind speed. Suggesting that while some instances of elevated turbidity in Figure 6B may be due to wind waves, other factors can contribute to these events. In general, data collected at the instrument platform in the months and years following dredged material placement at Gull Island did not indicate turbidity conditions that were substantially different from pre-placement levels near southern Gull Island or at other similar areas within SMIIL.
3.4 Meteorological, tidal, wave and water current velocity data
Platform data showed that waves near the southern edge of Gull Island were generally small with significant heights that rarely exceeded 0.2 m and periods that were typically between 1-2 s (Figure 7A). As is common in shallow estuaries, there was as strong correlation between windspeed and significant wave height (p < 0.001, R2 = 0.56). Thus, most of the wave action in the vicinity of Gull Island can predominantly be attributed to wind driven waves. This strong correlation allows us to use wind speed as a proxy for wave height, enabling turbidity and wind speed comparisons (as discussed in section 3.3) when wave height data was absent. While recreational watercraft likely did contribute to the overall wave climate, the collected data did not allow for attempts to separate out their contribution.
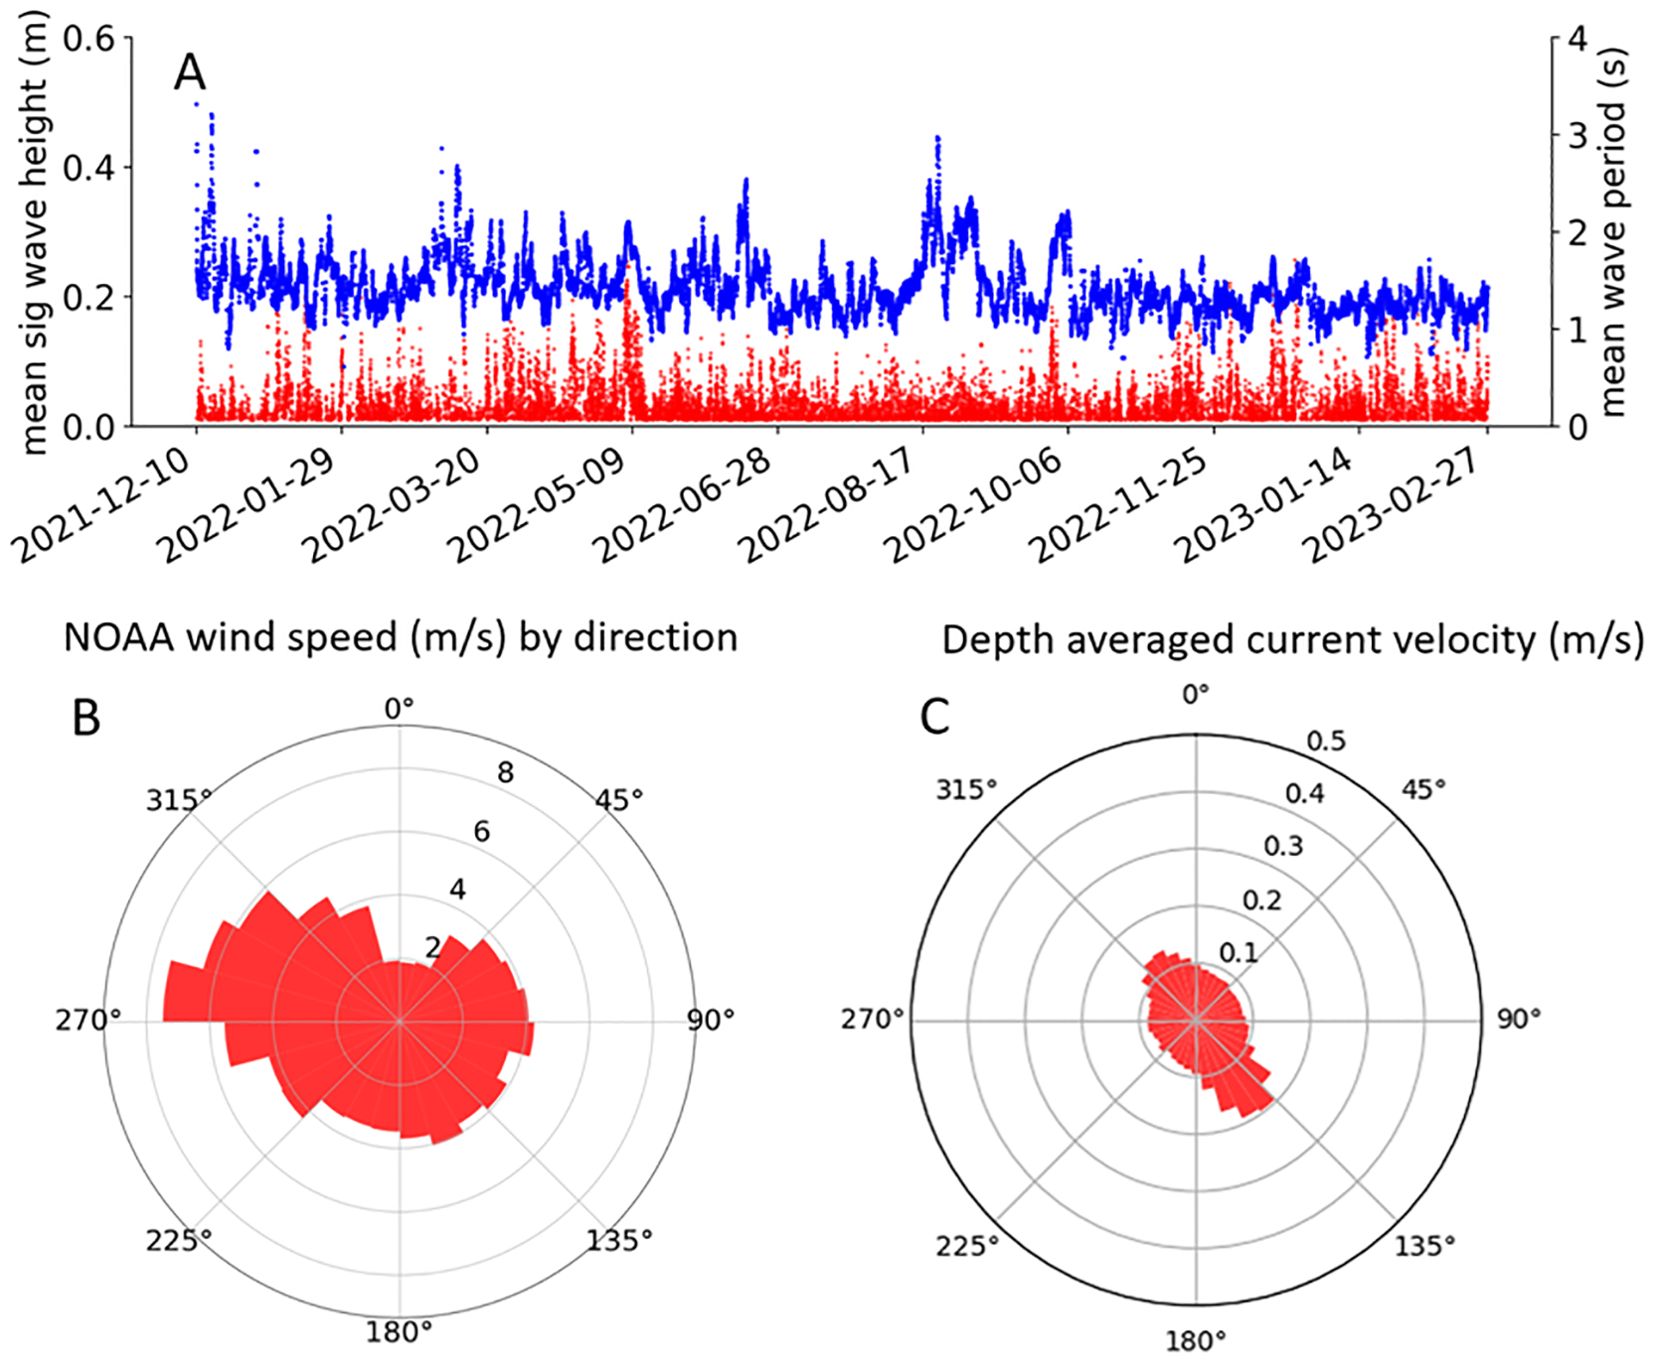
Figure 7. Time series plots of wave data collected at the observation platform off southern Gull Island. The mean of the upper and lower RBR significant wave height (m) plotted in red with values corresponding to the left-side y-axis and significant wave period (s) was plotted in blue with values corresponding to the right-side y-axis (A). Compass plot of NOAA wind speed (m/s) plotted by direction (B). Compass plot of mean depth average current velocity (m/s) (C).
The strongest mean wind speeds were consistently from the west, with speeds exceeding 6 m/s (Figure 7B), however prevailing winds were from the northwest. Over 13% of recorded winds originated between 300 to 315 degrees sampled from 8/18/2022 to 6/20/2023. With winds from the southwest being the least common.
A compass plot of mean depth average current velocities (Figure 7C) showed that currents had a southeast/northwest bi-directional signal, indicating that currents were largely tidally driven. Ebb tidal currents flowing to the southeast were found to be stronger than flood currents moving to the north west. While ebb currents were noticeably stronger than flood currents, depth averaged velocities were not observed to exceed 0.2 m/s in any direction.
In general, the hydrodynamic data collected at the Gull Island instrument platform to characterize wave height, wave period, and current velocity showed similar results to those reported by Fall et al. (2021) for nearby areas within SMIIL.
4 Discussion
A variety of factors associated with both the environmental setting and the physical properties of the dredged material contributed to the stability of the muddy berms on the southern edge of Gull Island. Whether they were sourced from transport in the tidal creek from the unconfined marsh placement to the mouth of the tidal creek at site A’ or directly from the placement pipe at site B, the dredged sediments produced berm-like features that deposited less than 200 m from where they were discharged into open water. Bathymetric surveys showed the southern shore of Gull Island to be a broad intertidal flat with less than a 1% (~0.6°) slope dipping south from the island’s edge. Research evaluating gradients associated with gravity flows of fluid mud have found that a critical slope of approximately 1.75% (1°) is required to maintain fluidized flow (Wright et al., 2001; McAnally et al., 2007). At more gentile gradients external agitation of the mud slurry by waves and currents is required to maintain suspension and flow. Dredge slurries composed of FGS can behave similarly to fluid mud as they are commonly composed of 15-20% sediment by volume, with corresponding densities on the order of 1.2-1.3 kg/m3 (Turner, 1996). Therefore, slurry placement that occurred directly onto the mud flat in sub-aerial conditions at low tide would not have been exposed to any waves and currents to help increase gravity flow and spread. Further, the low energy wave conditions and current velocities measured at the platform south of Gull Island (Hm0 < 0.2 m, Tp < 2 s, ū < 0.2 m/s) suggest that even during periods of sub-aqueous placement, there may not have been ample energy to maintain the dredge slurry in suspension to allow for continued gravity flow on the gentle slope. This would result in the limited spread of placed dredge material and aided in the formation of the berms along the southern edge of the Island.
The physical properties of the dredged material placed at Gull Island also impacted their dispersion and transport process. Recent research has demonstrated that dredging activities involving cohesive sediments tend to produce flocs and aggregated bed clasts composed of FGS (e.g. Fettweis et al., 2009; Smith and Friedrichs, 2011; Carey et al., 2013). Smith and Friedrichs (2011) found that more than 90% of the particles within hopper suction dredge plumes were either bed aggregates or flocs. Further, studies have also been conducted that highlight how the aggregation state of particles can impact both the likely transport distance and pathways of FGS (Perkey and Smith, 2019; Perkey et al., 2020, 2024). Specifically, due to their increased size and settling velocity, flocs and macro-bed-aggregates (>250 μm) do not remain in suspension as long as their constituent particles and therefore help reduce the far field spread of dredge plumes. The shallow water (<1 m MLLW) and low velocity currents (< 0.2 m/s) off southern Gull Island combined with the likelihood that many of the suspended particles in the dredge plume were in an aggregated state would lead to rapid deposition of suspended particles. Turbidity measurements made during and immediately after dredge material placement at the study site showed a limited spread of a suspended plume and supports that suspended dredged particles quickly settled out of the water column.
With limited gravity flow and suspended transport, deposition and consolidation of the dredged FGS occurred in close proximity to sites A’ and B. Due in part to the cohesive nature of the dredged sediment, remobilization of these sediments after deposition and consolidation was unlikely given the low energy hydrodynamic conditions measured off southern Gull Island. Recent flume erosion tests conducted on FGS obtained from the dredged NJIWW channel within SMIIL showed that the test sediments displayed cohesive behavior and that, following 30 days of self-weight consolidation, shear stress on the order of 0.4 Pa was required to initiate erosion of the sediment bed (Perkey et al., 2024). By applying common logarithmic boundary layer assumptions (law of the wall) for calculating shear velocity (u*) (Garcia, 2008), estimations of the bottom shear stress (τb) associated with tidal currents on the shallow flats near Gull Island were made. The values of the parameters used in calculating τb are provided in Table 3, where ρw is the water density, u(z) is the flow velocity at z height above the bed, k is the von Karman’s constant (0.41), and z0 is the hydraulic roughness associated with to skin friction, set equal to D50/12 (Soulsby, 1997). Estimations showed the current induced τb would be approximately 0.05 Pa, well below the 0.4 Pa that was required to produce erosion from Perkey et al. (2024). Further, these estimations suggested that current velocities would need to exceed 0.6 m/s to generate τb>0.4 Pa. Measured depth average current velocities off Gull Island did not exceed 0.2 m/s, and while it is possible that storm induced currents may periodically reach and exceed 0.6 m/s in the area, our observations suggest that these types of currents do not occur under typical tidal conditions. Thus, sustained erosion of the FGS berms was unlikely under the hydrodynamic conditions at Gull Island observed in this study.
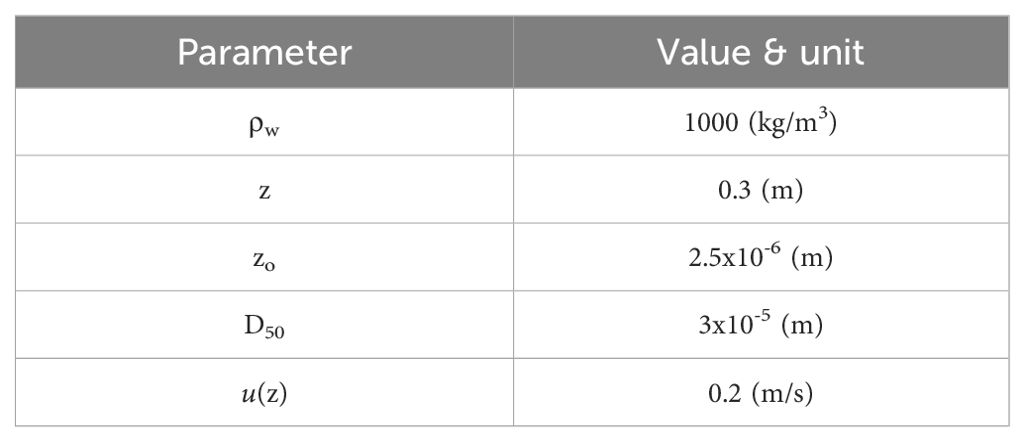
Table 3. Parameters used for bed stress calculations.
Macro-aggregated bed clasts were observed along the berm at placement site B approximately 1-month post placement (Figure 8). As shown in Figure 8, the edges of the newly deposited berms clearly experienced failure that resulted in the production of macro-aggregates on the order of several centimeters in diameter. The flume testing performed by Perkey et al. (2024) indicated these clasts were capable of withstanding disaggregation in shear stresses > 4 Pa. Thus, while berm edge failure was observed in the field, these clasts were unlikely to break apart due to shear stress. Instead, further break down of these aggregates would more likely result from abrasion during bedload transport (Perkey, 2022). However, considering the size of the aggregated clasts observed in Figure 8 and the calculated low shear stress (0.05 Pa) generated from the currents observed in this study, these clasts were not likely to be transported significant distances from the berm site outside of storm conditions and therefore contributed to the stability and limited dispersion of the FGS that was placed at the project site.
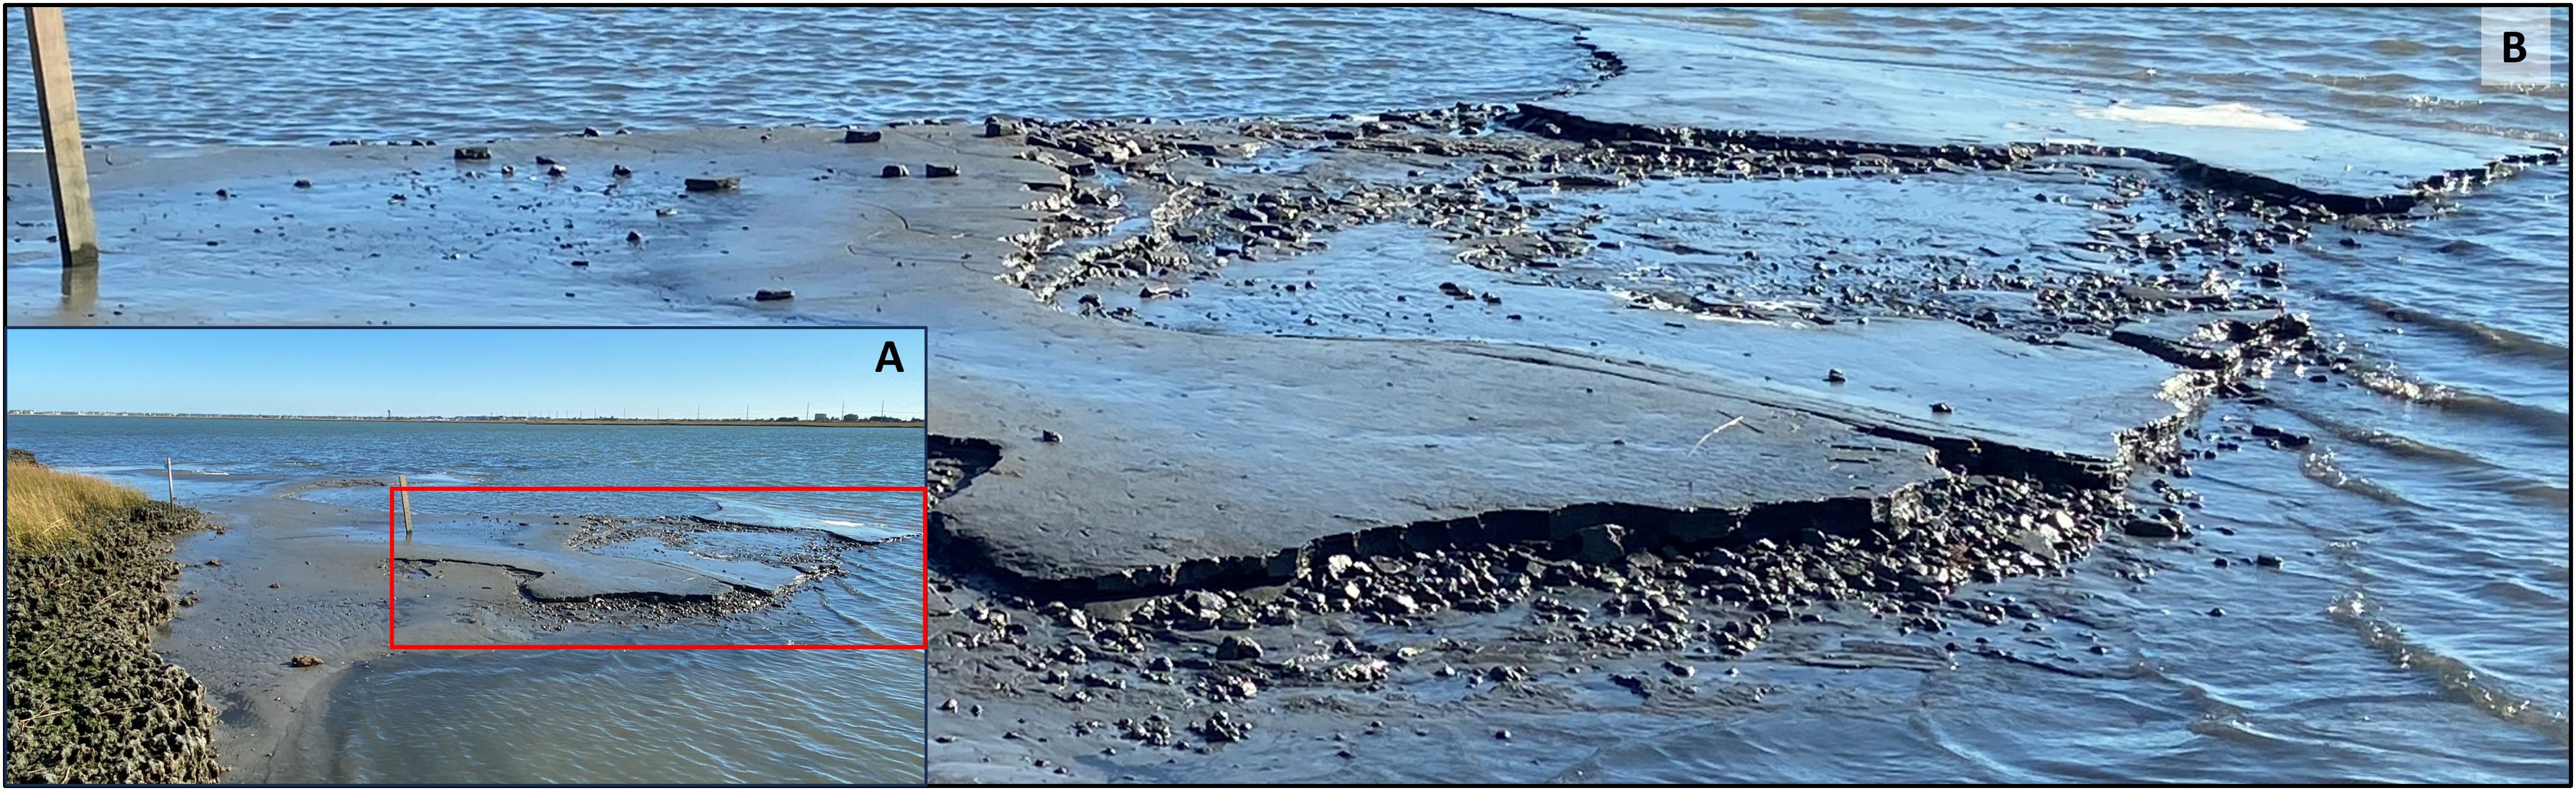
Figure 8. Photograph of the berm at site B 1-month post placement (A). Close up of the red box in (A) is provided in (B). Muddy macro-aggregates are seen along the edge of the berm. The 9-cm wide post in (B) provides scale for the size of the aggregates.
Grain size data from the cores collected from the berms did not show evidence of winnowing or change in sediment texture with depth through the dredged material deposit. This further supports the limited erosion and transport of the dredged material following initial deposition. Instead, the reduction in berm volume that was observed between the 6-month and 36-month post placement surveys is likely due to 1) consolidation of the dredged material, 2) compaction of the native sediment below the berm, or 3) a combination of both consolidation and compaction. From a sediment management perspective, this reduction in volume over time creates capacity for future dredge material placement in the area, especially if the project design calls for a targeted thickness of deposit or change in elevation.
Despite a decrease in overall volume, the persistence of the two berms over the 36 months of observation has been viewed as a success by the USACE and TWI. In addition to showcasing the ability to use dredged FGS to create stable berm features, there is anecdotal evidence that suggest the berms may have aided in marsh edge protection along Gull Island. While maximum berm height at both site A’ and B was reduced by approximately 0.2 m from 6-months to 36-months post placement, these deposits accounted for over 8,000 m3 of sediment in fan shaped deposits immediately in front of more than 500 linear meters of shoreline. As shown in Figure 4B, block failure along the marsh edge occurred in multiple locations within the study area over this same period. Most noticeably along the ~100 m of shoreline between sites A’ and B that did not have a berm feature develop in front of the marsh edge.
There is insufficient data to determine why bank failure occurred in this area, but one possible factor could be the morphology in front of the shoreline. Despite measurements showing relatively low wave energy within the study area, sloped deposits that protect the toe and face of a scarp from waves could help reduce erosion and undercutting (Schwimmer, 2001; Bendoni et al., 2016; Bloemendaal et al., 2021). The post placement bathymetry data shows that the berm deposits changed the slope in front of the marsh edge and likely reduced waves breaking directly onto the scarp face behind the berms. This wave-reduction was visually observed on many occasions. However, wave action is not the only mechanism that might be responsible for the marsh edge collapse. Other studies have suggested processes such as soil creep and seepage erosion (Mariotti et al., 2016; Zhao et al., 2022). Whatever the reason for deterioration of soil stability on the marsh edge, the sloped berm deposits placed in front of the scarp face may be providing a buttressing effect that helps stabilize the morphology and reduce slumping, as slumping has not been noted in the marsh edge areas protected by the berm features since emplacement. However, it is important to note that block failure along marsh edges occurs sporadically over time and therefore it is too soon to tell what level of impact the berms may be having on marsh edge stabilization. Further research and monitoring is needed to more adequately asses the effectiveness of these berms on marsh edge stabilization.
5 Conclusion
Coastal restoration projects involving BUDM are becoming more common as communities respond to sea level rise. The SMIIL was established in coastal New Jersey so that BUDM methods and techniques could be advanced. Many of the demonstration projects conducted within SMIIL have involved muddy sediments from within the back bay environment and are providing valuable information regarding the stability and dispersion of fine-grained features following placement. Specifically, data presented in this study demonstrated that:
● The shallow, low energy environment along with the presence of cohesive flocs and bed aggregates limited the duration and spatial spread of suspended sediment plumes associated with placement of the dredged material.
● The unconfined placement of fine-grained dredged material resulted in stable deposits along the edge of the island.
● The stability of the deposits was a factor of both the shallow, low energy environment of deposition and the cohesive nature of the sediment being placed. Knowledge of both the sediment properties and placement environment also allowed predictive calculations to assess the potential of far field transport of FGS.
● The reduction in volume of the deposits over time was more likely due to consolidation and compaction as opposed to erosion. Further, this volume reduction creates capacity for future dredged material placements to achieve targeted thicknesses or elevations.
● Anecdotal evidence suggested that the dredged material placement along the southern edge of Gull Island may have reduced marsh edge failure directly behind the berms.
Data availability statement
The raw data supporting the conclusions of this article will be made available by the authors, without undue reservation.
Author contributions
DP: Conceptualization, Formal analysis, Funding acquisition, Investigation, Project administration, Writing – original draft, Writing – review & editing. LT: Conceptualization, Investigation, Project administration, Writing – original draft, Writing – review & editing. KF: Conceptualization, Formal analysis, Investigation, Methodology, Project administration, Writing – review & editing. TH: Formal analysis, Investigation, Writing – review & editing. MC: Conceptualization, Funding acquisition, Writing – review & editing.
Funding
The author(s) declare financial support was received for the research, authorship, and/or publication of this article. This work was jointly funded and supported by the US Army Corps of Engineers through the Regional Sediment Management (RSM) Program, the Geophysical Computational Modeling (GCM) focus area of the RSM program, and the Dredging Operations Environmental Research (DOER) Program.
Acknowledgments
The authors would like to acknowledge assistance and support provided with bathymetric surveys from the Atlantic City field office of the USACE Philadelphia District. Additional field work and instrument servicing support was provided by Chris Callegan and Nathan Madsen (USACE-ERDC-CHL), John Supino and Kristen Fogaren (Boston College University), and Julie Blum (The Wetlands Institute). Laboratory analysis of the sediment cores was performed by Reneé Styles (USACE-ERDC-CHL).
Conflict of interest
The authors declare that the research was conducted in the absence of any commercial or financial relationships that could be construed as a potential conflict of interest.
Publisher’s note
All claims expressed in this article are solely those of the authors and do not necessarily represent those of their affiliated organizations, or those of the publisher, the editors and the reviewers. Any product that may be evaluated in this article, or claim that may be made by its manufacturer, is not guaranteed or endorsed by the publisher.
Supplementary material
The Supplementary Material for this article can be found online at: https://www.frontiersin.org/articles/10.3389/fmars.2024.1401225/full#supplementary-material
References
ASBPA (2023). Sediment placement regulations of U.S. coastal states and territories: Towards regional sediment management implementation. Available online at: https://www.coastalstates.org/?wpdmdl=18137 (accessed [August 13, 2024]).
Bendoni M., Mel R., Solari L., Lanzoni S., Francalanci S., Oumeraci H. (2016). Insights into lateral marsh retreat mechanism through localized field measurements. Water Resour. Res. 52, 1446–1464. doi: 10.1002/2015WR017966
Bloemendaal L. J. H., FitzGerald D. M., Hughes Z. J., Novak A. B., Phippen P. (2021). What controls marsh edge erosion? Geomorphology 386, 107745. doi: 10.1016/j.geomorph.2021.107745
Carey D. A., Hickey K., Germano J. D., Read L. B., Esten M. E. (2013). Monitoring survey at the Massachusetts Bay disposal site September/October 2013: Concord, Massachusetts, U.S. Army Corps of Engineers, New England District, Disposal Area Monitoring System Contribution, no. 195. 87.
Chasten M., Tedesco L., Kopkash G. (2022). Advancing sediment solutions in the seven mile island innovation laboratory. Coast. Eng. Proc. 37), 64–64. doi: 10.9753/icce.v37.papers.64
Croft A. L., Leonard L. A., Alphin T. D., Cahoon L. B., Posey M. H. (2006). The effects of thin layer sand renourishment on tidal marsh processes: Masonboro Island, North Carolina. Estuaries Coasts 29, 737–750. doi: 10.1007/BF02786525
Erwin R. M., Miller J., Reese J. G. (2007). Poplar Island environmental restoration project: challenges in waterbird restoration on an island in Chesapeake Bay. Ecol. Restor. 25, 256–262. doi: 10.3368/er.25.4.256
Faas R. W., Carson B. (1988). “Short-term deposition and long-term accumulation of lagoonal sediment, Great Sound, New Jersey,” in Mar. Geol, vol. 82. Ed. Asley G. M., 97–112.
Fall K. A., Perkey D. W., Tedesco L. P., Chasten M. A. (2022). Impact of strategic, unconfined, dredged material placement on turbidity within a shallow back bay system: Observations from Seven Mile Island Innovation Laboratory, NJ. WEDA J. Dredging 20, 38–49. Available at: http://www.westerndredging.org/phocadownload/WEDA_Journal_of_Dredging_Vol_20_No_1.pdf.
Fall K. A., Perkey D. W., Tyler Z. J., Welp T. W. (2021). Field measurement and monitoring of hydrodynamic and suspended sediment within the Seven Mile Island Innovation Laboratory, New Jersey. doi: 10.21079/11681/40980
Fettweis M., Houziaux J. S., Du Four I., Van Lancker V., Baeteman C., Mathys M., et al. (2009). Long-term influence of maritime access works on the distribution of cohesive sediments: analysis of historical and recent data from the Belgian nearshore area (southern North Sea). Geo-Marine Lett. 29, 321–330. doi: 10.1007/s00367-009-0161-7
Garcia M. H. (2008). Sediment transport and morphodynamics. In Sedimentation engineering: Processes, measurements, modeling, and practice, 21–165. Reston, VA: American Society of Civil Engineers.
Kopp R. E., Gilmore E. A., Little C. M., Lorenzo-Trueba J., Ramenzoni V. C., Sweet W. V. (2019). Usable science for managing the risks of sea-level rise. Earth's Future 7, 1235–1269. doi: 10.1029/2018EF001145
Kran N. (1975). Tidal Controls on Suspended Sediment in a Coastal Lagoon (Stone Harbor, New Jersey: The Wetlands Institute Reprint Series, Number 2), 46. p.
Lee H., Calvin K., Dasgupta D., Krinner G., Mukherji A., Thorne P., et al. (2023). “Climate change 2023: synthesis report,” in Contribution of working groups I, II and III to the sixth assessment report of the intergovernmental panel on climate change. Canberra, Australia: The Australian National University.
Mariotti G., Kearney W. S., Fagherazzi S. (2016). Soil creep in salt marshes. Geology 44, 459–462. doi: 10.1130/G37708.1
McAnally W. H., Friedrichs C., Hamilton D., Hayter E., Shrestha P., Rodriguez H., et al. (2007). Management of fluid mud in estuaries, bays, and lakes. I: Present state of understanding on character and behavior. J. Hydraulic Eng. 133, 9–22. doi: 10.1061/(ASCE)0733-9429(2007)133:1(9)
Mohan R. K., Shisler J. K., Dinicola W. J., Iannuzzi T. J., Ludwig D. F. (2007). “Design and construction considerations for wetland restoration using dredged material,” in Proceedings of the Eighteenth World Dredging Congress (WODCON XVIII). Bryan, TX: Newman Printing Company. 341–354.
Perkey D. W. (2022). Importance of muddy bed aggregate processes in cohesive sediment dynamics associated with sediment management projects (Williamsburg, VA: The College of William and Mary), 158. p.
Perkey D. W., Smith S. J. (2019). Impact of mud aggregate processes in sediment transport studies. Available online at: https://safe.menlosecurity.com/doc/docview/viewer/docNA9CBCC654E22dc13091aa4a4546141f28b301a6872f8f285dfdc6d0cc1ab25eb2bc2b9df7938.
Perkey D. W., Smith S. J., Fall K. A., Massey G. M., Friedrichs C. T., Hicks E. M. (2020). Impacts of muddy bed aggregates on sediment transport and management in the tidal James River, VA. J. Waterway Port Coastal Ocean Eng. 146, 04020028. doi: 10.1061/(ASCE)WW.1943-5460.0000578
Perkey D. W., Smith S. J., Fall K. A., Tarpley D. R., Friedrichs C. T. (2024). Production and abundance of macro-aggregate bed clasts from moderately consolidated cohesive beds and their implications for sediment management. J. Sedimentary Res. 94, 37–50. doi: 10.2110/jsr.2023.040
Schwimmer R. A. (2001). Rates and processes of marsh shoreline erosion in Rehoboth Bay, Delaware, USA. J. Coast. Res. 17 (3), 672–683. doi: 10.2307/4300218
Smith S. J., Friedrichs C. T. (2011). Size and settling velocities of cohesive flocs and suspended sediment aggregates in a trailing suction hopper dredge plume. Continental Shelf Res. 31, S50–S63. doi: 10.1016/j.csr.2010.04.002
Soulsby R. L. (1997). Dynamics of marine sands: A manual for practical applications (London: Thomas Telford).
Stockton University Coastal Research Center (2024). Marsh Edge Erosion (ESRIGeometryPolygon). Available at: https://www.arcgis.com/home/item.html?id=49d3c7505a4345b6931a782838b4738a#overview.
Turner T. M. (1996). Fundamentals of hydraulic dredging (New York, NY: American Society of Civil Engineers).
USACE (2013). Hydrographic Surveying. Engineering Manual EM 1110-2-1003 (Washington, DC: United States Army Corps of Engineers Washington, DC).
Weinstein M. P., Weishar L. L. (2002). Beneficial use of dredged material to enhance the restoration trajectories of formerly diked lands. Ecol. Eng. 19, 187–201. doi: 10.1016/S0925-8574(02)00077-0
Weis J. S., Watson E. B., Ravit B., Harman C., Yepsen M. (2021). The status and future of tidal marshes in New Jersey faced with sea level rise. Anthropocene Coasts 4, 168–192. doi: 10.1139/anc-2020-0020
Wentworth C. K. (1929). Method of computing mechanical composition types in sediments. Bull. Geological Soc. America 40, 771–790. doi: 10.1130/GSAB-40-771
Wright L. D., Friedrichs C. T., Kim S. C., Scully M. E. (2001). Effects of ambient currents and waves on gravity-driven sediment transport on continental shelves. Mar. Geology 175, 25–45. doi: 10.1016/S0025-3227(01)00140-2
Yozzo D. J., Wilber P., Will R. J. (2004). Beneficial use of dredged material for habitat creation, enhancement, and restoration in New York–New Jersey Harbor. J. Environ. Manage. 73, 39–52. doi: 10.1016/j.jenvman.2004.05.008
Keywords: fine-grained sediment, beneficial use, marsh edge erosion, sediment management, dredging
Citation: Perkey DW, Tedesco LP, Fall KA, Huff TP and Chasten MA (2024) Stability of marsh edge berms constructed from fine-grained dredged sediment. Front. Mar. Sci. 11:1401225. doi: 10.3389/fmars.2024.1401225
Received: 14 March 2024; Accepted: 05 August 2024;
Published: 29 August 2024.
Edited by:
Guan-hong Lee, Inha University, Republic of KoreaReviewed by:
Mohsen Soltanpour, K.N.Toosi University of Technology, IranYasuyuki Nakagawa, Port and Airport Research Institute (PARI), Japan
Copyright © 2024 Perkey, Tedesco, Fall, Huff and Chasten. This is an open-access article distributed under the terms of the Creative Commons Attribution License (CC BY). The use, distribution or reproduction in other forums is permitted, provided the original author(s) and the copyright owner(s) are credited and that the original publication in this journal is cited, in accordance with accepted academic practice. No use, distribution or reproduction is permitted which does not comply with these terms.
*Correspondence: David W. Perkey, RGF2aWQuUGVya2V5QHVzYWNlLmFybXkubWls