- 1Hainan Institute, Zhejiang University, Sanya, China
- 2Institute of Physical Oceanography and Remote Sensing, Ocean College, Zhejiang University, Zhoushan, China
- 3Hainan Observation and Research Station of Ecological Environment and Fishery Resource in Yazhou Bay, Sanya, China
- 4College of Oceanic and Atmospheric Sciences, Ocean University of China, Qingdao, China
Under the background of global climate change, Subsurface Marine Heatwaves (SSMHWs) have become a ‘hot-spot’ research due to their significant impacts on marine ecosystems. Temperature data from the ECCO2 for the years 1992 to 2021 is used to research the spatiotemporal characteristics of SSMHWs in the upper 500 m over the Xisha region (110°E to 113°E, 15°N to 18°N). This study indicates that SSMHWs of high intensity occur in the Xisha area, with the vertical maximum intensity at approximately 100 m. These events exhibit significant seasonal variations, with the highest intensity occurring in May. The intensity of SSMHW in the analysis region varies interannually. SSMHWs have intensified at a rate of 1.53°C·Days/Year and tend to shift to deeper water over the past three decades. A block-based method for SSMHW identification is proposed, in order to take the vertical extent of the event in consideration. By analyzing the eight most intense events based on spatial cumulative intensity, it suggested that warm mesoscale eddies may play an important role on the spatial distribution of the SSMHWs. Statistical analysis shows that the intensity and coverage of the warm mesoscale eddy in the Xisha zone may influence the intensity and evolution of the SSMHWs. Additionally, only 18.27% of SSMHW events occur with apparent surface marine heatwave signals. These findings are vital for uncovering SSMHW dynamics in the Xisha area, and are important for future monitoring, early warnings and marine conservation.
1 Introduction
In recent years, as the global warming trend continues to intensify, extreme weather and hydrological events have become increasingly frequent worldwide, their impacts on biology and the natural environment are obvious (Hansen et al., 2023). Research about the temperature change trend and the extreme anomalies of ocean, the Earth’s largest heat sink, has become increasingly popular. Pearce et al. (2011) introduced the concept of marine heatwaves (MHWs) for the first time in his study of the anomalous warming of coastal sea surface temperature (SST) in Western Australia during 2010/11, describing it as an abnormal phenomenon of extreme warming in a short period. The MHW identification method using climate percentile thresholds (Hobday et al., 2016) has widely applied in the global MHW research. Defined and identified through the above methods, MHW represents an extreme ocean temperature warming event that reflects the significant ecological damage (Hobday et al., 2016; Oliver et al., 2021). Statistical studies have revealed significant increases in the frequency, duration, and annual total days of global MHW events over the past century, with increases of 34%, 17%, and 54%, respectively (Oliver et al., 2018). Furthermore, coupled climate model studies predict a rapid increase in MHW frequency and intensity, with the most extreme scenarios forecasting permanent MHW conditions in the certain ocean regions by the late 21st century (Oliver et al., 2019; Qiu et al., 2021; Yao et al., 2022). MHWs severely threats to marine ecosystems and the human marine economy, decimating temperature-sensitive marine life like coral reefs and fish larvae, and causing drastic ecological and economic losses (Gouvêa et al., 2017; Frolicher and Laufkotter, 2018; Smith et al., 2023). Notably, events in Western Australia (2011) and the low-latitude Pacific (2015-2017) led to massive deaths of marine organisms and coral bleaching (Pearce et al., 2011; Wernberg et al., 2012; Hughes et al., 2017; Lachs et al., 2023). MHWs also indirectly trigger climate disasters through teleconnections, affecting global weather patterns and human economies (Pershing et al., 2018; Holbrook et al., 2019). Moreover, Ocean warming and MHWs can not only directly affect marine ecosystems, but also indirectly affect the marine eco-environment by influencing ocean dynamic processes, such as ocean fronts (Feng et al., 2022) and upwelling (Liu et al., 2023). This is one of the significant factors that MHWs can be a current research hotspot.
The South China Sea (SCS), a vital ecological and economic zone, experiences frequent MHWs, especially in the Beibu Gulf. Actually, the Beibu Gulf has experienced the effects of severely warming such as MHW events, which have significantly impacted on the local marine ecosystems (Feng et al., 2022). These events are often driven by anomalies in the Western Pacific Subtropical High and associated wind fields (Yao and Wang, 2021; Feng et al., 2022). Notably, the extreme MHW in the Beibu Gulf severely damaged local coral reef ecosystems during the summer of 2020 (Chen et al., 2022; Feng et al., 2022). Predictions based on CMIP6 data indicate an increase in the intensity and duration of MHWs in the SCS, increasing the risk of coral bleaching (Song et al., 2023; Sun et al., 2024).
MHWs impact not only the ocean surface but also deep-sea ecosystems. Thus, it is of necessity for further exploration of their effects below the surface (Dayan et al., 2023; Zhang et al., 2023). Based on ocean circulation model data and long-term observational data, the research of subsurface marine heatwaves (SSMHWs) aims to reveal how heat from surface marine heatwaves (SMHWs) is transferred to deeper ocean regions through oceanic dynamics (Galli et al., 2017; Schaeffer and Roughan, 2017). These studies have shown that SSMHWs can severely affect marine life, especially in shallow layer of ocean where organisms have limited mobility. By analyzing multiple data sources, including Argo floats and shipborne CTD, Jackson et al. (2018) highlighted the long-term impacts of deep SSMHWs on marine ecosystems, such as salmon food chains in specific regions. Additionally, Hu et al. (2021) found unexpectedly intense SSMHWs in regions, where only weak SMHWs happened ever. This highlights the significance of studying SSMHWs, particularly in areas where surface signals may not be pronounced. Further, novel classification methods based on the vertical structure characteristics of SSMHWs have been proposed, identifying various types of SSMHW vertical structures (Schaeffer et al., 2023; Zhang et al., 2023). Previous studies have indicated that eddy-driven SSMHWs can have a severe impact on coral bleaching (Wyatt et al., 2023).
Identifying and quantifying SSMHWs face greater challenges than SMHWs, especially additional vertical-dimension. Early use of in-situ data from temperature chains and buoys was limited by the sparse spatial-resolution (Galli et al., 2017; Schaeffer and Roughan, 2017; Hu et al., 2021; Fragkopoulou et al., 2023). Moreover, relying on ocean heat content (OHC) rather than SST for SSMHW detection faces adaptability issues due to fixed depth constraints (Dayan et al., 2023; McAdam et al., 2023). The recent application of computer neural network technology to analyze the spatial attributes of SSMHWs introduces new research opportunities, but also adds to the complexity of identification (Sun et al., 2023). Consequently, advancing SSMHW research requires more efficient and feasible methods for comprehensive spatiotemporal analysis.
The coral reefs of the Xisha Islands are the most representative coral reefs in China, hosting three-quarters of the country’s coral species with extremely high ecological value (Wang et al., 2011). In recent years, coral reef degradation caused by temperature anomalies in the Xisha area has been increasing (Zuo et al., 2023). Previous studies indicated that SMHWs are more prevalent in the northern SCS, particularly east of Hainan Island and the continental shelf waters, compared to the weaker SMHWs in the Xisha area (Tan et al., 2022; Wang et al., 2022). However, SSMHWs in areas where SMHWs are weak may not be equally weak (Hu et al., 2021). Additionally, Previous research revealed that mesoscale eddies, commonly propagating from the Luzon Strait in the northern SCS, could significantly affect the Xisha area where the high strategic and ecological importance (Wang et al., 2011; Du et al., 2016; Zhang et al., 2022). Given the potential underestimation of the ecological impacts caused by MHWs in the Xisha area, conducting more in-depth research on SSMHWs is essential.
This study aims to investigate the characteristics of SSMHWs in the Xisha area, focusing on the impacts of air-sea interaction and mesoscale eddies on the driving mechanisms of SSMHWs. The black box denotes the study region within the Xisha area, spanning from 110°E to 113°E longitude and from 15°N to 18°N latitude (Figure 1). The climatology-mean sea surface height (SSH) distribution showed that there was a cyclonic background circulation in the SCS (Fang et al., 2012). The second section provides detailed information on the data and methods. The spatiotemporal characteristics and driving mechanisms of SSMHWs in the Xisha area and the impact of net air-sea heat flux are discussed in Sec.3. Sec.4 discusses the findings of this study and prior research. Finally, the findings of this study are summarized in Section 5.
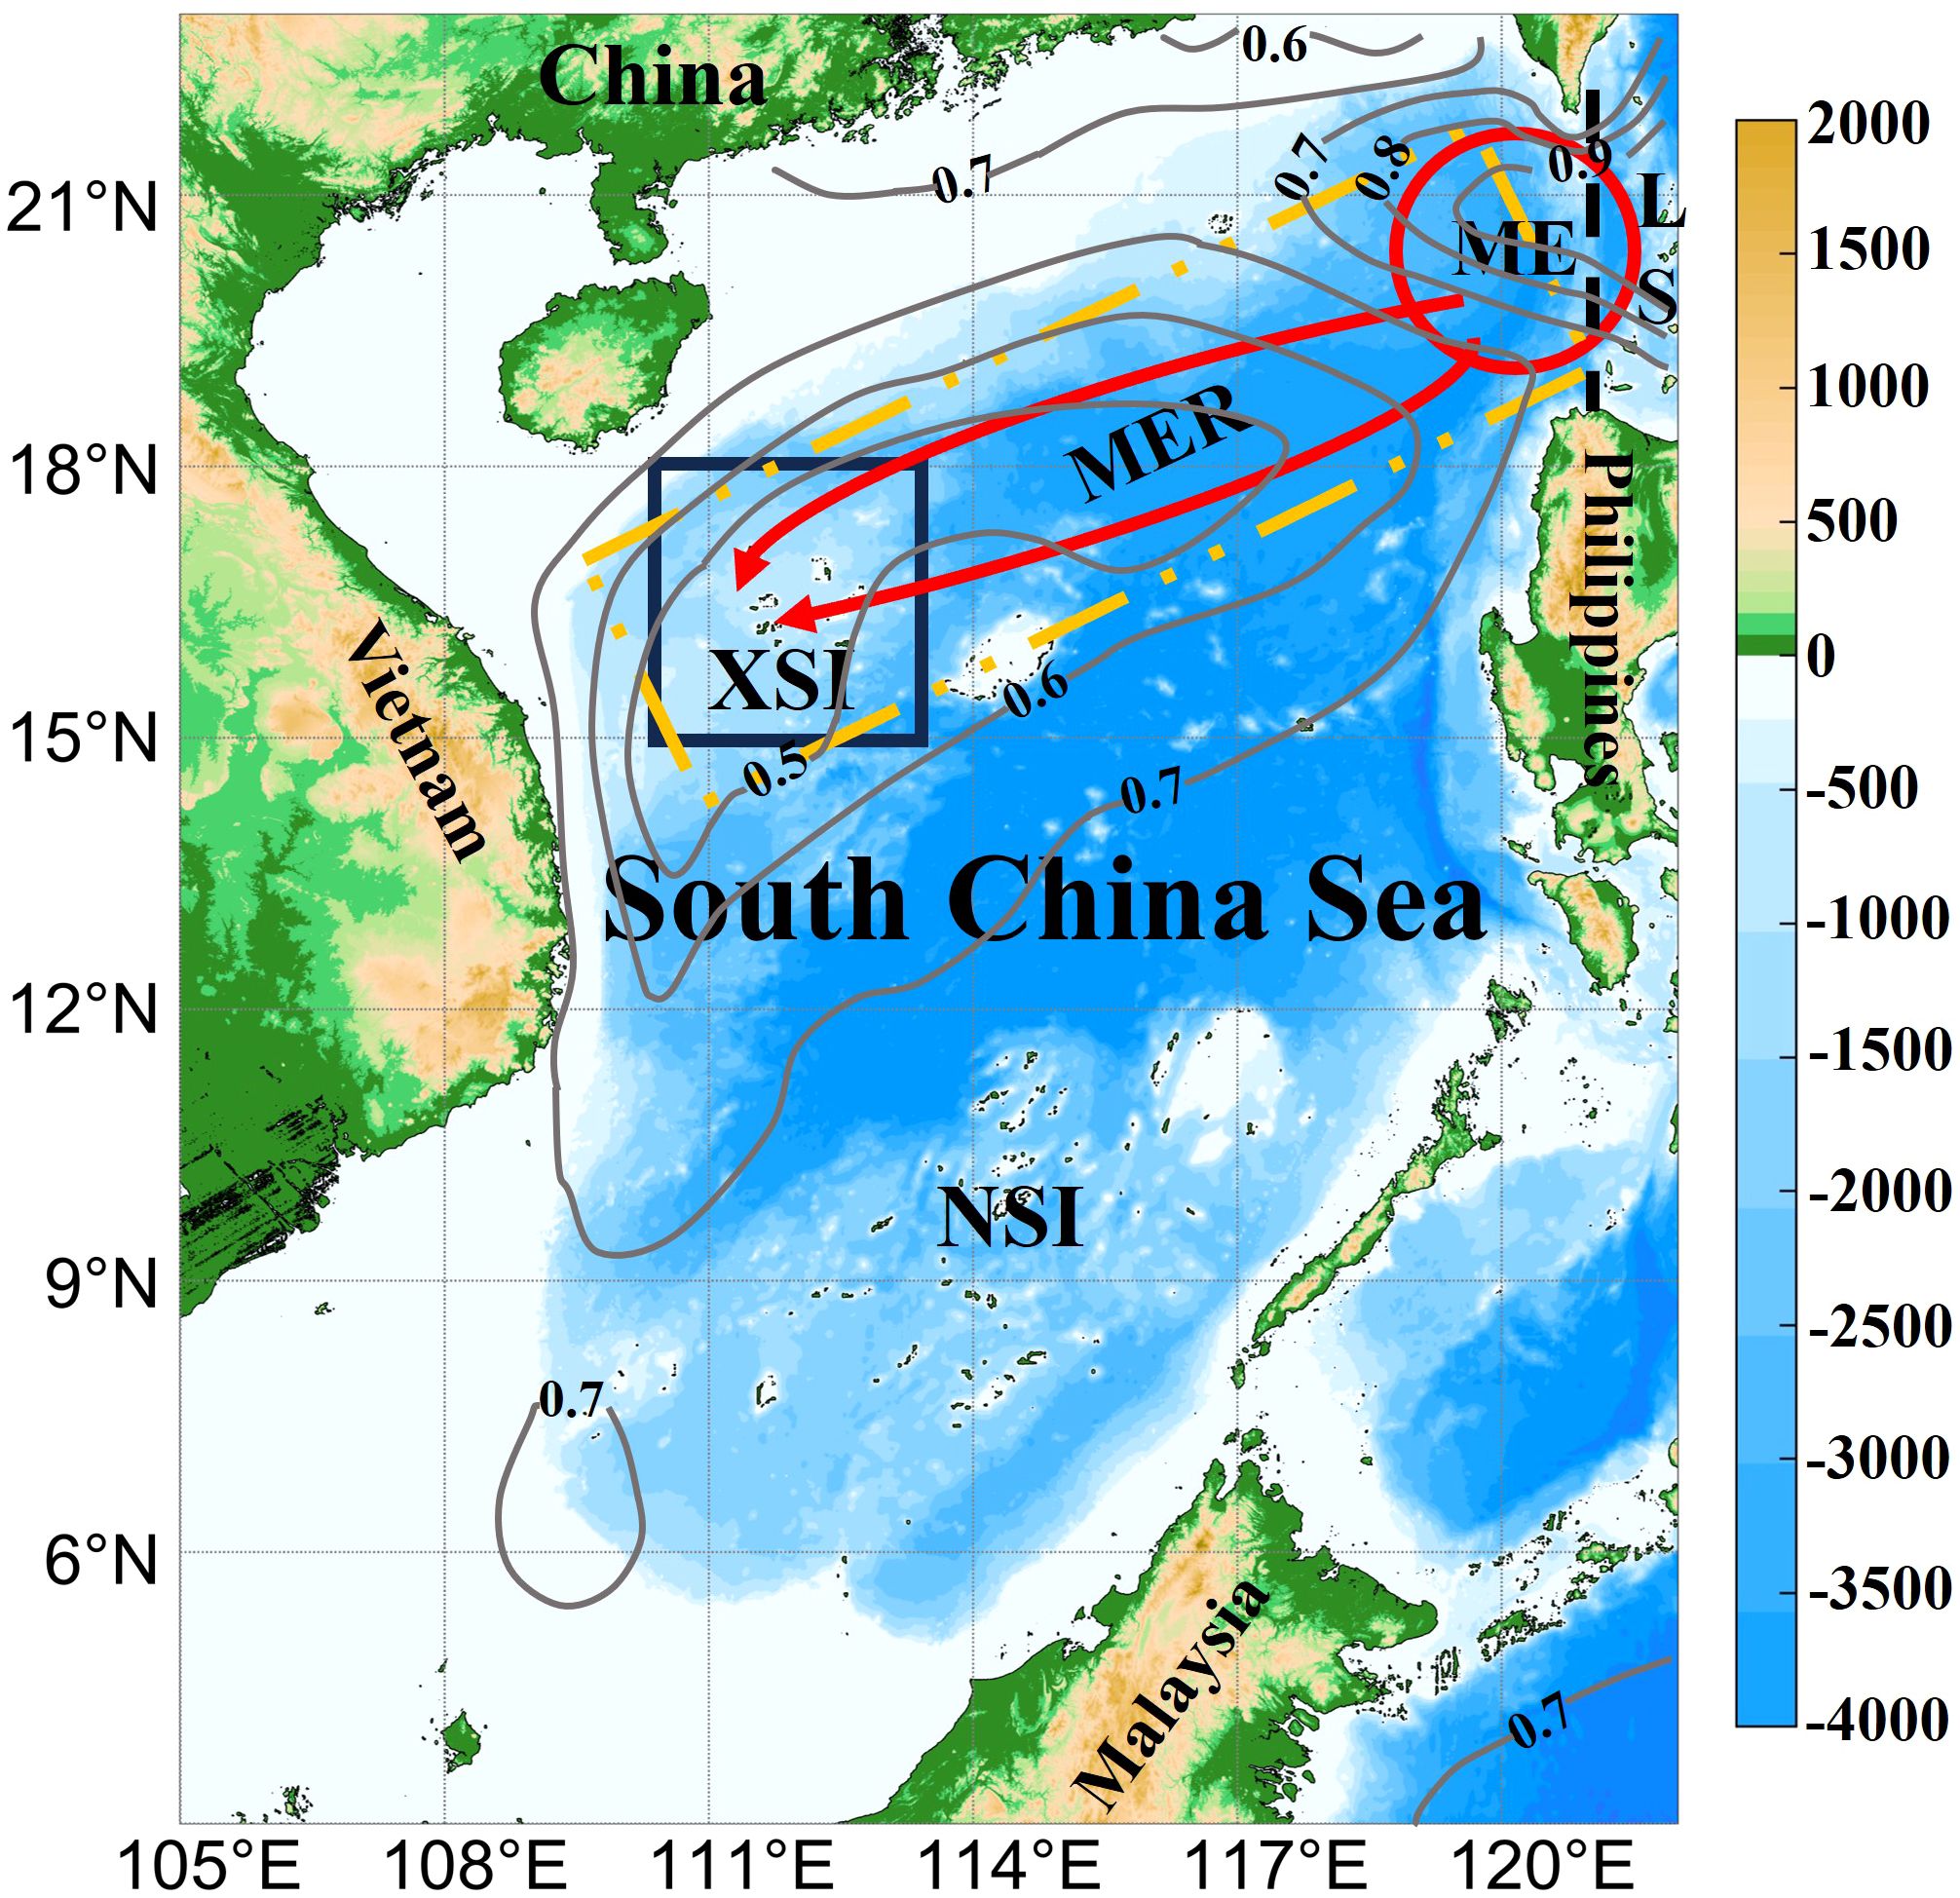
Figure 1 Schematic diagram of mesoscale eddies propagation paths. Colors represent geographic altitude (m). The black and yellow boxes, red arrows, and circles represent the study region, the main propagation area, directions, and generation areas of mesoscale eddies, respectively. The grey contour lines represent the climatology-mean SSH. XSI, the Xisha Islands; ME, Mesoscale Eddy; MER, Mesoscale Eddies Route; LS, the Luzon Strait; NSI, the South Islands.
2 Data and methods
2.1 Data description
The Optimum Interpolation Sea Surface Temperature version 2.1 (OISSTv2.1) satellite assimilation data from the United States National Oceanic and Atmospheric Administration (NOAA) was used to investigate SMHWs. The gridded dataset provides daily averaged temporal resolution, covering the period from 1992 to 2021, with a spatial resolution of 1/4°. This data is a long-term record that integrates data from multiple data sources such as satellites, buoys, ships, etc. The effectiveness and reliability of the OISSTv2 data in MHW research have been repeatedly validated, including its application in the MHW identification method proposed by Hobday et al (Hobday et al., 2016).
Based on temperature data, from the “Estimating the Circulation and Climate of the Ocean, Phase 2” (ECCO2) reanalysis dataset, the SSMHWs in the Xisha area were studied. The dataset offers tri-daily temporal resolution spanning from 1992 to 2021, with a spatial resolution of 1/4°. Time series data were processed through linear interpolation to daily data, whereas vertical spatial resolution was enhanced using Hermite interpolation to attain uniformly spaced data at 10 m intervals. This dataset provides a reliable research tool for long-term observation of three-dimensional oceanic changes. In the context of MHW research, the ECCO2 dataset has been extensively applied. Additionally, the ECCO2 dataset contains a variety of data on ocean dynamics and air-sea interactions, which is helpful for mechanism analysis. By comparing the results of OISST with ECCO2 in MHW research in the South China Sea, it was found that ECCO2 was very close to the observational data OISST in identifying MHWs in the SCS, proving the reliability of its application in MHW research in this region. The frequency of MHWs identified by OISST is generally higher than that of ECCO2, but the maximum frequencies are relatively close, 2.91 and 2.83 respectively, and both occur in the western sea area of the Luzon Strait. The intensity of MHWs identified by the above two data is closer, and the horizontal distribution characteristics are higher in the northwest and lower in the southeast. The relevant results are shown in the Supplementary Figure S1.
The SSH data, and three-dimension velocity data from the ECCO2 dataset were used to investigate potential driving mechanisms of SSMHWs. Additionally, the air-sea interaction data from the ERA5 reanalysis dataset provided by the European Centre for Medium-Range Weather Forecasts (ECMWF), including longwave radiation (LWR), shortwave radiation (SWR), latent heat flux (LHF), and sensible heat flux (SHF), were used to analyze the ocean heat budget. The temporal and spatial range and resolution of all data remain consistent with those used for MHW identification, by interpolation or averaging treatment for preprocessing.
The Nino3.4 data, from the NOAA Physical Sciences Laboratory, was used to explore the relationship between SSMHWs in the Xisha area and El Niño Southern Oscillation (ENSO).
2.2 MHW research
2.2.1 MHW identification
The definition and identification of MHW proposed by Hobday et al. (2016) are used to investigate the MHW in the study region. This method in our research used interpolated daily average ECCO2 temperature, took 1992 to 2021 as the research period, used the sliding average temperature of the 11-day window period as the baseline, sorted all temperature within the window period, and then selected the temperature value at 90% maximum percentile as the threshold. Finally, according to the definition, an event in which the temperature exceeded the threshold and lasted for more than 5 days (interruption no more than 2 days) was identified as a MHW event. The MHW identification program used in this research is based on an open-source toolkit developed by Zhao and Marin (2019).
2.2.2 SSMHW identification
To facilitate comprehensive research on SSMHW events, especially considering the spatial characteristics, this study proposes a block-based method for identifying SSMHWs. The steps of the method are as follows:
First, MHWs are identified at each spatial coordinate within the study region to create an array depicting changes in MHW Intensity (Int) over time at each pixel location. Points with an Int greater than 0 are marked as MHW occurrences. By calculating the ratio of pixel points in a MHW state at each depth layer, we derive a two-dimensional matrix representing the temporal variation of the MHW pixel ratio at every depth layer, as illustrated in the matrix in Figure 2A. A ratio of 0 is marked as no MHW occurred. This matrix is then segmented into regions where MHWs exist, with the blue line indicating a rough time range. Specify the depth of the earliest maximum ratio within the segment as the depth of the projection layer.
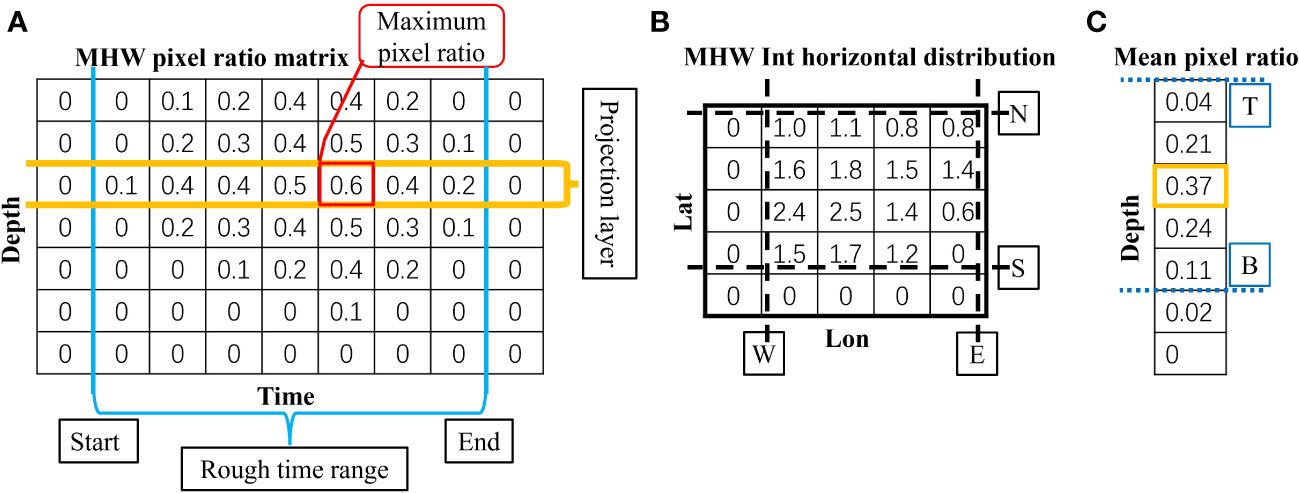
Figure 2 Schematic of the block-based SSMHW method. (A) The matrix represents the ratio of MHW pixel points at different depth layers at any time, used to find the rough time, vertical spatial extent, projection layer, and its maximum value of a SSMHW event. (B) The matrix represents the MHW horizontal distribution at the time and depth layer where the maximum value is located as described above, used to find the horizontal spatial range of SSMHW events. (C) The matrix represents the mean MHW pixel ratio within the rough time range calculated based on the newly found horizontal spatial range, used to find the precise vertical spatial range based on a certain proportion of the mean pixel ratio of the projection layer.
Second, expand the MHW horizontal Int distribution matrix of the depth layer at the time of the above maximum value, as shown in the matrix in Figure 2B. The outermost boundary layer is confirmed based on the location where MHW occurs, marked by the black dashed line.
Third, use the newly determined horizontal spatial range as the boundary to determine the mean MHW pixel ratio of each depth layer within the rough time range. The depth layer that can reach 10% of the mean pixel ratio of the projection layer is selected as the SSMHW vertical spatial range, as shown by blue dotted lines in the matrix in Figure 2C.
Fourth, we calculated the spatial average temperature in the above-identified space. We used the average value to identify more precise SSMHW start and end times through traditional MHW identification method. The result of the spatial MHW time range should be within the rough time range and there may be multiple events. Finally, the spatial range and time period of an SSMHW event are obtained.
2.2.3 Quantitative analysis indicators
Following previous studies, frequency (Fre, unit: Counts/Year), duration (Dur, unit: Days), MHW rate (Rate, unit: %), intensity (Int, unit: °C), cumulative intensity (CumInt, unit: °C·Days) and total cumulative intensity (TotalCumInt, unit: °C·Days/Year) were used to characterize SSMHWs (Feng et al., 2013; Hobday et al., 2016; Oliver et al., 2018). In addition, this research introduces new quantitative indicators that consider spatial factors for the study of SSMHWs, including heat content intensity (HCI, unit: GJ/m2), temperature-depth intensity (TDI, unit: °C·m), and spatial cumulative intensity (SCI, unit: °C·Days·km3). Here, the , where represents the ocean heat content on a given day t, represents the climatological average ocean heat content of that day. The TDI, calculated as , is a simplification of HCI, showing similar effectiveness in characterizing SSMHWs. Where Int represents the mean intensity of the SSMHW event, and stands for the vertical extent of the event. The Int, HCI, and TDI vary over time during a SSMHW event. Therefore, this study will take into account both the average and maximum values of these physical quantities in the quantitative characterization process.
The method used for calculating the OHC is as follows:
Where represents the specific heat capacity at constant pressure [4007 J/(kg·°C)], ρ denotes the density of seawater (1027 kg/m3), z is the depth of the seawater (m), where is the depth of the bottom layer and is the depth of the top layer, and is the temperature (°C) at depth z.
SCI is a new quantitative indicator based on CumInt, taking into account the spatial extent of the SSMHW’s impact. The magnitude of this indicator can represent the intensity of the SSMHW’s impact on the ecosystem over time and space. The specific calculation formula is as follows:
Where and represent the start and end time of the SSMHW event, respectively, is the real-time temperature (°C), is the corresponding climatological average temperature (°C).
2.3 Driving mechanisms research
2.3.1 Ocean heat budget calculation
Currently, the ocean heat budget equation has been widely applied in the study of MHW driving mechanisms, commonly using the mixed-layer heat budget equation (Holbrook et al., 2019; Amaya et al., 2020; Elzahaby et al., 2021; Schlegel et al., 2021; Chatterjee et al., 2022; Chen et al., 2022). However, the vertical spatial extent of SSMHWs often exceeds the depth of the mixed layer, making it more appropriate to use the boundary layer heat budget equation to study thermodynamic changes over time within the entire water column (Xiao et al., 2017; Chen et al., 2023).
Where the left side represents the ocean heat content changes (OHCC, unit: °C/Day), the ρ、 and T are as defined in the OHC calculation formula, represents the net air-sea heat flux (°C/Day), ADV represents the advective heat flux (°C/Day), and Res represents the heat flux resulting from other mechanisms (°C/Day).
Where , , , , represents the shortwave radiation, longwave radiation, sensible heat flux, and latent heat flux, respectively.
The advective heat flux calculates as follows:
Where x represents the longitudinal coordinates of the study area’s boundaries, with and denoting the western and eastern boundaries respectively, y indicates the latitudinal coordinates of the boundary, with and representing the southern and northern boundaries respectively, z refers to the depth of the boundary, with is the bottom boundary, u, v, and w represent the oceanic current velocities (m/s), is the reference temperature, calculated as the spatial average temperature.
2.3.2 Mesoscale eddies identification
The closed contour method based on Sea Surface Height Anomalies (SSHA) was used to detect mesoscale eddies, with a specific step parameter set at 0.01 (Mason et al., 2014; Zhang et al., 2014). To investigate the relationship between the intensity of mesoscale eddies and the intensity of SSMHWs, this study selects quantitative indicators such as amplitude (Amp) calculated as , vorticity (Vort) calculated as , and eddy kinetic energy (EKE) calculated as for the quantification of mesoscale eddies.
Where and represent the SSHA (m) of the center and the average value of the edge of mesoscale eddies, respectively, and both represent the oceanic current velocity anomalies (m/s).
Furthermore, the Pearson correlation coefficient was used to quantify the relationship between the intensity of SSMHW characteristics and the relevant parameters of mesoscale eddies, with the significance of the results validated through t-tests.
3 Results
3.1 Spatial distribution and temporal variation of SSMHW
To diminish the impact of water depth differences on the quantification of SSMHWs, we used relative values as SSMHW quantitative indicators, defined as the ratio to the average value of the same depth. These indicators include Fre, Dura, Rate, Int, CumInt, and TCumInt. The specific characterization results are presented in Figure 3.
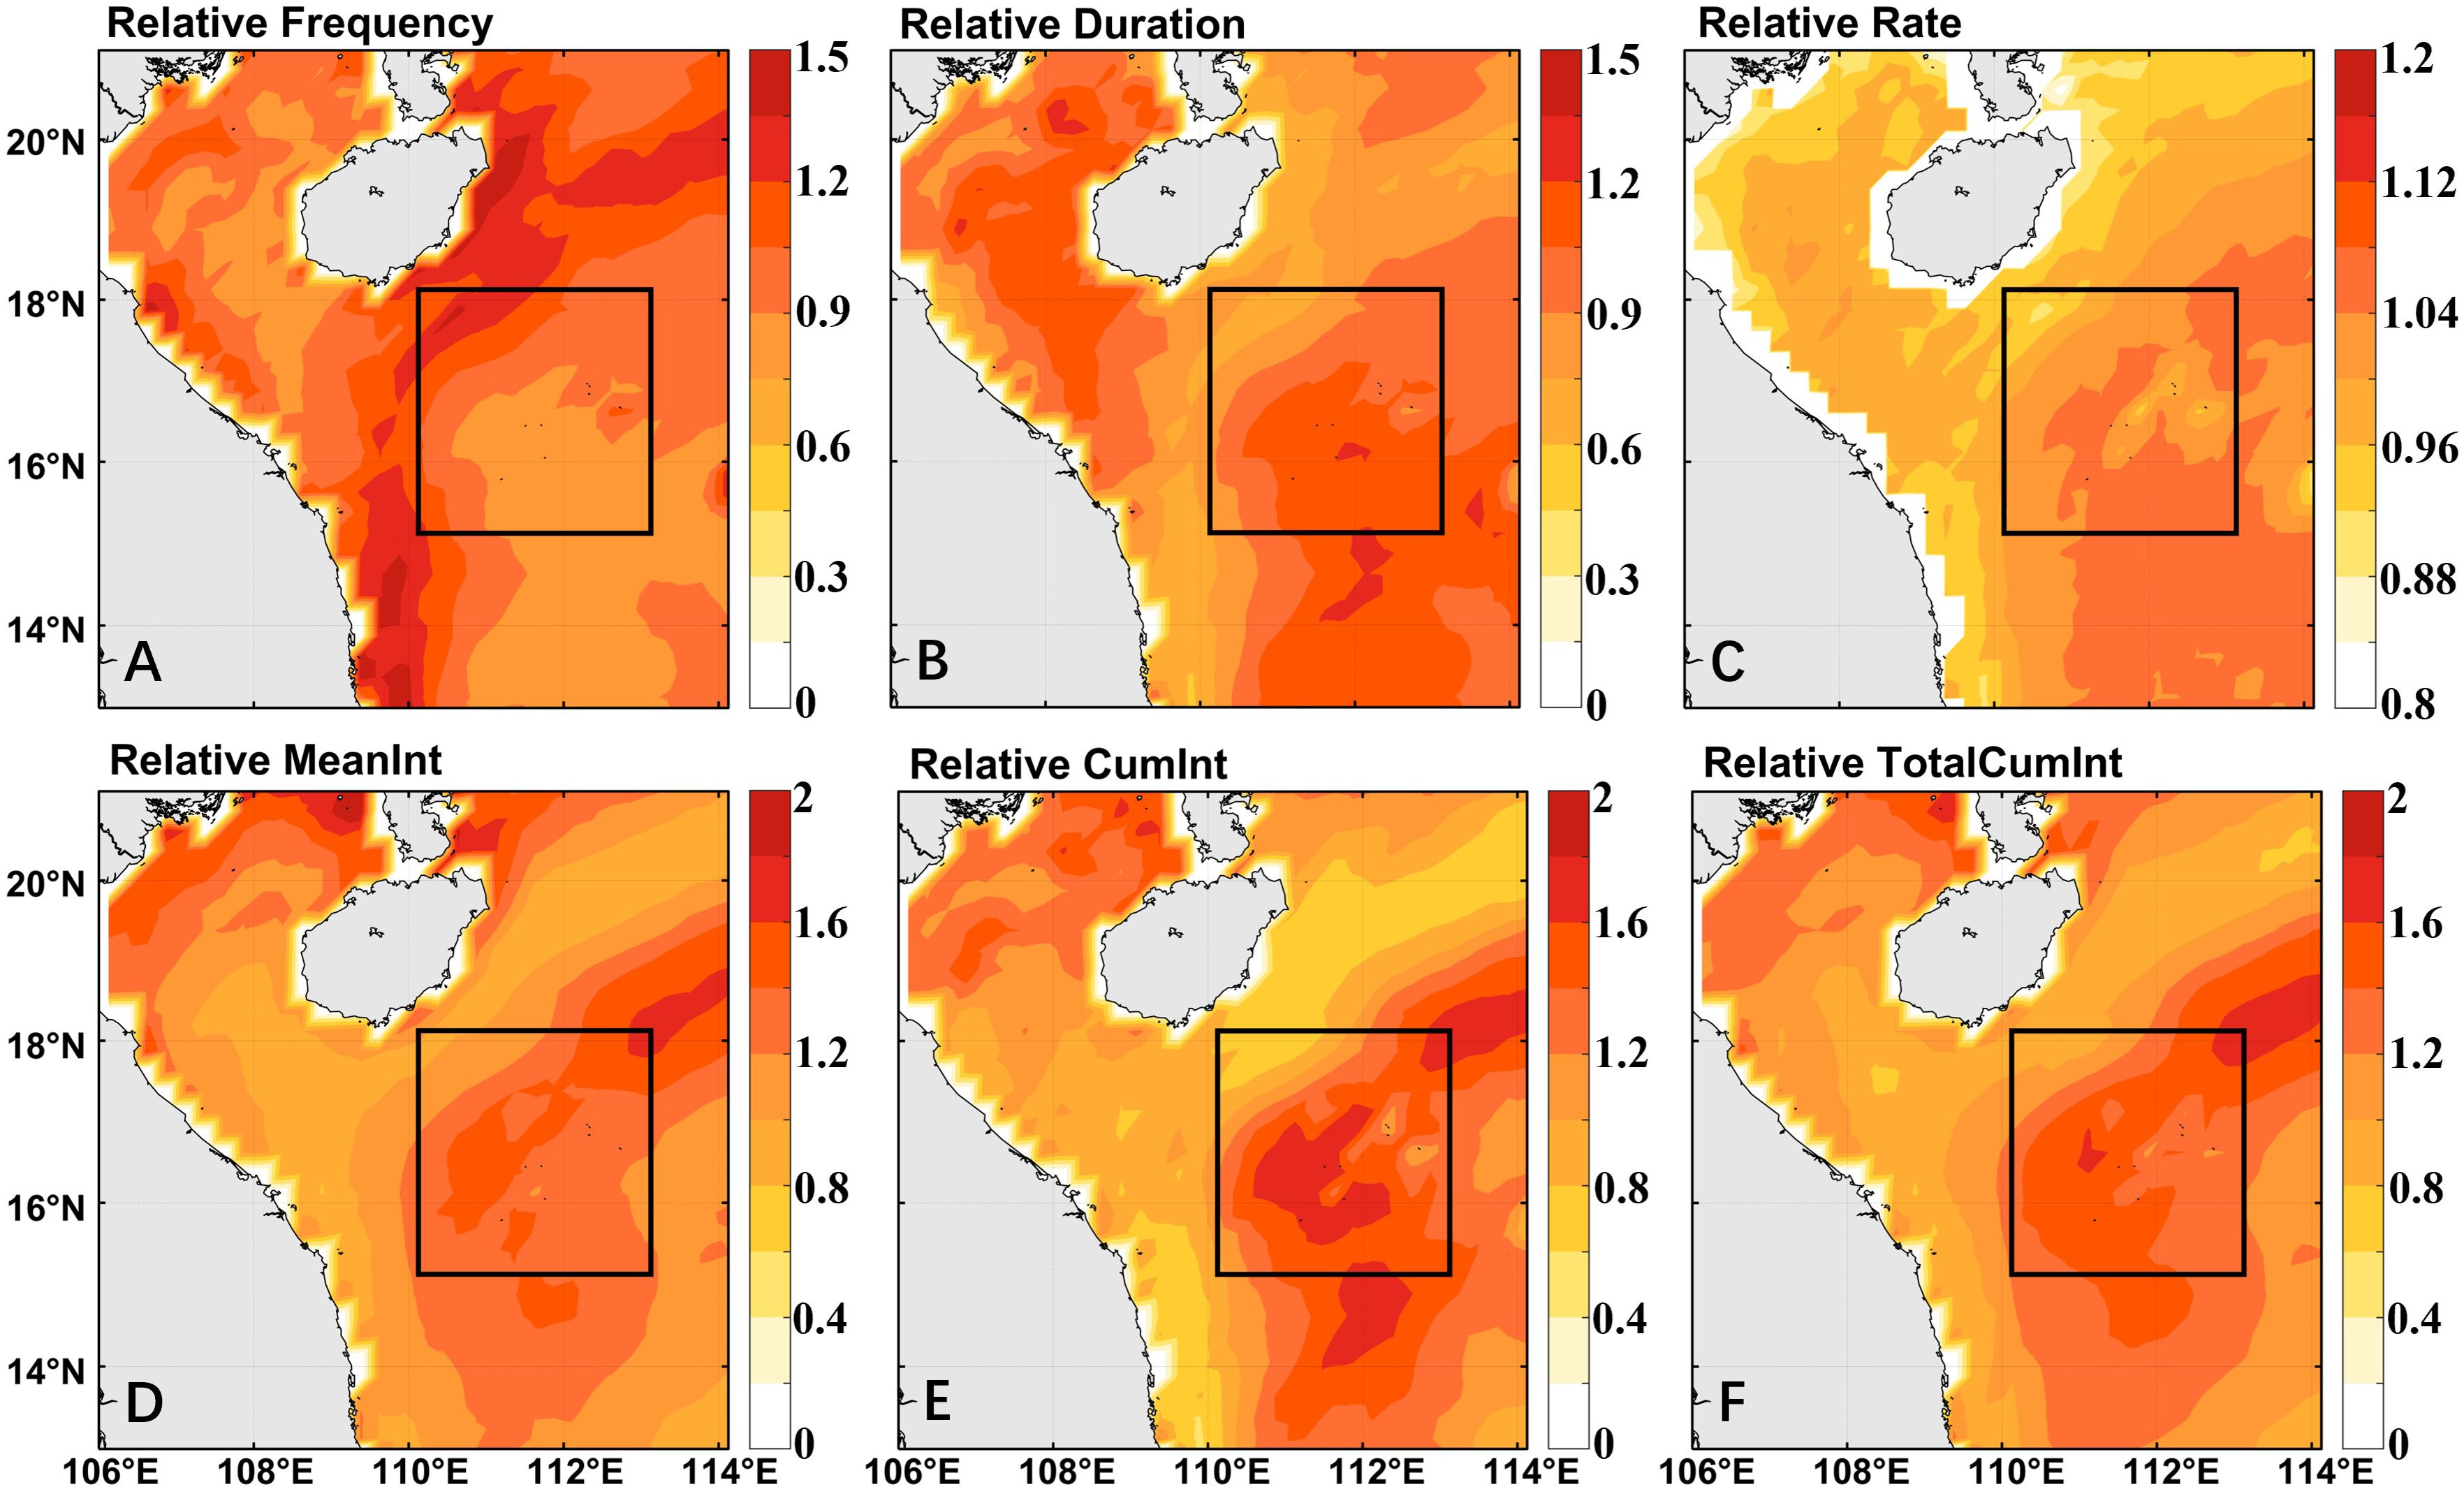
Figure 3 The spatial distribution of relative values for quantified indicators of SSMHWs from 1992 to 2021 in the northwest SCS, in the upper 500 m. (A) Frequency, (B) Duration, (C) MHW rate, (D) Mean intensity, (E) Cumulative intensity, and (F) Total cumulative intensity. The black box represents the study region.
The Xisha area, outlined by the black box, exhibited a relatively low frequency of SSMHWs, with an average relative value of 0.96 and an annual frequency of approximately 1.56 Counts/Year (Figure 3A). The frequency of SSMHWs near the South China Sea Throughflow significantly exceeded that in the surrounding regions, with the highest incidence observed to the east of Hainan Island (Wang et al., 2022). The average relative duration of SSMHWs was 1.04, with an average duration of approximately 22.98 Days/Count (Figure 3B). The average relative MHW rate, indicating the proportion of time affected by MHWs, was 1.02 (Figure 3C). On average, the region experiencing SSMHWs for approximately 9.82% of the year, was equivalent to about 36 days annually. The significant impact of SSMHWs on the study area, as demonstrated across three quantitative indicators: mean Int (MeanInt), CumInt, and TCumInt, with respective average relative values of 1.32, 1.38, and 1.36. The actual numerical values were approximately 1.49°C/Count for MeanInt, 38.43°C·Days/Count for CumInt, and 58.36°C·Days/Year for TCumInt (Figures 3D–F). This analysis adopted six quantitative indicators to assess the long-term horizontal spatial characteristics of SSMHWs in the Xisha area, indicating that although the frequency of SSMHWs in this region was not particularly high, their duration and intensity had a significant impact on the marine ecosystem. It is particularly noteworthy that this region is prone to intense SSMHW events, necessitating further research and attention.
Compared to SMHWs, the most significant characteristic of SSMHWs is their vertical spatial dimension. Figure 4 revealed the vertical spatial characteristics of SSMHWs in the study area. Using mixed layer depth data from the ECCO2 dataset, this study determined the study area’s average mixed layer depth as approximately 50 m for consistency with data vertical precision. The frequency of SSMHWs decreased significantly with depth within the mixed layer (Figure 4A). On average, there was a reduction of about 0.05 Counts/Year for the 10 m increasing in depth, with the surface layer registering the highest frequency at 1.83 Counts/Year. Below the mixed layer, the variation in frequency with depth remained stable. However, deeper than 450 m, there was a subtle increase in frequency as depth increases. Standard deviation analysis revealed that the variability in the frequency of SSMHWs was most pronounced at depths of 200-300 m, attributed largely to a significant increase in maximum value. There was a negative correlation between the frequency of SSMHWs and the variation in their duration with depth (Figures 4A, B). Within the mixed layer depth range, the duration of SSMHWs notably lengthens as depth increases, extending by about 0.75 Days/Count for each 10 m increment, with the shortest average duration of 18.41 Days/Count observed in the surface layer (Figure 4B). Below the mixed layer, the variability in duration decreased, with a slight decline observed beyond 450 m. The most pronounced variation was also found at depths of 200–300 meters, indicating substantial differences in SSMHW characteristics across different locations within this depth interval. The trends of Int and CumInt were generally similar, increasing with depth before diminishing, peaking at approximately 100 m, with the maximum values recorded at 3.07°C/Count for Int and 95.13°C·Days/Count for CumInt (Figures 4C, D). Standard deviation analysis indicated that Int changes to a lesser extent across the study area with depth, whereas CumInt exhibits more significant variability. The fluctuation in CumInt initially increased and then decreased with deeper progression.
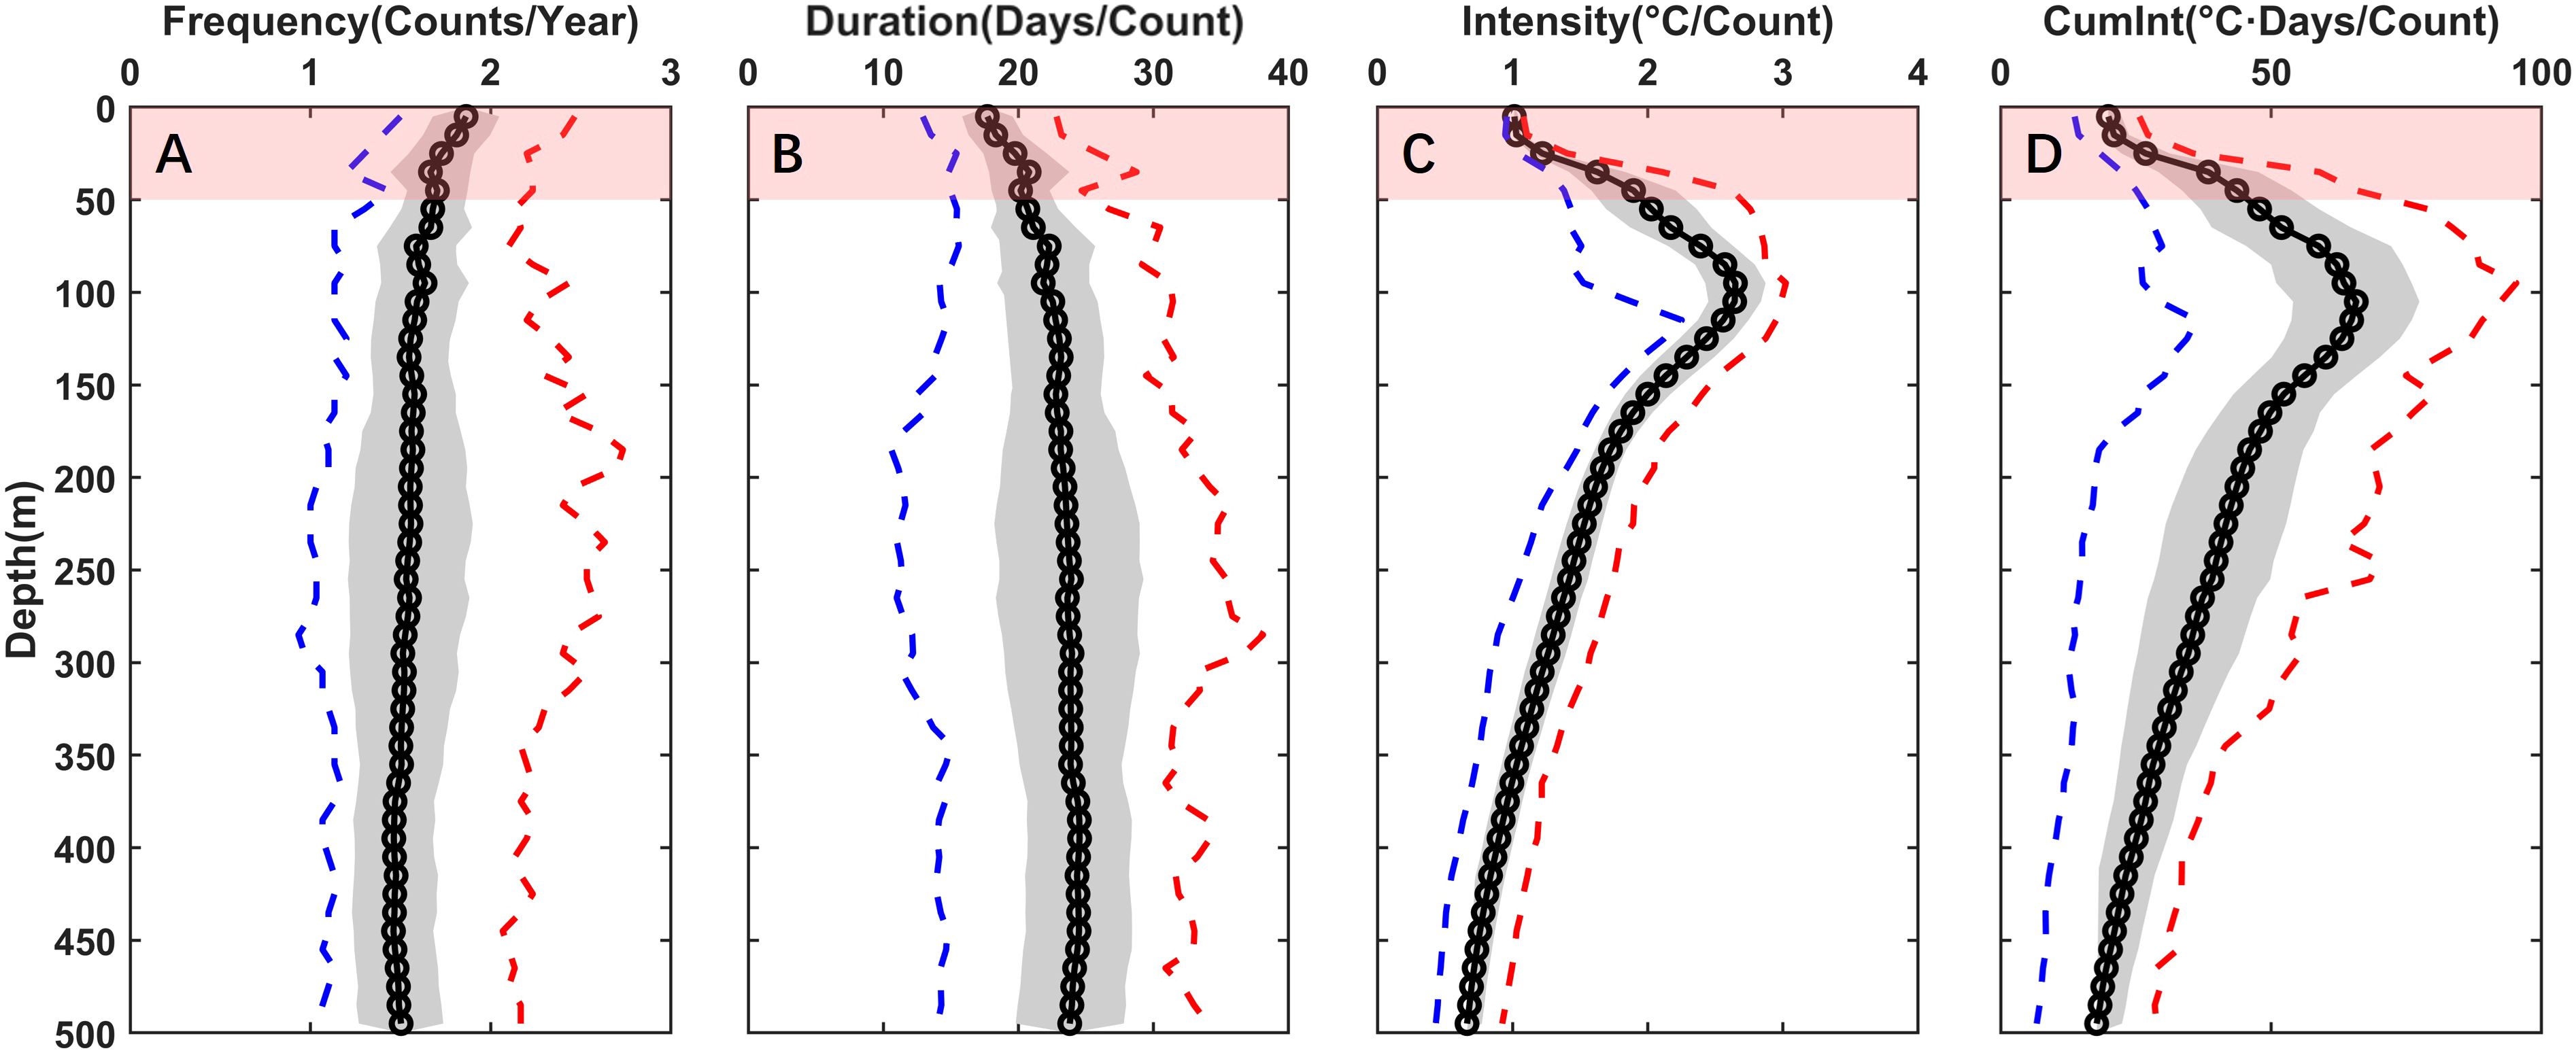
Figure 4 Vertical spatial distribution of the full-time domain SSMHWs quantification indicators in the Xisha area from 1992 to 2021 at depths of 0-500m. (A) Frequency, (B) Duration, (C) Intensity, (D) Cumulative Intensity. The red and blue dashed and black circled lines represent the curve of maximum, minimum and average value changes, respectively. The grey area represents the standard deviation interval.
This study investigated the characteristics of SSMHWs in the Xisha area in terms of seasonal and decadal variations. The study region exhibited significant seasonal variability in SSMHWs, with a peak in May when the average TCumInt reaches 5.38°C·Days/Month (Figure 5A). However, an examination of the changes across each depth layer showed that May does not present the highest average intensity for SSMHWs within the mixed-layer depth, highlighting the seasonal difference between shallow and deep SSMHWs. There was a significant upward trend in the TCumInt of SSMHWs in the region from 1992 to 2021, with an average annual increase of 1.53°C·Days/Year (Figure 5B). Notably, except for the abnormally warm water event in the shallow waters of the SCS in 1998, the impact of SSMHWs in the Xisha area was relatively weak before 2008. However, beginning in 2008, and particularly in the years 2012, 2014, 2020, and 2021, the intensity of SSMHWs had significantly increased. Although the TCumInt of SSMHWs in 1998 was high, the abnormal increase in temperature was primarily concentrated in the shallower waters above 100 m, accounting for approximately 65.95%. Over the initial 15 years, the average TCumInt for regions beyond 200 m constituted roughly 24.59%, escalating to about 43.70% in the next 15 years, an approximate 77.71% increase, indicating a trend of SSMHWs shifting towards deeper waters in the Xisha area. The years that exceed the mean TCumInt with in full vertical depth of 50.16°C·Days/Year were 1998, 2008, 2010, 2012, 2014, 2020, and 2021. Most of the above years were in the period when Nino3.4 was negative (Figure 5C). Especially after 2000, the correlation coefficient between TotalCumInt and Nino3.4 is -0.417, and the p value in t-test was 0.067, indicating that the La Niña may lead to an intensification of SSMHWs in the Xisha area. However, there was often a strong El Niño before a La Niña year, and due to the delay in the influence of large-scale climate conditions, the specific related mechanisms require further research.
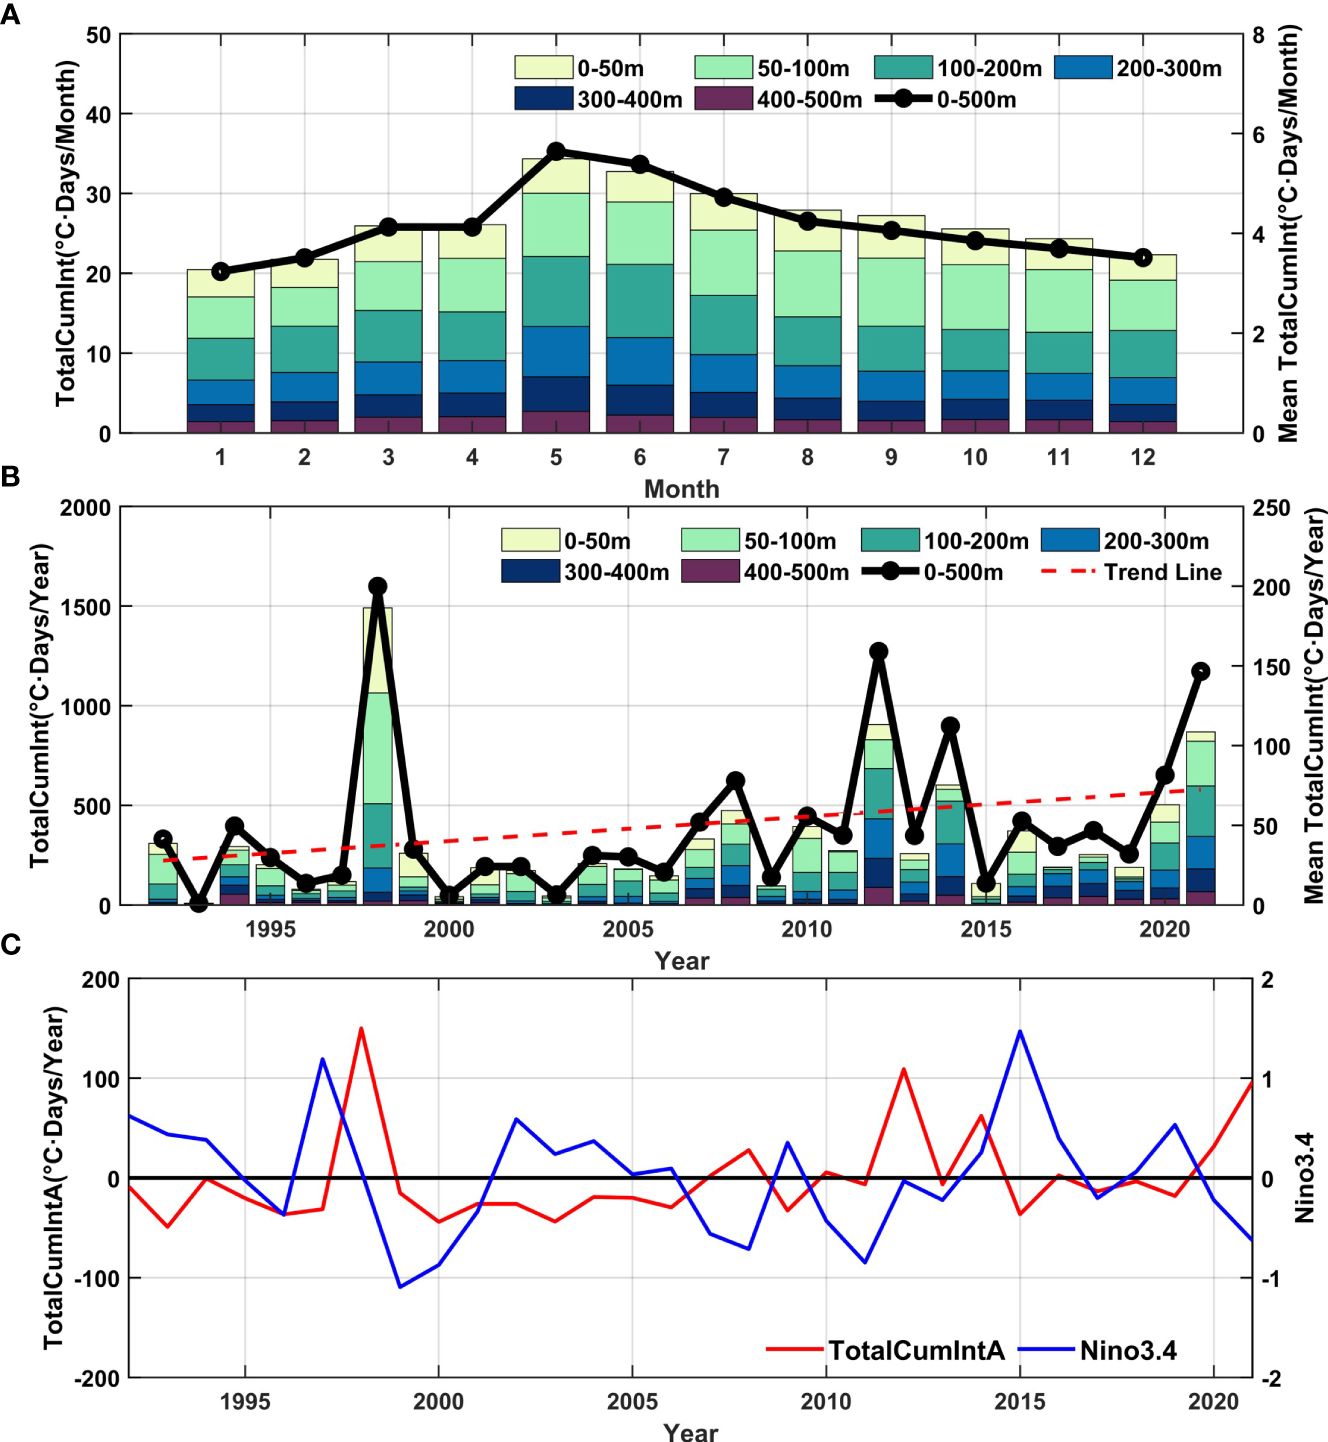
Figure 5 Temporal variations of SSMHWs in the Xisha area from 1992 to 2021. (A) Monthly variations, (B) Interannual variations, (C) The relationship between TotalCumInt anomaly and Nino3.4. Bars and the black dotted line represent the average TotalCumInt within various depth intervals and its average over the upper 500 m in (A, B), respectively. The red dashed line represents the trend line in (B). The red and blue solid lines represent TotalCumIntA and Nino3.4 in (C), respectively.
3.2 Characteristics of intense SSMHW events
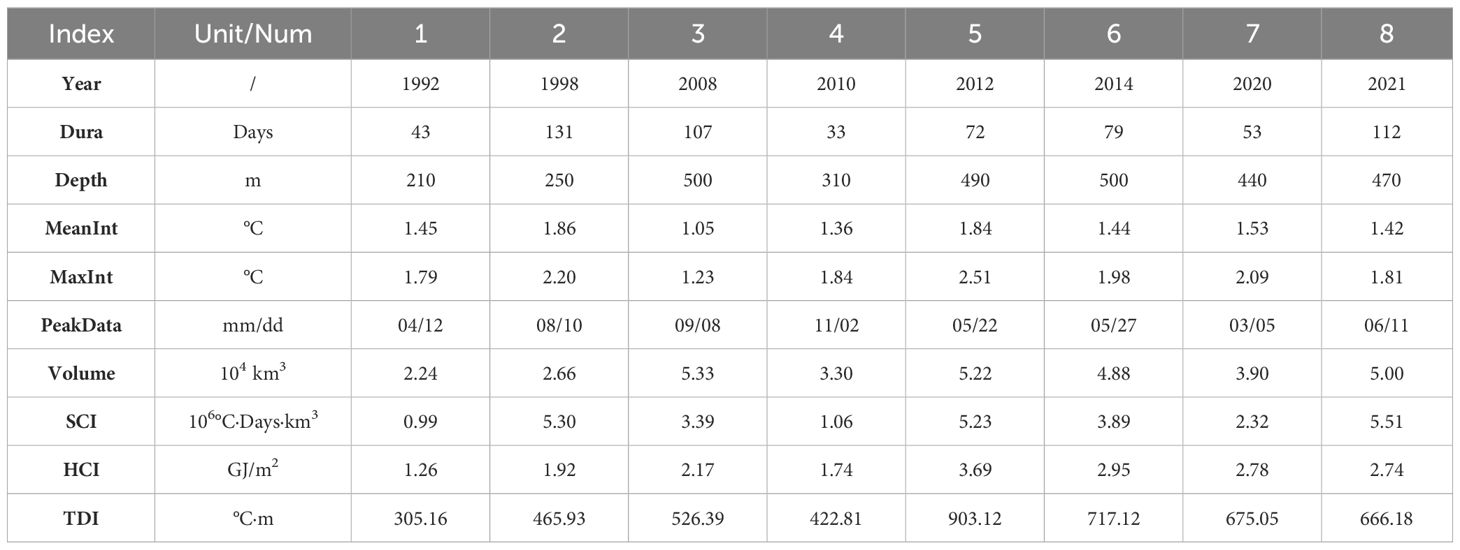
This study adopted the previously described block-based SSMHW identification method to examine the spatial extent of SSMHWs, identifying a total of 208 SSMHW events in the Xisha area from 1992 to 2021. Figure 6 illustrates the timing, central depth, Int, SCI, and other pertinent details, encompassing the vertical spatial and temporal scope of the top eight most intense events. Refer to Table 1 for details.

Figure 6 Spatiotemporal distribution of the block-based identification SMHW events. Circles represent SMHW events, with the area, fill colors and center depth representing the SCI, MaxInt and event’s central depth, respectively. Black dashed boxes represent the eight events occurring in 1992, 1998, 2008, 2010, 2012, 2014, 2020, and 2021, respectively. The black dashed box’s horizontal and vertical lengths represent the event’s temporal range and vertical spatial extent, respectively.
Figure 6 showed that among all events, the event spanning from May 25 to September 13, 2021, highlighted with the highest SCI, lasting 112 days, with MeanInt of 1.42°C, MaxInt of 1.81°C, covering an area of approximately 5×10⁴ km3, and reaching a staggering SCI of 5.51×10⁶°C·Days·km3. The event in 2012 recorded the highest MaxInt of 2.51°C, despite its shorter duration and slightly lower SCI of 5.23×10⁶°C·Days·km3, demonstrating extremely destructive. Notably, the event in 1998, despite its smaller depth range, exhibited an exceptionally high SCI, potentially linked to an extraordinary warm water event in the SCS influenced by the ENSO that year (Kuo et al., 2004). Our research focused on these eight most intense events, analyzing their commonalities to explore the main driving factors.
According to the MHW intensity categories classification method proposed by Hobday et al. (2018), we identified the difference between the threshold and the baseline as the basic magnification, and then the ratio of Int to the base magnification was used to distinguish the intensity levels of MHWs. The ratios of 1 to 1.5, 1.5 to 2, 2 to 2.5, 2.5 to 3 and greater than 3 are the ‘Weak’, ‘Moderate’, ‘Strong’, ‘Severe’ and ‘Extreme’ levels, respectively. Finally, the ratios corresponding to the intensity levels of each pixel in the water column were averaged to obtain the horizontal distribution results. The identified intense SSMHW events on average surpassed the ‘Strong’ grade, affecting nearly the entire study area, especially the central region where reached the ‘Severe’ intensity grade during the 2012 and 2020 events (Figure 7).
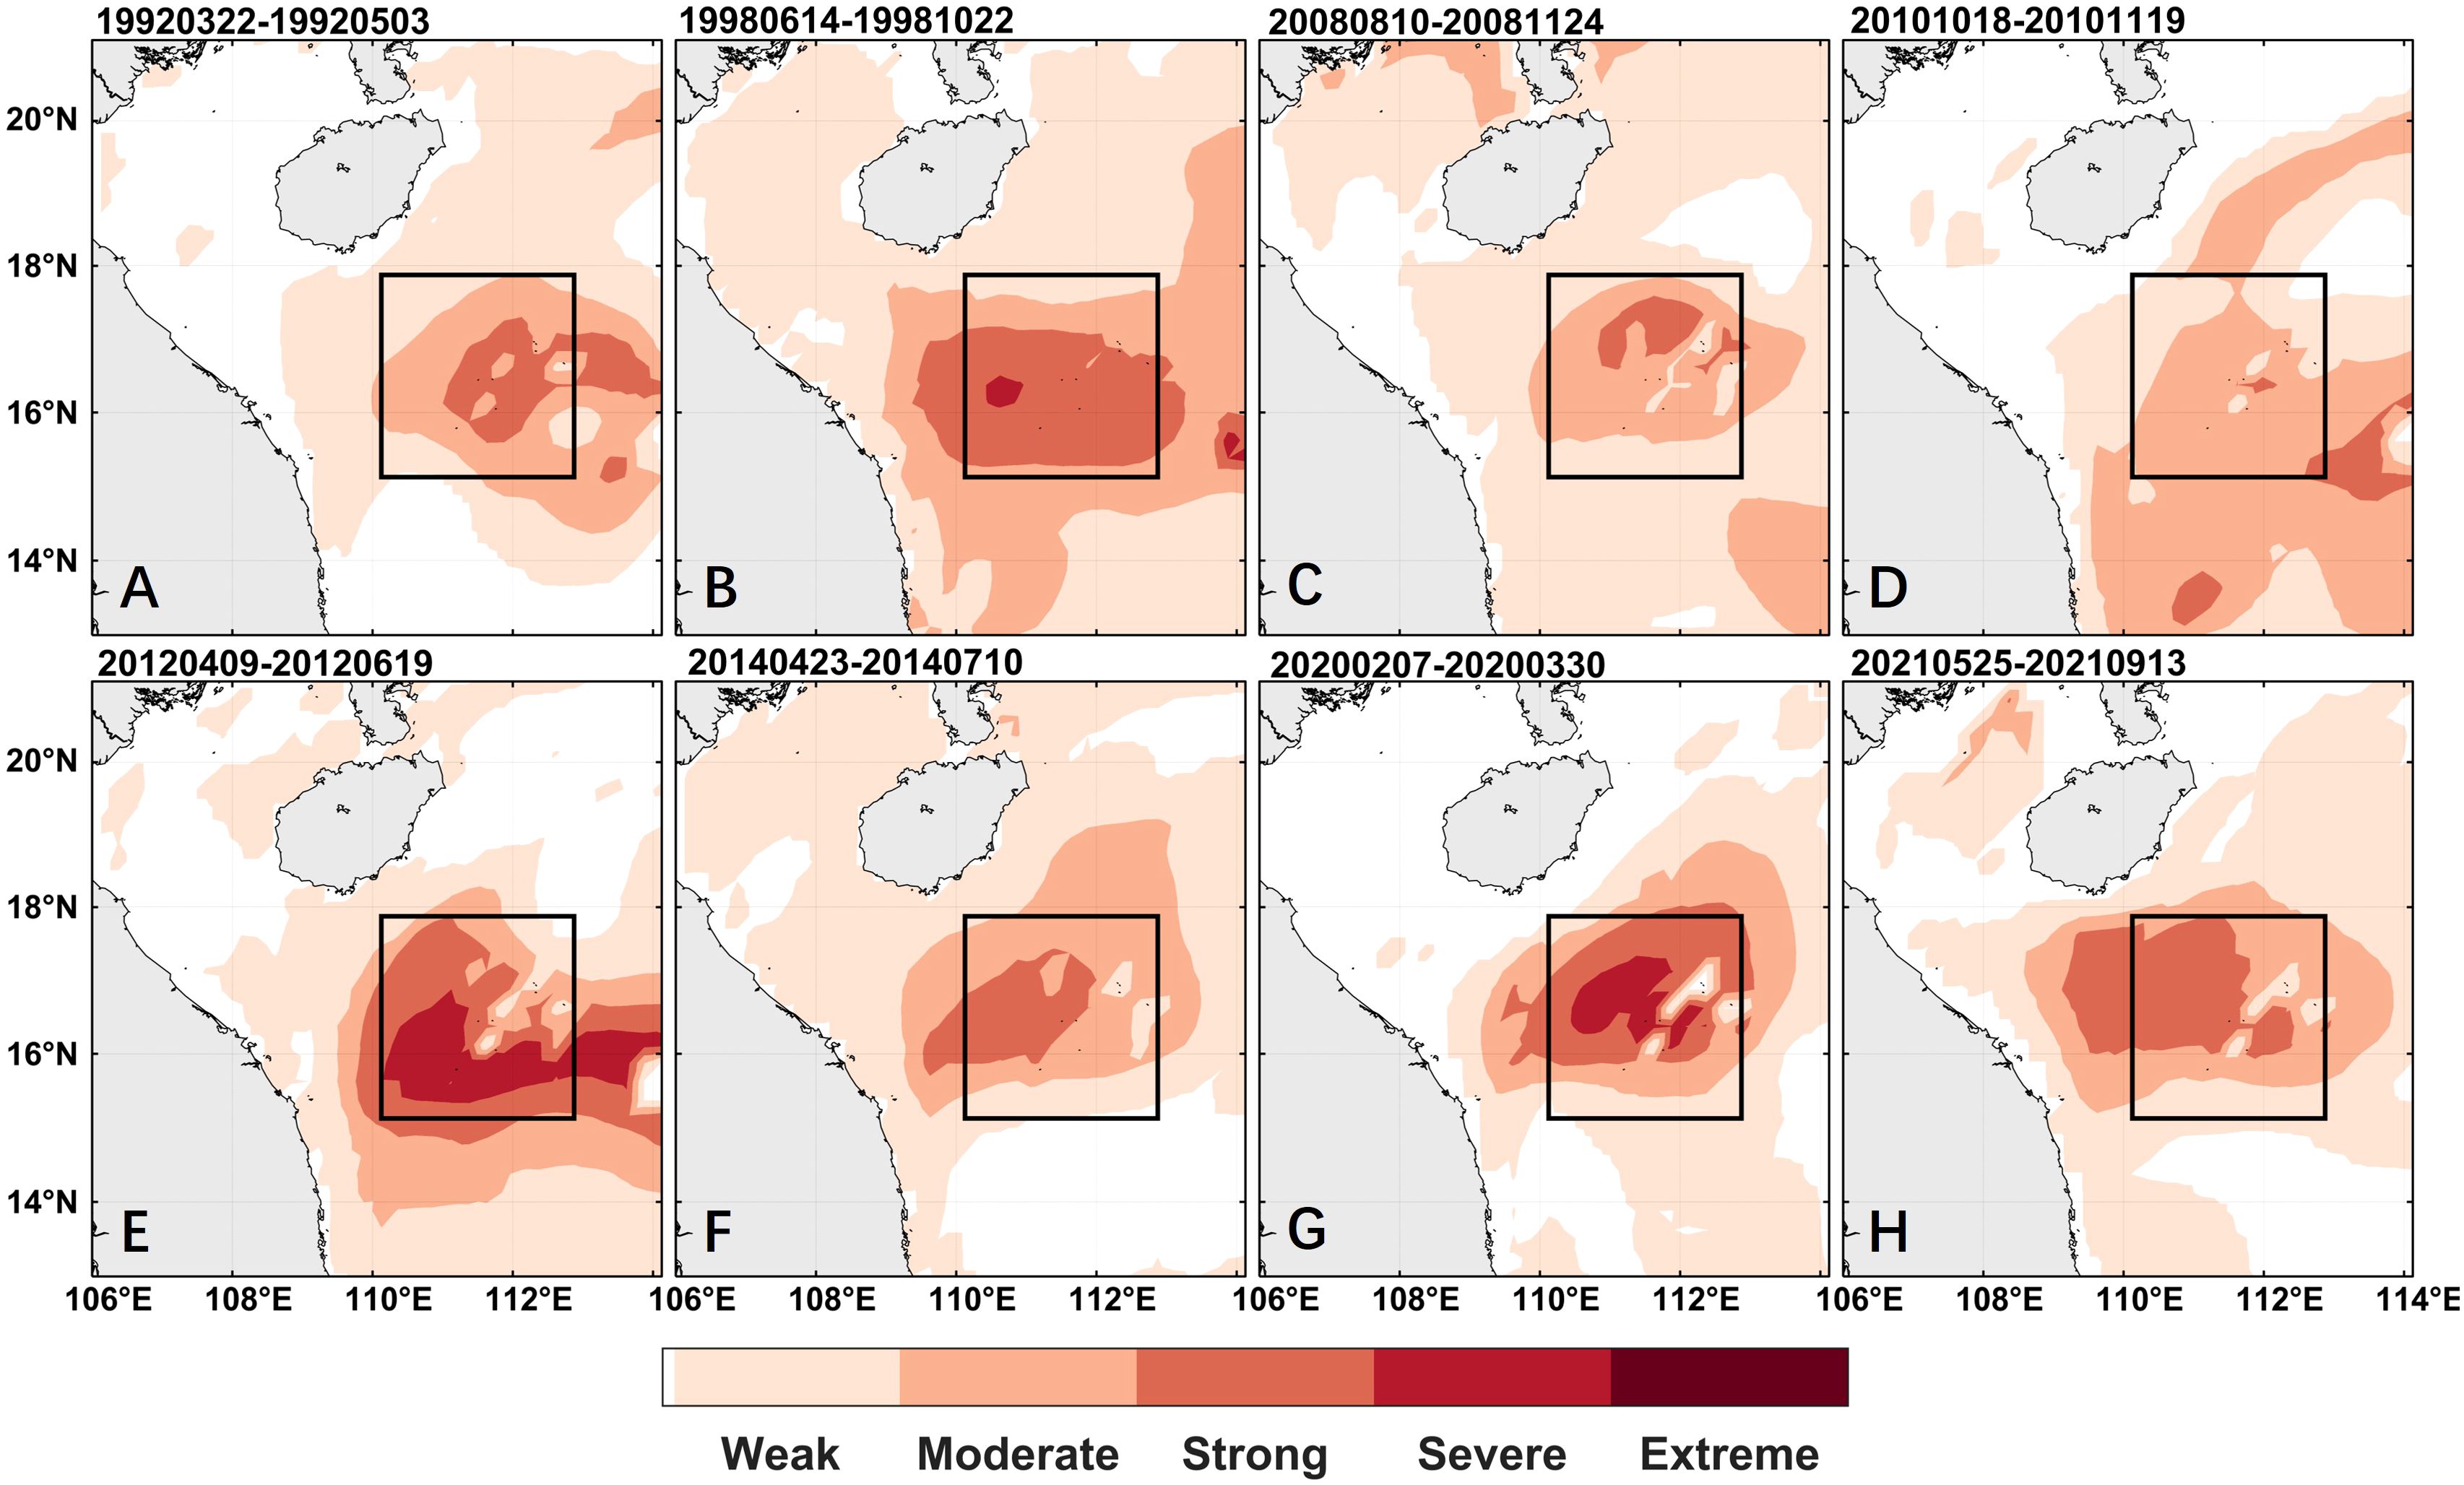
Figure 7 Horizontal distribution of intensity grades during the occurrence of selected intense SSMHW events. (A) 1992, (B) 1998, (C) 2008, (D) 2010, (E) 2012, (F) 2014, (G) 2020, (H) 2021. The black box represents the study region. Colors represent the intensity grades.
Analysis of vertical temperature anomalies during these SSMHW events reveals that, excluding the 1998 event with its prominent surface layer anomaly, the peak anomalies in other events predominantly occurred in subsurface layers (Figure 8). Notably, the 2014 and 2020 events displayed anomalous surface cooling. This indicated that signals in SST do not fully reflect the occurrence of SSMHWs. The vertical temperature anomaly distribution of the selected intense SSMHWs seems like the typical vertical temperature anomaly distribution of warm mesoscale eddies. This indicated a potential correlation between warm mesoscale eddies and intense SSMHWs in the Xisha area.
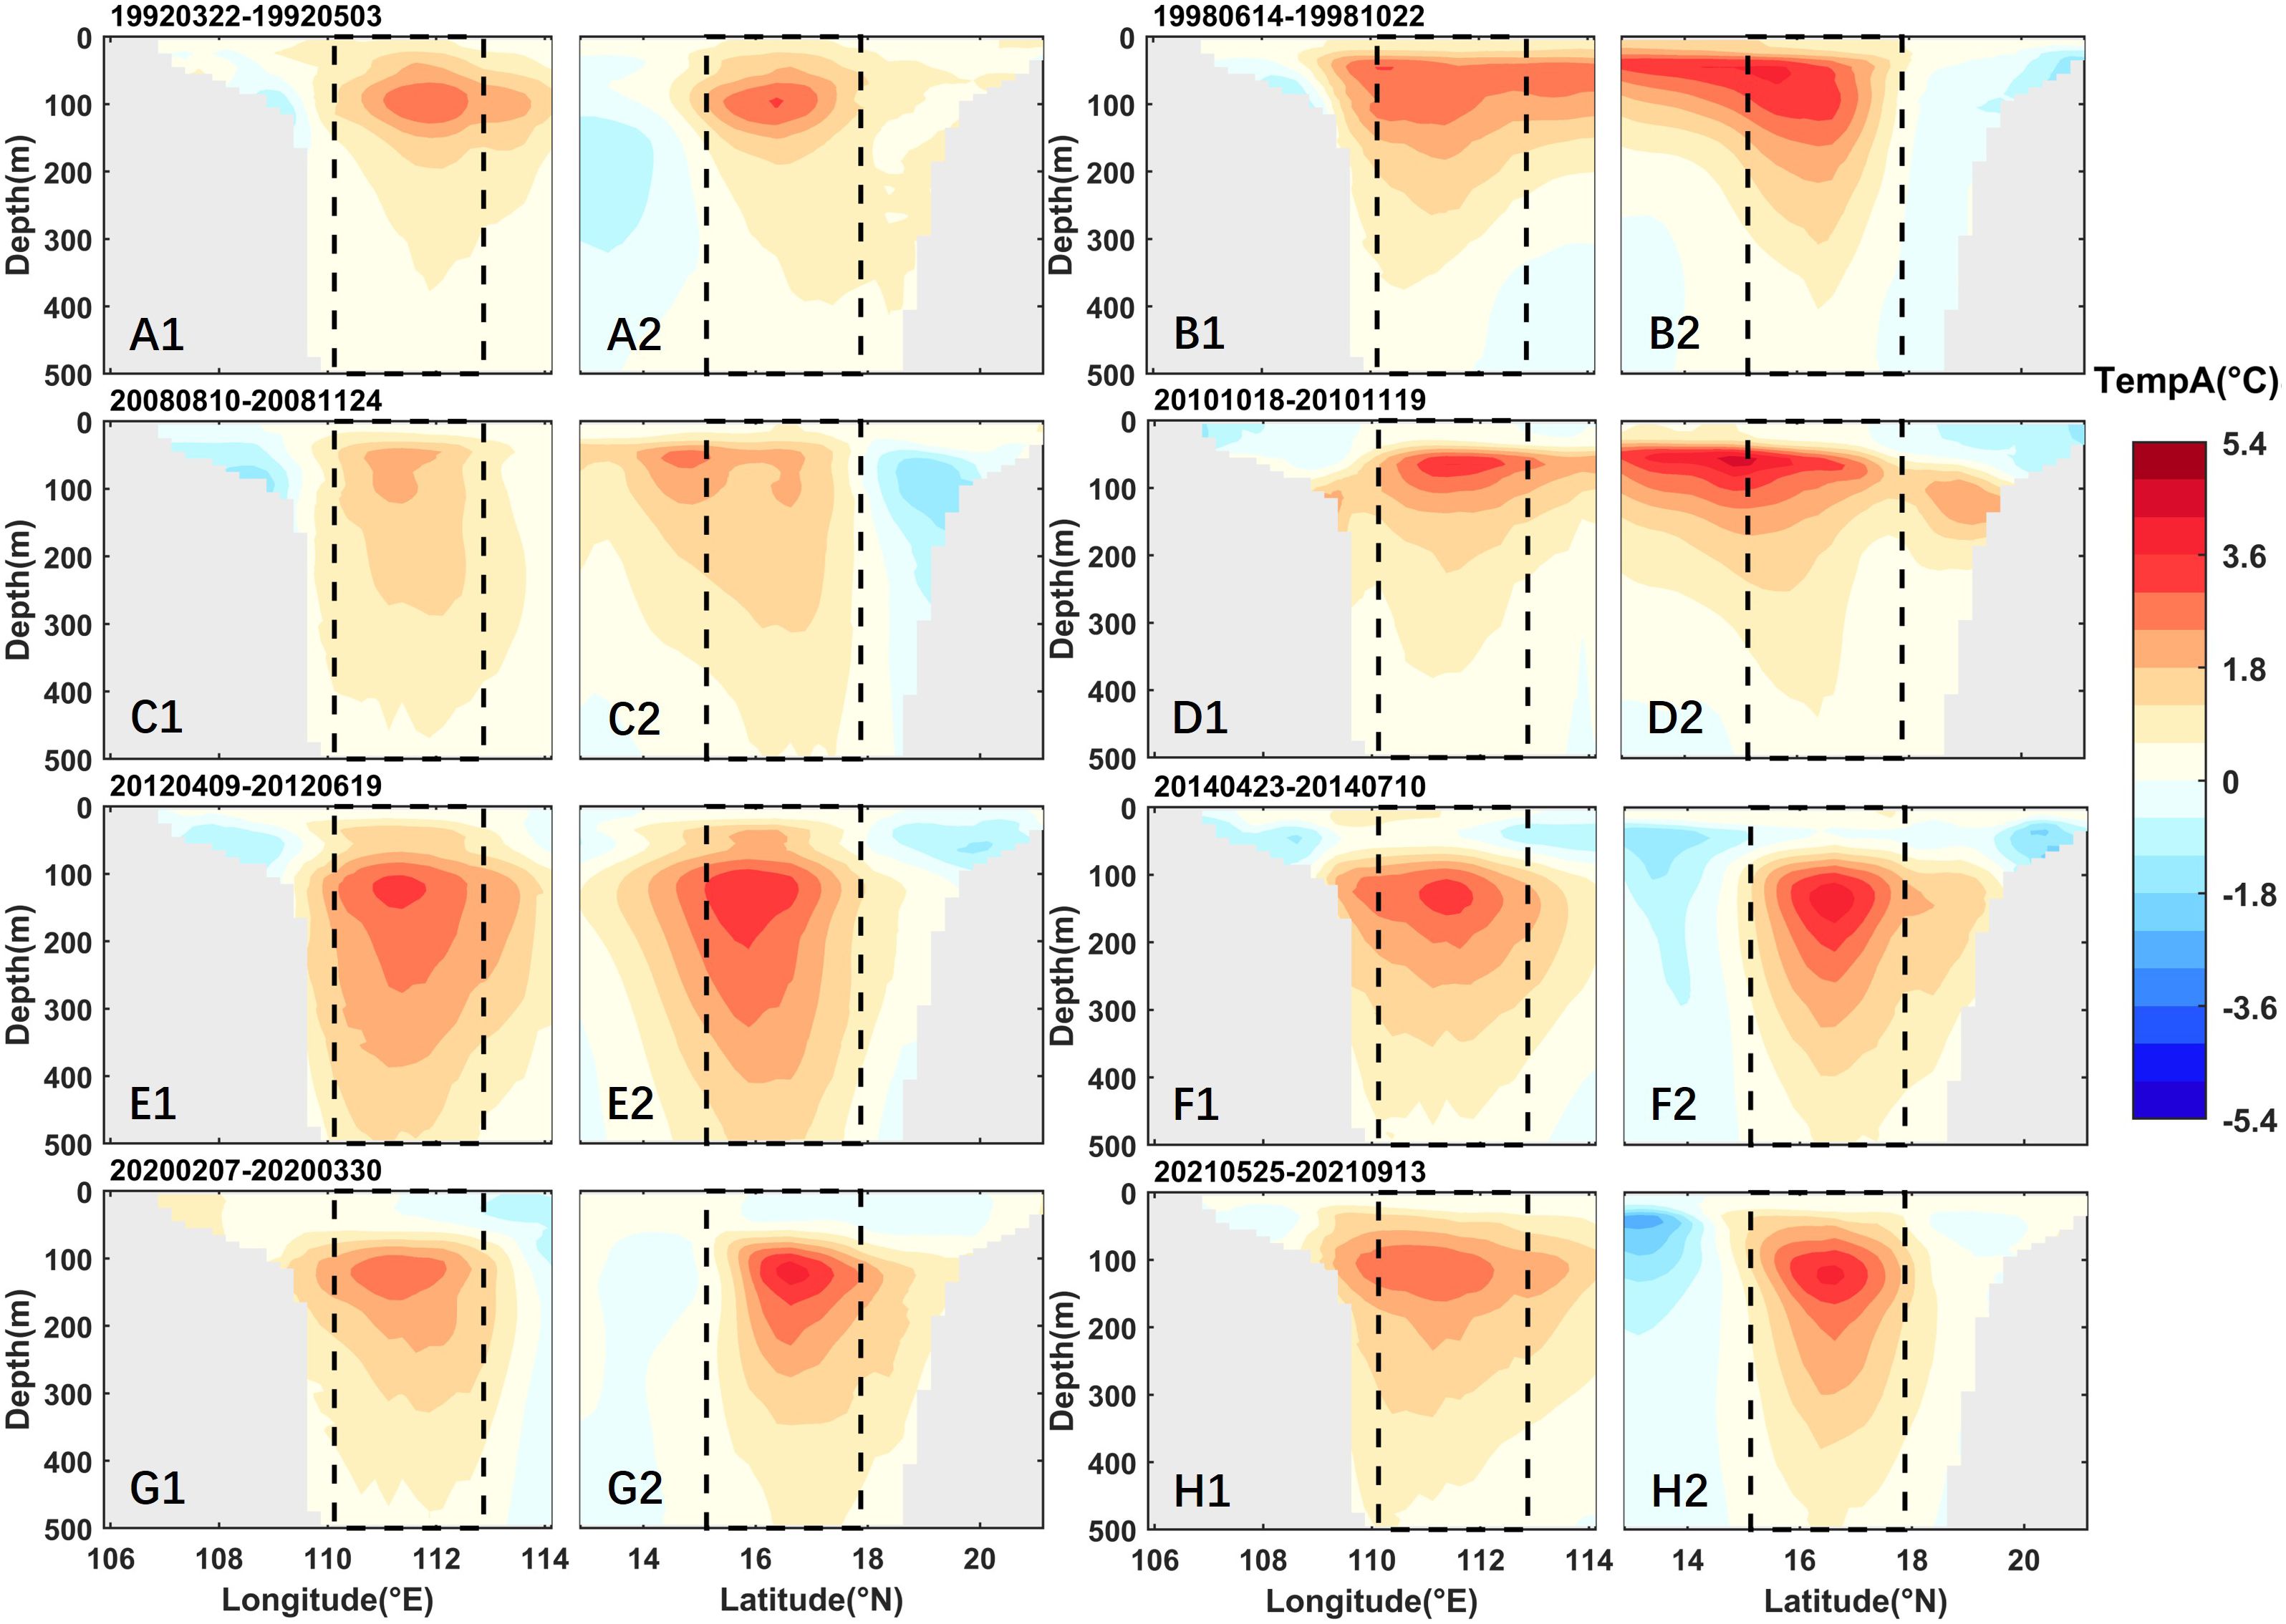
Figure 8 Vertical distribution of temperature anomalies during the occurrence of selected intense SSMHW events. (A–H) as shown in the previous figure, with (1) representing the zonal cross-section, (2) representing the meridional cross-section. The dashed box, the grey area and colors stand for the spatial extent of the study region, the continental shelf land and temperature anomalies, respectively.
3.3 Driving mechanisms of SSMHW events
3.3.1 Ocean heat budget
The growth and decay phases of an event are defined, respectively, as the periods from its onset to peak intensity and from peak intensity to its end. Through analyzing the heat budget equation and disregarding the residual term, it is found that advection heat flux primarily influences both phases of intense SSMHW events (Figure 9). The correlation coefficient of advection heat flux to changes in OHC was approximately 0.65 and 0.61 in growth and decay phases, with p-values significantly below 0.05 as determined by t-tests. During the growth phase, except for the event in 2020, which was mainly influenced by the residual term, the other events were predominantly driven by advection heat flux. In the decay phase, except for the events in 1992 and 2008, which were mainly influenced by the residual term, the other events were also primarily driven by advection heat flux. These findings indicated that advection heat flux played a decisive role in the development of intense SSMHW events. The influence of the residual term on the change in OHC within the heat budget equation is within acceptable limits. In summary, future research should prioritize advection heat transport as the key factor and tentatively speculate that oceanic dynamic mechanisms, such as current anomalies or mesoscale eddies, might act as the main drivers.
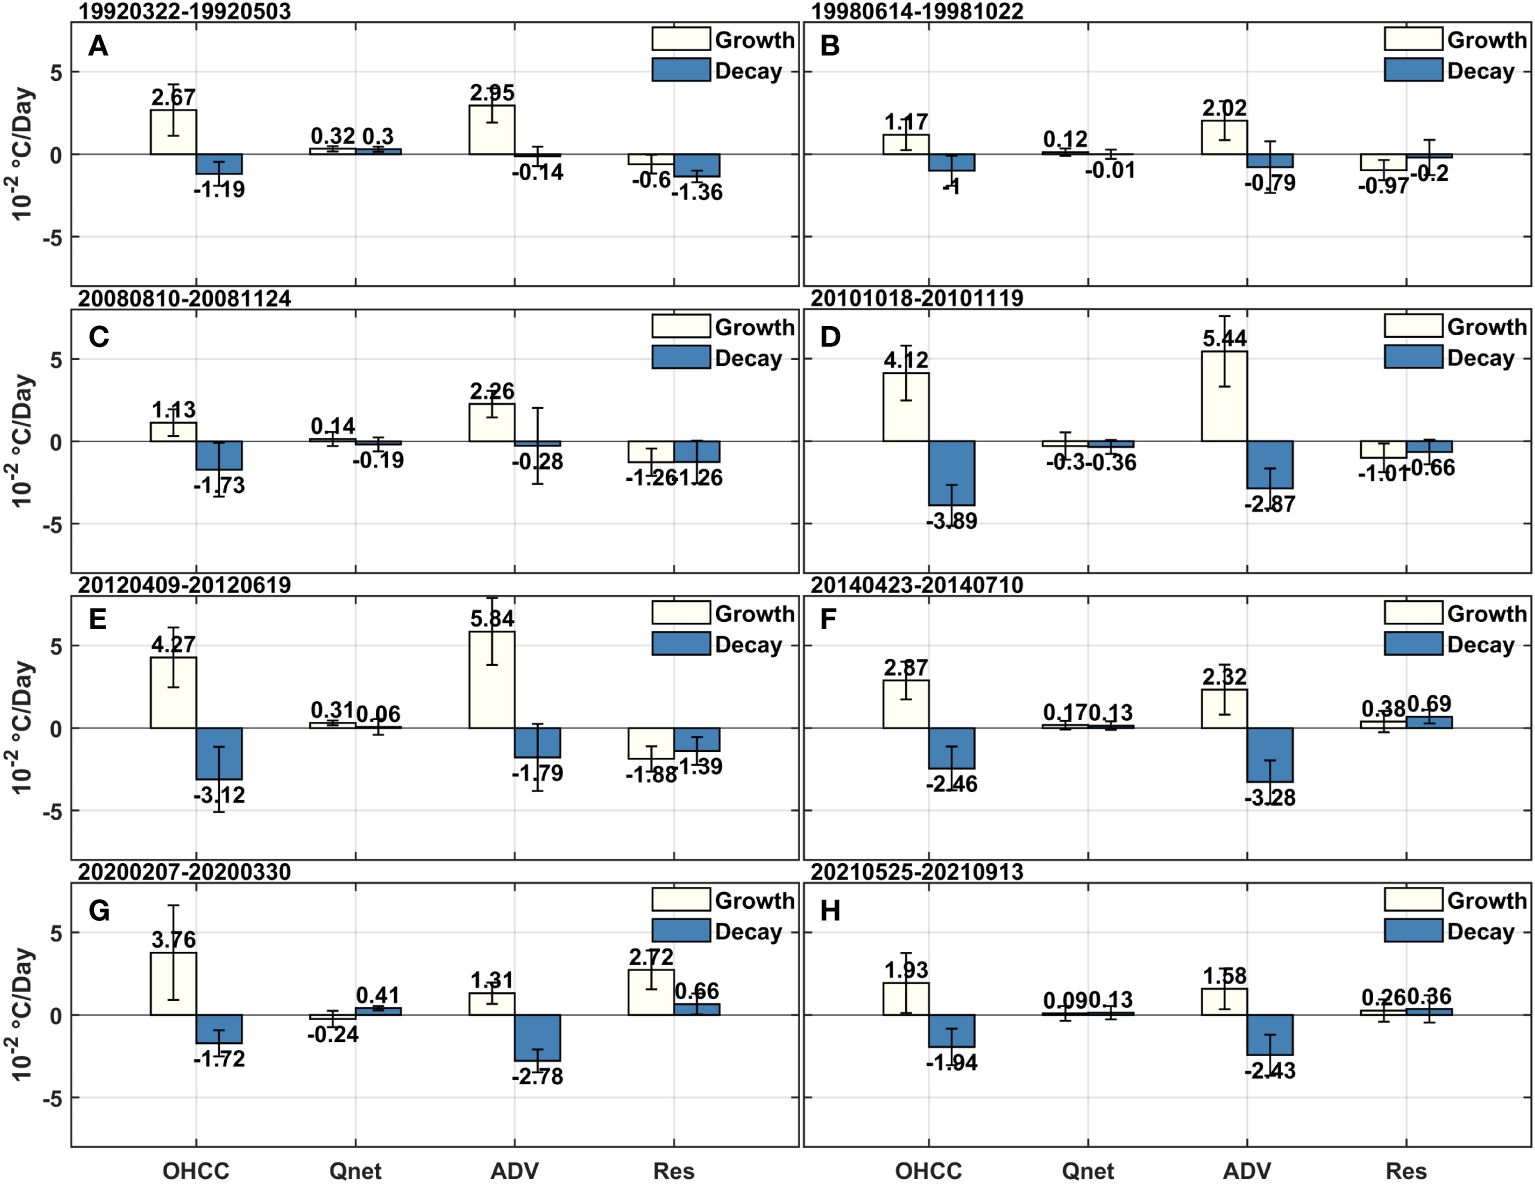
Figure 9 (A–H) The ocean heat budget for the intense SSMHW events in the grow and decay stages of each event. The light and dark colors represent the growth and decay phase, respectively. Bars and the black range line stand for average values and standard deviation, respectively. OHCC, Qnet, ADV, Res represent the OHC changes, net air-sea heat flux, advection heat flux and residual item, respectively.
3.3.2 Effects of mesoscale eddies on SSMHWs
To further validate the effect of advection heat flux on the evolution of the intense SSMHW, we analyzed the SSHA and sea surface current anomalies during the eight intense SSMHW events (Figure 10). During the eight SSMHW events, the Xisha area experienced significant increases in SSHA and noticeable current anomalies, indicating the crucial role of warm mesoscale eddies in driving intense SSMHWs in this region (Figure 10). It showed that mesoscale eddies nearly enveloped the entire study area during periods of intense SSMHWs, indicating a strong relationship between the occurrence of intense SSMHWs and warm mesoscale eddies. The 2012 event stood out with the highest Int and TDI, marked by the most notable positive SSHA and current velocity anomaly, caused by the warm mesoscale eddy during the corresponding period (Figure 10D). This evidence suggests a correlation between the intensity of SSMHWs and the intensity of warm mesoscale eddies.
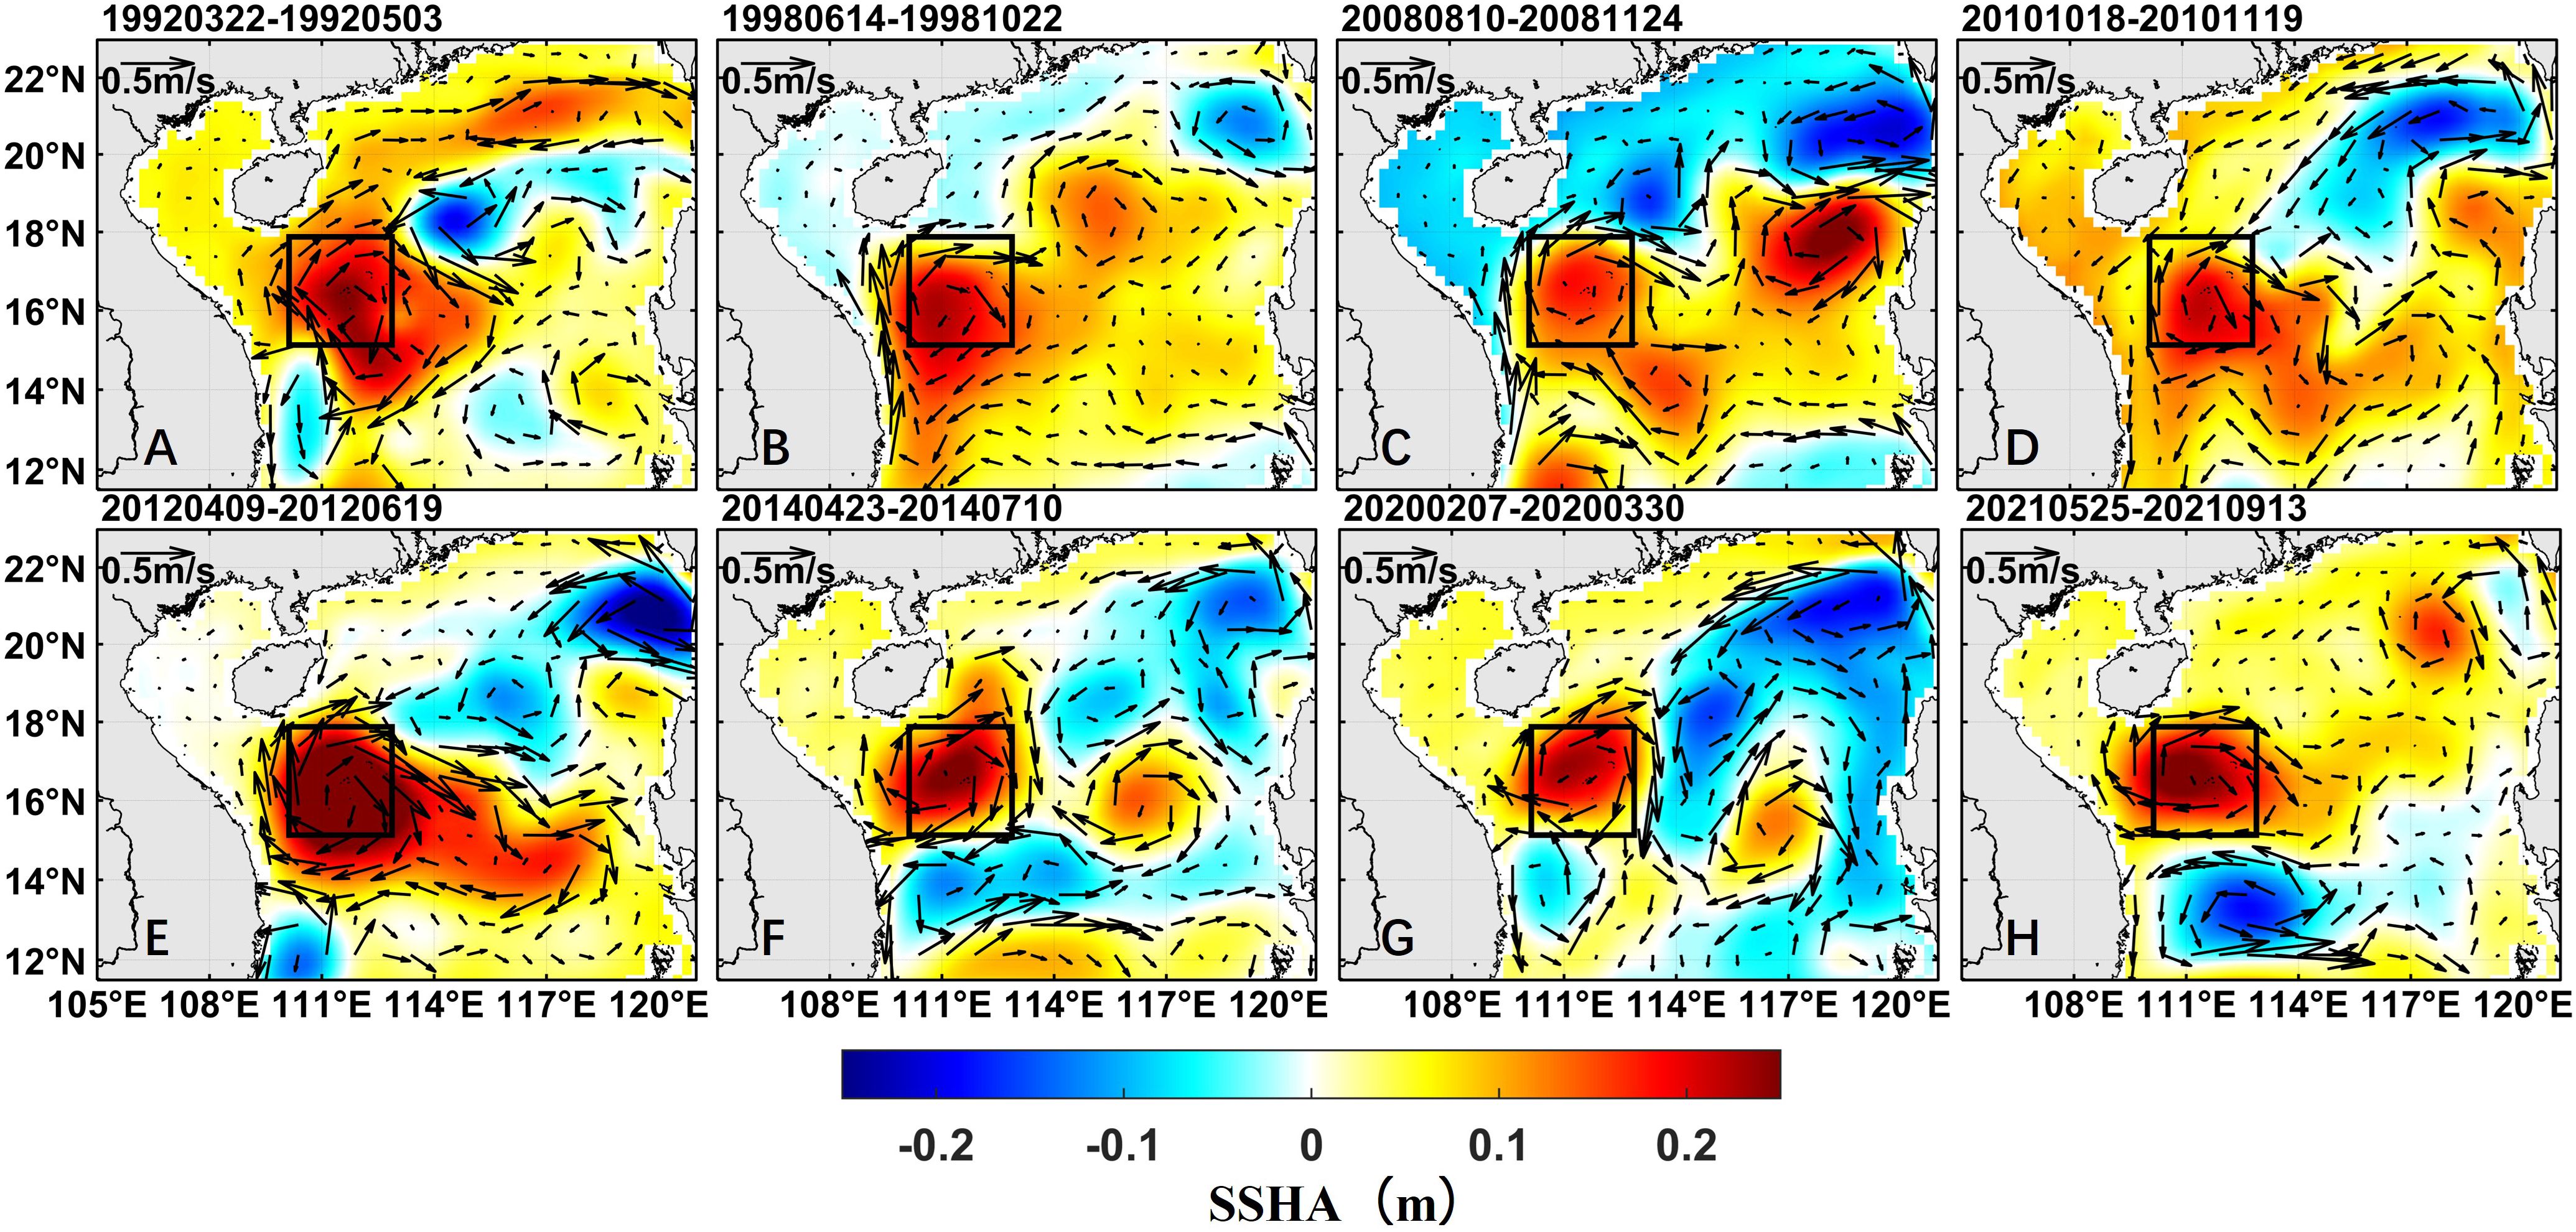
Figure 10 (A–H) SSHA and surface sea current anomalies associated with typical events. The black box represents the study area. Arrows represent the surface current anomalies. Colors stand for SSHA.
In order to investigate the relationship between the SSMHW and SSHA, we compared the correlation between the SSMHW indices, such as mean and maximum Int, HCI and TDI, and SSHA, using various SCI intensity of SSMHWs (Figure 11). It suggests that SSMHW events with higher SCI exhibit a stronger correlation between their maximum or mean Int and SSHA, but the correlation values decline dramatically with more and more weak SSMHW taking into account. However, instead of Int, the correlation between HCI or TDI and SSHA remains above 0.6. This suggests that it is more appropriate to use HCI or TDI to quantify the strength of SSMHW for subsequent mechanism research (Figure 11). We used the TDI stands for the intensity of SSMHW as following for simplicity.
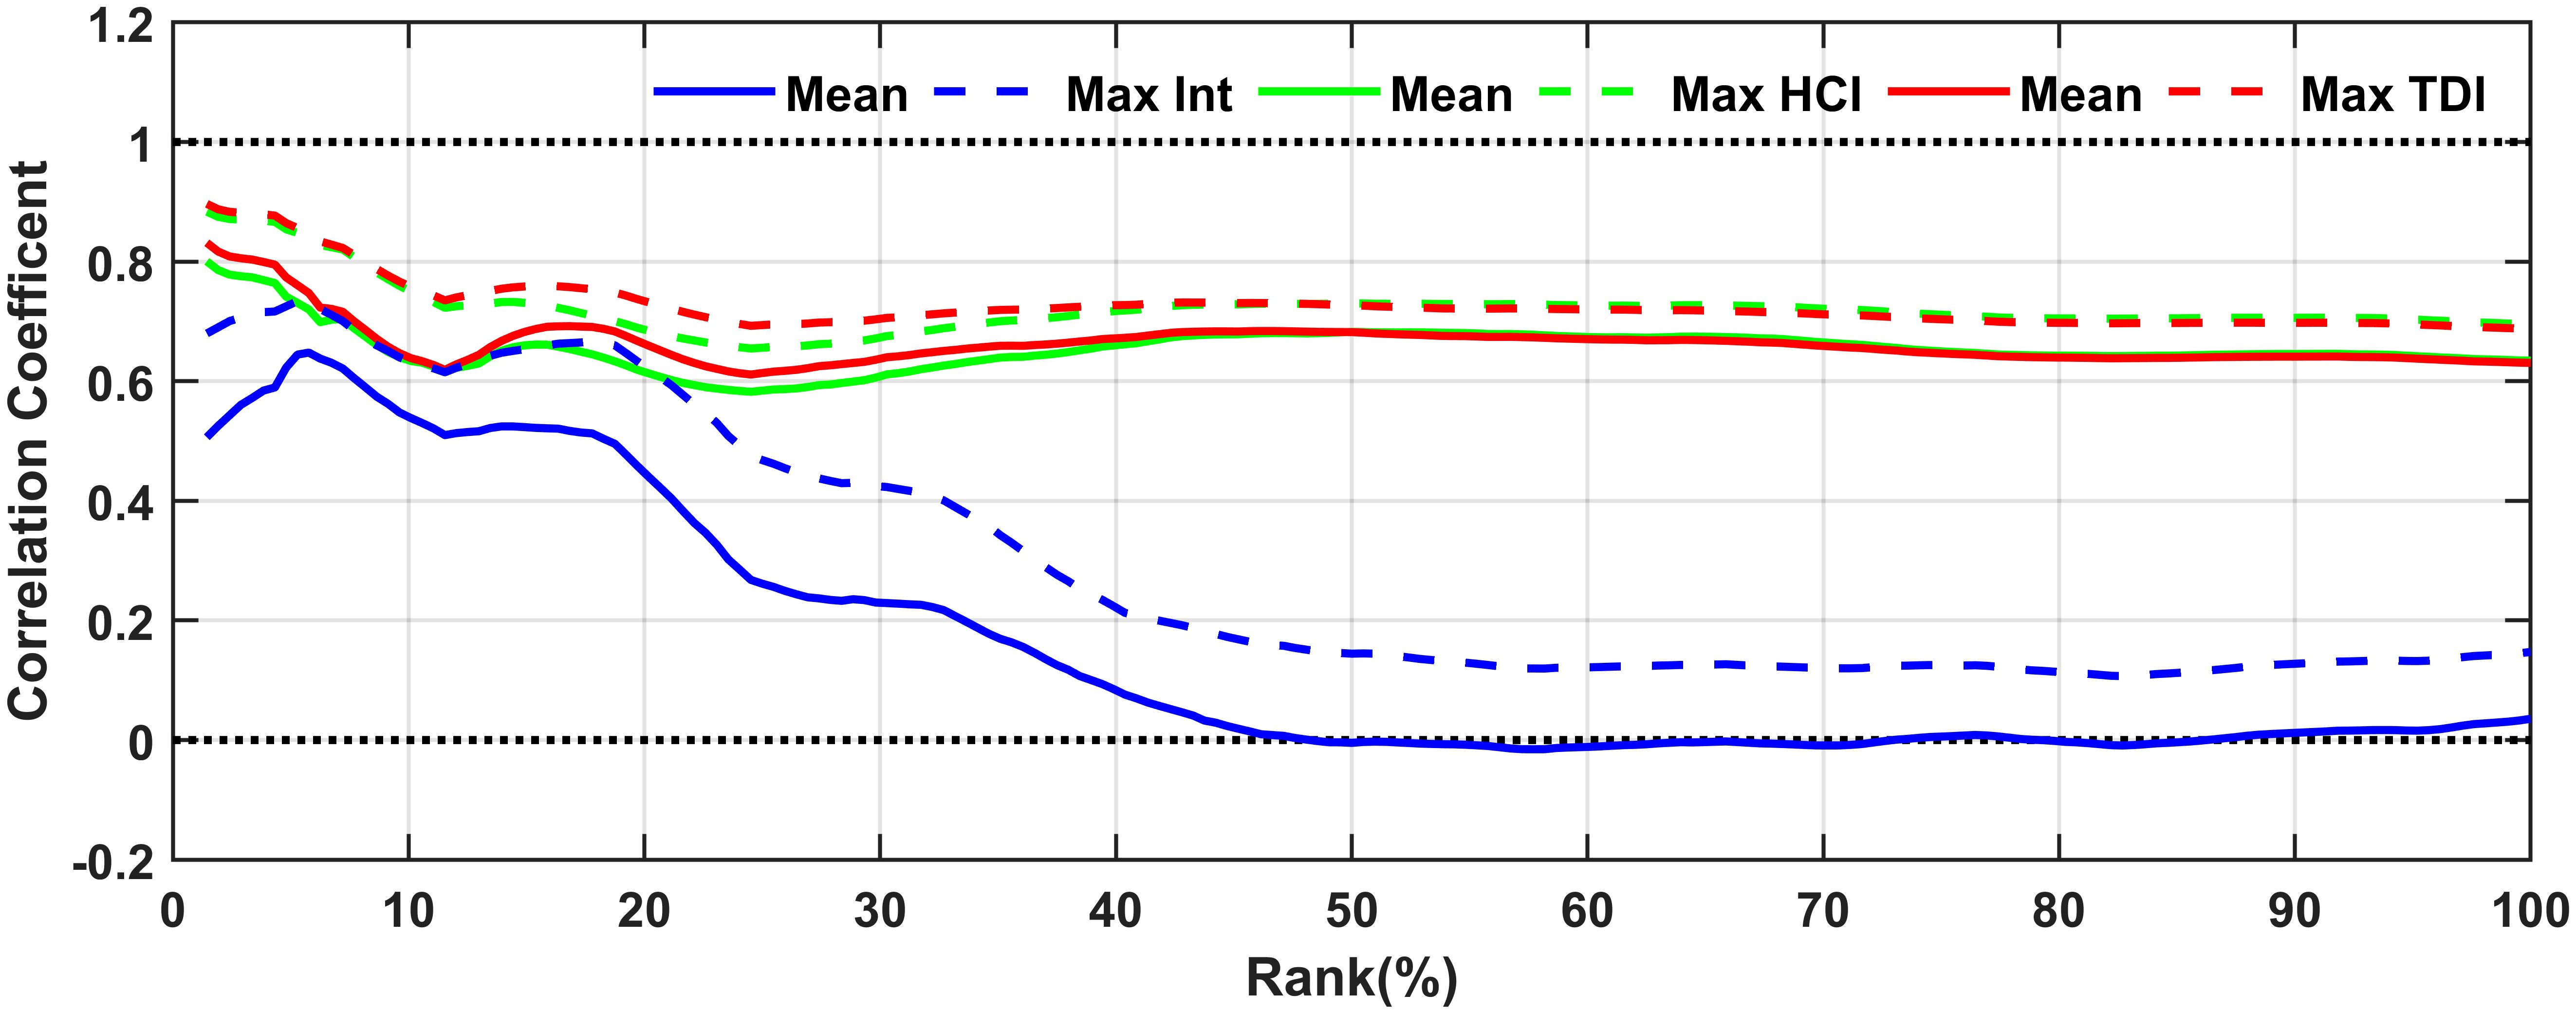
Figure 11 Correlation coefficient between SSHA and intensity indicators of SSMHWs. The dashed and solid lines represent the correlation coefficients among the maximum and average values, respectively. The blue, green and red lines stand for Int, HCI and TDI, respectively. Rank value represents all events ranked above a certain percentage.
Based on the findings presented above, warm mesoscale eddies are likely the primary drivers of intense SSMHWs in the Xisha area, with a discernible correlation between the intensities of both phenomena. To further verify this relationship, this study carefully selected 18 similar events from the past 30 years as expanded research targets. All selected SSMHWs were significantly influenced by warm mesoscale eddies, observed by surface current fields and sea surface height anomalies. The intensity indicators of warm mesoscale eddies, including amplitude, vorticity, and EKE, demonstrated a significant correlation with the TDI of SSMHWs, with average correlation coefficients of 0.8576, 0.7008, and 0.7415, respectively (Figures 12B–D). The correlation coefficient of 0.9112 between average SSHA and TDI indicates a stronger relationship compared to the intensity of warm mesoscale eddies (Figure 12A). In summary, in the Xisha area, the intensity of SSMHWs is enhanced by strengthening of the warm mesoscale eddies.
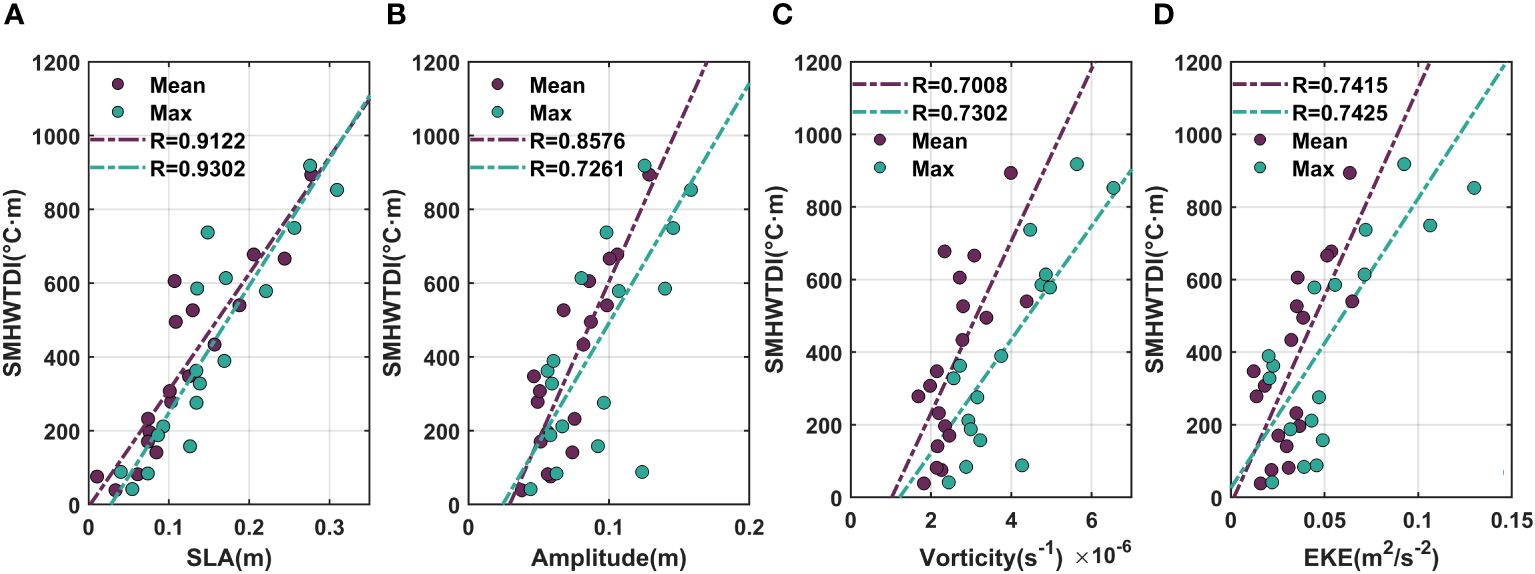
Figure 12 Correlation between the TDI of SSMHWs affected by mesoscale eddies and the intensity of mesoscale eddies. (A) the correlation between SSHA and TDI, (B) Mesoscale eddy amplitude, (C) Mesoscale vorticity, (D) Eddy kinetic energy. The dashed line stands for the fitting line, with purple and green representing the correlation between average and maximum values, respectively. R represents the correlation coefficient value.
The studies on the horizontal position relationship between SSMHWs and warm mesoscale eddies show that the area covered by warm mesoscale eddies in the study region gradually expands from their initial appearance to the peak phase, with the average maximum impact area reaching 48% (Figure 13A). Furthermore, from the peak phase through to the end of events, the area’s coverage proportion progressively diminishes. Due to the mesoscale eddy identification method’s tendency to underestimate eddy ranges, the actual proportion of the affected area may be larger (Mason et al., 2014). Specifically, during the 2020 and 2021 SSMHW events, warm mesoscale eddies were observed approaching the study area from the northeast at the onset of the heatwaves, gradually moving southwestward (Figures 13B, C). This movement of warm mesoscale eddies aligns with the findings of Zhang et al., which suggests that the occurrence of strong SSMHWs in the Xisha area is linked to warm mesoscale eddies generated on the west side of the Luzon Strait (Zhang et al., 2022). Further, this study observed that high-intensity SSMHWs consistently occur near these eddies’ locations, suggesting that SSMHWs move westward alongside the warm mesoscale eddies. This observation supports the analysis of the ocean heat budget equation, which identifies advection heat flux from warm mesoscale eddies as the primary driver.
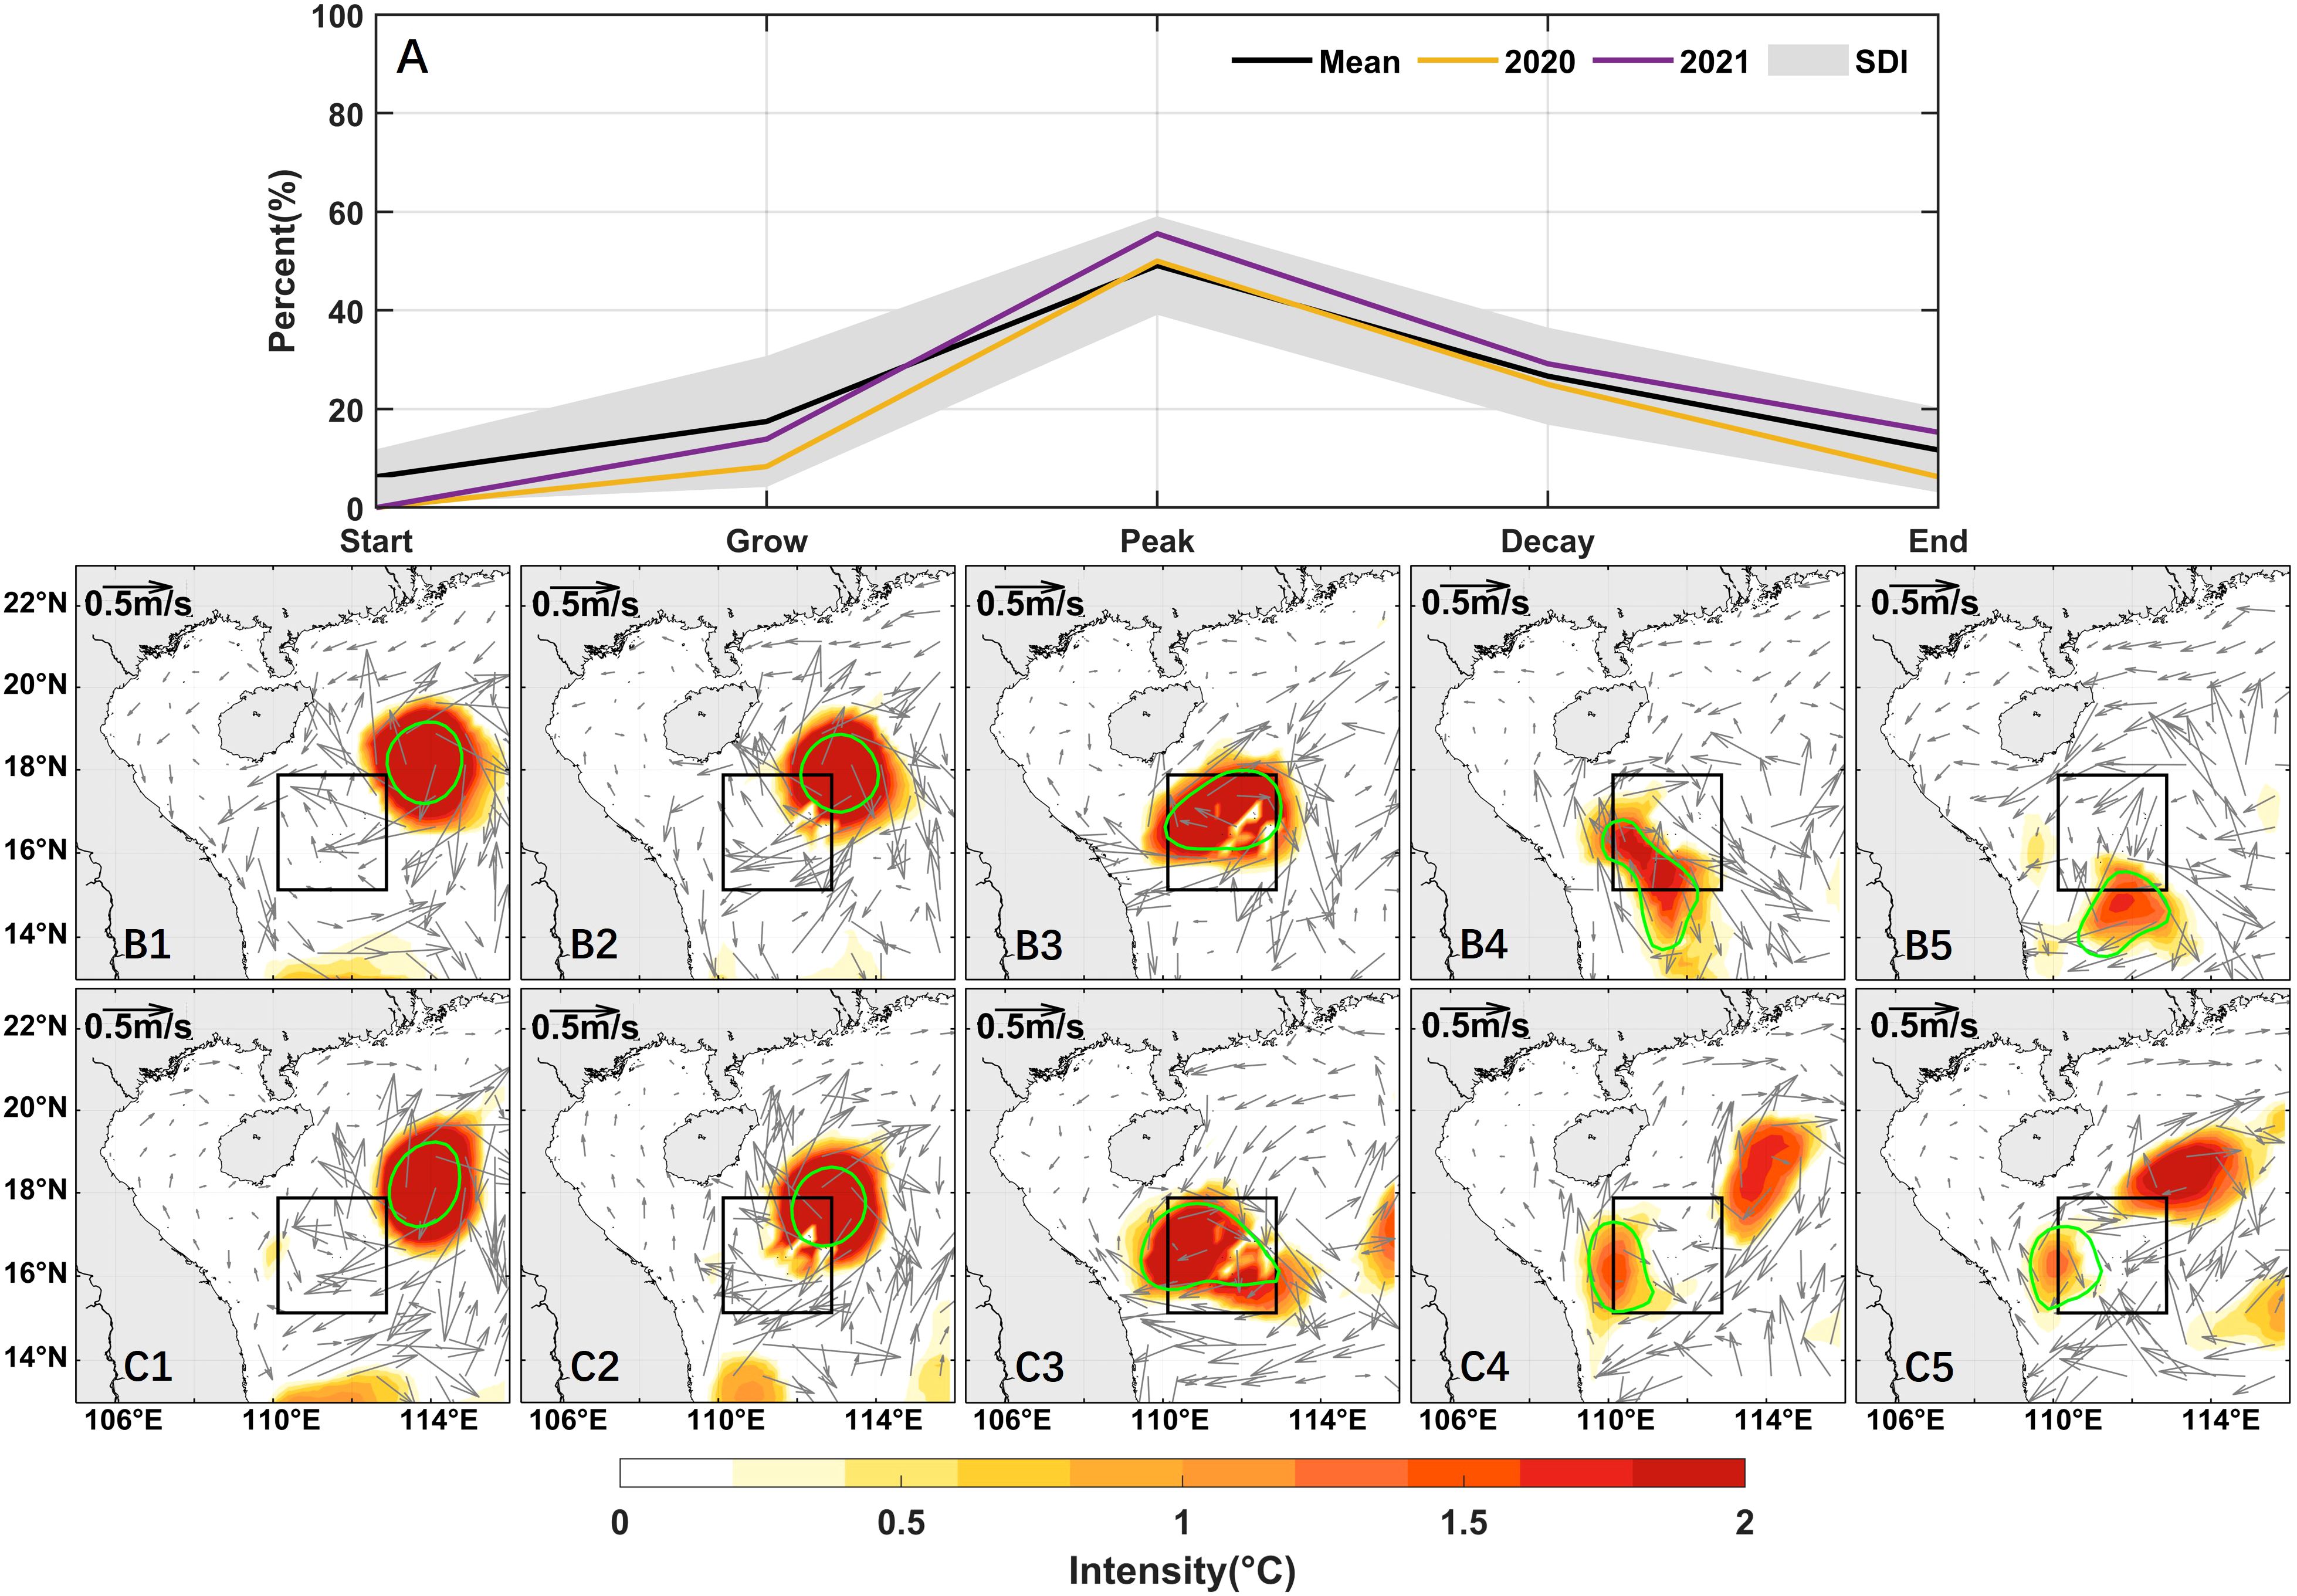
Figure 13 Relationship between the developmental stages of SSMHWs in the Xisha area and positions of warm mesoscale eddies. (A) The proportion of the area occupied by warm mesoscale eddies entering the study area during each stage, (B) The 2020 event, (C) The 2021 event. (1-5) represent the central time points of the start, growth, peak, decay, and end stages, respectively. The black box and green curve area represent the study region and the warm mesoscale eddy range, respectively. Arrows and colors stand for surface current velocity anomalies and Int, respectively.
3.4 The impact of net air-sea heat flux on SSMHWs
While analyzing 208 SSMHW events identified through a block-based method, we found instances where high-intensity SSMHWs co-occurred with anomalously low SST. This suggested that absence of SMHW signals didn’t mean there were no SSMHWs. This study adopted both statistical and composite analysis methods, to investigate the relationship between SSMHWs and surface signals. The statistical analysis showed that the majority of SSMHW events, approximately 81.73%, occurred without surface signals. The average time coverage of SMHW signals of the other 18.27% events was only 76.44%. In summary, it is not enough to only study SMHWs, because most SSMHWs occur without surface signals.
SSMHW events were divided into two groups based on the presence or absence of surface signals. The composite analysis of the air-sea heat flux anomaly was conducted for each group. The results indicated that a strong positive anomaly was present near the northern SCS when there is a surface signal (Figure 14A). In contrast, a significant negative anomaly occurred in the absence of a surface signal (Figure 14B). Statistical analysis revealed that events with surface signals exhibited positive anomalies in the net air-sea heat flux in 65.79% of cases, with an average anomaly of approximately 10.04 W/m². In the absence of a surface signal, events exhibiting negative anomalies account for approximately 47.06% of cases, with an average anomaly value of -18.08 W/m². The presence of surface signals in SSMHWs in the Xisha area is significantly influenced by net air-sea heat flux anomalies in the northern SCS, with shortwave radiation anomalies contributing approximately 55%, as the primary factor.
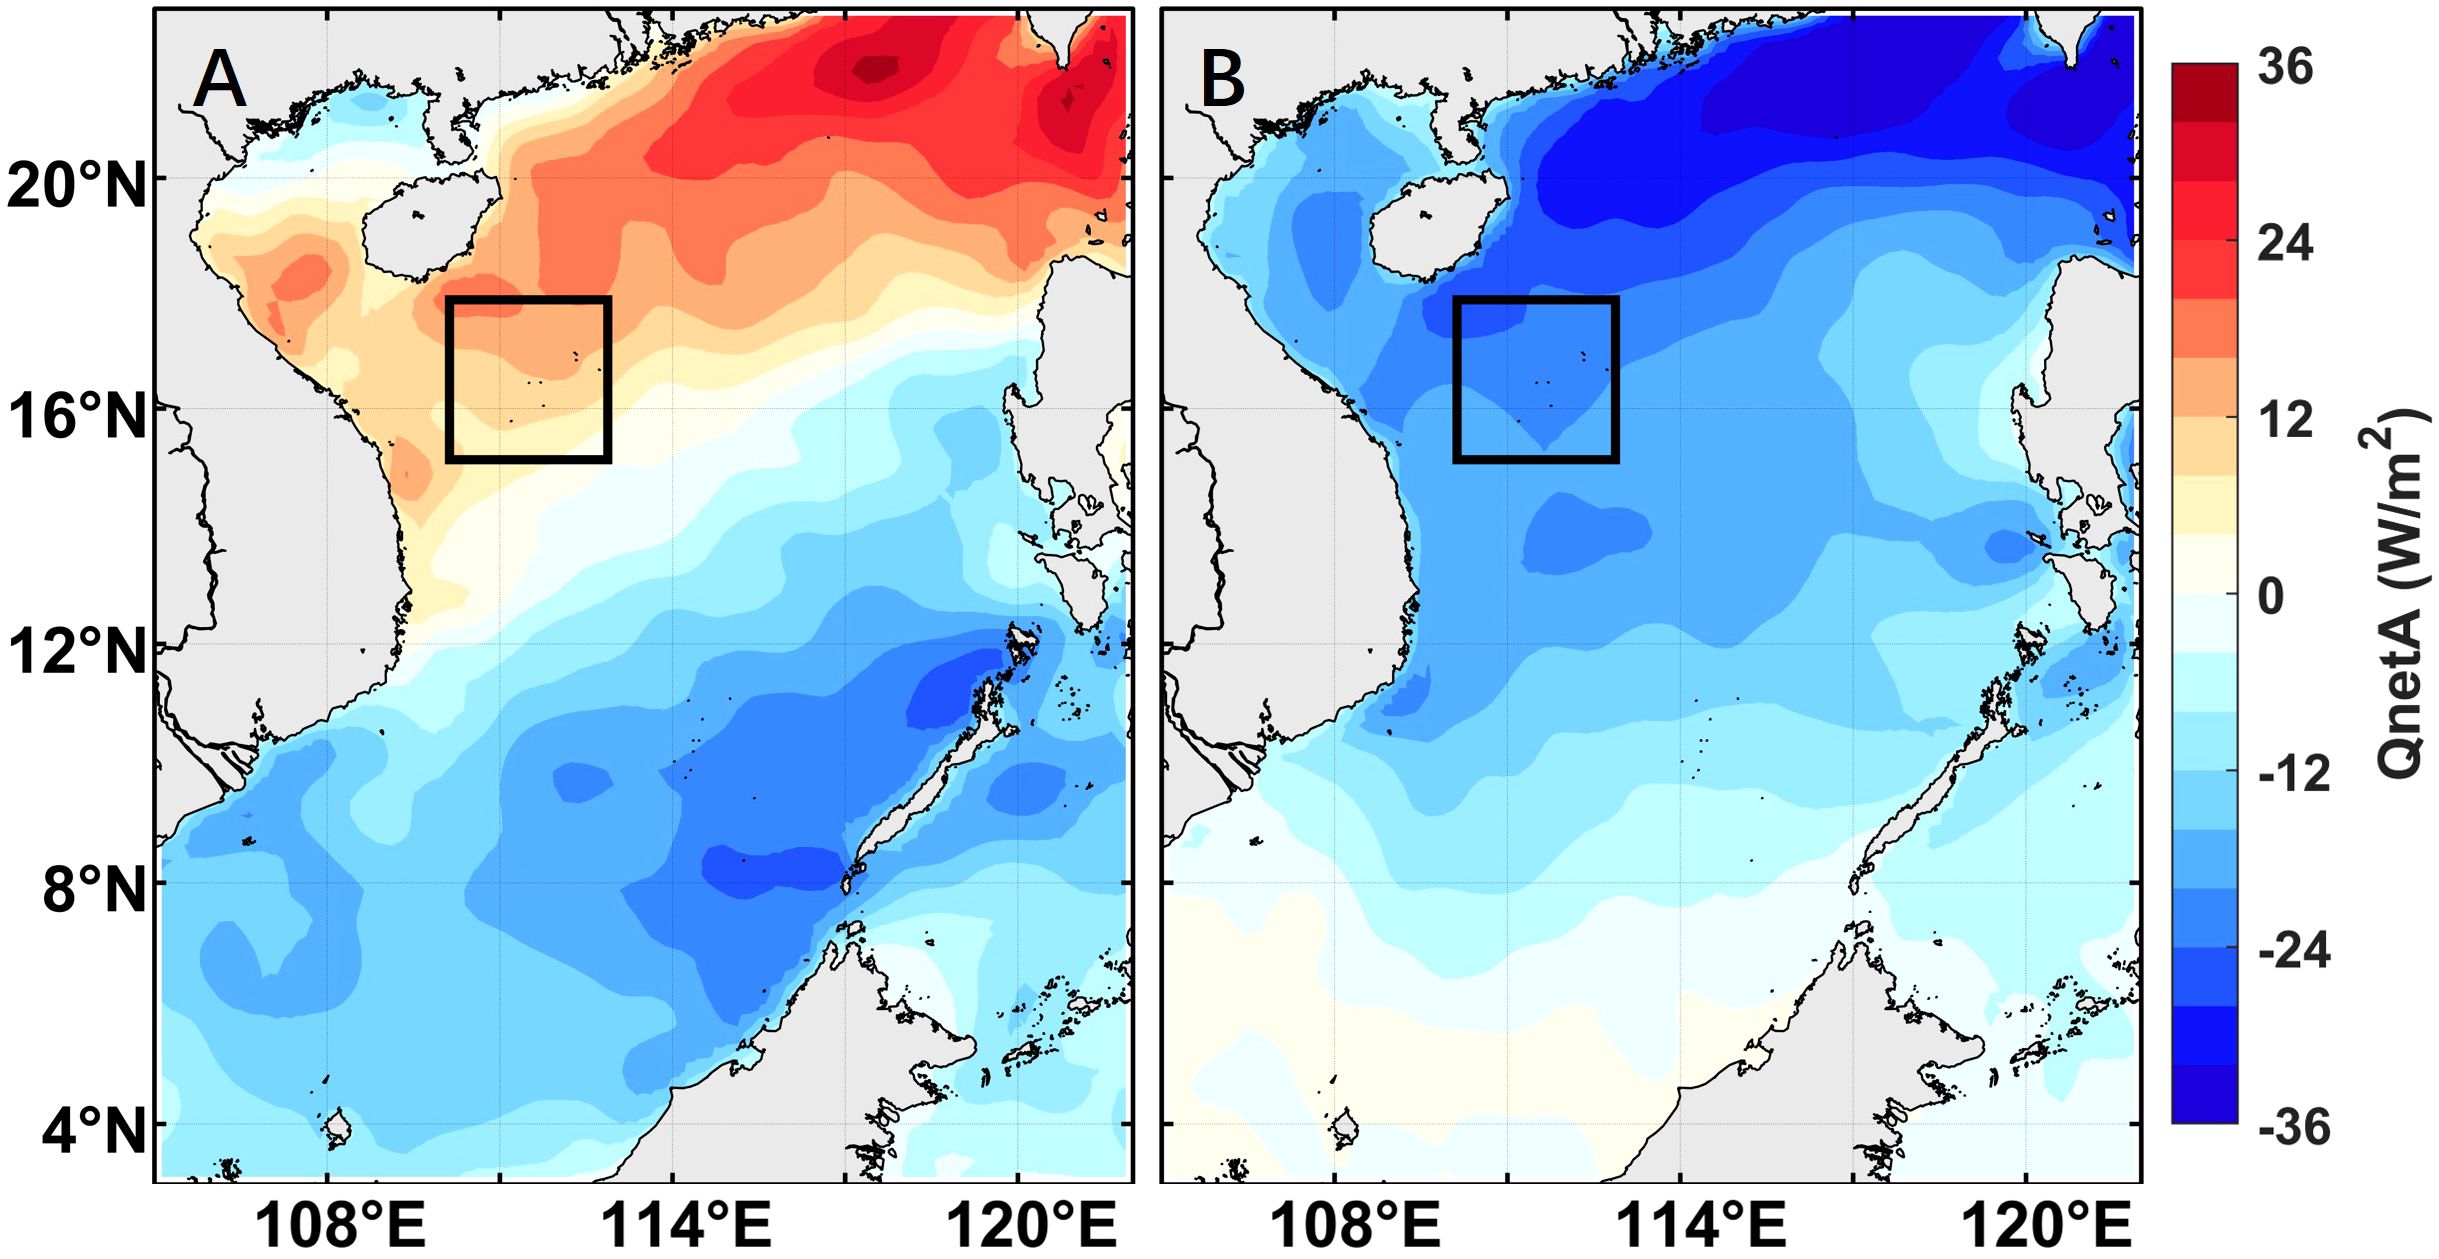
Figure 14 Composite analysis of the net air-sea heat flux anomaly during the occurrence of SSMHWs. (A) The presence of the SMHW signal, (B) The absence of the SMHW signal. The black box represents the study area. Colors indicate the net air-sea heat flux anomaly.
4 Discussion
At present, there is insufficient research on SSMHW, and the identification and quantification method for SSMHW events is still in the exploration and development stage (Hu et al., 2021; Dayan et al., 2023; McAdam et al., 2023; Sun et al., 2023). The main innovation of this study is adding spatial attribute to the identification and quantification of SSMHW. We introduced a new identification method and quantitative index for SSMHW events. It’s conducive to study the driving mechanisms of SSMHWs by the strongest spatiotemporal intensity as research target. Combining Figures 5B, 6, the block-based SSMHW identification method is effective. Intense SSMHW events almost occurred in years with greater TCumInt, when there were many extreme warmings or MHW events in SCS (Xiao et al., 2017; Han et al., 2023).
Previous researchers on MHWs in the northern SCS mostly believed that the intensity of MHWs in the Xisha region was weak (Yao and Wang, 2021; Wang et al., 2022; Sun et al., 2024). From the perspective of SSMHWs, the intensity in this region was relatively strong, breaking previous perceptions (Figures 3D–F). In terms of frequency and duration, the results of SSMHWs are similar to SMHWs (Sun et al., 2024). They are both high in frequency and low in duration in shallow seas (Figures 3A, B). From the vertical characteristic distribution, similar to the conclusions obtained by previous articles, the frequency (duration) decrease (increase) with depth (Hu et al., 2021; Fragkopoulou et al., 2023), and the intensity among 100-200 m is the largest (Figure 4).
Research on the correlation between SMHWs in the SCS and El Niño showed that the intensity of MHW events tended to be stronger in El Niño years (Tan et al., 2022). This finding is completely opposite to the situation of SSMHWs (Figure 5C). It can be inferred that the main driving mechanisms of SMHWs and SSMHWs are different. This article provides a conjecture on a possible mechanism. In La Niña years, the northwest Pacific subtropical high tends to become stronger, leading to an anomalous strengthening of northeasterly winds in the northern SCS, ultimately leading to an increase in the number and activity of mesoscale eddies in the region (Qian et al., 2020; Su et al., 2020; Yang et al., 2022). Thus, the more intense eddy activities may transport more heat to the Xisha region to enhance the SSMHWs there. However, the specific driving mechanism needs further study.
This study adopted the research idea of SMHWs from prior articles to research the primary driving mechanisms of SSMHWs (Chen et al., 2022, Chen et al., 2023). The finding of this study is that warm mesoscale eddies play a significant role in SSMHW intensity and evolution (Figures 10, 12, 13). Although, research on the driving mechanisms of SSMHWs in the SCS is currently limited, studies of SSMHWs in other regions have indicated that ocean dynamics, including mesoscale eddies, are the primary drivers of most SSMHW events (Schaeffer and Roughan, 2017; Elzahaby and Schaeffer, 2019; Wyatt et al., 2023; Zhang et al., 2023). However, the heat transfer of SSMHWs derived by warm mesoscale eddies in the Xisha region is not through down-welling anomaly, but through the advection of warm water (Hu et al., 2021). Similar to other marine regions, there are only a few SMHW signals when SSMHW events occur in the Xisha area (Elzahaby and Schaeffer, 2019; McAdam et al., 2023; Sun et al., 2023).
The primary cause of intense SSMHWs in the Xisha area is the inflow of warm water driven by warm mesoscale eddies, yet detailed studies on their formation and intensity variations are limited. This study advocates for further research into mesoscale eddies to improve predictions of SSMHW occurrences and intensities in the Xisha area, which is crucial for ecological conservation and early warning initiatives.
5 Conclusion
This study identified and analyzed the SSMHWs at each space point in the Xisha area, between 110°E to 113°E and 15°N to 18°N, from 1992 to 2021, using the ECCO2 dataset, to obtain their spatiotemporal characteristics. Besides, A novel block-based method for identifying SSMHWs was developed, identifying a total of 208 SSMHW events. With the addition of a vertical spatial dimension to SSMHW research, this study introduced innovative indices such as HCI, TDI, and SCI to quantify SSMHWs. The driving mechanisms of intense SSMHWs, characterized by SCI, in the Xisha area were investigated. The main conclusions were summarized as follows:
1. In the Xisha area, intense SSMHWs are observed, reaching peak intensity at a depth of 100 m. The intensity of SSMHWs presented seasonal variations, with highest intensity occurring in May. The intensity of SSMHW varies interannually, showing an increasing trend of 1.53°C·Days/Year.
2. The driving mechanism behind intense SSMHWs in the Xisha area is identified as the advective intrusion of abnormally warm water by warm mesoscale eddies. The intensity of SSMHW and that of warm mesoscale eddies are positively correlated. When the intensity of the warm mesoscale eddies is higher, the HCI and TDI of the SSMHW are larger statistically. The intensity of regional SSMHWs is strengthened as the coverage area of warm mesoscale eddies increasing, and weakened as the area decreasing.
3. When SSMHWs occur in the Xisha area, there are 81.73% of events without large-scale SMHW signals. 65.79% of SSMHWs with surface signals exhibit positive anomalies in the net air-sea heat flux, with shortwave radiation anomaly contributing approximately 55%.
Data availability statement
The original contributions presented in the study are included in the article/Supplementary Material. Further inquiries can be directed to the corresponding authors.
Author contributions
FG: Data curation, Formal analysis, Methodology, Software, Visualization, Writing – original draft. CL: Data curation, Formal analysis, Investigation, Project administration, Software, Writing – review & editing. FZ: Conceptualization, Formal analysis, Writing – review & editing. JS: Supervision, Validation, Writing – review & editing. PL: Funding acquisition, Resources, Supervision, Writing – review & editing. YG: Project administration, Writing – review & editing.
Funding
The author(s) declare financial support was received for the research, authorship, and/or publication of this article. The research was supported by the Hainan Provincial Joint Project of Sanya Yazhou Bay Science and Technology City (Grant No. 2021CXLH0020), National Natural Science Foundation of China (Grant No. 42206003), and Scientific and technological project of Zhoushan (Grant No. 2022C01004).
Acknowledgments
The authors acknowledge: NOAA, ECMWF, GEBCO, and National Aeronautics and Space Administration (NASA) for providing accessible data to support this study. We are grateful to (Zhao and Marin, 2019) for providing the marine heatwave identification toolkit. Furthermore, we would like to thank Dr. Sheng for his writing advice.
Conflict of interest
The authors declare that the research was conducted in the absence of any commercial or financial relationships that could be construed as a potential conflict of interest.
Publisher’s note
All claims expressed in this article are solely those of the authors and do not necessarily represent those of their affiliated organizations, or those of the publisher, the editors and the reviewers. Any product that may be evaluated in this article, or claim that may be made by its manufacturer, is not guaranteed or endorsed by the publisher.
Supplementary material
The Supplementary Material for this article can be found online at: https://www.frontiersin.org/articles/10.3389/fmars.2024.1399096/full#supplementary-material
References
Amaya D. J., Miller A. J., Xie S. P., Kosaka Y. (2020). Physical drivers of the summer 2019 North Pacific marine heatwave. Nat. Commun. 11, 1903. doi: 10.1038/s41467-020-15820-w
Chatterjee A., Anil G., Shenoy L. R. (2022). Marine heatwaves in the Arabian sea. Ocean Science. 18, 639–657. doi: 10.5194/os-18-639-2022
Chen S., Yao Y., Feng Y., Zhang Y., Xia C., Sian K. T. L. K., et al. (2023). Characteristics and drivers of marine heatwaves in 2021 summer in East Korea Bay, Japan/East Sea. Remote Sensing. 15, 713. doi: 10.3390/rs15030713
Chen Y., Zhai F., Li P., Gu Y., Wu K. (2022). Extreme 2020 summer SSTs in the Northern South China Sea: implications for the Beibu Gulf coral bleaching. J. Climate. 35, 4177–4190. doi: 10.1175/JCLI-D-21-0649.1
Dayan H., McAdam R., Juza M., Masina S., Speich S. (2023). Marine heat waves in the Mediterranean Sea: An assessment from the surface to the subsurface to meet national needs. Front. Mar. Sci. 10, 1045138. doi: 10.3389/fmars.2023.1045138
Du Y., Wu D., Liang F., Yi J., Mo Y., He Z., et al. (2016). Major migration corridors of mesoscale ocean eddies in the South China Sea from 1992 to 2012. J. Mar. Systems. 158, 173–181. doi: 10.1016/j.jmarsys.2016.01.013
Elzahaby Y., Schaeffer A. (2019). Observational insight into the subsurface anomalies of marine heatwaves. Front. Mar. Sci. 6, 745. doi: 10.3389/fmars.2019.00745
Elzahaby Y., Schaeffer A., Roughan M., Delaux S. (2021). Oceanic circulation drives the deepest and longest marine heatwaves in the east Australian current system. Geophys. Res. Letters. 48, e2021GL094785. doi: 10.1029/2021GL094785
Fang G., Wang G., Fang Y., Fang W. (2012). A review on the South China Sea western boundary current. Acta Oceanologica Sinica. 31, 1–10. doi: 10.1007/s13131-012-0231-y
Feng M., Mcphaden M., Xie S. (2013). La Niña forces unprecedented Leeuwin Current warming in 2011. Sci. Rep. 3, 1277. doi: 10.1038/srep01277
Feng Y., Bethel B. J., Dong C., Zhao H., Yao Y., Yu Y. (2022). Marine heatwave events near Weizhou Island, Beibu Gulf in 2020 and their possible relations to coral bleaching. Sci. Total Environ. 823, 153414. doi: 10.1016/j.scitotenv.2022.153414
Fragkopoulou E., Sen Gupta A., Costello M. J., Wernberg T., Araújo M. B., Serrão E. A., et al. (2023). Marine biodiversity exposed to prolonged and intense subsurface heatwaves. Nat. Climate Change. 13, 1114–1121. doi: 10.1038/s41558-023-01790-6
Frolicher T. L., Laufkotter C. (2018). Emerging risks from marine heat waves. Nat. Commun. 9, 650. doi: 10.1038/s41467-018-03163-6
Galli G., Solidoro C., Lovato T. (2017). Marine heat waves hazard 3D maps and the risk for low motility organisms in a warming mediterranean sea. Front. Mar. Sci. 4, 136. doi: 10.3389/fmars.2017.00136
Gouvêa L. P., Schubert N., Martins C. D. L., Sissini M., Ramlov F., Rodrigues E. R. D. O., et al. (2017). Interactive effects of marine heatwaves and eutrophication on the ecophysiology of a widespread and ecologically important macroalga. Limnology Oceanography. 62, 2056–2075. doi: 10.1002/lno.10551
Han T., Xu K., Wang L., Liu B., Tam C. -Y., Liu K., et al. (2023). Extremely long-lived marine heatwave in South China Sea during summer 2020: Combined effects of the seasonal and intraseasonal variations. Global Planetary Change 230, 104261. doi: 10.1016/j.gloplacha.2023.104261
Hansen J. E., Sato M., Simons L., Nazarenko L. S., Sangha I., Kharecha P., et al. (2023). Global warming in the pipeline. Oxford Open Climate Change. 3, kgad008. doi: 10.1093/oxfclm/kgad008
Hobday A. J., Alexander L. V., Perkins S. E., Smale D. A., Straub S. C., Oliver E. C. J., et al. (2016). A hierarchical approach to defining marine heatwaves. Prog. Oceanography. 141, 227–238. doi: 10.1016/j.pocean.2015.12.014
Hobday A., Oliver E. C., Gupta A. S., Benthuysen J. A., Burrows M. T., Donat M. G., et al. (2018). Categorizing and naming marine heatwaves. Oceanography 31, 162–173. doi: 10.5670/oceanog.2018.205
Holbrook N. J., Scannell H. A., Sen Gupta A., Benthuysen J. A., Feng M., Oliver E. C. J., et al. (2019). A global assessment of marine heatwaves and their drivers. Nat. Commun. 10, 2624. doi: 10.1038/s41467-019-10206-z
Hu S., Li S., Zhang Y., Guan C., Du Y., Feng M., et al. (2021). Observed strong subsurface marine heatwaves in the tropical western Pacific Ocean. Environ. Res. Lett. 16, 104024. doi: 10.1088/1748-9326/ac26f2
Hughes T. P., Kerry J. T., Alvarez-Noriega M., Alvarez-Romero J. G., Anderson K. D., Baird A. H., et al. (2017). Global warming and recurrent mass bleaching of corals. Nature 543, 373–377. doi: 10.1038/nature21707
Jackson J. M., Johnson G. C., Dosser H. V., Ross T. (2018). Warming from recent marine heatwave lingers in Deep British Columbia Fjord. Geophysical Res. Letters. 45, 9757–9764. doi: 10.1029/2018GL078971
Kuo N.-J., Zheng Q., Ho C.-R. (2004). Response of Vietnam coastal upwelling to the 1997–1998 ENSO event observed by multisensor data. Remote Sens. Environ. 89, 106–115. doi: 10.1016/j.rse.2003.10.009
Lachs L., Donner S. D., Mumby P. J., Bythell J. C., Humanes A., East H. K., et al. (2023). Emergent increase in coral thermal tolerance reduces mass bleaching under climate change. Nat. Commun. 14, 4939. doi: 10.1038/s41467-023-40601-6
Liu S., Lao Q., Zhou X., Jin G., Chen C., Chen F. (2023). Impacts of marine heatwave events on three distinct upwelling systems and their implications for marine ecosystems in the Northwestern South China Sea. Remote Sensing. 16, 131. doi: 10.3390/rs16010131
Mason E., Pascual A., McWilliams J. C. (2014). A new sea surface height–based code for oceanic mesoscale eddy tracking. Oceanic Technol. 31, 1181–1188. doi: 10.1175/JTECH-D-14-00019.1
McAdam R., Masina S., Gualdi S. (2023). Seasonal forecasting of subsurface marine heatwaves. Commun. Earth Environ. 4, 225. doi: 10.1038/s43247-023-00892-5
Oliver E. C. J., Benthuysen J. A., Darmaraki S., Donat M. G., Hobday A. J., Holbrook N. J., et al. (2021). Marine heatwaves. Ann. Rev. Mar. Sci. 13, 313–342. doi: 10.1146/annurev-marine-032720-095144
Oliver E. C., Burrows M. T., Donat M. G., Sen Gupta A., Alexander L. V., Perkins-Kirkpatrick S. E., et al. (2019). Projected marine heatwaves in the 21st century and the potential for ecological impact. Front. Mar. Sci. 6, 734. doi: 10.3389/fmars.2019.00734
Oliver E. C. J., Donat M. G., Burrows M. T., Moore P. J., Smale D. A., Alexander L. V., et al. (2018). Longer and more frequent marine heatwaves over the past century. Nat. Commun. 9, 1324. doi: 10.1038/s41467-018-03732-9
Pearce A., Lenanton R., Jackson G., Moore J., Feng M., Gaughan D. (2011). “The “marine heat wave” off Western Australia during the summer of 2010/11,” in Fisheries Research Report. No. 222. (Western Australia: Department of Fisheries), 40.
Pershing A. J., Mills K. E., Dayton A. M., Franklin B. S., Kennedy B. T. (2018). Evidence for adaptation from the 2016 marine heatwave in the Northwest Atlantic Ocean. Oceanogr. 31, 152–161. doi: 10.5670/oceanog.2018.213
Qian Q., Liang P., Qi L., Ding Y., He J. (2020). Sub-seasonal variability of meridional activity of Western Pacific subtropical high in boreal late summer. Front. Earth Sci. 8, 597969. doi: 10.3389/feart.2020.597969
Qiu Z., Qiao F., Jang C. J., Zhang L., Song Z. (2021). Evaluation and projection of global marine heatwaves based on CMIP6 models. Deep Sea Res. Part II: Topical Stud. Oceanogr. 194, 104998. doi: 10.1016/j.dsr2.2021.104998
Schaeffer A., Roughan M. (2017). Subsurface intensification of marine heatwaves off southeastern Australia: The role of stratification and local winds. Geophysical Res. Letters. 44, 5025–5033. doi: 10.1002/2017GL073714
Schaeffer A., Sen Gupta A., Roughan M. (2023). Seasonal stratification and complex local dynamics control the sub-surface structure of marine heatwaves in Eastern Australian coastal waters. Commun. Earth Environ. 4, 304. doi: 10.1038/s43247-023-00966-4
Schlegel R. W., Oliver E. C., Chen K. (2021). Drivers of marine heatwaves in the Northwest Atlantic: the role of air–sea interaction during onset and decline. Front. Mar. Sci. 8, 627970. doi: 10.3389/fmars.2021.627970
Smith K. E., Burrows M. T., Hobday A. J., King N. G., Moore P. J., Sen Gupta A., et al. (2023). Biological impacts of marine heatwaves. Ann. Rev. Mar. Sci. 15, 119–145. doi: 10.1146/annurev-marine-032122-121437
Song Q., Yao Y., Wang C. (2023). Response of future summer marine heatwaves in the South China sea to enhanced western pacific subtropical high. Geophys. Res. Lett. 50, e2023GL103667. doi: 10.1029/2023GL103667
Su D., Lin P., Mao H., Wu J., Liu H., Cui Y., et al. (2020). Features of slope intrusion mesoscale eddies in the Northern South China sea. J. Geophys. Res: Oceans. 125, e2019JC015349. doi: 10.1029/2019JC015349
Sun D., Li F., Jing Z., Hu S., Zhang B. (2023). Frequent marine heatwaves hidden below the surface of the global ocean. Nat. Geoscience. 16, 1099–1104. doi: 10.1038/s41561-023-01325-w
Sun W., Yang Y., Wang Y., Yang J., Ji J., Dong C. (2024). Characterization and future projection of marine heatwaves under climate change in the South China Sea. Ocean Modelling. 188, 102322. doi: 10.1016/j.ocemod.2024.102322
Tan H. J., Cai R. S., Wu R. G. (2022). Summer marine heatwaves in the South China Sea: Trend, variability and possible causes. Adv. Climate Change Res. 13, 323–332. doi: 10.1016/j.accre.2022.04.003
Wang D. R., Wu Z. J., Li Y. C., Chen J. R., Chen M. (2011). Analysis on variation trend of coral reef in Xisha. Acta Ecologica Sinica. 31, 254–258. doi: 10.1016/j.chnaes.2011.06.005
Wang Y., Zeng J., Wei Z., Li S., Tian S., Yang F., et al. (2022). Classifications and characteristics of marine heatwaves in the Northern South China sea. Front. Mar. Science. 9, 826810. doi: 10.3389/fmars.2022.826810
Wernberg T., Smale D. A., Tuya F., Thomsen M. S., Langlois T. J., De Bettignies T., et al. (2012). An extreme climatic event alters marine ecosystem structure in a global biodiversity hotspot. Nat. Climate Change. 3, 78–82. doi: 10.1038/nclimate1627
Wyatt A. S., Leichter J. J., Washburn L., Kui L., Edmunds P. J., Burgess S. C. (2023). Hidden heatwaves and severe coral bleaching linked to mesoscale eddies and thermocline dynamics. Nat. Commun. 14, 25. doi: 10.1038/s41467-022-35550-5
Xiao F., Zeng L., Liu Q.-Y., Zhou W., Wang D. (2017). Extreme subsurface warm events in the South China Sea during 1998/99 and 2006/07: observations and mechanisms. Climate Dynamics. 50, 115–128. doi: 10.1007/s00382-017-3588-y
Yang K., Cai W., Huang G., Hu K., Ng B., Wang G. (2022). Increased variability of the western Pacific subtropical high under greenhouse warming. Proc. Natl. Acad. Sci. U.S.A. 119, e2120335119. doi: 10.1073/pnas.2120335119
Yao Y., Wang C. (2021). Variations in summer marine heatwaves in the South China Sea. J. Geophys. Res.: Oceans. 126, e2021JC017792. doi: 10.1029/2021JC017792
Yao Y., Wang C., Fu Y. (2022). Global marine heatwaves and cold-spells in present climate to future projections. Earth’s Future. 10, e2022EF002787. doi: 10.1029/2022EF002787
Zhang Y., Du Y., Feng M., Hobday A. J. (2023). Vertical structures of marine heatwaves. Nat. Commun. 14, 6483. doi: 10.1038/s41467-023-42219-0
Zhang T., Li J., Xie L., Zheng Q. (2022). Statistical analysis of mesoscale eddies entering the continental shelf of the Northern South China Sea. J. Mar. Sci. Engineering. 10, 206. doi: 10.3390/jmse10020206
Zhang C., Xi X., Liu S., Shao L., Hu X. (2014). A mesoscale eddy detection method of specific intensity and scale from SSH image in the South China Sea and the Northwest Pacific. Sci. China Earth Sci. 57, 1897–1906. doi: 10.1007/s11430-014-4839-y
Zhao Z., Marin M. (2019). A MATLAB toolbox to detect and analyze marine heatwaves. J. Open Source Software 4 (33), 1124. doi: 10.21105/joss.01124
Keywords: subsurface marine heatwave, mesoscale eddy, the Xisha Islands, spatiotemporal characteristics, mechanism analysis
Citation: Gao F, Liu C, Zhai F, Song J, Li P and Gu Y (2024) The spatiotemporal characteristics and driving mechanisms of subsurface marine heatwaves in the Xisha Region. Front. Mar. Sci. 11:1399096. doi: 10.3389/fmars.2024.1399096
Received: 11 March 2024; Accepted: 30 April 2024;
Published: 23 May 2024.
Edited by:
Francisco Machín, University of Las Palmas de Gran Canaria, SpainReviewed by:
Yulong Yao, Chinese Academy of Sciences (CAS), ChinaFajin Chen, Guangdong Ocean University, China
Copyright © 2024 Gao, Liu, Zhai, Song, Li and Gu. This is an open-access article distributed under the terms of the Creative Commons Attribution License (CC BY). The use, distribution or reproduction in other forums is permitted, provided the original author(s) and the copyright owner(s) are credited and that the original publication in this journal is cited, in accordance with accepted academic practice. No use, distribution or reproduction is permitted which does not comply with these terms.
*Correspondence: Cong Liu, bGl1Y29uZzE3NUBnbWFpbC5jb20=; Yanzhen Gu, Z3V5YW56aGVuQHpqdS5lZHUuY24=
 Feng Gao
 Cong Liu
 Fangguo Zhai
 Jinbao Song
 Peiliang Li
 Yanzhen Gu