
94% of researchers rate our articles as excellent or good
Learn more about the work of our research integrity team to safeguard the quality of each article we publish.
Find out more
ORIGINAL RESEARCH article
Front. Mar. Sci., 12 June 2024
Sec. Coastal Ocean Processes
Volume 11 - 2024 | https://doi.org/10.3389/fmars.2024.1398702
 Jingsong Gao1,2*
 Lingqing Mo1,2
 Hanfang Lu1,2Xiaoni Meng1,2Guidan Wu1,2Dapeng Wang3
 Kim-Cuong Nguyen4Baoqing Hu1,2Anh Tu Tran5
Spring circulation in the Beibu Gulf remains an underinvestigated research topic. Model results validated by observations reveal that the northern and southern parts of the Beibu Gulf are controlled by an enclosed cyclonic gyre and a cyclonic gyre, respectively, while in the vertical, the circulation at the surface differs from those in the middle and deep layers. Contrary to that of the classical view, the modeled Qiongzhou Strait (QS) current flows eastward during some days in spring. This eastward current has an occurrence proportion of 29.3–55.4%, and its longest duration period is 7~18 d. The average current in the QS in spring is approximately westward except in some typical years. In spring, the northern Beibu Gulf is affected by the cold water mass (CWM), which is depicted by the 12°C and 10°C isolines in strong and weak years, respectively. Sensitivity experiments show that the heat flux is dominant in the northern Beibu Gulf via the effect of the CWM, and the monsoon wind favors the formation of the cyclonic gyre. Conversely, the cyclonic gyre in the southern Beibu Gulf is jointly driven by the monsoon wind and heat flux, with the effect of the monsoon wind being more significant. The current off the northern coast of Vietnam (VNC) can be either northeastward or southwestward in spring in different years. The VNC is mainly controlled by the elevation gradient along the northern coast of Vietnam, and the Coriolis force, horizontal advection, and vertical diffusion also play significant roles. Additionally, the CWM is mainly controlled by the heat flux whereas the monsoon wind plays a secondary role. And the VNC, current in the QS, CWM, and cyclonic gyre jointly affect nutrient distributions in the northern Beibu Gulf.
The Beibu Gulf (Gulf of Tonkin) is located in the northwestern South China Sea (SCS), surrounded by China and Vietnam (Figure 1). Comprehensive observations in the Beibu Gulf began in 1958. The 1964 China–Vietnam Joint Survey obtained extensive datasets, based on which hydrodynamic theories for the Beibu Gulf were developed. In the following decades, several coastal marine surveys were implemented. A comprehensive survey, namely the ‘908 project’, focusing on the seasonal variations in the Beibu Gulf was conducted during 2006–2007, and new views on the hydrodynamics therein were developed based on both model and observation results.
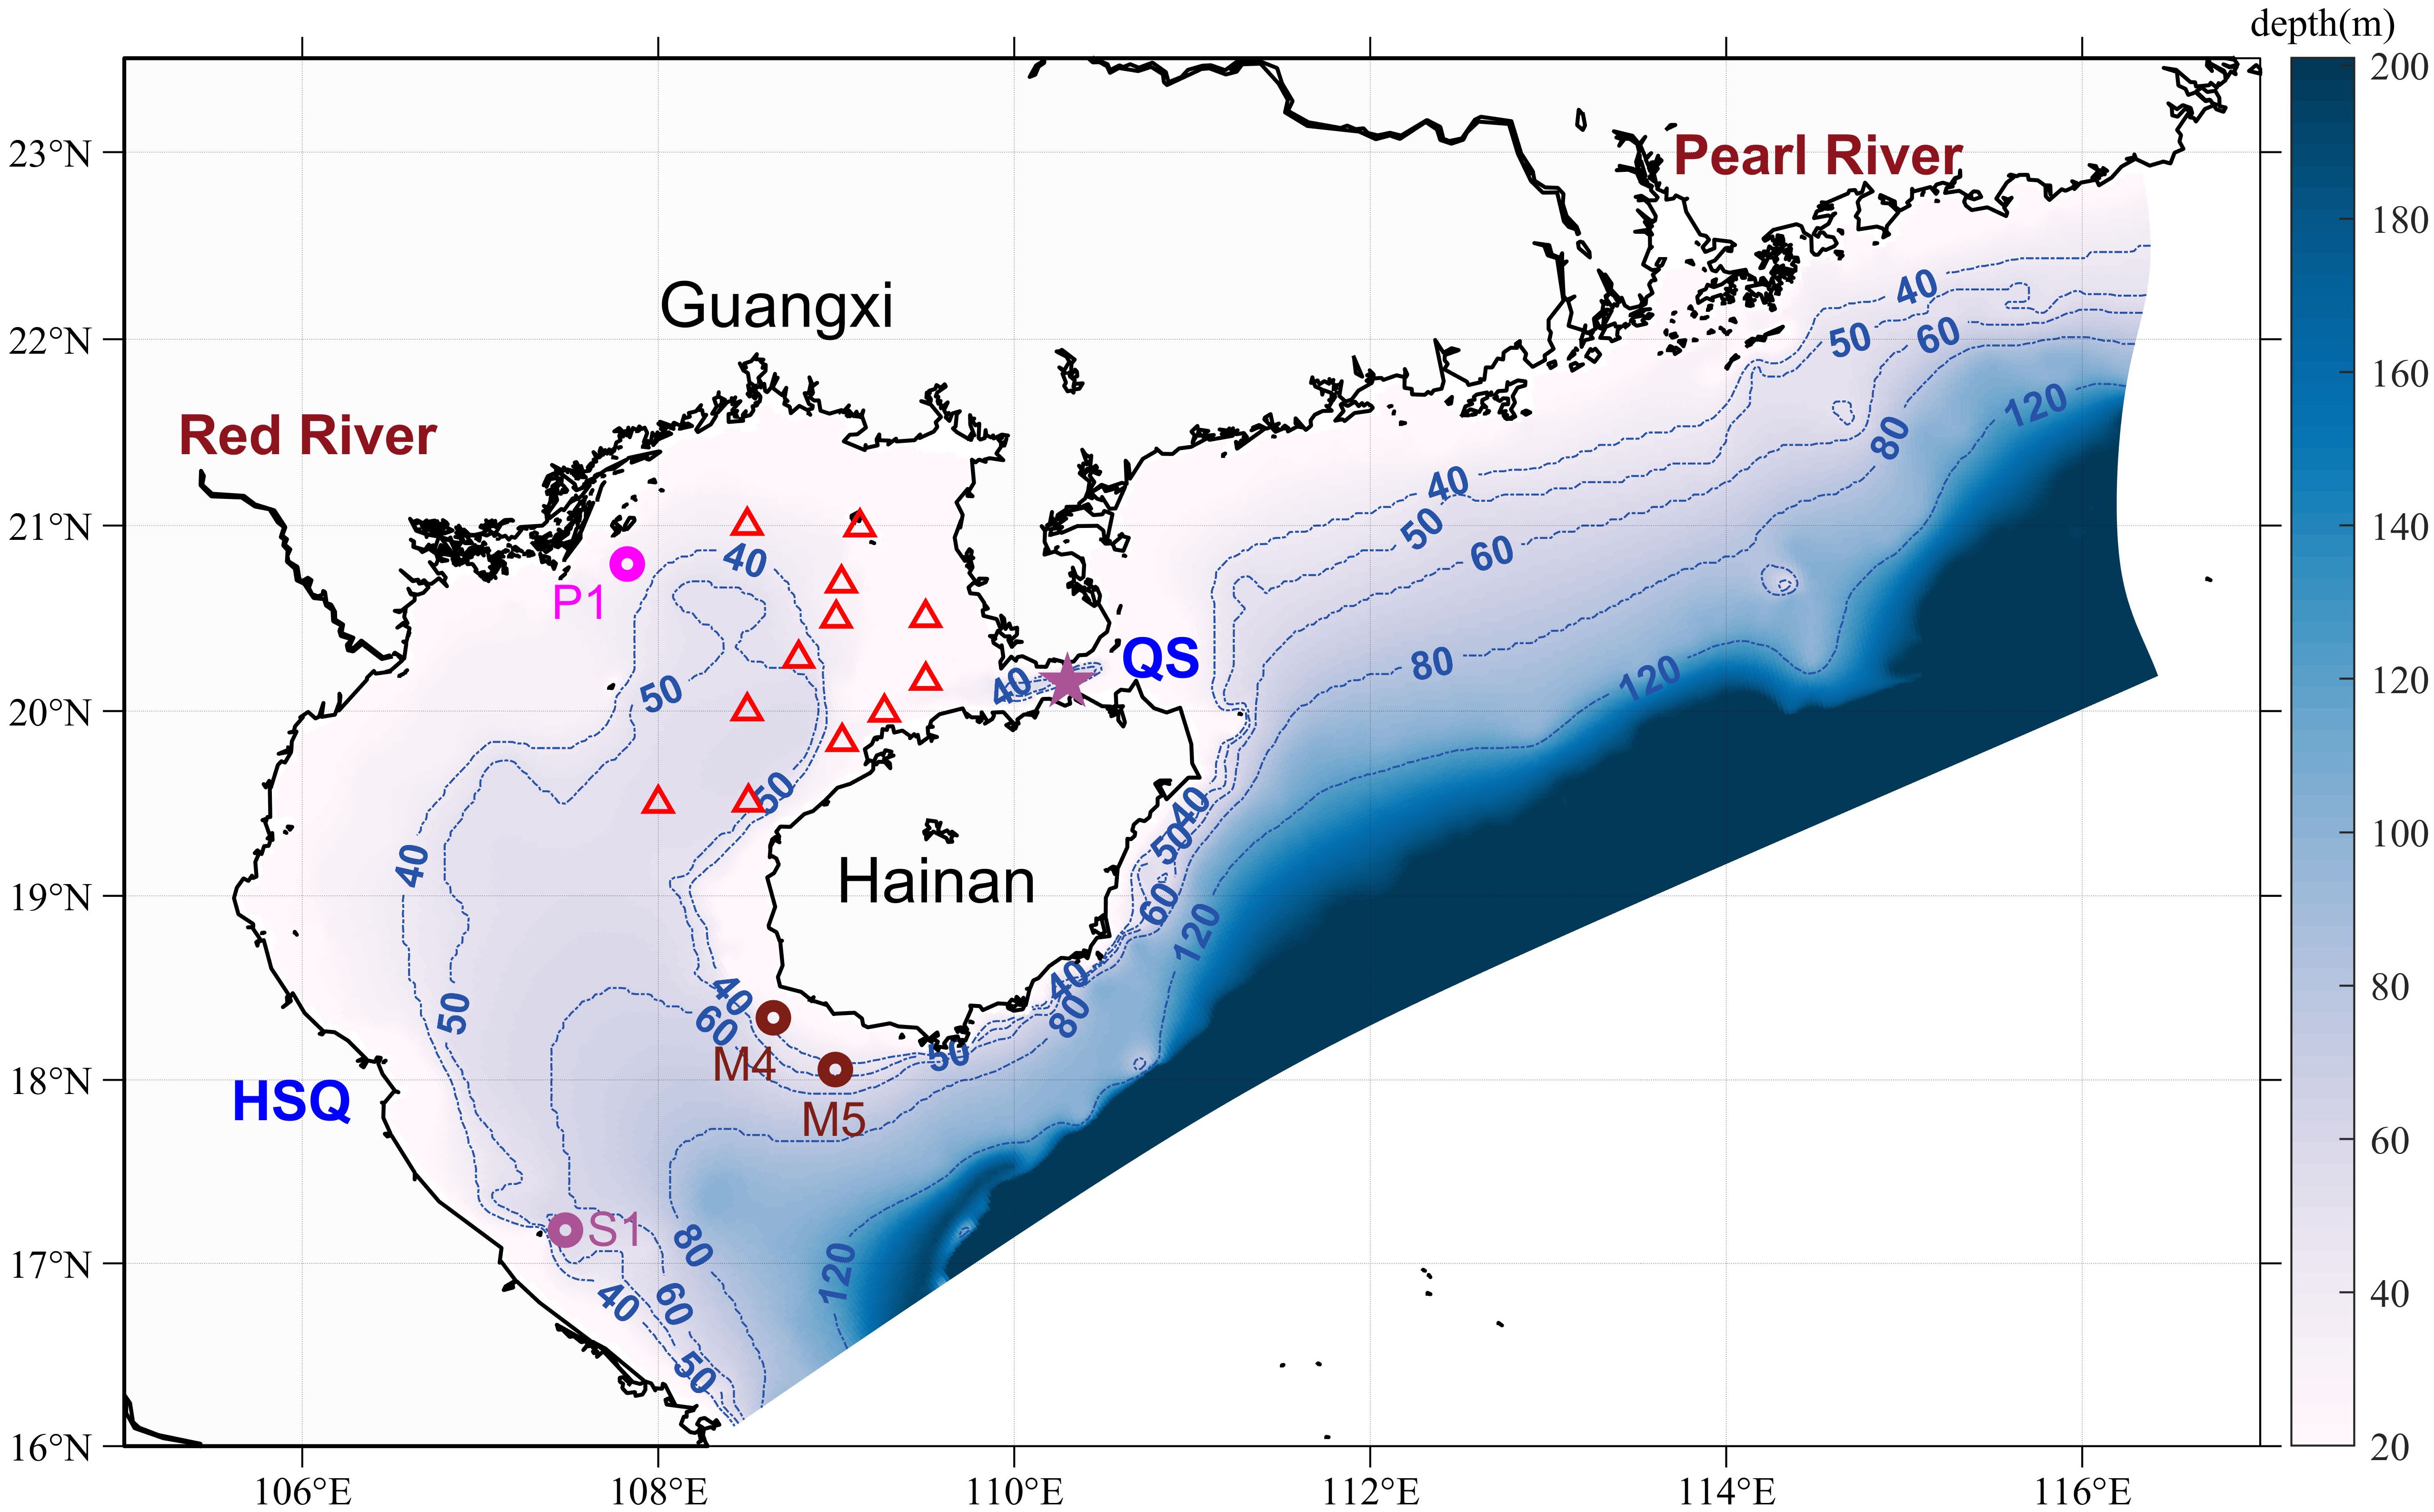
Figure 1 Model domain and bathymetry extracted from ETOPO2v2, with depths greater than 200 m shown as one color (deep blue). QS and HSQ are the Qiongzhou Strait and Cape Hoanh Son Quan, respectively. Red triangles indicate short-time observation current stations, whereas the three circles (M4, M5, and S1) represent long-term observation current stations. The purple star represents the point used for statistical analysis of the occurrence proportion and duration period of the eastward current in the QS, and the pink circle (P1) indicates the point used for analyzing the current off the northern coast of Vietnam (VNC).
Regarding the circulation structure in summer, three main perspectives exist: gulf-scale anticyclonic circulation, gulf-scale cyclonic circulation, and two-gyre circulation (Comprehensive Oceanic Survey Office of National Scientific Committee of China, 1964; Xu et al., 1980; Wang, 1998; Xia et al., 2001; Yang et al., 2003; Zu, 2005; Wu et al., 2008; Sun et al., 2009; Chen, 2013; Ding et al., 2013; Gao et al., 2015). Evidence propounds mostly that the northern and southern Beibu Gulf are dominated by an anticyclonic gyre and a cyclonic gyre, respectively. Conversely, regarding the circulation structure in winter, four main perspectives exist: gulf-scale cyclonic circulation nested with two cyclonic gyres, gulf-scale cyclonic circulation with an enclosed cyclonic gyre in the northern gulf, northern enclosed cyclonic gyre and southern anticyclonic gyre, and two cyclonic gyres with a southwestward current off the northwestern coast of Hainan Island (Comprehensive Oceanic Survey Office of National Scientific Committee of China, 1964; Liu and Yu, 1980; Tan, 1987; Yu and Liu, 1993; Yuan and Deng, 1999; Manh and Yanagi, 2000; Sun et al., 2001; Xia et al., 2001; Su and Yuan, 2005; Zu, 2005; Sun et al., 2009; Chen, 2013; Ding et al., 2013; Fang, 2014; Gao and Chen, 2014). Most studies support that winter circulation in the Beibu Gulf comprises two cyclonic gyres with a southwestward current off the northwestern coast of Hainan Island, and the monsoon wind is the primary driving factor. The circulation structure in fall is generally similar to that in winter (Zu, 2005; Chen, 2013; Gao and Chen, 2014); however, the northward intrusion of the southern cyclonic gyre in fall is greater than that in winter (Gao and Chen, 2014).
Spring circulation in the Beibu Gulf has attracted considerably less attention due to sparse observation and model results. Historical observations suggest that spring circulation is gulf-scale cyclonic with a nested cyclonic gyre in the southern Beibu Gulf (Su and Yuan, 2005). Observation results from May 30 to June 4, 1994, revealed the existence of a cyclonic gyre in the northern Beibu Gulf (Zhong, 1995). Observational data from two stations off the Guangxi coast indicated a northwestward current in the area in the spring of 2007 (Zhang et al., 2009). Additionally, the current observed at station M4 off the southern coast of Hainan was found to be northeastward in the spring of 2007 (Wang et al., 2009). Conversely, the Beibu Gulf is a semi-enclosed gulf that is strongly affected by the monsoon wind (Yuan and Deng, 1999; Manh and Yanagi, 2000; Sun et al., 2001; Xia et al., 2001; Su and Yuan, 2005; Zu, 2005; Gao et al., 2014). Marine phytoplankton are highly productive during the spring, and circulation in the Beibu Gulf affects the distributions of chlorophyll a and primary productivity in addition to any occurrences of red tide (Chen and Shi, 2019). Then two questions arise: What is the circulation structure in spring? What is the effect of the monsoon wind on spring circulation?
According to the 1964 China–Vietnam Joint Survey, the current in the Qiongzhou Strait (QS) is eastward during spring and summer. By analyzing historical data and model results, many scientists revealed that the current in the QS is westward throughout the year (Shi et al., 2002; Bao et al., 2005; Zu, 2005; Chen et al., 2006; Yang et al., 2006; Chen et al., 2007; Yan et al., 2008, 2008; Chen et al., 2009; Ding, 2014). The observation results from the ‘908 project’ showed that an eastward current occurring in the QS in spring can last for ~7 d (Zhang et al., 2009). This eastward current in spring was also revealed by 33 shipboard Acoustic Doppler Current Profile (ADCP) surveys from March 8 to April 2, 2013 (Zhu et al., 2014). Therefore, is the QS in spring dominated by the westward current? Additionally, the longest duration period and greatest occurrence proportion of the eastward current in spring have been unknown until now.
The Princeton Ocean model (Blumberg and Mellor, 1987) is utilized in this study. For surface forcing, daily average wind is extracted from the Seawinds project (Zhang et al., 2006), and heat flux is derived from the OAFlux project (Yu et al., 2008). Considering the strong tidal mixing in the domain (Shi et al., 2002; Hu et al., 2003; Lu et al., 2008), six principal tidal constituents (, , , , , and ) in the two open boundaries are retrieved from the tidal model of the Oregon State University (Zu et al., 2008). Initial factors including temperature and salinity and lateral boundary data including daily average elevation, temperature, salinity, and barotropic and baroclinic velocities are extracted from a global 1/12° HYCOM + NCODA analysis.
The depth data in this study are from ETOTO2v2, which includes the corrected Beibu Gulf depth field of ETOPO2, with the maximum and minimum depths being 2,129 and 10 m, respectively. The horizontal resolution of the model varies from 0.9 to 2.0 km, and there are 21 sigma layers in the vertical. The river discharges of Pearl River, Red River, and the other six rivers along the Guangxi coast are according to Gao et al. (2015). Research has shown that the sea surface elevation and velocity in the Beibu Gulf exhibit stable periodic oscillations after a simulation time of no more than 10 d (Hu et al., 2003). Therefore, in this study, the daily average results were analyzed after the integration of three months (after March 1, 2006), with the integration time being from December 1, 2005, to December 31, 2009. After that, three sensitive experiments—no tide, no heat flux, and no wind—were conducted in 2006 to distinguish the effects of the forces.
To compare the modeled and observed circulation structures, historical data from the spring of 1973 (Figure 2) are used. Evidently, the observed circulation in the northern Beibu Gulf is cyclonic, and the currents are northeastward off the northwestern coast of Hainan Island and northwestward off the western end of the QS. Similarly, the average spring circulation based on four year model results shows that there is an enclosed cyclonic gyre in the northern Beibu Gulf, and the current off the northwestern coast of Hainan is northeastward (Figure 3). Additionally, the current in the QS is westward and turns northwestward off the western end of the QS. The observed current during 2017–2018 also revealed a cyclonic gyre in the northern Beibu Gulf (Chen et al., 2020).
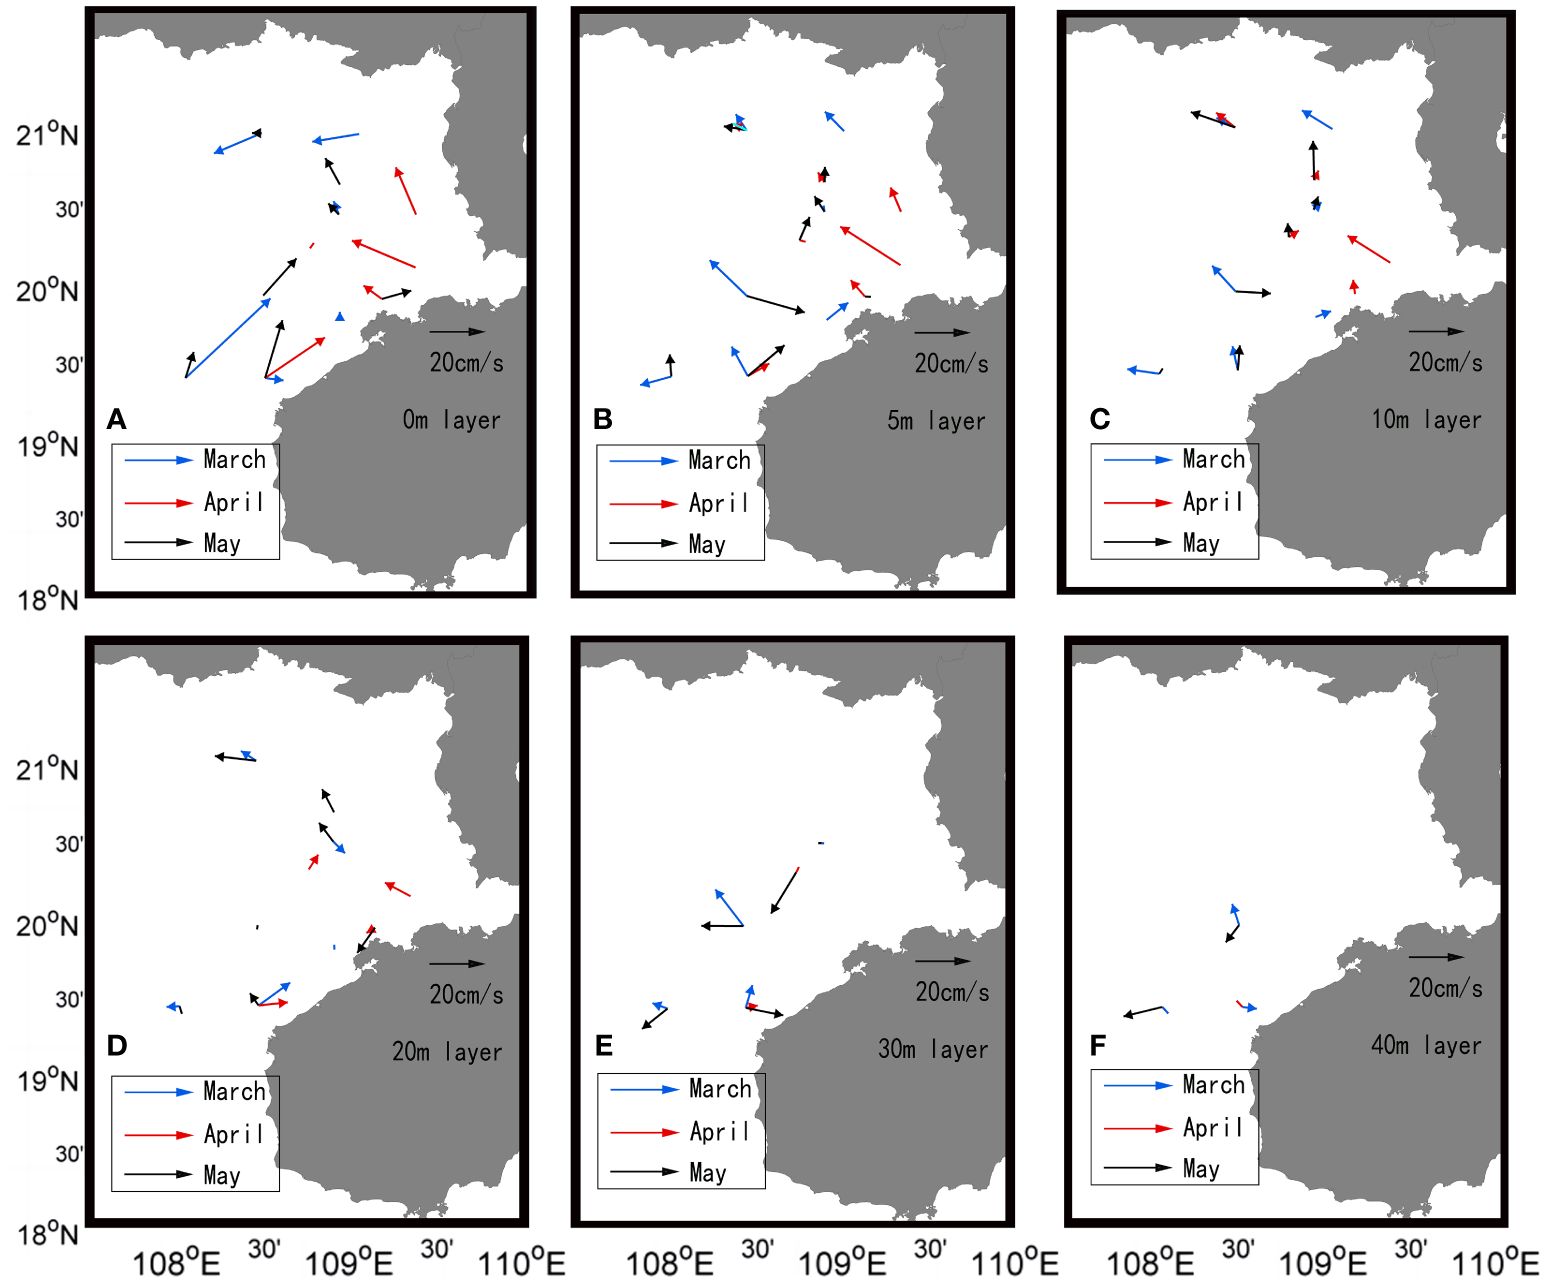
Figure 2 Observed short-term currents from the surface to the 50-m layer in the spring of 1973. Blue, red, and black arrows correspond to March, April, and May, respectively. Panels (A–F) show the surface, 5-m, 10-m, 20-m, 30-m, and 50-m layers, respectively.
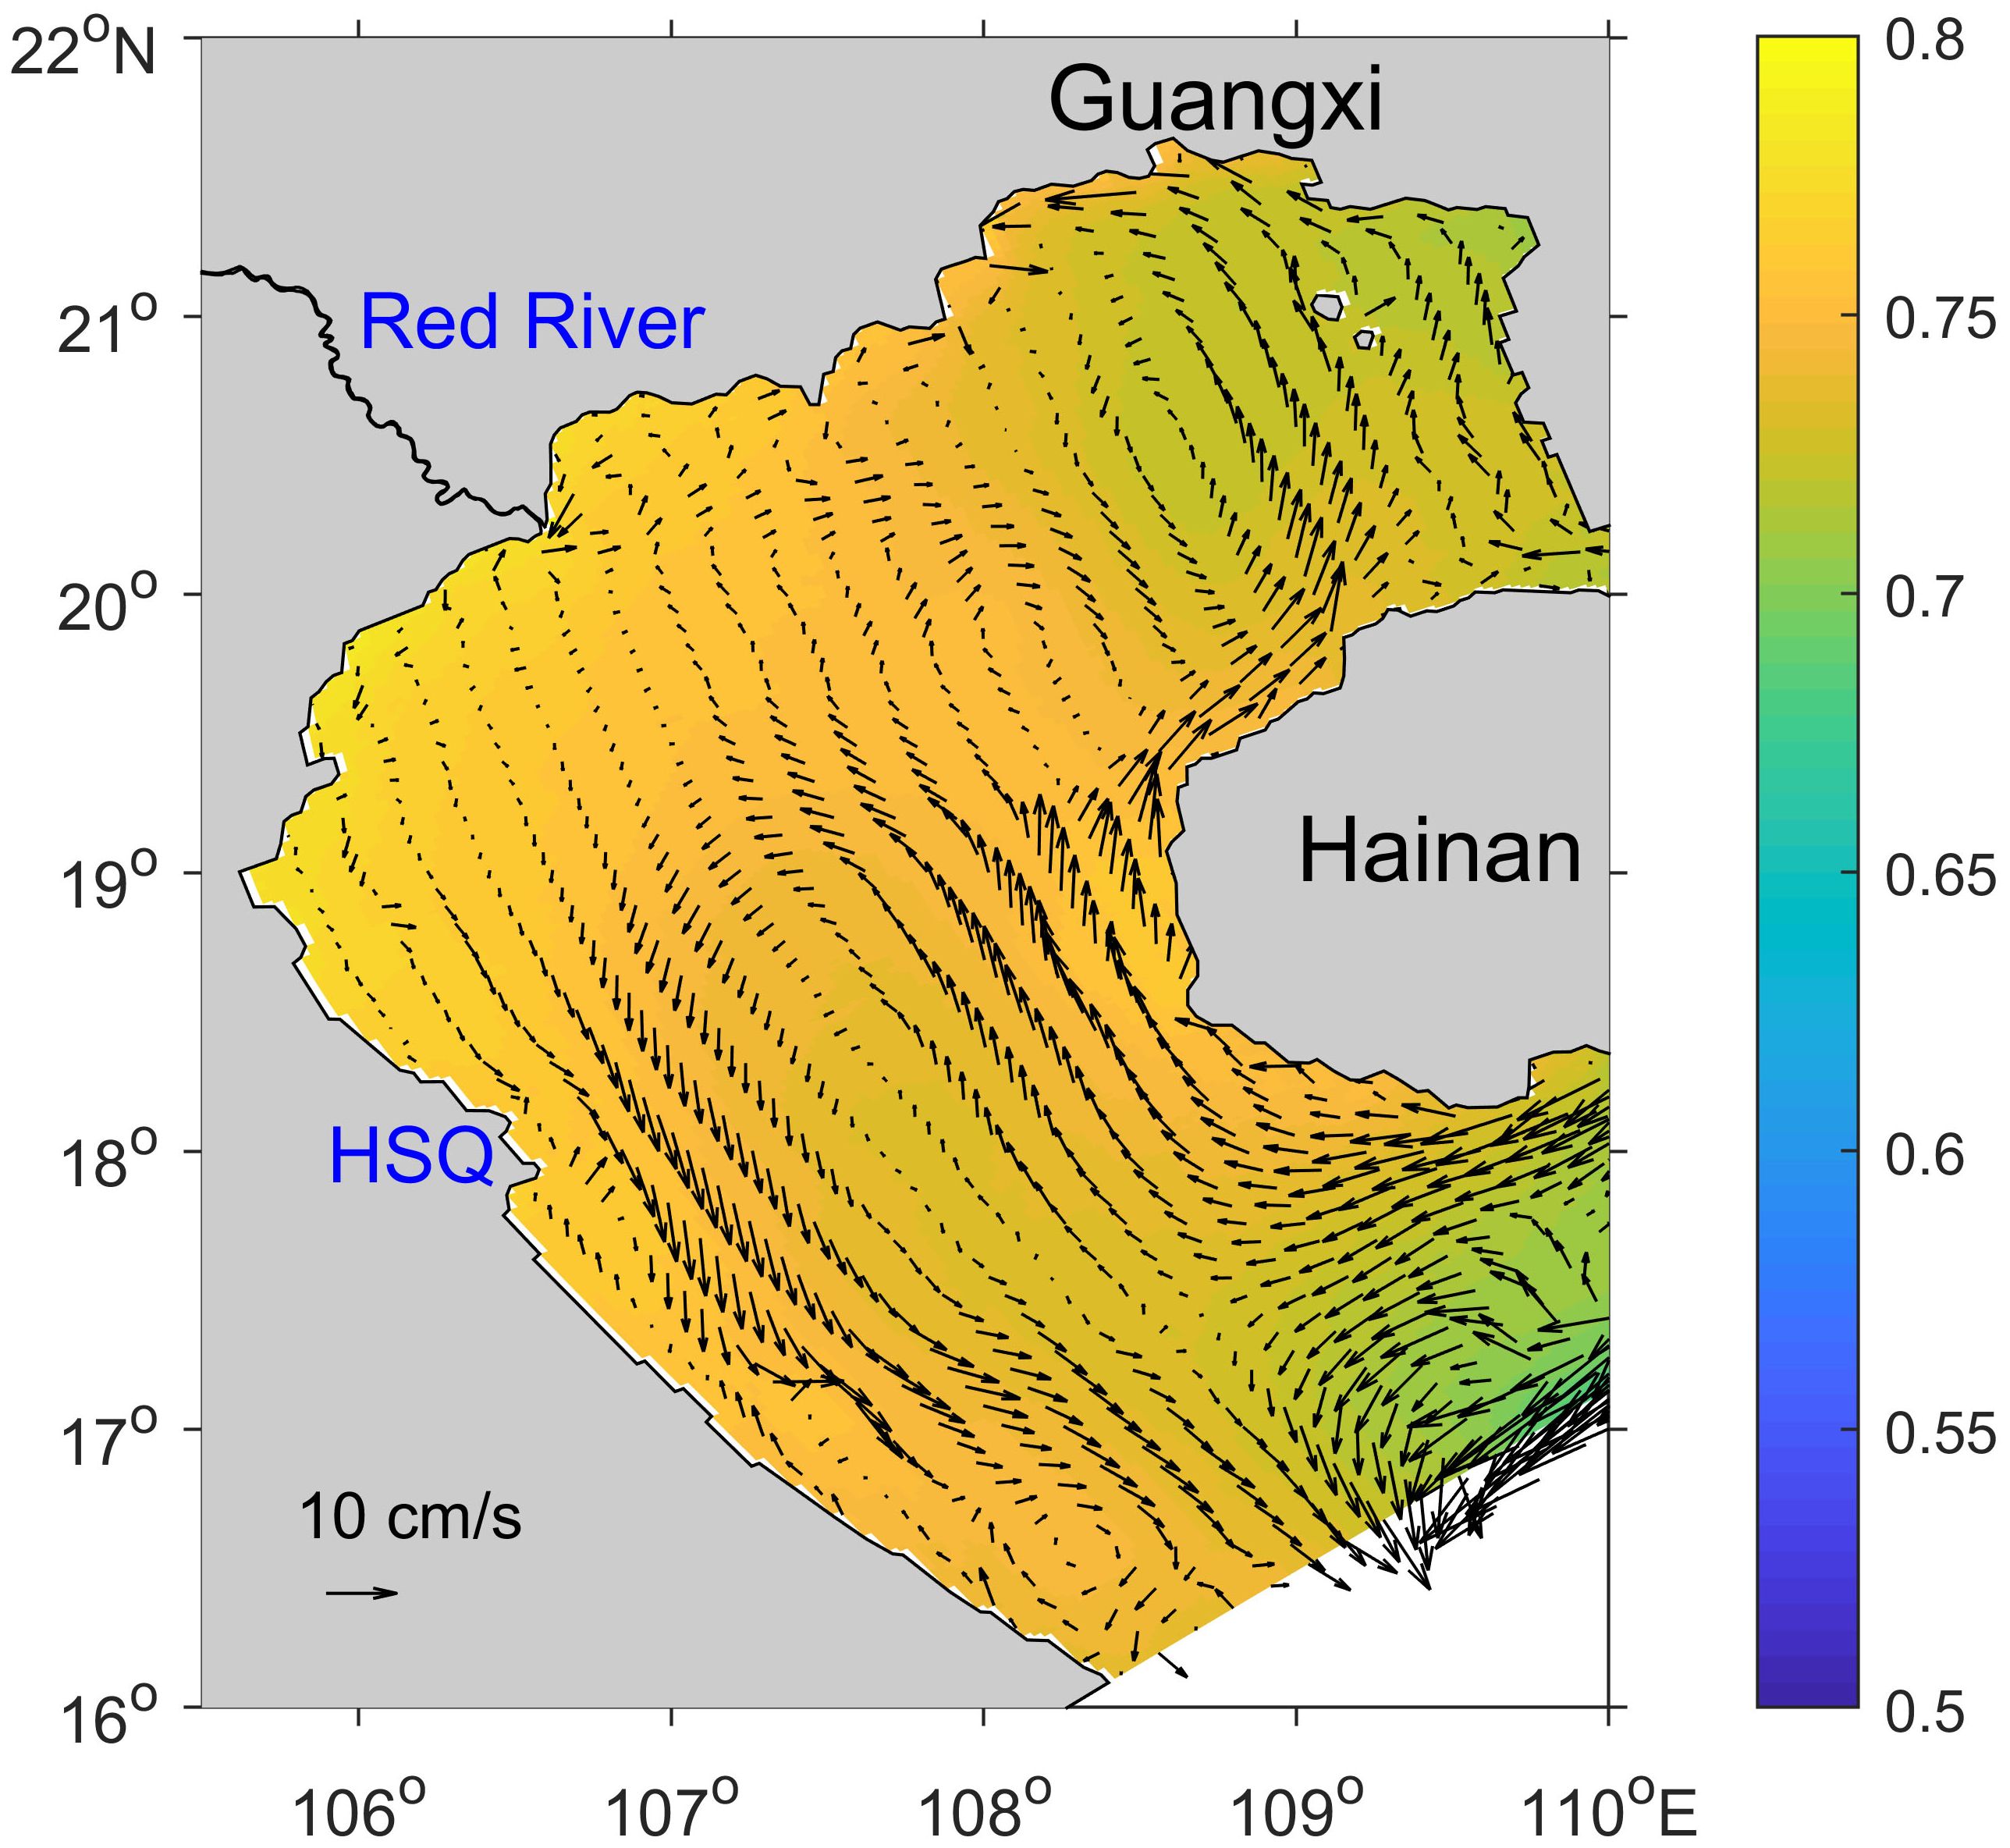
Figure 3 Spatiotemporal average circulation in spring (March–May) during 2006–2009.
Current data from two moorings (stations M4 and M5; Figure 1) show that the currents off the southern coast of Hainan Island are either northwestward or southwestward in the spring of 2007 (Wang et al., 2009), similar to the cases from the model results (Figure 3). Due to limited observed current data, only few validations have been conducted off the Vietnam coast. In this study, observed current off the Vietnam coast (station S1; Figure 1) between September 19 and 20, 2018 is utilized in this study, with a sampling frequency of 3 min. As previously mentioned, the general circulation structure is relatively stable on an interannual basis; therefore, the observed current off the Vietnam coast can be compared with the climatological (2006–2009) average current between September 19 and 20. After filtering the observed current with a truncation frequency of 72 h, the model results are consistent with the observation results (Table 1). Furthermore, the zonal current velocities from the model and observation results are 0.0605 and 0.0625 m/s, corresponding to meridional velocities of 0.0550 and 0.0518 m/s, respectively. The error percentages between the modeled and observed zonal and meridional current velocities are 3.2% and 6.18%, respectively.
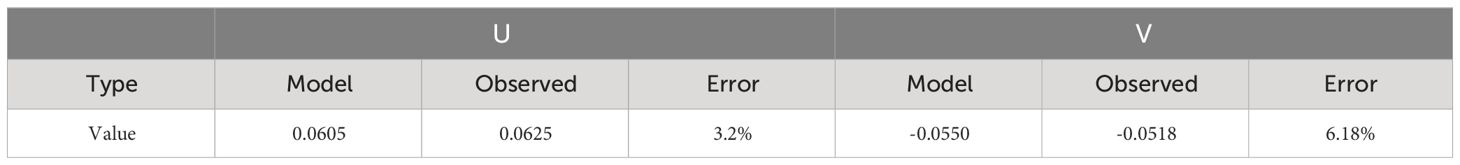
Table 1 Observed and modeled zonal and meridional current velocities at station S1.
Conversely, both remote sensing and model results suggest that there is a warm pool off the western coast of Hainan Island (Figure 4). Remote sensing data are obtained from the GHRSST OSTIA project (http://apdrc.soest.hawaii.edu/las/v6/constrain?var=12591), which focuses on operational sea surface temperature and sea ice analyses with a horizontal resolution of 0.5° × 0.5°. Based on the fiducial value, which is the spatiotemporal average sea surface temperature (SST) in the Beibu Gulf during 2006–2009, the average temperature difference of the warm pool (red rectangle in Figure 4) calculated based on remote sensing and model results is approximately 0.3565 and 0.3887°C, respectively. The modeled temperature off the coast in the Beibu Gulf is slightly greater than that inferred from remote sensing (Figure 4) possibly due to the high turbidity in coastal water. Wei et al. (2017) proposed that the SST deviation between the remote sensing and observation results can reach 0.5–0.6°C when the suspended sediment concentration is 5,000 mg/l, while it will rise to 1.0°C in some special situations. Besides the warm pool, the cold water mass (CWM) that was revealed by observational data in 1994 (Zhong, 1995) is also captured by this model, and its variation in spring is analyzed in the section 3.3.
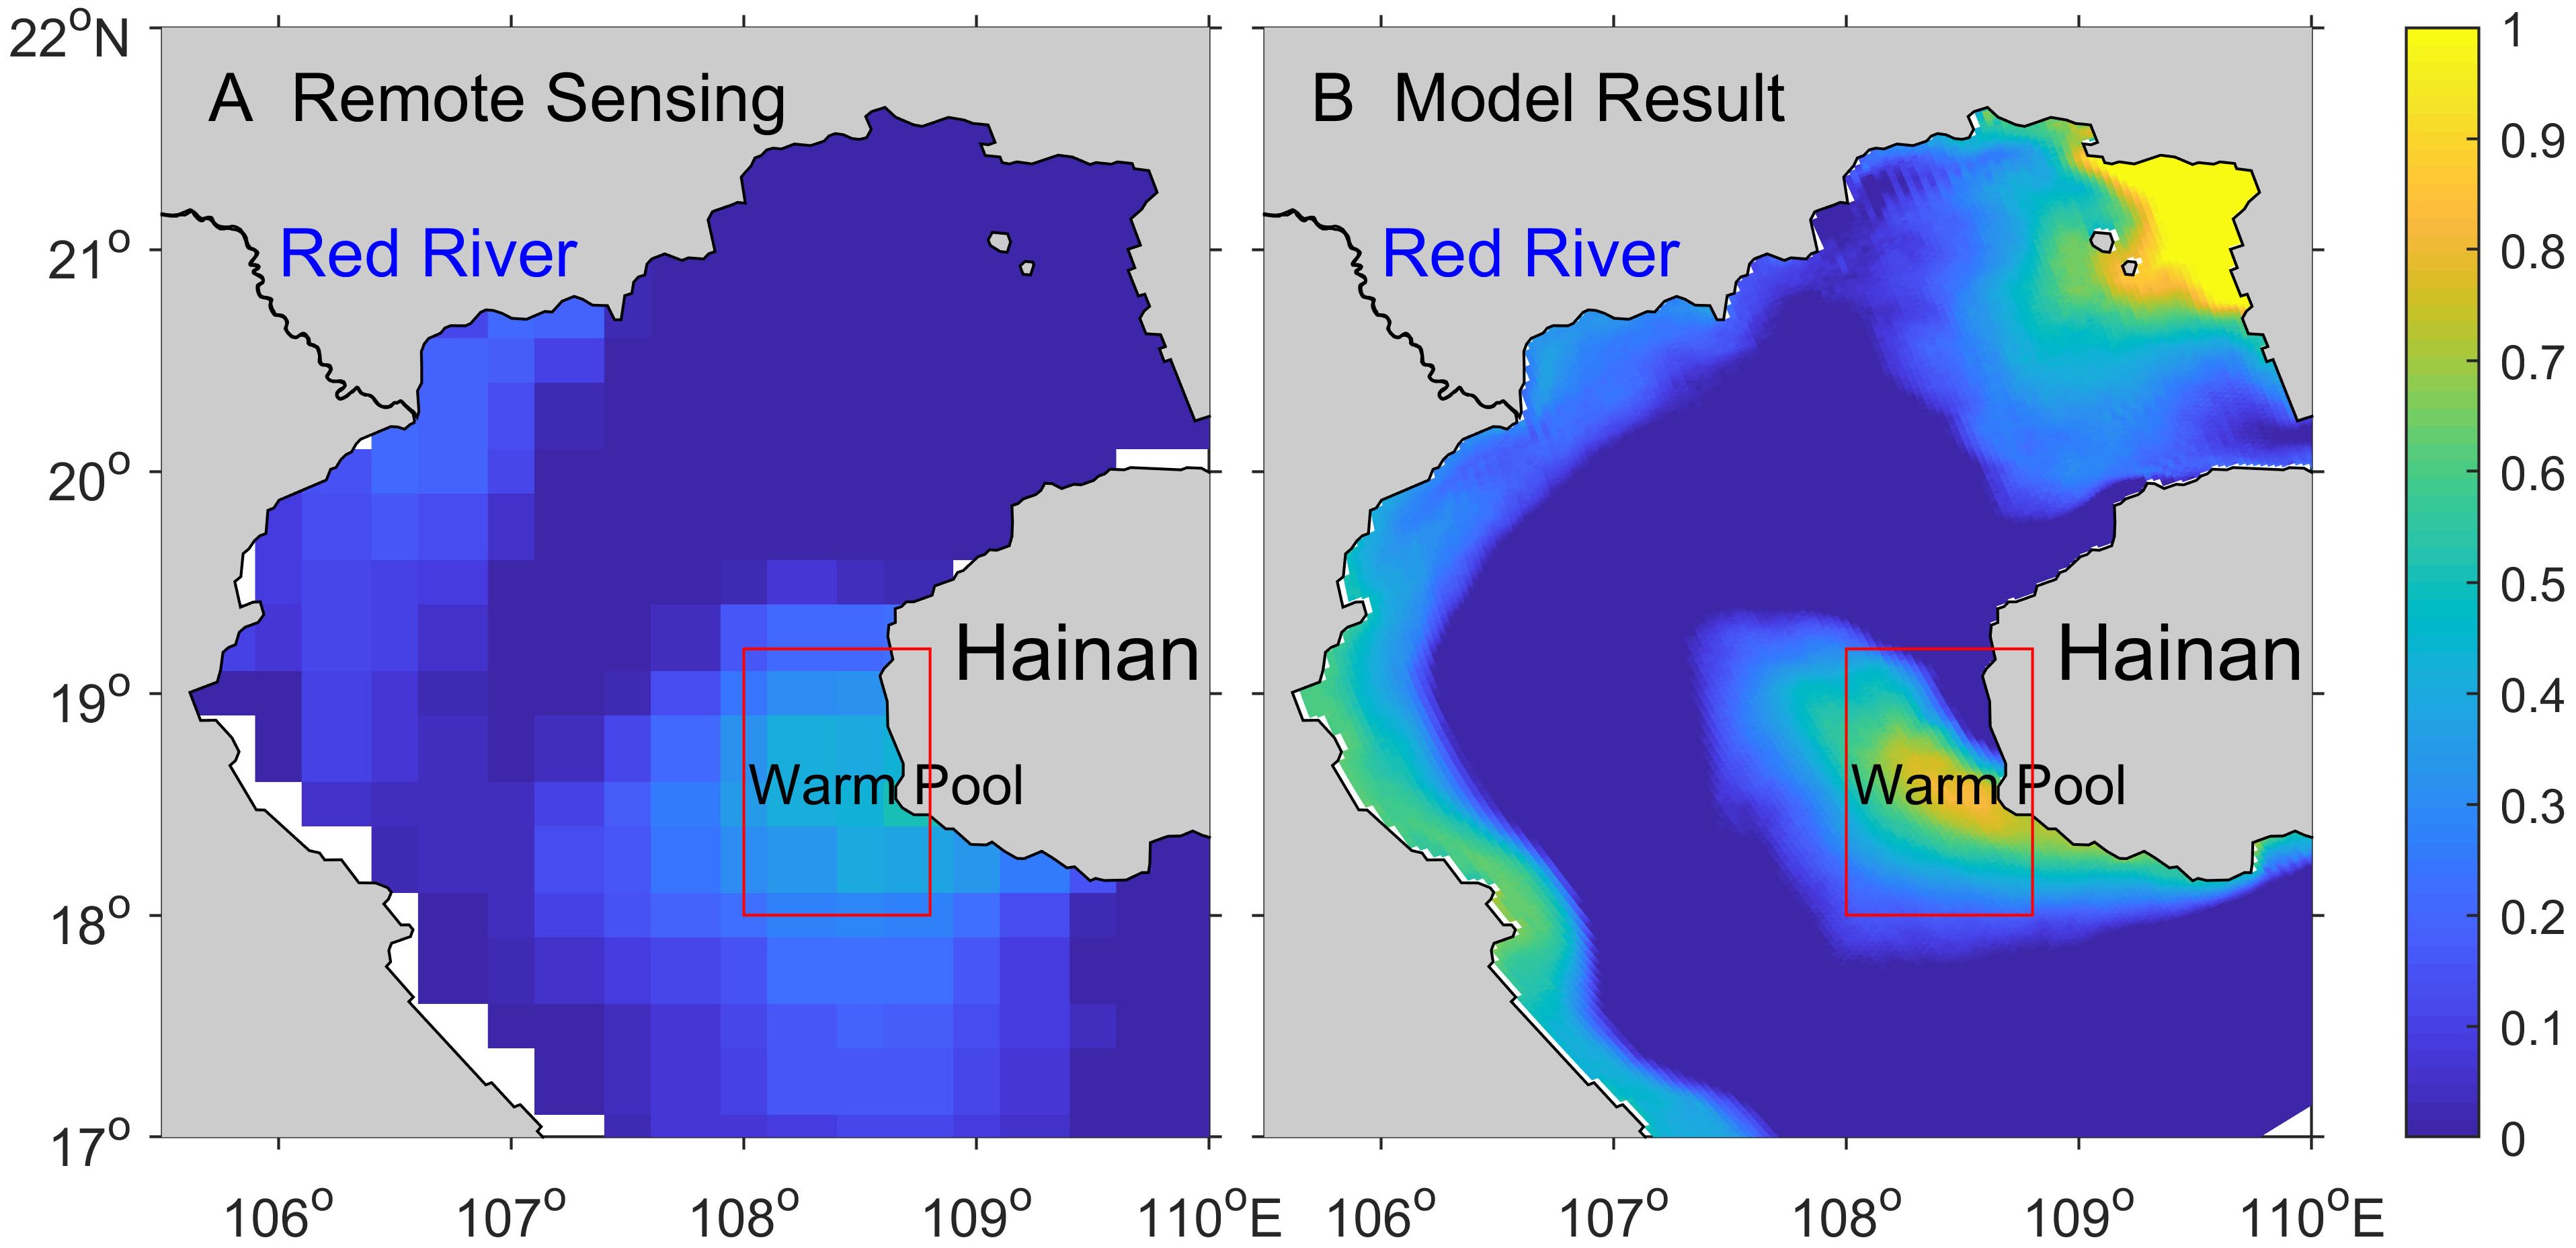
Figure 4 Sea surface temperature (SST; unit: °C) anomaly in October during 2006–2009 from remote sensing (A) and model (B) results. The fiducial value is the spatiotemporal average SST in the Beibu Gulf during 2006–2009.
Based on historical observational data (Figure 2), a cyclonic gyre exists in the northern Beibu Gulf. This result is in agreement with that revealed by the average spring circulation during 2006–2009 (Figure 3). To further analyze the circulation variation characteristics, the vertical and temporal average circulations in different year are shown in Figure 5. In general, a northwestward current from the SCS intrudes the Beibu Gulf in spring (Figure 5). One branch turns northeastward off the northwestern coast of Hainan Island and then transfers northwestward off the Guangxi coast. Subsequently, this current meets the northeastward current off the northern coast of Vietnam (VNC). Finally, an enclosed cyclonic gyre forms in the northern Beibu Gulf. Another branch turns westward off the western coast of Hainan Island and flows out of the Beibu Gulf to form another cyclonic gyre. The circulation structure is similar to that revealed by previous studies (Zhong, 1995; Su and Yuan, 2005; Zhang et al., 2009; Chen, 2013; Chen et al., 2020), albeit with some new features.
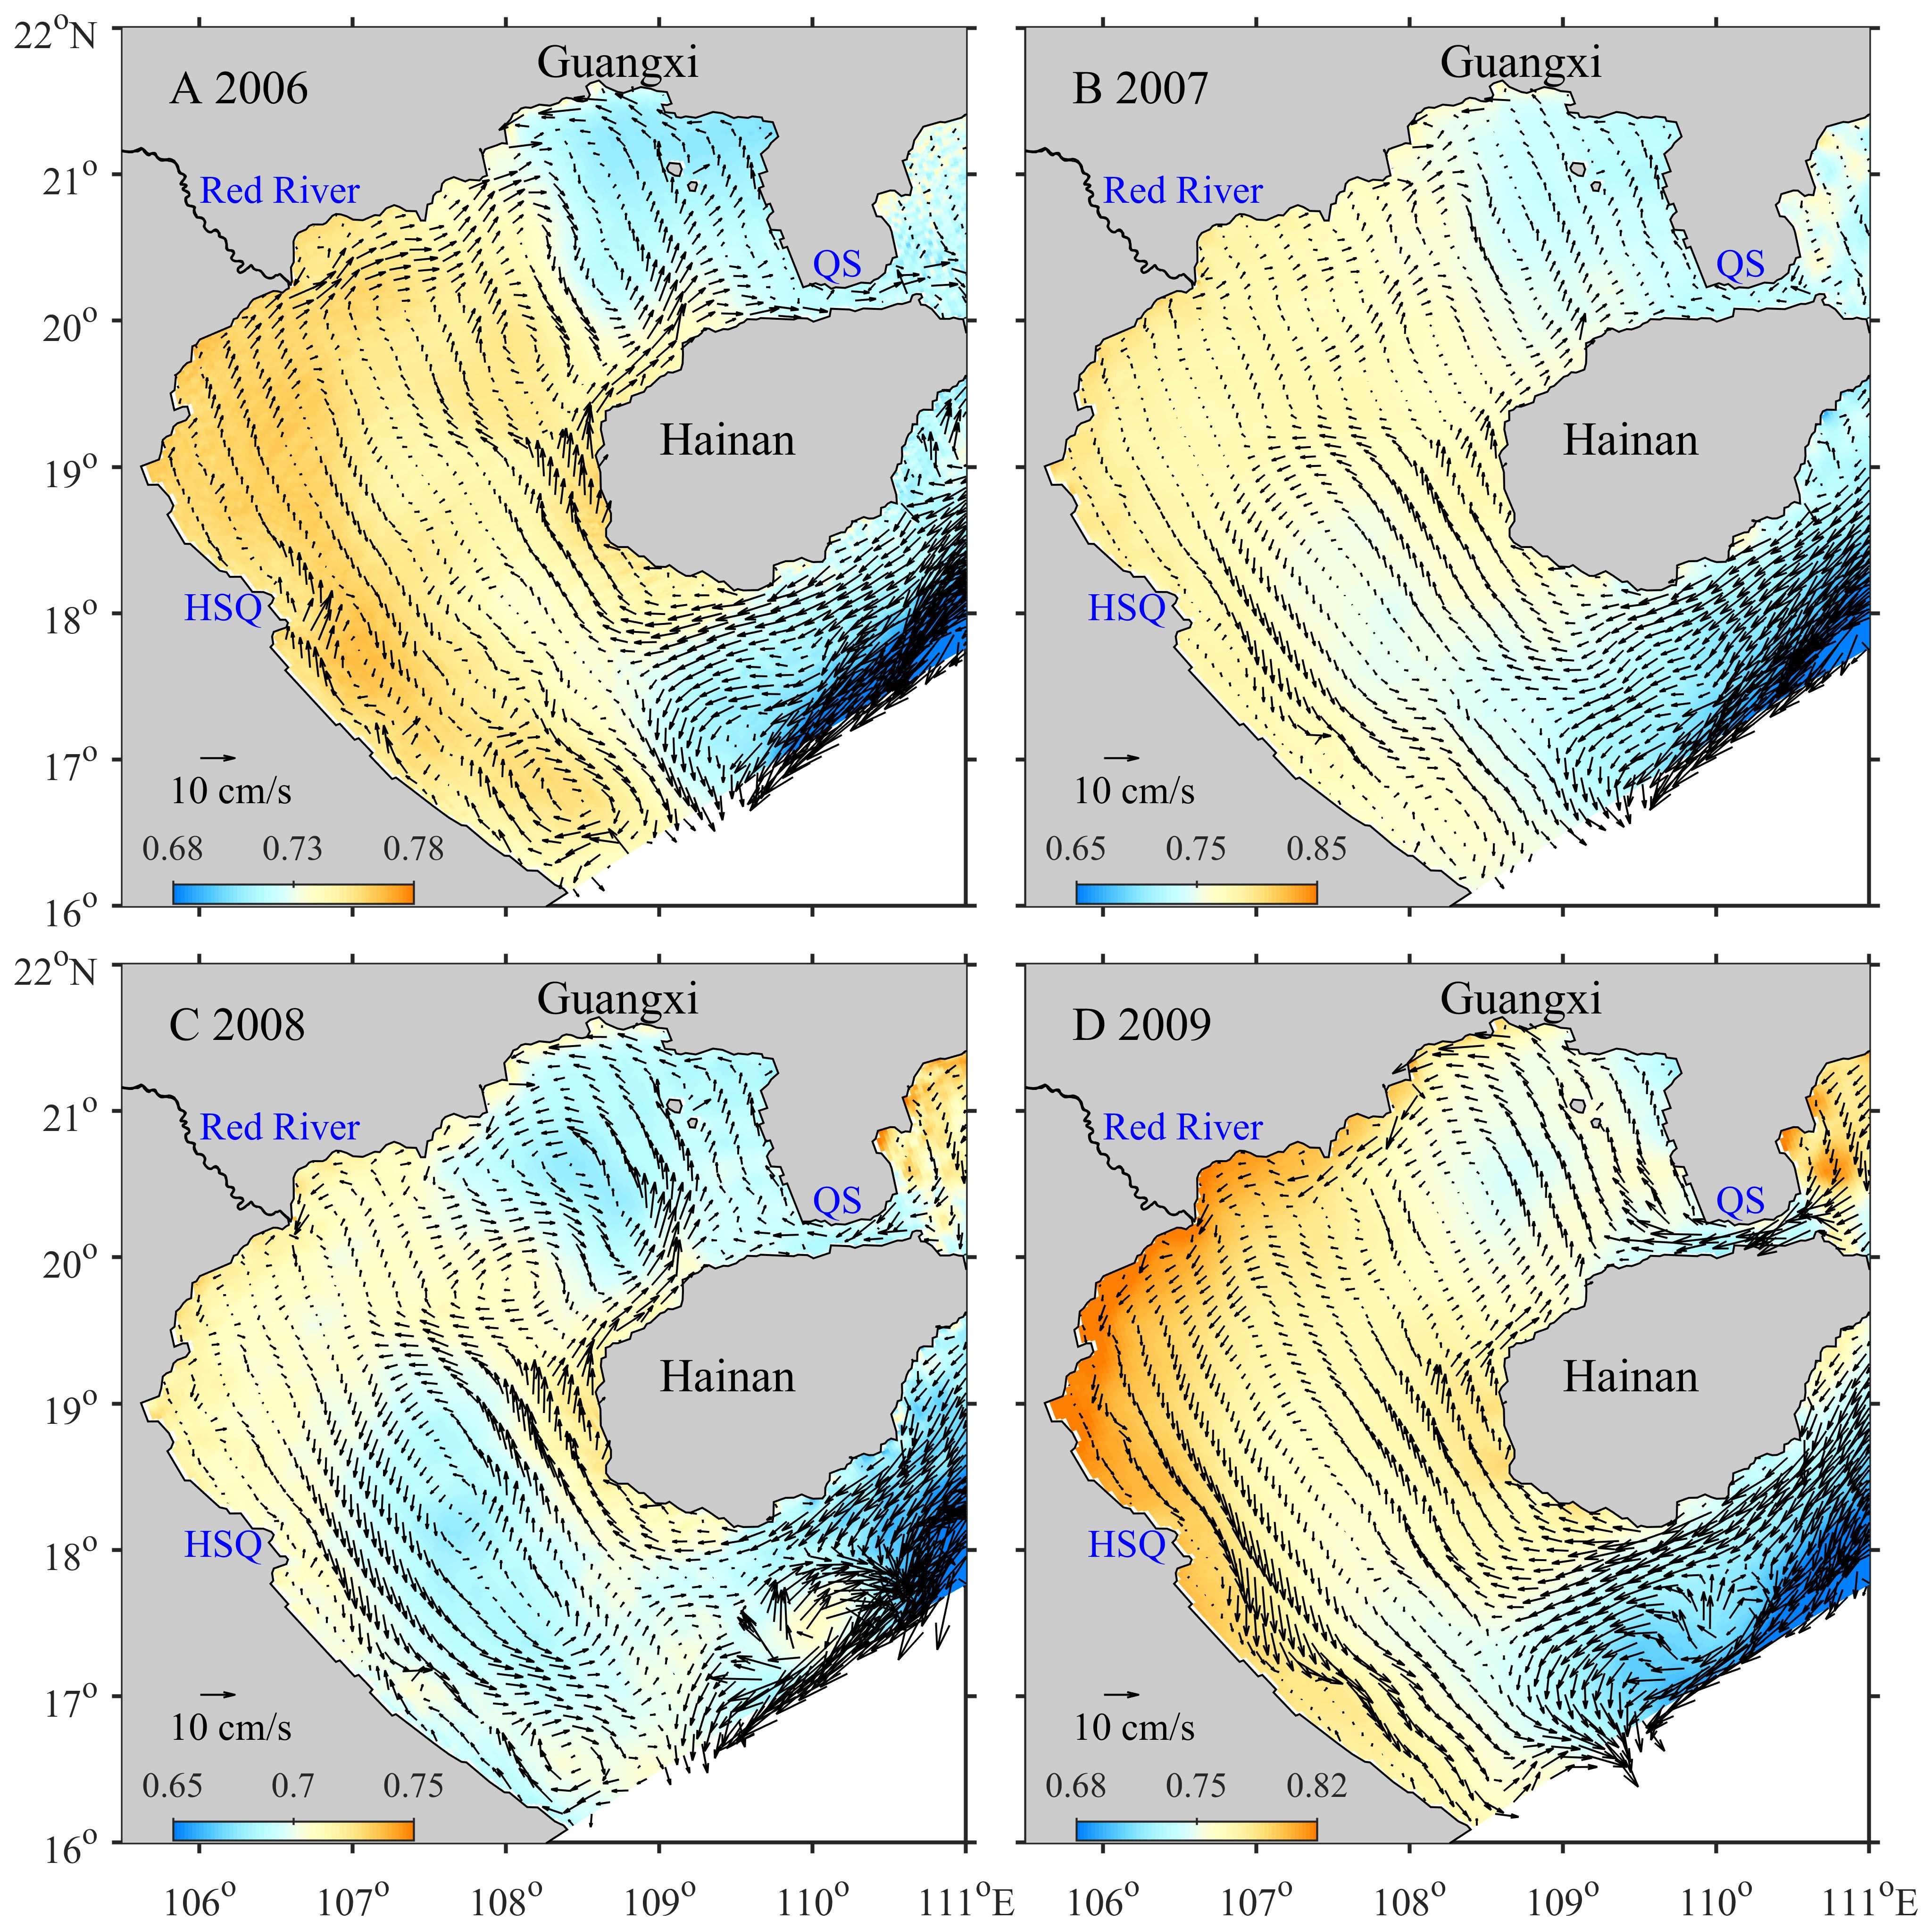
Figure 5 Vertical and temporal average circulation in the springs of 2006 (A), 2007 (B), 2008 (C), and 2009 (D), with the color representing elevation (m).
The enclosed gyre in the northern Beibu Gulf also exhibits interannual variations, with the occupying range in April 2006 and 2009 being larger than that in April 2007 and 2008. Additionally, the VNC was northeastward in 2006 and 2007 and southwestward in 2008 and 2009. Based on historical data, Su and Yuan (2005) proposed that the VNC is southwestward. The variation characteristics of the VNC are further analyzed in section 5.
The strength of the current off the northwestern coast of Hainan Island also shows obvious interannual variations during the four years. According to research, the southern Beibu Gulf is affected by a cyclonic gyre (Su and Yuan, 2005). Interestingly, results show that the southern cyclonic gyre was enclosed and unclosed in April 2006 and 2008 and April 2007 and 2009, respectively.
To analyze the vertical distribution, the circulations in April of the four years are shown in Figure 6. In the vertical, the circulation at the surface differs from those in the middle and deep layers, implying that the monsoon wind is not the only driving factor. The surface current was northeastward in April 2006 and 2008, whereas it became northwestward in April 2007 and 2009. The circulations in the layers below the 20-m layer were similar. In April 2008, the circulation at the 20-m layer (northeastward) was different from those at the 30- and 50-m layers (southwestward) (Figures 6J–L).
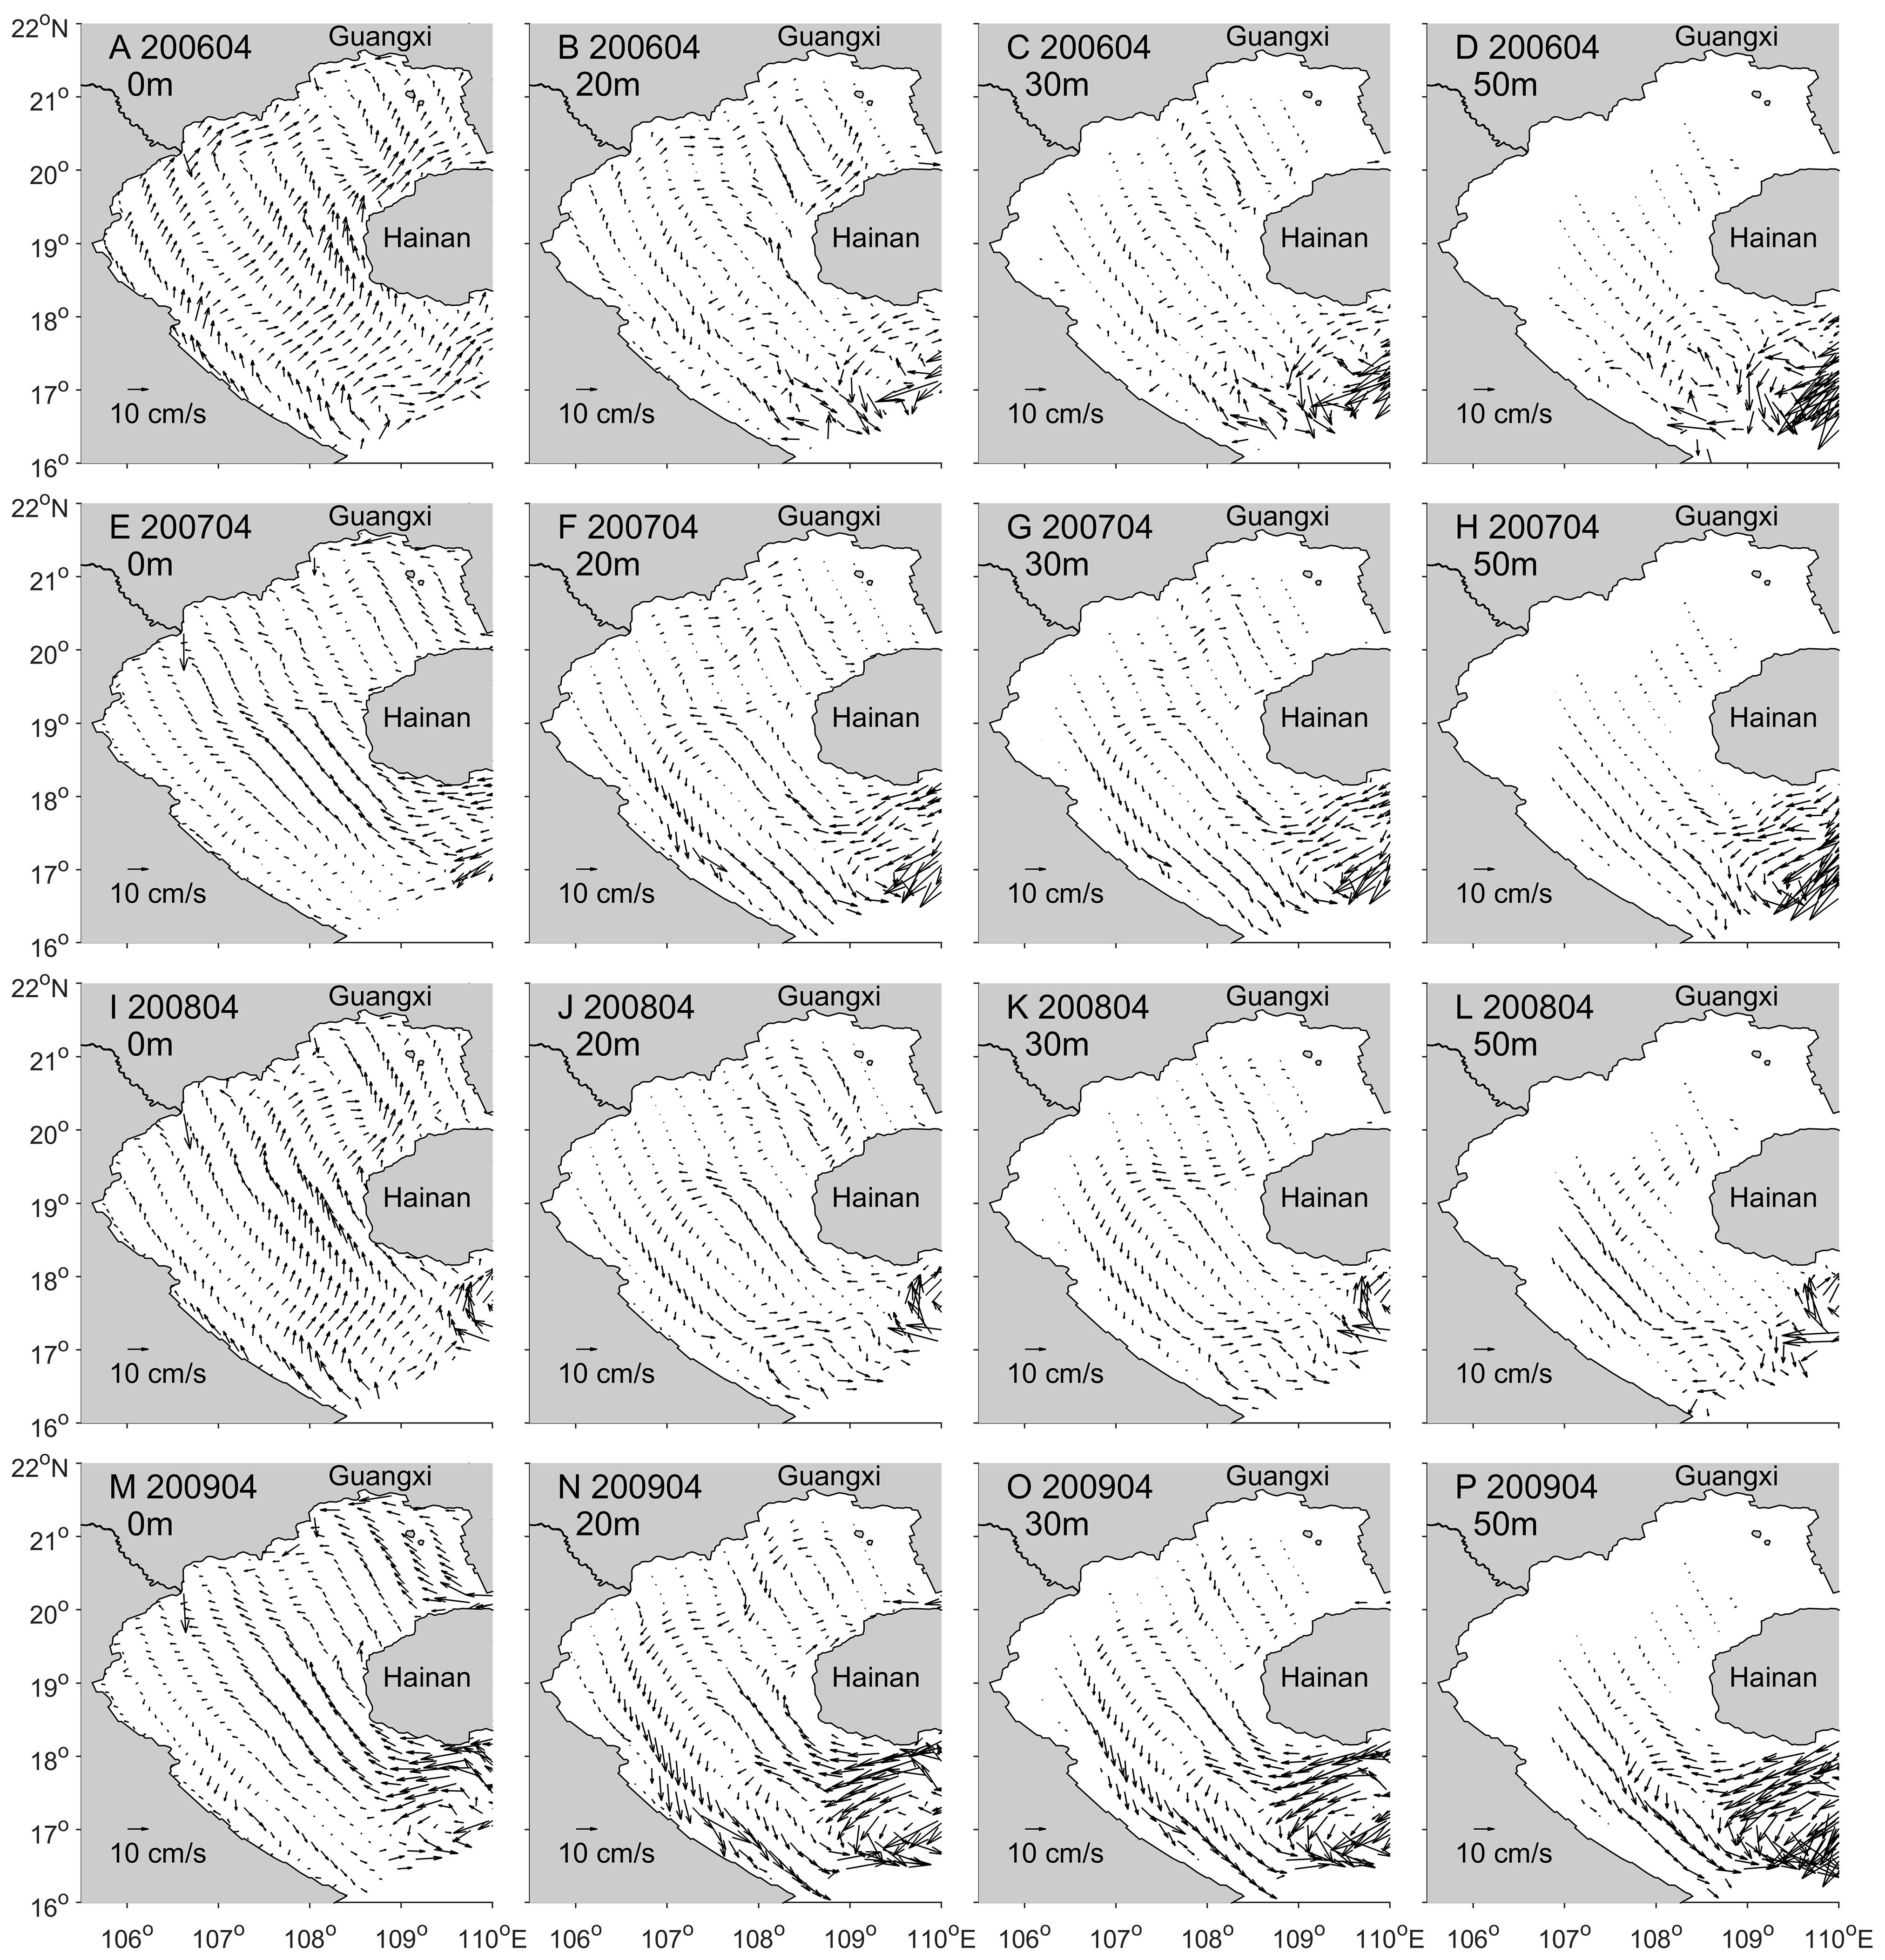
Figure 6 Circulation at the surface (A, E, I, M), 20-m (B, F, J, N), 30-m (C, G, K, O), and 50-m (D, H, L, P) layers in April 2006 (A–D), 2007 (E–H), 2008 (I–L), and 2009 (M–P), respectively.
Over the past two decades, several studies suggested that the current in the QS is westward throughout year (Shi et al., 2002; Zu, 2005; Chen et al., 2007; Yan et al., 2008; Chen et al., 2009). However, the observation results during 2006 and 2007 and 33 repeat shipboard ADCP surveys in the QS during the spring of 2013 reveal that the current in the QS can be eastward during certain days in the spring and summer (Zhang et al., 2009; Gao et al., 2013; Zhu et al., 2014). The statistical results reveal that the zonal current velocity is approximately twice the meridional current velocity in the QS; however, their variation phase is basically synchronous, with the mean correlation coefficient being 0.97. This shows that, in spring, the QS is dominated by either a northeastward or a southwestward current.
Furthermore, the statistical results for the zonal current (Table 2) show that the average strength of the eastward current (0.2717 m/s) is lower than that of the westward current (0.3583 m/s) in spring, and the maximum velocity of the current is westward greater than that of the eastward current, revealing that the QS is mainly controlled by the westward current. In the spring of 2006, although the eastward current (0.1216 m/s) is slightly lower than that of westward current (0.1388 m/s), the occurrence proportions of the eastward current exceeds 50%, resulting in the eastward current in the spring of 2006 (Figure 5A). In the springs of 2006–2009, the occurrence proportions of an eastward current were 55.4%, 50%, 45.7%, and 29.3%, respectively (Figure 7). A comprehensive analysis of the mean current velocity and occurrence proportion indicates that the current in the QS clearly flowed eastward and westward in the springs of 2006 and 2009, respectively, whereas weak and moderate westward currents occurred in the springs of 2007 and 2008, respectively (Figure 7). In addition, the longest durations of a spring eastward current (i.e., continuous eastward current) were 11, 18, 11, and 7 d in 2006–2009, respectively.
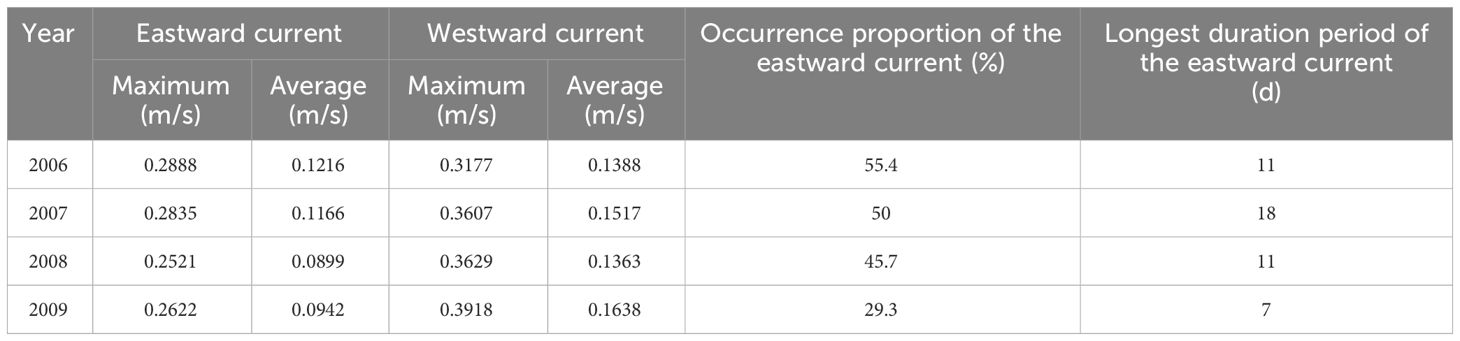
Table 2 Statistical results for the duration period and strength of the current in the QS.

Figure 7 Zonal current variations in the springs of 2006 (A), 2007 (B), 2008 (C), and 2009 (D), respectively. The current station is located in the middle of the QS (purple star in the Figure 1). The eastward direction is indicated as positive values.
Based on observations and sensitive experiments, the tidal rectification is found to be dominant in the westward residual current all year round in the QS (Shi et al., 2002). According to the observations and model results, it is revealed that the current in the QS is affected by the sea level difference between two entrances of the QS (Gao et al., 2013). Using the current profile surveys in the spring of 2013, the sea level difference between two entrances of the QS and the tidal rectification are thought to be the driving factor (Zhu et al., 2014). Actually, the current in the QS, affected by the monsoon wind, tidal rectification, the current off the southern coast of Guangdong and the circulation in the Beibu Gulf, is very complex. Therefore, new observations are needed to further analyze the variation mechanism of the current in the QS.
The variation of the CWM was revealed using the temperature difference (TD) between the surface and bottom layers (Chen et al., 2015). In the southern Beibu Gulf, the strong TD cannot support the existence of CWM (Figure 8), because the strong TD is induced by the low temperature in the deep water (Figure 1). Conversely, the water depth in the northern Beibu Gulf is lower than that in the southern Beibu Gulf (Figure 1); however, the strength of the TD there is much stronger than that in the southern Beibu Gulf. Therefore, the TD in the northern Beibu Gulf is associated with the CWM. In general, the CWM forms in winter, grows in spring, matures in summer, and disappears in autumn (Gao et al., 2013; Chen et al., 2015); however, its interannual as well as daily variation characteristics have not been analyzed till now.
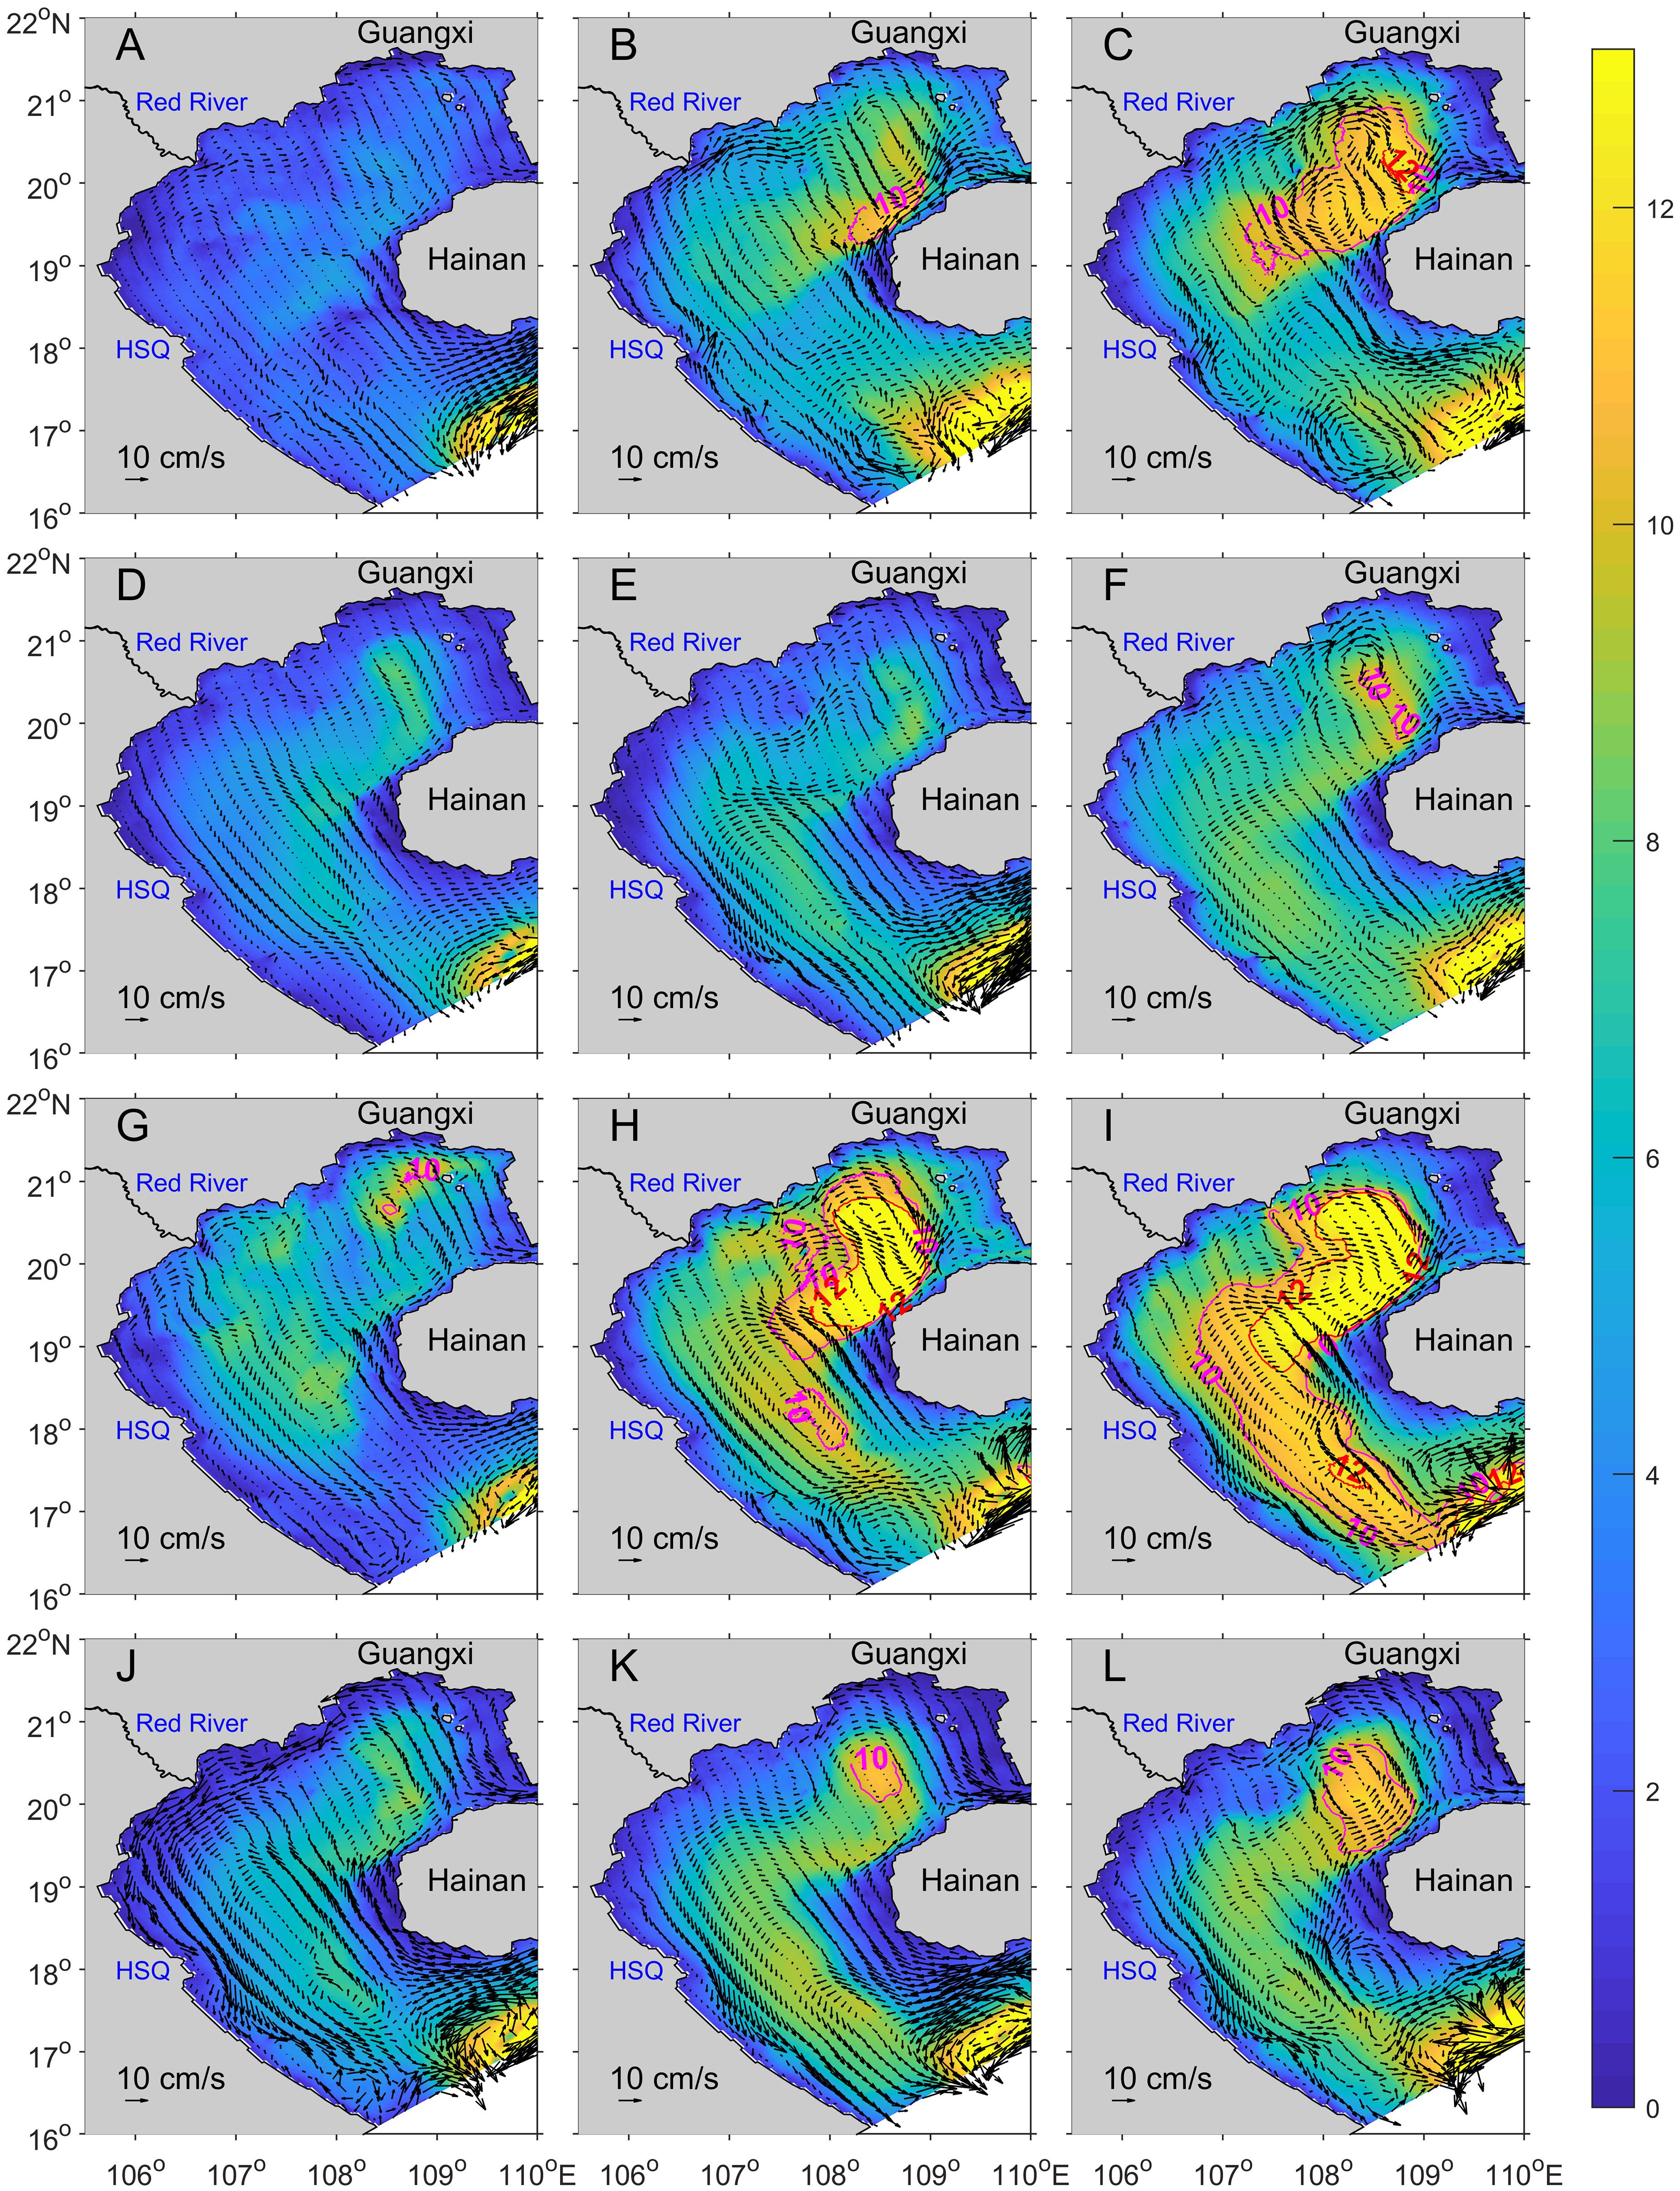
Figure 8 Variation of the cold water mass (CWM) and vertical average circulation in the springs of the four years, with panels (A–C, D–F, G–I, J–L) representing March–May of 2006, 2007, 2008, and 2009, respectively. Red and purple lines represent the 12- and 10-°C isolines, respectively. Colors indicate the temperature differences between the surface and bottom layers.
From March to May, the CWM becomes stronger when the strength and range of the TD increase. At the same time, the cyclonic gyre becomes stronger in the northern Beibu Gulf. This result is similar with that of Zhong (1995), who concluded that the spring circulation in the northern Beibu Gulf is driven by the thermohaline circulation and topography. Actually, the thermohaline circulation is associated with the CWM in the northern Beibu Gulf, and the monsoon wind also plays a significant role. In this study, the CWM in the spring of 2007 was the weakest, and the 10°C isoline for the TD in May 2007 occupied only a small region. Conversely, the 10°C isoline in May 2008 could expand to the southern Beibu Gulf, and the northern Beibu Gulf was dominated by the 12°C isoline in relation to the CWM. In May 2006 and 2009, the 10°C isoline was associated with the cyclonic gyre and CWM. The CWM existing in April 2007 is reported by Huang et al. (2009).
A strong CWM occurred in the spring of 2008; therefore, the daily variation of the CWM in April of that year is shown as Figure 9. Overall, the range of the CWM increased gradually from April 1 to 30, with the occupying area of 1472, 6945, 13204 and 21733 km2 on April 1, 6, 24, and 30, respectively. However, it decreased slightly from April 10 to 12. Initially, the shape of the CWM was crescent on April 1; subsequently, the CWM became thicker. According to the vertical cross section (not shown), the TD increased in the first 5 d due to the surface temperature increasing and the bottom temperature remaining largely unchanged. In the following 15 d, the TD decreased because vertical mixing triggered an exchange between the surface and deep waters. Thereafter, the TD increased again because of the formed thermocline layer blocking the hot surface water from diffusing downward.
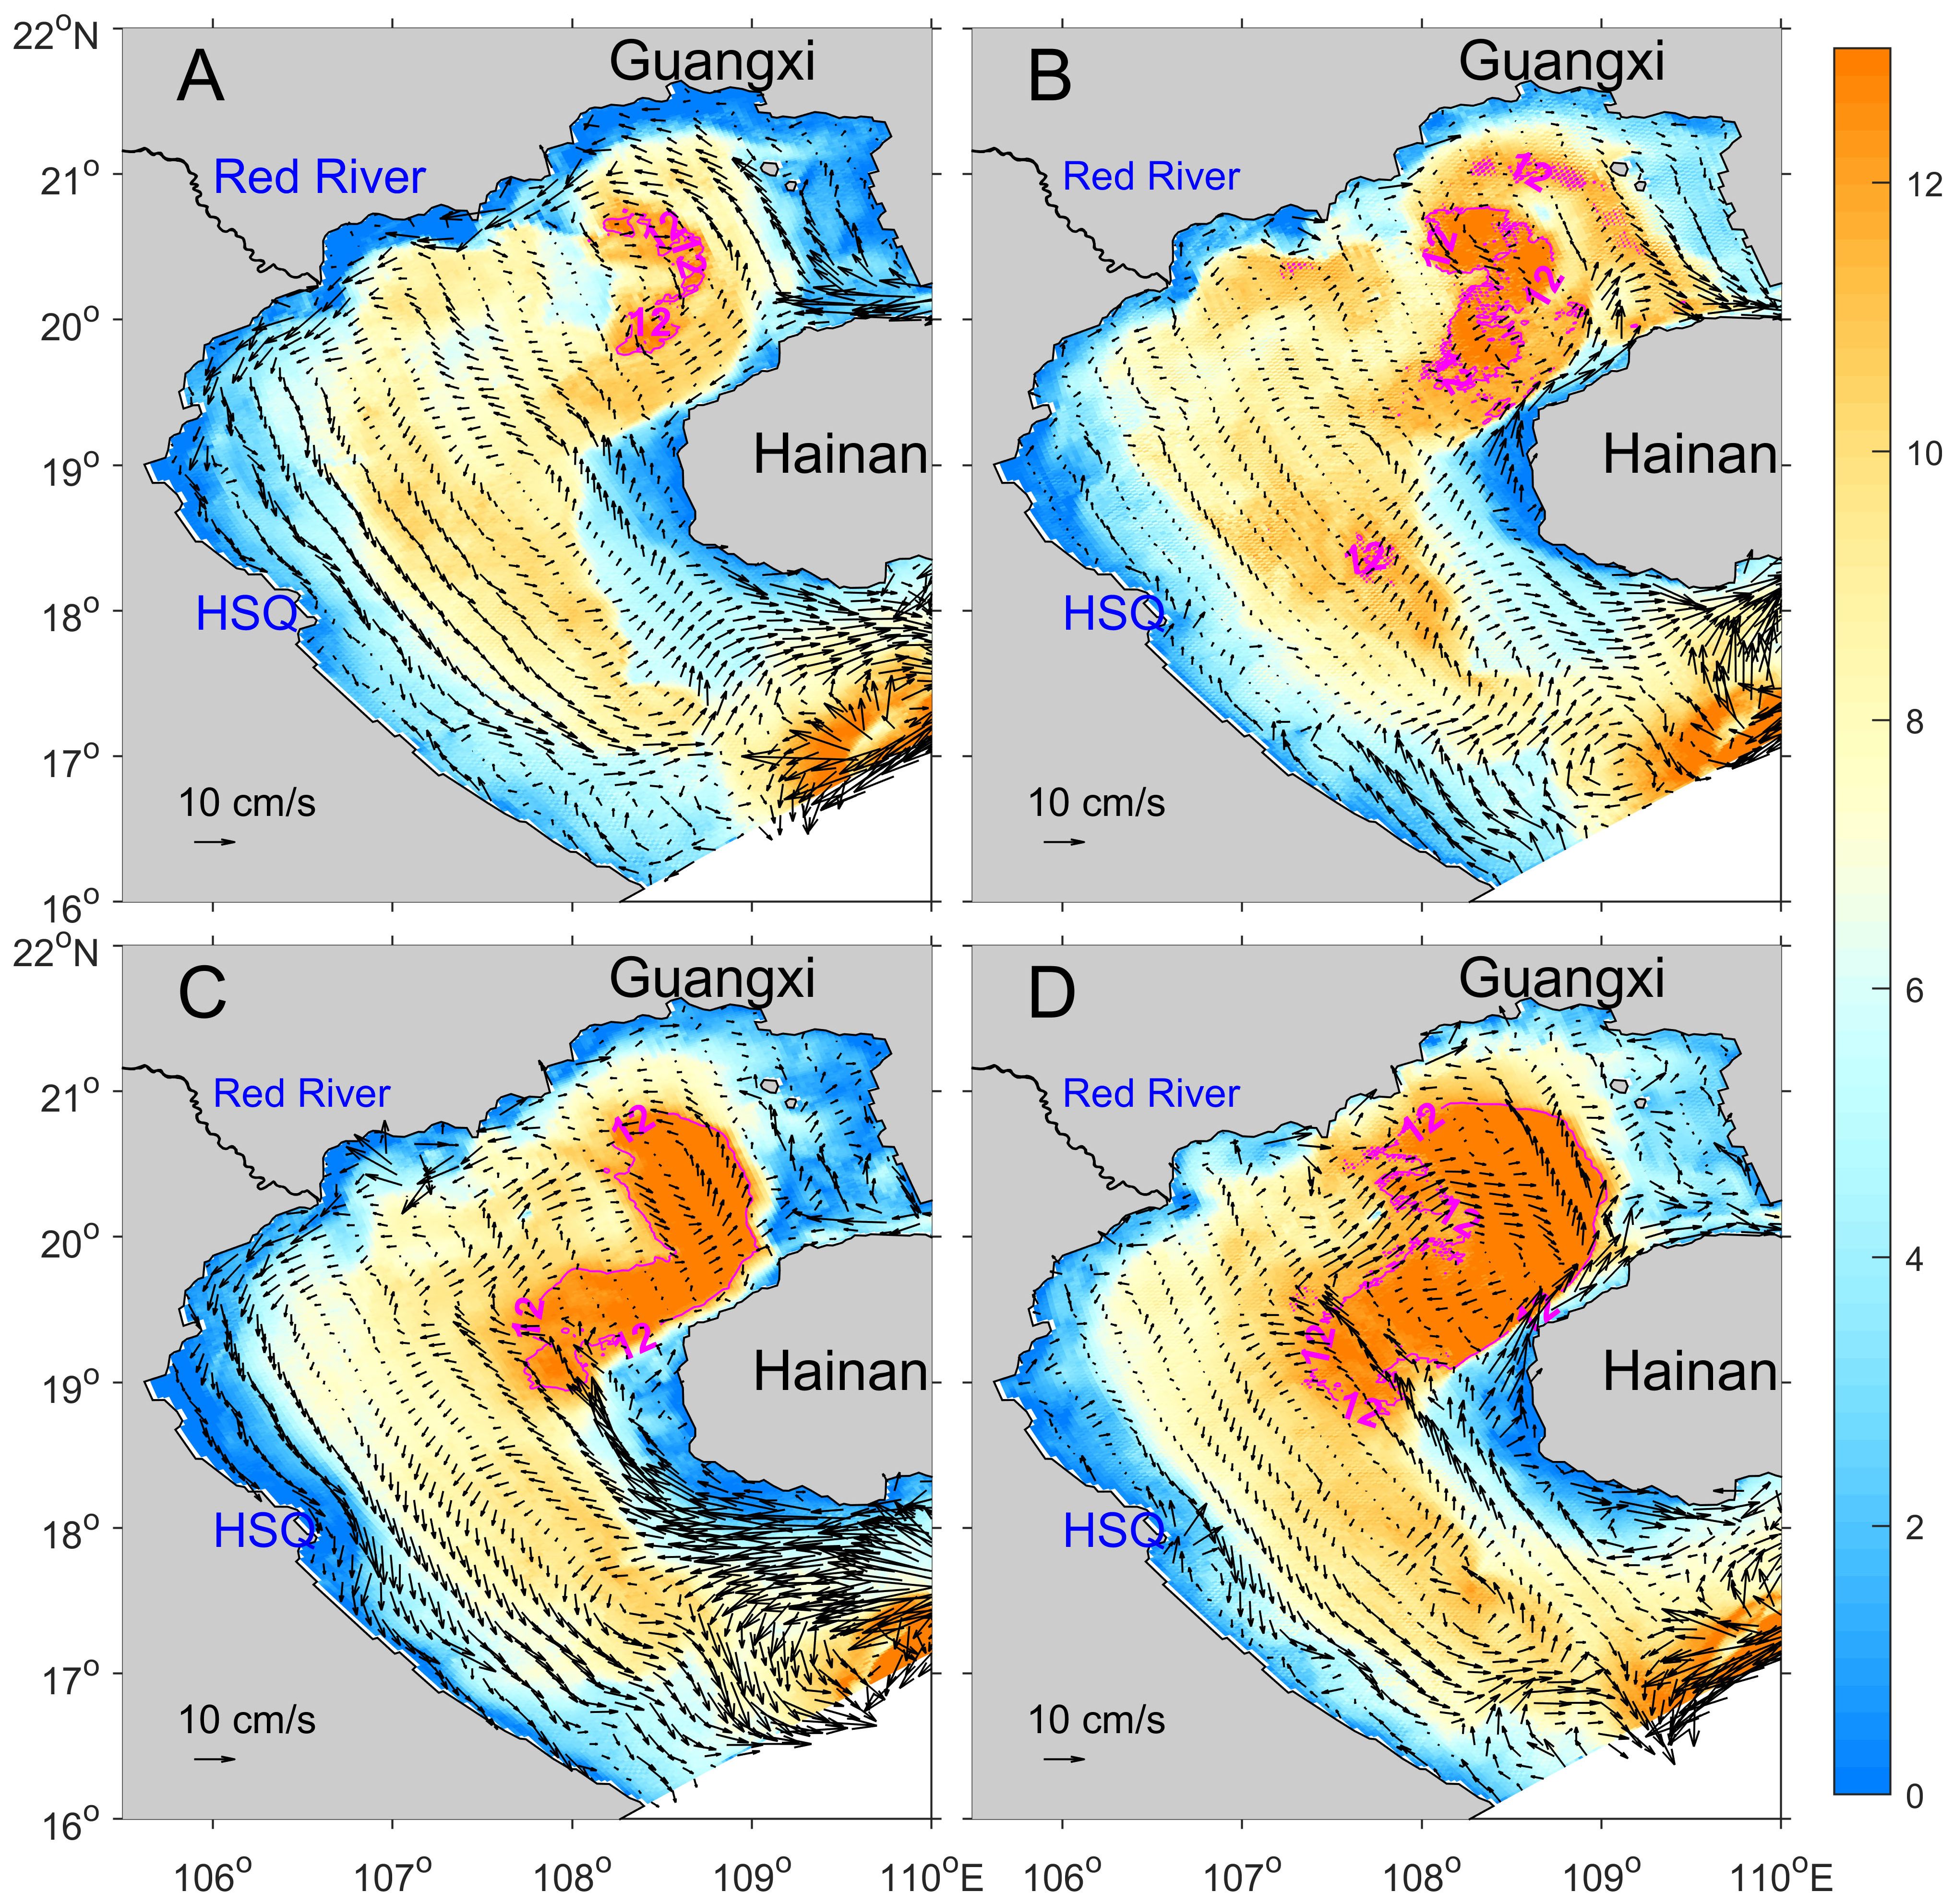
Figure 9 Daily variation of temperature difference (TD) between the surface and bottom layer, with panels (A–D) representing the TD distribution on April 1, 6, 24, and 30, 2008, respectively. Purple lines represent the 12-°C isoline. Colors indicate the temperature difference between the surface and bottom seawater.
The VNC is characterized by substantial controversy, with researchers supporting either a northeastward or a southwestward current concept (Su and Yuan, 2005; Gao et al., 2017). In this study, the VNC can be either northeastward or southwestward in spring in different years; for example, it was obviously northeastward and southwestward in May 2006 and March 2009, respectively (Figure 8). The spatiotemporal variation of the VNC at station P1 reveals that the VNC has apparent daily variation characteristics (Figure 10). In May 2006, the current was northeastward between the surface and bottom layers in the first 11 d; however, it became southwestward in the upper layer between May 12 and 16, when the currents were northward or southeastward in the middle and bottom layers, respectively. Subsequently, the current switched back to a northeastward direction between the surface and bottom layers in the last 15 d except May 21, when the currents in the middle and deep layers were eastward. In March 2009, the current was mainly southwestward between the surface and bottom layers except in two periods: From March 8 to 11, the current in the upper layer was still southwestward, whereas the current in the middle layer was eastward or northeastward in response to the northward current in the deep layer. From March 20 to 22, the current was almost northeastward or northward in the vertical, with the current in the deep layer being northward from March 16 to 19. Therefore, the VNC is relatively stable-nested, exhibiting 6 d of non-mainstream behavior in one month.
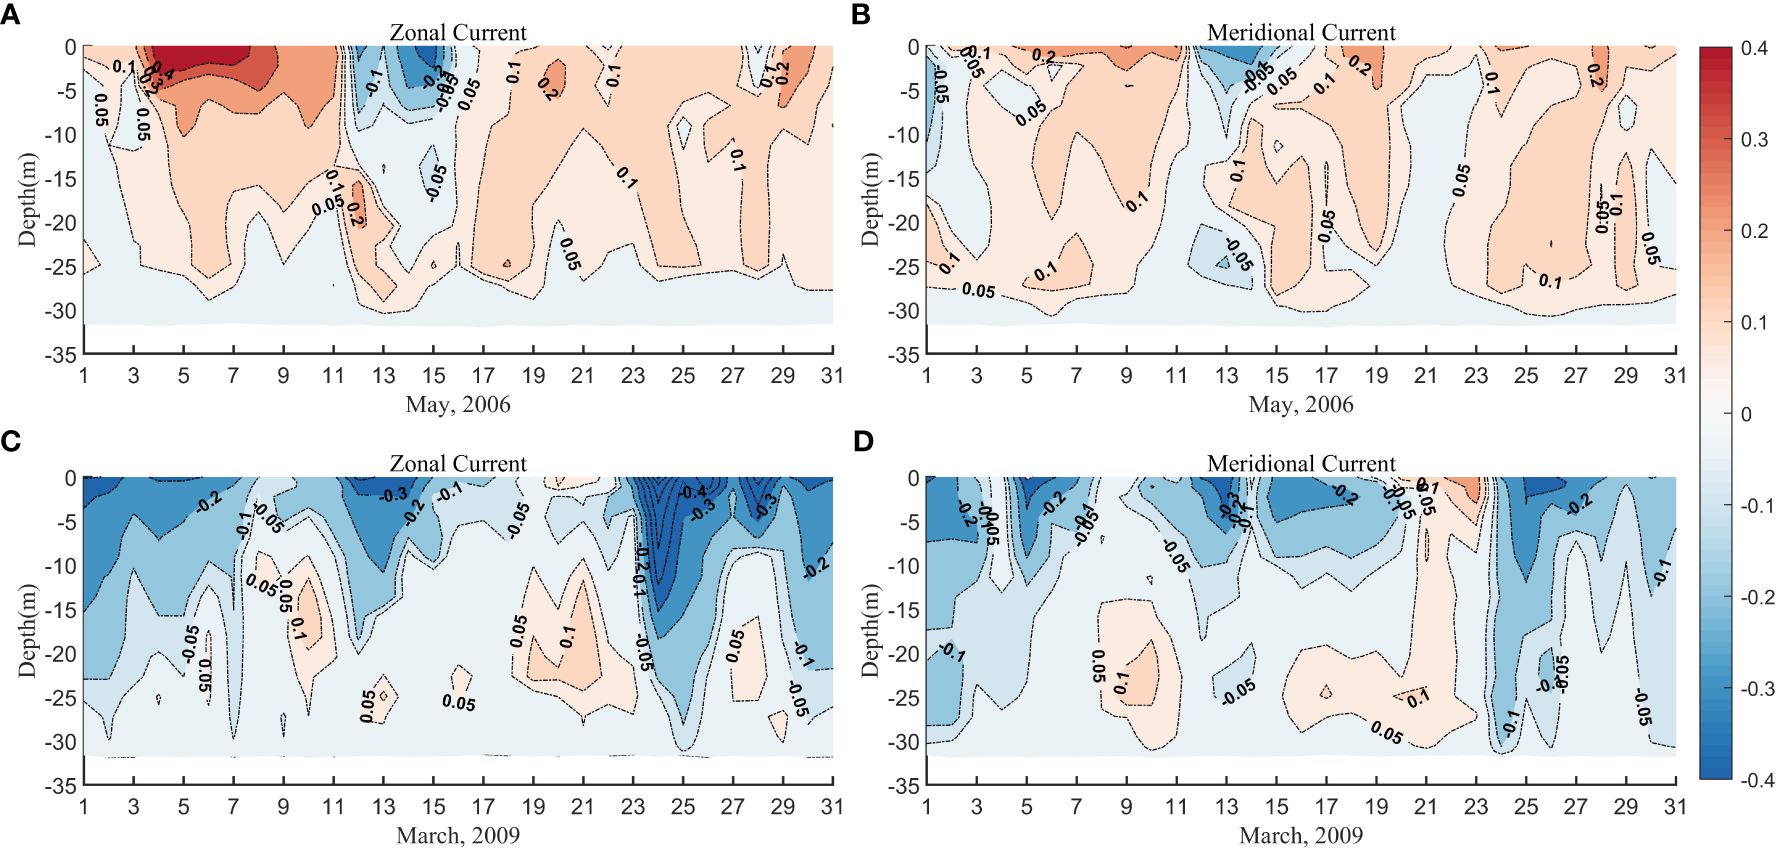
Figure 10 Vertical distributions of the zonal (A, C) and meridional (B, D) components of the current at station P1 in May 2006 (A, B) and March 2009 (C, D).
Three sensitive experiments—no tide, no heat flux, and no wind—were conducted to distinguish the effects of the forces (Figure 11). Without the force of tide (Figure 11B), the main circulation structure is similar to that in the control run (Figure 11A); however, the elevation is higher than that in the control run because the tide-induced gyre is cyclonic. Without the force of heat flux (Figure 11C), the two cyclonic gyres in the Beibu Gulf disappear, and the current becomes northeastward off the northern coast of the Beibu Gulf (Figure 11C). When the force of wind is eliminated, the cyclonic gyre in the southern Beibu Gulf is reversed and becomes an anticyclonic gyre (Figure 12D), and the enclosed cyclonic gyre in the northern Beibu Gulf becomes confined into a small region. In addition, the current off the northern Vietnam coast changes from southwestward to northeastward, and the current off the Guangxi coast changes from westward to eastward (Figure 11D). Therefore, the spring circulation in the Beibu Gulf is mainly controlled by the heat flux and monsoon wind.
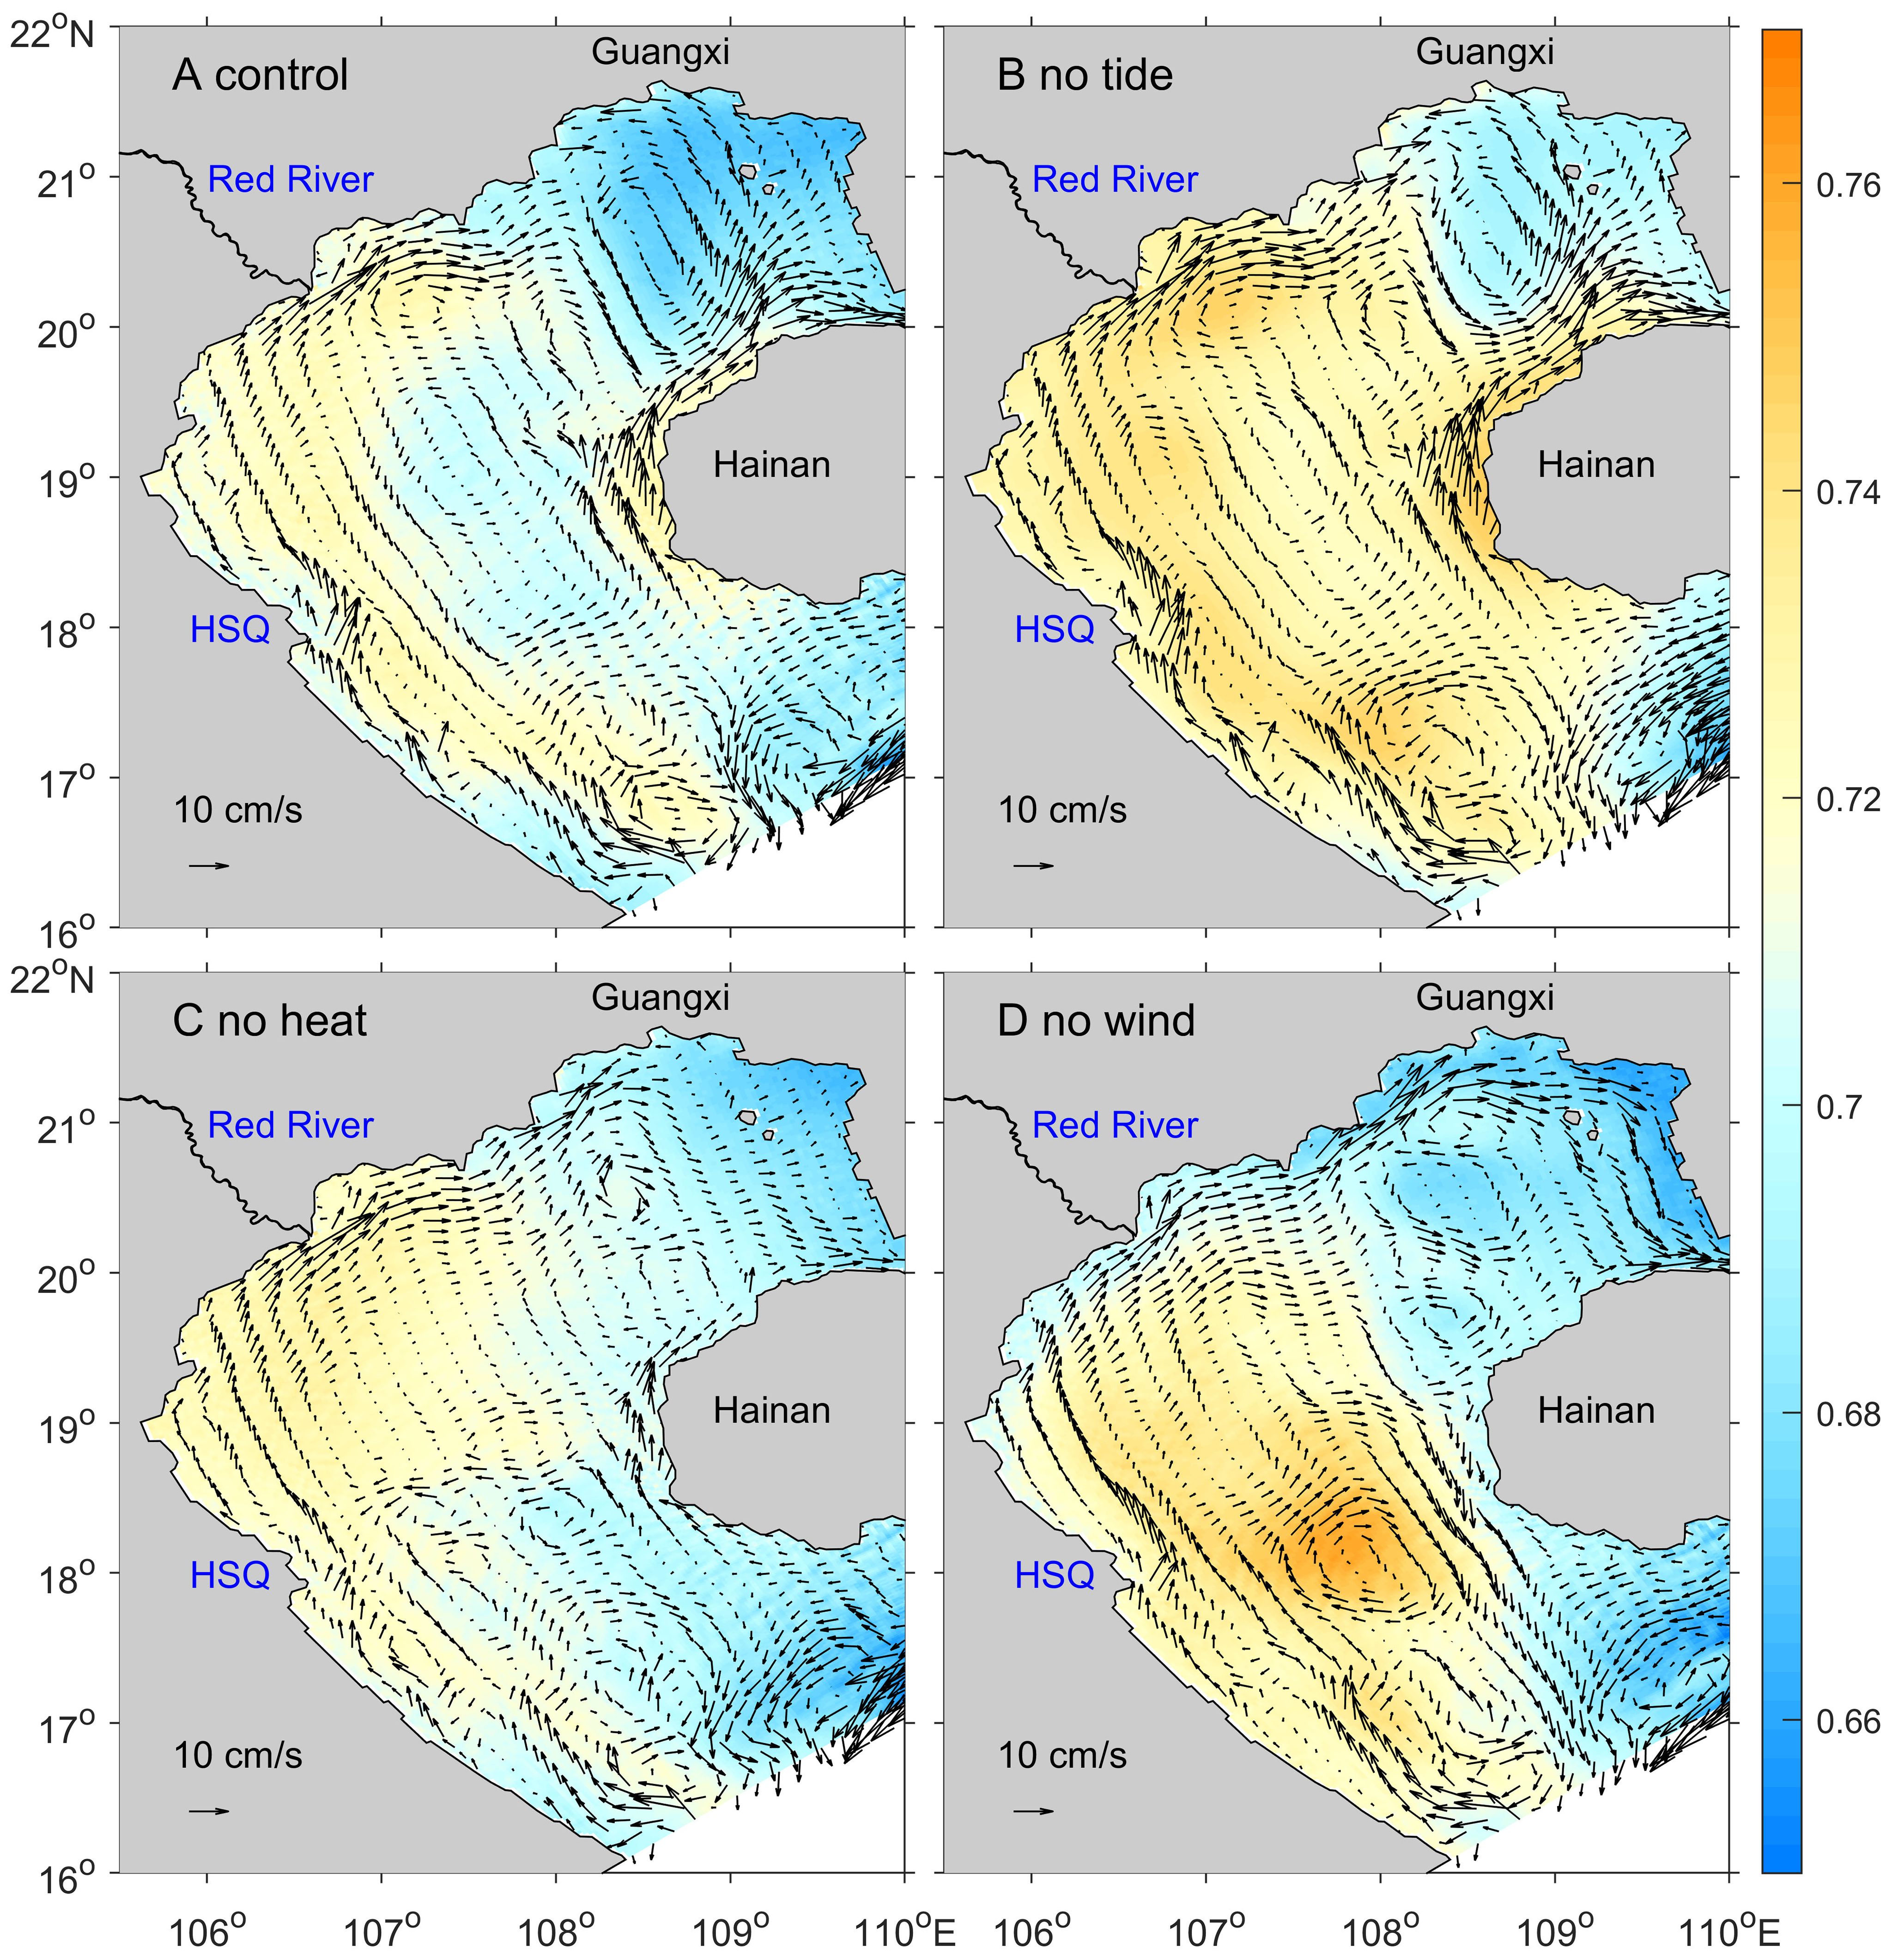
Figure 11 Vertical average circulation in April 2006 derived from four experiments: control run (A), without the force of tide (B), without the force of heat flux (C), and without the force of monsoon (D). Colors indicate the elevation distribution (m).
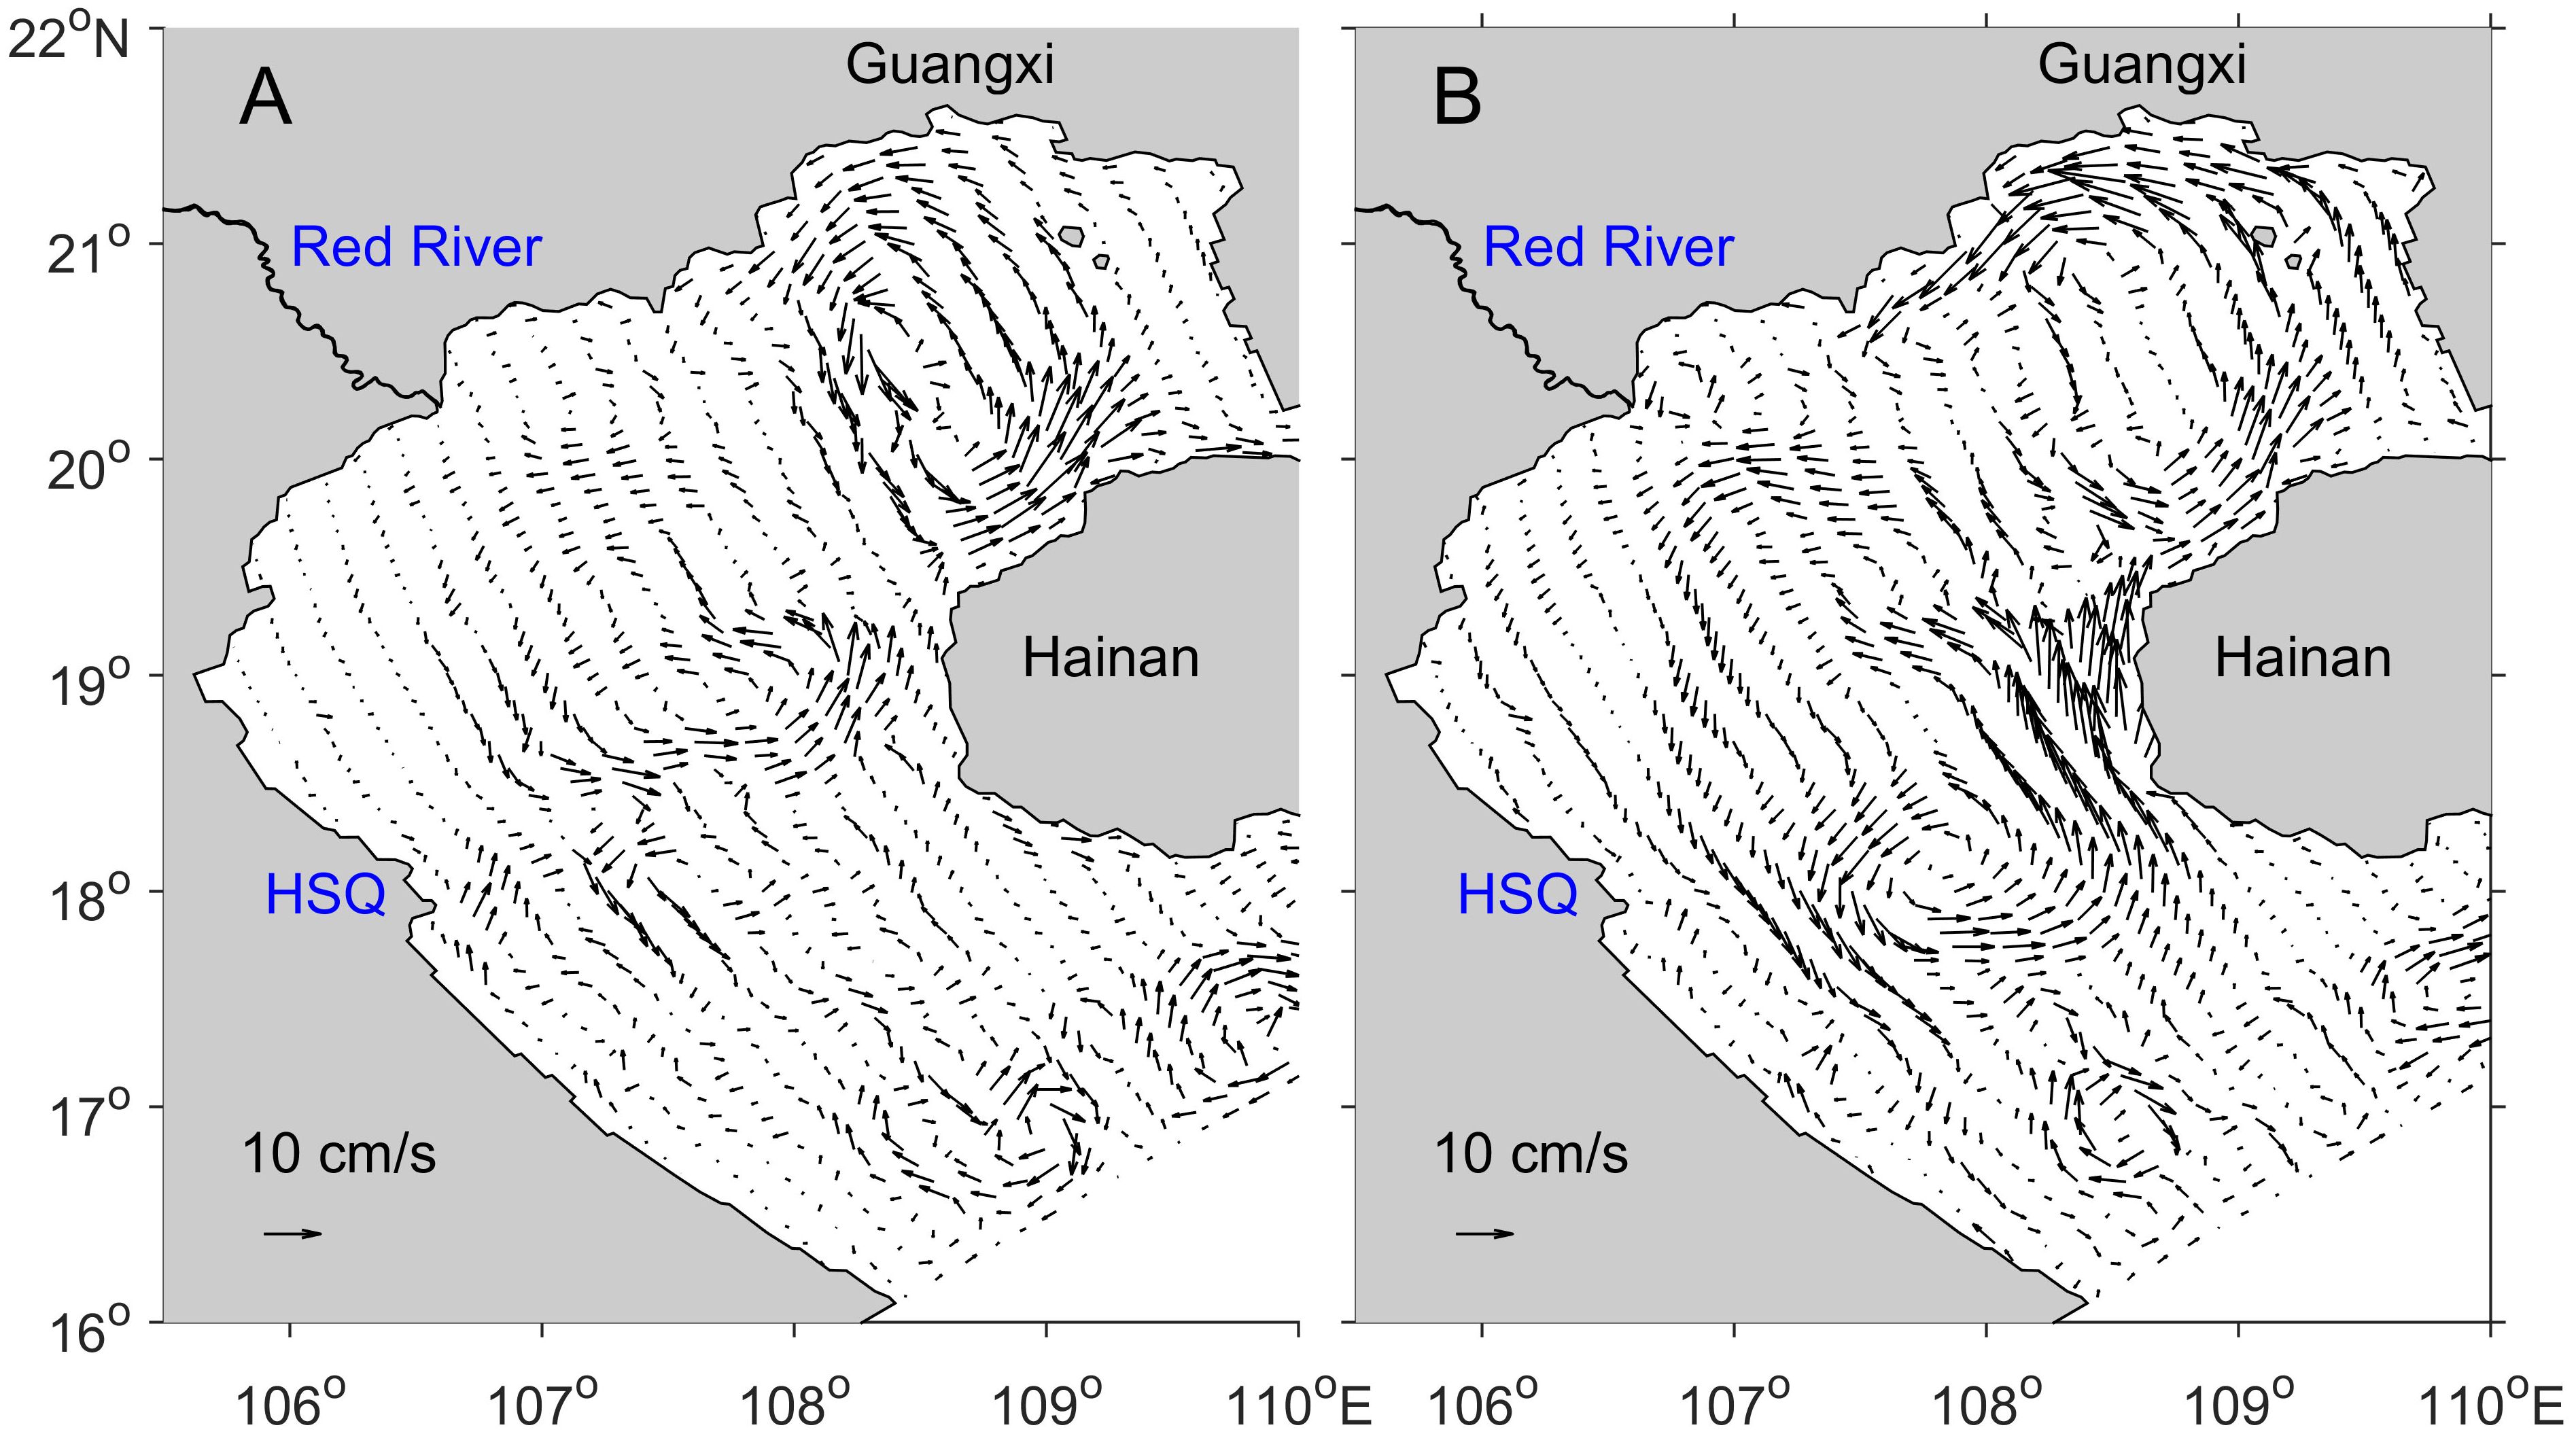
Figure 12 Circulation in the control run minus the circulations without the forces of heat flux (A) and monsoon wind (B) in April 2006, respectively.
To further analyze the effects of the monsoon wind and heat flux, the circulation driven only by either the heat flux (i.e., the circulation in the control run minus the circulation without the force of heat flux) or the monsoon wind (i.e., the circulation in the control run minus the circulation without the force of the monsoon wind) were considered (Figure 12). Despite the persistent nonlinear effect of force, the circulation essentially represents the effect induced by either the heat flux or the monsoon wind. The cyclonic gyre in the northern Beibu Gulf (Figure 11A) disappears without the force of heat flux (Figure 11C). This is because the CWM in the northern Beibu Gulf cannot exist when the force of heat flux is eliminated (not shown). Furthermore, the effect of heat flux in the northern Beibu Gulf is manifested by the existence of the CWM, which is associated with the enclosed cyclonic gyre there (Figures 8, 12A). Based on the result driven by the monsoon wind, the wind can trigger a cyclonic current off the Guangxi and northern Vietnam coasts (Figure 12B). Therefore, the effect of heat flux is larger than that of the monsoon wind in the northern Beibu Gulf.
A small enclosed cyclonic gyre occurs off the western coast of Hainan induced by the heat flux (Figure 12A), and an enclosed cyclonic gyre is dominant in the southern Beibu Gulf trigged by the monsoon wind (Figure 12B). One branch of the enclosed cyclonic gyre can intrude into the northern Beibu Gulf until 20° N (Figure 12B), similar to the circulation pattern in the southern Beibu Gulf in the control run (Figure 5). Therefore, the cyclonic gyre in the southern Beibu Gulf is jointly driven by the monsoon wind and heat flux, with the effect of the monsoon wind being more significant.
Based on the sensitive experiments (Figure 13), the CWM is mainly controlled by the heat flux, while the monsoon wind plays a secondary role. Tidal forces only change the range and strength of the CWM. Without heat flux forcing, the TD in the Beibu Gulf is less than 2°C and the CWM disappears (Figure 13B). When the monsoon wind forcing is eliminated, the 10°C isoline is still present but the 12°C isoline is not observed (Figure 13C). Compared with the control (Figure 13A), the area within the 10°C isoline decreases in the experiment without tidal forcing Figure 13D).
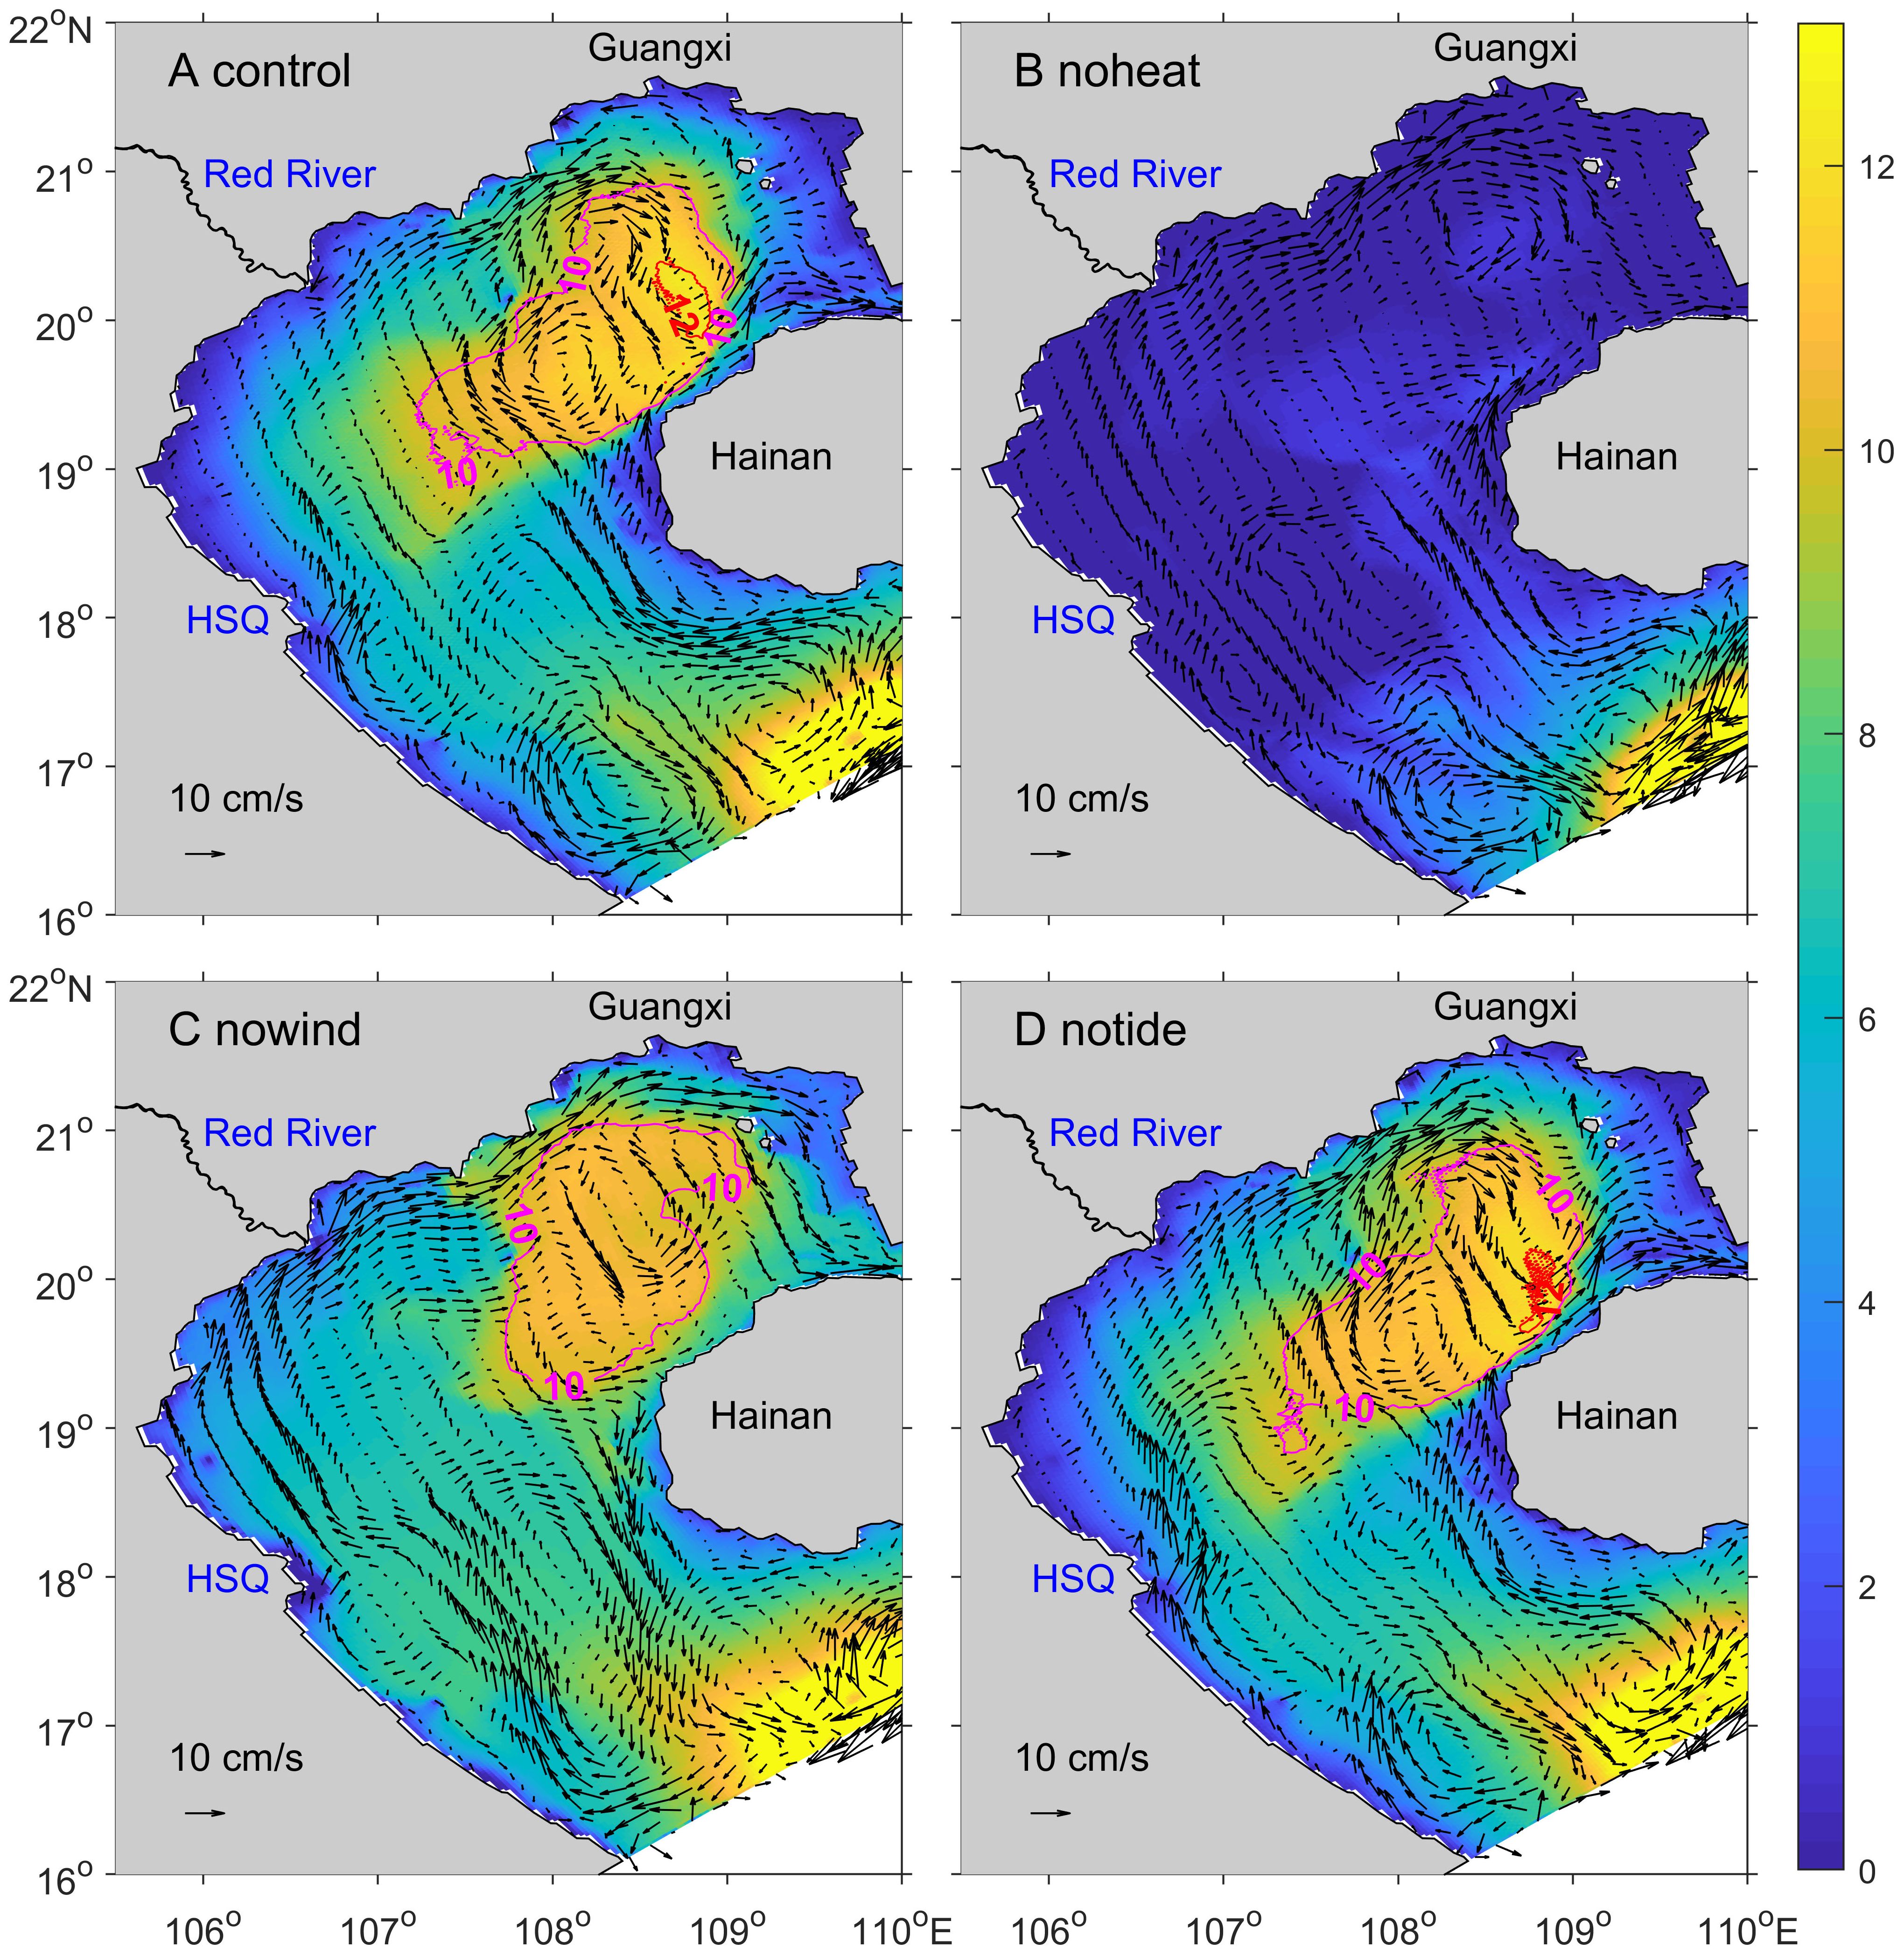
Figure 13 Temperature difference (TD) distributions in April 2006 obtained from four experiments: (A) control, (B) without tidal forcing, (C) without heat flux forcing, and (D) without monsoon wind forcing. Red and purple lines represent the 12°C and 10°C isolines, respectively. Colors indicate the TD between the surface and bottom layer.
The physical mechanism of the VNC is further examined by analyzing the momentum balance (Equations 1, 2). Assigning x and y of the local Cartesian coordinate system as the positive eastward and positive westward directions, respectively, the x and y momentum equations can be written as:
where u, v, and w are the x, y, and z components of the water velocity; f is the Coriolis parameter; ζ is the surface elevation; P is the baroclinic pressure; is the water density; is the vertical viscosity; and t is the time. To simplify the analysis, the terms on the left side of each equation are marked with the numbers from 1 to 7.
Figure 14 shows the distribution of the momentum balance in the vertical at station P1 (20.7929° N, 107.8260° E) on May 9, 2006, when there was a significant northeastward current in the vertical (Figure 10). In the SCS, the first-order baroclinic Rossby deformation radii are ~5–20 km over the continental shelf region (Gan and Cai, 2001); hence, the Coriolis force can affect the current in the Beibu Gulf. This theory is proved by momentum balance analysis (Figure 14). In the upper 5-m layer, the u component is controlled by the Coriolis force, balanced by the surface elevation gradient, horizontal advection, and vertical diffusion (Figure 14A). In the deep layer, the u component is dominated by the Coriolis force, balanced by the horizontal advection. For the v component, the current in the upper 5-m layer is affected by the surface elevation gradient and vertical diffusion, balanced by the Coriolis force and horizontal advection (Figure 14B). However, in the deep layer, the effect of surface elevation gradient is significant on the v component, and the Coriolis force becomes the equilibrium term. In the bottom layer, the current is controlled by vertical diffusion, balanced by the surface elevation gradient and horizontal advection for the u and v components, respectively.
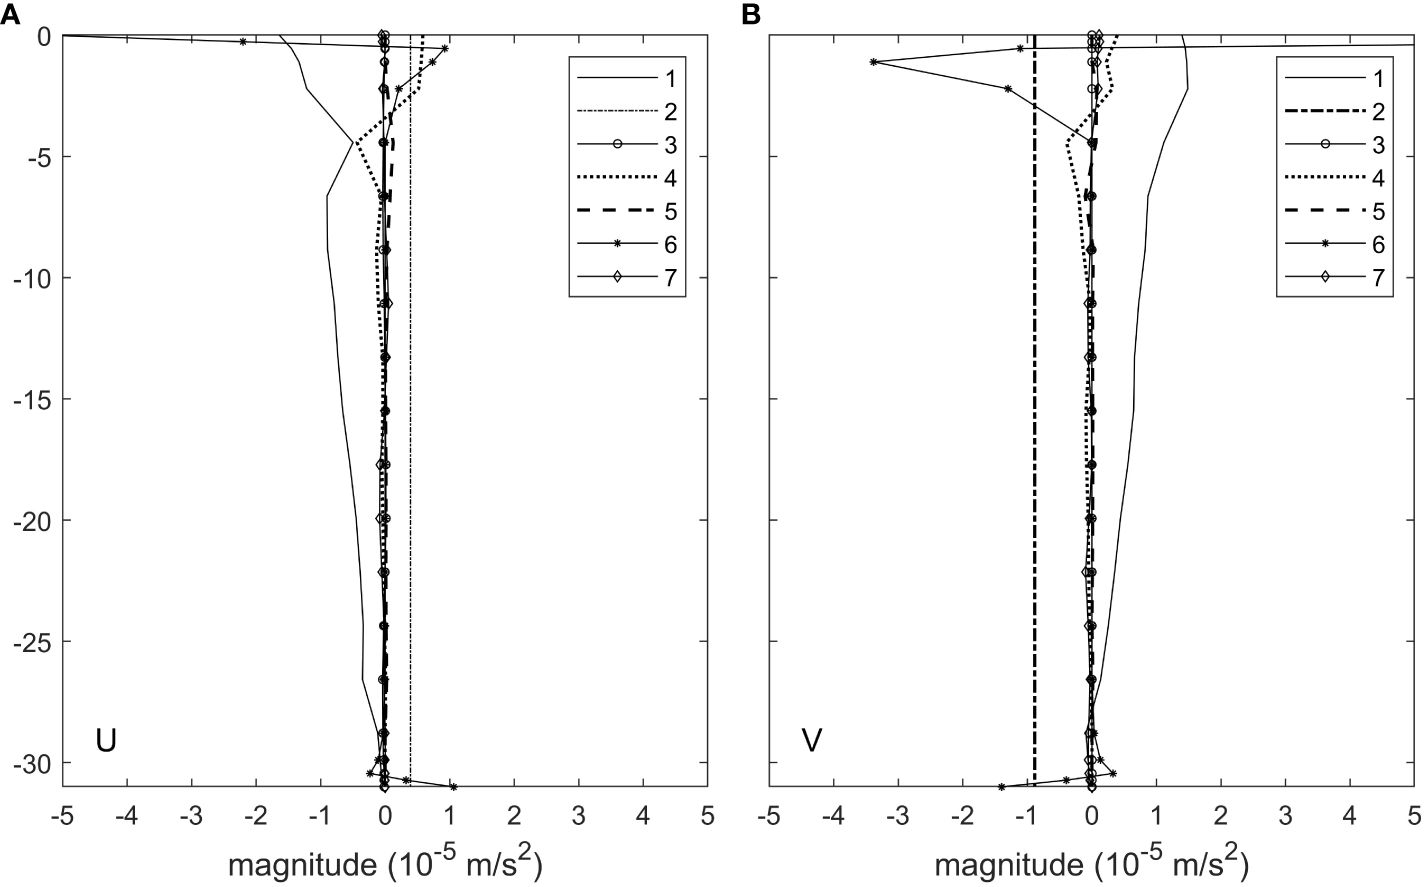
Figure 14 Vertical profiles of the daily average terms of the momentum equations for the zonal (A) and meridional (B) current at station P1 on May 9, 2006, for the control run experiment. Numbers represent the following: 1, Coriolis force; 2, surface elevation gradient; 3, baroclinic pressure gradient; 4, horizontal advection; 5, vertical advection; 6, vertical diffusion; and 7, acceleration.
This result reveals that the elevation gradient along the northern coast of Vietnam dominates the local current direction; hence, the VNC in May 2006 and March 2009 was northeastward and southwestward, respectively. The Coriolis force, horizontal advection, and vertical diffusion also play significant roles.
Regarding the nutrient distribution in the spring of 2011 (Figures 15A, B), the maximum occurred at the western end of the QS and northwestern coast of Hainan (Wu, 2014). With respect to the circulations in the springs of 2008 and 2009, the westward current carrying abundant nutrients in the QS met the northeastward current off the northwestern coast of Hainan, resulting in nutrient maxima. The nutrient decreased gradually from the eastern to the western Guangxi coast due to the cyclonic gyre in the northern Beibu Gulf (Figure 5). Conversely, there was a small region of high NO3-N off the western Guangxi coast (Figure 15B), which may be related to the river input off the Guangxi coast and the nutrient transport by the cyclonic gyre in the northern Beibu Gulf. Regarding the NO2-N (Figure 15A), which is the intermediate product between NH4-N and NO3-N, the value in the 30-m layer was larger than those in the other layers (Wu, 2014). Nutrients experience upwelling from the bottom layer to the top layer of the CWM, and the CWM was isolated from the upper layer via the thermocline layer. Additionally, the low temperature in the interior of the CWM limited the biochemical reaction, promoting the storage of NO2-N.
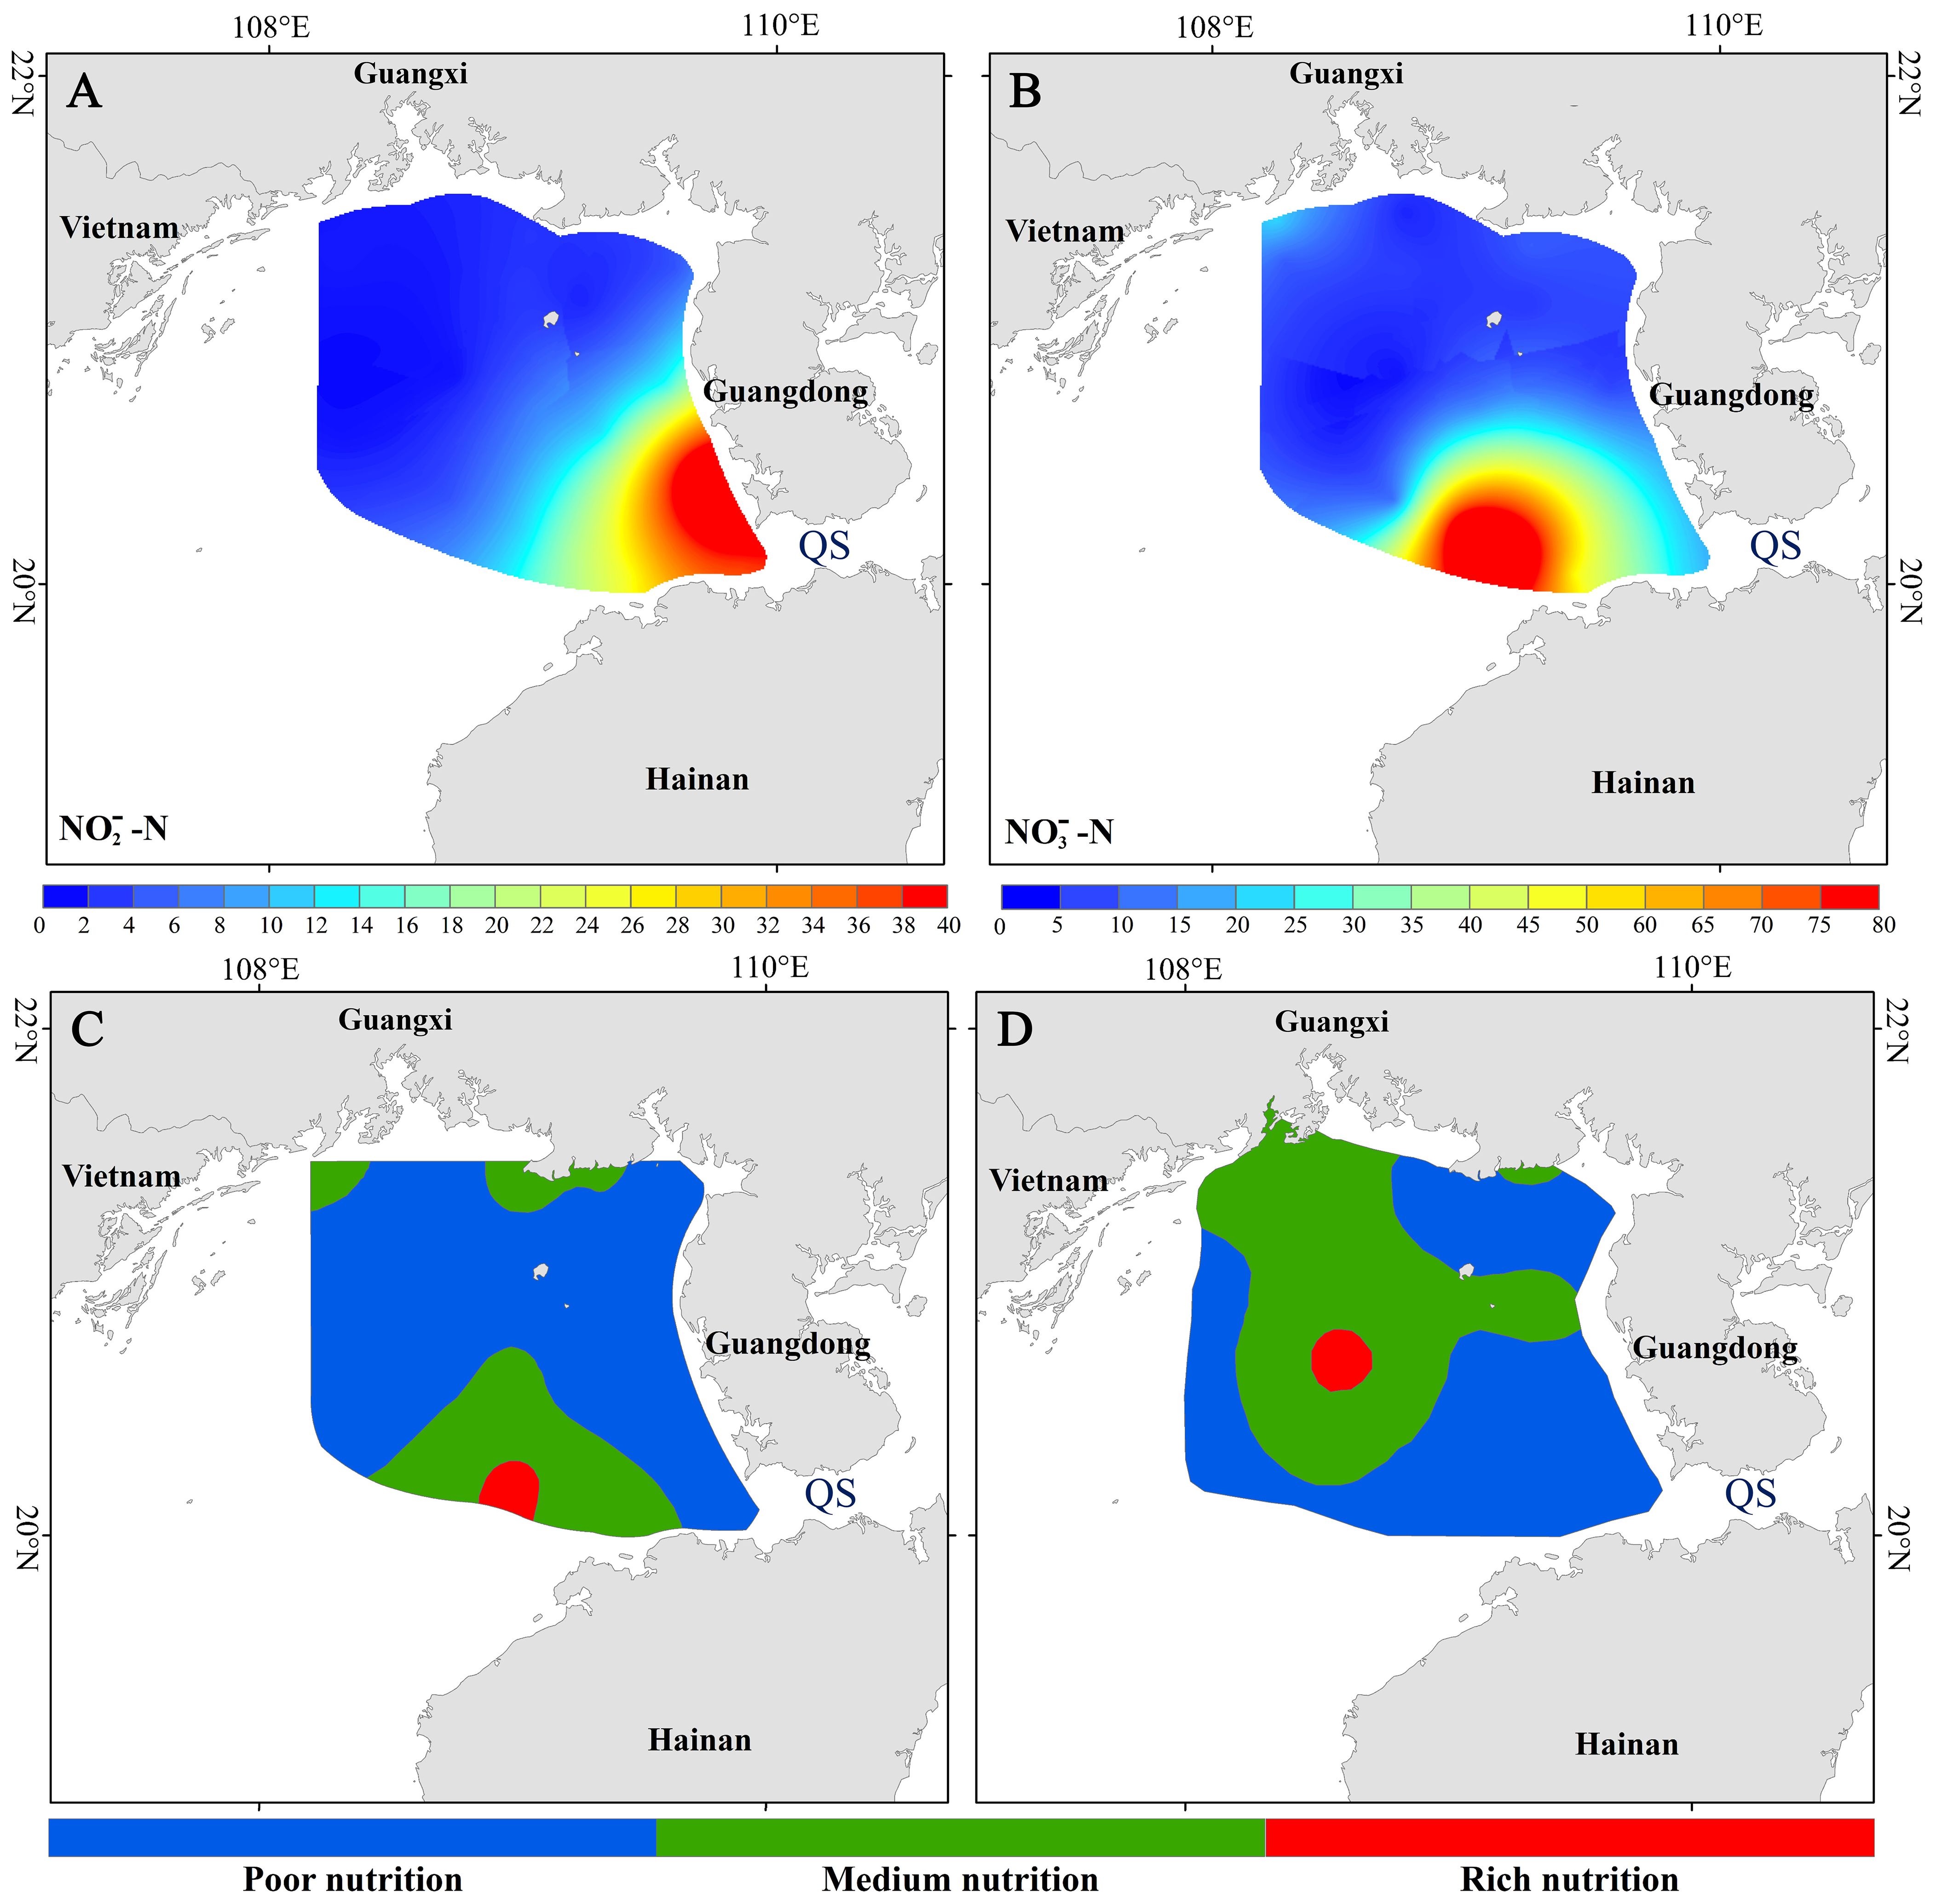
Figure 15 The distribution of NO2-N (A), NO3-N (B), eutrophication index (C) in the spring of 2011 and the eutrophication index in the spring of 2007 (D). These results are from Wu (2014).
In the spring of 2011, the region of moderate eutrophication was mainly located off the western Guangxi coast (Figure 15C), whereas in the spring of 2007 (Figure 15D), this region extended from the western coast of Guangxi to the center of the northern Beibu Gulf and the coast of Leizhou Peninsula (Wu, 2014). This phenomenon was induced by the northeastward VNC, which could transport abundant nutrients from the Red River to the Guangxi coast in the spring of 2007 (Figure 5B). However, the VNC can also be southwestward, such as the springs of 2008 and 2009 (Figure 5C, D), and the VNC in the spring of 2011 may have also been also southwestward. Furthermore, the small region of high eutrophication corresponded to the location of weak CWM in the spring of 2007 (Figure 8F).
According to statistics, the Red Tide in the Beibu Gulf occurred eight times in spring, and eight Red Tide events occurred off the western and middle Guangxi coast, accounting for 40% of all Red Tide events in the past twenty years (Su et al., 2022). This result is controlled by the northeastward VNC, westward current in the QS, and cyclonic gyre in the northern Beibu Gulf. The CWM may also play an important role. In spring, the current in the QS is basically westward, resulting in increased nutrient input from the Pearl River to the northern Beibu Gulf’. In winter, the low temperature and southwestward VNC as well as the low nutrient input of the Red River restrict the occurrence of Red Tide.
The summer and winter circulations in the Beibu Gulf have been thoroughly investigated. Conversely, the structure and formation mechanism of the spring circulation as well as the current in the QS and the variation of the CWM have been under investigated. This study uses a model validated by observations and concludes the following:
The northern Beibu Gulf is controlled by an enclosed cyclonic gyre, the April ranges of which were larger in 2006 and 2009 than those in 2007 and 2008. Conversely, the cyclonic gyre in the southern Beibu Gulf was enclosed in April 2006 and 2008, but was unclosed in April of 2007 and 2009. The northeastward current off the northwestern Hainan coast is dominant; however, its strength exhibits significant interannual variations. Vertically, circulation at the surface differs from circulation in the middle and deep layers. Heat flux is dominant in the northern Beibu Gulf owing to the effect of the CWM, and the monsoon wind can be favorable for the cyclonic gyre’s formation. In contrast, the cyclonic gyre in the southern Beibu Gulf is jointly driven by the monsoon wind and heat flux, of which the monsoon wind effect is more significant.
Contrary to the accepted opinion that the current in the QS flows westward throughout the year, we found that the current in the QS can flow eastward during certain days in the spring and that the zonal current velocity is approximately twice the meridional current velocity with the same variations. In the springs of 2006–2009, the occurrence proportions of the eastward current were 55.4%, 50%, 45.7%, and 29.3% respectively, which produced eastward and westward currents in the QS during the springs of 2006 and 2009. The QS was dominated by weak westward flow in the springs of 2007 and 2008. The longest eastward current duration ranged from 7 to 18 d in 2006–2009.
In spring, the northern Beibu Gulf is affected by the CWM, which increases in both strength and size from March to May. The CWM also exhibits obvious interannual variations, and its range can be associated with the 12°C and 10°C isolines in strong and weak years, respectively. The daily variations in the CWM indicate that its shape is a crescent that becomes thicker in the spring. In addition, owing to vertical mixing, the CWM becomes a little smaller for several days during its evolution. Sensitivity experiments indicate that the CWM is mainly controlled by the heat flux, while the monsoon wind plays a secondary role.
The spring VNC can either flow northeastward or southwestward in different years. For example, the VNC flowed northeastward and southwestward in May 2006 and March 2009, respectively. Momentum balance analysis indicates that the VNC is mainly controlled by the elevation gradient along the northern coast of Vietnam, while Coriolis forcing, horizontal advection, and vertical diffusion also play significant roles.
It can be found that the VNC, current in the QS, CWM and cyclonic gyre significantly affect the nutrient distribution in the northern Beibu Gulf. An ecological dynamic model is required to further analyze its dynamic process. In addition, the controlling mechanism of the current in the QS can be solved by more observations.
The original contributions presented in the study are included in the article/supplementary material, further inquiries can be directed to the corresponding author/s.
JG: Writing – original draft, Writing – review & editing. LM: Writing – original draft. HL: Writing – original draft. XM: Writing – original draft. GW: Writing – original draft. DW: Writing – review & editing. K-CN: Writing – review & editing. BH: Writing – review & editing. AT: Writing – review & editing.
The author(s) declare financial support was received for the research, authorship, and/or publication of this article. This work is jointly supported by the Guangxi Science and Technology Sharp Peak Special Program (Grant No. 2023AA14004), National Natural Science Foundation of China (Grant Nos. 41966001; 42071135; 41930537), Guangxi Natural Science Foundation (Grant No. 2018GXNSFDA281031), Investigation of Fishery Resources in the Guangxi Beibu Gulf (GXZC2022-G3-001062-ZHZB) and the project (QTFR01.03/21-22).
The authors declare that the research was conducted in the absence of any commercial or financial relationships that could be construed as a potential conflict of interest.
All claims expressed in this article are solely those of the authors and do not necessarily represent those of their affiliated organizations, or those of the publisher, the editors and the reviewers. Any product that may be evaluated in this article, or claim that may be made by its manufacturer, is not guaranteed or endorsed by the publisher.
Bao X. W., Hou Y. J., Chen C. S., Chen F. (2005). Analysis of characteristics and mechanism of current system on the west coast of Guangdong of China in summer. Acta Oceanol. Sin. 24, 1–9.
Blumberg A. F., Mellor G. L. (1987). “A description of a three-dimensional coastal ocean circulation model,” in Three-dimensional coastal ocean models, vol. 4 . Ed. Heaps N. (AGU, Washington, D. C), 1–16.
Chen B., Shi M. C. (2019). Advances in study of beibu gulf circulation (in Chinese with English abstract). Guangxi Sci. 26, 595–603.
Chen B., Xu M., Ya B., Chen X. Y., Xu Z. X., Shi M. C. (2020). Effect of the runoff diffusion on the circulation in the northern Beibu Gulf. Chin. J. Oceanol. Limnol. 2, 43–54.
Chen B., Yan J. H., Wang D. R., Shi M. C. (2007). The transport volume of water through the Qiongzhou Strait in the winter season (in Chinese with English abstract). Period. Ocean Univ. China 37, 357–364.
Chen C. L., Li P. L., Shi M. C., Zuo C. J., Chen M. X., Sun H. P. (2009). Numerical study of the tides and residual currents in the Qiongzhou Strait. Chin. J. Oceanol. Limnol. 27, 931–942. doi: 10.1007/s00343-009-9193-0
Chen D. S., Chen B., Yan J. H., Xu H. F. (2006). The seasonal variation characteristics of residual currents in the Qiongzhou Strait (in Chinese with English abstract). Trans. Oceanol. Limnol. 2, 12–17.
Chen Z. H. (2013). Numerical simulation on seasonal variation of ocean circulation and its dynamic mechanism in the Beibu Gulf (in Chinese with English abstract). Ocean University of China, Qingdao.
Chen Z. H., Qiao F. L., Xia C. S., Wang G. (2015). The numerical investigation of seasonal variation of the cold water mass in the Beibu Gulf and its mechanisms. Acta Oceanol. Sincia 34, 44–54. doi: 10.1007/s13131-015-0595-x
Chen Z. Z., Hu J. Y., Sun Z. Y., Zhu J. (2009). “Distributions of temperature, salinity characteristics in the eastern Beibu Gulf in July and August of 2006 (in Chinese with English abstract),” in The essay collection of the researches on the ocean science in the Gulf of Tonkin- PT I (China Ocean Press, Beijing), 79–87.
Comprehensive Oceanic Survey Office of National Scientific Committee of China. (1964). Report of china–vietnam joint oceanic survey of the beibu gulf (Beijing: National Scientific Committee of China).
Ding Y. (2014). Observational and Model Studies of the Continental Shelf Circulation and Coastal Trapped Waves in the Northern South China Sea (in Chinese with English abstract). Ocean University of China, Qingdao.
Ding Y., Chen C., Beardsley R. C., Bao X. W., Shi M. C., Zhang Y., et al. (2013). Observational and model studies of the circulation in the Beibu Gulf, South China Sea. J. Geophys. Res. Oceans 118, 6495–6510. doi: 10.1002/2013JC009455
Fang X. Y. (2014). Numerical simulation of seasonally circulation and water exchange in the Beibu Gulf (in Chinese with English abstract). Ocean University of China, Qingdao.
Gan Z. J., Cai S. Q. (2001). Geographical and seasonal variability of Rossby Radii in South China Sea (in Chinese with English abstract). J. Trop. Oceanogr. 20, 1–9.
Gao J. S., Chen B. (2014). Analysis on characteristics and formation mechanism of the winter boreal circulation in the Beibu Gulf (in Chinese with English abstract). Guangxi Sci. 21, 64–72.
Gao J., Shi M., Chen B., Guo P., Zhao D. (2014). Responses of the circulation and water mass in the Beibu Gulf to the seasonal forcing regime. Acta Oceanol. Sin. 33, 1–11. doi: 10.1007/s13131-014-0506-6
Gao J. S., Chen B., Shi M. C. (2015). Summer circulation structure and formation mechanism in the Beibu Gulf. Sci. China Ser. D-Earth Sci. 58, 286–299. doi: 10.1007/s11430-014-4916-2
Gao J. S., Wu G. D., Ya H. Z. (2017). Review of the circulation in the Beibu gulf, South China Sea. Continent. Shelf Res.: A Companion J. to Deep-Sea Res. Prog. Oceanogr. 138, 106–119.
Gao J. S., Xue H. J., Chai F., Shi M. C. (2013). Modeling the circulation in the Beibu gulf, South China sea. Ocean Dynam. 63, 979–993. doi: 10.1007/s10236-013-0636-y
Hu J. Y., Kawamura H., Tang D. L. (2003). Tidal front around the Hainan Island, northwest of the South China sea. J. Geophys. Res. 108, 3342.
Huang Z. D., Hu J. Y., Sun Z. Y., Zhu J., Chen Z. Z. (2009). “Distributions of temperature, salinity and density in the eastern Beibu Gulf (Gulf of Tonkin) in spring 2007 (in Chinese with English abstract),” in The essay collection of the researches on the ocean science in the Gulf of Tonkin-PT II (Beijing: Ocean Press of China), 96–98.
Liu F. S., Yu T. C. (1980). Preliminary study on the oceanic circulation in Beibu Bay (in Chinese with English abstract). Trans. Oceanol. Limnol. 1, 9–15.
Lu X. G., Qiao F. L., Wang G. S., Xia C. S., Yuan Y. L. (2008). Upwelling off the west coast of Hainan Island in summer: Its detection and mechanisms. Geophys. Res. Lett. 35, L02604. doi: 10.1029/2007GL032440
Manh D. V., Yanagi T. (2000). A study on the residual flow in the Beibu Gulf. J. Oceanogr. 56, 59–68. doi: 10.1023/A:1011162524466
Shi M. C., Chen C. S., Xu Q., Lin H., Liu G., Wang H. (2002). The role of Qiongzhou Strait in the seasonal variation of the South China Sea circulation. J. Phys. Oceanogr. 32, 103–121.doi: 10.1175/1520-0485(2002)032<0103:TROQSI>2.0.CO;2
Su Q. Z., Lei X. T., Liu G. Q. (2022). Characteristics of Red Tide Disaster in Coastal Waters of Beibu Gulf of Guangxi in Recent 20 Years (in Chinese with English abstract). Guangxi Sciences 29 (3), 552–557.
Sun H. L., Huang W. M., Zhao J. S. (2001). Three-dimensional numerical simulation of tide-induced, wind-driven and thermohaline residual currents in the Beibu Bay (in Chinese with English abstract). Oceanol. ET Limnol. 32, 561–568.
Sun S. W., Wang Y., Lan J. (2009). “Hydrographic condition and circulation in the Beibu Gulf in winter and summer of 2006 (in Chinese with English abstract),” in The essay collection of the researches on the ocean science in the Beibu Gulf- PT II (China Ocean Press, Beijing), 64–72.
Tan G. H. (1987). Preliminary analysis of hydrologic structure and hydrologic feature in the sea region of the Beibu Gulf (in Chinese with English abstract). Trans. Oceanol. Limnol. 4, 7–15.
Wang D. R. (1998). Study of the dynamic-thermodynamic mechanic of Beibu Bay cool water masses (in Chinese with English abstract). Ocean University of China, Qingdao.
Wang J. F., Wang Y., Sun S. W. (2009). “Tidal currents and residual currents in the southeastern Beibu Gulf in spring (in Chinese with English abstract),” in The essay collection of the researches on the ocean science in the Beibu Gulf- PT II (Beijing: Ocean Press of China), 47–55.
Wei J. A., Wang D., Gong F., He X., Bai Y. (2017). The influence of increasing water turbidity on sea surface emissivity. IEEE Trans. Geosci. Remote Sens 55, 3501–3515. doi: 10.1109/TGRS.2017.2675623
Wu M. L. (2014). The Distribution Feature of Nutrients and the Study of Their Influence on Ecosystem in the Northern Beibu Gulf. Xiamen University, Xiamen.
Wu D. X., Wang Y., Lin X. P., Yang J. Y. (2008). On the mechanism of the cyclonic circulation in the Beibu Gulf in the summer. J. Geophys. Res. 113, C09029. doi: 10.1029/2007JC004208
Xia H. Y., Li S. H., Shi M. C. (2001). Three-D numerical simulation of wind-driven current and density current in the Beibu Gulf. Acta Oceanol. Sin. 20, 455–472.
Xu X. Z., Qiu Z., Chen H. C. (1980). The general descriptions of the horizontal circulation in the South China Sea (in Chinese). In Proceedings of the 1980 Symposium on Hydrometeorology, Chinese Society of Oceanology and Limnology, Science Press. (Beijing: Science Press).
Yan C. T., Chen B., Yang S. Y., Yan J. H. (2008). The Transportation volume of water through the Qiongzhou Strait in winter season (in Chinese with English abstract), Trans. Oceanol. Limnol. 1, 1–9.
Yang S. Y., Bao X. W., Chen C. S., Chen F. (2003). Analysis on characteristics and mechanism of current system in west coast of Guangdong Province in the summer (in Chinese with English abstract). Acta Oceanol. Sin. 25 (6), 1–8.
Yang S. Y., Chen B., Li P. L. (2006). A study of the characteristics of water transport from the South China Sea into Beibu Bay via the Qiongzhou Strait in summer in terms of temperature and salinity data (in Chinese with English abstract). Trans. Oceanol. Limnol. 1, 1–7.
Yu L., Jin X., Weller R. A. (2008). Multidecade global flux datasets from the Objectively Analyzed Air – Sea Fluxes (OAFlux) Project: latent and sensible heat fluxes, ocean evaporation, and related surface meteorological variables (Woods Hole Massachusetts: Woods Hole Oceanographic Institution). OAFlux Pro-ject Technical Report. OA-2008–01, 64pp.
Yu M. G., Liu J. F. (1993). South China Sea circulation system and situation (in Chinese with English abstract). Mar. Forecasts 10, 13–17.
Yuan S. Y., Deng J. Z. (1999). Numerical research on the circulation in the Beibu Gulf (in Chinese with English abstract). Study exploit. South China Sea 2, 41–16.
Zhang H. M., Bates J. J., Reynolds R. W. (2006). Assessment of composite global sampling: sea surface wind speed. Geophys. Res. Lett. 33, L17714. doi: 10.1029/2006GL027086
Zhang G. R., Pan W. R., Lan J., Lin Y. H., Ma T., Luo Z. B., et al. (2009). “The characters of the volume transport in spring and winter in the northern and eastern Beibu Gulf (in Chinese with English abstract),” in The essay collection of the researches on the ocean science in the Beibu Gulf- PT II (China Ocean Press, Beijing), 135–137.
Zhong H. L. (1995). Analysis of the circulations in northern part of Beibu Gulf of South China Sea in spring (in Chinese with English abstract). Mar. Sci. Bull. 14, 81–85.
Zhu X. H., Ma Y. L., Guo X. Y., Fan X. P., Long Y., Yuan Y. C., et al. (2014). Tidal and residual currents in the Qiongzhou Strait estimated from shipboard ADCP data using a modified tidal harmonic analysis method. J. Geophys. Res. 119, 8039–8060. doi: 10.1002/2014JC009855
Zu T. T. (2005). Analysis of the current and its mechanism in the Gulf of Beibu (in Chinese with English abstract). Ocean University of China, Qingdao.
Keywords: Beibu Gulf, spring circulation, numerical model, cold water mass (CWM), Qiongzhou Strait (QS), current off the northern coast of Vietnam (VNC)
Citation: Gao J, Mo L, Lu H, Meng X, Wu G, Wang D, Nguyen K-C, Hu B and Tran AT (2024) Spring circulation characteristics and formation mechanism in the Beibu Gulf. Front. Mar. Sci. 11:1398702. doi: 10.3389/fmars.2024.1398702
Received: 10 March 2024; Accepted: 07 May 2024;
Published: 12 June 2024.
Edited by:
Meilin Wu, Chinese Academy of Sciences (CAS), ChinaReviewed by:
Weizeng Shao, Shanghai Ocean University, ChinaCopyright © 2024 Gao, Mo, Lu, Meng, Wu, Wang, Nguyen, Hu and Tran. This is an open-access article distributed under the terms of the Creative Commons Attribution License (CC BY). The use, distribution or reproduction in other forums is permitted, provided the original author(s) and the copyright owner(s) are credited and that the original publication in this journal is cited, in accordance with accepted academic practice. No use, distribution or reproduction is permitted which does not comply with these terms.
*Correspondence: Jingsong Gao, a2V5dG90aGVzdWNjZXNzQDE2My5jb20=
Disclaimer: All claims expressed in this article are solely those of the authors and do not necessarily represent those of their affiliated organizations, or those of the publisher, the editors and the reviewers. Any product that may be evaluated in this article or claim that may be made by its manufacturer is not guaranteed or endorsed by the publisher.
Research integrity at Frontiers
Learn more about the work of our research integrity team to safeguard the quality of each article we publish.