- 1Graduate School of Fisheries Sciences, Hokkaido University, Hakodate, Hokkaido, Japan
- 2Arctic Research Center, Hokkaido University, Sapporo, Hokkaido, Japan
The most concerning recent ocean changes in temperature issues are known as marine heat waves. Under these conditions, it is important to evaluate the effects of temperature on zooplankton. In this study, we investigated the growth rates of three dominant copepod species (Eucalanus bungii, Metridia pacifica, and Neocalanus plumchrus) in the northern North Pacific under three different temperature conditions (3, 7, and 11°C) using an artificial cohort method. Experimental conditions for 42 hour incubations were set to light intensity and photoperiod corresponding to 50 m depth. The dissolved oxygen solubility after rearing ranged from 69.2% to 102.1%, suggesting sufficient conditions for copepod growth. Chlorophyll a increased in 83% of the experiments, indicating that the food conditions were sufficient for the copepods. The mean proportion of dead specimens evaluated using neutral red was 10.2%, corresponding with the reported values in the field. Thus, it can be concluded that the laboratory-rearing conditions used in this study provided sufficient food, and the only effect evaluated would be that of the three different temperatures. Since the developmental time for each stage is longer than the rearing period, it is important to conduct experiments with a large number of individuals to obtain accurate growth rate results. The specific growth rates of E. bungii and M. pacifica increased with increasing temperature. In contrast, N. plumchrus showed the highest growth rate under moderate water temperature conditions. In terms of weight units (dry, carbon, and nitrogen), the carbon weight-specific growth rates were higher than those of the other two units, a common characteristic of the three species. This reflected lipid accumulation during the late copepodite stages. The interspecies differences in growth rate responses to water temperature reflect species-specific differences in temperature tolerance or the optimum temperature for each species. As E. bungii and M. pacifica reproduce near the surface layer through income breeding, their temperature tolerance or optimum temperature is expected to be high. However, because the reproduction of N. plumchrus occurs in the cold deep layer by using capital breeding, its temperature tolerance and optimum temperature would be lower than those of the former two species.
1 Introduction
The warming changes in oceans are often referred to as marine heat waves (Bond et al., 2015; Kuroda and Setou, 2021). A marine heat wave is a technical term that describes warm temperature conditions that persist for five or more days (Di Lorenzo and Mantua, 2016). Marine heatwaves have various effects on climate and marine ecosystems, such as alterations in marine ecosystems and fisheries resources (Bond et al., 2015), an increase in dry weather (Di Lorenzo and Mantua, 2016), and modifi;cation of the Jet stream (Kuroda and Setou, 2021). Marine heat waves are thought to affect plankton first because they are characterized by shorter generation lengths (Bond et al., 2015; Kuroda et al., 2021). Therefore, clarifying the effects of temperature on plankton has been a primary issue recently.
Growth rate (g) is an index to express a zooplankton physiological parameter (Kimmerer and McKinnon, 1987; Liu and Hopcroft, 2006a, b, 2008; Kimmerer et al., 2007). Growth rates are prime indicators for understanding whether zooplankton will increase or decrease in the future (Kiørboe, 1997; Kobari et al., 2019). However, it is not fully understood how environmental factors, including water temperature, affect the growth rate of zooplankton, especially copepods from the North Pacific (Liu and Hopcroft, 2006a, b, 2008; Kobari et al., 2019).
Various methods are available to determine copepod growth rates, including the artificial cohort method (Kimmerer and McKinnon, 1987; Liu and Hopcroft, 2006a, b), egg production (Hopcroft et al., 2005), natural cohort method (Vidal and Smith, 1986), and molting rate method (Peterson et al., 2002). The artificial cohort (AC) method is useful because it does not require complex experimental protocols and enables the use of multiple species under the same conditions (Kimmerer and McKinnon, 1987; Liu and Hopcroft, 2006a, b; Kobari et al., 2019). Therefore, using AC methods under various temperature conditions enabled us to determine the species-specific responses of sympatric copepod species to increasing temperatures. However, such an experimental design for the AC method is yet to be established.
Therefore, we evaluated the growth rates of three dominant copepods (Eucalanus bungii, Metridia pacifica, Neocalanus plumchrus) in the northern North Pacific using the AC method at different temperatures. These copepods are important species that were found to contribute 16.1% (E. bungii), 6.5% (M. pacifica), and 14.7% (N. plumchrus) to the zooplankton biomass in the region (Ikeda et al., 2008). As a new AC method, the collecting methods with a fine-mesh net (63 µm) with a large bucket cod-end allow the collection of whole populations of the copepods. Then the gentle use of a reverse sieve with a large mesh (925 µm) creates populations with early copepodite stages. Rearing at light conditions similar to those at 50 m depth and at three different temperature conditions for two days was expected to provide detailed insights into the specific growth rates of each species. Temperature, dissolved oxygen (DO), and chlorophyll a (Chl a) were the environmental factors measured at the beginning and end of the experiments in the laboratory. We evaluated the effects of these environmental factors on the growth rates of the three copepod species.
2 Materials and methods
2.1 Onboard experiment
Eighteen zooplankton net collections were made along the 47˚N east-west transect line in the northern North Pacific during the WOCE cruise of the R/V Mirai of the Japan Agency for Marine-Earth Science and Technology (JAMSTEC) from July 22 to August 17, 2021 (Figure 1, Table 1). Fresh zooplankton samples were collected by the vertical tow of the 45-cm mouth diameter Quad–NORPAC net (Hama et al., 2019) equipped with two 63 µm mesh nets with a large bucket cod-end (5 L) at 0–50 m depth at night. Collection temperatures at 0–50 m water column of each station ranged between 1.9 and 17.3°C (cf. Egashira et al., 2024).
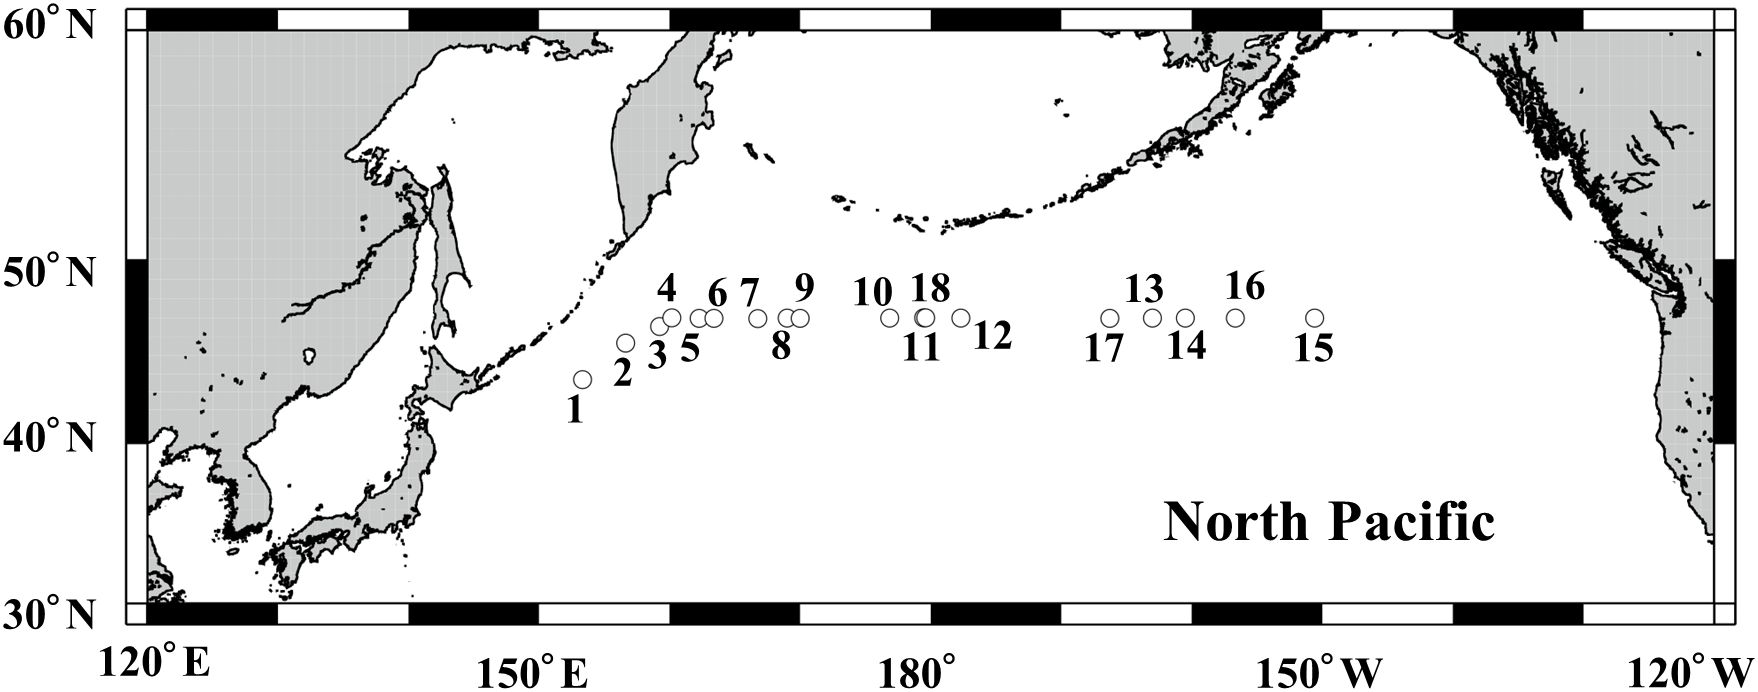
Figure 1. Locations of the stations where the specimens used for the growth rate experiments were collected in the northern North Pacific from July 22 to August 17, 2021. Experimental numbers (cf. Table 1) are superimposed in the panel.

Table 1. Data on the laboratory rearing for the developmental rates of the three dominant copepods (Eucalanus bungii, Metridia pacifica, and Neocalanus plumchrus) in the northern North Pacific that was conducted from July 22 to August 17, 2021.
The macro-sized carnivorous zooplankton (e.g., chaetognaths, amphipods, and euphausiids) contained in the freshly collected samples were removed using gentle reverse filtration through a large plastic sieve with a 925 µm mesh size. Carnivorous zooplankton that could not be removed by reverse filtration, such as small chaetognaths, were visually inspected and removed using a large-bore pipette. When phytoplankton were abundant, the sample was placed in a large bucket (~ 20 L) for 20–60 minutes for the phytoplankton to settle to the bottom, whereafter gentle reverse filtration was conducted using a 925 µm large sieve. Fresh zooplankton within the incubation water was then gently dispensed into four clear plastic bottles (approximately 4.4 L) with a 14 mm diameter siphon tube. The rearing plastic bottles were filled with incubation water without air bubbles to prevent the physical shock caused by air bubbles during rearing.
Three bottles were placed in the three incubators (Cool Incubator CN-40A, Mitsubishi Electric Engineering) set at 3, 7, and 11°C (termed L, M, and H, respectively) for approximately 42 hours. Each incubator was equipped with an LED light with a photon flux of 3.75 ± 0.27 µmol m-2 sec.-1 which was measured within the incubator by light sensor LI-1400 (Li-Cor Inc.). The light intensity was approximately the same light condition at a depth of 50 m, and a timer to adjust the light period from 4:30 to 19:30 and the dark period from 19:30 to 4:30 according to the local sunrise and sunset time in the field. Thus, the light-dark cycle was set to light:dark = 15 h:9 h. One of the rearing bottles was used as a sample at time 0 (T0).
The T0 rearing bottle was prepared using the following manipulations at the beginning of the experiment. A portion of the incubation water was siphoned into a 50 mL DO bottle using a 1 mm diameter tube equipped with a 10 µm mesh at the tip. The DO concentration was measured with a precision of 1 µmol L-1 using a sensor (Firesting O2, Pyro Science GmbH) placed inside the DO bottle. The temperature of the incubation water was measured using a digital thermometer (TT-P01, TANITA) with an accuracy of 0.1°C. The T0 zooplankton sample was then gently filtered through a 100 µm mesh filter net and concentrated to approximately 1 L. Water filtered through 100 µm mesh was used to determine Chl a concentration. Fresh zooplankton samples concentrated in 1 L bottles were stained with neutral red (NR) to determine whether the individuals were alive or dead (Elliott and Tang, 2009; Zetsche and Meysman, 2012). Briefly, 5 mL of NR stock solution (10 g L-1) was added to a 1 L bottle and incubated in a refrigerator set at 5°C for 1 hour. After staining, fresh samples were filtered and collected on a 50 µm mesh. The specimen-collected mesh was then covered with aluminum foil, placed in a zipper-plastic bag, and frozen at −20°C. For the incubation water through 100 µm mesh, 180–285 mL was filtered through a 25 mm diameter GF/F filter. The filter was then immersed in dimethylformamide (DMF) to extract Chl a under dark conditions for at least one day (Suzuki and Ishimaru, 1990). After extraction, Chl a concentration (µg L-1) was determined using a fluorometer (Trilogy Laboratory Fluorometer, Turner Designs).
The incubation bottles were kept in the incubators set at three different temperature conditions, and temperature and DO were measured approximately 17 hours later. After 42 hours, temperature, DO, Chl a measurements, NR staining, and the frozen samples were made for each temperature condition. This was a series of experimental work, and these rearing experiments were conducted 18 times during the cruise (Table 1). To provide further clarity on the modified methods used in this study, we have included detailed pictures as a supplement (Supplementary Figure 1) to demonstrate the protocol of the methods.
2.2 Data analysis
After the cruise, frozen zooplankton samples were immersed in 30 mL of 5% formalin seawater in a laboratory. The samples were then acidified by adding 1 mol L-1 HCl at 5% volume to determine the survival of the zooplankton using the NR method, which stains live individuals red, whereas dead individuals remain unstained (Elliott and Tang, 2009: Zetsche and Meysman, 2012). E. bungii, M. pacifica, and N. plumchrus were identified under a stereomicroscope (30-50 x magnification, SMZ-10, Nikon), and the individuals of each copepodite stage (C1–C6) were counted. C4–C6 stages of M. pacifica and E. bungii were divided into males and females. Among the total number of individuals, 7.4–15.4% were not stained by NR, and only the data from stained individuals were used in subsequent analyses. The individual weights (dry weight [DW], carbon weight [CW], and nitrogen weight [NW]) of each copepodite stage of E. bungii, M. pacifica, and N. plumchrus were obtained from Ueda et al. (2008). The mean individual weight at each experimental condition at T0, 3, 7, and 11°C was determined in three units (DW, CW, and NW) using the following formula:
where M is the mean individual weight (µg), Wi is the individual weight (µg) of stage i, and Ci is the proportion of stage i individuals in the total population. The daily growth rate (g: day-1) was calculated by the following equation:
where M0 is the mean individual weight (µg) at T0, Mi is the mean individual weight (µg) at day d and at temperature i, and d is the period of rearing in a day. A generalized linear model (GLM) analysis was performed with growth rate (g) as the response variable and various environmental data (temperature, DO, and Chl a) as the explanatory variables. The water temperature and DO in each experiment were averaged from two measurements at 17 and 42 hours. For Chl a, three data points, i.e., at the beginning of the experiment (Chl_t0: µg L-1), at the end of the experiment (Chl_end: µg L-1), and the daily variation during the experiment (Chl_var: µg L-1 day-1), were calculated. The negative value of Chl_var indicates a decrease in Chl a over time. The variance inflation factor (VIF) was determined for each explanatory variable before use in the GLM, and variables with a VIF > 3 were excluded from subsequent analyses. For water temperature, which was determined to be the most important environmental parameter by GLM analysis, a generalized additive model (GAM) analysis was used to analyze its impact on the growth rate (g).
3 Results
3.1 Experimental conditions
The rearing period ranged from 1.67 to 1.88 days (40.0–44.0 hours) throughout the 18 experiments conducted in this study (Table 1). The total numbers of target copepod species in the four experimental bottles were 23–251 individuals for E. bungii, 36–3291 individuals for M. pacifica, and 28–134 individuals for N. plumchrus. When the number of individuals in the four experimental bottles was less than 23, we excluded the results from the analysis due to an insufficient number of individuals. Based on these criteria, the total number of experiments was 4 for E. bungii, 15 for M. pacifica, and 10 for N. plumchrus (Table 1).
Temperature conditions during the rearing experiments of three treatments (L, M, H) were 2.47–4.59°C (mean 3.49°C) for L, 6.55–8.4°C (mean 7.53°C) for M, and 10.88–12.31°C (mean 11.58°C) for H (Table 2). DO was at 281.3–342.9 µmol L-1 for L, 239.5–304.6 µmol L-1 for M, and 192.3–278.6 µmol L-1 for H. Within the experiments, DO was higher for the colder conditions. For Chl a, initial Chl a (Chl_t0) was 0.45–7.52 µg L-1, and final Chl a (Chl_end) was 0.31–14.3 µg L-1. During the experiments, the daily change in Chl a (Chl_var) ranged between −0.30 and 6.91 µg L-1 day-1. Within the 54 experimental conditions (18 stations × three temperature conditions), Chl a increased in 45 experiments and decreased in 9 experiments.
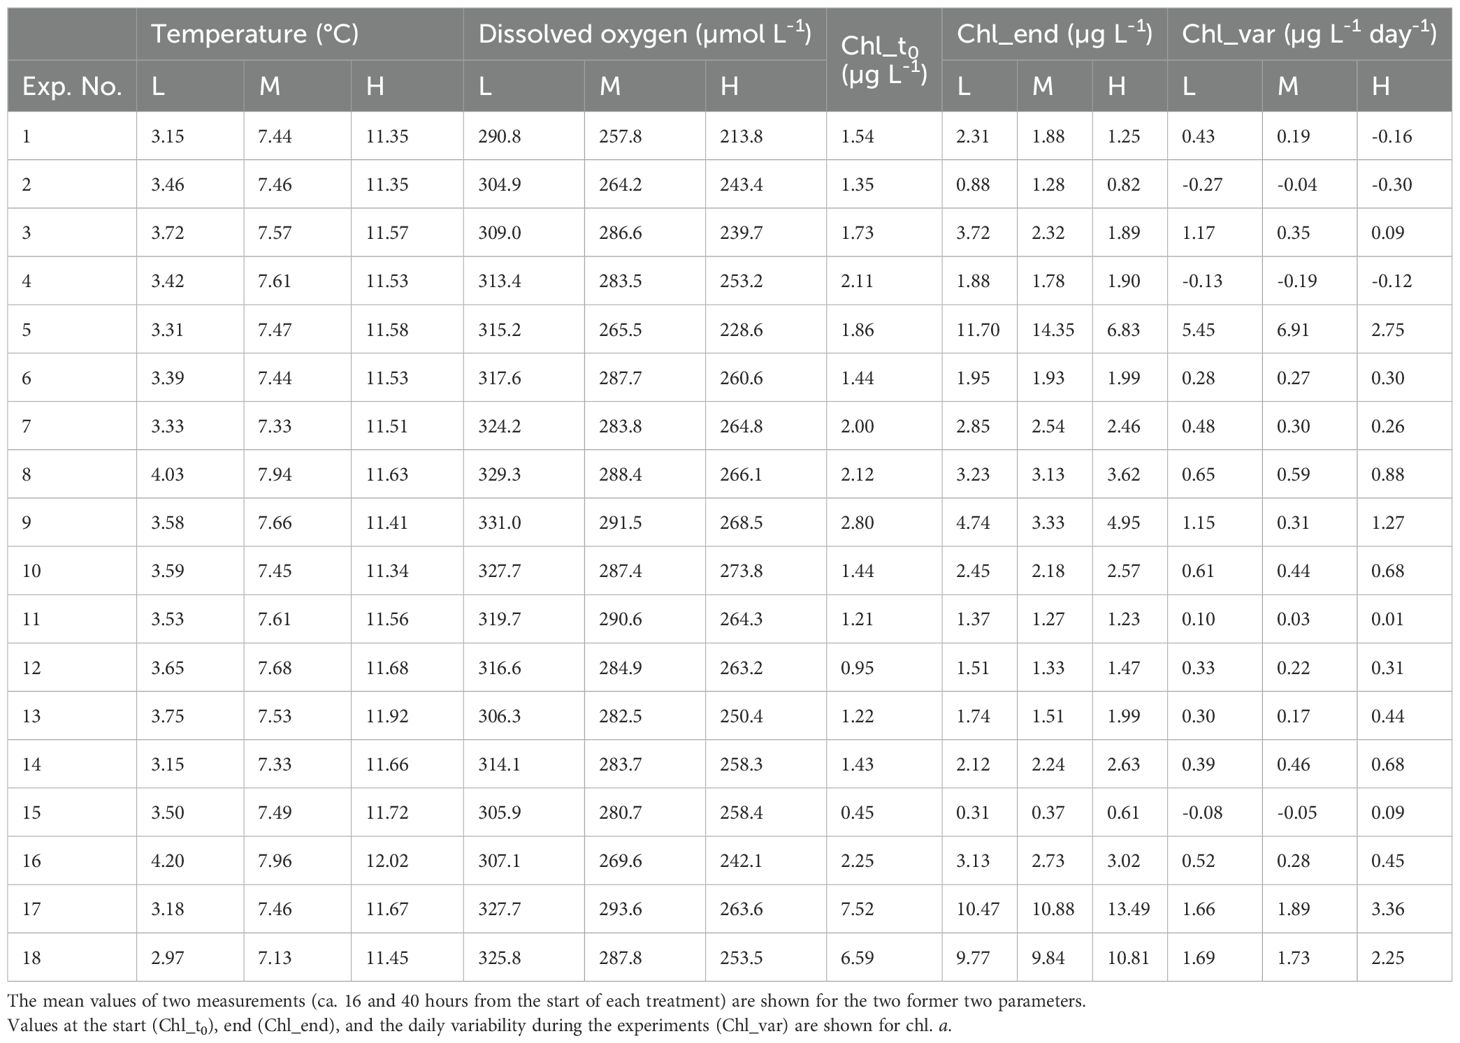
Table 2. Summary of the environmental parameters (temperature, dissolved oxygen, and chlorophyll a [chl. a]) of the three treatments (L, M, H) of each experiment.
3.2 Growth rate
The detailed stage distribution data of each experiment are presented in three supplemental tables (Supplementary Tables 1-3 for E. bungii, M. pacifica, and N. plumchrus, respectively). The growth rate g of E. bungii was 0.000–0.080 day-1 in DW, 0.000–0.192 day-1 in CW, and 0.000–0.095 day-1 in NW (Figure 2). For E. bungii, g was highest at the highest temperature among the three experimental conditions used in this study. The growth rate g of M. pacifica was at 0.009–0.204 day-1 in DW, 0.002–0.475 day-1 in CW, and 0.006–0.377 day-1 in NW (Figure 3). For M. pacifica, g was also higher for the higher temperature conditions within the experimental conditions of this study. The growth rate g of N. plumchrus was at 0.018–0.422 day-1 in DW, 0.005–0.754 day-1 in CW, and 0.020–0.566 day-1 in NW (Figure 4). For N. plumchrus, g was highest in the middle water temperature condition (Experiment M), except for one experiment (Exp. 6). The g of N. plumchrus showed different responses to the three experimental temperatures than the former two species.
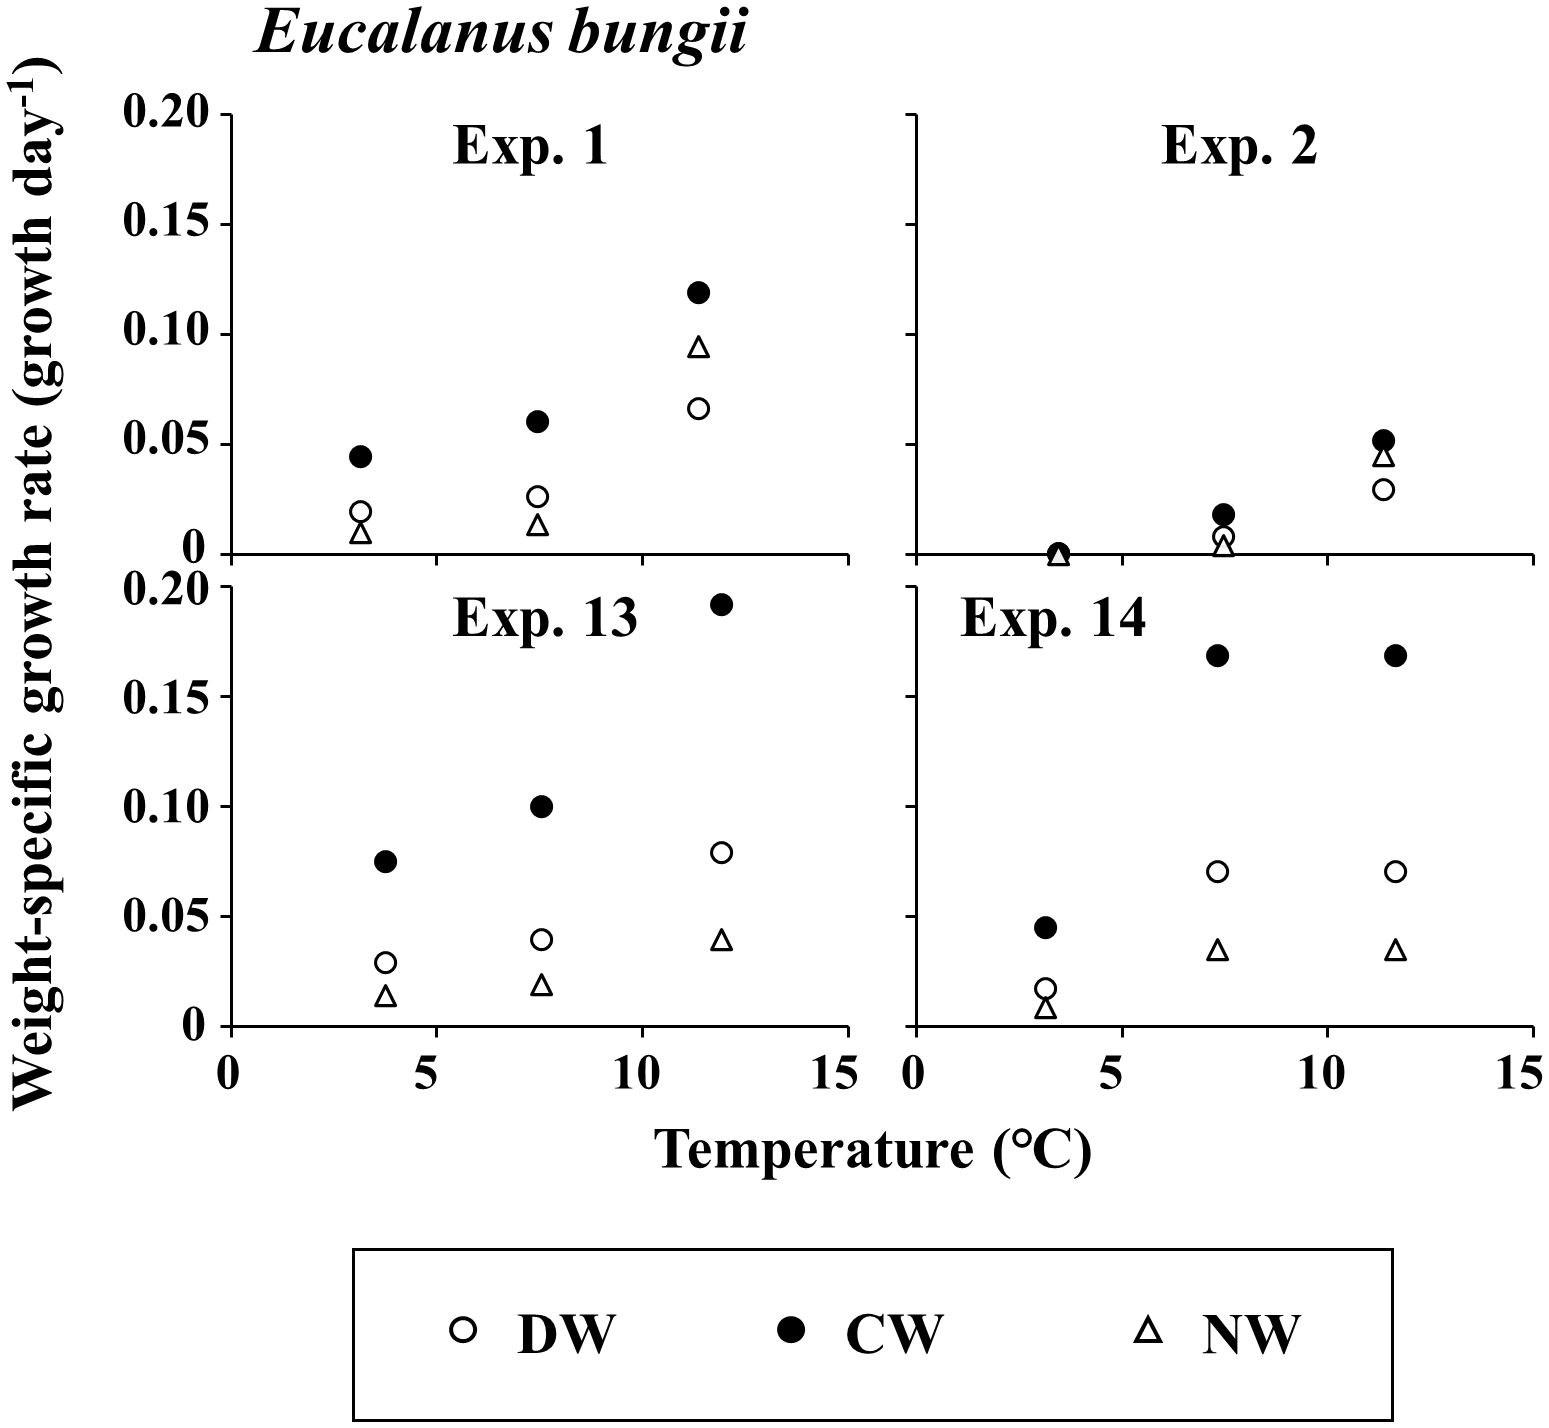
Figure 2. Eucalanus bungii. Results of mean daily weight-specific growth rates with the rearing temperatures in each experiment. Three weight units (dry [DW], carbon [CW], and nitrogen [NW]) were applied. For details of each experiment, see Tables 1, 2.
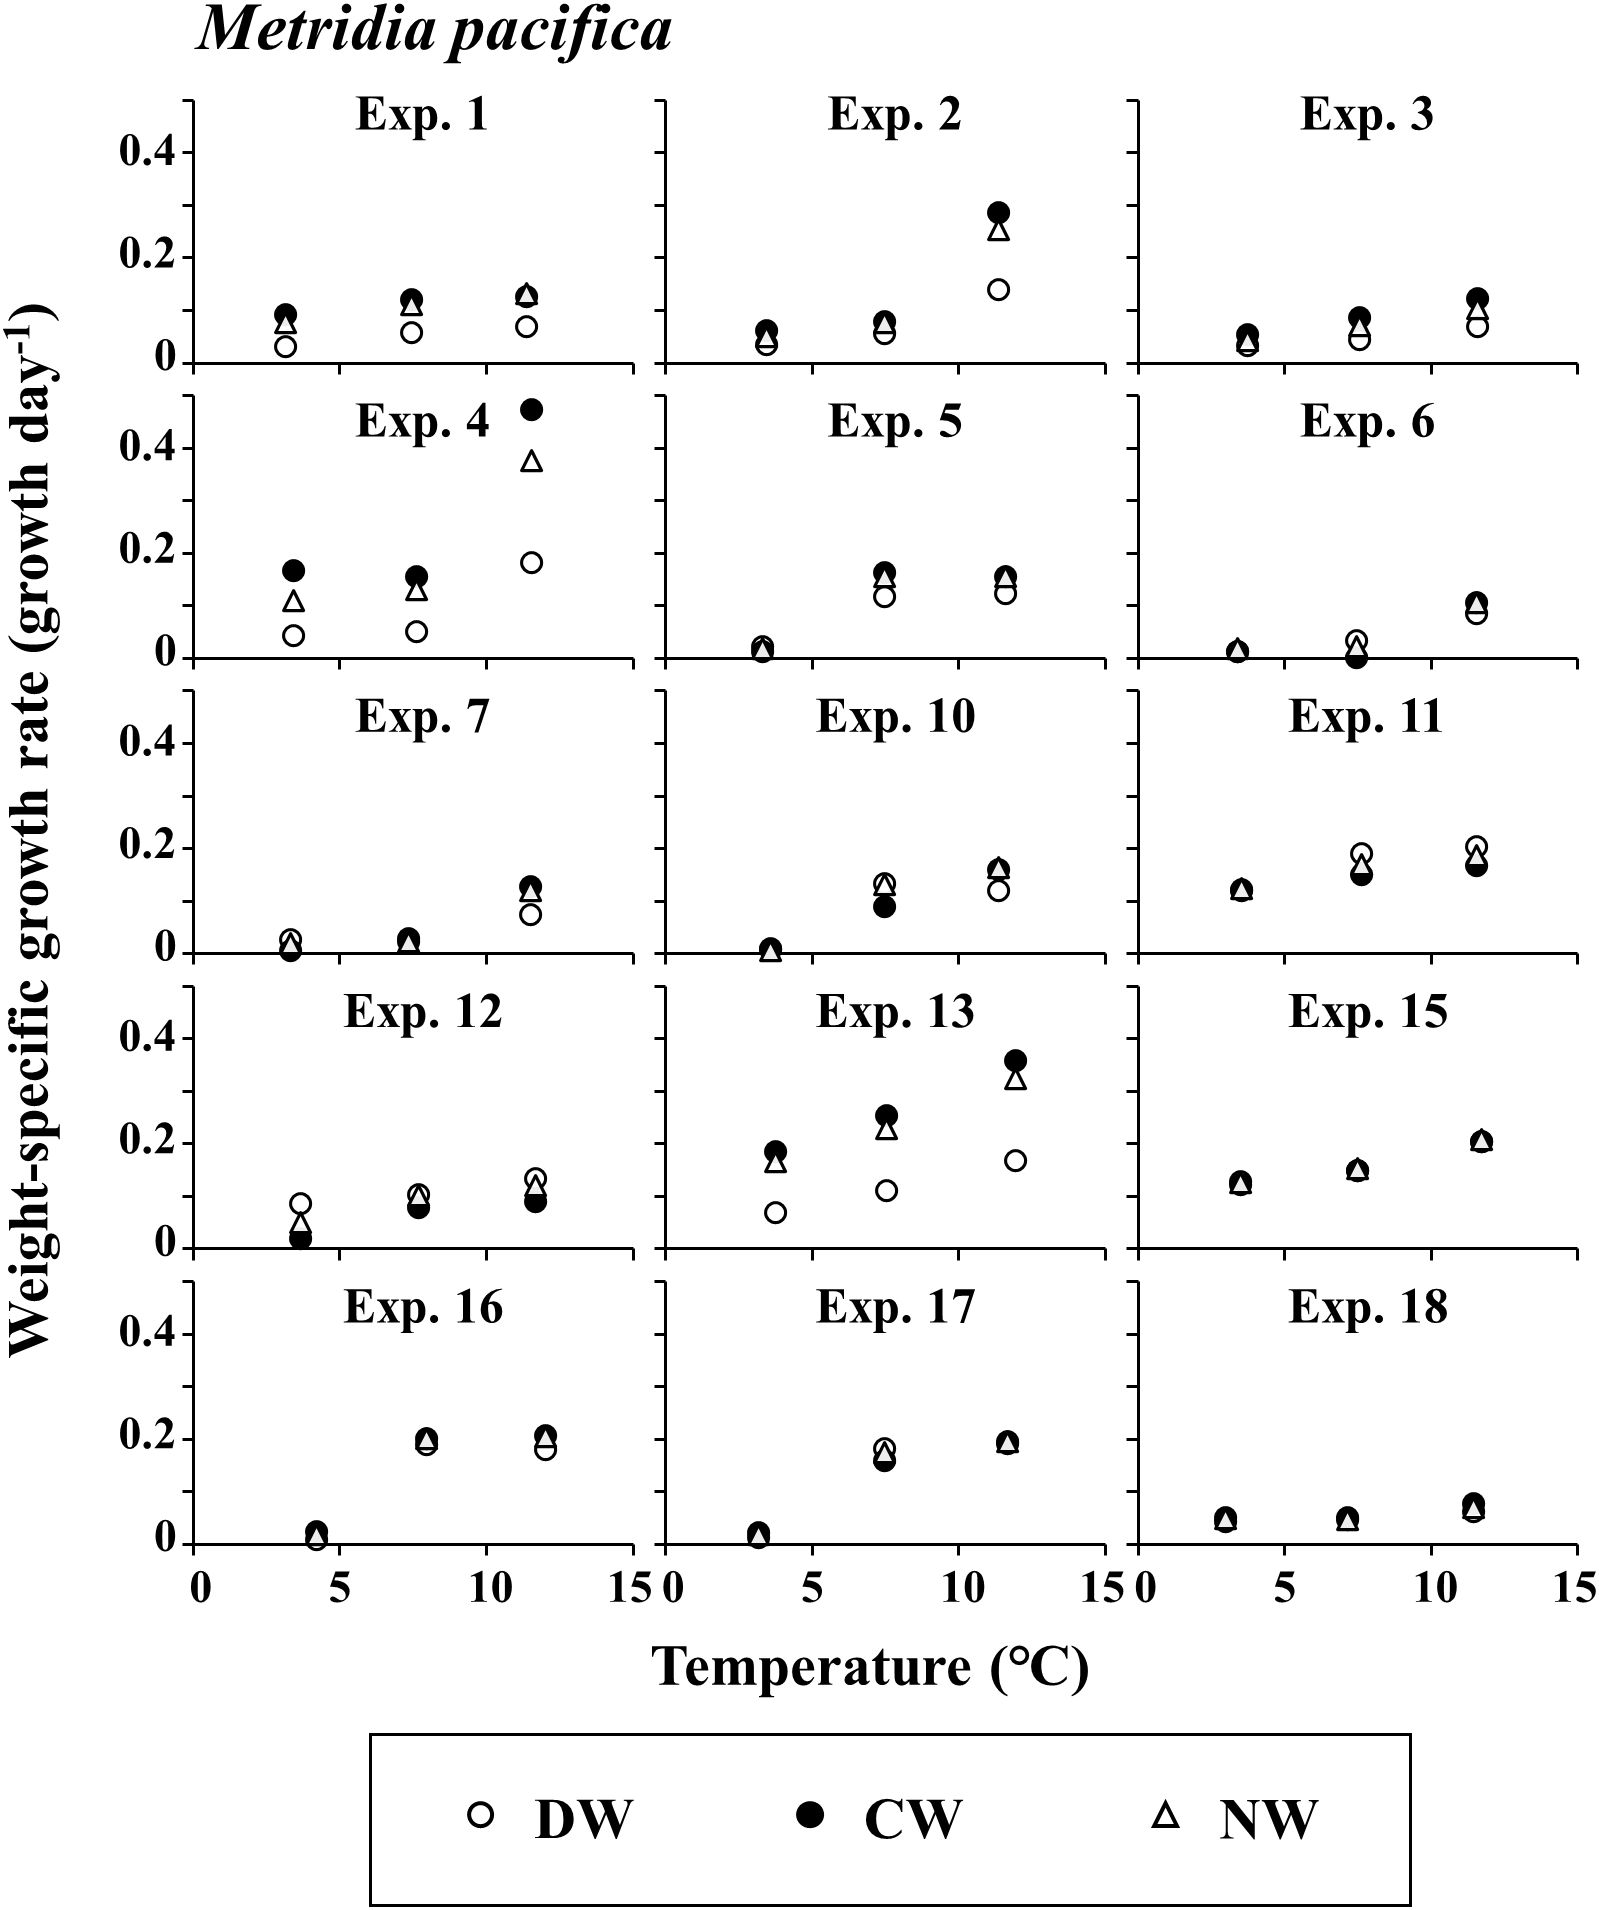
Figure 3. Metridia pacifica. Results of mean daily weight-specific growth rates with the rearing temperatures in each experiment. Three weight units (dry [DW], carbon [CW], and nitrogen [NW]) were applied. For details of each experiment, see Tables 1, 2.
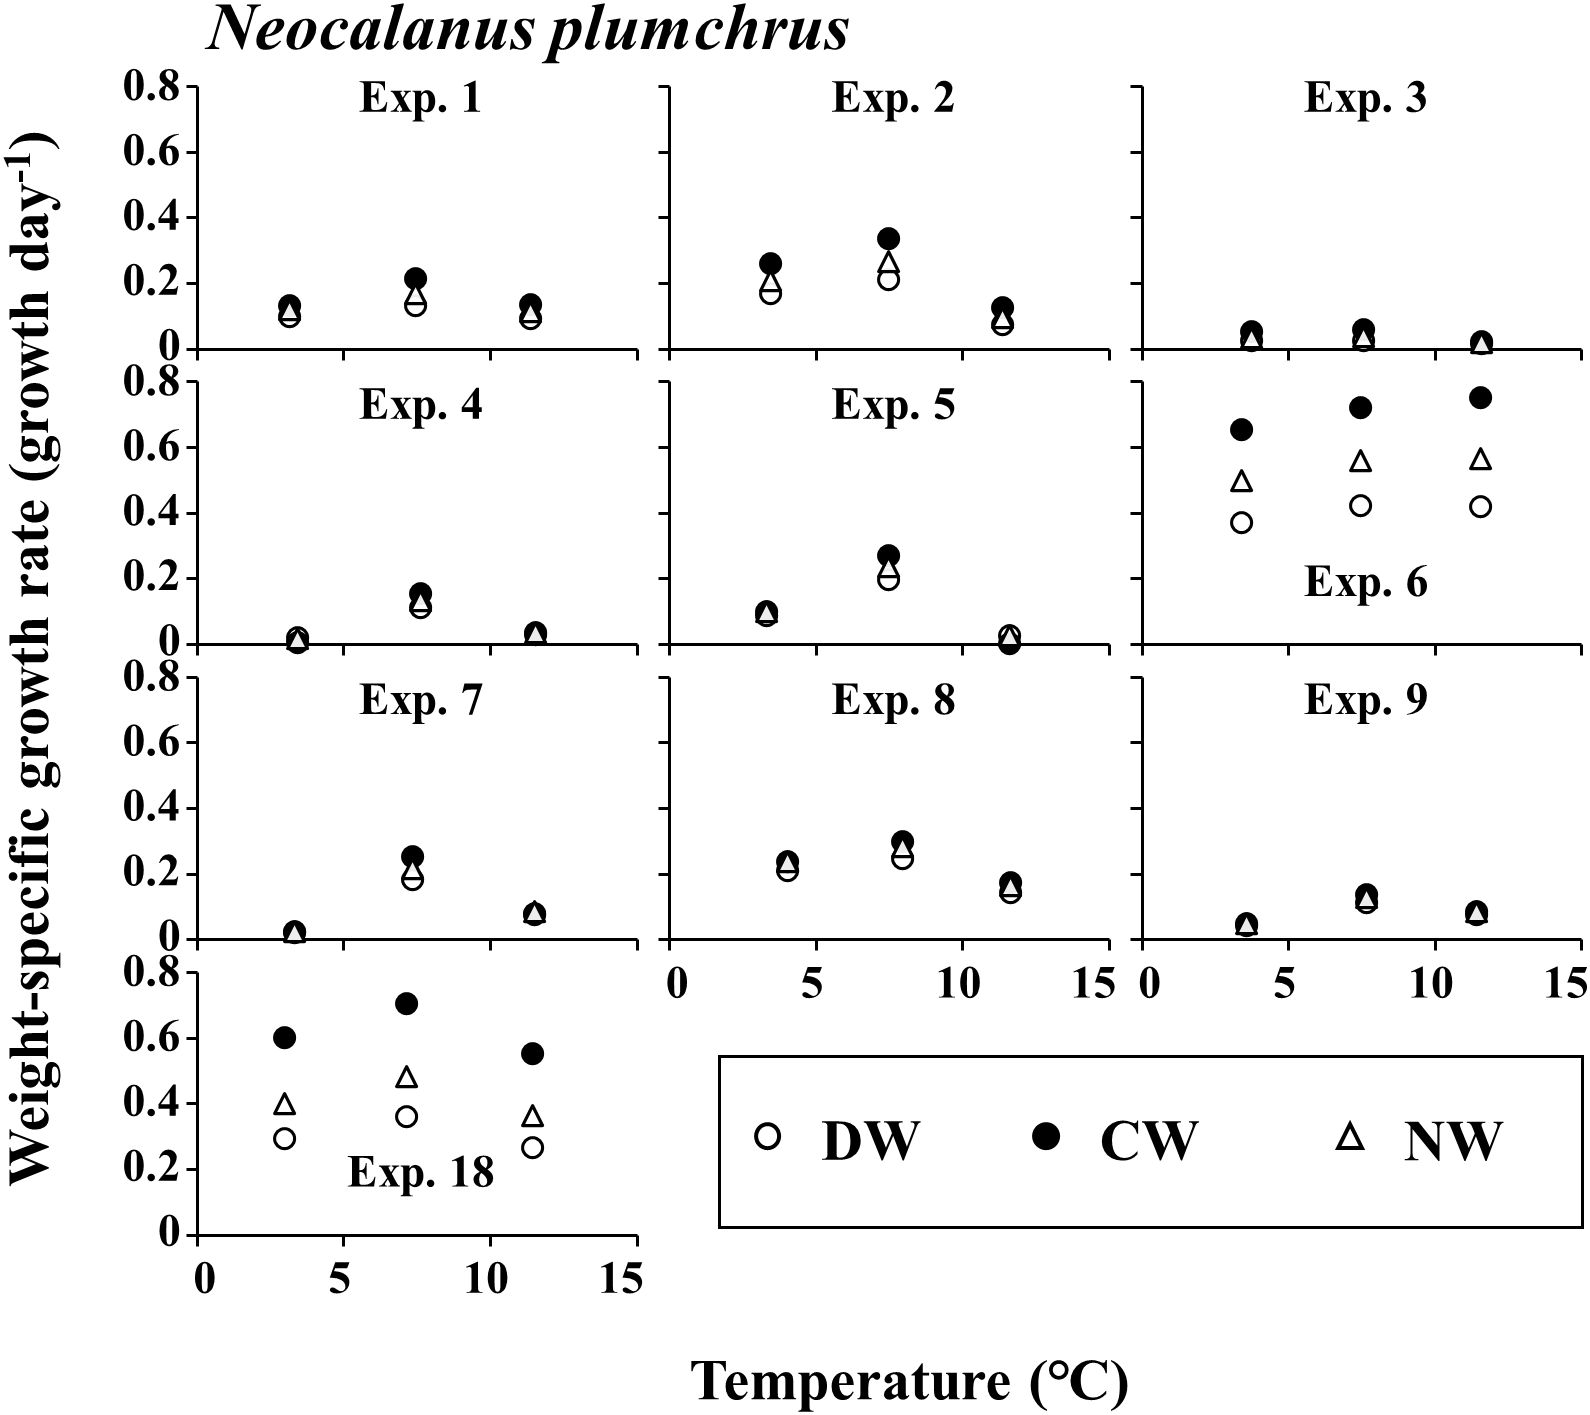
Figure 4. Neocalanus plumchrus. Results of mean daily weight-specific growth rates with the rearing temperatures in each experiment. Three weight units (dry [DW], carbon [CW], and nitrogen [NW]) were applied. For details of each experiment, see Tables 1, 2.
The range of g varied greatly among the species. The maximum value of g was 0.192 day-1 for E. bungii, 0.475 day-1 for M. pacifica, and 0.754 day-1 for N. plumchrus (Figures 2–4). Among the three species, the highest g was seen for N. plumchrus. From the viewpoint of the three weight units determined in this study (DW, CW, and NW), g in CW was higher than that in the other two units. This weight unit trend was common among the three species.
3.3 Effect of environmental parameters on growth rate
The results of the VIF between the environmental data measured during the rearing experiment are shown in Table 3. We treated VIF values > 3 as variables with a high correlation with the other environmental data, Chl_end showed a high correlation with the other two Chl a data points (Chl_t0 and Chl_var). Thus, we omitted Chl_end from the GLM analysis.
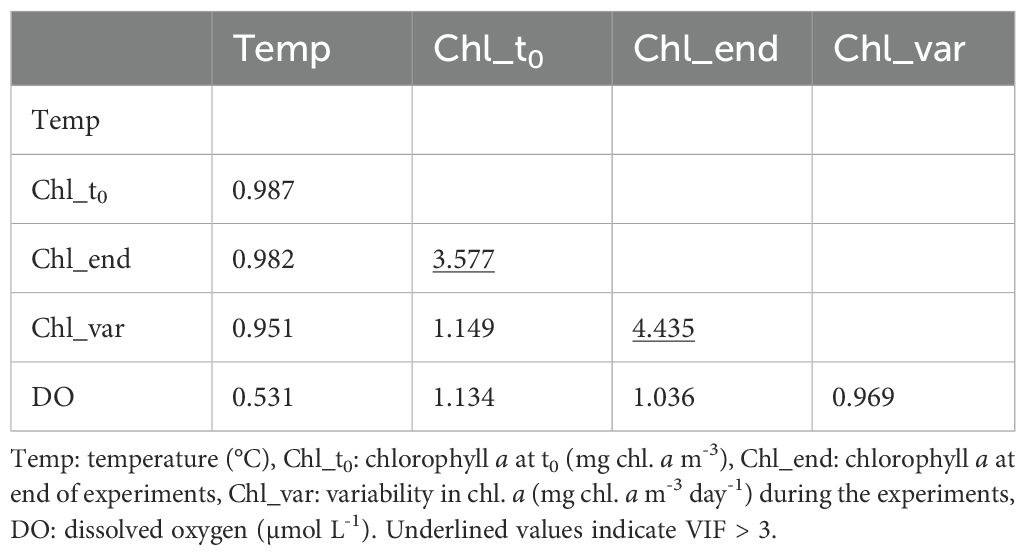
Table 3. Variance inflation factors (VIF) among the environmental parameters during the laboratory rearing experiments.
The results of the GLM analysis applying the growth rate g as the response variable and each environmental variable (temperature, Chl_t0, Chl_var, and DO) as explanatory variables for the three weight units of the three species are shown in Table 4. Among the environmental variables, temperature had the most prominent effect and was common to all three weight units of E. bungii and M. pacifica (p< 0.01). In contrast, the temperature had no significant effect on any of the three weight units for N. plumchrus in the GLM. This reflected the species-specific reaction of g with temperature for the species mentioned above. The growth rate g of N. plumchrus was the highest under mid-temperature conditions (M) (Figure 4). Regarding the effects of the other environmental variables, a slight positive effect (one or two out of nine experimental conditions) was observed for Chl_t0 and Chl_var. Notably, the DO did not affect g under these experimental conditions.
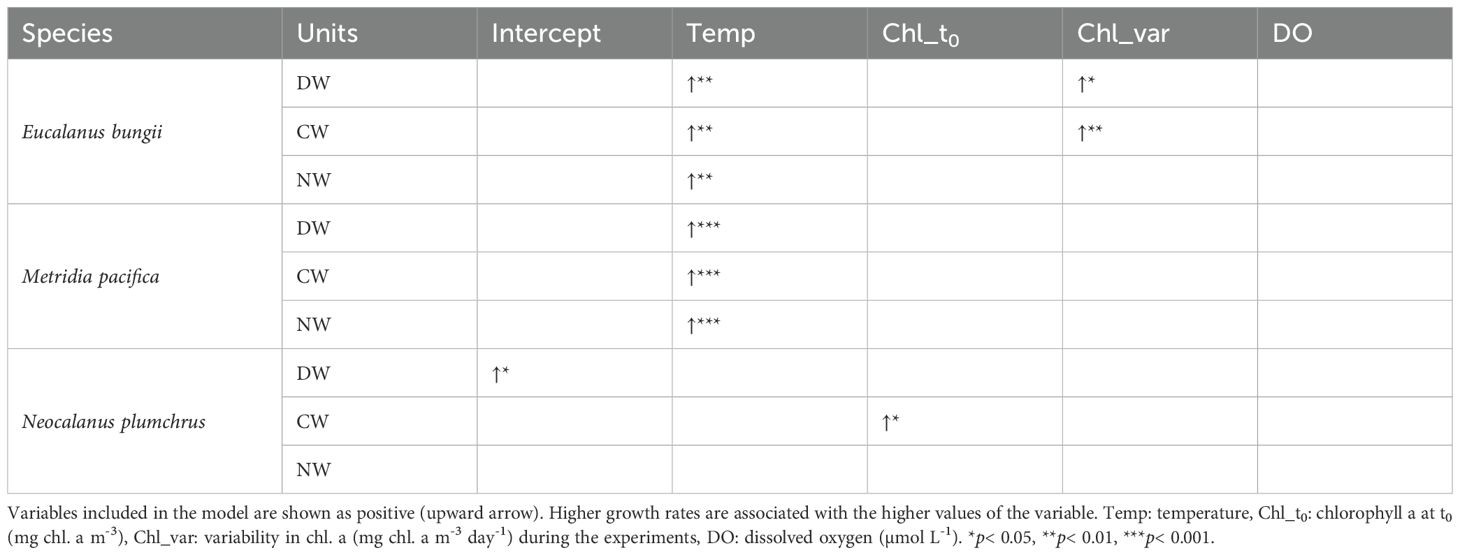
Table 4. Results of GLM and stepAIC analysis for the growth rates for weights at three units (dry [DW], carbon [CW], nitrogen [NW]) of Eucalanus bungii, Metridia pacifica, and Neocalanus plumchrus during this study.
The results of the GAM analysis, applying growth rate g as the response variable and temperature as the explanatory variable for the three units of the three species, are shown in Figure 5. Temperature had a highly significant effect on g in all three species (p< 0.001). For E. bungii and M. pacifica, growth rate g was increased with increasing temperature under the temperature condition of this study (2.5–12.3°C). In contrast, the g of N. plumchrus peaked around 7°C and showed slightly lower values at 3°C and 11°C, yielding a dome-shaped curve of g against temperature within the examined temperatures in this study (Figure 5).
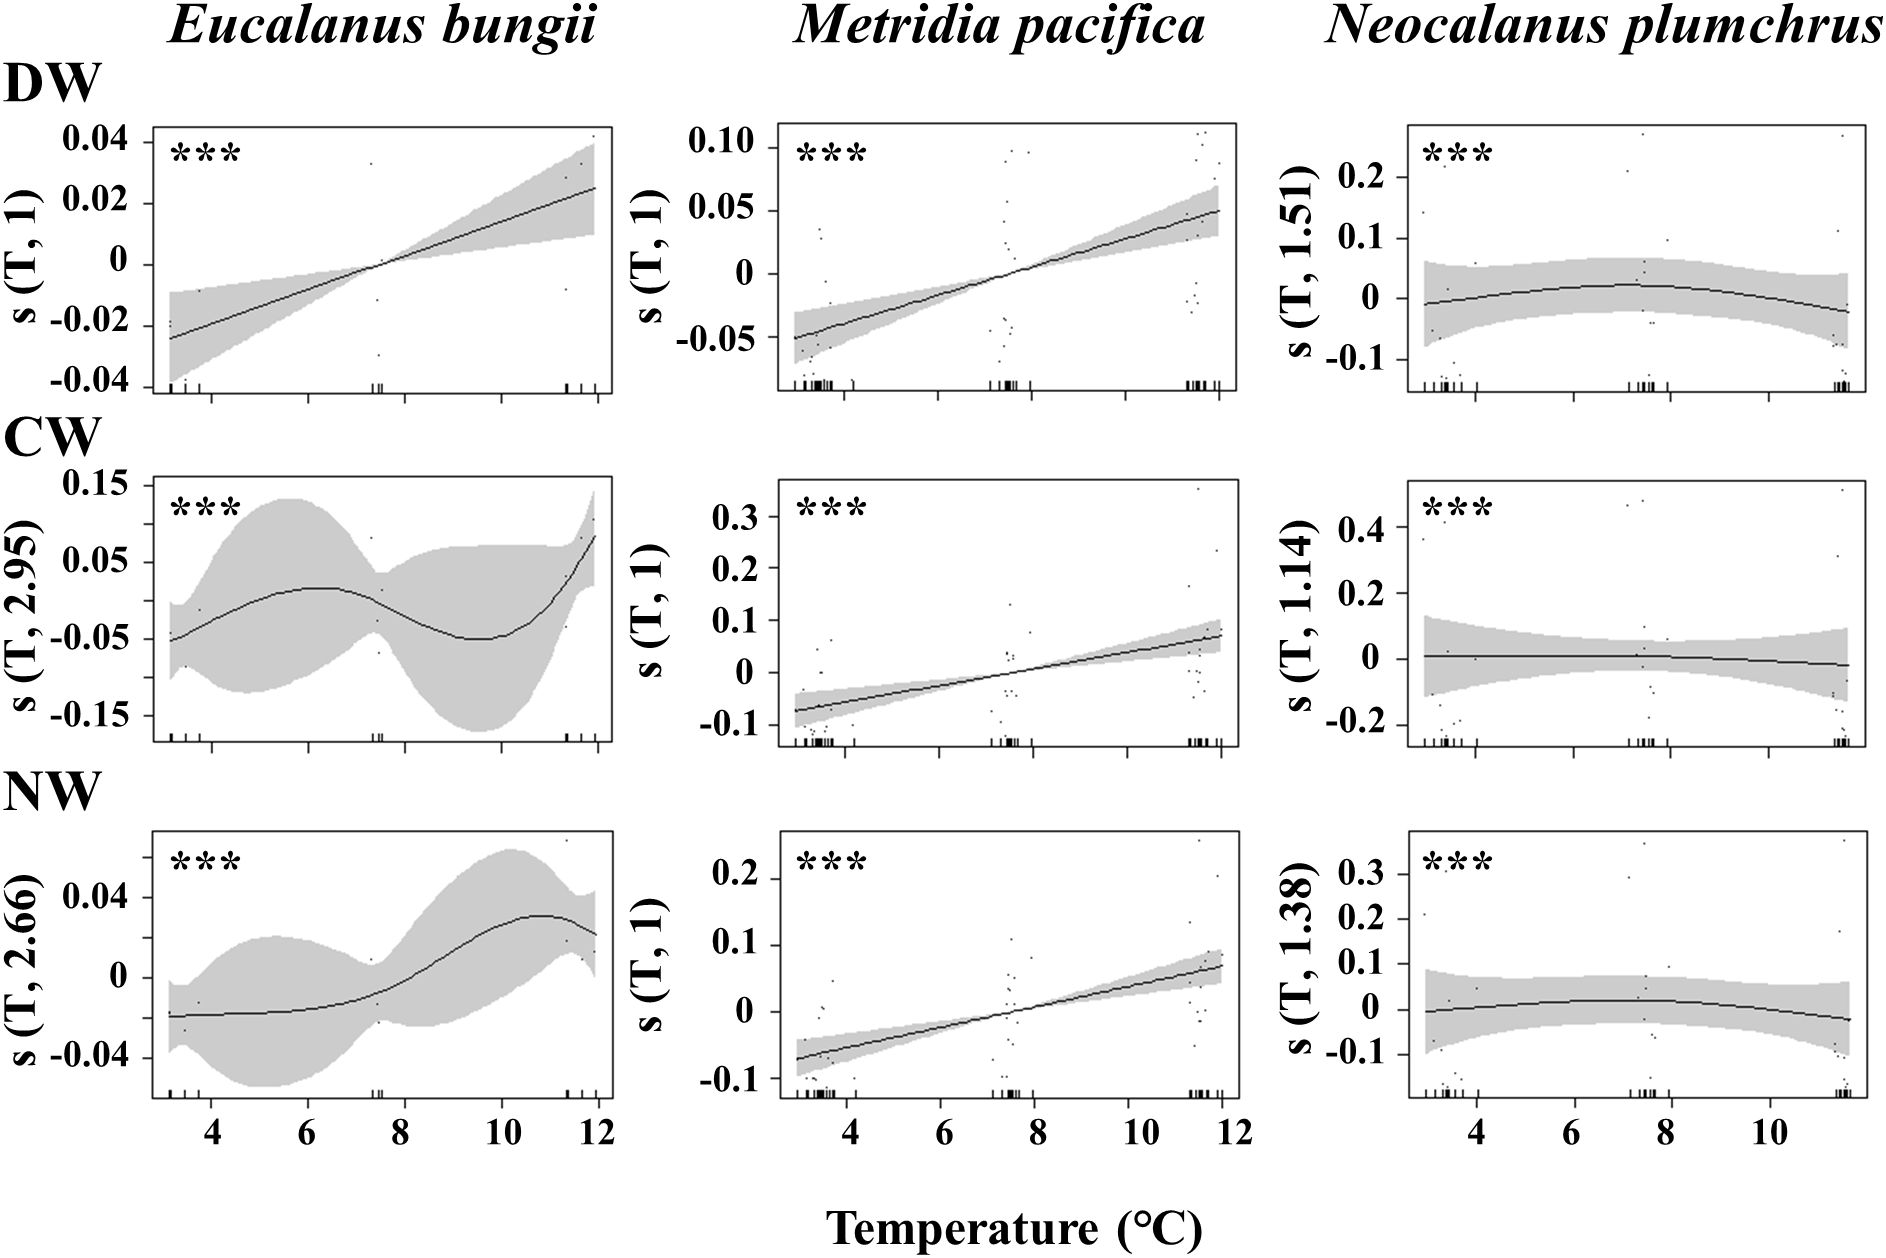
Figure 5. Results of GAMs based on the growth rates of three weight untes (dry [DW], carbon [CW], and nitrogen [NW]) of Eucalanus bungii, Metridia pacifica, and Neocalanus plumchrus with temperature during experiments of this study. ***p < 0.001.
4 Discussion
4.1 Experimental conditions
The short incubations have the advantage that they avoid artifacts associated with long-term incubations. However, they also have limitations: 1) no acclimatization to experimental temperatures could introduce stress response; 2) the duration of the experiment is short compared with the stage durations. The latter point is important because there is an expected increase in weight within a stage, and the DW estimates from Ueda et al. (2008) are average weights, and the DW of recently moulted individuals may be lower (< 2 days). Thus, the growth estimates in this study may be overestimates, which may partly explain the differences between published results and the current study.
The rearing period ranged from 1.67 to 1.88 days (40.0–44.0 hours) throughout the 18 experiments conducted in this study (Table 1). We quantified temperature, dissolved oxygen (DO), and Chl as environmental data that affect the growth rate of copepods in this study. The temperature was kept at 4°C intervals (3, 7, and 11°C) through the rearing experiments for 1.67–1.88 days (Table 2). This indicated that temperature differences were present throughout the experiment.
For dissolved oxygen, the DO under the three experimental conditions can be converted and expressed as oxygen solubility. The oxygen solubilities at temperatures L, M, and H ranged from 84.1% to 102.1%, 78.8% to 99.9%, and 69.2% to 100.0%, respectively. This indicates that DO conditions are favorable for zooplankton, especially copepods. This was also confirmed by the fact that DO had no significant effect on growth rates for any of the three weight units of the three species in this study (Table 4). Near supersaturated DO was seen for Experiment 17, which was characterized by high Chl_t0 and high productivity, which may have been improved by the sufficient light conditions of 3.75 µmol m-2 sec.-1 at about 50 m depth (Nosaka et al., 2014).
The Chl_t0 observed in this study was substantially higher than the Chl a values observed for field conditions. This may be because the zooplankton collection in this study was made with a fine mesh net with 63 µm, which could collect large phytoplankton cells and concentrate them. Because the light conditions of the rearing experiments in this study were similar to the photoperiod and light intensity at a depth of 50 m, Chl a increased at the end of 83% (45/54) of the rearing experiments (Table 2). These results indicated sufficient feeding conditions (food availability of phytoplankton) for the three copepods categorized as suspension feeders during the rearing experiments. Thus, food was not considered a limiting factor for copepod growth.
The experimental rearing conditions used in this study, as indicated by temperature, DO, and Chl a were characterized by the availability of sufficient and favorable food and only a large difference in temperature between the experimental conditions was observed. However, the effects of abrupt changes in temperature and the effects of crowds (e.g., rearing at high densities), which are not seen in field conditions, are two major factors that should be considered (Kimmerer and McKinnon, 1987; Kimmerer et al., 2007). While such shortcomings were present in the present study, the proportion of dead specimens evaluated using the neutral red method did not differ between T0 and the end of the experiments (p > 0.05, one-way ANOVA). The observed proportion of the dead copepod specimen (7.4–15.4%) agreed with the reported values from the field conditions (Elliott and Tang, 2011; Maud et al., 2018; Tang et al., 2019). This suggested that the changes in temperature and rearing at high zooplankton density had little effect on the mortality of copepods during the short rearing period (1.67–1.88 days) of this study. Thus, it can be concluded that the growth rates in this study represent the responses of the three copepod species when food was sufficiently available and only changed with rearing water temperature conditions.
4.2 Growth rate
The three copepod species examined in this study (E. bungii, M. pacifica, and N. plumchrus) are the dominant species in the zooplankton community of the subarctic Pacific (Miller et al., 1984; Ikeda et al., 2008). For copepods living in relatively low temperatures, the 40–44 hour experimental time in this study may be too short, as their stage duration could be longer than the rearing time. From the literature, the duration times of different life stages of three species have been reported (Padmavati and Ikeda, 2002; Yamaguchi et al., 2010; Takahashi and Ide, 2011) (Supplementary Tables 4). At temperatures between 3–8°C, the stage duration times ranged from 7 to 55 days, with a median of 14.5 days. Based on these values, we found that during our study’s 42-hour (1.75-day) rearing period, 3.2–25.0% (median 12.1%) of the specimens were expected to molt. To ensure that at least one specimen molts until the end of the rearing, we estimated that 4–31.4 individuals (median 8.3 individuals) at each copepodite stage are needed under the initial conditions (T0). We conducted the study using triplicate incubation bottles and an adequate number of individuals at each temperature condition (see Table 1). From this perspective, we were able to determine the maximum growth rate of each species under conditions where food was not limited.
Owing to their ecological importance, the growth rates of the three species have been studied previously. The reported growth rates are summarized by Kobari et al. (2019). For example, the growth rates of E. bungii have been reported as 0.10 day-1 in the Bering Sea (Vidal and Smith, 1986), and 0.02 day-1 (Ikeda et al., 2008) and 0.04 day-1 (Kobari et al., 2010) in the Oyashio region. From laboratory rearing, maximum growth rate of 0.15 day-1 has been reported (Takahashi and Ide, 2011). In this study, the maximum growth rate of E. bungii reached 0.19 day-1, which is higher than the values previously reported (Figure 2). This may be due to the rearing conditions in this study; thus, food was sufficiently available, and there was a wide range of rearing temperatures.
M. pacifica was the smallest copepod among the three species examined in the present study. Although the other two species have generation lengths of one year or more (Kobari and Ikeda, 2001; Shoden et al., 2005), M. pacifica is considered to have multiple generations within one year (Batchelder, 1985; Padmavati et al., 2004). Growth rates of M. pacifica have been reported as less than 0.01–0.29 day-1 (Liu and Hopcroft, 2006b) and 0.17–0.18 day-1 (Hopcroft et al., 2005) in the coastal area of the Gulf of Alaska. The maximum growth rate of M. pacifica observed in the present study ranged from 0.20–0.47 day-1. The maximum growth rate of M. pacifica in this study was higher than previously reported values for the same species, similar to the trend mentioned for E. bungii (Figure 3).
There are two breeding patterns of pelagic copepods based on their energy, as discussed by Varpe et al. (2009) and Sainmont et al. (2014). Income breeders derive their reproductive energy from in-situ feeding, while capital breeders obtain theirs from stored energy in their bodies, such as lipids. While the two previous species are income breeders that reproduce by feeding at the sea surface (Padmavati et al., 2004; Shoden et al., 2005), N. plumchrus is a capital breeding species that descends to the deep layer at the C5 stage, molts to adults in the deep layer, and reproduces in the deep layer without feeding by using stored lipids as energy (Kobari and Ikeda, 2001). The growth rates of N. plumchrus have been well documented, with maximum growth rates of 0.09 day-1 in the Bering Sea (Vidal and Smith, 1986), 0.28 day-1 in the Gulf of Alaska (Liu and Hopcroft, 2006a), and 0.19 day-1 (Kobari et al., 2003) or 0.03 day-1 (Kobari et al., 2010) in the Oyashio region. The maximum growth rate of N. plumchrus in this study ranged from 0.42 to 0.75 day-1 (Figure 4), which was higher than previously reported values, a similar trend as that of the two species mentioned above.
Thus, in the present study, growth rates higher than those reported in previous studies were observed for all three species. These patterns were common not only for E. bungii and M. pacifica, which showed the highest growth rates under the highest temperature conditions, but also for N. plumchrus, which had the highest growth rates under intermediate temperature conditions. This suggested that the high growth rates observed in this study may not be due to the broader experimental water temperature ranges but rather due to high primary productivity, which is enhanced by the high concentration of food phytoplankton concentrated by the fine-mesh net and the sufficient light conditions available during the rearing experiments. Thus, the high growth rates observed in this study are considered the maximum growth rates of each species, which were achieved under sufficient feeding conditions for each temperature condition.
This study determined copepod growth rates using three weight units. Common for the three species, the growth rates in CW were higher than those in DW and NW. A similar pattern has been reported for C. finmarchicus in the North Atlantic, where the growth rates in CW were 1.0–1.1 times higher than those in NW at naupliar stages and 1.4–1.7 times higher in C5, which is a reflection of the higher lipid accumulations at the late copepodite stages (Campbell et al., 2001). The three copepod species examined in this study are also known to store lipids in their bodies (prosomes), especially during the late copepodite stages (Kobari and Ikeda, 2001; Padmavati et al., 2004; Shoden et al., 2005). These characteristics may induce higher growth rates in CW than in the other two units.
4.3 Effect of environmental parameters on growth rate
Among the three environmental parameters considered in this study (temperature, DO, and Chl a), DO did not affect the growth rate in any experiment, and Chl a had little effect on the growth rates of most weight units of the three species (Table 4). These results might be because both dissolved oxygen and food availability under the experimental conditions were more favorable than those observed under field conditions.
In contrast, the temperature had a clear effect on the growth rates of the three species. To quantify the temperature effect on the physiology of zooplankton, Q10 is used. However, the calculation of the Q10 value is meaningful for metabolism-related values such as respiration rates or ammonia excretion rates, and would not be calculated for growth rates (cf. Ikeda et al., 2000). In response to temperature, E. bungii and M. pacifica exhibited higher growth rates at the highest experimental temperature, whereas N. plumchrus showed lower growth rates at the highest experimental temperature (Figure 5).
This may reflect inter-species differences in the optimum temperature for each species. Because E. bungii and M. pacifica reproduce at the surface layer through income breeding, their optimum temperatures are expected to be high (Padmavati et al., 2004; Shoden et al., 2005). However, since N. plumchrus reproduces in the deep layer by capital breeding, it descends to the deep layer to avoid high temperatures during the warm period. Thus, the temperature tolerance and optimum temperature of N. plumchrus are expected to be lower than those of the other two species.
Marine heatwaves are conditions in which warm seawater conditions continue for at least five days or longer. Their global occurrence increased by 34% during 1987–2016 compared to that during 1925–1954, their duration increased by 17%, and their annual duration expressed as days in a year increased by more than 50% (Smale et al., 2019). Marine heat waves were even observed in the subarctic Pacific and in the Gulf of Alaska in 2014–2016 (Bond et al., 2015; Di Lorenzo and Mantua, 2016). A marine heat wave was also observed in the western Subarctic Pacific in 2021 (Kuroda and Setou, 2021; Kuroda et al., 2021). The depth affected by marine heat waves extended near the surface layer (<20 m) (Kuroda and Setou, 2021). Since N. plumchrus is treated as a particle feeder species, especially on phytoplankton and microzooplankton, which are abundant near the surface (Ikeda et al., 2008), the negative effect of marine heat waves on their growth rates is expected.
The species-specific differences in growth rate responses to temperature evaluated in this study are important for predicting the response of lower–trophic level marine ecosystems in future oceans, where such marine heatwaves are expected to occur more frequently than in the present.
5 Conclusions
In the present study, we developed a modified artificial cohort method, especially in the collecting method and rearing conditions, to evaluate the growth rates of various sympatric copepods. This method was achieved by collecting zooplankton through a fine-mesh (63 µm) net equipped with a bucket-type cod-end and creating a zooplankton community that contained only young copepodite stages made by a gentle reverse filtering of a large 925 µm sieve, then rearing for approximately 42 hours. During rearing, the available light and photoperiod were similar to that at a depth of 50 m. In these treatments, Chl a increased by 83% by the end of the experiment. This suggested that the feeding conditions were sufficient for copepods and did not act as limiting factors. In terms of oxygen solubility, the DO was at 69.2%–102.1%, which was also sufficient for copepod growth. The mean proportion of dead specimens evaluated using the NR method was 10.2% for the three copepod species (E. bungii, M. pacifica, and N. plumchrus), which corresponds with the values observed in the field. Therefore, we established a method to evaluate the growth rate of copepods under food-sufficient conditions. The copepod species studied in this research are subarctic species that live in cold conditions, so the developmental time for each stage is longer than the 42 hour rearing period. Therefore, it’s important to conduct experiments with a large number of individuals to obtain accurate growth rate results. The key finding of this study is that the optimal water temperature varies among the three sympatric species, which is related to the ecology of each species. Temperature was the most prominent factor affecting the growth rates of all three species. Under rearing at 3, 7, and 11°C, E. bungii and M. pacifica showed high growth rates at the highest temperature (11°C), while N. plumchrus showed a high growth rate at an intermediate temperature (7°C). These species-specific differences in growth rates for response to temperature could be interpreted as the optimum temperatures for E. bungii and M. pacifica were higher than that of N. plumchrus. These results are important for predicting the response of dominant copepods to future environments, which is expected to be a frequent occurrence of marine heat waves.
Data availability statement
The raw data supporting the conclusions of this article will be made available by the authors, without undue reservation.
Ethics statement
The manuscript presents research on animals that do not require ethical approval for their study.
Author contributions
TT: Conceptualization, Data curation, Writing – original draft, Formal analysis, Investigation. SN: Writing – original draft, Writing – review & editing. KM: Writing – review & editing, Resources, Software, Validation, Visualization. AY: Conceptualization, Data curation, Project administration, Supervision, Writing – original draft, Writing – review & editing.
Funding
The author(s) declare financial support was received for the research, authorship, and/or publication of this article. Part of this study was supported by Grants-in-Aid for Challenging Research (Pioneering) 20K20573, Scientific Research 22H00374 (A), 20H03054 (B), 19H03037 (B), and 17H01483 (A) from the Japan Society for the Promotion of Science (JSPS). This study was partially supported by the Arctic Challenge for Sustainability II (ArCS II; JPMXD1420318865) and the Environmental Research and Technology Development Fund (JPMEERF20214002) of the Environmental Restoration and Conservation Agency of Japan.
Acknowledgments
The zooplankton used in this study were collected from R/V Mirai at JAMSTEC. We sincerely thank Dr. Shinya Kouketsu, the chief scientist of the cruise, as well as the captain, crew, and scientists onboard the cruise for their great help in collecting samples and obtaining the hydrographic data used in this study.
Conflict of interest
The authors declare that the research was conducted in the absence of any commercial or financial relationships that could be construed as a potential conflict of interest.
Publisher’s note
All claims expressed in this article are solely those of the authors and do not necessarily represent those of their affiliated organizations, or those of the publisher, the editors and the reviewers. Any product that may be evaluated in this article, or claim that may be made by its manufacturer, is not guaranteed or endorsed by the publisher.
Supplementary material
The Supplementary Material for this article can be found online at: https://www.frontiersin.org/articles/10.3389/fmars.2024.1397721/full#supplementary-material
References
Batchelder H. P. (1985). Seasonal abundance, vertical distribution, and life history of Metridia pacifica (Copepoda: Calanoida) in the oceanic subarctic Pacific. Deep-Sea Res. 32A, 949–964. doi: 10.1016/0198-0149(85)90038-X
Bond N. A., Cronin M. F., Freeland H., Mantua N. (2015). Causes and impacts of the 2014 warm anomaly in the NE Pacific. Geophys. Res. Lett. 42, 3414–3420. doi: 10.1002/2015GL063306
Campbell R. G., Wagner M. M., Teegarden G. J., Boudreau C. A., Durbin E. G. (2001). Growth and development rates of the copepod Calanus finmarchicus reared in the laboratory. Mar. Ecol. Prog. Ser. 221, 161–183. doi: 10.3354/meps221161
Di Lorenzo E., Mantua N. (2016). Multi-year persistence of the 2014/15 North Pacific marine heatwave. Nat. Clim. Change 6, 1042–1048. doi: 10.1038/nclimate3082
Egashira K., Huang Y.-S., Matsuno K., Yamaguchi A. (2024). East-west differences of the microplankton community along the 47°N transect in the subarctic Pacific during the summer of 2021. Bull. Fish. Sci. Hokkaido Univ. 74, 23–33. doi: 10.14943/bull.fish.74.1.23
Elliott D. T., Tang K. W. (2009). Simple staining method for differentiating live and dead marine zooplankton in field samples. Limnol. Oceanogr. Methods 7, 585–594. doi: 10.4319/lom.2009.7.585
Elliott D. T., Tang K. W. (2011). Spatial and temporal distributions of live and dead copepods in the lower Chesapeake Bay (Virginia, USA). Estuar. Coast. 34, 1039–1048. doi: 10.1007/s12237-011-9380-z
Hama N., Abe Y., Matsuno K., Yamaguchi A. (2019). Study on effect of net mesh size on filtering efficiency and zooplankton sampling efficiency using Quad-NORPAC net. Bull. Fac. Fish. Hokkaido Univ. 69, 47–56. doi: 10.14943/bull.fish.69.1.47
Hopcroft R. R., Clarke C., Byrd A. G., Pinchuk A. G. (2005). The paradox of Metridia spp. egg production rates: a new technique and measurements from the coastal Gulf of Alaska. Mar. Ecol. Prog. Ser. 286, 193–201. doi: 10.3354/meps286193
Ikeda T., Shiga N., Yamaguchi A. (2008). Structure, biomass distribution and trophodynamics of the pelagic ecosystem in the Oyashio region, western subarctic Pacific. J. Oceanogr. 64, 339–354. doi: 10.1007/s10872-008-0027-z
Ikeda T., Torres J. J., Hernández-León S., Geiger S. P. (2000). “Metabolism,” in ICES Zooplankton Methodology Manual. Eds. Harris R. P., Wiebe P. H., Lenz J., Skjoldal H. R., Huntley M. (Academic Press, San Diego, CA), 455–532. doi: 10.1016/B978-012327645-2/50011-6
Kimmerer W. J., Hirst A. G., Hopcroft R. R., McKinnon A. D. (2007). Estimating juvenile copepod growth rates: corrections, inter-comparisons and recommendations. Mar. Ecol. Prog. Ser. 336, 187–202. doi: 10.3354/meps336187
Kimmerer W. J., McKinnon A. D. (1987). Growth, mortality, and secondary production of the copepod Acartia tranteri in Westernport Bay, Australia. Limnol. Oceanogr. 32, 14–28. doi: 10.4319/lo.1987.32.1.0014
Kiørboe T. (1997). Population regulation and role of mesozooplankton in shaping marine pelagic food webs. Hydrobiologia 363, 13–27. doi: 10.1023/A:1003173721751
Kobari T., Ikeda T. (2001). Ontogenetic vertical migration and life cycle of Neocalanus plumchrus (Crustacea: Copepoda) in the Oyashio region, with notes on regional variations in body sizes. J. Plankton Res. 23, 287–302. doi: 10.1093/plankt/23.3.287
Kobari T., Sastri A. R., Yebra L., Liu H., Hopcroft R. R. (2019). Evaluation of trade-offs in traditional methodologies for measuring metazooplankton growth rates: Assumptions, advantages and disadvantages for field applications. Prog. Oceanogr. 178, 102137. doi: 10.1016/j.pocean.2019.102137
Kobari T., Shinada A., Tsuda A. (2003). Functional roles of interzonal migrating mesozooplankton in the western subarctic Pacific. Prog. Oceanogr. 57, 279–298. doi: 10.1016/S0079-6611(03)00102-2
Kobari T., Ueda A., Nishibe Y. (2010). Development and growth of ontogenetically migrating copepods during the spring phytoplankton bloom in the Oyashio region. Deep-Sea Res. II 57, 1715–1726. doi: 10.1016/j.dsr2.2010.03.015
Kuroda H., Azumaya T., Setou T., Hasegawa N. (2021). Unprecedented outbreak of harmful algae in Pacific coastal waters off southeast Hokkaido, Japan, during late summer 2021 after record-breaking marine heatwaves. J. Mar. Sci. Eng. 9, 1335. doi: 10.3390/jmse9121335
Kuroda H., Setou T. (2021). Extensive marine heatwaves at the sea surface in the northwestern Pacific Ocean in summer 2021. Remote Sens. 13, 3989. doi: 10.3390/rs13193989
Liu H., Hopcroft R. R. (2006a). Growth and development of Neocalanus flemingeri/plumchrus in the northern Gulf of Alaska: validation of the artificial cohort method in cold waters. J. Plankton Res. 28, 87–101. doi: 10.1093/plankt/fbi102
Liu H., Hopcroft R. R. (2006b). Growth and development of Metridia pacifica (Copepoda: Calanoida) in the northern Gulf of Alaska. J. Plankton Res. 28, 769–781. doi: 10.1093/plankt/fbl009
Liu H., Hopcroft R. R. (2008). Growth and development of Pseudocalanus spp. in the northern Gulf of Alaska. J. Plankton Res. 30, 923–935. doi: 10.1093/plankt/fbn046
Maud J. L., Hirst A. G., Atkinson A., Lindeque P. K., McEvoy A. J. (2018). Mortality of Calanus helgolandicus: Sources, differences between the sexes and consumptive and nonconsumptive processes. Limnol. Oceanogr. 63, 1741–1761. doi: 10.1002/lno.10805
Miller C. B., Frost B. W., Batchelder H. P., Clemons M. J., Conway R. E. (1984). Life histories of large, grazing copepods in a subarctic ocean gyre: Neocalanus plumchrus, Neocalanus cristatus, and Eucalanus bungii in the Northeast Pacific. Prog. Oceanogr. 13, 201–243. doi: 10.1016/0079-6611(84)90009-0
Nosaka Y., Isada T., Kudo I., Saito H., Hattori H., Tsuda A., et al. (2014). Light utilization efficiency of phytoplankton in the western subarctic gyre of the North Pacific during summer. J. Oceanogr. 70, 91–103. doi: 10.1007/s10872-013-0217-1
Padmavati G., Ikeda T. (2002). Development of Metridia pacifica (Crustacea: Copepoda) reared at different temperatures in the laboratory. Plankton Biol. Ecol. 49, 93–96. Available at: https://www.plankton.jp/PBE/issue/vol49_2/vol49_2_093.pdf.
Padmavati G., Ikeda T., Yamaguchi A. (2004). Life cycle, population structure and vertical distribution of Metridia spp. (Copepoda: Calanoida) in the Oyashio region (NW Pacific Ocean). Mar. Ecol. Prog. Ser. 270, 181–198. doi: 10.3354/meps270181
Peterson W. T., Gomez-Gutierrez J., Morgan C. A. (2002). Cross-shelf variation in calanoid copepod production during summer 1996 off the Oregon coast, USA. Mar. Biol. 141, 353–365. doi: 10.1007/s00227-002-0821-x
Sainmont J., Andersen K. H., Varpe Ø., Visser A. W. (2014). Capital versus income breeding in a seasonal environment. Am. Nat. 184, 466–476. doi: 10.1086/677926
Shoden S., Ikeda T., Yamaguchi A. (2005). Vertical distribution, population structure and lifecycle of Eucalanus bungii (Copepoda: Calanoida) in the Oyashio region, with notes on its regional variations. Mar. Biol. 146, 497–511. doi: 10.1007/s00227-004-1450-3
Smale D. A., Wernberg T., Oliver E. C. J., Thomsen M., Harvey B. P., Straub S. C., et al. (2019). Marine heatwaves threaten global biodiversity and the provision of ecosystem services. Nat. Clim. Change 9, 306–312. doi: 10.1038/s41558-019-0412-1
Suzuki R., Ishimaru T. (1990). An improved method for the determination of phytoplankton chlorophyll using N, N-dimethylformamide. J. Oceanogr. Soc Japan 46, 190–194. doi: 10.1007/BF02125580
Takahashi K., Ide K. (2011). Reproduction, grazing, and development of the large subarctic calanoid Eucalanus bungii: is the spring diatom bloom the key to controlling their recruitment? Hydrobiologia 666, 99–109. doi: 10.1007/s10750-010-0093-2
Tang K. W., Ivory J. A., Shimode S., Nishibe Y., Takahashi K. (2019). Dead heat: copepod carcass occurrence along the Japanese coasts and implications for a warming ocean. ICES J. Mar. Sci. 76, 1825–1835. doi: 10.1093/icesjms/fsz017
Ueda A., Kobari T., Steinberg D. K. (2008). Body length, weight and chemical composition of ontogenetically migrating copepods in the western subarctic gyre of the North Pacific Ocean. Bull. Plankton Soc Japan 55, 107–114. Available at: https://agriknowledge.affrc.go.jp/RN/2010786016.pdf.
Varpe Ø., Jørgensen C., Tarling G. A., Fiksen Ø. (2009). The adaptive value of energy storage and capital breeding in seasonal environments. Oikos 118, 363–370. doi: 10.1111/j.1600-0706.2008.17036.x
Vidal J., Smith S. L. (1986). Biomass, growth, and development of populations of herbivorous zooplankton in the southeastern Bering Sea during spring. Deep-Sea Res. 33A, 523–556. doi: 10.1016/0198-0149(86)90129-9
Yamaguchi A., Onishi Y., Omata A., Kawai M., Kaneda M., Ikeda T. (2010). Population structure, egg production and gut content pigment of large grazing copepods during the spring phytoplankton bloom in the Oyashio region. Deep-Sea Res. II 57, 1679–1690. doi: 10.1016/j.dsr2.2010.03.012
Keywords: artificial cohort method, marine heat wave, growth rate, Eucalanus bungii, Metridia pacifica, Neocalanus plumchrus
Citation: Teraoka T, Nagao S, Matsuno K and Yamaguchi A (2024) The modified artificial cohort method for three dominant pelagic copepods in the northern North Pacific revealed species-specific differences in the optimum temperature. Front. Mar. Sci. 11:1397721. doi: 10.3389/fmars.2024.1397721
Received: 08 March 2024; Accepted: 03 September 2024;
Published: 02 October 2024.
Edited by:
James J. Pierson, University of Maryland, College Park, United StatesReviewed by:
Helmut Maske, Center for Scientific Research and Higher Education in Ensenada (CICESE), MexicoMark D. Ohman, University of California, San Diego, United States
Copyright © 2024 Teraoka, Nagao, Matsuno and Yamaguchi. This is an open-access article distributed under the terms of the Creative Commons Attribution License (CC BY). The use, distribution or reproduction in other forums is permitted, provided the original author(s) and the copyright owner(s) are credited and that the original publication in this journal is cited, in accordance with accepted academic practice. No use, distribution or reproduction is permitted which does not comply with these terms.
*Correspondence: Atsushi Yamaguchi, YS15YW1hQGZpc2guaG9rdWRhaS5hYy5qcA==
 Takumi Teraoka1
 Kohei Matsuno
 Atsushi Yamaguchi