 Arpita Roy1,2
 Vikash Kumar2
 Kampan Bisai2
 Pratyasha Bhowal1
 Soumya Prasad Panda2
 Asim Kumar Jana2
 Rajat Banerjee1*
 Basanta Kumar Das2*
- 1Department of Biotechnology and Dr. B. C. Guha Centre for Genetic Engineering and Biotechnology, University of Calcutta, Kolkata, West Bengal, India
- 2Biotechnology Laboratory, Indian Council of Agricultural Research (ICAR)-Central Inland Fisheries Research Institute, Kolkata, West Bengal, India
Hilsa (Tenualosa ilisha), a highly prized edible fish, is consumed by over 250 million people worldwide. Estrogens are essential hormones required during reproduction and bind with estrogen receptors in target organs for biological activity. The two unique subtypes of the estrogen receptor found in fish are alpha (α) and beta (β) and exhibit distinctive roles in reproduction. The present study aimed to understand the breeding physiology of hilsa during the seasonal gonadal cycles through GSI seasonal variation, histological study, and molecular identification, characterization, and transcriptional modification of estrogen receptors in hilsa. Monthly GSI analysis from females showed that during September, the GSI value was maximum (22.01 ± 0.68), followed by the May GSI value (18.78 ± 0.97). Histological observation showed the formation of asynchronous gametes during the development of ovaries. The histological analysis revealed the formation of developing oocytes, nucleus, presence of primary oogonia, secondary oogonia, chromatin nucleolar oocytes, and early perinucleolar oocytes in the ovary (January–early July). Progressively, formations of the yolk vesicles, yolk granule stage, premature stage, and mature stage with post-ovulatory follicles were also identified. Linear observation was recorded during the monsoon season from July to November. Furthermore, partial length cDNAs for estrogen receptors were characterized, and their mRNA expression patterns demonstrate that ER-α expression significantly increased in September, followed by April and August in the ovary and liver tissue. Both the liver and ovary showed the highest mRNA expression of ER-β in September. The study revealed that ER-α expression was higher in the ovary as compared with liver tissue. Furthermore, we introduce three-dimensional (3D) models depicting the hilsa estrogen receptors in complex with estradiol (E2), constructed through homology modeling. This investigation contributes valuable insights into the molecular characteristics of estrogen receptors in this teleost fish. Our present work provided preliminary evidence of estrogen receptors during reproduction in hilsa.
1 Introduction
Hilsa (Tenualosa ilisha), a highly demandable preferred food rich in two types of omega-3-polyunsaturated fatty acids, e.g., docosahexaenoic acid and eicosatetraenoic acid, improves health and protects against several diseases, specifically heart disease (Mohanty et al., 2012). The hilsa is an anadromous species, mainly habituated to the lower region of the estuaries and the foreshore areas. This fish migrates twice a year from the Bay of Bengal to almost all rivers for breeding, one from early February to April and another from July to September (Jones and Menon, 1951). Hilsa exhibits a biannual phase of spawning, one during April–May and another in August–September (Pramanick et al., 2013). During the breeding season, they move upward to the rivers and, after spawning, return to the estuarine zone (Miah, 2015). The Ganga, Brahmaputra, and Hooghly rivers collectively contributed 70% of the nation’s total hilsa production before the completion of the Farakka Barrage (Hossain et al., 2019). However, the population of hilsa from the riverine ecosystems is declining drastically due to water pollution and improper net maintenance and fishing activities (Dutta et al., 2017). Moreover, their migration patterns are currently hampered by the construction of barrages and dams, putting their population at risk. Consequently, the market value of fish gradually rises due to a lack of supply (Islam and Hoq, 2018). Many attempts have been made to breed and culture the fish artificially. However, very little success has been achieved in rearing hilsa in confined waters. Therefore, several works have been carried out to characterize the genes responsible during breeding and maturation.
Estrogens, commonly known as 17-beta-estradiol (E2), perform crucial functions in the regulation of different biological processes like differentiation and development in vertebrates (Nilsson et al., 2001; Gustafsson, 2003; Hess, 2003; Heldring et al., 2007). They are formed by the action of aromatase, translating testosterone into estradiol and androstenedione to estrone (Korach, 1994). Estrogens have also been demonstrated to play a key role in reproduction by mediating processes involved in gonadotropin release, vitellogenesis, oogenesis, testicular development, ovarian differentiation, regrowth of spermatogonium, etc (Nakamura et al., 1998; Miura et al., 1999; Devlin and Nagahama, 2002; Guiguen et al., 2010; Lubzens et al., 2010; Chakraborty et al., 2011a, Chakraborty et al., 2003). Like other steroid hormones, E2 indirectly binds to an estrogen-responsive region (ERE) and regulates the target gene’s expression (Saville et al., 2000; Hall et al., 2001). Moreover, the intracellular or cell plasma membrane estrogen receptors (ERs) initiate the signaling pathway of estrogens (Levin, 2001; Edwards, 2005; Thomas et al., 2006; Nagler et al., 2010). Small-molecule receptors, e.g., steroids, thyroid hormones, rexinoids, and oxysterols, are found in ERs, which are a member of the nuclear receptor superfamily (Couse et al., 1997). The expression of ERs depends on stage, sex, and tissue (Patiño and Sullivan, 2002). In fish, E2 helps in the process of vitellogenesis in the liver and produces vitellogenin (Finn and Kristoffersen, 2007; Lubzens et al., 2010). Fish possess two unique subtypes of the ER: alpha (α) and beta (β). The extra isoform combinations of each subtype vary depending on the extent of genome duplication within the taxon (Nagler et al., 2012). Three distinct types of estrogen receptors have been reported in teleost fishes like Dicentrarchus labrax (Halm et al., 2004), Danio rerio (Menuet et al., 2002), Oryzias latipes (Chakraborty et al., 2011b), and Pimephales promelas (Filby and Tyler, 2005). However, four isoforms (i.e., erα1, erα2, erβ1, erβ2) were reported in the rainbow trout (Oncorhynchus mykiss) (Nagler et al., 2012). These receptors play a significant role in fish gonad maturation and reproduction, differentiation, and development (Kuiper et al., 1996; Mosselman et al., 1996; Todo et al., 1996; Tchoudakova et al., 1999; Xia et al., 1999; Socorro et al., 2000). Hence, investigation of the transcription profile of these receptors in different tissues at different season cycles would help in identifying the maturation stages and developing breeding interventions in fish.
Therefore, in the current study, the molecular characterization and expression of ERs both ER-α and β were investigated in female hilsa to understand the reproductive physiology during vitellogenin secretion in the liver and ovarian maturation. Additionally, the homology models for ER-α and β based on the sequencing data were developed and structure-based techniques like molecular docking were employed to understand their mechanistic properties. The models were validated and subjected to docking with estradiol (E2) within the binding pocket to elucidate its molecular interactions with the proteins.
2 Materials and methods
2.1 Experimental fish and tissue collection
Adult female hilsa (maturation phase, stages I–VII) was collected in live conditions from different seasons of ovary maturation from the river Ganga (Figure 1). The samples were collected from Godakhali (22°23′47.50″N & 88° 8′15.17″E), South 24 Parganas, the inlets of Hooghly River to the Bay of Bengal and from 40 to 50 km upstream of this river between Barrackpore (22°46′25.96″N and 88°19′59.09″E), Dist. North 24 Parganas, and Naihati (22°79′82.36″N, 88°35′71.92″E), Dist. North 24 Parganas, West Bengal, India. The fish were caught depending on the tidal periods, either in the morning or the afternoon. Every month from January to December, six female fish were collected in different developmental stages of the reproductive cycle. The body weights of the collected fish ranged from 500 g to 800 g. The collected samples were then maintained in disinfected plastic bags and transported right away to the laboratory in an ice pack condition. Each fish was weighed, and ovary and liver tissues were collected aseptically for experimental purposes.
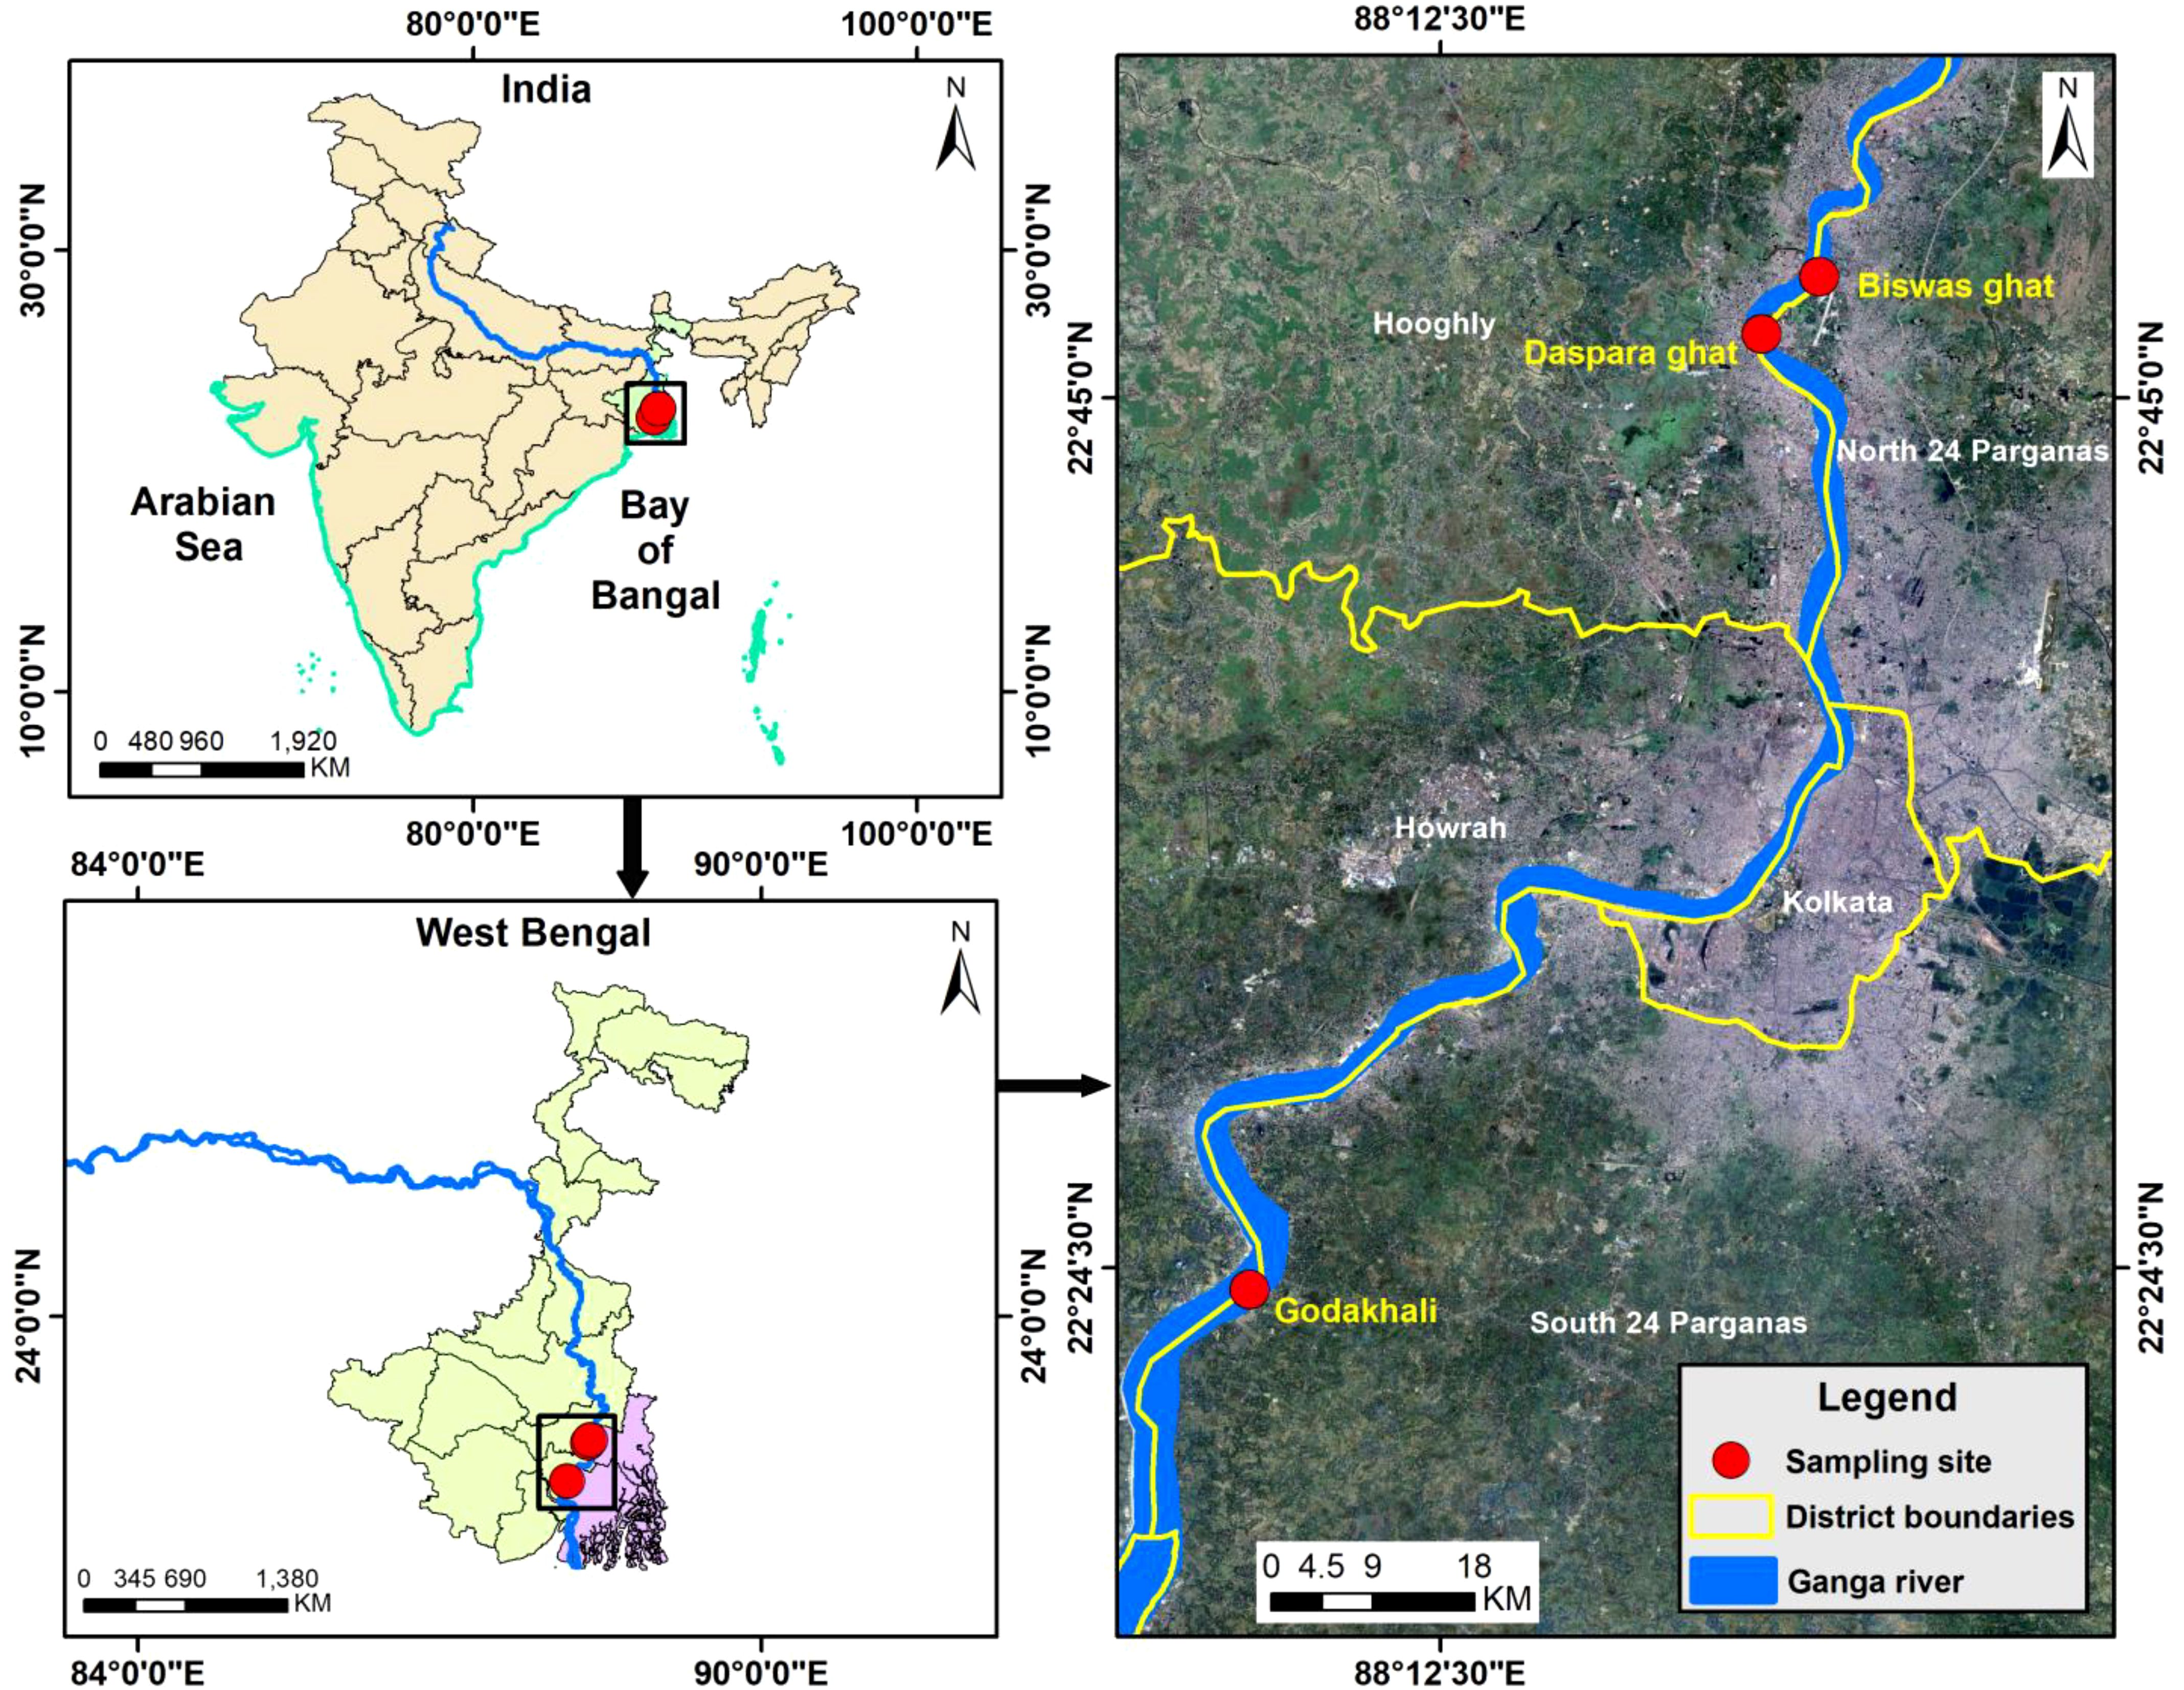
Figure 1 Map showing the location of sampling sites.
2.2 Gonadosomatic index study
During each sampling, the collected ovary of each fish was weighed again to determine the gonadosomatic index, and according to the following formula, the gonadosomatic index (GSI) of each fish was determined (Panter et al., 2004).
2.3 Histological analysis
From the fish samples, the ovaries were collected, cleaned, cut into 1-mm–2-mm size, and fixed into 10% neutral buffered formalin (NBF) for 24 h. Tissues were washed carefully and transferred into 70% alcohol. Using varying alcohol concentrations, tissues were dehydrated, after which xylene was used as a cleansing agent and fixed into paraffin. Using microtome (RM 2025, Leica Biosystems, Germany), hematoxylin and eosin were used to stain the paraffin-embedded tissue with a 5-µm thickness (Shihab et al., 2017) and viewed using a light microscope (Olympus CX-31, Japan) for histological changes, and microphotographs were taken.
The developmental stages of the gonad, oocyte size, presence of follicular layer, and number of nucleoli and cytoplasmic inclusions were detected and used to categorize the oogenesis process following the method developed by Akhter et al. (2022).
2.4 RNA extraction and cDNA synthesis
Approximately 100 mg of liver and ovary samples from each of six female fish per month was used to extract total tissue RNA by the TRIzol method (Sigma, USA) following the manufacturer’s instructions. Each sample RNA concentration was determined using a nano-drop (Eppendorf, BioSpectrometer, Hamburg), and quality was checked in 1% agarose gel. To remove genomic DNA, the extracted RNA was treated with DNAse I reagent (TURBO DNA free Kit; Thermo) followed by cDNA synthesis using a cDNA synthesis kit (Thermo Scientific, USA) per manufacturer’s instructions. Before usage, the first-strand cDNA was kept at 20°C.
2.5 Semiquantitative PCR
Using primers specific to the 18S rRNA gene, hilsa was amplified by PCR in the Thermal Cycler GeneAmp™ PCR System 9700 (Applied Biosystems, Foster City, US). The primer used to amplify the 18S rRNA gene was 5′-TGGTTAATTCCGATAACGAACGA-3′ as a forward primer and 5′-CGCCACTTGTCCCTCTAAGAA-3′ as a reverse primer (Sampath Kumar et al., 2000) (Supplementary Figure S1). The levels of 18S rRNA are more uniform than other common internal standards, such as β-actin (Degani et al., 2003). The PCR amplification of the ER-α and β genes was performed using gene-specific primers (Table 1). PCR was carried out by the protocol provided by (Sigma, USA) using 2 μl of total isolated cDNA in the liver and ovary. A 50-μl reaction mixture was performed under thermal conditions by following the initial denaturation at 95°C (2 min), 94°C (0.30 min), annealing temperature depending on specific primers (1.30 min), and then extension at 72°C (0.45 min) and final extension (3.00 min) followed by 35 cycles and was seen in 1.8% agarose gel containing ethidium bromide (EtBr) (Supplementary Figure S2).
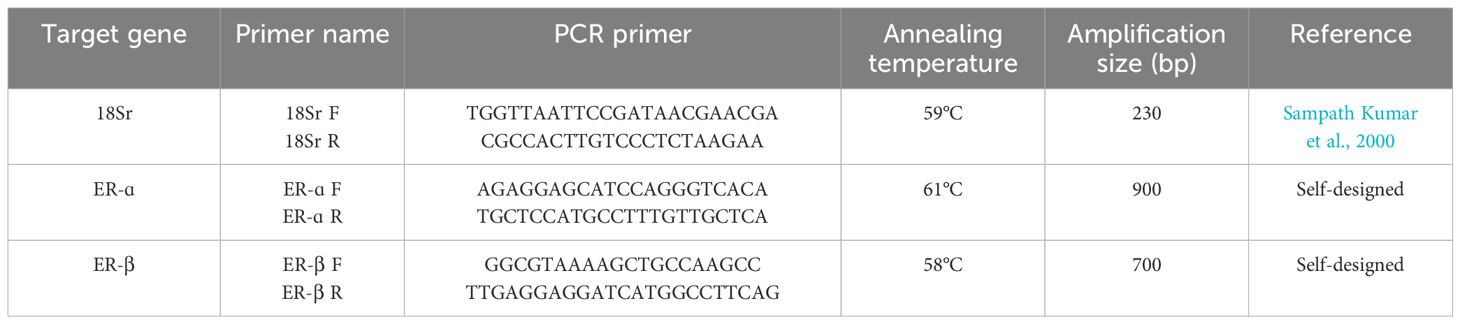
Table 1 List of primers used in this study for PCR.
2.6 Phylogenetic analysis
Using an ABI 3730xl capillary sequencer, the amplified PCR products from both liver and ovary tissue were sequenced in both directions (Applied Biosystems, Foster City, CA) and aligned using the software BioEdit version 7.0.0. Using the NCBI-BLAST program capability, the constructed contig sequences of the ERs were then compared with sequences present in GenBank [http://www.ncbi.nlm.nih.gov\BLAST] (Behera et al., 2015).
The ER-ɑ and β gene sequences were aligned with other ER-ɑ and β genes of different-family fish species from NCBI GenBank using ClustalW in MEGA 7 (Kumar et al., 2016). The phylogenetic tree was constructed using the neighbor-joining method, and the evolutionary history was inferred from it (Saitou and Nei, 1987) with 1,000 bootstrap replicates.
2.7 Real-time quantitative PCR for hepatic and ovarian expression of ER subtypes
Changes in ER gene expression during gonad maturation in hilsa were quantified by using SYBR Green Master Mix to perform quantitative PCR (qPCR) in the LightCycler 480. (Roche, Germany). 18S rRNA was used as a control. qPCR primers of ER-α and β were designed based on the submitted sequences (Table 2). qPCR analysis of tissues was done in triplicates, and the standard curves were generated. Briefly, 20 μl of the total reaction mixture has 2 μl of cDNA as template, 1 μl of each forward primer and reverse primer (5 pmol/μl), 10 μl of 2× LightCycler SYBR Green I Mix, and 6 μl of nuclease-free water provided in the kit. The real-time PCR (qPCR) program involved a pre-incubation at 95°C followed by 35 cycles of amplification at 95°C (10 s), annealing temperature for particular genes for 10 s, and 72°C (10 s). The specificity of qPCR was confirmed by melt curve analysis temperatures of 95°C (5 s), 65°C (1 min), and 97°C (1 min). The samples were cooled down at 40°C (10 s). The results were reported as the fold change in expression relative to the 18Sr RNA gene by using the 2−ΔΔCT method (Livak and Schmittgen, 2001).
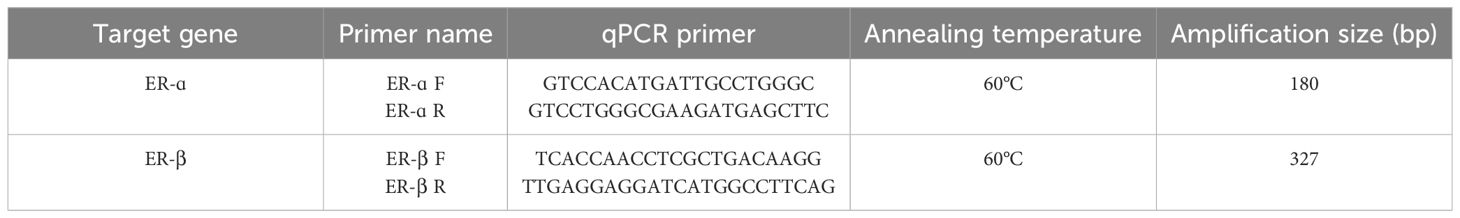
Table 2 List of primers used in this study for qPCR.
2.8 3D-structure prediction and molecular docking studies
The protein sequences of ER-α and β from Tenualosa ilisha were further analyzed for the secondary structure analysis, tertiary structure prediction, and molecular docking and protein–protein interaction studies.
2.8.1 Protein structure generation and validation
The structures of ER α and β were predicted using the SWISS-MODEL online server (http://swiss-model.expasy.org/) (Arnold et al., 2006) by the application of the homology modeling approach to ascertain the best protein templates and the optimal models were used for subsequent investigations. The validation of the predicted structures is considered to be the paramount element in structure predictions. The Ramachandran plot, the most optimal model, was chosen among various predicted structures for ER-α and β, based on PROCHECK (Laskowski et al., 1993), which was generated by submitting comparative protein models to the PDBsum website (Laskowski et al., 2018) (http://www.ebi.ac.uk/thornton-srv/databases/pdbsum/). The protein models were then assessed using the ProSA server (Wiederstein and Sippl, 2007) and subsequently subjected to validation through the SAVES server (https://servicesn.mbi.ucla.edu/SAVES/). This validation process involved confirming the accuracy of the predicted protein models by considering their 3D structures with the ERRAT values (Colovos and Yeates, 1993).
2.8.2 Secondary structure analysis
The secondary structure analysis of the two predicted models involved the determination of the number of α-helices, β-turns, extended strands, β-sheets, and coils. This study was conducted using the PDBsum tool (Laskowski et al., 2018) to obtain the secondary motif map and topology diagrams.
2.8.3 Molecular docking, binding affinity, and interaction analysis
The docking simulation between the ER-α and β with estradiol (E2) was conducted using AutoDock Vina (Trott and Olson, 2010) on the PyRx platform (GUI version 0.8). The protein structure and ligand conversion from PDB to PDBQT format was performed using Open Babel before docking. AutoDock Vina software, a docking grid box with three-dimensional dimensions, was set to the maximum with the number of dockings runs 8. Eventually, the software yielded a binding energy table as the outcome. The conformations exhibiting the lowest binding energy or docking score were selected for subsequent studies.
The outcome was analyzed using LigPlot+ (Laskowski and Swindells, 2011) software. The input provided to the servers consists of a file formatted in PDB (Protein Data Bank) format. Hydrogen bonds, van der Waals contacts, and covalent bonds are used to identify interacting protein residues.
2.9 Statistical analysis
All data are presented as mean ± SE (standard error of the mean). The expressions of ER-ɑ and β genes were subjected to one-way ANOVA followed by Tukey’s multiple comparison tests to identify significant expressional differences every month. The level of significance was set at (p < 0.05). The statistical tests were performed in the SPSS statistical software (version 25).
3 Results
3.1 GSI and histological study
The number of oocytes in hilsa gradually increases throughout the breeding season. The post-winter breeding season starts in January, with the development of the ovary starts followed by February. This month, ovaries were thread or ribbon-like structures that took one-fourth of the body cavity (GSI: 9.25 ± 0.36) and reached the pre-vitellogenic stage. In March, the vitellogenesis stage starts and the ovary gradually enlarges due to the accumulation of yolk (GSI: 12.06 ± 0.76). At the post-vitellogenic stage during April, ovaries became very large and occupied more than half of the body cavity (GSI: 15.86 ± 0.48). During May, ovaries became fully mature, ripened, and ready to spawn with the tidal flow of water (GSI: 18.78 ± 0.97). During May, a small quantity of spawning also occurred. In June, the ovaries were empty in this post-spawning stage, containing some immature oocytes (GSI: 7.6 ± 0.42). Again, the monsoon breeding season starts from July to November. During July, again, the biannual spawning was in progress and the gonad development started with an immature ovary, small reddish and transparent in nature (GSI: 9.11 ± 0.27). In August, the ovaries occupied half of the body cavity and the ova became opaque (GSI: 14.2 ± 0.59). In September, ovaries occupy the whole length of the body cavity. Ova become granular and yellow in color (GSI: 22.01 ± 0.68) and the ovaries become fully mature and prepared for spawning. Partly spent, i.e., spawning, was in progress during October (GSI: 12.07 ± 0.53) and November (GSI: 8.6 ± 0.23) (Figure 2).
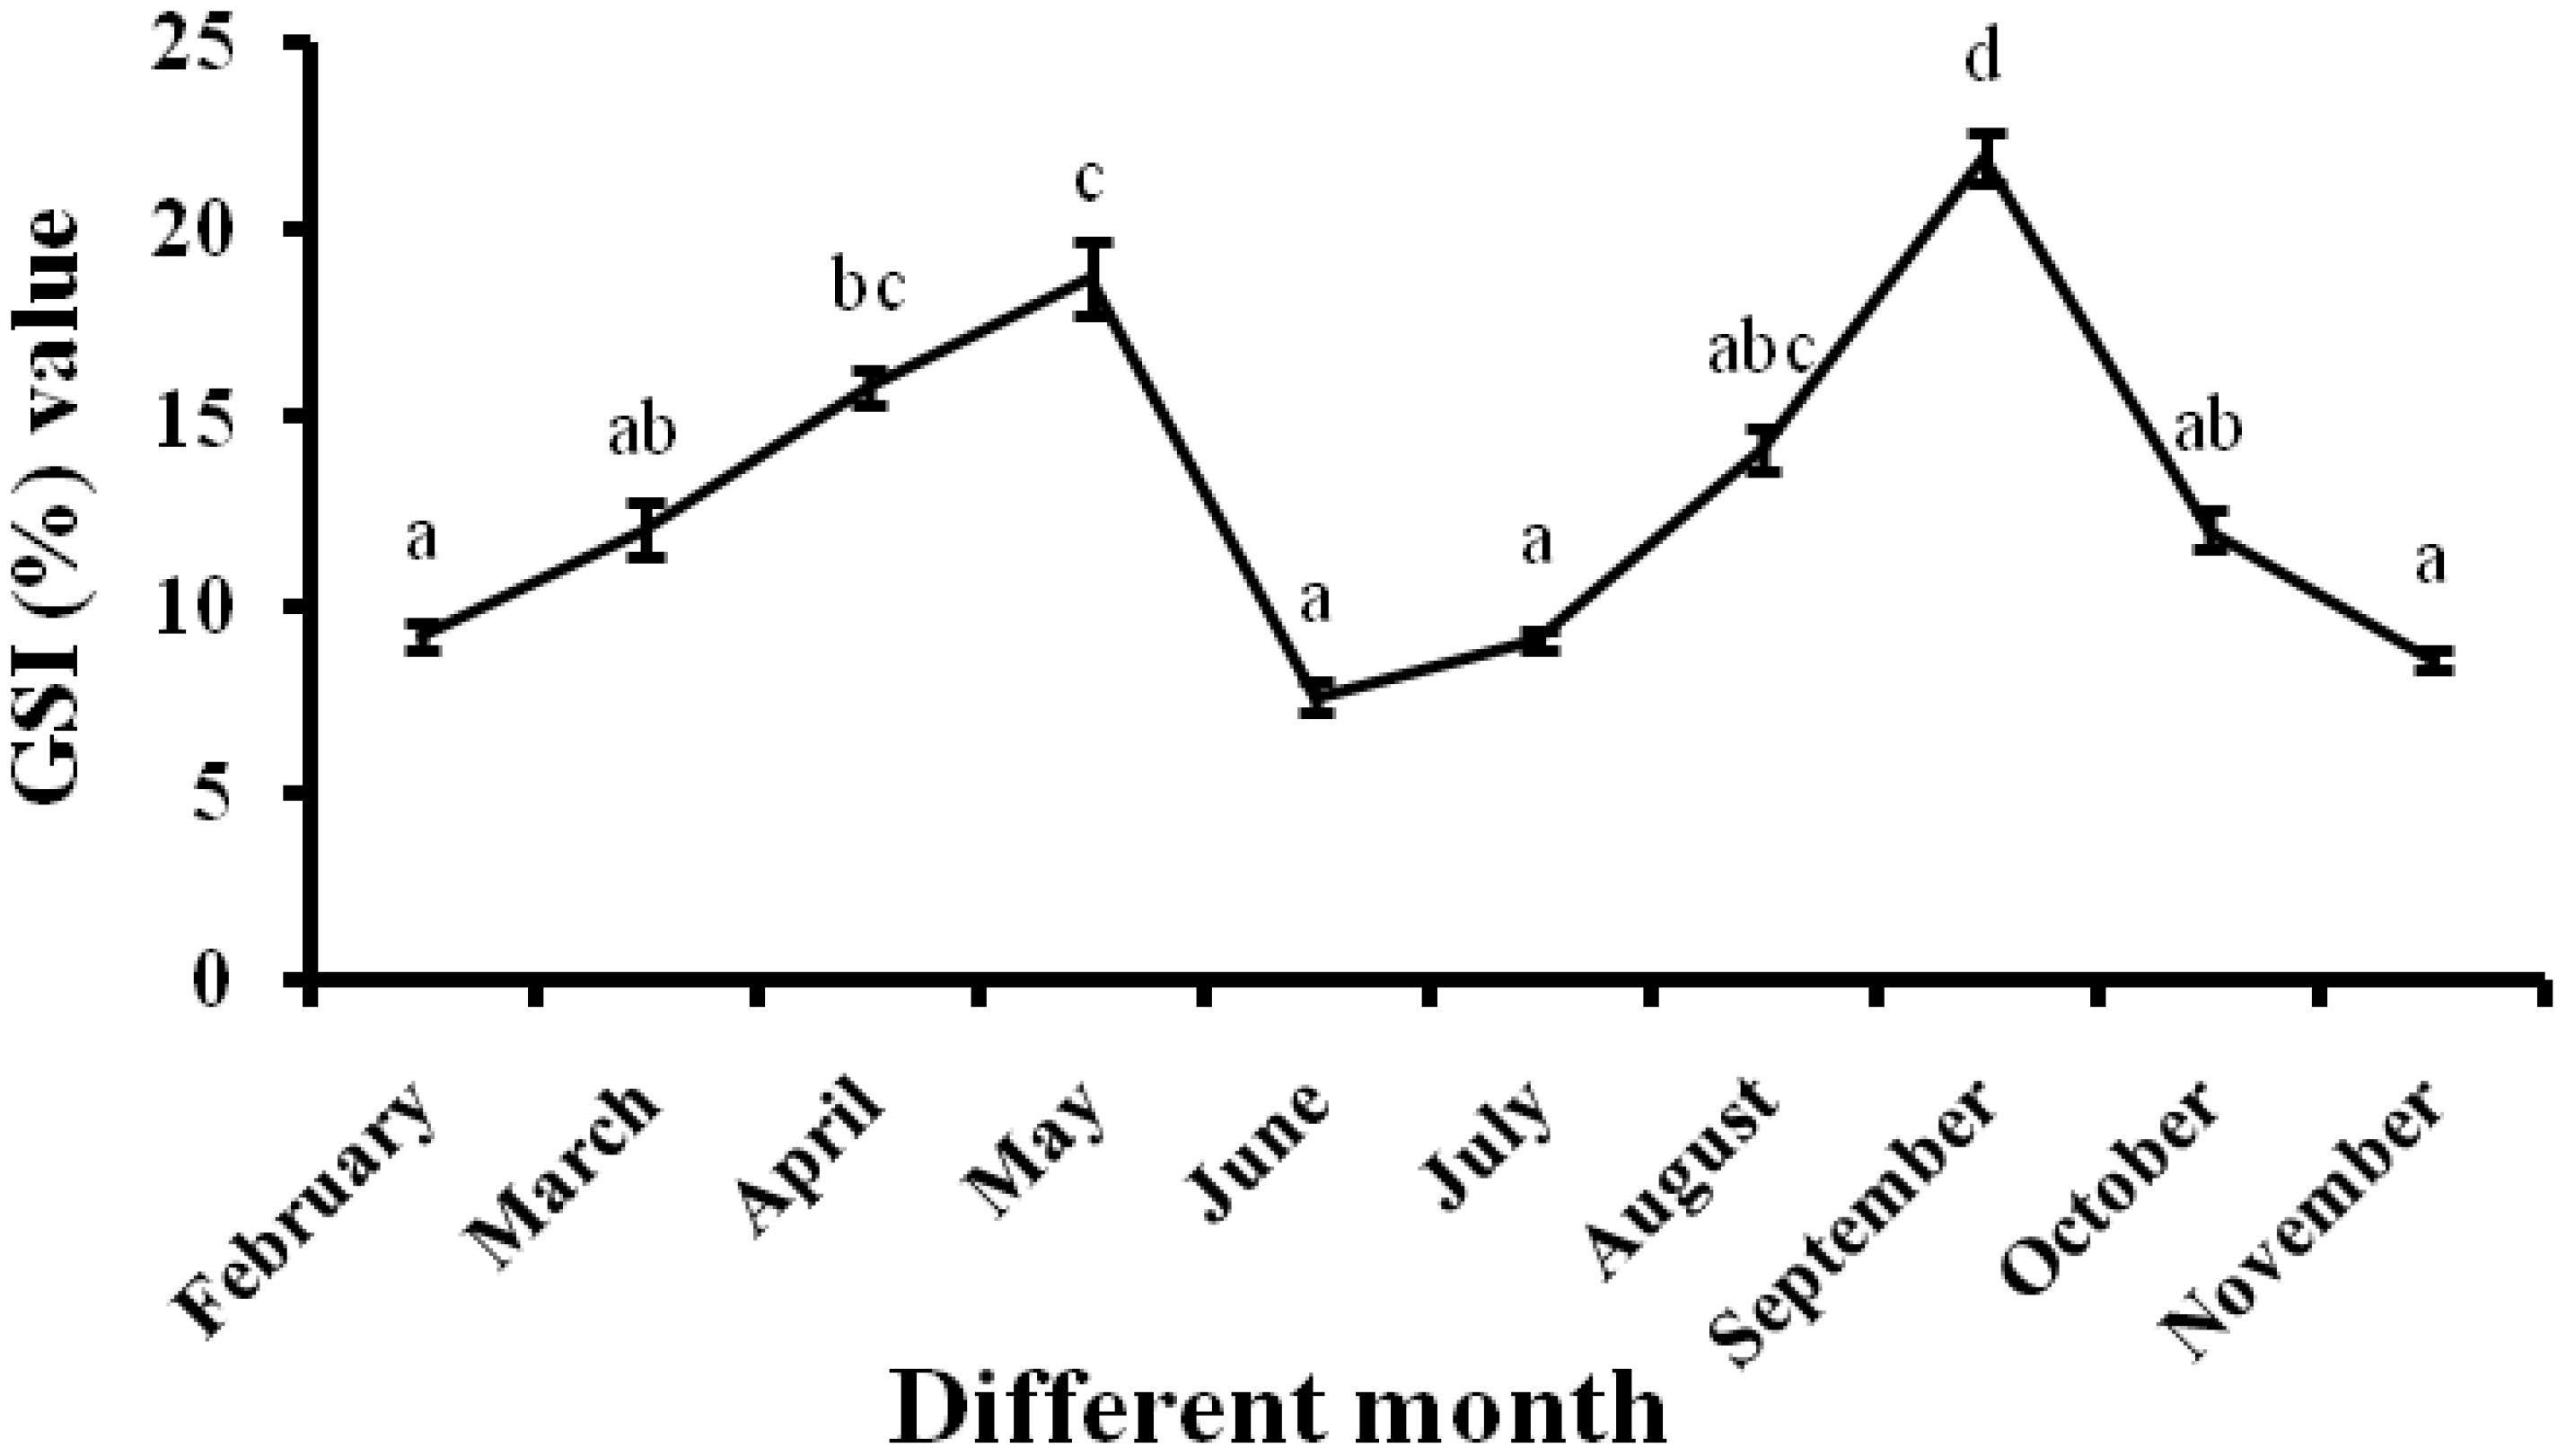
Figure 2 GSI % of female fishes in different months. All data are presented as mean ± SE (n = 6), and at the 0.05 level, different superscripts differ significantly.
In the first stage of ovary development during January and early February, which contained a large number of developing follicles, oocytes were spherical, oval, and multi-faceted, large nucleus occupied most of the cell, and presence of primary oogonia (PO), secondary oogonia (SO), chromatin nucleolar oocytes (CNO), and preperinucleolar oocytes (PPO) were observed (Figure 3A). In February, the number of oocytes increased in the peri-nucleolus stage. Primary oogonia and secondary oogonia were present in each developing oocyte; oocytes became ova, and follicular cells were arranged in a single layer identified encircling each oocyte (Figure 3B). The earliest and most polygonal-shaped perinuclear oocytes were present during March. In contrast, late perinuclear oocytes changed in shape from polygonal to oval as oocyte development progressed and increased in size and at the oocyte’s edge, the yolk granules were initially observed (Figure 3C). During April, a yolk vesicle was observed in the premature oocyte (Figure 3D). In May, small alveoli were formed around the nucleus and increased in size during the end of the cortical alveoli stage, and the yolk vesicles were gradually moved in the direction of the nucleus (Figure 3E). In June, oocytes were in the mature stage and bright pink-stained yolk vesicle in the outer cortex slowly grew more prominent and doubled in quantity (Figure 3F). From June to July, the oocytes were greatly expanded and there was a breakdown of the eccentric germinal disk (Figure 3G); oocytes were detected with post-ovulatory follicles demonstrating post-ovulatory alterations in the ovary (Figure 3H). These identical changes are also observed in different months from July to December.
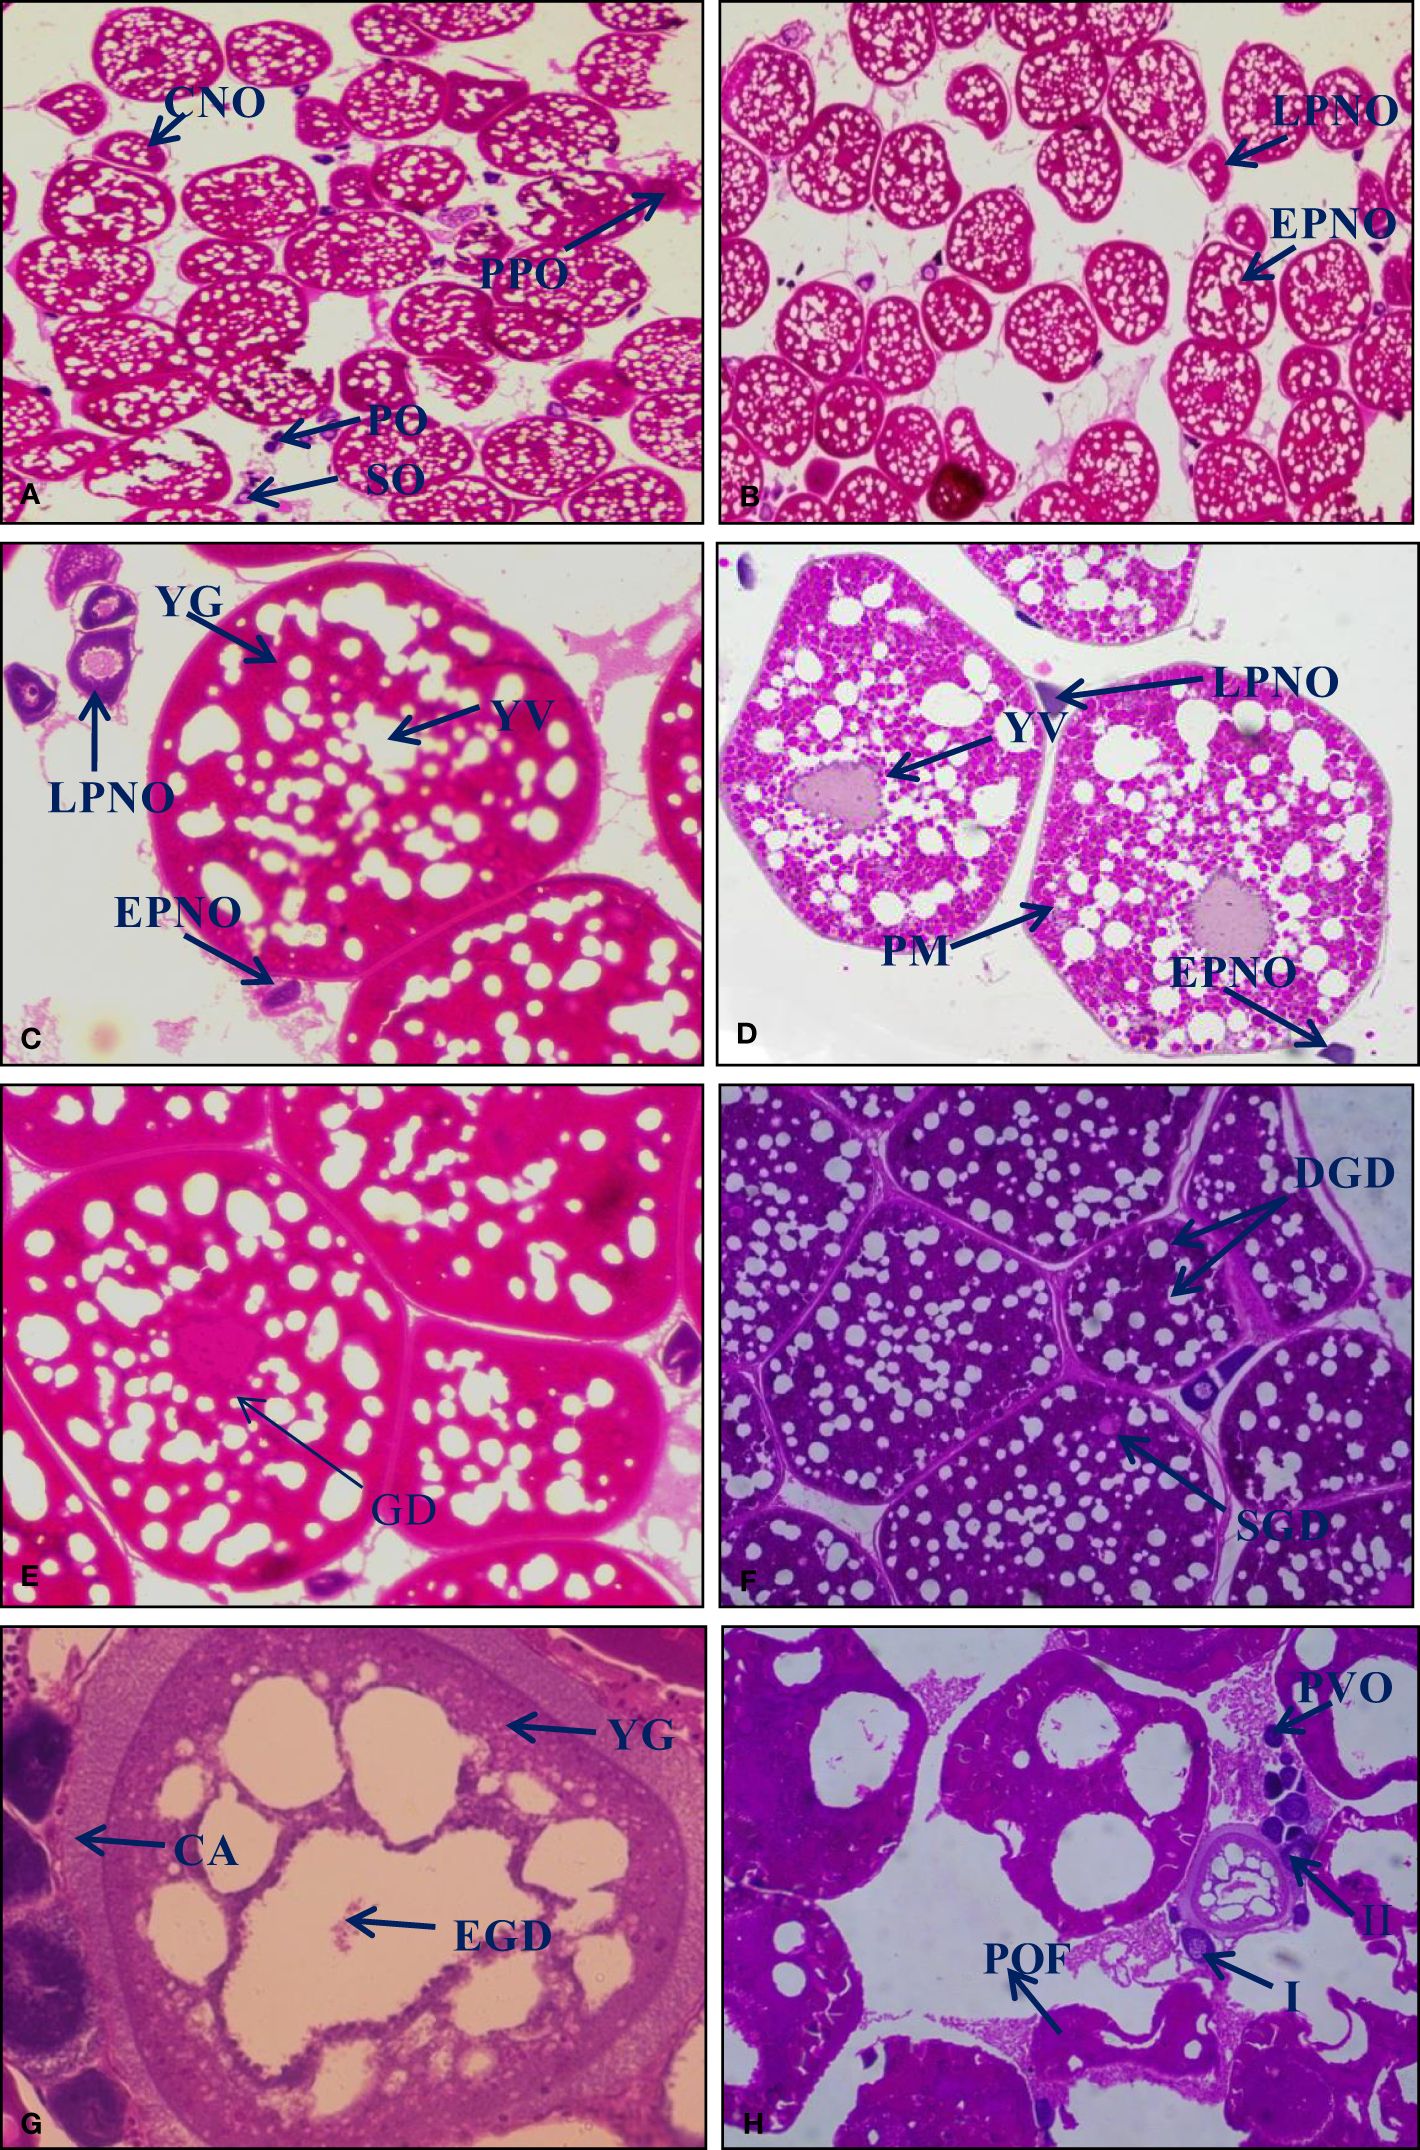
Figure 3 H&E-stained histological section (10×) of ovary. The different stages of oocytes were identified following the method developed by Akhter et al. (2022). [(A) January; (B) February; (C) March; (D) April.] Primary oogonia (PO), secondary oogonia (SO) and chromatin nucleolar oocytes (CNO), preperinucleolar oocytes (PPO), early perinuclear oocytes (EPNO), late perinuclear oocytes (LPNO), yolk granules (YG), yolk vesicle (YV) in the oocyte, premature oocyte (PM). [(E) May; (F) June; (G, H) June to July.] Germinal disk (GD), single germinal disk (SGD), double germinal disk (DGD), yolk globules (YG), cortical alveoli (CA), breakdown of eccentric germinal disk (EGD), post-ovulatory changes, post-ovulatory follicles (POF), atretic oocytes (types I and II), and a cohort of previtellogenic oocytes (PVO).
3.2 Molecular identification and phylogenetic analysis
The partial mRNA sequence of the ER-α gene consisted of 900 bp (Accession No. MT748787) at the nucleotide level and showed 82.46% identity with Alosa sapidissima (XM042094934), 82.15% with Clupea harengus (XM042707299), and 79.20% with Oncorhynchus mykiss (XM021598369), whereas the partial mRNA sequence of the ER-β gene consisted of 700 bp (Accession No. OR455448), at the nucleotide level, confirming 82.33% similarity with Clupea harengus (XM031581405), belonging to the same family of Clupeidae. However, hilsa remains in a cluster with species like E. electricus (XM035524318), A. limnaeus (XM014015399), N. brichardi (XM006792714), and O. bonariensis (EU284022). Phylogenetic analysis based on the nucleotide sequences of the ER-α and β demonstrates the close relatedness of hilsa ERs with those of another teleost, shown in (Figures 4A, B).
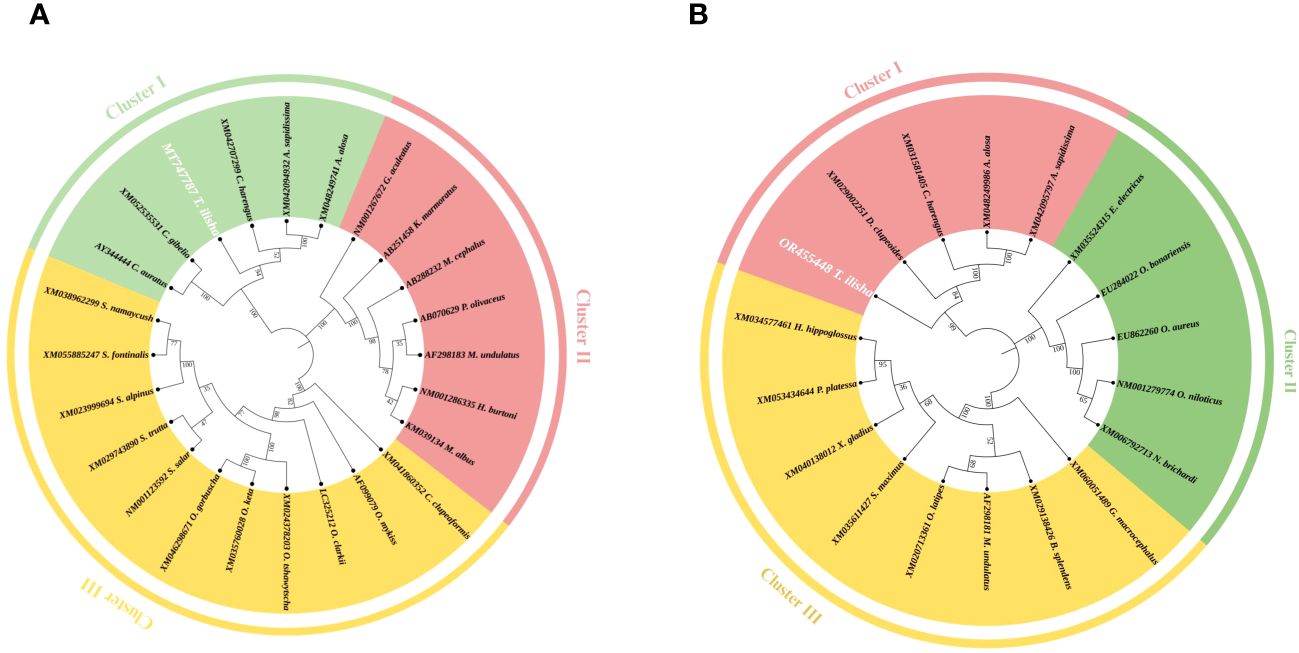
Figure 4 (A) Phylogenetic relationship of deduced nucleotide sequences of hilsa. Phylogenetic analysis of ER-α nucleotide sequences of hilsa with other different fishes. MEGA-X used the neighbor-joining method to create a tree. The numbers next to the branches represent the percentage values for 1,000 bootstrap replicates. (B) Phylogenetic relationship of deduced nucleotide sequences of hilsa. Phylogenetic analysis of ER-β nucleotide sequences of hilsa with other different fishes. The MEGA-X program used the neighbor-joining method to create a tree. The numbers next to the branches represent the percentage values for 1,000 bootstrap replicates.
3.3 Tissue-specific expression by qPCR
The qPCR primers checked by normal PCR and ER-α and β were visualized at 180 bp and 327 bp, respectively (Supplementary Figure S3), which varied throughout various months in the liver and ovary, observed in agarose gel (Supplementary Figures S4A, S4B, S5A, S5B), and then qPCR was carried out with diluted cDNA for ER target genes. The standard deviation method for each relative gene expression value was calculated statistically. Significant upregulation of the ER-α gene has been observed monthly in both tissues. During post-ovulation, the secretion of ER-α decreases at the end of winter breeding and again increases with the initial of monsoon breeding (Figure 5A). In both tissues, ER-β was found to be upregulated at the beginning of gonad maturation during February. However, the expression of the ER-β gene had stabilized during April, May (winter breeding), and September and October (Monsoon breeding), and with the increase in ER-β secretion, its expression was markedly upregulated. In the ovary, the expression has significantly increased at various stages of maturity (Figure 5B). The data were expressed as the fold change in expression with respect to the 18S rRNA gene, using the 2−ΔΔCT method.
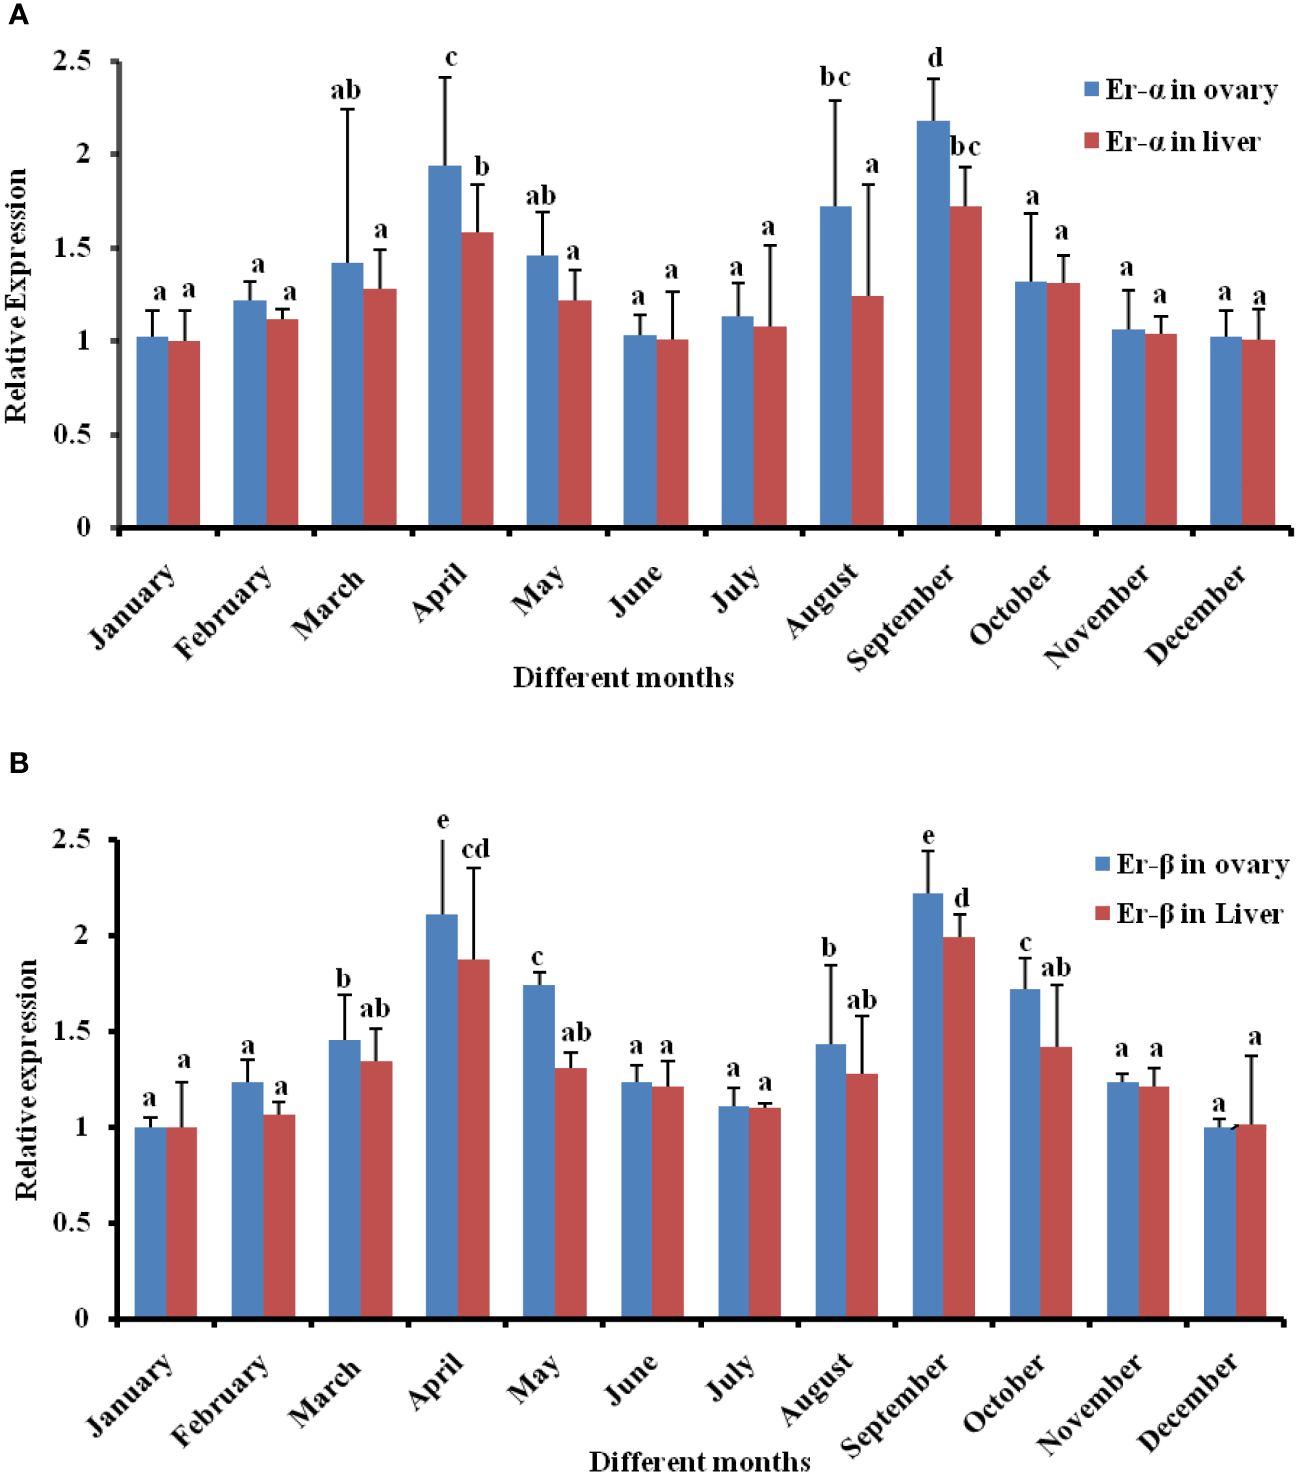
Figure 5 Expressional profiles of the ovary and liver obtained. (A) Expression of Er-α in different months of hilsa using qPCR for three times. The results are represented as the ratio of ER-α mRNA/18S rRNA and analyzed in triplicate. Relative abundance is used to express the data, displayed as the mean ± S.E. The letters above the bars denote groups that are statistically different from one another, at least at p < 0.05. FIGURE 5 Expressional profiles of ovary and liver obtained. (B) Expression of ER-β of female hilsa during the breeding season by qPCR for three times. The results are represented as the ratio of ER-α mRNA/18S rRNA and analyzed in triplicate. Relative abundance is used to express the data, displayed as the mean ± S.E. The letters above the bars denote groups that are statistically different from one another, at least at p < 0.05.
3.4 In silico studies of ER-α and β
3.4.1 Protein structure generation and validation
The application of protein modeling plays a crucial function in the examination of the relationship between the ER-α and β. The three-dimensional structures of the proteins (Figure 6AI, II) were produced and analyzed in the Ramachandran plot. The optimal model selection was based on the highest percentages of residues observed in the most favored regions and the lowest percentage scores in the outlier region. The analysis showed that ER-α exhibits a distribution of residues within different regions, with 86.7% of residues falling into the favored zone, 11.8% within the allowed region, 1.1% within the generously allowed region, and 0.4% in the disallowed region (Figure 6B I). Regarding ER-β, the results of the plot analysis demonstrated that 83.9% of the residues were located inside the favored zone whereas 13.2% of the residues were situated within the allowed region. Additionally, a minor proportion of 0.6% of the residues was found in the generously allowed region with 2.3% in the disallowed region (Figure 6B II). The results of the Z-score from ProSA and the ERRAT score of the projected models for each structure are listed in Table 3.
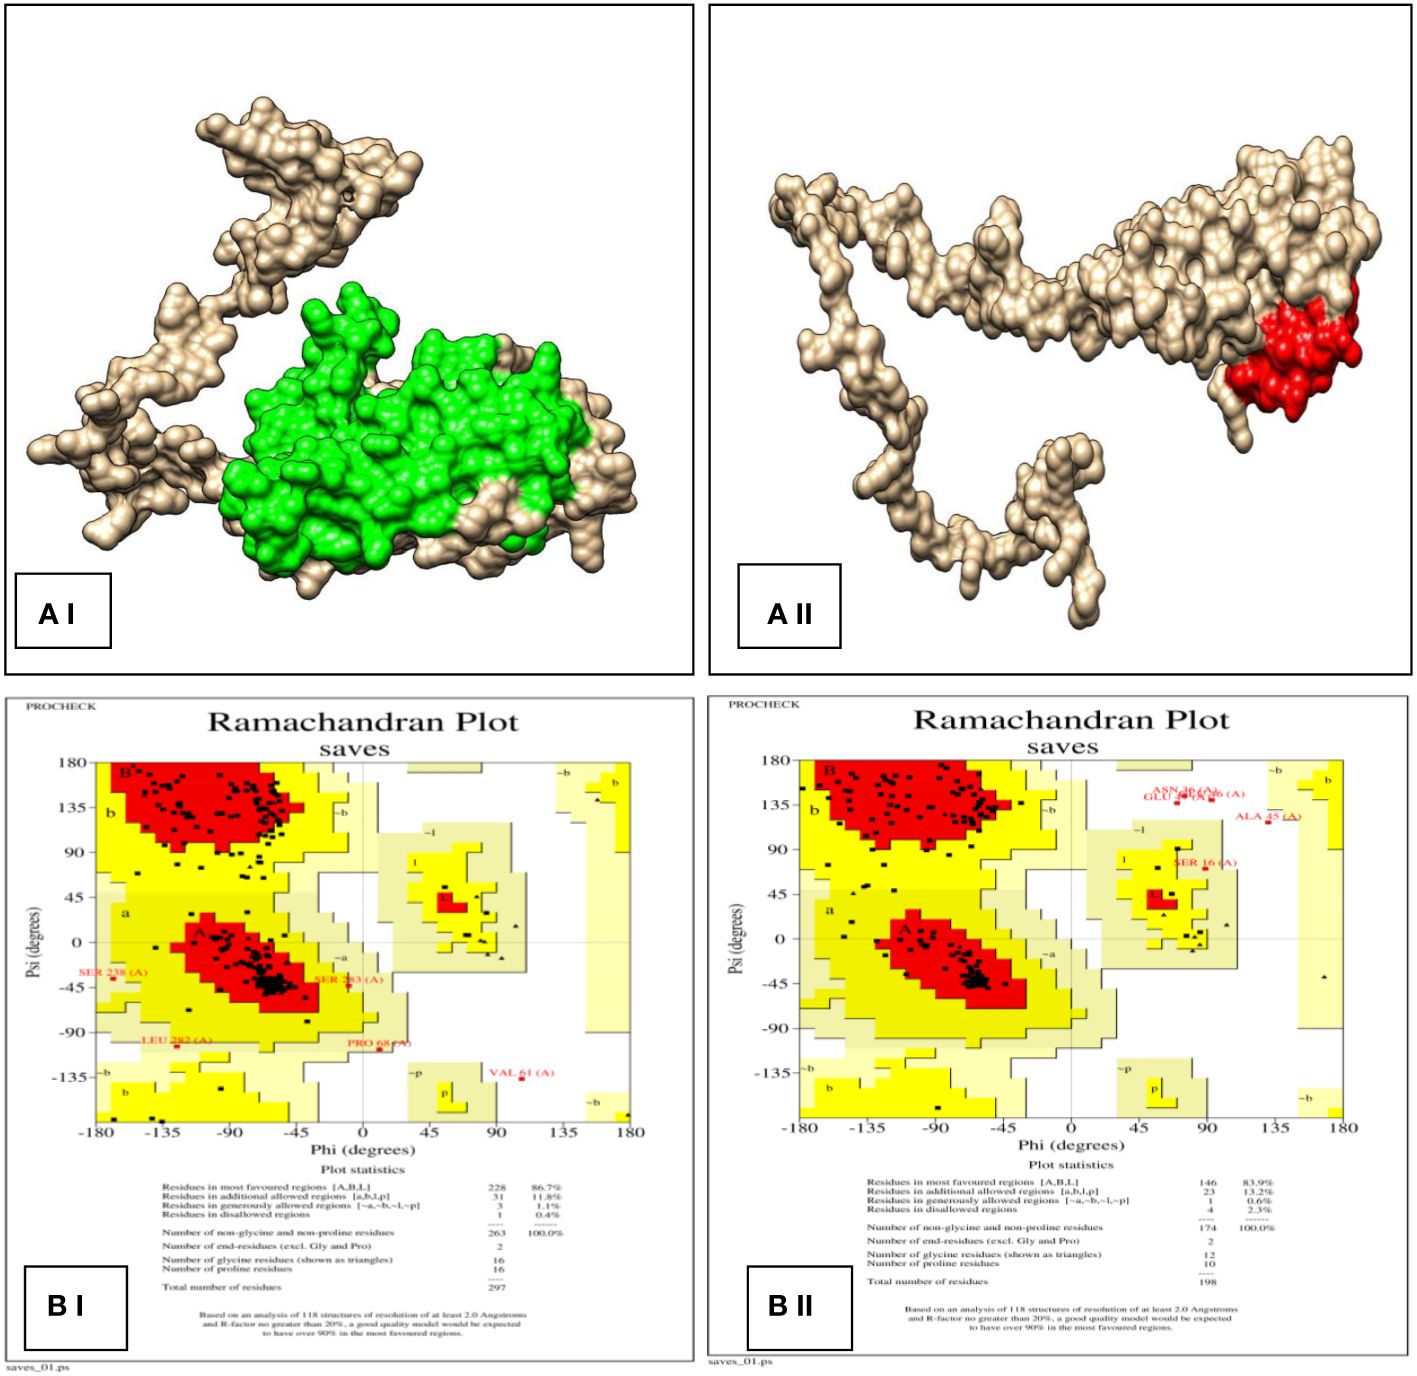
Figure 6 (AI) and (AII) The predicted 3D model of ER-α (green) and ER-β (red) by using SWISS MODEL homology modeling; (BI) and (BII) 3D structure validation using Ramachandran plot analysis.
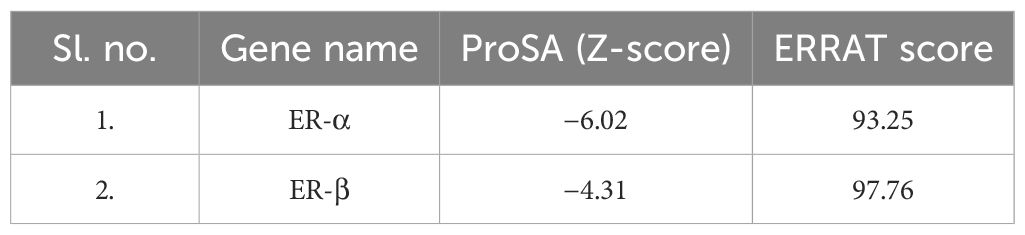
Table 3 Properties of the predicted models.
3.4.2 Secondary structure analysis
In this secondary structural study, predicted structures of ER-α and β as obtained from the SWISS MODEL server were used as a template. The PDBsum program created the secondary structures, as shown in Figures 7A, B. The secondary structure of ER-α, Figure 7A (purple) consists of 12 helices, denoted as H1 to H11, with 17 helix–helix interactions and 2 beta-sheet motifs, whereas in the case of ER-β, Figure 7B (red), there were 6 alpha helices involved in 6 helix–helix interactions and 1 beta-sheet.
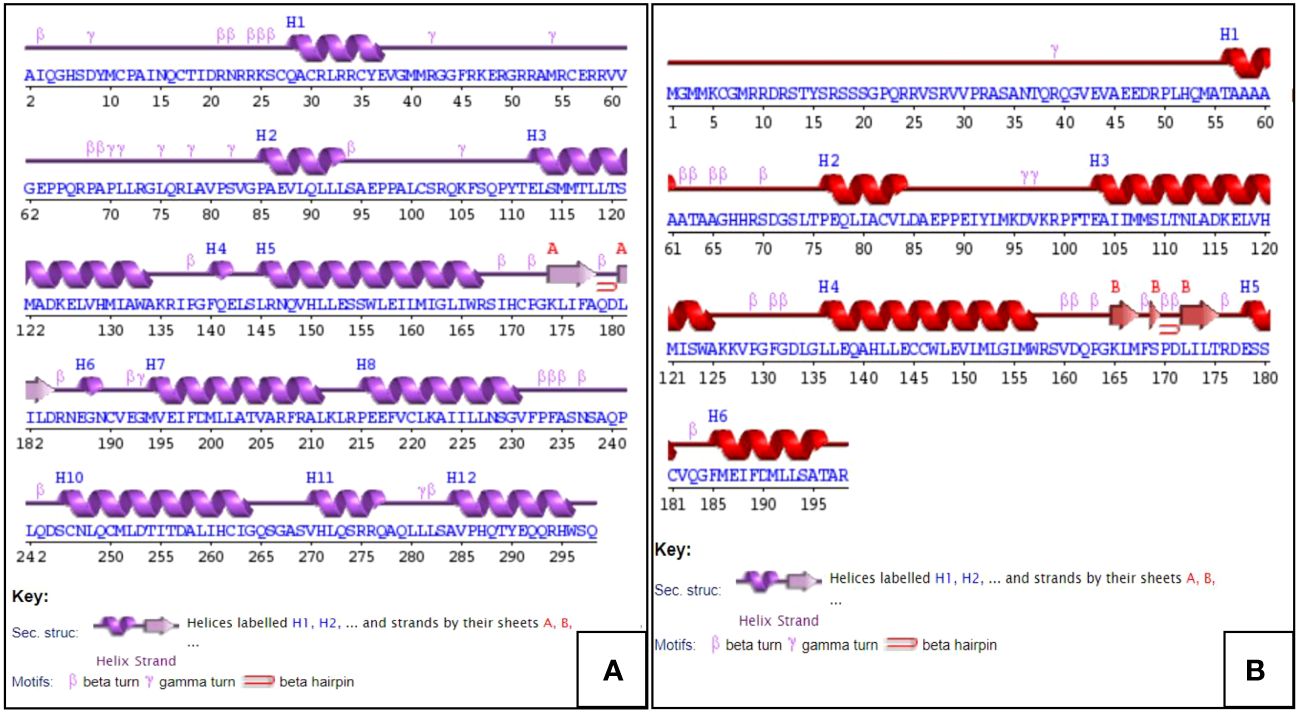
Figure 7 Schematic diagrams are showing the secondary structural elements. (A) Secondary structure of ER-α (purple) and (B) secondary structure of ER-β (red), as calculated using the PDBsum tool. α-Helices are labeled with the letter “H”, and β-strands are lettered in uppercase alphabets.
3.4.3 Molecular docking, binding affinity, and interaction analysis
The two ERs (ER-α and β) were docked with estradiol (E2) by using AutoDock Vina to predict the best possible binding pose of the ligand and the receptors for better analysis (Figures 8A, B). In the case of ER-α, when docked with E2, it gave a binding energy of −6.6 kcal/mol, whereas E2, when complexed with ER-β, gave a binding energy of −8.5 kcal/mol. The E2 binding affinity with ER-β is 28% increase in the binding with ER-α. Hence, we further conducted interaction analysis of the receptors and E2 and visualized using the LigPlot+ software to understand the polar and non-polar contacts (Figures 8C, D). Interaction analysis showed that the number of polar bonds with E2 is the same in case of both the receptors, but the number of non-polar bonds is higher in case of E2 in complex with ER-β.
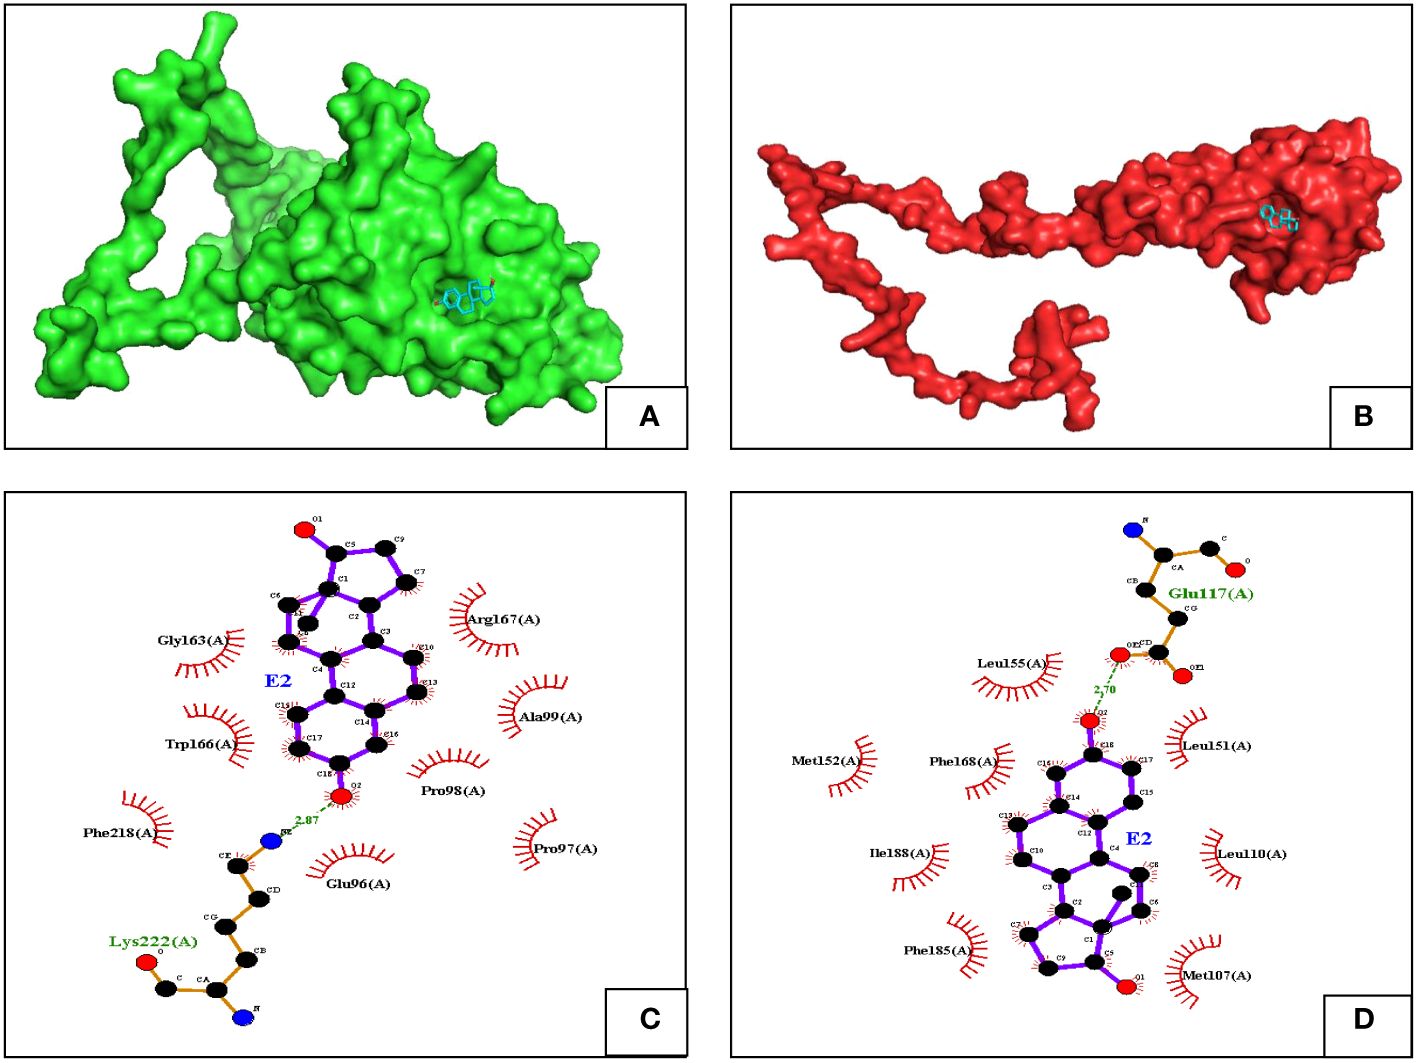
Figure 8 Docked poses of (A) ER-α with estradiol, ER-α is in green cartoon. (B) ER-β with estradiol, with ER-β in red cartoon. The ligand structure is represented in blue stick format. Binding interactions of ER-α (C) and ER-β (D) with estradiol (E2).
4 Discussion
In this study, for the first time, we have assessed the estrogen receptors in a seasonally spawning female fish during the full reproductive cycle, as demonstrated by the expression of estrogen receptor mRNAs in the liver and ovary of female hilsa. Environmental factors play a vital role during gonadal development that occurs until final breeding (Ahammad et al., 2021). We observed seasonal variation in the GSI value, demonstrated by histological changes of maturation in ovaries. The differences in seasonality of spawning in different areas may be due to a range of genetic and environmental factors. In a seasonal cycle, ovaries became fully mature, with GSI: 18.78 ± 0.97 during May, whereas in September (monsoon season), ovaries occupy the whole length of the body cavity with the highest GSI: 22.01 ± 0.68. In parallel, a study found that hilsa from Hooghly had a higher gonadosomatic index (GSI) from March to September, with a peak in October (15.8470) (Bhaumik and Sharma, 2011). These results are consistent with the findings in other places (Jones and Menon, 1951; Roomiani et al., 2014; Almukhtar et al., 2016; Halim et al., 2020).
Five to eight phases of oogenesis were documented in most teleost fishes (Chitrakar, 2017). From the histological analysis, hilsa is considered a group of synchronous species as two or three stages of oocytes were seen in each sampling time. Ovary highlights heterogeneous yolk vacuoles in the developing oocyte. The nucleus occupies the greater part of the cell during the formation of chromatin nucleolus, transformed into the perinucleolus stage; the appearance of cortical alveolus is the marker of oocyte development at the beginning of primary vitellogenesis, the formation of single and double germinal disk during secondary vitellogenesis, and breakdown of the eccentric germinal disk showing post-ovulatory changes during tertiary vitellogenesis. These findings were also observed by Akhter et al. (2022), in the same species as hilsa. Similar findings had been shown in Dicentrarchus labrax and Danio rerio (Çakici and Üçüncü, 2007). Transformation of the nucleus and nucleolus attributed to the formation of the nucleus, and cortical alveolus shows oocyte development at the beginning of the spawning season (Green et al., 2011; Moallem et al., 2015).
The real-time PCR data showed considerable differences and tissue-specific expression patterns. The expression of ERs was significantly increased in the breeding season. The qPCR results clearly showed that the expression of the alpha receptor was higher in April, whereas from September to November, the expression in both liver and ovary tissue sharply declined. In both ovarian and liver tissue, ER-β expression was higher in April, and the maximum value was observed in September. Findings highlight the expression of ERs and function of receptors (ER-α and β) in the liver and ovary of hilsa, as demonstrated in the case of some salmonids and cyprinids (Tyler et al., 1990; Pankhurst et al., 1999; King and Pankhurst, 2003). The upregulation and downregulation expression profiles of ERs throughout the breeding determine the relationship between the existence of two ERs in this species, allowing us to evaluate breeding scenarios with the ERs of other vertebrates. In some teleosts, ER is primarily responsible for the E2-induced production of vitellogenin in the liver (Sabo-Attwood et al., 2004), medaka liver which increased with sexual development (Chakraborty et al., 2011b), and zebrafish (Meng et al., 2010). The patterns of expressions suggest a predominant role during each phase of the reproductive cycle. The results above showed that the 2−ΔΔCT method is used for quantification of the mRNA expression of ER-α and β and ANOVA is used for statistical analysis based on different months during the breeding season, and it was found to be the most appropriate. The observation detailed in the reference supports this outcome in oviparous vertebrates (Finn and Kristoffersen, 2007; Lubzens et al., 2010). Another investigation showed similarity that ER-α plays a dominant role in the teleost fishes and maintains its consistency (Flouriot et al., 1995; Sabo-Attwood et al., 2004).
Understanding the theory of evolution was achieved through phylogenetic analysis and its relationships among all these organisms. Present phylogenetic studies using the mRNA sequences have succeeded in providing valuable answers about the phylogenetic relationships of T. ilisha ERs with the ERs of other families of teleost. In the case of ER-α, the results showed that among 22 species belonging to different families like Salmonidae, Gasterosteidae, Mugilidae, Cichlidae, Percidae, and Sparidae, Cluster I comprises mRNA sequences of hilsa. The closest genetic distance was observed between other fishes like Alosa sapidissima and Clupea harengus. The ER-β genes provide a higher correlation between the provided data and greater validity. Like other teleosts, hilsa also showed the changes in the expression of ER subtypes.
To date, the three-dimensional structures of estrogen receptors in teleost fishes have not been extensively explored and determined. Consequently, we have seized the opportunity to unveil the 3D structures of estrogen receptors α and β in Tenualosa ilisha. Subsequently, we introduced estradiol (E2) into these structures to examine the nature of interactions between estradiol and the respective receptors. The predicted three-dimensional conformation of ER-α exhibited a sequence similarity of 70.71% with the AlphaFold DB model of ESR1_PAGMA, a gene identified in Pagrus major (Red Sea bream), a member of the Sparidae family. In contrast, ER-β demonstrated a sequence identity of 76.04% when compared with the AlphaFold DB model of A0A6P8GR32_CLUHA, a gene identified in Clupea harengus (Atlantic herring). Notably, Clupea harengus belongs to the Clupeidae family, which is the same family as that of Tenualosa ilisha. The results presented in this study are consistent with the phylogenetic analysis conducted on the two ERs. We further took the predicted structures (obtained from the AlphaFold database (Jumper et al., 2021) of the ERs from Danio rerio and compared our predicted structures. Thereby, we found that the ER-α from both the organisms had slight differences in their structures. ER-βs from Tenualosa ilisha and Danio rerio, when aligned, gave a root mean square deviation [RMSD] of their C α chains 0.244. Upon the introduction of estradiol (E2) into the models, a discernible preference for binding with ER-β was observed. Estrogens function by binding to and activating intracellular estrogen receptors (ERs), members of the nuclear receptor superfamily characterized by a defined domain structure for small molecule recognition (steroids, thyroid hormones, rexinoids, oxysterols, etc.). The ERs consist of two principal domains, namely, the DNA-binding domain (DBD) and the ligand-binding domain (LBD), where most ligands, including estradiol (E2), typically bind (Nelson and Habibi, 2013). Our investigation yielded analogous findings, as we aligned the obtained sequences using InterPro (Mistry et al., 2021), revealing a central LBD region in both our ERs. Notably, the docking of E2 demonstrated its binding affinity to residues located within the LBD region. In summary, the present data suggest that the involvement of ER-α and β is directly or indirectly and physiologically relevant. In fact, bioassays for endocrine regulation frequently involve the expression of the ER gene. It is more evident that the physiological environment cannot be ignored while designing such experiments and analyzing the data. The study reveals the nucleotide sequence of ER-α and β assimilates and coincides with a gradual increase and decrease throughout the breeding and focuses on the vitellogenesis process in the liver and expression in the ovary.
5 Conclusion
In summary, the identification and characterization of ER-α and β classified them phylogenetically and analyzed their expression in hilsa. For the first time, crucial information about molecular dynamics representing an example for future studies on other teleosts is revealed. Moreover, in this study, we present the primary three-dimensional (3D) model of estrogen receptors. These models are derived from the sequences of a homologous protein. Notably, our investigation reveals a remarkable conservation of interactions between estradiol (E2) and amino acids within the steroid-binding pocket or the LBD in both models. The study provided detailed information on ER-α and β, which would possibly help in developing a breeding management protocol for Tenualosa ilisha.
Data availability statement
The data presented in the study are deposited in the NCBI repository, accession numbers MT748787 and OR455448.
Ethics statement
The animal study was approved by Organization for Economic Cooperation and Development (OECD) guidelines were followed for the handling and care of experimental animals. The animal utilization protocol was approved by Institutional Animal Ethics Committee, ICAR-Central Inland Fisheries Research Institute, Kolkata, India, (IAEC/2021/04) for the experimental setup. The study was conducted in accordance with the local legislation and institutional requirements.
Author contributions
AR: Conceptualization, Data curation, Formal analysis, Software, Writing – original draft. VK: Resources, Writing – review & editing. KB: Formal analysis, Software, Writing – review & editing. PB: Formal analysis, Investigation, Software, Writing – review & editing. SP: Data curation, Methodology, Software, Writing – review & editing. AJ: Formal analysis, Investigation, Writing – review & editing. RB: Conceptualization, Project administration, Supervision, Validation, Visualization, Writing – review & editing. BD: Conceptualization, Project administration, Resources, Software, Supervision, Validation, Visualization, Writing – review & editing.
Funding
The author(s) declare financial support was received for the research, authorship, and/or publication of this article. The work is supported by grants in aid from the Department of Science and Technology (DST) (DST/INSPIRE/IF180848/2019) to AR as an INSPIRE fellow.
Acknowledgments
The authors would like to acknowledge the authority of the University of Calcutta, Kolkata 700019, West Bengal, India, and ICAR-Central Inland Fisheries Research Institute, Barrackpore 700120, West Bengal, India, for providing infrastructure to carry out the experiment. The authors also thank Abhijit Pakhira and Tania Koyal for helping with laboratory assistance.
Conflict of interest
The authors declare that the research was conducted in the absence of any commercial or financial relationships that could be construed as a potential conflict of interest.
The reviewer TC declared a past co-authorship with the author(s) VK and BD to the handling editor.
Publisher’s note
All claims expressed in this article are solely those of the authors and do not necessarily represent those of their affiliated organizations, or those of the publisher, the editors and the reviewers. Any product that may be evaluated in this article, or claim that may be made by its manufacturer, is not guaranteed or endorsed by the publisher.
Supplementary material
The Supplementary Material for this article can be found online at: https://www.frontiersin.org/articles/10.3389/fmars.2024.1396297/full#supplementary-material
References
Ahammad A. K. S., Hasan N. A., Haque M. M., Bashar A., Ahmed M. B. U., Alam M. A., et al. (2021). Environmental factors and genetic diversity as drivers of early gonadal maturation: a gonadosomatic index based investigation on Indian Shad, Tenualosa ilisha Population of Bangladesh. Front. Mar. Sci. 8, 758868. doi: 10.3389/fmars.2021.758868
Akhter M., Khan A. B. S., Ullah M. R. (2022). Reproductive potential and histological profiling of the wild female anadromous shad (Tenualosa ilisha) in lower Meghna Estuary, Bangladesh. Arch. Agric. Environ. Sci. 7, 1–7. doi: 10.26832/24566632.2022.070101
Almukhtar M. A., Jasim W., Mutlak F. (2016). Reproductive biology of hilsa shad Tenualosa ilisha (Teleostei: Clupeidae) during spawning migration in the Shatt Al Arab river and Southern Al Hammar Marsh, Basra, Iraq. J. Fish Aquat Sci. 11, 43–55. doi: 10.3923/jfas.2016.43.55
Arnold K., Bordoli L., Kopp J., Schwede T. (2006). The SWISS-MODEL workspace: A web-based environment for protein structure homology modelling. Bioinformatics 22, 195–201. doi: 10.1093/bioinformatics/bti770
Behera B. K., Das P., Maharana J., Meena D. K., Sahu T. K., Rao A. R., et al. (2015). Functional screening and molecular characterization of halophilic and halotolerant bacteria by 16S rRNA gene sequence analysis. Proc. Natl. Acad. Sci. India B - Biol. Sci. 85, 957–964. doi: 10.1007/s40011-014-0440-6
Bhaumik U., Sharma A. P. (2011). The fishery of Indian Shad (Tenualosa ilisha) in the Bhagirathi-Hooghly river system. Fishing Chimes 31, 21–27.
Çakici Ö., Üçüncü S.İ. (2007). Oocyte development in the zebrafish, Danio rerio (Teleostei: Cyprinidae). J. Fish Aquat Sci. 24, 137–141.
Chakraborty T., Katsu Y., Zhou L. Y., Miyagawa S., Nagahama Y., Iguchi T. (2011a). Estrogen receptors in medaka (Oryzias latipes) and estrogenic environmental contaminants: An in vitro–in vivo correlation. J. Steroid Biochem. Mol. Biol. 123, 115–121. doi: 10.1016/j.jsbmb.2010.11.015
Chakraborty T., Shibata Y., Zhou L.-Y., Katsu Y., Iguchi T., Nagahama Y. (2011b). Differential expression of three estrogen receptor subtype mRNAs in gonads and liver from embryos to adults of the medaka, Oryzias latipes. Mol. Cell. Endocrinol. 333, 47–54. doi: 10.1016/j.mce.2010.12.002
Chitrakar P. (2017). Micro-Anatomical and Morpho-Histological studies of ovary of stone carp Psilorhynchus pseudecheneis (Menon & Dutta 1964) from Trishuli river of Nepal. Aquaculture 17, 4.
Colovos C., Yeates T. O. (1993). Verification of protein structures: Patterns of nonbonded atomic interactions. Protein Sci. 2, 1511–1519. doi: 10.1002/pro.5560020916
Couse J. F., Lindzey J., Grandien K. A. J., Gustafsson J.-A., Korach K. S. (1997). Tissue distribution and quantitative analysis of estrogen receptor-α (ERα) and estrogen receptor-β (ERβ) messenger ribonucleic acid in the wild-type and ERα-knockout mouse. Endocrinology 138, 4613–4621. doi: 10.1210/endo.138.11.5496
Degani G., Tzchori I., Yom-Din S., Goldberg D., Jackson K. (2003). Growth differences and growth hormone expression in male and female European eels [Anguilla Anguilla (L.)]. Gen. Comp. Endocrinol. 134, 88–93. doi: 10.1016/S0016-6480(03)00238-7
Devlin R. H., Nagahama Y. (2002). Sex determination and sex differentiation in fish: an overview of genetic, physiological, and environmental influences. Aquaculture 208, 191–364. doi: 10.1016/S0044-8486(02)00057-1
Dutta V., Sharma U., Kumar R. (2017). Assessment of river ecosystems and environmental flows: Role of flow regimes and physical habitat variables. Climate Change Environ. Sustainability 5, 20–34. doi: 10.5958/2320642x.2017.00002.3
Edwards D. P. (2005). Regulation of signal transduction pathways by estrogen and progesterone. Annu. Rev. Physiol. 67, 335–376. doi: 10.1146/annurev.physiol.67.040403.120151
Filby A. L., Tyler C. R. (2005). Molecular characterization of estrogen receptors 1, 2a, and 2b and their tissue and ontogenic expression profiles in fathead minnow (Pimephales promelas). Biol. Reprod. 73, 648–662. doi: 10.1095/biolreprod.105.039701
Finn R. N., Kristoffersen B. A. (2007). Vertebrate vitellogenin gene duplication in relation to the “3R hypothesis”: correlation to the pelagic egg and the oceanic radiation of teleosts. PLoS One 2, e169. doi: 10.1371/journal.pone.0000169
Flouriot G., Pakdel F., Ducouret B., Valotaire Y. (1995). Influence of xenobiotics on rainbow trout liver estrogen receptor and vitellogenin gene expression. J. Mol. Endocrinol. 15, 143–151. doi: 10.1677/jme.0.0150143
Green S. J., Akins J. L., Côté I. M. (2011). Foraging behaviour and prey consumption in the Indo-Pacific lionfish on Bahamian coral reefs. Mar. Ecol. Prog. Ser. 433, 159–167. doi: 10.3354/meps09208
Guiguen Y., Fostier A., Piferrer F., Chang C.-F. (2010). Ovarian aromatase and estrogens: A pivotal role for gonadal sex differentiation and sex change in fish. Gen. Comp. Endocrinol. 165, 352–366. doi: 10.1016/j.ygcen.2009.03.002
Gustafsson J.-Å. (2003). What pharmacologists can learn from recent advances in estrogen signalling. Trends Pharmacol. Sci. 24, 479–485. doi: 10.1016/S0165-6147(03)00229-3
Halim N. H. A., Yahya S.-F., Puasa N. A., Jamon S. (2020). Reproductive biology and histological profiling of maturity stages in hilsa shad, Tenualosa ilisha (Teleostei: Clupeidae) in the mouth of Perak waters, Malaysia. Int. J. Fish. Aquat. Stud. 8, 132–142.
Hall J. M., Couse J. F., Korach K. S. (2001). The multifaceted mechanisms of estradiol and estrogen receptor signaling. J. Biol. Chem. 276, 36869–36872. doi: 10.1074/jbc.R100029200
Halm S., Martınez-Rodrıguez G., Rodrıguez L., Prat F., Mylonas C. C., Carrillo M., et al. (2004). Cloning, characterisation, and expression of three oestrogen receptors (ERα, ERβ1 and ERβ2) in the European sea bass, Dicentrarchus labrax. Mol. Cell. Endocrinol. 223, 63–75. doi: 10.1016/j.mce.2004.05.009
Heldring N., Pike A., Andersson S., Matthews J., Cheng G., Hartman J., et al. (2007). Estrogen receptors: how do they signal and what are their targets. Physiol. Rev. 87, 905–931. doi: 10.1152/physrev.00026.2006
Hess R. A. (2003). Estrogen in the adult male reproductive tract: a review. Reprod. Biol. Endocrin. 1, 1–14. doi: 10.1186/1477-7827-1-52
Hossain M. A. R., Das I., Genevier L., Hazra S., Rahman M., Barange M., et al. (2019). Biology and fisheries of hilsa shad in Bay of Bengal. Sci. Total Environ. 651, 1720–1734. doi: 10.1016/j.scitotenv.2018.10.034
Islam M. S., Hoq M. E. (2018). “Vulnerability of aquaculture-based fish production systems to the impacts of climate change: insights from Inland Waters in Bangladesh,” in Bangladesh I: Climate Change Impacts, Mitigation and Adaptation in Developing Countries, (Switzerland: Springer Nature) 67–97. doi: 10.1007/978-3-319-26357-1
Jones S., Menon P. M. G. (1951). Observations on the life-history of the Indian shad, hilsa ilisha (Hamilton). Proc. Natl. Acad. Sci. 33, 101–124. doi: 10.1007/BF03049975
Jumper J., Evans R., Pritzel A., Green T., Figurnov M., Ronneberger, et al. (2021). Highly accurate protein structure prediction with AlphaFold. Nature 596, 583–589. doi: 10.1038/s41586-021-03819-2
King H. R., Pankhurst N. W. (2003). Ovarian growth and plasma sex steroid and vitellogenin profiles during vitellogenesis in Tasmanian female Atlantic salmon (Salmo salar). Aquaculture 219, 797–813. doi: 10.1016/S0044-8486(02)00647-6
Korach K. S. (1994). Insights from the study of animals lacking functional estrogen receptor. Science 266, 1524–1527. doi: 10.1126/science.7985022
Kuiper T. B. H., Langer W. D., Velusamy T. (1996). Evolutionary status of the pre-protostellar core L1498. Astrophys. J. 468, 761. doi: 10.1086/177732
Kumar S., Stecher G., Tamura K. (2016). MEGA7: molecular evolutionary genetics analysis version 7.0 for bigger datasets. Mol. Biol. Evol. 33, 1870–1874. doi: 10.1093/molbev/msw054
Laskowski R. A., Jabłońska J., Pravda L., Vařeková R. S., Thornton J. M. (2018). PDBsum: Structural summaries of PDB entries. Protein Sci. 27, 129–134. doi: 10.1002/pro.3289
Laskowski R. A., MacArthur M. W., Moss D. S., Thornton J. M. (1993). PROCHECK: a program to check the stereochemical quality of protein structures. J. Appl. Crystallogr. 26, 283–291. doi: 10.1107/S0021889892009944
Laskowski R. A., Swindells M. B. (2011). LigPlot+: multiple ligand–protein interaction diagrams for drug discovery (Washington, US: ACS Publications). doi: 10.1021/ci200227u
Levin E. R. (2001). Invited Review: Cell localization, physiology, and nongenomic actions of estrogen receptors. J. Appl. Physiol. 91, 1860–1867. doi: 10.1152/jappl.2001.91.4.1860
Livak K. J., Schmittgen T. D. (2001). Analysis of relative gene expression data using real-time quantitative PCR and the 2–ΔΔCT method. Methods 25, 402–408. doi: 10.1006/meth.2001.1262
Lubzens E., Young G., Bobe J., Cerdà J. (2010). Oogenesis in teleosts: how fish eggs are formed. Gen. Comp. Endocrinol. 165, 367–389. doi: 10.1016/j.ygcen.2009.05.022
Meng X., Bartholomew C., Craft J. A. (2010). Differential expression of vitellogenin and oestrogen receptor genes in the liver of zebrafish, Danio rerio. Anal. Bioanal. Chem. 396, 625–630. doi: 10.1007/s00216-009-3112-2
Menuet A., Pellegrini E., Anglade I., Blaise O., Laudet V., Kah O., et al. (2002). Molecular characterization of three estrogen receptor forms in zebrafish: binding characteristics, transactivation properties, and tissue distributions. Biol. Reprod. 66, 1881–1892. doi: 10.1095/biolreprod66.6.1881
Miah M. S. (2015). Climatic and anthropogenic factors changing spawning pattern and production zone of hilsa fishery in the Bay of Bengal. Weather Clim. Extrem. 7, 109–115. doi: 10.1016/j.wace.2015.01.001
Mistry J., Chuguransky S., Williams L., Qureshi M., Salazar G. A., Sonnhammer E. L. L., et al. (2021). Pfam: The protein families database in 2021. Nucleic Acids Res. 49, D412–D419. doi: 10.1093/nar/gkaa913
Miura T., Miura C., Ohta T., Nader M. R., Todo T., Yamauchi K. (1999). Estradiol-17β stimulates the renewal of spermatogonial stem cells in males. Biochem. Biophys. Res. Commun. 264, 230–234. doi: 10.1006/bbrc.1999.1494
Moallem Z., Abdi R., Movahedinia A., Shirali S., Salati A. P. (2015). Gonad histology and gonadosomatic index variations during gonadal development of wild female. Tenualosa ilisha. J. Persian Gulf. 6, 53–58.
Mohanty H. K., Mahapatra M. M., Kumar P., Biswas P., Mandal N. R. (2012). Modeling the effects of tool shoulder and probe profile geometries on friction stirred aluminum welds using response surface methodology. J. Mar. Sci. Appl. 11, 493–503. doi: 10.1007/s11804-012-1160-z
Mosselman S., Polman J., Dijkema R. (1996). ERβ: identification and characterization of a novel human estrogen receptor. FEBS Lett. 392, 49–53. doi: 10.1016/0014-5793(96)00782-X
Nagler J. J., Cavileer T. D., Verducci J. S., Schultz I. R., Hook S. E., Hayton W. L. (2012). Estrogen receptor mRNA expression patterns in the liver and ovary of female rainbow trout over a complete reproductive cycle. Gen. Comp. Endocrinol. 178, 556–561. doi: 10.1016/j.ygcen.2012.06.010
Nagler J. J., Davis T. L., Modi N., Vijayan M. M., Schultz I. (2010). Intracellular, not membrane, estrogen receptors control vitellogenin synthesis in the rainbow trout. Gen. Comp. Endocrinol. 167, 326–330. doi: 10.1016/j.ygcen.2010.03.022
Nakamura M., Bhandari R. K., Higa M. (2003). The role estrogens play in sex differentiation and sex changes of fish. Fish Physiol. Biochem. 28, 113–117. doi: 10.1023/B:FISH.0000030495.99487.17
Nakamura M., Kobayashi T., Chang X., Nagahama Y. (1998). Gonadal sex differentiation in teleost fish. J. Exp. Zool. 281, 362–372. doi: 10.1002/(ISSN)1097-010X
Nelson E. R., Habibi H. R. (2013). Estrogen receptor function and regulation in fish and other vertebrates. Gen. Comp. Endocrinol. 192, 15–24. doi: 10.1016/j.ygcen.2013.03.032
Nilsson S., Makela S., Treuter E., Tujague M., Thomsen J., Andersson G., et al. (2001). Mechanisms of estrogen action. Physiol. Rev. 81, 1535–1565. doi: 10.1152/physrev.2001.81.4.1535
Pankhurst N. W., Hilder P. I., Pankhurst P. M. (1999). Reproductive condition and behavior in relation to plasma levels of gonadal steroids in the spiny damselfish Acanthochromis polyacanthus. Gen. Comp. Endocrinol. 115, 53–69. doi: 10.1006/gcen.1999.7285
Panter G. H., Hutchinson T. H., Hurd K. S., Sherren A., Stanley R. D., Tyler C. R. (2004). Successful detection of (anti-) androgenic and aromatase inhibitors in pre-spawning adult fathead minnows (Pimephales promelas) using easily measured endpoints of sexual development. Aquat. Toxicol. 70, 11–21. doi: 10.1016/j.aquatox.2004.06.007
Patiño R., Sullivan C. V. (2002). Ovarian follicle growth, maturation, and ovulation in teleost fish. Fish Physiol. Biochem. 26, 57–70. doi: 10.1023/A:1023311613987
Pramanick K., Kundu S., Paul S., Mallick B., Moulik S. R., Pal P., et al. (2013). Changes in plasma steroid levels during oocyte development in Indian shad, Tenualosa ilisha (Hamilton 1822): Role of gonadotropins on in vitro steroid production and development of oocyte maturational competence. Anim. Reprod. Sci. 141, 177–188. doi: 10.1016/j.anireprosci.2013.08.009
Roomiani L., Sotudeh A. M., Hakimi Mofrad R. (2014). Reproductive biology of hilsa shad (Tenualosa ilisha) in coastal Waters of the Northwest of Persian Gulf. Iran. J. Fish. Sci. 13, 201–215.
Sabo-Attwood T., Kroll K. J., Denslow N. D. (2004). Differential expression of largemouth bass (Micropterus salmoides) estrogen receptor isotypes alpha, beta, and gamma by estradiol. Mol. Cell. Endocrinol. 218, 107–118. doi: 10.1016/j.mce.2003.12.007
Saitou N., Nei M. (1987). The neighbor-joining method: a new method for reconstructing phylogenetic trees. Mol. Biol. Evol. 4, 406–425. doi: 10.1093/oxfordjournals.molbev.a040454
Sampath Kumar R., Ijiri S., Trant J. M. (2000). Changes in the expression of genes encoding steroidogenic enzymes in the channel catfish (Ictalurus punctatus) ovary throughout a reproductive cycle. Biol. Reprod. 63, 1676–1682. doi: 10.1095/biolreprod63.6.1676
Saville B., Wormke M., Wang F., Nguyen T., Enmark E., Kuiper G., et al. (2000). Ligand-, cell-, and estrogen receptor subtype (α/β)-dependent activation at GC-rich (Sp1) promoter elements. J. Biol. Chem. 275, 5379–5387. doi: 10.1074/jbc.275.8.5379
Shihab I., Gopalakrishnan A., Vineesh N., Muktha M., Akhilesh K. V., Vijayagopal P. (2017). Histological profiling of gonads depicting protandrous hermaphroditism in E leutheronema tetradactylum. J. Fish Biol. 90, 2402–2411. doi: 10.1111/jfb.13324
Socorro S., Power D. M., Olsson P. E., Canario A. V. M. (2000). Two estrogen receptors expressed in the teleost fish, Sparus aurata: cDNA cloning, characterization and tissue distribution. J. Endocrinol. 166, 293–306. doi: 10.1677/joe.0.1660293
Tchoudakova A., Pathak S., Callard G. V. (1999). Molecular cloning of an estrogen receptor β subtype from the goldfish, Carassius auratus. Gen. Comp. Endocrinol. 113, 388–400. doi: 10.1006/gcen.1998.7217
Thomas P., Dressing G., Pang Y., Berg H., Tubbs C., Benninghoff A., et al. (2006). Progestin, estrogen and androgen G-protein coupled receptors in fish gonads. Steroids 71, 310–316. doi: 10.1016/j.steroids.2005.09.015
Todo T., Ryo H., Yamamoto K., Toh H., Inui T., Ayaki H., et al. (1996). Similarity among the Drosophila (6–4) photolyase, a human photolyase homolog, and the DNA photolyase-blue-light photoreceptor family. Science 272, 109–112. doi: 10.1126/science.272.5258.109
Trott O., Olson A. J. (2010). AutoDock Vina: improving the speed and accuracy of docking with a new scoring function, efficient optimization, and multithreading. J. Comput. Chem. 31, 455–461. doi: 10.1002/jcc.21334
Tyler C. R., Sumpter J. P., Witthames P. R. (1990). The dynamics of oocyte growth during vitellogenesis in the rainbow trout (Oncorhynchus mykiss). Biol. Reprod. 43, 202–209. doi: 10.1095/biolreprod43.2.202
Wiederstein M., Sippl M. J. (2007). ProSA-web: Interactive web service for the recognition of errors in three-dimensional structures of proteins. Nucleic Acids Res. 35, 407–410. doi: 10.1093/nar/gkm290
Keywords: hilsa (Tenualosa ilisha), reproduction, estrogen receptors, vitellogenesis, mRNA expression
Citation: Roy A, Kumar V, Bisai K, Bhowal P, Panda SP, Jana AK, Banerjee R and Das BK (2024) Molecular characterization and expression profile of estrogen receptor subtypes in female hilsa (Tenualosa ilisha). Front. Mar. Sci. 11:1396297. doi: 10.3389/fmars.2024.1396297
Received: 05 March 2024; Accepted: 10 May 2024;
Published: 05 June 2024.
Edited by:
Shivendra Kumar, Dr. Rajendra Prasad Central Agricultural University, IndiaReviewed by:
Tapas Chakraborty, Kyushu University, JapanSarvendra Kumar, College of Fisheries Kishanganj, India
Copyright © 2024 Roy, Kumar, Bisai, Bhowal, Panda, Jana, Banerjee and Das. This is an open-access article distributed under the terms of the Creative Commons Attribution License (CC BY). The use, distribution or reproduction in other forums is permitted, provided the original author(s) and the copyright owner(s) are credited and that the original publication in this journal is cited, in accordance with accepted academic practice. No use, distribution or reproduction is permitted which does not comply with these terms.
*Correspondence: Basanta Kumar Das, YmFzYW50YWt1bWFyZEBnbWFpbC5jb20=; Rajat Banerjee, cmJiY2djQGNhbHVuaXYuYWMuaW4=