
94% of researchers rate our articles as excellent or good
Learn more about the work of our research integrity team to safeguard the quality of each article we publish.
Find out more
ORIGINAL RESEARCH article
Front. Mar. Sci., 20 June 2024
Sec. Marine Conservation and Sustainability
Volume 11 - 2024 | https://doi.org/10.3389/fmars.2024.1396026
 Yue Li1,2†
 Yaling Huang1,3*†Xiaoyun Zhang1Yawen Jiang1,2Xiaoshan Jing1Yihong Deng1Rongmao Li4Degang Jiang5
 Jingli Mu1*
Maintaining the health of coastal aquaculture ecosystems is crucial for sustainable development. Therefore, establishing a specific ecosystem health assessment index system for aquaculture bays is paramount. This system allows for the evaluation of the health status of these bays and aids in the planning and restoration of fishery habitats. Utilizing the well-known “Pressure-State-Response” framework, a comprehensive evaluation index system with 14 indicators was developed. Additionally, the analytic hierarchy process and entropy weight methods were employed to assess the ecosystem health of Sansha Bay, a representative aquaculture bay in Fujian Province, China. The results revealed variations in health status across four zones in 2020, categorized as “good” or “excellent”. However, the security index was more spatially distributed and classified from “fair” to “safety”. Key indicators critical to sustaining the health of the aquaculture bay ecosystem included the regional environmental risk index, the proportion of industrial discharge outlets, the zooplankton species diversity index, the phytoplankton species diversity index, the molar ratio of phosphorus to nitrogen, and the size of nature reserves. According to the assessments of ecosystem health and ecological security, vigorous endeavors in aquatic ecology are paramount to ensure the enduring sustainability of aquaculture, with a specific emphasis on Zoning 1 and Zoning 4. These findings not only enhance and expand the methods for assessing the health of aquaculture bay ecosystems but also provide a scientific basis for the conservation of fishery habitats and the green, high-quality development of the aquaculture industry in Sansha Bay.
In recent years, aquaculture has emerged as the fastest-growing sector in food production, surpassing capture fisheries in terms of fish yield for human consumption since 2013 (FAO, 2016). As the leading global producer and exporter in the fishery industry, the aquaculture production in China contributed approximately 79.8% of the total national aquatic production in 2020 (https://www.yearbookchina.com/navibooklist-n3022013079-1.html, Supplementary Table S1). Semi-enclosed bays, functioning as crucial transition zones, play a pivotal role in marine ecosystems (Jiang et al., 2021). A fishery habitat is defined as the spatial domain where fish organisms depend on the associated physical and chemical processes, such as spawning, rearing, and feeding (Valavanis et al., 2004; Fairchild et al., 2013; Moore et al., 2016). Shallow inshore-sheltered bays have gradually gained prominence as significant areas for fishery cultivation due to their unique geographical environment (Chang and Chen, 2008; Li et al., 2017). The coastal aquaculture area in China experienced an average annual growth rate of 4.17% from 1990 to 2020 (Song et al., 2023).
Enclosed and semi-enclosed bays worldwide are currently experiencing habitat degradation due to a combination of natural factors and human activities (Huang et al., 2013), such as climate change, wastewater discharge, shipping, and overfishing (Borja et al., 2016). The compounding effects of human activities and climate change are disrupting the structure of biological communities (Halpern et al., 2015; Tian et al., 2021; Lyu et al., 2022; Song et al., 2022), leading to a decrease in species richness, a decline in fishery resources, and even degradation of the ecosystem health in aquaculture bays (Li et al., 2021; Yan et al., 2021; Ai et al., 2023; Zhang F. et al., 2023). A healthy ecosystem serves as the material foundation and provides ecological services necessary for human survival (Rapport and Maffi, 2011); therefore, it is essential to maintain the health of ecosystems as a vital component of sustainable development. Conducting ecosystem health assessments, which serve as effective management tools, allows us to understand the health status of an ecosystem and identify the threshold of ecological degradation (Chi et al., 2018). Thus, it is imperative and meaningful to carry out ecosystem health assessments for aquaculture bays. These assessments not only enhance research and monitoring of the ecological environment and resources but also provide a scientific basis for the planning and restoration of fishery habitats, ensuring the sustainable utilization of coastal bay ecosystems (Pan et al., 2021; Yu et al., 2022).
Quantitative ecosystem health assessments should comprehensively consider multiple indicators that encompass both biophysical and socioeconomic aspects (Costanza, 1997; Xu et al., 2001). The use of an index system has become the prevailing approach for conducting these assessments, as it effectively integrates various indices and information sources, offering a holistic understanding of ecosystem health (Song et al., 2017). While numerous studies have assessed the health of marine ecosystems, recent attention has increasingly focused on evaluating bay ecosystems using the index system methodology (Gari et al., 2015; Yang et al., 2021). Notable examples include the establishment of a marine ecological health index system by the U.N. Environmental Program in 1992 and the release of guidance for assessing the health of coastal marine ecosystems by the State Oceanic Administration of the People’s Republic of China in 2005 (SOA, 2005), which serves as a reference for subsequent evaluations and research on marine ecological health. Recently, Qian et al. (2023) devised an ecological health evaluation index system to assess the sustainability of ecological health in Xiamen Bay, China. Despite the increasing attention given to marine ecosystem health assessments, it is important to note that no single method or index system can be universally applied across all scales and regions (Devlin et al., 2019; Yang et al., 2021). Furthermore, until recently, there has been a scarcity of studies specifically focusing on ecosystem health evaluations for aquaculture bays, resulting in a lack of suitable indicators and framework systems tailored to these ecosystems.
The ecosystem health index system encompasses numerous factors, requiring a scientific, systematic, representative, and user-friendly assessment principle. Various techniques have been employed for ecosystem health assessments, including network analysis, the health distance model, optimal functional condition evaluation, and conceptual models (Sadeghi et al., 2023). Among these approaches, conceptual models such as Reliability-Resilience-Vulnerability (RelResVul) (Hazbavi et al., 2018, 2019), Driver forces-Pressure-State-Impact-Response (DPSIR) (Martins et al., 2012), Vitality (Vigor)-Organization Force-Recovery Force (VORes) (Sadeghi et al., 2023), Vigor-Organization-Resilience-Services (VORS) (Xu et al., 2022), and Pressure-State-Response (PSR) (Song et al., 2017; Liao et al., 2018; Sun et al., 2019; Sadeghi et al., 2023), have been extensively utilized. Based on previous studies, the PSR model demonstrates efficiency and widespread applicability in ecosystem health assessments, ascribed to its simplicity, intuitiveness, and user-friendly nature (Zhang F. et al., 2023; Zhang R. et al., 2023; Zhang Y. et al., 2023). For instance, Yang et al. (2021) adopted the pressure-state-response (PSR) framework in their study of ecological and environmental marine health assessment.
At present, for multiple-target integrated assessment, many methods have been developed to determine the weight of each index. Common methods for determining index weights include the analytic hierarchy process (AHP), entropy weight (EW) method, and coefficient of variation method, among others (Ren et al., 2022). Among these methods, AHP regards complex issues as a system, which is a reliable method to deal with multicriteria analysis (Roy et al., 2021), therefore, it is widely used for ecosystem or ecological health assessments (Sun et al., 2019). It derives weight coefficients from expert scoring. This process generally reflects the relative importance differences between evaluation indicators, but is relatively subjective. The EW method is an objective assignment method, and determines weights based on the information quantity provided by observed values of each index. This objective process reduces human interference in weight calculations and yields more realistic evaluation results. Compared to other calculation methods, the EW method is easier to implement (Zhang R. et al., 2023), but it overlooks the intrinsic importance of each index within a specific system. Considering the advantages and disadvantages of the subjective method (e.g. AHP), its combination with the objective method is recommended for calculating indicator weights to minimize the influence of subjective factors on the relative importance of each indicator. Until recently, the majority of current studies related to health assessment of marine ecosystems have adopted the AHP as the subjective weighting method (Song et al., 2017; Fu et al., 2021; Yang et al., 2021; Song et al., 2022), and have ignored the use of objective methods such as EW method (Wu et al., 2023).
Sansha Bay, recognized as the primary spawning ground for Larimichthys crocea, stands as the largest seawater cage culture base in China (Song et al., 2023). By 2020, the production of Larimichthys crocea comprised approximately 70% of China’s total production, totaling 178,000 tons (Song et al., 2023). However, the water quality and ecosystem of the bay have shown signs of degradation in recent years, attributed to land-based pollution, rapid urbanization, industrialization along the coast, and intensive mariculture activities (Lin et al., 2017; Huang et al., 2023). The fishery habitat in Sansha Bay faces considerable pressure and risks from terrestrial pollutant influx, the potential for sudden environmental incidents, and high susceptibility to red tide disasters. Consequently, there is escalating concern among various stakeholders regarding the ecological issues in this region. Although some studies have explored the impacts of aquaculture on sedimentary heavy metal and water nutrient pollution (Jiang et al., 2021; Xie et al., 2022; Song et al., 2023), phytoplankton assemblages (Huo et al., 2018), water exchange (Lin et al., 2017), and ecological functions (Xie et al., 2022), a comprehensive assessment of the aquaculture bay ecosystem’s health status and the factors precipitating its decline is lacking.
Therefore, this study considers Sansha Bay, a typical aquaculture bay in China, as a demonstrative case. Using small-scale spatial zoning as evaluation unit, we establish an assessment indicator system focusing on ecosystem health of aquaculture bay based on PSR model to explore the following: (1) determining the weight for each index based on EW and AHP methods; (2) assessing the ecosystem health and ecological security of Sansha Bay across space in 2020; (3) identifying the potential drivers and influencing factors on ecosystem health. The findings will not only provide a scientific basis for the preservation of fishery habitats and the advancement of environmentally sustainable practices in Sansha Bay, but also enhance and broaden methodology for ecosystem health assessment in other aquaculture bays, which further guarantees the sustainable development.
Sansha Bay, covering an area of 714 km2 of seawater (119° 31 ′ 26 ′′ E to 120° 05 ′ 16 ′′ E, 26° 31 ′ 02 ′′ N to 26° 57 ′ 52 ′′ N), stands as the largest bay in Fujian Province, Southeast China. This bay encompasses several smaller bays, including Baima Harbor, Yantian Harbor, Dongwuyang, and Guanjingyang (Figure 1). It is characterized as a semi-closed bay with a narrow entrance, known as the Dongchong Channel, which is around 3 km wide and links the bay to the outer waters of the Taiwan Strait (Lin et al., 2017). The seawater’s half-life exchange through the Dongchong Channel is less than 10 days, contrasting with over 30 days in the upper part of the bay (Lin et al., 2017). Due to its unique geography, Sansha Bay has traditionally been rich in fishery resources and serves as a vital mariculture ecosystem in China.
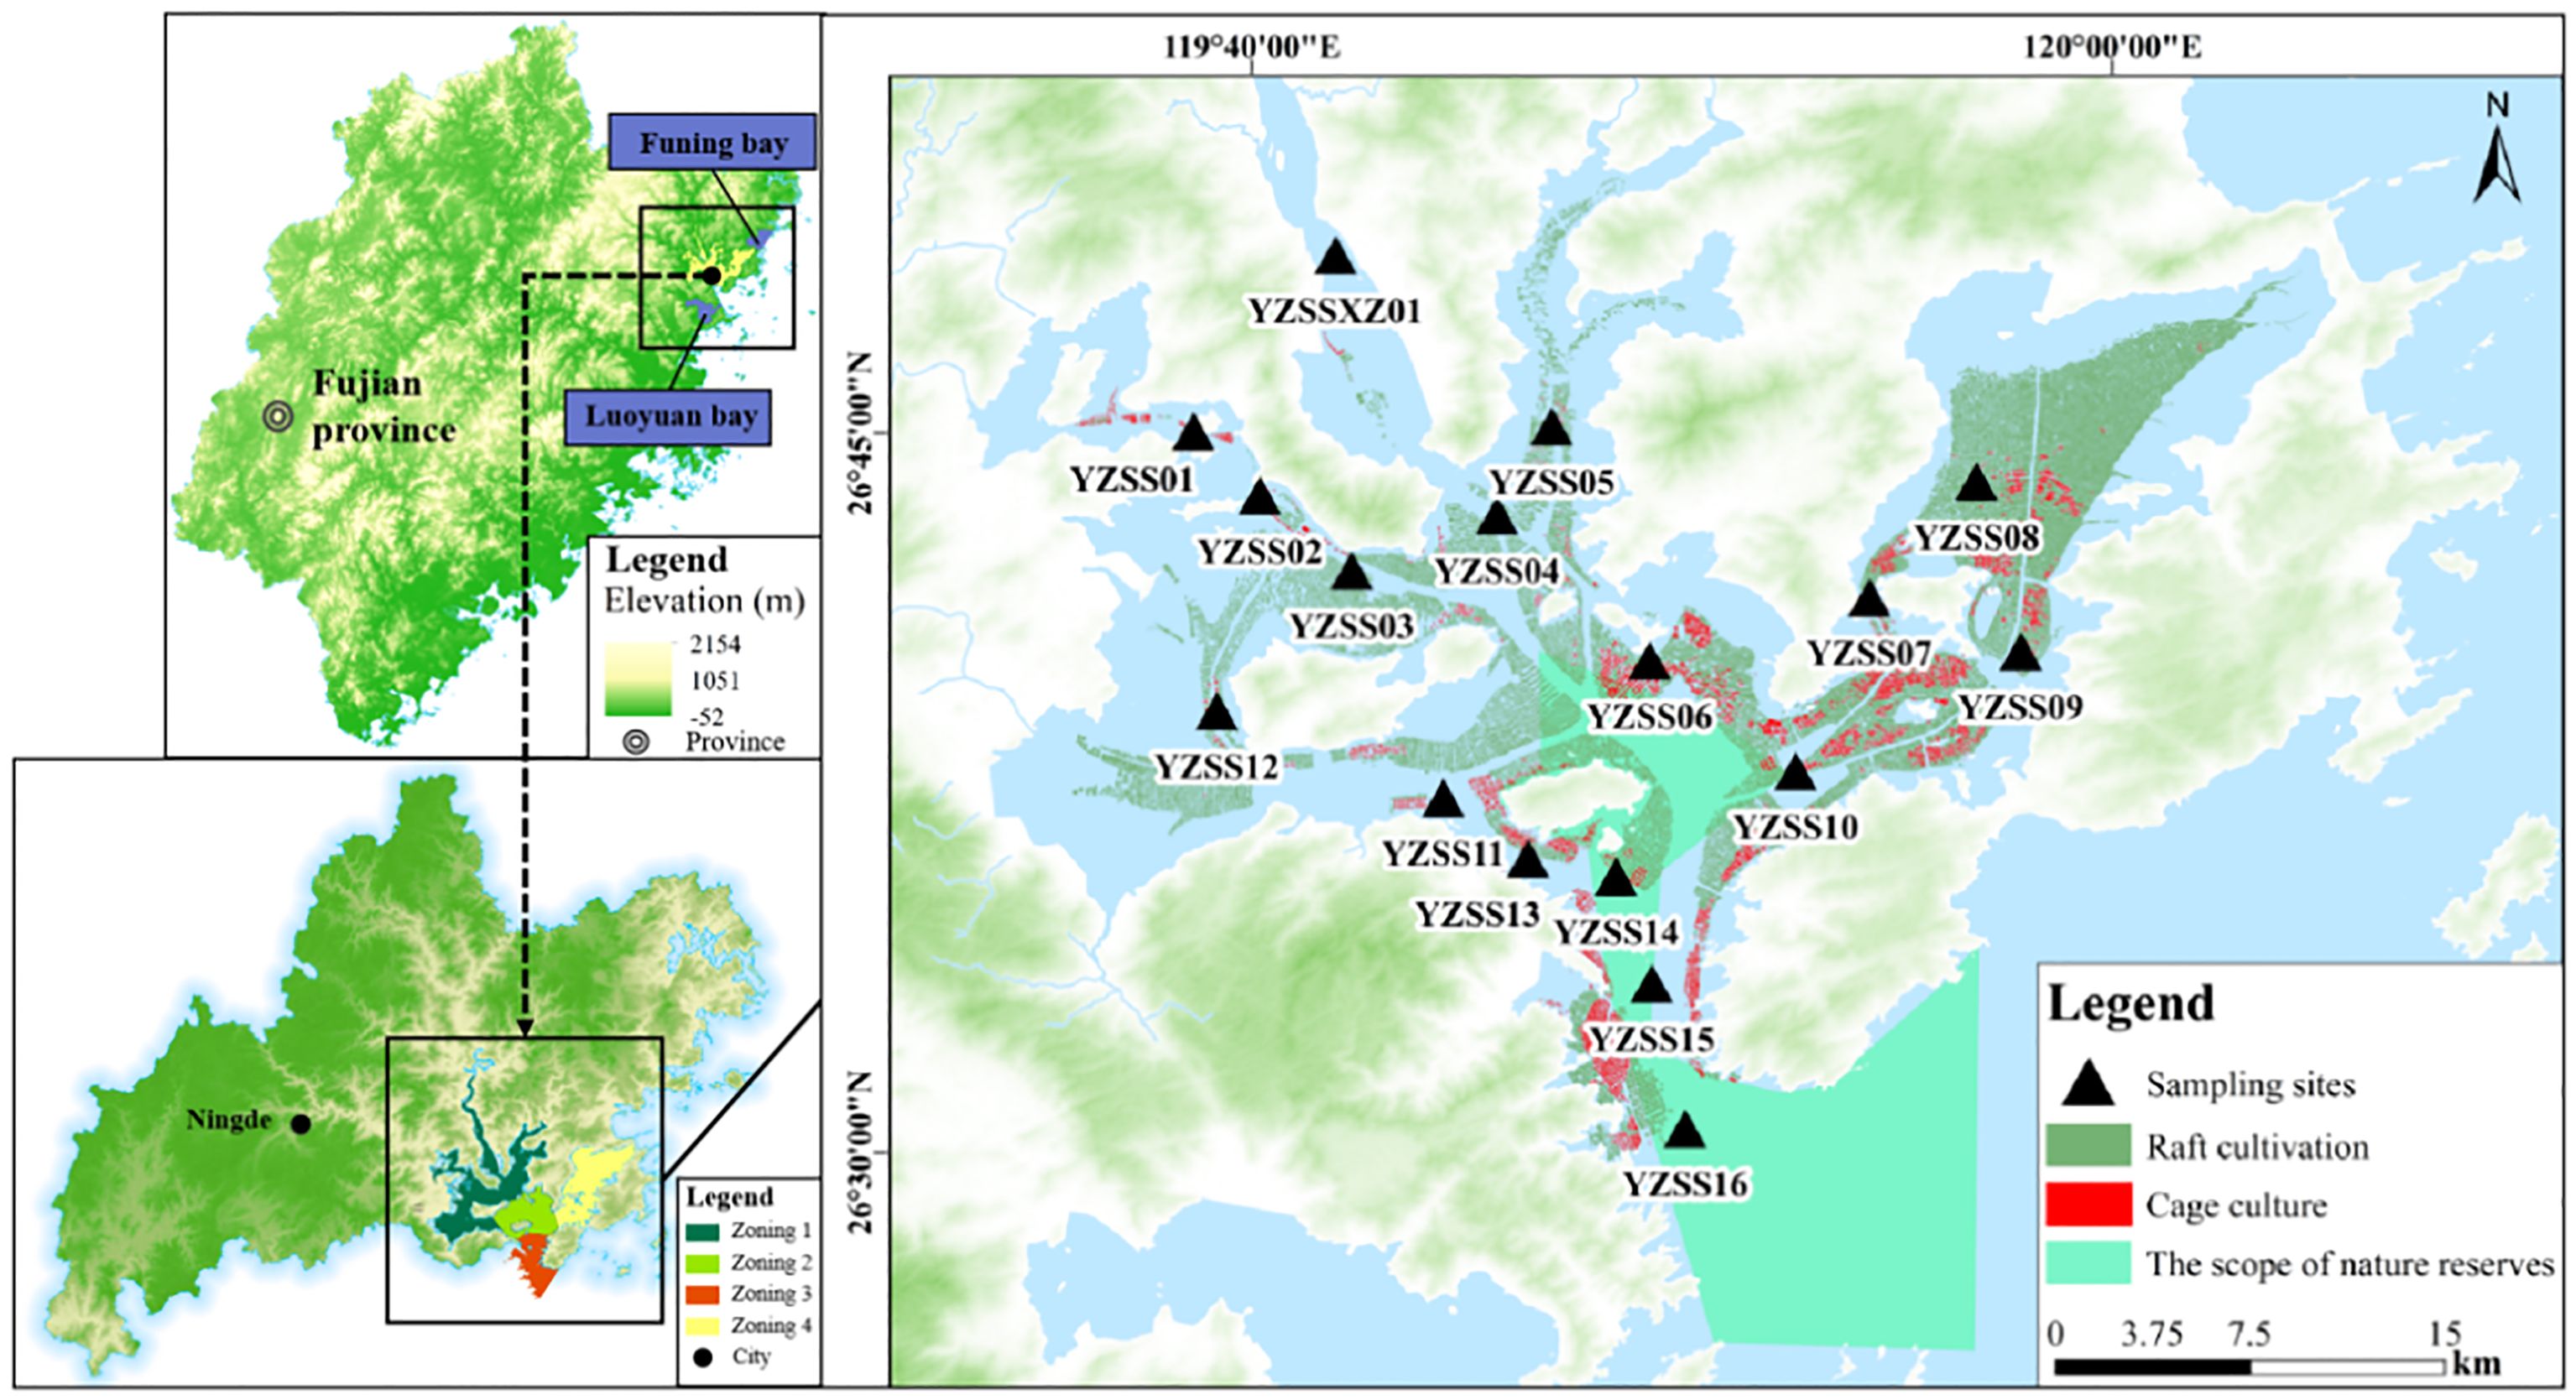
Figure 1 Locations and sampling stations of Sansha Bay.
The ecological environment quality and hydrodynamic conditions within Sansha Bay exhibit spatial variability influenced by natural geographical features, human activities, and marine spatial planning. To address these influences, monitoring data related to the ecological environment, hydrodynamic conditions, mariculture distribution, and coastal discharge points were scrutinized. Through the application of Principal Component Analysis and SKATER cluster analysis, Sansha Bay was segregated into four distinct subareas labeled as Zoning 1-4. Subsequently, a health assessment was performed for each zoning within Sansha Bay based on the aforementioned data analysis.
The aquaculture bay ecosystem represents a unique and intricate system crafted through human interventions aiming to bolster ecological service functions. It involves complex interplay between organisms and their environment, revolving around material exchange, energy flow, and information dissemination among the land, basin, and bay. Furthermore, the aquaculture bay ecosystem faces diverse pressures from human activities and natural disasters, impacting its overall health. Principles including representativeness, simplicity, data accessibility, information precision, and data computing readiness, have been considered while selecting indicators (Wu et al., 2023). According to the above principles, 14 key factors related to sea use, land-based pollution source and ecological risk, ecological and environmental characteristics, marine aquaculture attributes, fisheries management and conservation strategies (Table 1) were selected based on an in-depth analysis of the pollution source structure, development of port industry cluster, and ecosystem characteristic of Sansha Bay (Huang et al., 2023). The index calculation methods are listed in Supplementary Tables S2–S4. These factors were carefully selected to establish an indicator system rooted in the pressure-state-response framework.
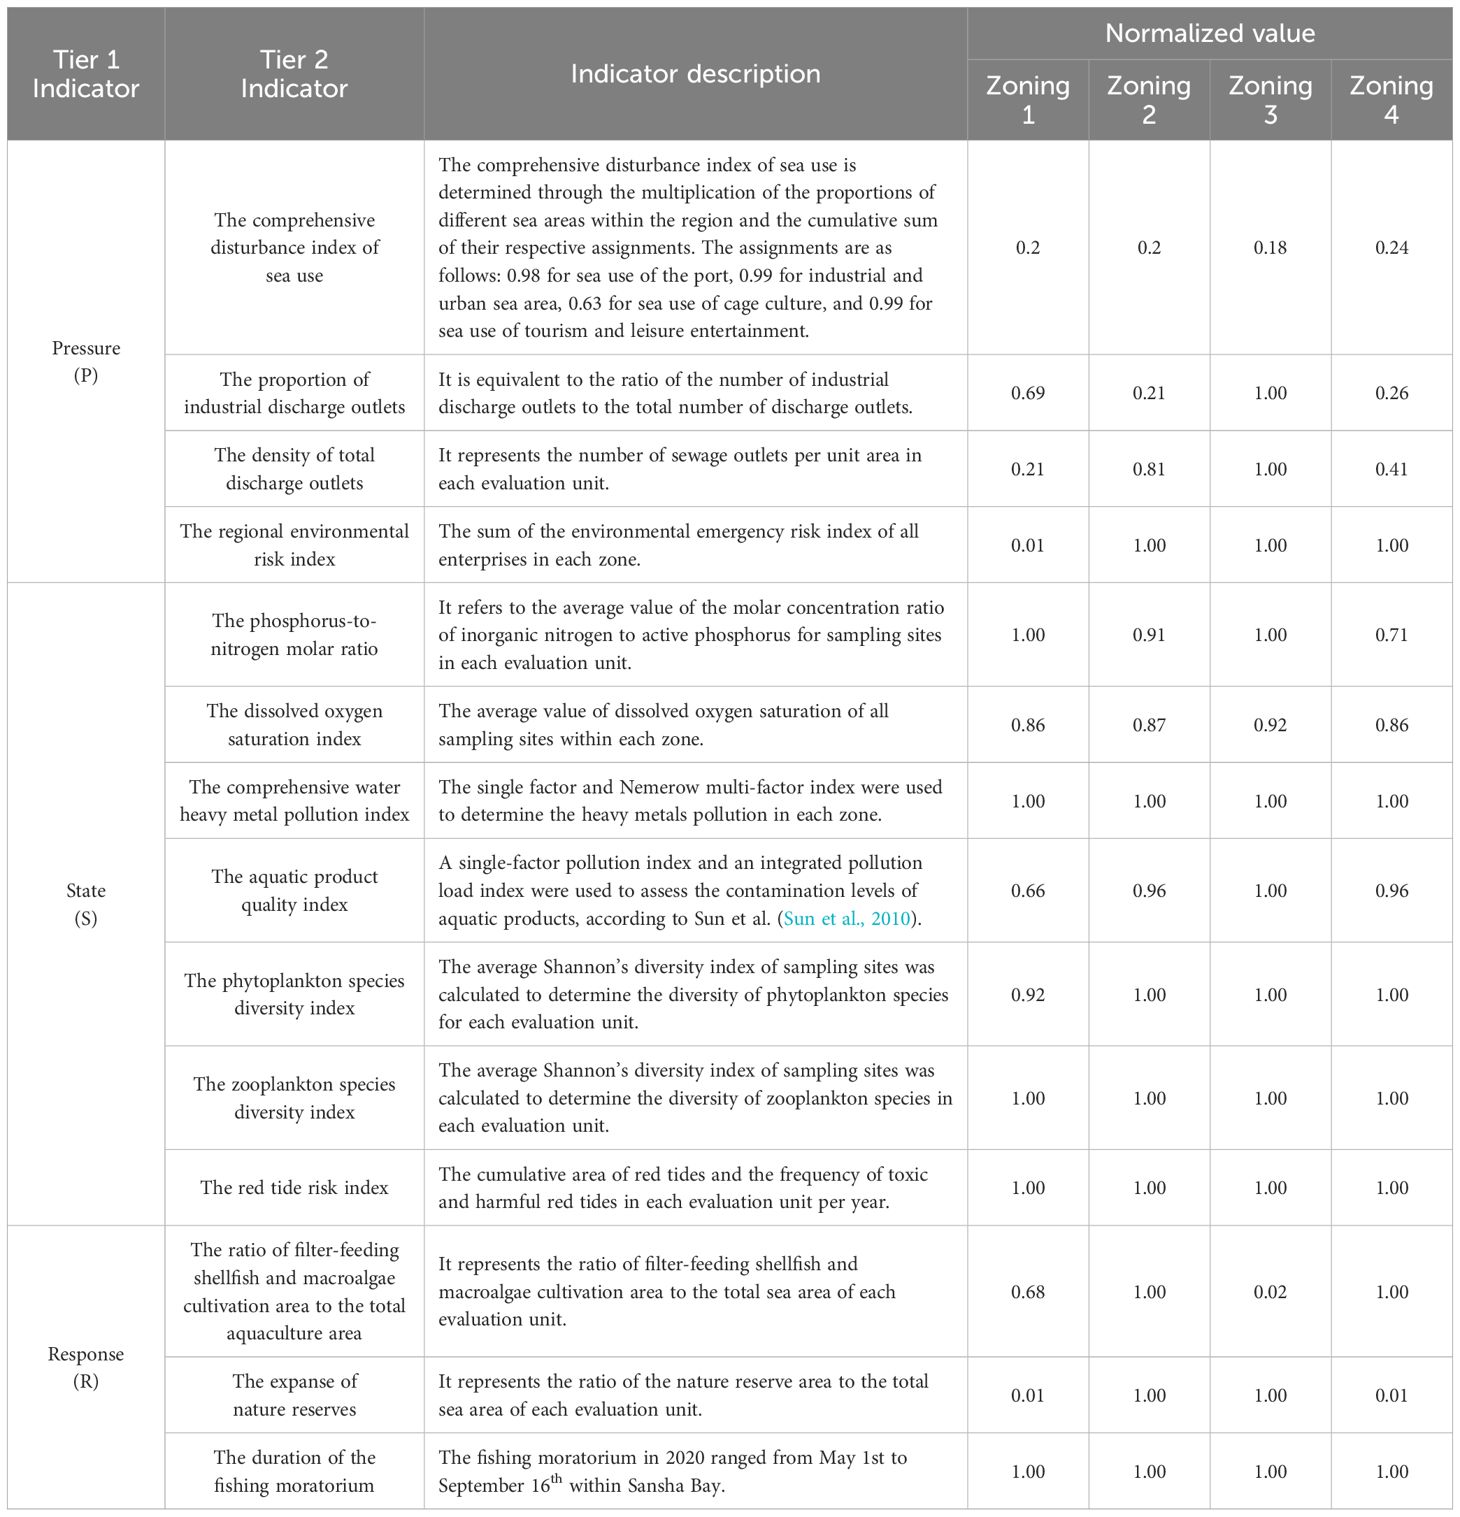
Table 1 Aquaculture bay ecosystem health evaluation index system.
The PSR indicator model operates under the premise of distinct causal relationships among all influencing factors (Sun et al., 2019). The model, structured around the “Pressure-State-Response” paradigm, comprises three interconnected components, each incorporating multiple secondary indicators (Figure 2). Data concerning these indicators were systematically gathered and organized for each zoning area within Sansha Bay.
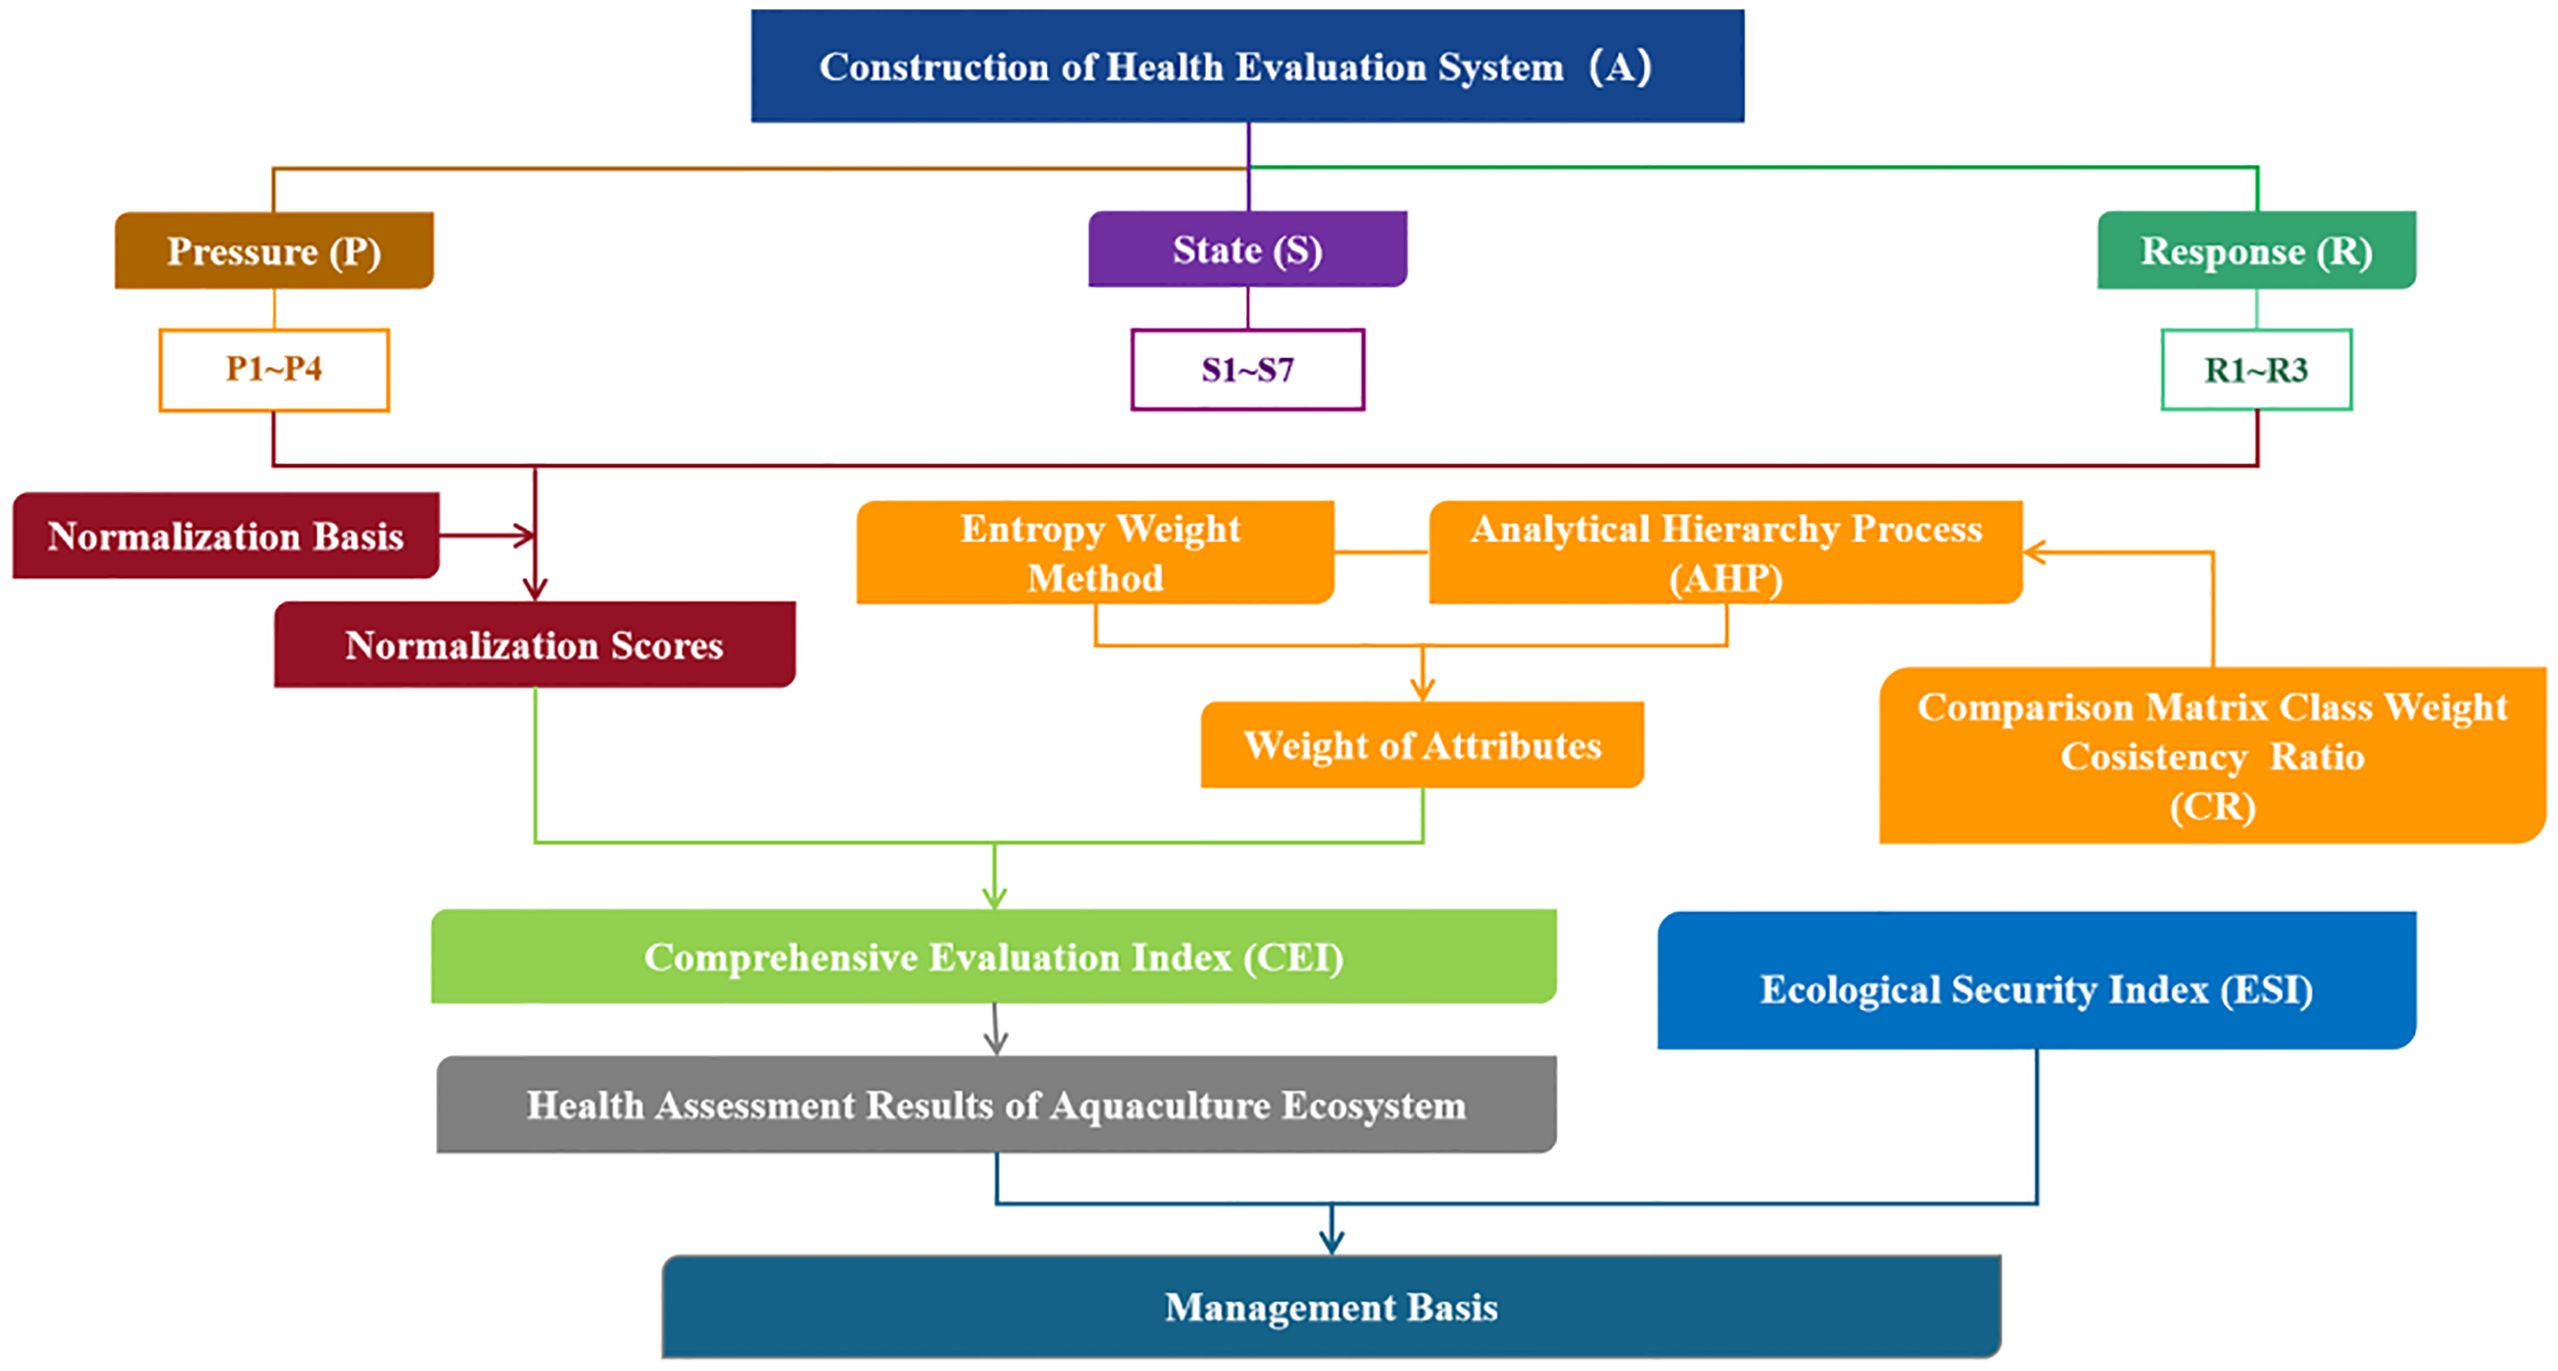
Figure 2 Multiple factors system framework of aquaculture ecosystem health assessment in Sansha Bay.
The “Pressure” layer delineates the influence and strain exerted by human activities on the fishery’s ecological environment. This layer comprises four key indicators: the comprehensive disturbance index of sea use (P1), the proportion of industrial discharge outlets (P2), the density of total discharge outlets (P3), and the regional environmental risk index (P4).
In contrast, the “State” layer showcases the present state and developmental patterns of the aquatic ecological environment within Sansha Bay. This layer encompasses seven indices: the phosphorus-to-nitrogen molar ratio (S1), dissolved oxygen saturation index (S2), comprehensive water heavy metal pollution index (S3), aquatic product quality index (S4), phytoplankton species diversity index (S5), the zooplankton species diversity index (S6), and the red tide risk index (S7).
The “Response” layer mirrors the strategies and regulations implemented to alleviate adverse impacts on the aquaculture ecosystem. It comprises three indicators: the ratio of filter-feeding shellfish and macroalgae cultivation area to the total aquaculture area (R1), the expanse of nature reserves (R2), and the duration of the fishing moratorium (R3).
Data standardization is imperative due to the diverse types, properties, and dimensions of evaluation indicators, resulting in a lack of comparability. To address this issue, data transform dimensionless values within the range of 0 to 1 through standardization procedures. Establishing suitable benchmark values is crucial for effective data standardization. In the context of assessing the health of aquaculture bay fishery habitats, these benchmark values are fluid and comparative, influenced by the ecosystem’s natural attributes and individuals’ cognitive perspectives and value orientations at a specific timeframe. This study, prioritizing practicality, utilizes the critical values from each index evaluation standard as reference points for the index when the pressure tends towards harmlessness, the state nears optimal health, and the response trends towards excellence.
The evaluation indicators are segregated into positive and negative categories, each having unique standardized representations.
For positive indicators [Equation (1)]:
For negative indicators [Equation (2)]:
In the equation, represents the standardized value of the evaluation index i factor, corresponds to the current value of the evaluation index i factor, and represents the reference value of the evaluation index i. When ≥ 1, the normalized value is 1; when < 1, the normalized value is .
Entropy functions as a metric that gauges the degree of organization within a system, enabling the evaluation of the informativeness present in gathered data and the determination of the significance of representative data. Widely utilized in water body assessments, this metric plays a pivotal role. The EW method is utilized to determine the weight value of evaluation factors. Specifically, as the statistical data variation for an evaluation factor increases, the contained information entropy decreases, resulting in a higher weight value for that factor. However, the entropy method’s calculation process necessitates adherence to certain foundational requirements. These requirements include managing negative and extreme values, which cannot be directly integrated into the computation. Therefore, this project implements an improved entropy method that standardizes negative and extreme values to establish the objective weight value of evaluation factors.
① Standardized value translation [Equation (3)]:
Xij is the index value after translation, and H is the amplitude of index translation, which is generally 0.01.
② The calculation of the information entropy value of the j index [Equations (4), (5)]:
k > 0, ej> 0. If Xij is all equal for a given j, then Pij=1/m, and ej takes the maximum value, that is, ej=k*lnm. If k=l/lnm, then ej=1, so 0≤ ej ≤1.
③ The j item refers to the determination of the weight of the table [Equations (6), (7)]:
④ Comprehensive evaluation index () calculation
Using the standardized values and index weights of the indicators mentioned above, we constructed the comprehensive evaluation index for ecological health assessment is aquaculture habitat zoning [Equation (8)]. This was achieved through weighted summation, allowing us to obtain the results of the habitat health assessment.
CEIEW is the comprehensive index of aquaculture bay ecosystem health evaluation, the value range is 0 ~ 1, n is the number of evaluation indexes, Wi is the weight of the i th index, and Ei is the standardized value of the i th index.
AHP is a semi-quantitative computational technique primarily utilized to analyze intricate problems featuring multiple objectives. This method is extensively applied in ecosystem health assessments. The process of employing AHP to ascertain index weights in ecological health evaluation entails several steps. Initially, a hierarchical model is formulated, whereby marine ecological experts are consulted to evaluate the relative significance and hierarchy of each layer of evaluation factors. Subsequently, a pairwise comparison matrix is created to assess factors within each layer. This matrix employs numerical scales ranging from 1 to 9 alongside their reciprocal values. By determining the maximum eigenvector of the matrix, the importance value of each evaluation factor layer can be derived, followed by a consistency evaluation.
The inception of the analysis involves dividing the research object into interconnected components and categorizing them based on their interrelationships. Subsequently, a hierarchical model is formulated to elucidate the connections among these factors. The layers comprising the target (A), criterion (B), and index (C) are sequentially defined. Elements within the criterion and index layers occupy lower levels and directly impact the corresponding upper-tier elements. The weight assigned to lower-level evaluation factors signifies their influence over their higher-level counterparts.
Firstly, each column of the judgment matrix is normalized to obtain the matrix [Equation (9)]:
Secondly, each type of normalized judgment matrix is added by rows to obtain a vector [Equation (10)]:
Then, the vector is normalized to obtain the feature vector [Equation (11)]:
Finally, the maximum eigenvalue of the judgment matrix is calculated [Equation (12)]:
To ensure the validity of the judgment matrix construction, it is crucial to examine its consistency. The specific calculation equation is [Equations (13), (14)]:
C.I. and C.R. are the consistency test indexes; λmax is the maximum eigenvalue; n is the order of the matrix; R.I. is the average random consistency index. It is generally believed that when C.R.<0.1, the consistency of the judgment matrix can pass the test, indicating that the judgment matrix is set reasonably. Otherwise, the judgment matrix should be corrected until it passes the consistency test.
Initiating from the target layer, the absolute weight of each element is established concerning the overall objective by computing the relative weight of each element layer by layer. The total weight of the target remains fixed at 1, and the relative weight of each lower-layer element is multiplied by the absolute weight of the upper-layer criterion to derive the absolute weight value for each element.
Finally, the comprehensive index (CEIAHP) was determined, aligning with the EW method.
In this study, based on the investigation and monitoring data, 10 experts who knew well about SanSha Bay were involved in the assessment, the expertise areas of these experts were mainly in marine environmental science, resources and environment, and aquaculture. Those experts were interviewed by an environmental management researcher, who introduced detailed knowledge of each indicator and made the experts extensively know this knowledge. The process was consulted as follows: Firstly, the experts compare any two item layers, including pressure, state, and response layers. Secondly, the experts compare between any two indicators in each layer.
The comprehensive health assessment index serves to appraise the health condition of the aquaculture ecosystem. This index is formulated through a fusion of the AHP and the EW method. The equation utilized for computing this index is as follows [Equation (15)]:
EHI is the comprehensive index. The values range from 0-1; a is the compromise coefficient of the comprehensive index, and the value in this study is 0.5. CEIi is the comprehensive index of the EW method, and CEIj is the comprehensive index of the AHP.
In this study, the health status of the aquaculture ecosystem in Sansha Bay is categorized into five grades: “excellent,” “good,” “fair,” “poor,” and “very poor.” This classification is based on a range of evaluation criteria for coastal marine ecosystem health and the specific conditions identified within the aquaculture bays, as illustrated in Table 2. Drawing from prior studies on ecosystem health assessment (Yang et al., 2018; Sun et al., 2019), these five grades were established on a scale of 0 to 1, with uniform intervals of 0.2, taking into account ecosystem stability (Table 2).
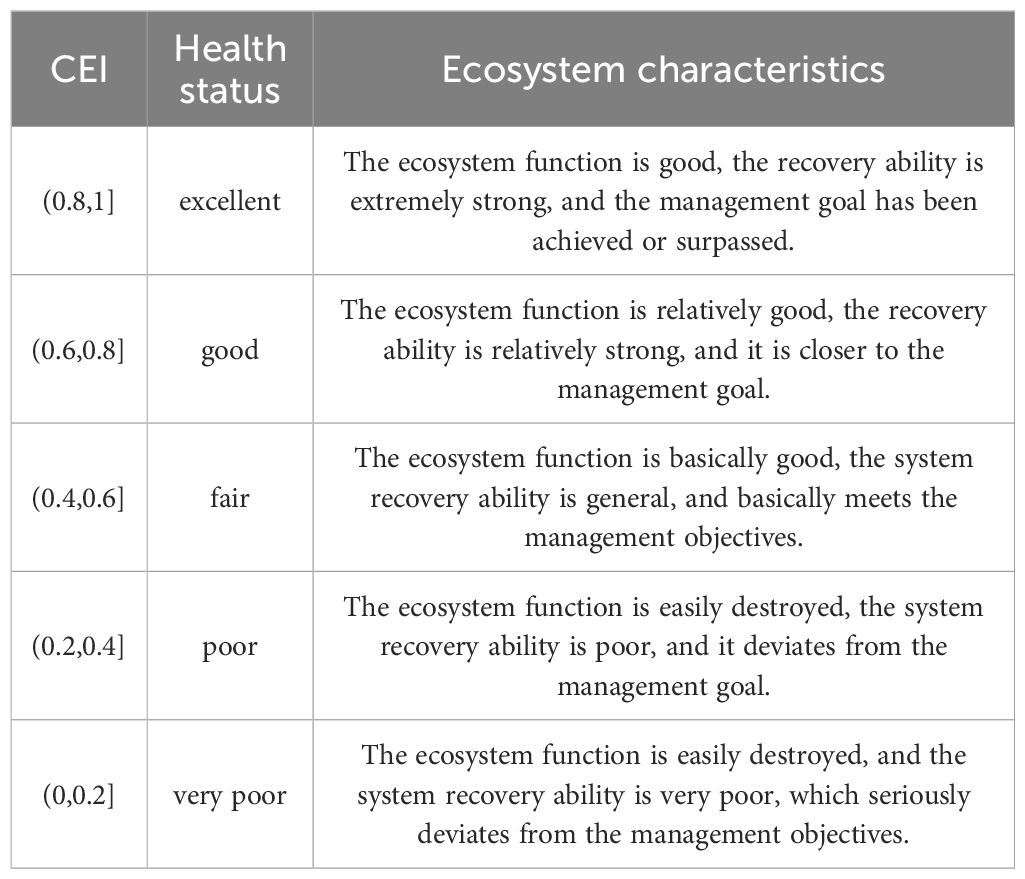
Table 2 Evaluation grade of health status for Sansha Bay.
Ecological security refers to the overall health and integrity of an ecological system, signifying its ability to uphold structural and functional stability (Wei et al., 2022) and its resilience against external pressures, serving as a gauge of its carrying capacity. The ecological security index (ESI) was computed using pressure, state, and response indices by Ma et al. (2019) and Sadeghi et al. (2023) through the formula provided below [Equation (16)].
Higher ESI values signify increased safety levels within the bay, necessitating lower priority for response interventions. With the incorporation of diverse ecological safety classification methodologies (Chen et al., 2023; Zhang F. et al., 2023; Zhang Y. et al., 2023) and aligning with the comprehensive evaluation grade of the bay ecosystem health, ecological safety levels are delineated into five grades within a scale of 0 to 1, evenly segmented in 0.2 intervals (Table 3).

Table 3 Evaluation grade of ecological security in Sansha Bay.
The eco-environment monitoring data utilized in this study, including inorganic nitrogen, active phosphorus, heavy metals, dissolved oxygen, phytoplankton species diversity, and zooplankton species diversity, were procured from the Fujian Fisheries Resources Monitoring Center’s records from 2021, with the sampling locations depicted in Figure 1. Sea-use data were sourced from the Marine Functional Zoning records of Fujian Province spanning 2011-2020. Details on sea discharge outlets in Ningde City were acquired from conducted surveys. The regional environmental risk index was computed by considering hazardous substance storage and critical quantities, adhering to the technical guidelines for environmental risk assessments on projects (HJ 169-2018) as outlined by the Ministry of Ecology and Environment of the People’s Republic of China. The hazardous substance storage data were extracted from the environmental impact assessment reports of major harbor industries. The cumulative area and frequency of toxic red tides and harmful red tides were extracted from the 2021 Bulletin of Fujian Marine Disaster (http://hyyyj.fujian.gov.cn/xxgk/tzgg/202212/t20221216_6080496.htm). The mariculture area in 2020 was determined through the analysis of Landsat multi-temporal remote sensing imagery. Information pertaining to nature reserves was retrieved from the Ningde Municipal People’s Government website (https://www.ningde.gov.cn/). Notably, a fishing moratorium was enforced from May 1st to September 16th 2020.
The calculation details for the assessment indexes using EW and APH methods are illustrated in Supplementary Tables S5–S7. The significance of the factor layers—pressure, state, and response—was established through the EW method, allocating weights of 50.52%, 27.97%, and 21.52%, respectively. Among the 14 indicators, the dissolved oxygen saturation index in the “state” layer and the size of nature reserves in the “response” layer wielded a more substantial impact on the evaluation compared to other metrics (Figure 3), with weights of 17.78% and 13.86%, respectively. Notably, in the “Pressure” layer, the proportion of industrial discharge outlets held the highest weight at 8.27%, while the regional environment risk index bore the smallest weight at 5.47%. Within the “State” layer, the dissolved oxygen saturation index dominated, coupled with the aquatic product quality index at 6.72%, with the red tide risk index holding no weight in the assessment. In the “Response” layer, the size of nature reserves carried the heaviest weight, and the duration of the fishing moratorium held no weight (0%).
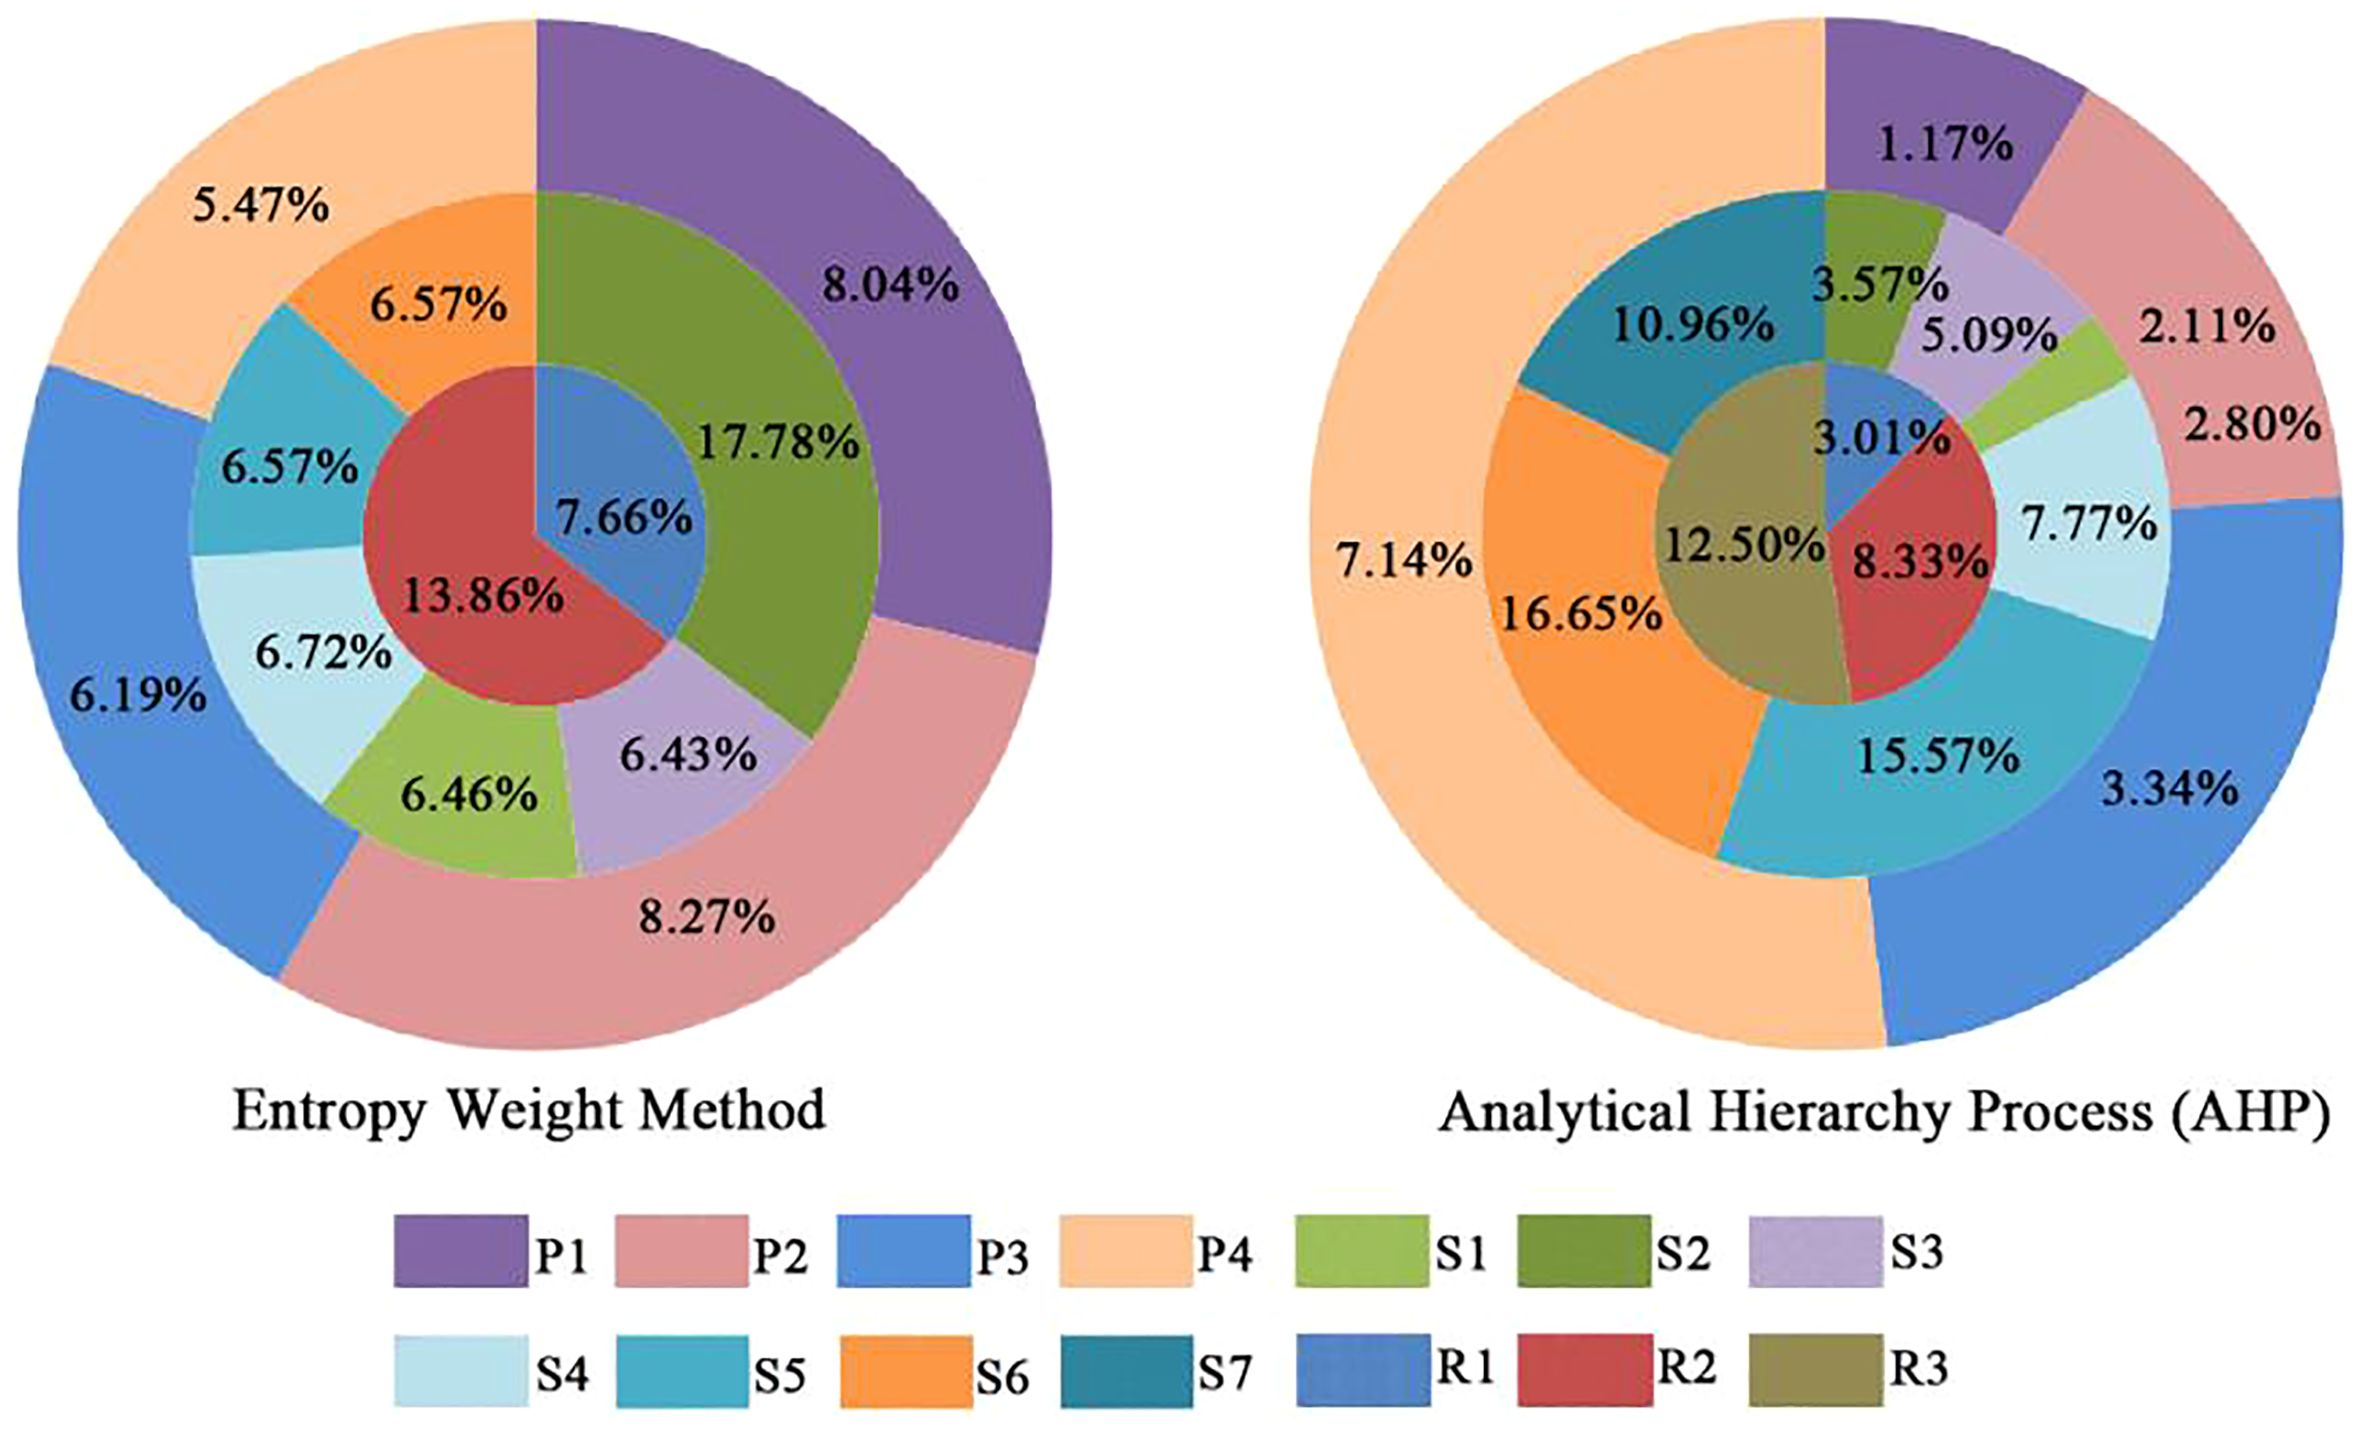
Figure 3 Entropy method and analytic hierarchy process index weight proportion diagram.
Employing the AHP method, the weights attributed to the three-factor layers were 13.76%, 63.39%, and 23.85%, respectively. Among the 14 indicators, the zooplankton species diversity index and the phytoplankton species diversity index within the “state” layer demonstrated a relatively higher impact on the assessment in comparison to other indicators (Figure 3), with weights of 16.65% and 15.57%, respectively. In the “Pressure” layer, the regional environment risk index carried the most weight at 7.14%, whereas the proportion of industrial discharge outlets held the lowest weight at 1.17%. Within the “State” layer, the zooplankton species diversity index held precedence, with the molar ratio of phosphorus and nitrogen exhibiting the minimal weight at 2.80%. Concluding in the “Response” layer, the duration of the fishing moratorium commanded the highest weight at 12.50%, while the ratio of the filter-feeding shellfish and macroalgae cultivation area to the total aquaculture area bore the lightest weight at 3.01%.
Utilizing the standardized values of indicators and weights derived from the EW and AHP methods, the ecosystem health assessment index for Sansha Bay was appraised in each zoning area (Figures 4A, B). The entropy method generated assessment index readings ranging from 0.58 to 0.84. The highest CEIEw value (0.84) was observed in Zoning 3, followed by Zoning 2 (0.82), indicating that Zoning 3 and Zoning 2 achieved an “excellent” health status. Zoning 4 exhibited a commendable health status with a comprehensive index of 0.65. Conversely, Zoning 1, located in the estuary zone, obtained the lowest assessment index of 0.58, warranting a classification of “fair” health (Figure 4A). By contrast, results from the AHP method unveiled assessment index values spanning from 0.75 to 0.96. The distribution trend of CEIAHP values among the four zones was similar to CEIEw values. Generally, Zoning 2, 3, and 4 were all designated as “excellent,” while Zoning 1 was rated as “good” (Figure 4B).
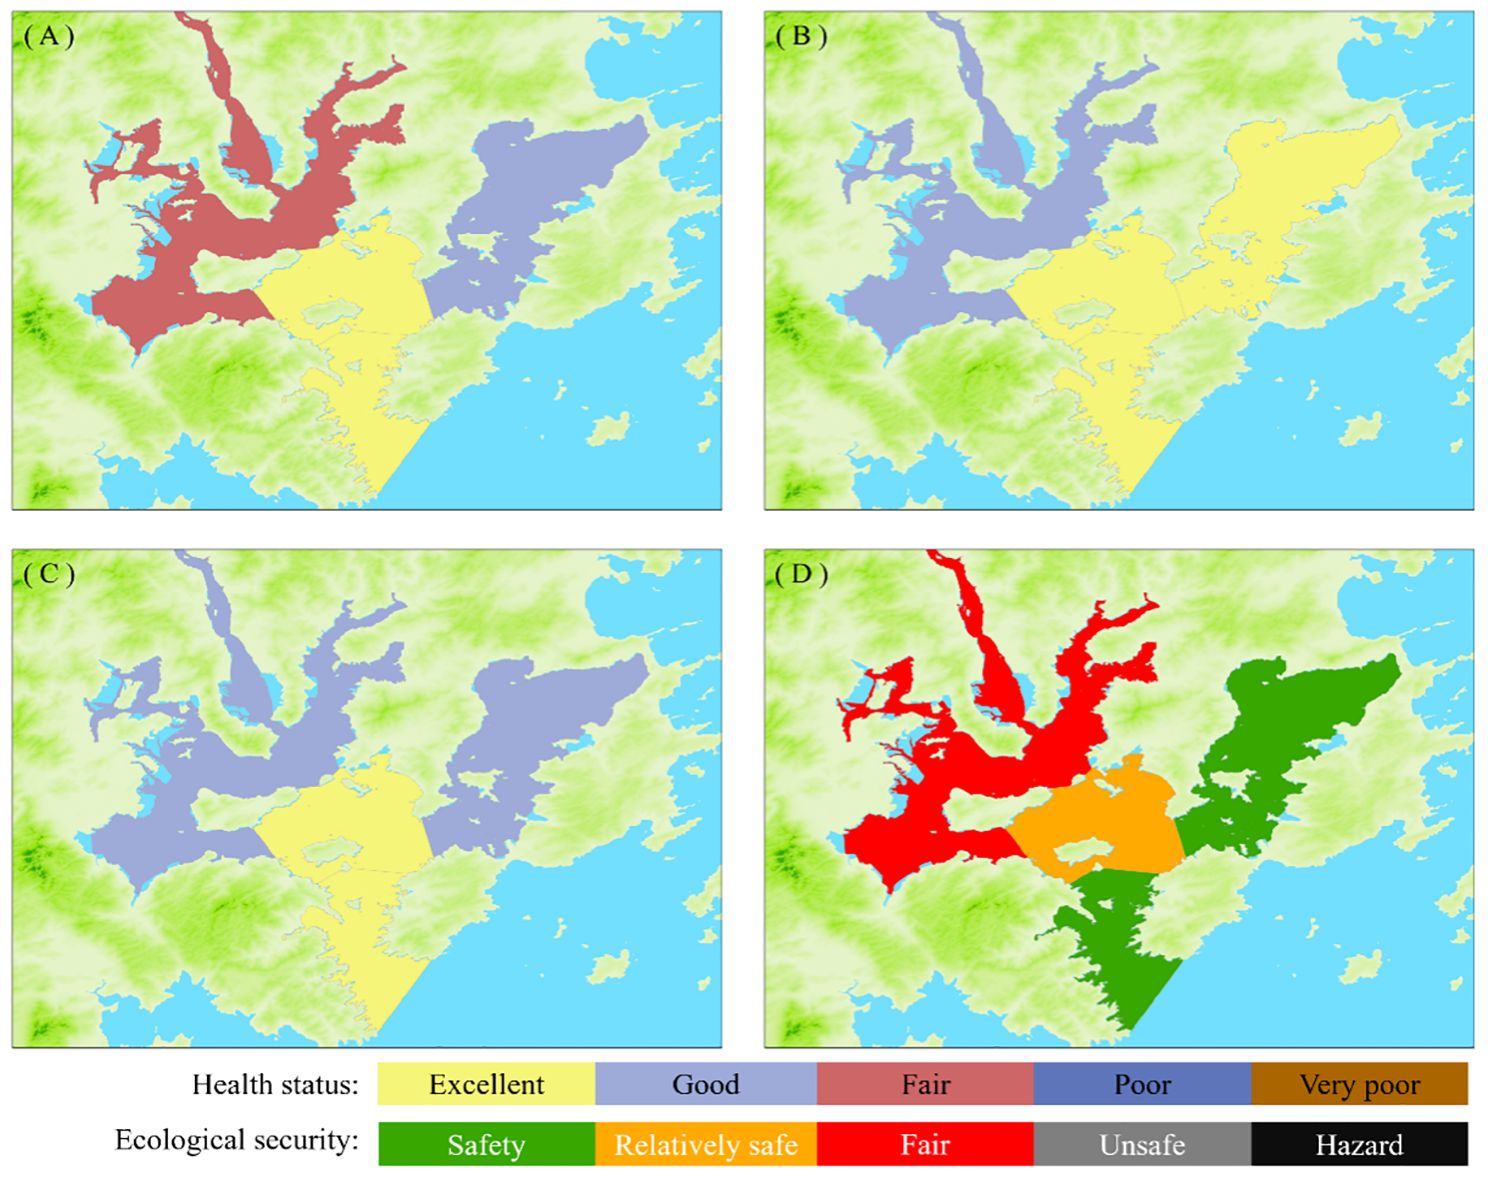
Figure 4 Health assessment and ecological security assessment for Sansha Bay. Panels (A–D) represent the results of the entropy method, analytic hierarchy process, comprehensive weight method, and ecological security assessment, respectively.
Significant divergences emerged in the assessment outcomes between the EW and AHP methods, prompting the calculation of CEI values to furnish a more holistic evaluation of Sansha Bay’s health status. The CEI values for Zoning 1, Zoning 2, Zoning 3, and Zoning 4 were ascertained as 0.67, 0.89, 0.90, and 0.75, respectively. Zoning 3 had the highest CEI value, and Zoning 1 obtained the lowest value. Zoning 2 and Zoning 3 were lauded as “excellent” in their health status, while Zoning 1 and Zoning 4 were appraised as “good” (Figure 4C). Nonetheless, disparities in health status persist across different areas. In general, the final ecosystem health assessment of Sansha Bay indicates that the fishery habitat in the bay is predominantly in good condition, affirming its continued suitability for aquaculture.
In delving into a deeper comprehension of the spatial distribution pattern of ecological security within Sansha Bay, the ESI was computed for each zoning area. The ecological security statuses of the four zones in Sansha Bay are presented in Figure 4D. Zoning 3 and Zoning 4 secured ESI values of 1.09 and 0.99, respectively, signifying high ecological security levels. Zoning 2 exhibited a comparatively secure ESI value of 0.61. In contrast, Zoning 1 recorded the lowest ESI value at 0.51, indicating a moderate level of ecological security classified as “fair”.
The overall health status of the aquaculture bay ecosystem aligns with prevailing management objectives (3.2. section). However, upon scrutinizing the ecological security assessment, Zoning 1 emerged with a fair status, characterizing it as particularly fragile and under significant human activity pressures. Given that Sansha Bay is a semi-enclosed bay with limited water exchange capacity, notably in Zoning 1, an imperative emerges to bolster management practices to mitigate land-based pollution and environmental risks stemming from harbor industries in Zoning 1. According to the health status of Zoning 4, constant refinement of aquaculture sea use, cultivation models, and stocking density is advised for this region.
Numerous frameworks are available for assessing the health of bay ecosystems; however, due to variations in research inquiries, objectives, and regional attributes, no single framework universally fits all studies or bays. Previous research has showcased marked differences in indicator selection, analytical methodologies, and assessment priorities (Zhang R. et al., 2023; Zhang Y. et al., 2023). Despite this, until recently, there has been a lack of indicator systems designed explicitly for aquaculture bay ecosystems. To address the attributes of Sansha Bay, a multi-tiered indicator system featuring 14 indicators was established. Although previous studies have also suggested that human activities are important factors affecting the health of the bay ecosystem, and factors associated with landscape pattern, pollutant discharge into the sea, and socio-economic situation were often chosen (Yu et al., 2014; Wu et al., 2023). With the rapid development of the port industry, some chemicals may be released or leaked during production, use, storage, disposal, and recycling processes, posing certain environmental pressures on the aquatic ecology and product safety of the bay. However, existing studies rarely use the environmental risk index as an evaluation index. In addition, in recent years, aquaculture in China has been restricted and the suitable aquaculture area was shrinking (Long et al., 2024), ascribed to the acceleration of coastal urbanization and industrialization combined with the ecology and environment protection of coastal zone. The impacts of human activities on marine ecosystems generally vary in space, implying that ecosystem health evaluation of the aquaculture bay based on the smaller evaluation unit is necessary. Until recently, the entire bay has been considered as a single evaluation unit in the majority of current studies related to the bay ecosystem health (Yu et al., 2014; Yu et al., 2022; Wu et al., 2023). This study proposed for the first time to carry out an ecosystem health assessment based on fishery habitat zoning in China. The formulated evaluation index system in this study can act as a supplemental tool for health assessments of other aquaculture bays.
The key influencing factors can be identified according to the weight value of pressure, state, and response layers. The average weight values of these three target layers determined by EH and APH methods were 32.14%, 45.68%, and 22.69%, respectively. This indicated that the key influencing factors are mostly in the pressure and state layers.
In the pressure layer, the regional environmental risk index (P4) had the highest average weight value, followed by the proportion of industrial discharge outlets (P2). This suggests that the convergence of land-based contamination, rapid coastal urban expansion, industrial advancement collectively will influence the stability and well-being of the ecosystem (Lin et al., 2023). The pressure index values across the four zones spanned from 0.24 to 0.85, with Zoning 1 displaying the lowest and Zoning 3 the highest value (Supplementary Figure S1). The notably low-pressure index in Zoning 1 signifies a subpar health status, reflecting a substantial threat to the ecosystem in this zone (Newton and Weichselgartner, 2014; Sun et al., 2019). The accelerated growth of the harbor industry has heightened the occurrence of ecological mishaps like hazardous chemical pollutants leaking into nearby waters, posing certain environmental pressures on the aquatic ecology and product safety. In contrast to the other three zones, Zoning 3 maintained a relatively healthy status in pressure layer. It might be ascribed to the fact that Zoning 3 situated at the bay mouth, experiences minimal influences from land-based human activities on the regional marine ecosystem.
Among the 7 indicators within state layer, the zooplankton species diversity index (S6) carried the heaviest average weight, followed by the phytoplankton species diversity index (S5). The species diversity of biological communities is an important aspect for diagnosis of habitat degradation in marine ecosystem (Yu et al., 2014). In this study, the diversity index values of phytoplankton and zooplankton generally met the evaluation criteria of good or excellent grade. Previous study also declared that as of 2019 the ecosystem’s primary productivity was still redundant in Sansha Bay (Xie et al., 2022). These outcomes collectively suggest that the current state of the aquatic ecological environment in Sansha Bay aligns with aquaculture standards. However, the quantity of bivalve-macroalgae polyculture has expanded in recent decades, which might pose potential negative impacts on ecological functions and trophic connectivity (Xie et al., 2021). Thus, more scientific evaluation of the breeding capacity and more reasonable aquaculture layout warrant to make the aquaculture ecosystem more resilient and stable. The molar ratio of phosphorus and nitrogen was also an important influencing factor, with the average weight exceeding one-ten of the total weight. In Zoning 4, the molar ratio of phosphorus and nitrogen fell below the requisite cellular ratio of 16:1 (Downing, 1997), while exceeding this ratio in Zoning 1, 2, and 3. This finding underscores the potential adverse impacts and highlight the importance of controlling excessive nitrogen and phosphorus inputs to safeguard the sustainable progression of cage aquaculture in the region (Cai et al., 2007).
The average comprehensive score for the “response” indicator registered at 0.67, implying a “good” health status (Supplementary Figure S1). This signifies that ecosystem managers and decision-makers overseeing Sansha Bay have enacted responsive measures (Sun et al., 2019), such as establishing reserves, adjusting cultivation patterns and species, and enforcing a fishing moratorium. Nonetheless, substantial score contrasts are evident among the diverse zones. Consequently, Zoning 3 displayed the highest health status within the response layer, while Zoning 1 achieved a fair status. The expanse of nature reserves (R2) held the second highest weight among 14 indicators. However, the current protected zones primarily concentrate in Zoning 2 and Zoning 3. This would be the main reason for the obvious spatial difference in the health status within the response layer.
Despite significant efforts, this study is not devoid of inevitable limitations. PSR framework model has been adopted in this study, due to its simplicity, intuitiveness, and user-friendly nature. However, this model mainly focuses on environmental indicators (Huang et al., 2016), and is not suitable for evaluation units with large spatial scales, large impacts, and large spatial variability (Wen and Hou, 2021). The more number of influencing factors selected and more complex ecosystem evaluated, the larger uncertainties introduced. Nonetheless, methods of AHP and EW methods were combined to minimize the influence of subjective factors on the relative importance of each indicator. But, the survey data collected from 10 experts showed great variation, which might be ascribed to differences in their research areas and focus. In order to reduce the uncertainty of subjective judgments, it is necessary to invite more experts with professional knowledge and experience to participate in the survey in subsequent research. In addition, security index has been widely used in watershed security assessment. The ESI value was calculated by dividing the product of state (S) in response (R) index to pressure (P) index. The uncertainty may be amplified, which would affect the accuracy and rationality of the results. Systematical uncertainty analysis warrants in subsequent research.
A comprehensive ecosystem health index system encompasses a multitude of factors, embracing both biophysical and socioeconomic dimensions. The indicators selected in this study based on PSR model majorly dominated by environmental indicators. Thus, the evaluation results might ignore the impact of human economic and social activities on social system and ecological systems in Sansha Bay to a certain extent. In addition, while striving to select data encompassing the four zones of Sansha Bay to establish the evaluation index system, certain crucial data or indicators, such as Larimichthys crocea abundance or biomass and sediment monitoring data, were omitted due to data unavailability. This omission underscores certain constraints on the precision of the assessment framework. Meanwhile, the impacts of natural and anthropogenic activities on bay ecosystem health can vary temporally and spatially. For instance, diverse mariculture species exhibit distinct culture cycles, and distinct environmental impacts are witnessed across seasons. Thus, the temporal fluctuation of ecosystem health warrants comprehensive evaluation in subsequent research.
This study introduced a “Pressure-State-Response” framework combining with the AHP and EW methods to assess the ecosystem health of Sansha Bay. The result revealed that the health status across four zones in 2020, categorized as “good” or “excellent”, indicating that the overall ecosystem health of Sansha Bay aligns with prevailing management objectives. However, the security index was more spatially distributed and classified from “fair” to “safety”. It can be implied from the result that the ecosystem health of Sansha Bay is under some degree of threat from human activities. Key indicators critical to sustaining the health of the aquaculture bay ecosystem included the regional environmental risk index, the proportion of industrial discharge outlets, the zooplankton species diversity index, the phytoplankton species diversity index, the molar ratio of phosphorus to nitrogen, and the size of nature reserves. According to the assessments of ecosystem health and ecological security, vigorous endeavors in aquatic ecology are paramount to ensure the enduring sustainability of aquaculture, with a specific emphasis on Zoning 1 and Zoning 4. Nonetheless, the findings contribute not only to enhancing and broadening aquaculture bay ecosystem health assessment methodologies but also furnish valuable theoretical underpinning for high-quality development in the aquaculture industry in Sansha Bay. It should be noted that some issues, such as systematical uncertainty analysis, more data availability, and temporal evaluation of ecosystem health, are expected to be addressed in subsequent research.
The original contributions presented in the study are included in the article/Supplementary Material. Further inquiries can be directed to the corresponding authors.
YL: Conceptualization, Data curation, Investigation, Methodology, Software, Writing – original draft, Writing – review & editing. YH: Conceptualization, Data curation, Funding acquisition, Project administration, Supervision, Writing – review & editing. XZ: Data curation, Investigation, Methodology, Software, Writing – original draft. YJ: Data curation, Investigation, Methodology, Software, Writing – review & editing. XJ: Data curation, Investigation, Software, Writing – review & editing. YD: Data curation, Investigation, Software, Writing – review & editing. RL: Data curation, Project administration, Supervision, Validation, Writing – review & editing. DJ: Data curation, Project administration, Supervision, Validation, Writing – review & editing. JM: Data curation, Funding acquisition, Project administration, Supervision, Validation, Writing – review & editing.
The author(s) declare financial support was received for the research, authorship, and/or publication of this article. This research was supported by the Science and Technology Innovation Project of Natural Resources of Fujian Province (NO.KY-080000-04-2022-007), the Talent Introduction Pre-research Project of Minjiang University (MJY20015), the Special Fund for Marine Development of Fujian Province (NO. FUHJF-2022-12).
We thank the Fujian Fisheries Resources Monitoring Center for the help with data collection.
The authors declare that the research was conducted in the absence of any commercial or financial relationships that could be construed as a potential conflict of interest.
All claims expressed in this article are solely those of the authors and do not necessarily represent those of their affiliated organizations, or those of the publisher, the editors and the reviewers. Any product that may be evaluated in this article, or claim that may be made by its manufacturer, is not guaranteed or endorsed by the publisher.
The Supplementary Material for this article can be found online at: https://www.frontiersin.org/articles/10.3389/fmars.2024.1396026/full#supplementary-material
Ai B., Wang P., Yang Z., Tian Y., Liu D. (2023). Spatiotemporal dynamics analysis of aquaculture zones and its impact on green tide disaster in Haizhou Bay, China. Mar. Environ. Res. 183, 105825. doi: 10.1016/j.marenvres.2022.105825
Borja A., Elliott M., Andersen J. H., Berg T., Carstensen J., Halpern B. S., et al. (2016). Overview of integrative assessment of marine systems: the ecosystem approach in practice. Front. Mar. Sci. 3, 20. doi: 10.3389/fmars.2016.00020
Cai Q., Du Q., Qian X. (2007). Study on marine ecological environment of Sansha Bay in Fujian. Environ. Monit. China 23, 101–105. doi: 10.19316/j.issn.1002-6002.2007.06.028
Chang Y. Q., Chen J. X. (2008). “The status of mariculture in northern China,” in FAO/NACA Regional Workshop on the Future of Mariculture: a Regional Approach for Responsible Development in the Asia-Pacific Region. FAO Fisheries Proceedings, ed. A. Lovatelli, M.J. Phillips, J.R. Arthur and K. Yamamoto, 7–11 March 2006. Rome, FAO. (Guangzhou, China), 271–284.
Chen D., Guo K., Zeng W., Wang F., Li L., Jin X. (2023). Study on the spatial-temporal patterns and evolution characteristics of ecological security based on dynamic evaluation in the Three Gorges Reservoir Area. Ecol. Indic. 151, 110297. doi: 10.1016/j.ecolind.2023.110297
Chi Y., Zheng W., Shi H., Sun J., Fu Z. (2018). Spatial heterogeneity of estuarine wetland ecosystem health influenced by complex natural and anthropogenic factors. Sci. Total Environ. 634, 1445–1462. doi: 10.1016/j.scitotenv.2018.04.085
Costanza R. (1997). “Toward and operational definition of ecosystem health,” in Frontiers in Ecological Economics (Cheltenham, United Kingdom: Edward Elgar Publishing), 75–92. doi: 10.4337/9781035303427
Devlin M. J., Lyons B. P., Bacon J., Edmonds N., Tracey D., Al Zaidan A. S., et al. (2019). Principles to enable comprehensive national marine ecosystem status assessments from disparate data: The state of the marine environment in Kuwait. Estuar. Coast. Shelf Sci. 230, 106407. doi: 10.1016/j.ecss.2019.106407
Downing J. A. (1997). Marine nitrogen: phosphorus stoichiometry and the global N: P cycle. Biogeochemistry 37, 237–252. doi: 10.1023/A:1005712322036
Fairchild E. A., Siceloff L., Howell W. H., Hoffman B., Armstrong M. P. (2013). Coastal spawning by winter flounder and a reassessment of essential fish habitat in the Gulf of Maine. Fish. Res. 141, 118–129. doi: 10.1016/j.fishres.2012.05.007
Fu X. M., Liu G. J., Liu Y., Xue Z. K., Chen Z., Jiang S. S., et al. (2021). Evaluation of the implementation of marine functional zoning in China based on the PSR-AHP model. Ocean Coast. Manage. 203, 105496. doi: 10.1016/j.ocecoaman.2020.105496
Gari S. R., Newton A., Icely J. D. (2015). A review of the application and evolution of the DPSIR framework with an emphasis on coastal social-ecological systems. Ocean Coast. Manage. 103, 63–77. doi: 10.1016/j.ocecoaman.2014.11.013
Halpern B. S., Frazier M., Potapenko J., Casey K. S., Koenig K., Longo C., et al. (2015). Spatial and temporal changes in cumulative human impacts on the world’s ocean. Nat. Commun. 6, 1–7. doi: 10.1038/ncomms8615
Hazbavi Z., Keesstra S. D., Nunes J. P., Baartman J. E. M., Gholamalifard M., Sadeghi S. H. (2018). Health comparative comprehensive assessment of watersheds with different climates. Ecol. Indic. 93, 781–790. doi: 10.1016/j.ecolind.2018.05.078
Hazbavi Z., Sadeghi S. H., Gholamalifard M. (2019). Dynamic analysis of soil erosion-based watershed health. Geogr. Environ. Sustain. 12, 43–59. doi: 10.24057/2071-9388-2018-58
Huang Y., Li Y., Cheng Z., Li R., Chen H., Mu J. (2023). Spatiotemporal distributions of nutrients and their potential influencing factors in Sansha bay. Mar. Environ. Sci. 42, 440–448. doi: 10.13634/j.cnki.mes.2023.03.011
Huang J., Li Q., Tu Z., Pan C., Zhang L., Ndokoye P., et al. (2013). Quantifying land-based pollutant loads in coastal area with sparse data: Methodology and application in China. Ocean Coast. Manage. 81, 14–28. doi: 10.1016/j.ocecoaman.2012.07.011
Huang B., Wei N. A., Meng W., Zhang M. (2016). Marine biodiversity evaluation based on the pressure-state-response (PSR) model of Changhai County, Liaoning Province. Biodivers. Sci. 24, 48–54. doi: 10.17520/biods.2015159
Huo Y., Wei Z., Liu Q., Yang F., Long L., Zhang Q., et al. (2018). Distribution and controlling factors of phytoplankton assemblages associated with mariculture in an eutrophic enclosed bay in the East China Sea. Acta Oceanol. Sin. 37, 102–112. doi: 10.1007/s13131-018-1238-9
Jiang Y., Yin G., Hou L., Liu M., Zheng Y., Han P., et al. (2021). Marine aquaculture regulates dissimilatory nitrate reduction processes in a typical semi-enclosed bay of southeastern China. J. Environ. Sci. 104, 376–386. doi: 10.1016/j.jes.2020.12.025
Li H., Li X., Li Q., Liu Y., Song J., Zhang Y. (2017). Environmental response to long-term mariculture activities in the Weihai coastal area, China. Sci. Total Environ. 601, 22–31. doi: 10.1016/j.scitotenv.2017.05.167
Li X., Yu R., Geng H., Li Y. (2021). Increasing dominance of dinoflagellate red tides in the coastal waters of Yellow Sea, China. Mar. pollut. Bull. 168, 112439. doi: 10.1016/j.marpolbul.2021.112439
Liao C., Yue Y., Wang K., Fensholt R., Tong X., Brandt M. (2018). Ecological restoration enhances ecosystem health in the karst regions of southwest China. Ecol. Indic. 90, 416–425. doi: 10.1016/j.ecolind.2018.03.036
Lin H., Chen Z., Hu J., Cucco A., Zhu J., Sun Z., et al. (2017). Numerical simulation of the hydrodynamics and water exchange in Sansha Bay. Ocean Eng. 139, 85–94. doi: 10.1016/j.oceaneng.2017.04.031
Lin Y., Chen Q., Huang F., Xue X., Zhang Y. (2023). Identifying ecological risk and cost-enefit value for supporting habitat restoration: a case study from Sansha Bay, southeast China. Ecol. Process. 12, 1–15. doi: 10.1186/s13717-023-00432-1
Long L. N., Liu H., Cui M. C., Zhang C. L., Liu C. (2024). Offshore aquaculture in China. Rev. Aquacult. 16, 254–270. doi: 10.1111/raq.12837
Lyu H., Song D., Zhang S., Wu W., Bao X. (2022). Compound effect of land reclamation and land-based pollutant input on water quality in Qinzhou Bay, China. Sci. Total Environ. 826, 154183. doi: 10.1016/j.scitotenv.2022.154183
Ma L., Bo J., Li X., Fang F., Cheng W. (2019). Identifying key landscape pattern indices influencing the ecological security of inland river basin: The middle and lower reaches of Shule River Basin as an example. Sci. Total Environ. 674, 424–438. doi: 10.1016/j.scitotenv.2019.04.107
Martins J. H., Camanho A. S., Gaspar M. B. (2012). A review of the application of driving forces–Pressure-State-Impact-Response framework to fisheries management. Ocean Coast. Manage. 69, 273–281. doi: 10.1016/j.ocecoaman.2012.07.029
Moore C., Drazen J. C., Radford B. T., Kelley C., Newman S. J. (2016). Improving essential fish habitat designation to support sustainable ecosystem-based fisheries management. Mar. Policy 69, 32–41. doi: 10.1016/j.marpol.2016.03.021
Newton A., Weichselgartner J. (2014). Hotspots of coastal vulnerability: A DPSIR analysis to find societal pathways and responses. Estuar. Coast. Shelf Sci. 140, 123–133. doi: 10.1016/j.ecss.2013.10.010
Pan Z., He J., Liu D., Wang J., Guo X. (2021). Ecosystem health assessment based on ecological integrity and ecosystem services demand in the Middle Reaches of the Yangtze River Economic Belt, China. Sci. Total Environ. 774, 144837. doi: 10.1016/j.scitotenv.2020.144837
Qian L., Wang F., Cao W., Ding S., Cao W. (2023). Ecological health assessment and sustainability prediction in coastal area: A case study in Xiamen Bay, China. Ecol. Indic. 148, 110047. doi: 10.1016/j.ecolind.2023.110047
Rapport D. J., Maffi L. (2011). Eco-cultural health, global health, and sustainability. Ecol. Res. 26, 1039–1049. doi: 10.1007/s11284-010-0703-5
Ren Y., Zhang F., Li J., Zhao C., Jiang Q., Cheng Z. (2022). Ecosystem health assessment based on AHP-DPSR model and impacts of climate change and human disturbances: a case study of Liaohe River Basin in Jilin Province, China. Ecol. Indic. 142, 109171. doi: 10.1016/j.ecolind.2022.109171
Roy S., Pandit S., Papia M., Rahman M. M., Hossain M. S. (2021). Coastal erosion risk assessment in the dynamic estuary: the Meghna estuary case of Bangladesh coast. Int. J. Disast. Risk Re. 61, 102364. doi: 10.1016/j.ijdrr.2021.102364
Sadeghi S. H., Chamani R., Silabi M. Z., Tavosi M., Katebikord A., Darvishan A. K., et al. (2023). Watershed health and ecological security zoning throughout Iran. Sci. Total Environ. 905, 167123. doi: 10.1016/j.scitotenv.2023.167123
SOA. (2005). The Guidance for the Assessment of Coastal Marine Ecosystem Health (Beijing: Publication by the State Oceanic Administration of the People’s Republic of China).
Song D., Gao Z., Zhang H., Xu F., Zheng X., Ai J., et al. (2017). GIS-based health assessment of the marine ecosystem in Laizhou Bay, China. Mar. pollut. Bull. 125, 242–249. doi: 10.1016/j.marpolbul.2017.08.027
Song Y., Li M., Fang Y., Liu X., Yao H., Fan C., et al. (2023). Effect of cage culture on sedimentary heavy metal and water nutrient pollution: Case study in Sansha Bay, China. Sci. Total Environ. 899, 165635. doi: 10.1016/j.scitotenv.2023.165635
Song N., Wang N., Lin W. (2022). Assessment of the impact of artificial island airport reclamation on marine ecosystem health: A case study of the Dalian offshore airport, China. Ocean Coast. Manage. 226, 106281. doi: 10.1016/j.ocecoaman.2022.106281
Sun J., Gu X. Y., Zhang A. Q., Wang X. (2010). Organism qualities and pollution assessment at the Yellow Sea of Jiangsu Province. Mar. Sci. 34, 28–33. doi: 1000-3096(2010)06-0028-06
Sun B., Tang J., Yu D., Song Z., Wang P. (2019). Ecosystem health assessment: A PSR analysis combining AHP and FCE methods for Jiaozhou Bay, China1. Ocean Coast. Manage. 168, 41–50. doi: 10.1016/j.ocecoaman.2018.10.026
Tian P., Li J., Cao L., Pu R., Gong H., Liu Y., et al. (2021). Impacts of reclamation derived land use changes on ecosystem services in a typical gulf of eastern China: A case study of Hangzhou bay. Ecol. Indic. 132, 108259. doi: 10.1016/j.ecolind.2021.108259
Valavanis V. D., Georgakarakos S., Kapantagakis A., Palialexis A., Katara I. (2004). A GIS environmental modelling approach to essential fish habitat designation. Ecol. Modell. 178, 417–427. doi: 10.1016/j.ecolmodel.2004.02.015
Wei Q., Halike A., Yao K., Chen L., Balati M. (2022). Construction and optimization of ecological security pattern in Ebinur Lake Basin based on MSPA-MCR models. Ecol. Indic. 138, 108857. doi: 10.1016/j.ecolind.2022.108857
Wen J., Hou K. (2021). Research on the progress of regional ecological security evaluation and optimization of its common limitations. Ecol. Indic. 127, 107797. doi: 10.1016/j.ecolind.2021.107797
Wu W., Hu J., Song D. (2023). Assessment of marine ecosystem health and its key influencing factors in Laizhou Bay, China. Front. Mar. Sci. 10, 1–15. doi: 10.3389/fmars.2023.1115896
Xie B., Huang C., Wang Y., Zhou X., Peng G., Tao Y., et al. (2021). Trophic gauntlet effects on fisheries recovery: a case study in Sansha Bay, China. Ecosyst. Heal. Sustain. 7, 1965035. doi: 10.1080/20964129.2021.1965035
Xie B., Zhou X., Huang L., Zheng X., Du J., Yu W., et al. (2022). The ecological functions and risks of expansive bivalve-macroalgae polyculture: A case study in Sansha Bay, China. Aquaculture 560, 738549. doi: 10.1016/j.aquaculture.2022.738549
Xu F., Dawson R. W., Tao S., Cao J., Li B. (2001). A method for lake ecosystem health assessment: an Ecological Modeling Method (EMM) and its application. Hydrobiologia 443, 159–175. doi: 10.1023/A:1017564608126
Xu W., He M., Meng W., Zhang Y., Yun H., Lu Y., et al. (2022). Temporal-spatial change of China's coastal ecosystems health and driving factors analysis. Sci. Total Environ. 845, 157319. doi: 10.1016/j.scitotenv.2022.157319
Yan Q., Cheng T., Song J., Zhou J., Hung C., Cai Z. (2021). Internal nutrient loading is a potential source of eutrophication in Shenzhen Bay, China. Ecol. Indic. 127, 107736. doi: 10.1016/j.ecolind.2021.107736
Yang W., Xu K., Lian J., Bin L., Ma C. (2018). Multiple flood vulnerability assessment approach based on fuzzy comprehensive evaluation method and coordinated development degree model. J. Environ. Manage. 213, 440–450. doi: 10.1016/j.jenvman.2018.02.085
Yang W., Zhang Z., Sun T., Liu H., Shao D. (2021). Marine ecological and environmental health assessment using the pressure-state-response framework at different spatial scales, China. Ecol. Indic. 121, 106965. doi: 10.1016/j.ecolind.2020.106965
Yu G., Sun P., Liu G., Xu D., Ding G., Huang D. (2014). Diagnostic model construction and example analysis of habitat degradation in enclosed bay: I. diagnostic model construction. Chin. J. Oceanol. Limnol. 32, 626–625. doi: 10.1007/s00343-014-3217-0
Yu W., Zhang D., Liao J., Ma L., Zhu X., Zhang W., et al. (2022). Linking ecosystem services to a coastal bay ecosystem health assessment: A comparative case study between Jiaozhou Bay and Daya Bay, China. Ecol. Indic. 135, 108530. doi: 10.1016/j.ecolind.2021.108530
Zhang F., Fu H., Lou H., Sun X., Zhang D., Sun P., et al. (2023). Assessment of eutrophication from Xiaoqing River estuary to Laizhou Bay: Further warning of ecosystem degradation in typically polluted estuary. Mar. pollut. Bull. 193, 115209. doi: 10.1016/j.marpolbul.2023.115209
Zhang R., Wang C., Xiong Y. (2023). Ecological security assessment of China based on the Pressure-State-Response framework. Ecol. Indic. 154, 110647. doi: 10.1016/j.ecolind.2023.110647
Keywords: Aquaculture bay, pressure-state-response framework, ecosystem health, ecological security assessment, Sansha Bay
Citation: Li Y, Huang Y, Zhang X, Jiang Y, Jing X, Deng Y, Li R, Jiang D and Mu J (2024) Ecosystem health assessment: a PSR analysis combining AHP and EW methods for Sansha Bay, China. Front. Mar. Sci. 11:1396026. doi: 10.3389/fmars.2024.1396026
Received: 05 March 2024; Accepted: 27 May 2024;
Published: 20 June 2024.
Edited by:
Lorenzo Mari, Polytechnic University of Milan, ItalyReviewed by:
Rui Zhang, Chinese Academy of Sciences (CAS), ChinaCopyright © 2024 Li, Huang, Zhang, Jiang, Jing, Deng, Li, Jiang and Mu. This is an open-access article distributed under the terms of the Creative Commons Attribution License (CC BY). The use, distribution or reproduction in other forums is permitted, provided the original author(s) and the copyright owner(s) are credited and that the original publication in this journal is cited, in accordance with accepted academic practice. No use, distribution or reproduction is permitted which does not comply with these terms.
*Correspondence: Yaling Huang, eWxodWFuZ0BtanUuZWR1LmNu; Jingli Mu, amxtdUBtanUuZWR1LmNu
†These authors have contributed equally to this work
Disclaimer: All claims expressed in this article are solely those of the authors and do not necessarily represent those of their affiliated organizations, or those of the publisher, the editors and the reviewers. Any product that may be evaluated in this article or claim that may be made by its manufacturer is not guaranteed or endorsed by the publisher.
Research integrity at Frontiers
Learn more about the work of our research integrity team to safeguard the quality of each article we publish.