
95% of researchers rate our articles as excellent or good
Learn more about the work of our research integrity team to safeguard the quality of each article we publish.
Find out more
ORIGINAL RESEARCH article
Front. Mar. Sci. , 05 September 2024
Sec. Deep-Sea Environments and Ecology
Volume 11 - 2024 | https://doi.org/10.3389/fmars.2024.1395892
This article is part of the Research Topic Environmental Impacts & Risks of Deep-Sea Mining: Recommendations for Exploitation Regulations View all 10 articles
 Santosh Gaikwad1,2
 Sabyasachi Sautya1*
 Samir Damare3
 Maria Brenda Luzia Mascarenhas-Pereira4Vijayshree Gawas3
 Jayesh Patil4
 Mandar Nanajkar2,5Sadiq Bukhari2,6
Managing deep-sea mining is challenging due to limited data on species and habitat distribution, hindering decision-making. In less-explored polymetallic nodule sites in the Indian Ocean, management approaches are deemed unfeasible due to a substantial lack of data. In this study, we aim to bridge the knowledge gap through a detailed analysis of the macrobenthos (fauna > 300 µm) obtained with two sampling gears (multi- and box corer) in potential impact, preservation, and reference zones in the Central Indian Ocean Basin. In total, 337 individuals were categorized into 106 morphospecies and 18 higher taxa. The lowest abundance was reported in the box corer. Nematodes and copepods dominated the macrobenthos community, whereas polychaetes and tanaidaceans were the more prevalent macrofaunal taxa. Carbohydrates and total organic carbon showed a notable positive correlation with polychaetes, isopods, and bivalves, indicating their influence on larger-sized taxa. Various functional traits, i.e., less motile, discretely motile, biodiffusors, and upward/downward conveyers, were dominant in the study area. The comparative analysis of multi- and box corer sampling reveals distinct patterns in macrobenthic diversity, emphasizing the importance of employing both gears for accurate functional analysis. The paper underscores the significance of including large meiofaunal taxa in macrofauna analyses for assessing deep-sea ecosystem functioning and services. Additionally, the findings contribute significantly to environmental baseline and impact assessment, a crucial aspect of sustainable management in a highly promising polymetallic nodule mining area, aligning with the goals of exploring.
The blue economy is focused on sustainably harnessing the vast natural resources found in the depths of the ocean, including abundant reserves of oil, gas, and minerals in specific deep-sea regions. Of particular interest are its seafloor mineral deposits, which remain untapped (Hein et al., 2020) and encompass three primary types of economically significant deposits: polymetallic nodules (PMN), cobalt-rich ferromanganese crusts, and seafloor massive sulfides (SMS). Such deposits hold the potential to diversify the mineral supply to global industries (Petersen et al., 2016). In an era where the global trajectory is firmly set toward sustainability and technology-driven progress, the availability of critical minerals such as nickel and cobalt contained in PMN assumes greater importance as a lifeline for emerging technologies, including renewable energy systems, electric vehicle batteries, and advanced electronics (Hein et al., 2013). Thus, seafloor mineral deposits can contribute significantly to the sustainable development of the maritime domain and the broader global economy.
Globally, a total of four seafloor areas with abundant polymetallic nodule fields are known, i.e., the Clarion–Clipperton Zone (CCZ), Peru Basin, Penrhyn Basin (including the Cook Islands EEZ), and Central Indian Ocean Basin (CIOB) (Hein et al., 2013). These fields fall under the jurisdiction of the International Seabed Authority (ISA), as they extend beyond the national control of any single country. However, the granting of mining permissions has been stalled due to undefined complexities in environmental, social, and governance aspects related to deep-sea mining (Kung et al., 2021). Among the 31 exploration licenses with 22 nations, India has been allocated a license area for exploring polymetallic nodules and polymetallic sulfide areas in CIOB.
Deep-sea mining has the potential to cause significant environmental impacts, including biodiversity loss, slow recovery, and enormous spatial scales of mines for certain mineral resources (Van Dover et al., 2017). The impacts of deep-sea mining on microbial ecosystem services are also a concern and are rarely considered explicitly (Orcutt et al., 2020). Bottom trawling and mining activities can cause significant physical disturbance to the seafloor, leading to the loss of benthic habitats and the associated ecosystem services (Snelgrove, 1999; McLaverty et al., 2023). These services are critical for the ecological functioning of the deep ocean and provide a range of ecosystem services, including nutrient cycling, carbon sequestration, and habitat provision (Armstrong et al., 2010; Thurber et al., 2014). Therefore, it is crucial to assess the significance of potential large-scale environmental impacts, define “serious harm”, and consider ecosystem service benefits, resilience, postmining restoration costs, and cumulative impacts associated with deep-sea mining activities (Levin et al., 2016; Chen et al., 2022).
Moreover, the nodule fields of the abyssal plain are one of the deep sea’s biologically diverse and unique habitats. This habitat is mainly covered with solid substrate (mostly nodules) and otherwise soft sediment, which supports various benthic life forms (Smith and Demopoulos, 2003). These nodules boost biodiversity at regional scales, underscoring the importance of preserving regions subjected to nodule mining for biodiversity conservation (Smith et al., 2008). Furthermore, some experimental studies have revealed predominantly negative disturbance effects (Bluhm, 2001; Ingole et al., 2001; Radziejewska, 2002; Miljutin et al., 2011; Jones et al., 2017). Predicting the impact of nodule mining remains challenging due to the limited ecological baseline knowledge of the area (Bridges et al., 2023). Therefore, to assess the potential consequences of future deep-sea mineral resource mining, a comprehensive baseline understanding of the fauna associated with nodule-rich regions is imperative. Earlier studies of the benthic fauna along the nodule areas of CIOB showed a high diversity with the dominance of foraminifera, sponges, anthozoans, mollusks, polychaetes, crustaceans, nematodes, and bryozoans in these habitats (Parulekar et al., 1982; Pavithran et al., 2009b; Simon-Lledó et al., 2019; Singh et al., 2019; Chuar et al., 2020; Washburn et al., 2021), but a relatively lower mean density of macrofauna was recorded compared to other PMN areas in the global ocean (Parulekar et al., 1992; Ingole and Koslow, 2005; Pavithran and Ingole, 2005; Ingole et al., 2005b; Pavithran et al., 2009b). These studies contributed to high species richness and species rarity; however, many deep-sea species are still undescribed by taxonomists (Smith et al., 2006). Recently, a few newly described species and first reports have emerged from CIOB, including species of Copepoda, Bivalvia, Bacteria, and Cirripedia (Chan et al., 2020; Jang et al., 2020; Lee et al., 2020; Lim et al., 2020).
Various sampling techniques and methodologies can be used to sample the benthic fauna, raising questions about the comparability of the data, especially when the objectives involve discerning spatial or temporal differences. In accordance with the recommendations for environmental assessment set forth by the Legal Technical Commissions (LTC) issued by ISA (ISBA/16/LTC/7, 2010; ISBA/25/LTC/6/Rev.1, 2020), most studies on macrofauna have been conducted using box corers (Supplementary Table S1), with the prevalent use of pseudoreplicates, especially in CIOB (Parulekar et al., 1982; Ingole et al., 2005b; Pavithran et al., 2009b). Thus, macrofaunal biodiversity and community structure in the abyssal fields of the CIOB remain poorly characterized, representing just one aspect of a larger picture. Determining the optimal choice for sampling gear or sample processing method is not always straightforward and is often constrained by available equipment and cost considerations. This gives rise to challenges related to efficiency, comparability, and data integrity. Despite recent advancements in sampling equipment and analytical approaches, benthic ecologists frequently adhere to methods employed in earlier studies. However, recent investigations have brought to light that the multicorer offers certain advantages over the box corer, with the latter exhibiting a 2.9-fold underestimation in macrofauna density (Montagna et al., 2017). Additionally, the multicorer proves effective in capturing undisturbed sediment layers, addressing concerns related to sampling accuracy.
In the present study, we undertook an inquiry to address crucial questions regarding the macrobenthic community within the framework of a potential polymetallic nodule mining area: (1) Are there noticeable differences in community structure, density, species/family richness, evenness, and functional composition between potential reference and mining sites? (2) What environmental factors play a role in shaping communities? Additionally, we delve into the intriguing question of (3) whether the choice of sampling gear can influence the derived univariate indices and ultimately contribute to shaping the observed community pattern and functional structure. For these purposes, we conducted a comparison between the utilization of the box corer and multicorer in proposed mining areas within the CIOB, focusing particularly on the low-productivity zone where each individual holds significant importance. While we aim to answer the questions raised above, the primary aim of this study is to establish baseline information on macrobenthic communities and their interactions with the environment along the PMN region of the CIOB.
The CIOB has a northward opening in the Bay of Bengal. The approximate dimensions of CIOB are 6,000 km long and 1,600 km wide, and its depth reaches 6,090 m (MoES, 2020). Indian Ocean Nodule Field (IONF) is situated in the CIOB, extending approximately from 9°S to 16°30′S and 72°E to 80°E, stretched across 739,260 km², and refers to a commercially exploitable portion of the nodule field (Mukhopadhyay et al., 2008).
In the IONF, a number of seamounts of various characteristics and dimensions were identified, along with abyssal hills. Afanasiy Nikitin seamount in the central part of the basin is well known for cobalt crust deposits (Glasby, 2010), which reach a maximum height of 1,549 m (Krishna, 2003). These seamounts and abyssal hills make the habitat more complex for the faunal component and enhance the diversity of the region. The Ganges–Bramhaputra fan appears to be a long distance from the CIOB, but the fan extends up to about 10°S and influences the nutrient chemistry in the IONF (Krishna, 2003; Mukhopadhyay et al., 2008).
The average primary productivity in CIOB is 3.72 mg C m−³ day−¹ at the surface and a mean of 51.23 mg C m−² day−¹ in the water column (0–150 m), respectively (Matondkar et al., 2005), which is considerably lower than in other oceans. Subsequently, the low organic content in surface sediments (0.07%–0.41%) is attributed to low sediment accumulation rates in the CIOB (Pattan et al., 2005). CIOB exhibited a high microbial diversity (Shah et al., 2024), and abundance was found to be three times greater than the earlier reported range of 108 to 109 CFU g−1 dry sediment in other oceanic waters around the globe (Raghukumar et al., 2001). Thus, the IONF and adjacent area in CIOB are very complex, and it is important to understand their full biological resources with respect to geomorphology and geophysical parameters.
In the year 2013, a block of ~ 13.875 km × 13.875 km (7.5° × 7.5°) was designated as the Impact Reference Zone (IRZ) and Preservation Reference Zone (PRZ) for conducting the trials of mining in CIOB (MoES, 2020). Within this area, the sediment samples were collected in July 2019 on board R/V Sindhu Sadhana (cruise No. SSD062) at three sites in the licensed area for PMN exploration, approximately 100–120 km apart (Figure 1A; Supplementary Table S2, panel A). The PRZ represents a reference site and should not be influenced by any mining activities or impacts in the future. The IRZ is designated as an Impact Reference Zone, where the benthic impact experiments and possible mining will take place. Site BC20 will also be used as a reference site located in the north of both sites.
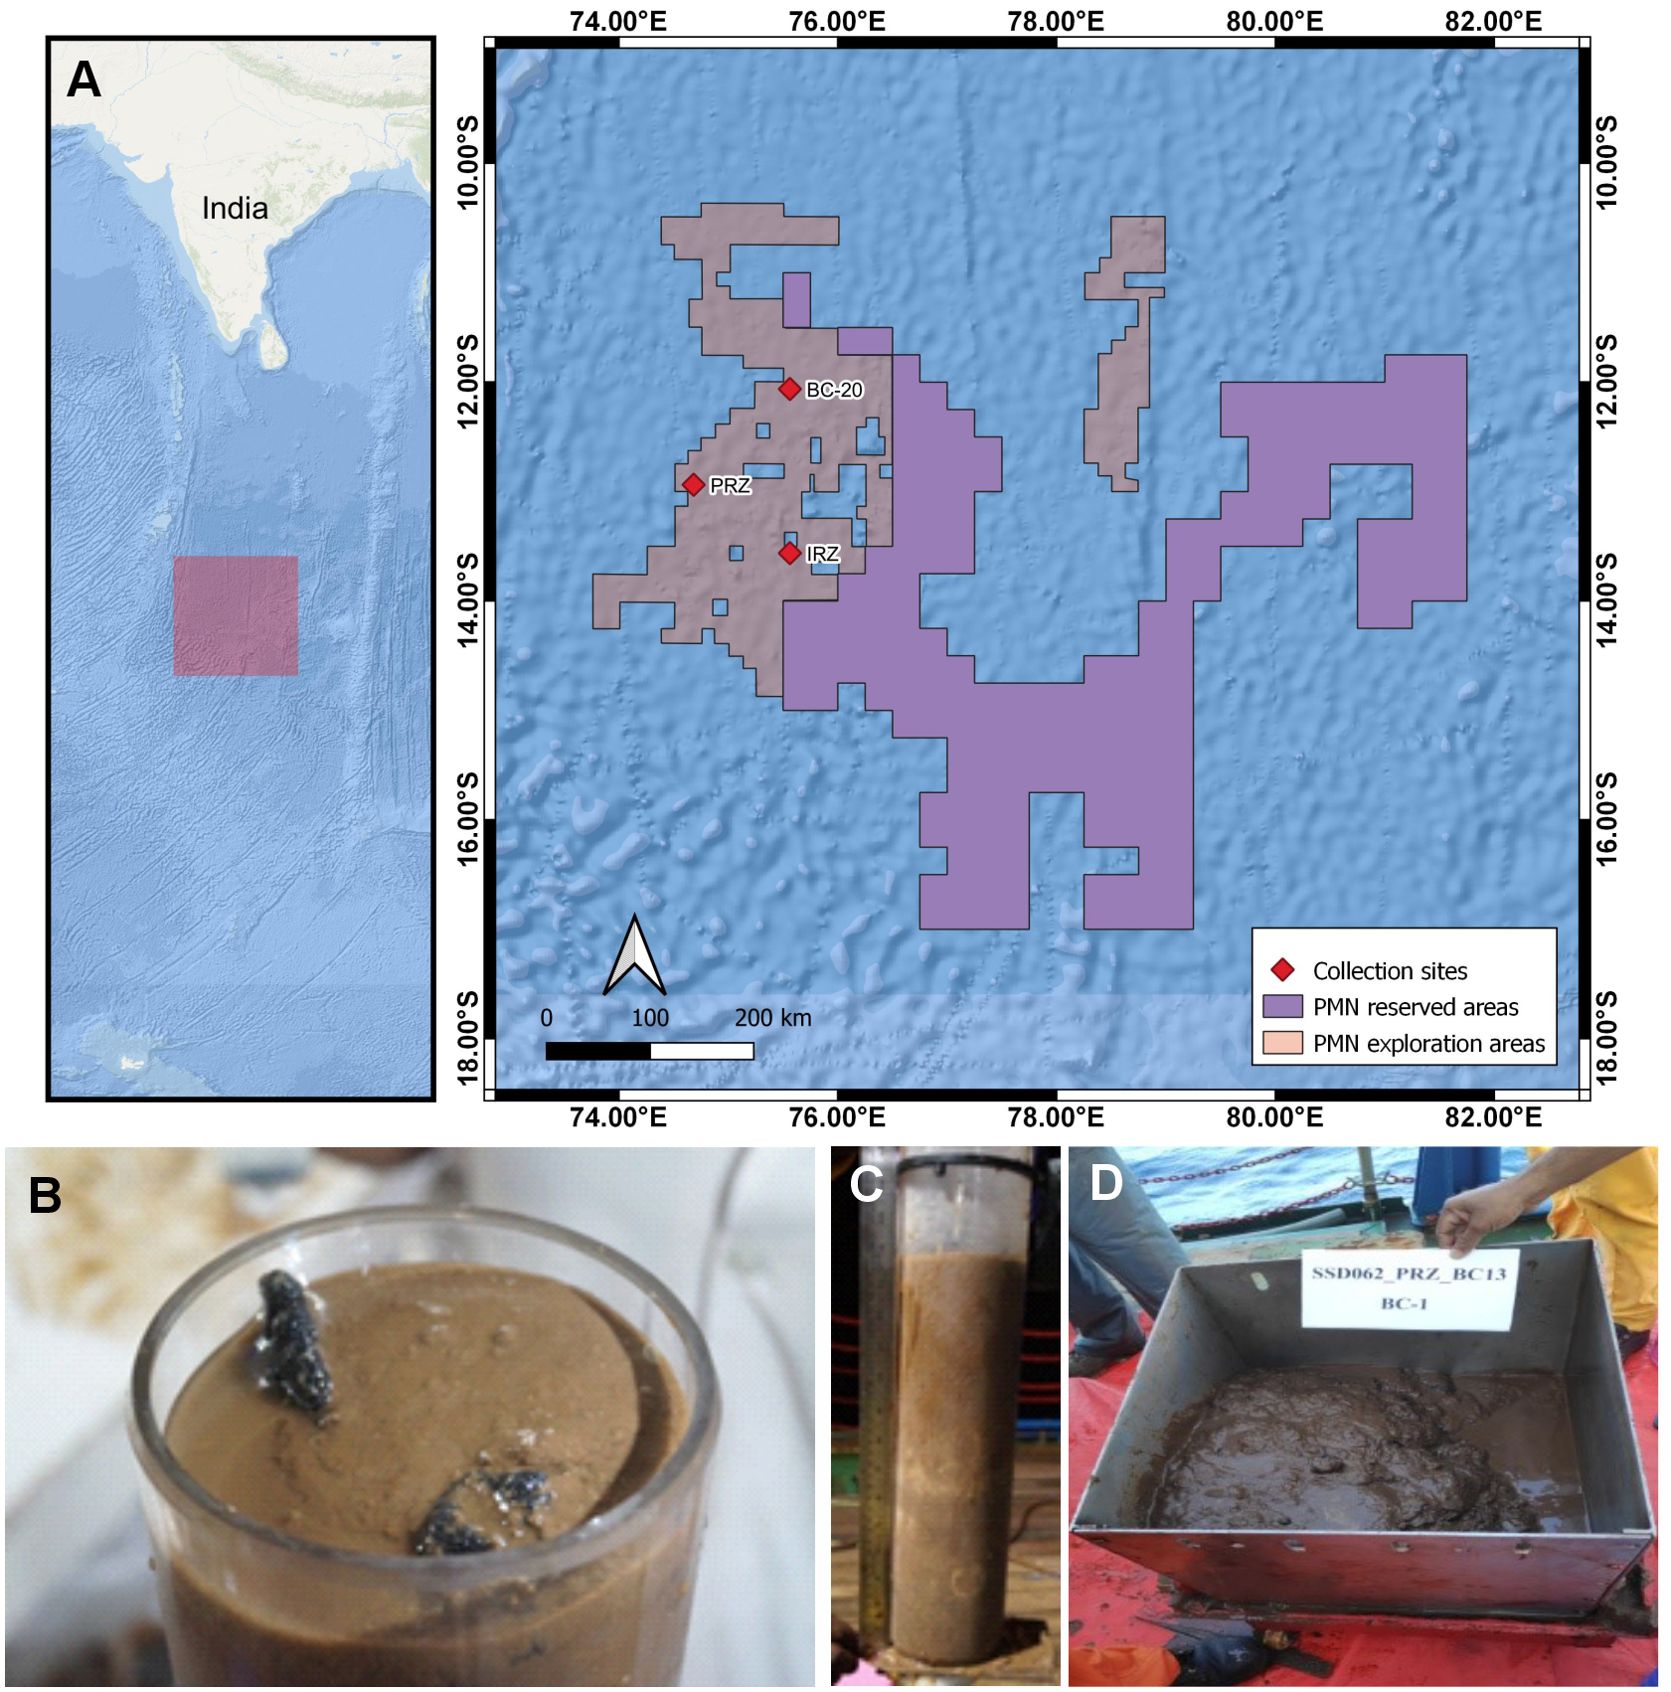
Figure 1. Geographic map of sampling sites and sample retrieval in the PMN exploration area, Central Indian Ocean Basin. Multi- and box corer samples were obtained from each site (see Supplementary Table S2). The map was generated using QGIS open-source software and bathymetric data used from GEBCO 2020. (A) Map showing the location of sampling sites. (B, C) Onboard-taken multicorer retrieved with full undisturbed sediment layers along with polymetallic nodules. (D) Box corer with uneven surfaced sediment sample after siphoning the overlaying water.
Two sampling gears were used to collect seafloor sediment, viz. multi-corer (Bowers & Connelly Corer, USA; 10 cm inner diameter; Figures 1B, C) and USNEL spade box corer (0.25 m²; Figure 1D). The multicorer with eight core liners and box corer were deployed thrice and twice at each site, respectively. Due to time constraints and logistical limitations, the number of samples collected had to be restricted. The lowering speed of the spade core was about 0.6 m s−1 until the 100-m altimeter reading, then after the spade corer was lowered at 0.1 m s−1 to minimize the impact (i.e., bow wave). Each deployment of gear retrieved relatively undisturbed sediment from the sea floor. The depth of vertical sediment penetration varied between ~ 15 cm and 35 cm, depending on the sediment surface and nodules present. The upper 0–10 cm of sediment layer only was used. The overlaying water in multi- and box corer was also added to the topmost layer of the sediment. Each box corer (0–10 cm) was completely used for macrobenthic faunal extraction according to ISBA guidelines (ISBA/25/LTC/6/Rev.1, 2020). Among the three operations of multicorer deployment, two core liners from the first two operations and a single core liner from the third operation were used for macrobenthic faunal extraction, bringing it all together five core liners from each site (Supplementary Table S2, panel A). Thereafter, two core liners taken from the same operation were analyzed separately, but the data were merged (averaging), making them single core liner data as per the ISBA guidelines (ISBA/25/LTC/6/Rev.1, 2020). Therefore, the used replicates will be three and two per site for multi- (0.039 m² area coverage) and box corers (0.5 m² area coverage), respectively. Another two core liners were taken for estimation of environmental parameters. The remaining core liners were used for separate biological, chemical, and geological studies (not included in this study). Thereafter, the core liner samples for macrobenthic fauna and environmental analysis were vertically sectioned at depths of 0–1 cm, 1–2 cm, 2–3 cm, 3–4 cm, 4–5 cm, 5–6 cm, 6–8 cm, and 8–10 cm below the sediment surface. The polymetallic nodules brought with gears were carefully removed with minimum disturbance and washed to remove any associated fauna. The final abundance data merged these faunal contents with the 0–1-cm layer of multicorer samples. The macrobenthic samples of the single core liner from each operation (n = 3) and the first box corer were fixed and stored in 10% borax-buffered formalin and 0.5% Rose Bengal. Other samples of the single-core liner from the first two operations (n = 2) and the second box corer were directly preserved in 80% denatured ethanol and stored in a − 80°C deep freezer along with all samples of environmental parameters until further laboratory analysis.
The physical properties of the water column (i.e., conductivity-based salinity, temperature, depth) were measured with a CTD profiler (SBE 25, Seabird, USA) equipped with a dissolved oxygen (DO) sensor (RINKO, ALEC, 108 Japan). The seawater was collected for measuring DO and salinity using Niskin bottles connected to a CTD rosette for calibration and standardization of CTD probes.
Two core liners of the multicorer were used for pore water extraction and one liner each for geochemical and sedimentological analysis. All cores were sub-sectioned at 2 cm intervals up to 10 cm and subsequently at a 5-cm interval from 10 cm to 20 cm and stored in a deep freezer at − 20°C for further analysis in the laboratory. The porewater for the sediment was extracted onboard using a refrigerated centrifuge at 5,000 rpm under 2°C temperature. The supernatant was filtered through 0.42 μm syringe filters (Merck, Germany) and stored in the refrigerator/deep freezer till further analysis.
The pH, PO4³−-P, NO2−-N, NO3−-N, SiO2−–Si, and salinity were estimated for the pore water of each sediment layer, including sediment–water interface (SWI). The pH and salinity were measured using a multiparameter (Hanna, HI98194) calibrated with pH and salinity-known solutions before use. DO in seawater was fixed with the addition of Winkler A and Winkler B reagents, following Grasshoff et al. (1999). Care was taken to ensure that there were no air bubbles while collecting the seawater. The precipitate was dissolved in H2SO4, which was later titrated against sodium thiosulfate using Dosimat (Metrohm, Switzerland). The endpoint was determined by adding starch as an indicator. A precision of ± 0.6% was obtained.
The nutrients such as PO4³--P (μmol L−1), NO2--N (μmol L−1), NO3−-N (μmol L−1), and SiO2−–Si (μmol L−1) were analyzed using 25 mL of seawater and 5 mL of porewater (diluted five times) for each nutrient by following the standard procedure of Grasshoff et al. (1999). The calibration was carried out using several working standards with respect to each nutrient’s concentration range. A precision of ±3% was obtained.
The second stored (deep freezer at −20°C) sediment liners retained for geochemical and sedimentological analysis were subjected to estimations of total organic carbon (TOC; %), sand (%), silt (%), clay (%), total carbohydrate (CHO; mg g−1), total protein (PRO; mg g−1), total lipid (LIP; mg g−1), and labile organic matter (LOM; mg g−1). The total organic carbon was analyzed on bulk powdered samples by a flash dynamic combustion method using the Thermo Scientific FLASH 2000 Series Nitrogen and Carbon (CN) analyzer at CSIR-NIO, Goa, India. The total inorganic content was determined using the UIC CM 5014 Coulometer. The CaCO3 weight percent was calculated by multiplying the values of inorganic carbon with the ratio of molecular weight of CaCO3 to C (i.e., 8.33). CaCO3% = total inorganic carbon × (molecular weight of CaCO3/atomic weight of carbon) (Johnson et al., 2014). The total organic carbon content was calculated by subtracting the total inorganic carbon from the total carbon. The sand contents were determined after wet sieving through a 62 µm sieve, and silt (63–2 µm) and clays (< 2 µm) were determined by standard pipette analysis (Buchanan, 1984).
LOM was calculated as a sum of PRO, CHO, and LIP per gram of dried sediment. For this, approximately 5 g of sediment samples from each subsection were air-dried and stored at room temperature. These air-dried samples were then used to estimate the concentration of PRO, CHO, and LIP. PRO was estimated using Folin–Ciocalteu’s phenol reagent. Bovine serum albumin (BSA) was used as a standard. CHO was estimated using the phenol sulfuric acid method. Glucose was used as a standard. LIP was extracted from dried sediment samples using direct elution with chloroform, methanol, and water in 10:5:2 ratios, respectively. The extracts were oxidized with acid dichromate, and spectrometric readings were recorded. Steric acid was used as standard. All three biochemical compounds were performed by the latest modified methods (Danovaro, 2010).
In the laboratory, each soft sediment layer was first sieved through a mesh size of 300 μm using filtered seawater (Pavithran et al., 2009a) for meaningful comparison to previous studies (Wilson, 2017; Yu et al., 2018; Bonifácio et al., 2020). The material retained on the sieves was stored in 10% borax-buffered formalin or 80% denatured ethanol and stained with 0.5% Rose Bengal. The stained specimens were entirely picked up for identification purposes. In many deep-sea studies, macrofauna typically refers to organisms retained on a 300 μm sieve and often includes a substantial number of meiofaunal taxa (e.g., Nematoda, Harpacticoida, and Ostracoda) (Hessler and Jumars, 1974). These taxa, including various species and life stages, easily pass through the sieve and are frequently overlooked in macrofauna analyses (Hessler and Jumars, 1974; Wilson, 2017; Washburn et al., 2021). While some studies classify certain meiofaunal taxa as macrofauna, this inconsistency complicates comparative analyses (Ingole et al., 2001; Choi et al., 2004; Yu et al., 2018; Lins and Brandt, 2020; Kaiser et al., 2024). Exclusive meiofaunal taxa, i.e., Nematoda, Copepoda, Ostracoda, Acari, and Kinorhyncha, retained on the 300 μm sieve, are referred to as meiofauna taxa in macrofauna in the current study. The rest is considered macrofauna “sensu stricto”. All fauna retained on a 300 μm sieve are thus called macrobenthos here (Macrobenthos = Macrofauna + Meiofauna; “sensu lato”).
An attempt has been made to record and identify all the macrobenthic fauna to the highest possible taxonomic resolution (phylum/class/order). Polychaeta, Copepoda, Isopoda, Tanaidacea, and Nematoda were further identified to family/genus/species level were given morphospecies numeric labels (Supplementary Table S3). Some specimens were damaged or broken and therefore could not be properly identified at the family/genus level. Such specimens were identified to the lowest possible taxonomic level, included in a group of many species (denoted by “.spp”), otherwise included in a single group (denoted by “.sp”), with the same morphological features. The biomass was estimated in wet weight by weighing the taxa in each replicate collectively using the high-precision microweighing balance. The macrobenthic density and biomass were standardized and represented in individuals per square meter (ind. m−²; ± SE) and grams per square meter (g m−²; ± SE), respectively, after averaging the core liner data to a single core for the same multicorer operation. All the specimens were deposited in the institutional museum at the CSIR-National Institute of Oceanography (CSIR-NIO) under Dr. Sabyasachi Sautya.
The traits of mobility and reworking capability were used to determine the bioturbation potential (BP) (Queirós et al., 2013). Although bioturbation potential is not a direct measure of the bioturbation process, this allows us to understand the capability of the community to perform bioturbation. BP used in time series observations may help in understanding the coupled impact of sediment and organisms and may complement managemental policies (Painting et al., 2013; Van Hoey et al., 2013). Mobility (Mi) and sediment reworking (Ri) scores were calculated after Queirós et al., 2013 (Table 1; Supplementary Table S4), although other studies were also taken into consideration if the information was lacking (Fauchald and Jumars, 1979; Jumars et al., 2015). Where scores were not available for any species, the scores of the closest relative species were used, or the highest possible taxonomic level. Finally, these traits were weighted by species abundance for representation. Furthermore, the community-weighed mean (CWM) matrix of the trait data was computed using site×species (abundance data) and species×traits matrices (trait data). The CWM was then employed to assess differences in functional structure between sites and sampling gears.
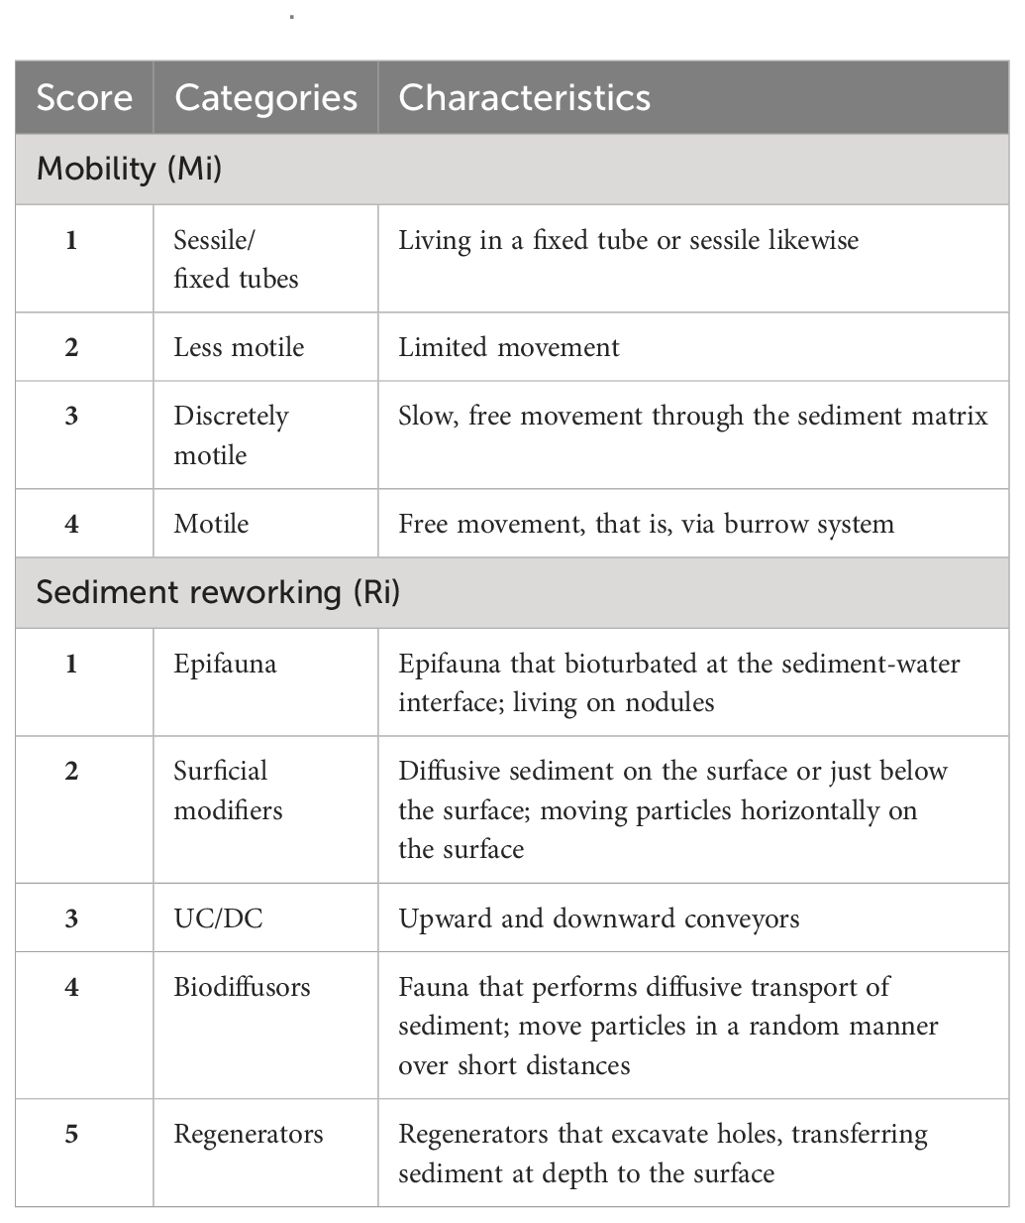
Table 1. Traits, categories, and scores used for functional analysis of macrobenthos in the Central Indian Ocean Basin (CIOB) following Queirós et al. (2013).
The small sample size just spanning three sites, each over 100 km apart, can restrict the significance of statistical analysis substantially. However, the use of robust statistical methods (e.g., Anderson, 2001; McCune and Grace, 2002) allows for valuable insights even with limited samples. The spatial distribution of sampling sites, although far apart, provides a broad environmental gradient that is essential for understanding regional biodiversity patterns. Therefore, a robust statistical analysis approach was considered in the present study. The macrobenthic community structure (macrobenthos; “sensu lato”) and functional community weighed mean (CWM) were tested for significant differences between and within sites and sampling types using PERMANOVA (Anderson et al., 2008). Prior to this, the Bray–Curtis similarity matrix was calculated on square root-transformed abundance data and the Euclidean distance matrix on abundance-weighted sum of traits. Permutation of residuals under a reduced model method was implemented with Type III (partial). A Monte Carlo test was also performed in parallel to confirm the test results due to the small dataset. The univariate indices were calculated as a measure of diversity, i.e., species richness (S), total abundance (N), Shannon–Wiener index (Shannon and Weaver, 1949) for diversity (H′) using loge, Margalef’s index (Margalef, 1968) for species richness (d), and Pielou’s index (Pielou, 1969) for species evenness (J′).
The significant differences in the indices between the sites were analyzed with generalized linear models (glm function) using the “stats” package (R Core Team, 2021), negative binomial generalized linear models (glm.nb function) using the “MASS” package (Venables and Ripley, 2002), and Generalized least-squares models (gls function) using the “nlme” package (Pinheiro et al., 2021) in R. Prior to this, the data were checked for normal distribution using the “ggplot2” package (Wickham et al., 2024), where frequency was plotted against each parameter. Multicollinearity and homogeneity of variance were checked with the vif and levene.test functions using the “car” (Fox and Weisberg, 2019) and “Lawstat” packages (Hui et al., 2008), respectively. The overdispersion statistic was used for each model using the “deviance divided by df.residual” formula to select the type of link function in the model. The glm.nb and gls were performed for overdispersion and heterogeneity of variance. For underdispersion, the log link function was used in the model. The AIC was also used to select the best-fitted model among others. An ANOVA test (type II sum of squares) was performed to conduct the F-test on the glm model outputs and the Wald Chi-squared test on the gls model outputs (Henseler et al., 2019).
The Spearman’s rank correlation was used to test the relationship between univariate indices and environmental variables. The statistical significance of the correlation coefficient was tested using a significance level of p < 0.05. Prior to this, the Shapiro–Wilk test was used for the data normality test, and all variables were found to have a nonnormal distribution. The relationship between the environmental parameters and macrobenthic community structure was ascertained by canonical correspondence analysis (CCA). The data (multi- and box corer) used for CCA were untransformed data for both the macrobenthic community and environmental parameters. Only environmental factors with significance were displayed with a high frequency of morphospecies. The CCA was performed with the cca function using the “Vegan” package in R (Oksanen et al., 2020).
The univariate indices and PERMANOVA were performed using PRIMER v6 (Clarke and Gorley, 2006; Anderson et al., 2008). The CWM data were estimated with the cwm function using the “BAT” package (Cardoso et al., 2015). The environmental parameters were depicted in a line graph using the “ggplot2”, “dplyr”, and “tidyr” packages (Wickham et al., 2023; Hadley et al., 2024; Wickham et al., 2024). This approach facilitates a clear visualization of sediment depth variations through color gradients. Each color signifies the actual values at specific intercepts (e.g., PRZ, 0–2 cm), while values between these points lack numerical representation on the axis and thus cannot be compared directly. The Venn diagram using the “Venn” package (Dusa, 2021) and the CCA plot were created using R programming software (R Core Team, 2021). The map was accomplished in QGIS 3.10 (QGIS Development Team, 2020) with an open-source bathymetric data gradient (Weatherall et al., 2019).
The analysis of the sediment-water interface at the three analyzed sites yielded several noteworthy findings. Temperature remained consistent at 1.45°C among all sites with no variability (Supplementary Table S2, panel B), while DO levels were highest at PRZ (7.50 ± 0.95 mL L−1), followed by IRZ (6.04 ± 0.56 mL L−1) and BC20 (5.61 ± 0.40 mL L−1; Supplementary Table S2, panel B). The mean salinity displayed minimal variation, with values ranging from 31.49 ± 0.31 psu (IRZ) to 31.76 ± 0.08 psu (PRZ). The highest pH (8.17 ± 0.04) was recorded at PRZ, while the lowest was observed at BC20 (8.01 ± 0.03), with subsurface pH exhibiting lower values in sediment layers below 6–8 cm vertical depth (Figure 2). Subsurface salinity, measured from pore water analysis, showed relatively low variation except for the IRZ’s bottom layer, where salinity ranged between 30.5 psu and 31.1 psu. Nutrient profiles varied considerably between sites and vertical depths. Phosphate values at the sediment–water interface were similar in PRZ and BC20 (2.36 µmol L−1), but much lower than IRZ (5.68 µmol L−1). Subsurface pore water phosphate (PO4³--P) profiles indicated the highest values at BC20’s 8–10 cm depth (4.18 µmol L−1) and less variation (1.59–2.36 µmol L−1) throughout vertical depths in PRZ, whereas IRZ’s bottom sediment showed the highest values at surface layers and lower values at 8–10 cm depth (2.84 µmol L−1). Nitrite (NO2−-N) concentrations were similar throughout the vertical profile of IRZ and BC20; however, higher concentrations were reported in the subsurface layers of PRZ. Nitrate (NO3−-N) concentrations were higher at surface layers than subsurface layers. Contrastingly, silicate (SiO2−–Si) values gradually increased with the depth sediments at all the sites (Figure 2).
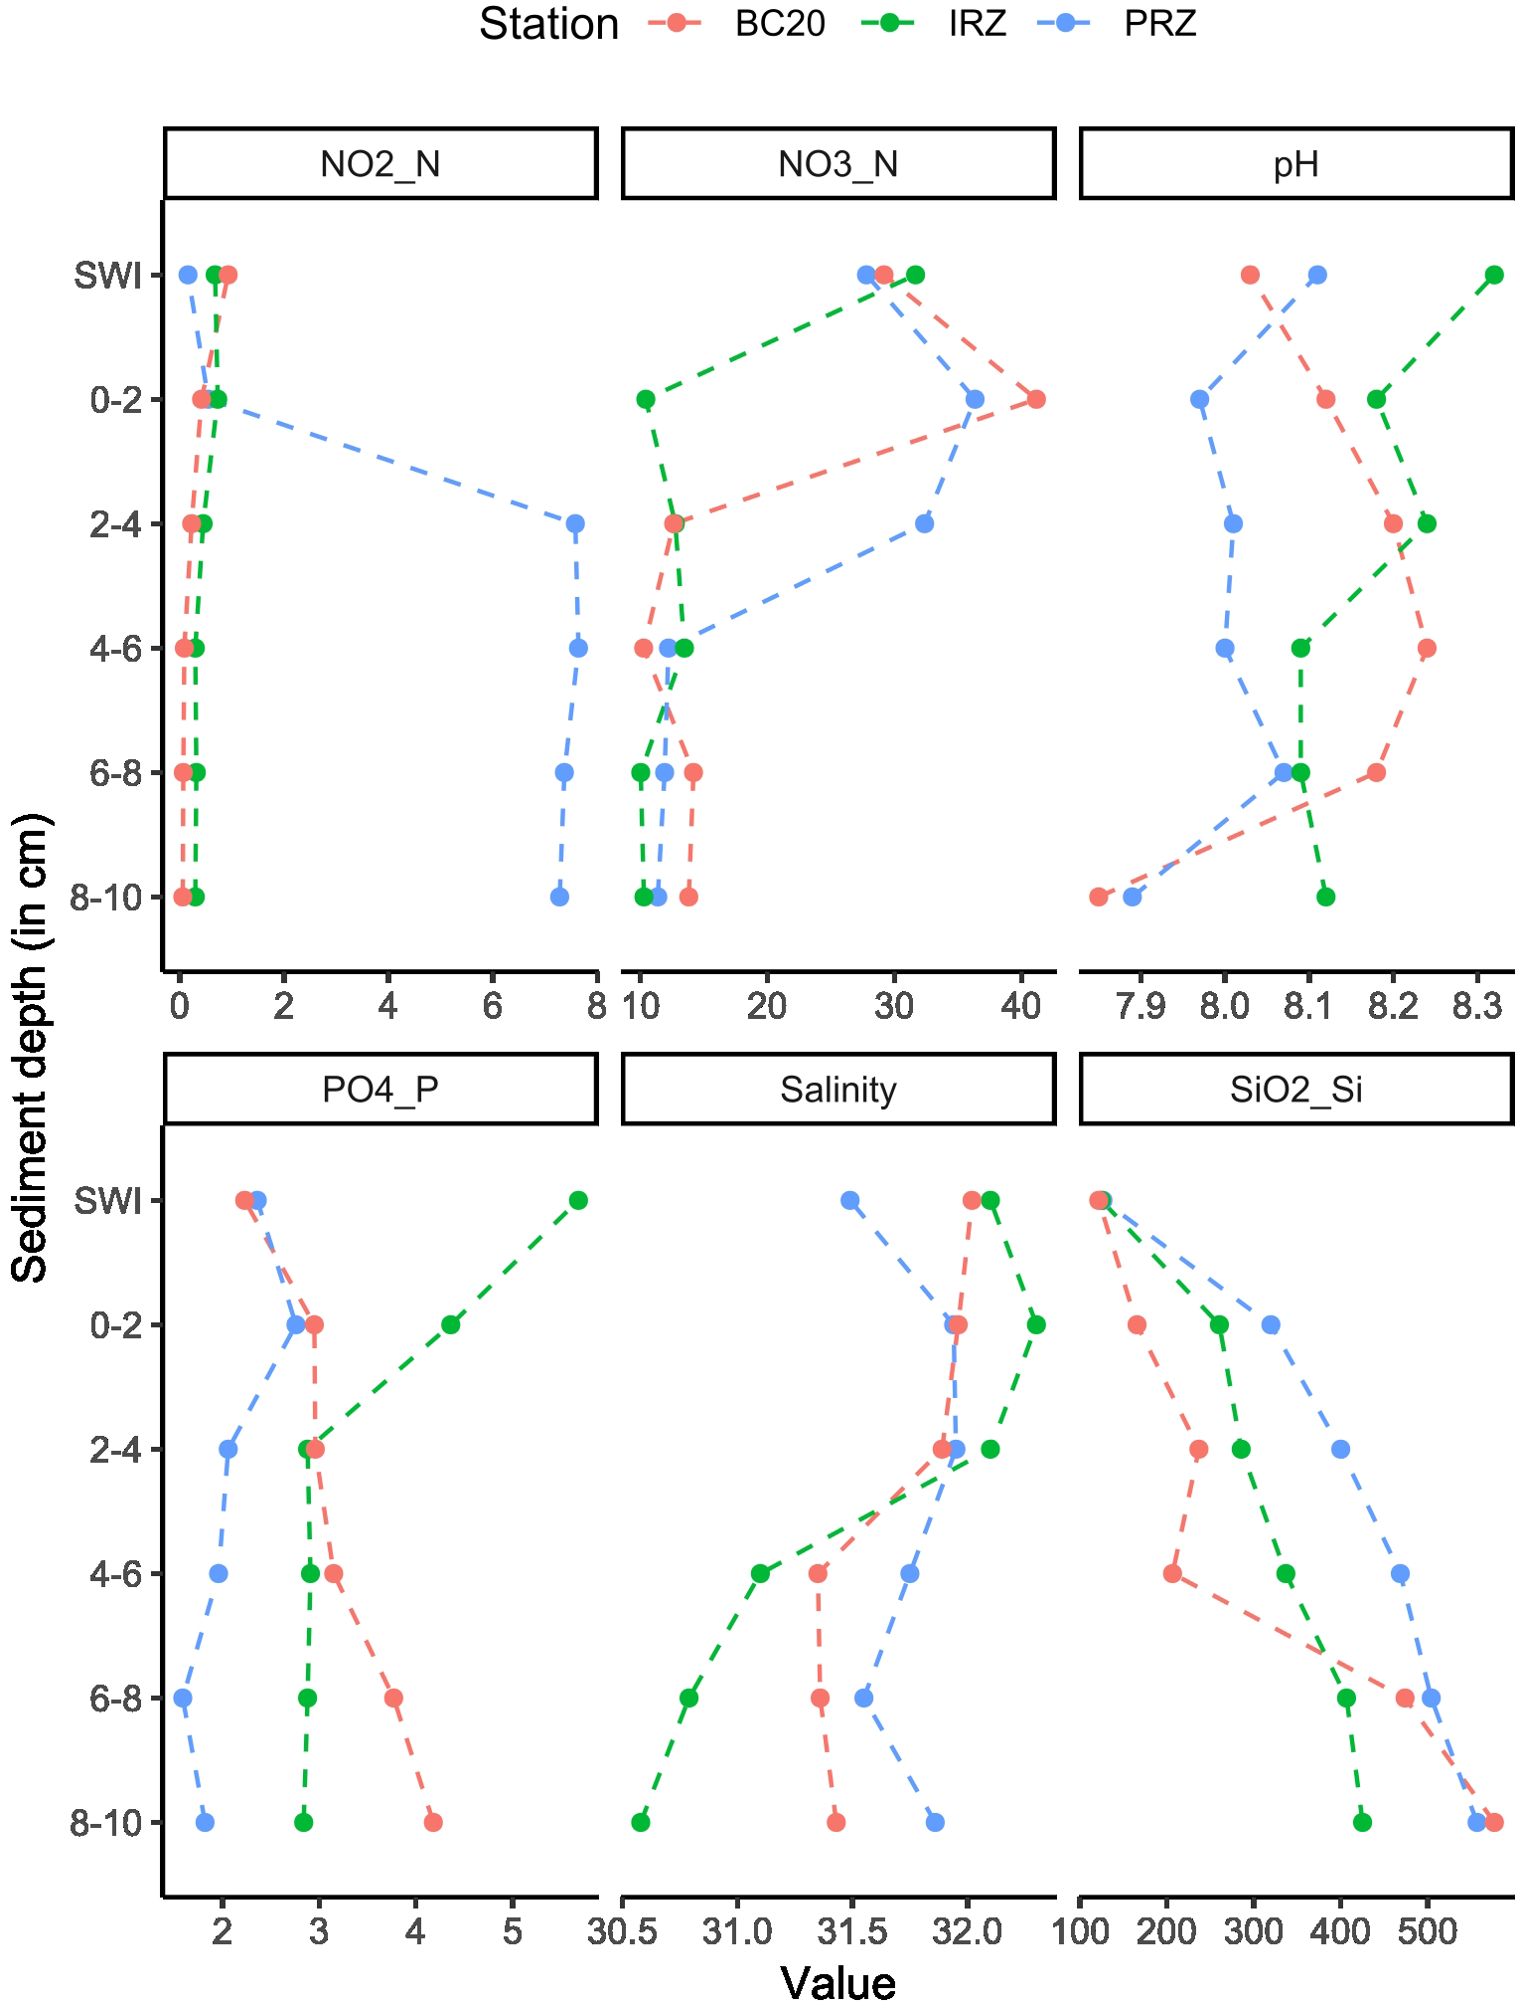
Figure 2. Variation in the environment parameters pH, salinity (psu), PO4³−-P (μmol L−1), NO2−-N (μmol L−1), NO3−-N (μmol L−1), and SiO2−-Si (μmol L−1) at the sediment–water interface (SWI) and in interstitial waters (pore water) up to 10 cm sediment depth across three sites (BC20, PRZ, and IRZ) in CIOB (see Figure 1 for locations).
TOC levels in sediments were relatively consistent across sites, with the lowest at PRZ (0.35%) compared to IRZ (0.40%) and BC20 (0.47%). TOC decreased with depth (Figure 3). CHO, protein, and LOM exhibited similar distribution patterns, with higher values in surface sediment layers, while lipid content was higher in subsurface layers around 2–4 cm sediment depth (Figure 3). Surface sediments were primarily composed of clay, ranging from 65.06% to 74.02% in all three sites (Supplementary Table S2, panel B), with silt being the second most dominant grain size (22.96% to 31.7%). Sand particles played a minor role in sediment texture. The sediments were predominantly characterized by pelagic dead radiolarian remains, composed of clay, fine silt, and very coarse silt particles, which exhibited similar properties in BC20 and IRZ compared to PRZ. Subsurface sediments (0–10 cm vertical) displayed greater variability in texture properties, indicating that BC20 and IRZ shared a similar sediment particle origin compared to PRZ. Clay content was notably higher in the upper fractions (0–2 cm, 2–4 cm, and 4–6 cm), while the bottom fractions (6–8 cm and 8–10 cm) exhibited less clay dominance in all three sites.
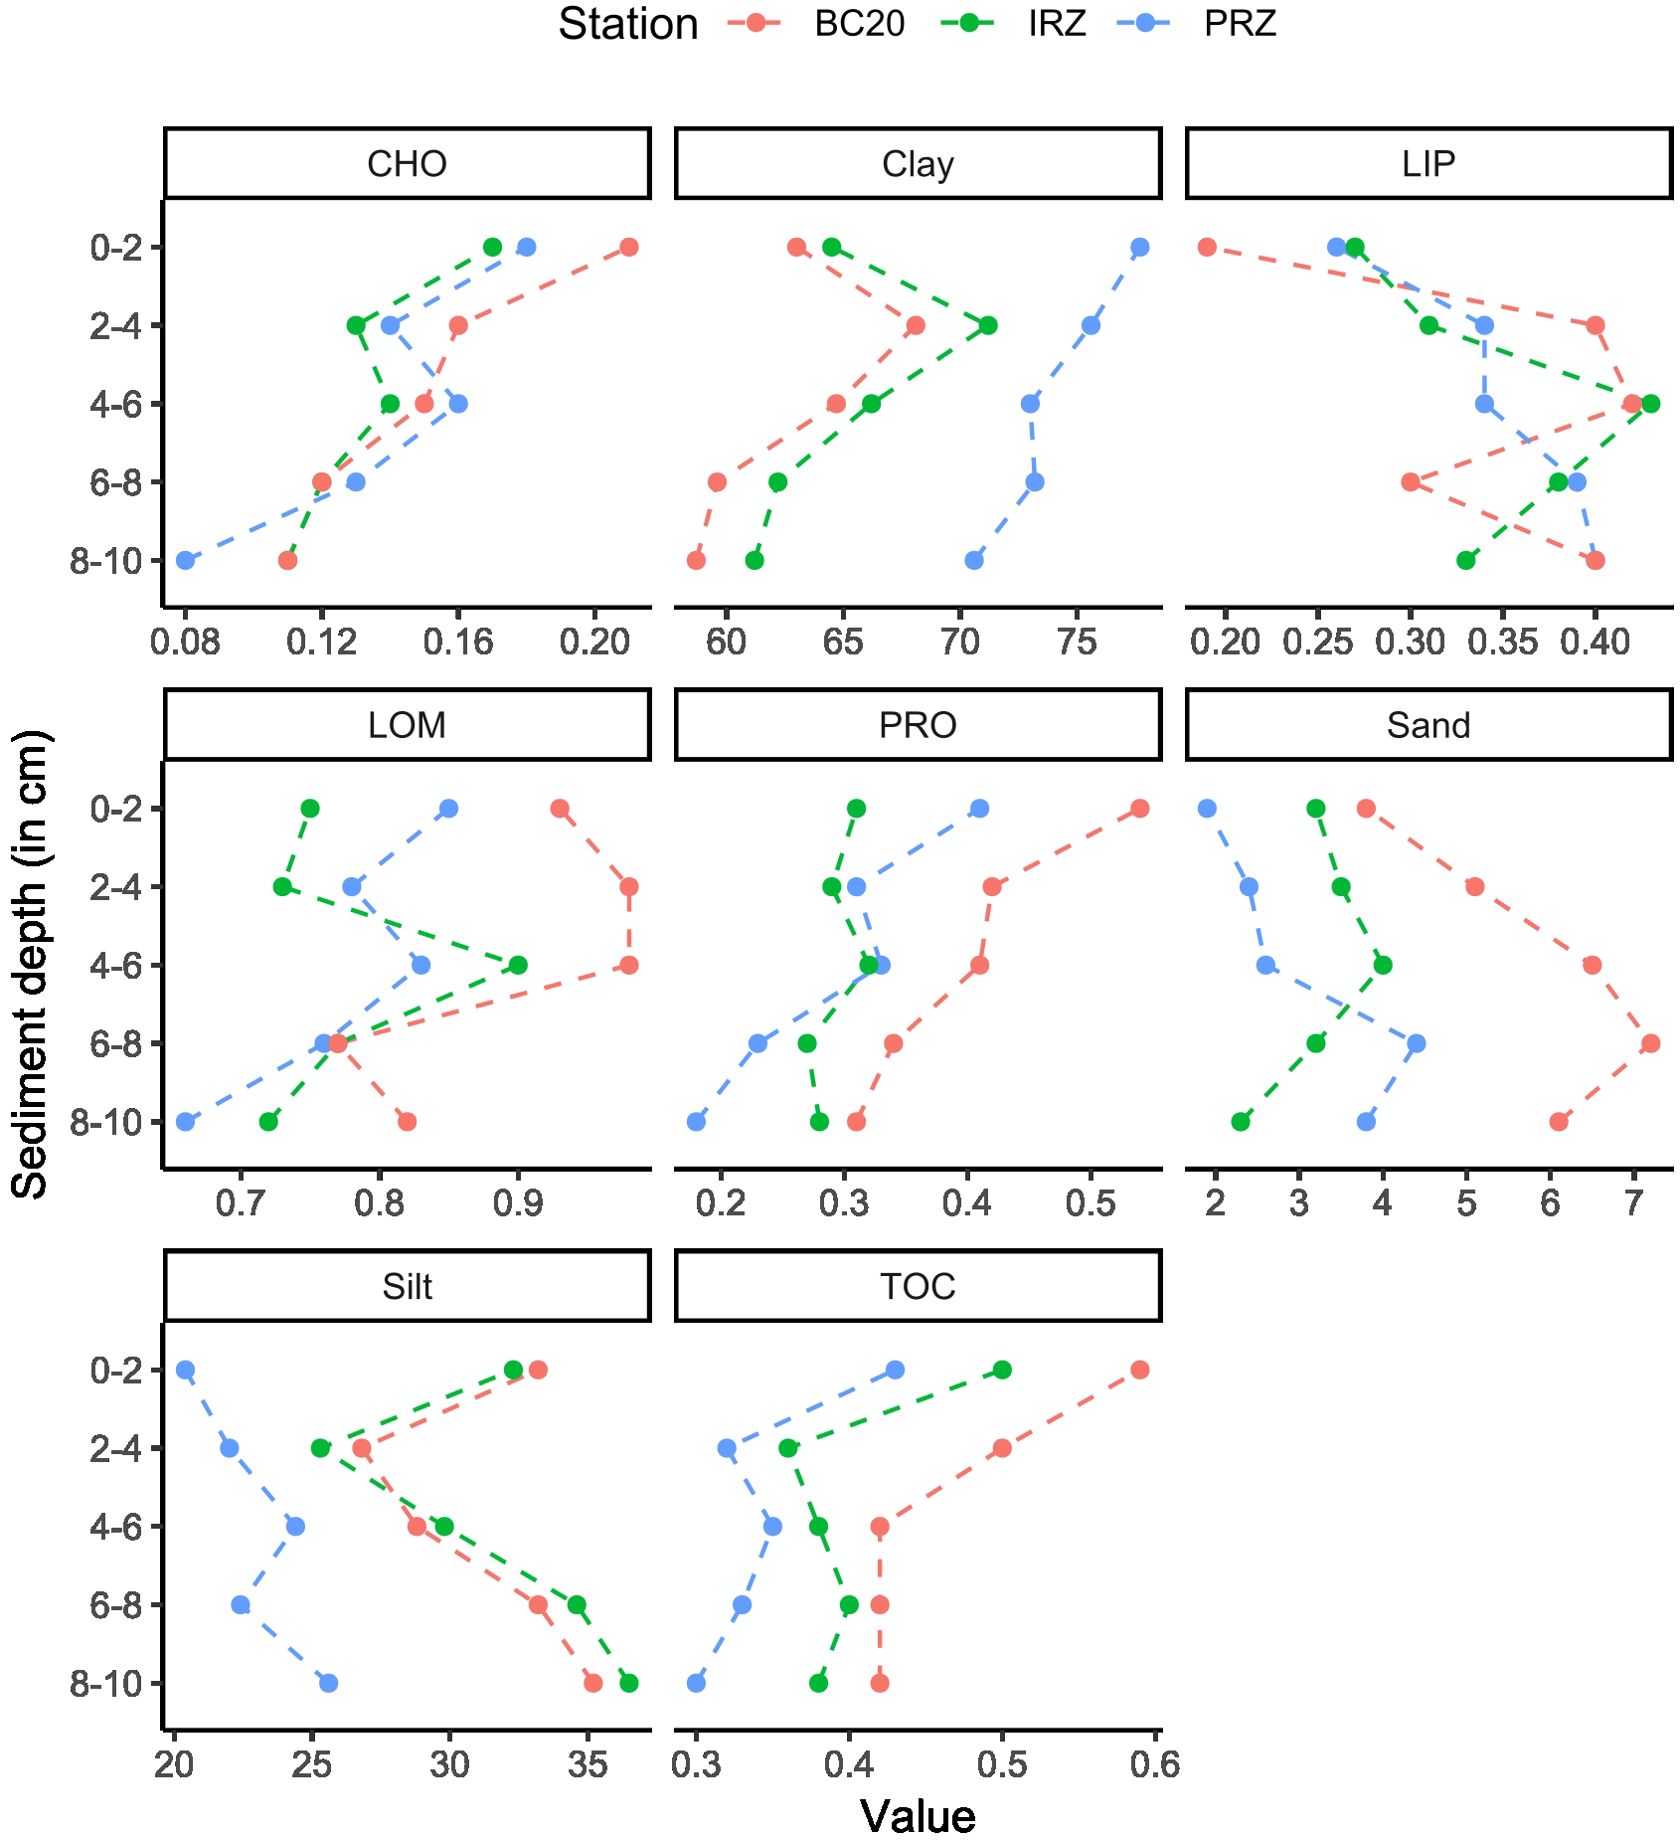
Figure 3. Total organic carbon (TOC; %), total carbohydrate (CHO; mg g−1), total protein (PRO; mg g−1), total lipid (LIP; mg g−1), labile organic matter (LOM; mg g−1), sand (%), silt (%), and clay (%) in the top 10 cm sediment layers across three sites (BC20, PRZ, and IRZ) in CIOB.
Our findings encompass the macrobenthic community sampled using both the multi- and box corers, presented together for the purpose of comparison. A total of 337 macrobenthic individuals (> 300 µm) were observed and analyzed from nine replicates of multicore liners and six box corers in the current study. The fauna was categorized into 106 morphospecies and 18 higher taxa, spanning nine phyla (Supplementary Table S3).
As per the multicorer sampling method, the highest macrobenthic density was recorded from IRZ (1,953.31 ± 375.63 ind. m−2) and PRZ (1,953.31 ± 588.77 ind. m−2), while the lowest abundance was at BC20 (1,762.2 ± 173.79 ind. m−2). Overall, the community structure did not differ much between the sites (Table 2). Across all taxa, Nematoda emerged as the most prevalent group, constituting 52.06% of the total, followed by Harpacticoida (27.72%), Polychaeta (9.74%), Calanoida (3.37%), Isopoda (1.50%), Ostracoda (1.12%), and Tanaidacea (1.12%). Other taxa contributed 3.31% to the total fauna, and each taxon contributed less than 1% (Supplementary Table S5). In macrofauna (“sensu stricto”), Polychaeta (66.67%) was the most dominant taxon, followed by Isopoda (10.26%) and Tanaidacea (7.69%). The other taxa (Ophiuroidea, Bivalvia, and Porifera) contributed equally, 5.13% each.
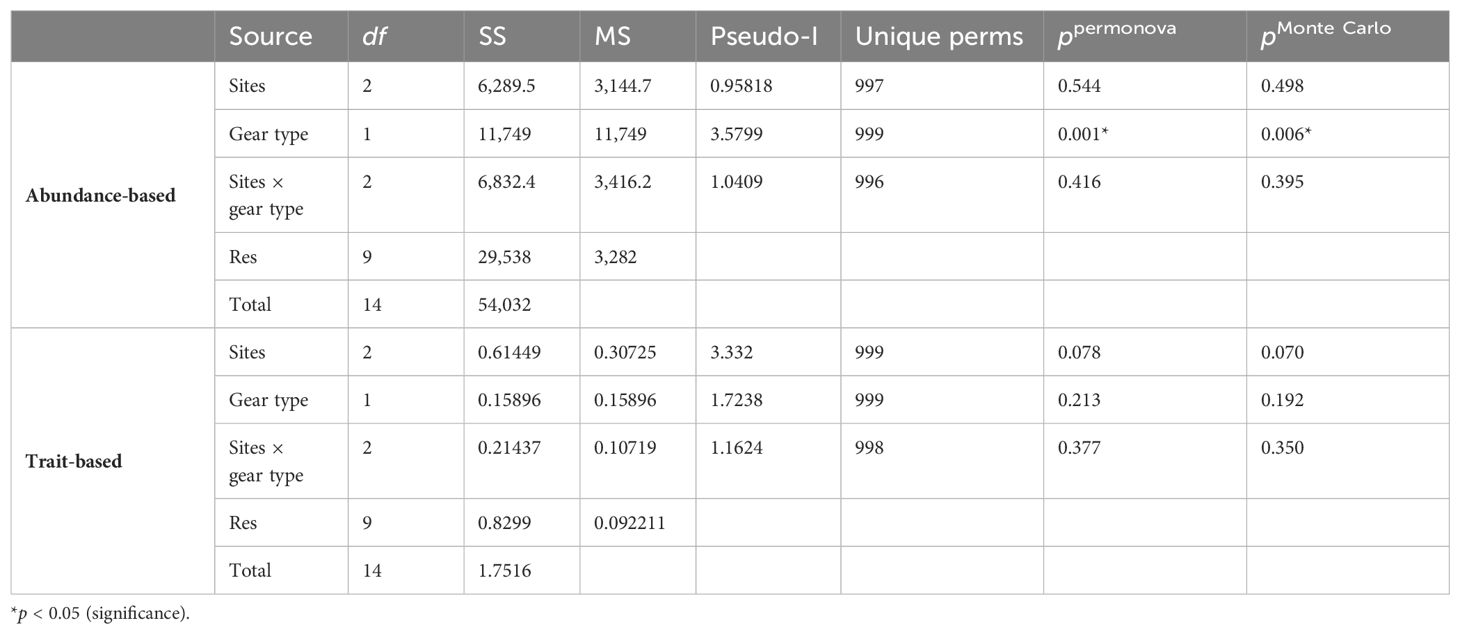
Table 2. The two-way PERMANOVA main test showing difference in abundance- and trait-based macrobenthic community structure (using macrobenthos “sensu lato” abundance) between two types of sampling gears and sites in the PMN area, Central Indian Ocean Basin (CIOB).
The box corer deployment revealed that the highest macrobenthic abundance was recorded from BC20 (110 ± 10 ind. m−2), followed by PRZ (64 ± 40 ind. m−2), while the lowest abundance was at IRZ (60 ± 0 ind. m−2). The Nematoda was the dominant taxon, contributing 23.08% of total abundance in box corers (Supplementary Table S5). The following dominant taxa were Harpacticoida (20.51%), Polychaeta (10.26%), Acari (9.40%), Isopoda (9.40%), Tanaidacea (5.98%), and Ostracoda (5.13%); Bivalvia, Sipuncula, and Clitellata contributed equally 3.42% each and other taxa (i.e., Calanoida, Amphipoda, Decapoda, and Nemertea) contributed collectively 5.98% and less than 2% each (Supplementary Table S5). The highest contribution to the macrofauna (“sensu stricto”) was made by Polychaeta (25.53%), followed by Isopoda (23.39%) and Tanaidacea (14.90%). The Clitellata, Bivalvia, and Sipuncula contributed equally with 8.52%, and other taxa (Amphipoda, Decapoda, and Nemertea) contributed 10.62%. Finally, the macrobenthic community structure did not vary significantly between sites across sampling gears or between sampling gears (Table 3).
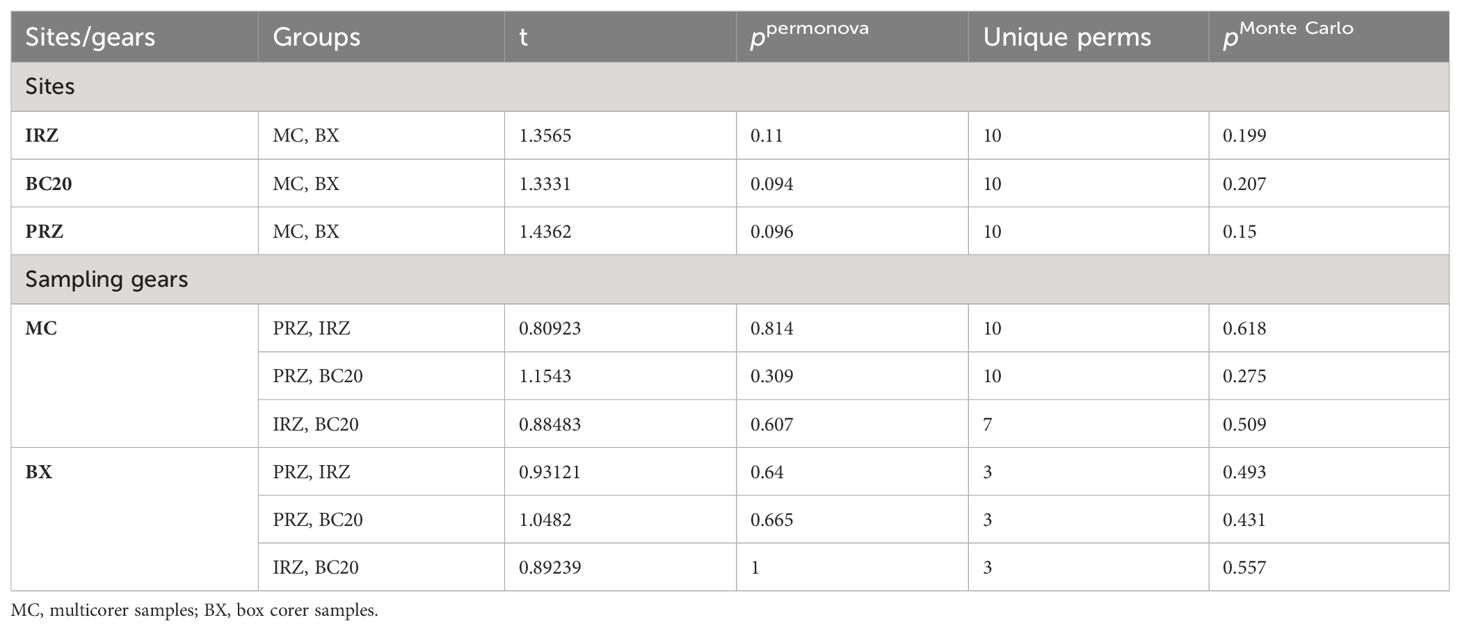
Table 3. Two-way PERMANOVA pair-wise test showing difference in density-based macrobenthic community structure (using macrobenthos “sensu lato” abundance) between sites across type sampling gears and between type sampling gears across sites in the PMN area, Central Indian Ocean Basin (CIOB).
In total, 117 individuals were collected in box corer and 220 in multicorer; 39 and 46 morphotypes were unique to multi- and box corer, respectively. However, 21 morphotypes were found commonly in both sampling gears (Figure 4A). Furthermore, BC20 showed the most unique taxa in both gears, followed by IRZ and then PRZ (Figure 4B). The typical meiofaunal taxa were largely captured by the multicorer system, contributing 85.39% of macrobenthos abundance, and box corer captured relatively low (59.82%). Out of 18 higher taxa, 13 and 14 occurred in multi- and box corer sampling types across all the sites, respectively. Only nine taxa (i.e., Polychaeta, Acari, Calanoida, Harpacticoida, Isopoda, Tanaidacea, Ostracoda, Bivalvia, and Nematoda) occurred in both sampling gears. The mean number of morphospecies (S) was reported 26–39 in multicorer and 22–35 in box corer sampling types. The S was found highest in BC20 (36 and 35) and lowest in PRZ (26 and 22) considering multi- and box corer samples, respectively. The Margalef’s richness (d), Pielou’s evenness (J’), and Shannon–Wiener diversity (H’) showed the lowest values in IRZ and highest in BC20 using multicorer compared to box corer (in BC20). However, the d showed a similar trend of high and low to S in multicorer samples (Supplementary Table S6). The J’ and H’ are also highest at BC20 but H’ was similar in PRZ and IRZ, whereas, J’ was found to be lowest in IRZ. Besides these little differences, the sites were not significantly different in any of the indices based on multi– or box corer (Table 4).
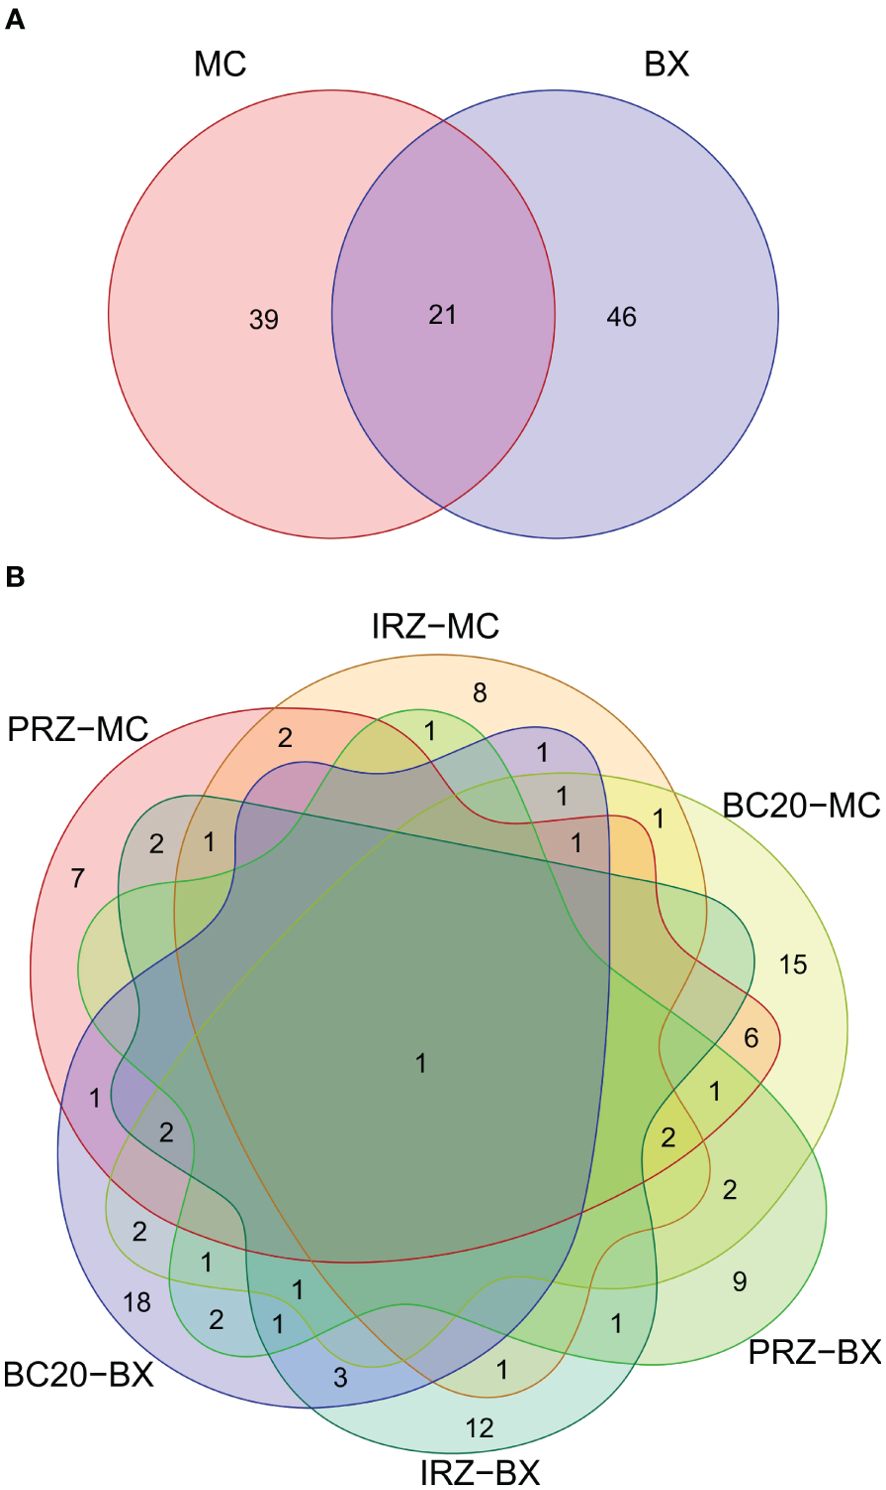
Figure 4. The Venn diagram depicts the overlap of macrobenthic species (number of species/β diversity) between the sampling gear types and the sites: (A) between sampling gears multi- (MC) and box corer (BX) and (B) between sites across sampling types.
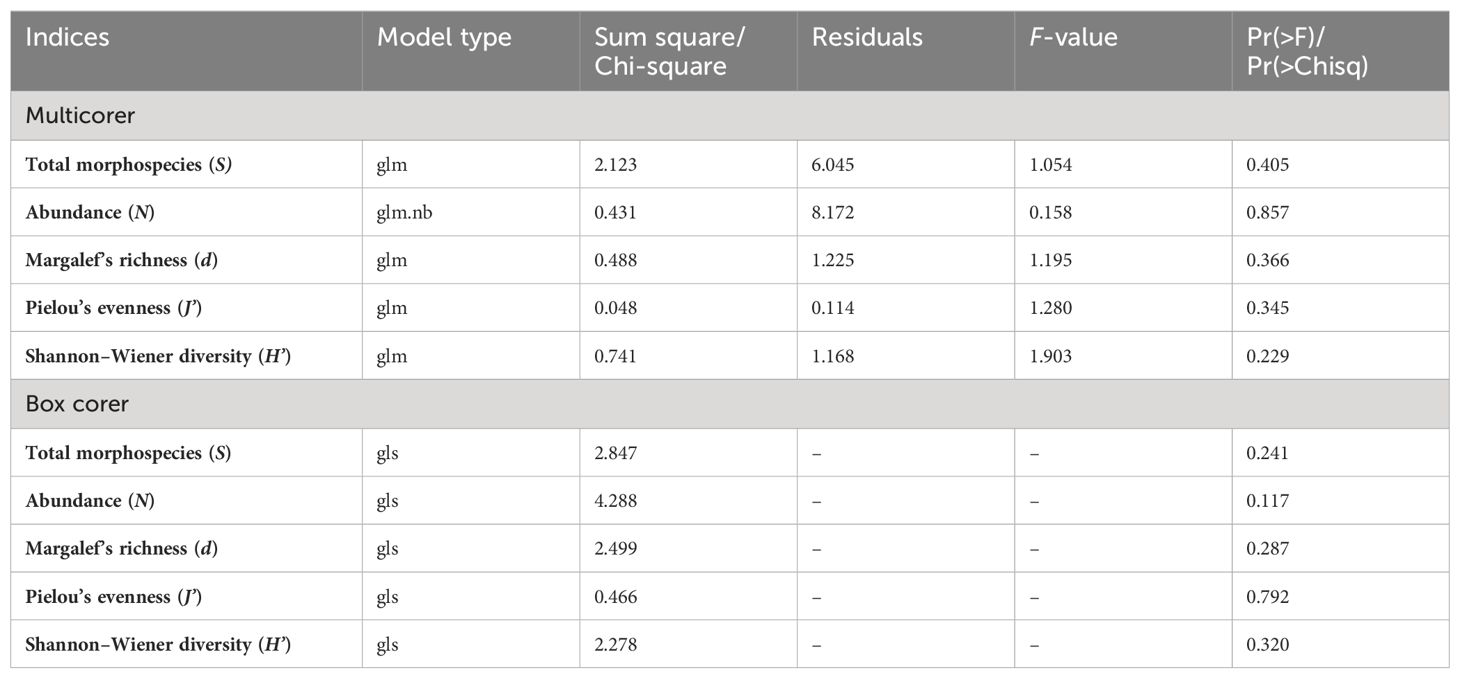
Table 4. Generalized linear model results showing differences in univariate indices between sites and sampling gear types.
The mean estimated biomass (macrobenthos) was recorded as 0.08 ± 0.01 g m−2 and 0.02 ± 0.01 g m−2 based on multi- and box corer sampling types, including all sites, respectively. The multicorer site showed the highest 0.09 ± 0.02 g m−2 in both IRZ and BC20 sites, followed by PRZ (0.08 ± 0.03 g m−2) (Figure 5A). The box corer samples revealed the highest biomass was found in IRZ 0.05 ± 0.03 g m−2 and lowest in PRZ and BC20 (Figure 5B). Polychaeta contributed the highest to total biomass, with 57.78%, 41.23%, and 56.13% in PRZ, IRZ, and BC20 in multicorer samples, respectively (Figure 5C). In PRZ of box corer samples, Bivalvia contributed the highest to the total biomass with 29.68%, followed by Amphipoda and Polychaeta with 22.97% and 17.67%, respectively. Tanaidacea (80.01% and 28.64%) contributed the highest to the total biomass of IRZ and BC20, followed by Polychaeta with 10.37% and 23.63% respectively.
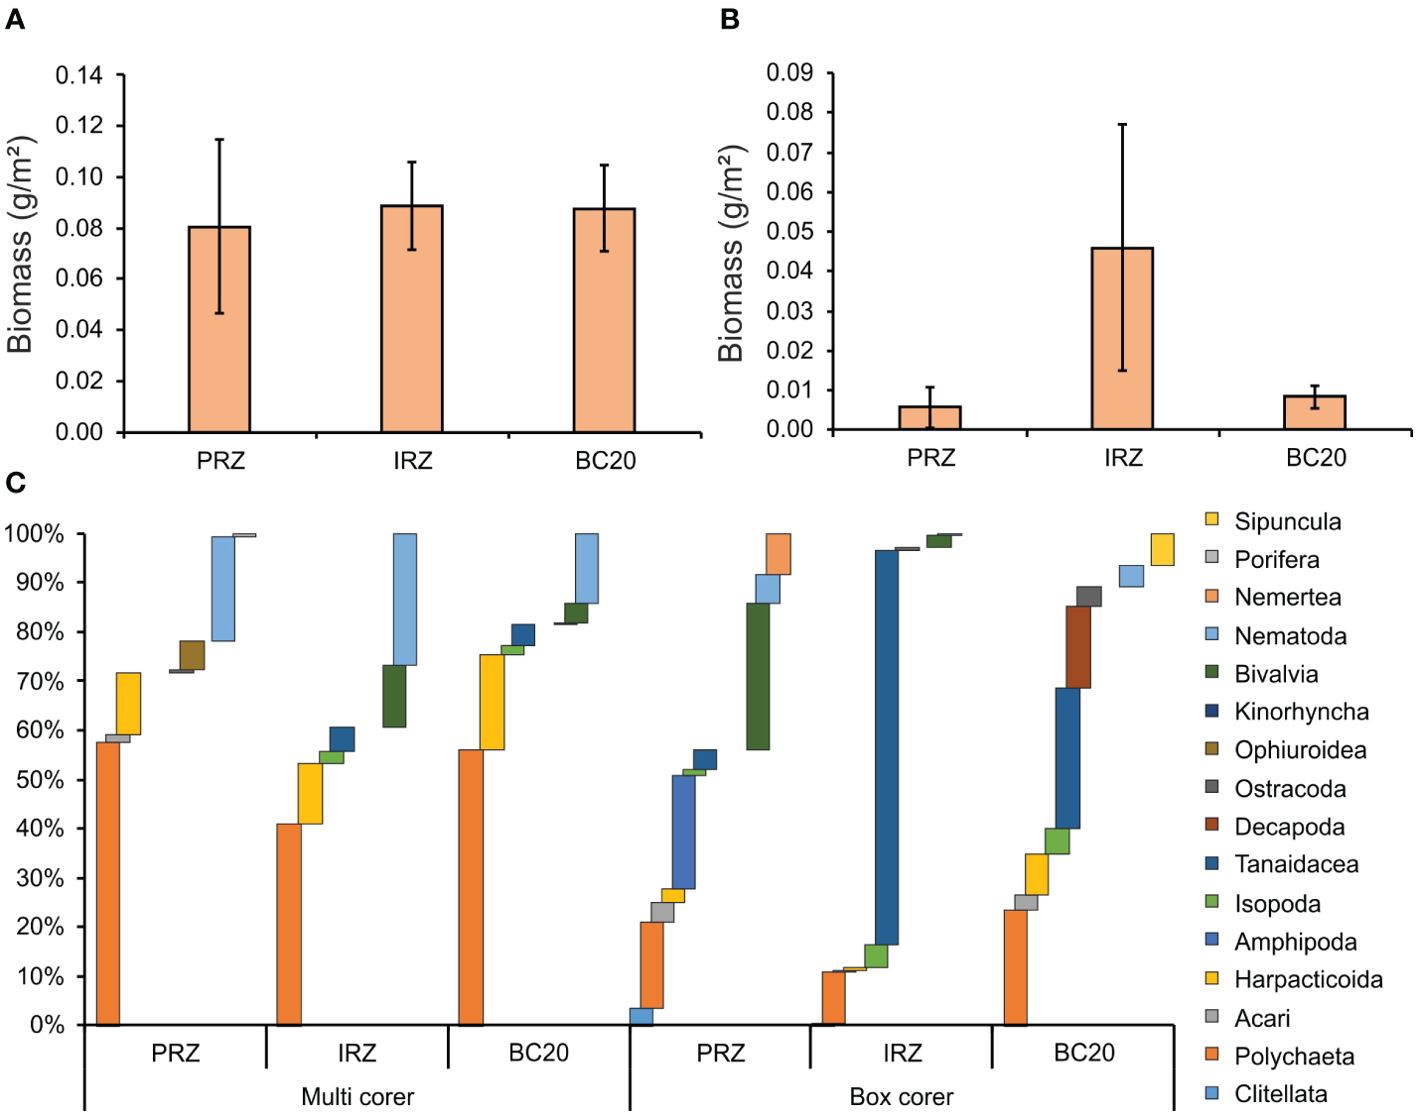
Figure 5. The mean estimated biomass multicorer (A); box corer (B) and percentage composition of higher-level taxa (C) across sampling gears and the sites of PMN area.
The total abundance of macrobenthic fauna decreased with increasing depth of the sediment layer (Figure 6A), showing that most of the macrobenthic fauna is restricted to the top 0–5 cm of the sediment cores, which contained > 92% (> 800 ind. m−2) of macrobenthos in all the sites. The top 0–5 cm of the sediment cores contributed 93.51%, 95.89%, and 92.86% of fauna to macrobenthos at PRZ, IRZ, and BC20 sites, respectively. The composition of 42.86% (840.77 ind. m−2), 60.27% (1,121.03 ind. m−2), and 61.43% (1,095.55 ind. m−2) of macrobenthic fauna was contributed by a 0–1-cm sediment layer in PRZ, IRZ, and BC20 sites, respectively (Figure 6B). In all three sites and the upper 0–5 cm, Nematoda was the most dominant taxon, followed by Copepoda and Polychaeta.
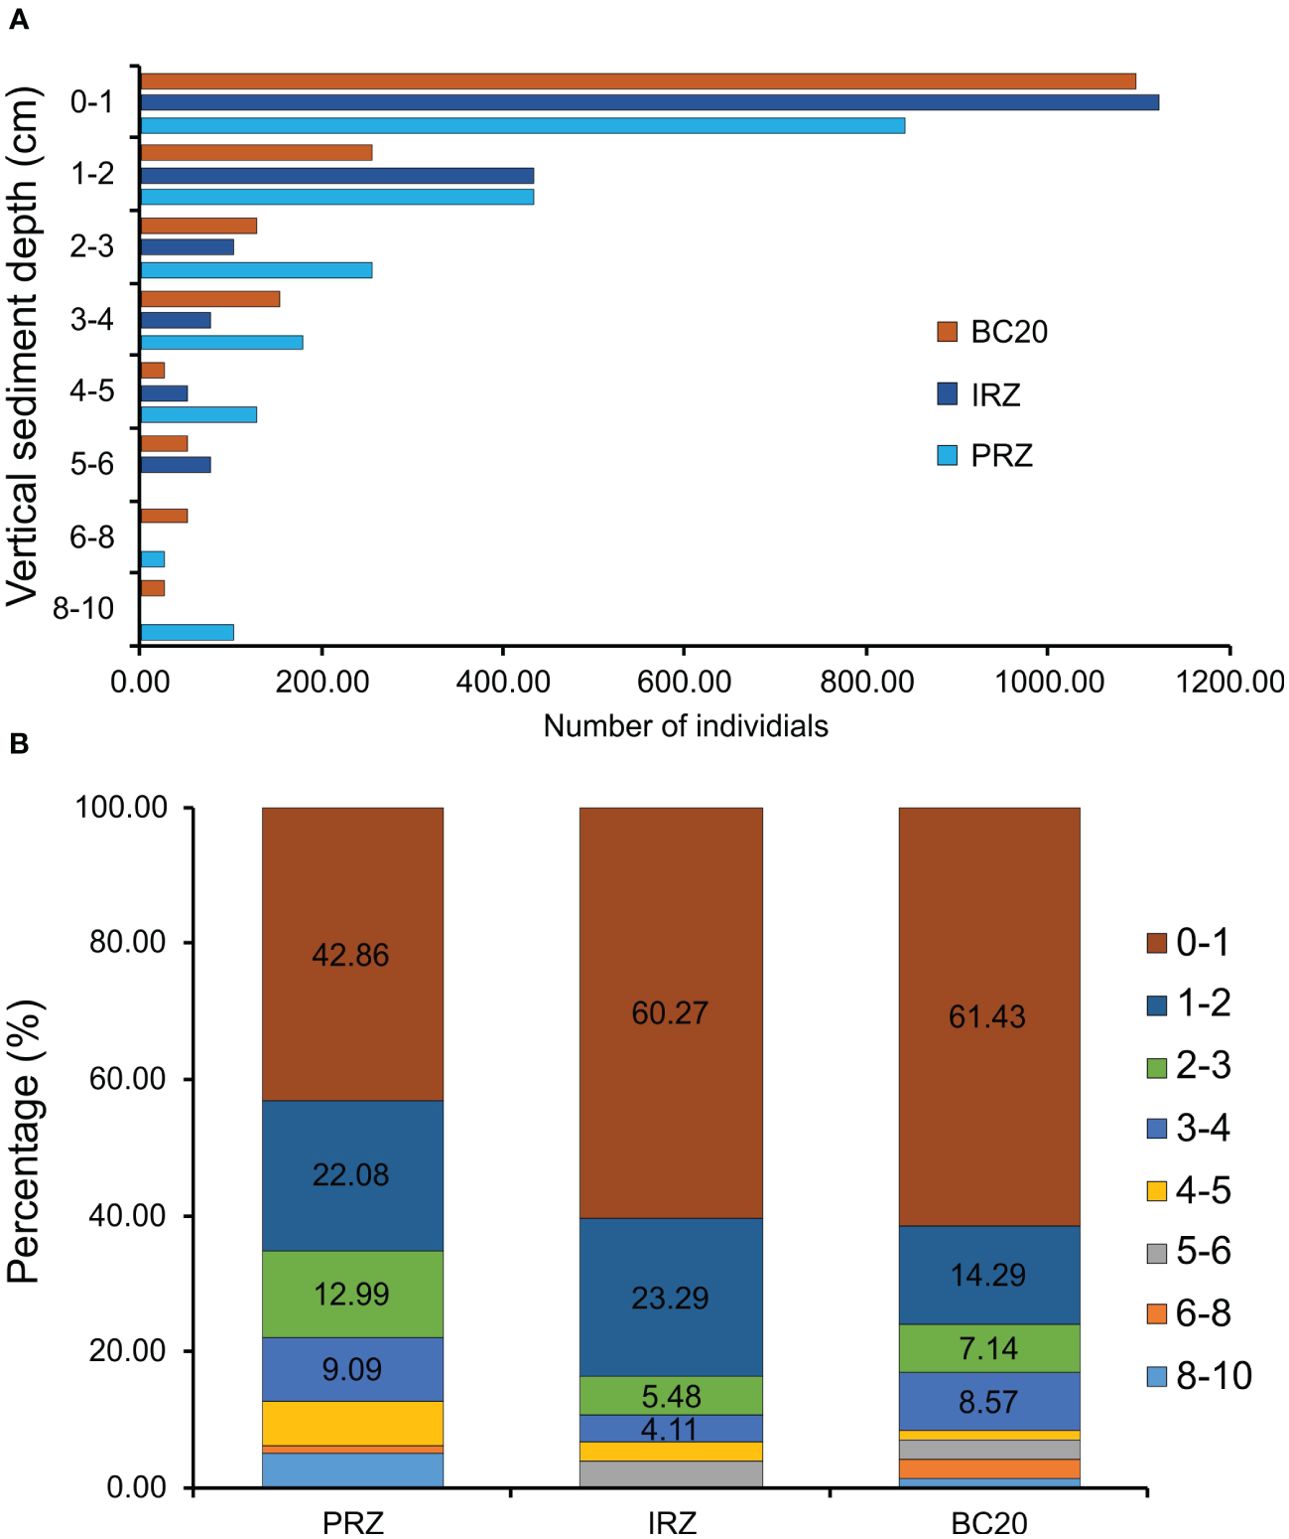
Figure 6. Vertical distribution and contribution of each sediment layer to total macrobenthic abundance in multicorer sediment samples across three sites in the PMN area, Central Indian Ocean Basin (CIOB). (A) Vertical distribution; (B) contribution in percentage to each sediment layer.
The present study revealed the presence of 17 morphospecies of polychaetes across 12 families, as detailed in Supplementary Table S3. The collective contribution of polychaetes to macrobenthos was noteworthy, constituting 9.72% and 10.22% in multi- and box corer samples, respectively. In multicorer samples, Cirratulidae sp., Lacydoniidae sp.1, Opheliidae sp., Amphicorina bansei, and Exogone sp.1 collectively contributed 6.00% to macrobenthos, which comprised 11 morphospecies and a few unidentified. The analysis of box corer samples revealed the presence of nine morphospecies of polychaetes, with two dominant species, Aricidea sp. and Sabellidae sp. of the total polychaete fauna (Supplementary Table S3). In multicorer samples, the morphospecies richness (S) of polychaetes ranged from four to five in multicorer (Supplementary Table S6). Notably, the BC20 site exhibited the highest richness and density, recording values of five and 233.33 ± 76.59 ind. m−2, respectively, while the lowest values were observed at IRZ for S and PRZ for density. BC20 displayed the highest diversity indices, i.e., d, J’, and H’. In contrast, box corer samples exhibited lower morphospecies richness (2) and density (4 ind. m−2) in PRZ. The highest values of S were reported in IRZ and density in BC20 in box corer samples. Noteworthy variations in diversity indices were observed, with PRZ exhibiting the highest d, PRZ and IRZ showing the highest J’, and IRZ displaying the highest H’.
Within the Malacostraca fauna, the Tanaidacea emerged as the most dominant group in the current study. A total of six morphospecies of Tanaidacea were identified, with two encountered in multicorer samples and five in box corer samples. Collectively, these Tanaidaceans contributed 1.12% (multicorer) and 5.97% (box corer) to macrobenthos (Supplementary Table S5). Analysis of multicorer samples revealed that among Tanaidaceans, Leptognathiidae sp.3 dominated, followed by Leptognathiidae sp.1 (Supplementary Table S3). In contrast, Tanaidomorpha sp.1 and Leptognathiidae sp.2 were the predominant morphospecies in box corer samples, each contributing 28.48%. In multicorer, tanaids were only reported at the IRZ site (Supplementary Table S6). Contrastingly, IRZ has the highest mean density, S and H’, of tanaids using box corer. It is worth mentioning that diversity indices in multicorer samples were neglected due to the presence of only two morphospecies. Furthermore, Isopoda was also recorded in very low amounts, similar to tanaids, making it difficult to compare between sampling gears.
Copepods were recorded as the second most dominant group among meiofauna (> 300 µm), contributing significantly to macrobenthos composition. In the PMN region, a total of 20 distinct morphospecies were identified, with 16 and 12 morphospecies observed in multi- and box corer samples, respectively, collectively constituting 31.44% and 22.19% of macrobenthos (Supplementary Table S5). Harpacticoid copepods within the Copepoda class were particularly diverse and abundant, with 16 morphospecies spanning nine families reported in the study region. Among these, the family Aegisthidae stood out as the most diverse and dominant, followed by Argestidae (Supplementary Table S3), with unidentified harpacticoids exhibiting overall dominance. In multicorer samples, Parameiropsidae sp. made the highest contribution to the harpacticoid fauna, followed by a combination of Aegisthidae sp.3 and Canthocamptidae sp.1, Argestidae sp.2, Argestidae sp.3, and Ectinosomatidae sp.2. In box corer samples, on the other hand, Nannopodidae sp. dominating in copepod community. The diversity indices reflected distinct patterns between the two corer types. Multicorer samples exhibited the highest species richness (S) ranging from 9 (PRZ) to 11 (IRZ and BC20), whereas box corer samples showed a slightly lower richness ranging from 3 (PRZ and IRZ) to 10 (BC20) (Supplementary Table S6). Density patterns followed a similar trend. Interestingly, the d was lowest in multicorer samples except BC20 using box corer, while H’ showed contrasting results. Evenness (J’) remained equal in both sampling types. Site BC20 demonstrated the highest copepod density, while IRZ and PRZ exhibited comparable values.
Nematodes were the most dominant and diverse taxa, comprising 31 morphospecies belonging to 14 families, including several unidentified species. Notably, Chromadoridae, Desmodoridae, Ironidae, Oncholaimidae, and Oxystominidae stood out as dominant and diverse families among nematodes in the region. These nematodes contributed 52.02% and 23.03% to macrobenthos in multi- and box corer samples, respectively (Supplementary Table S5). In the multicorer, Desmodoridae sp.2, Oncholaimidae sp.1, and Oxystominidae sp.3 were particularly dominant. While Sphaerolaimidae sp., Dorylaimida sp., Oncholaimidae sp.1, and Oncholaimidae sp.3 held dominance in box corer samples (Supplementary Table S3), a total of 20 and 15 morphospecies were encountered in multi- and box corer samples, respectively. The morphospecies richness (S) was highest in multicorer samples, ranging from 8 (PRZ) to 17 (BC20), while box corer samples exhibited lower values (5–11). Density peaked in IRZ (multicorer) and BC20 (box corer), while species richness was highest in BC20 across both sampling types. In multicorer samples, H’ reached its highest value of 1.1 ± 0.28, whereas d and J’ per site were highest in BC20 and lowest in PRZ. In box corer samples, d was highest in IRZ, while J’ was nearly equal in IRZ and BC20 (Supplementary Table S6), and H’ was highest at BC20.
Mobility and sediment reworking traits exhibited distinct differences in sampling gear based on the total abundances of morphospecies associated with specific traits. However, the community-weighted mean (CWM) of traits did not significantly differ in gear types (Table 2). The multicorer method predominantly captured a high abundance of traits, whereas the box corer exhibited considerably less abundance of these traits (Figure 7). This discrepancy could be attributed to the consideration of abundance-weighted traits. However, the variation is much less pronounced or comparable when only the count is considered without weighting. Moreover, relying solely on counts could introduce bias to the results, as abundance serves as a crucial measure of intensity per unit area. Therefore, we considered an abundance-weighted total for each trait. In mobility traits, less motile and discretely motile modalities were dominant among all. Sessile fauna very rarely occurs only in multicorer (PRZ and IRZ) and box corer (BC20). Surficial modifiers emerged as the dominant factor in the PMN region, closely followed by biodiffusors and upward/downward conveyors. Epifauna, on the other hand, was exclusively observed in the PRZ of multicorer samples. In the IRZ multicorer samples, surficial modifiers held sway. These findings illustrate the prevailing presence of fauna with slow and limited mobility, particularly those capable of surface diffusion that moves particles horizontally across the surface in polymetallic nodule fields.
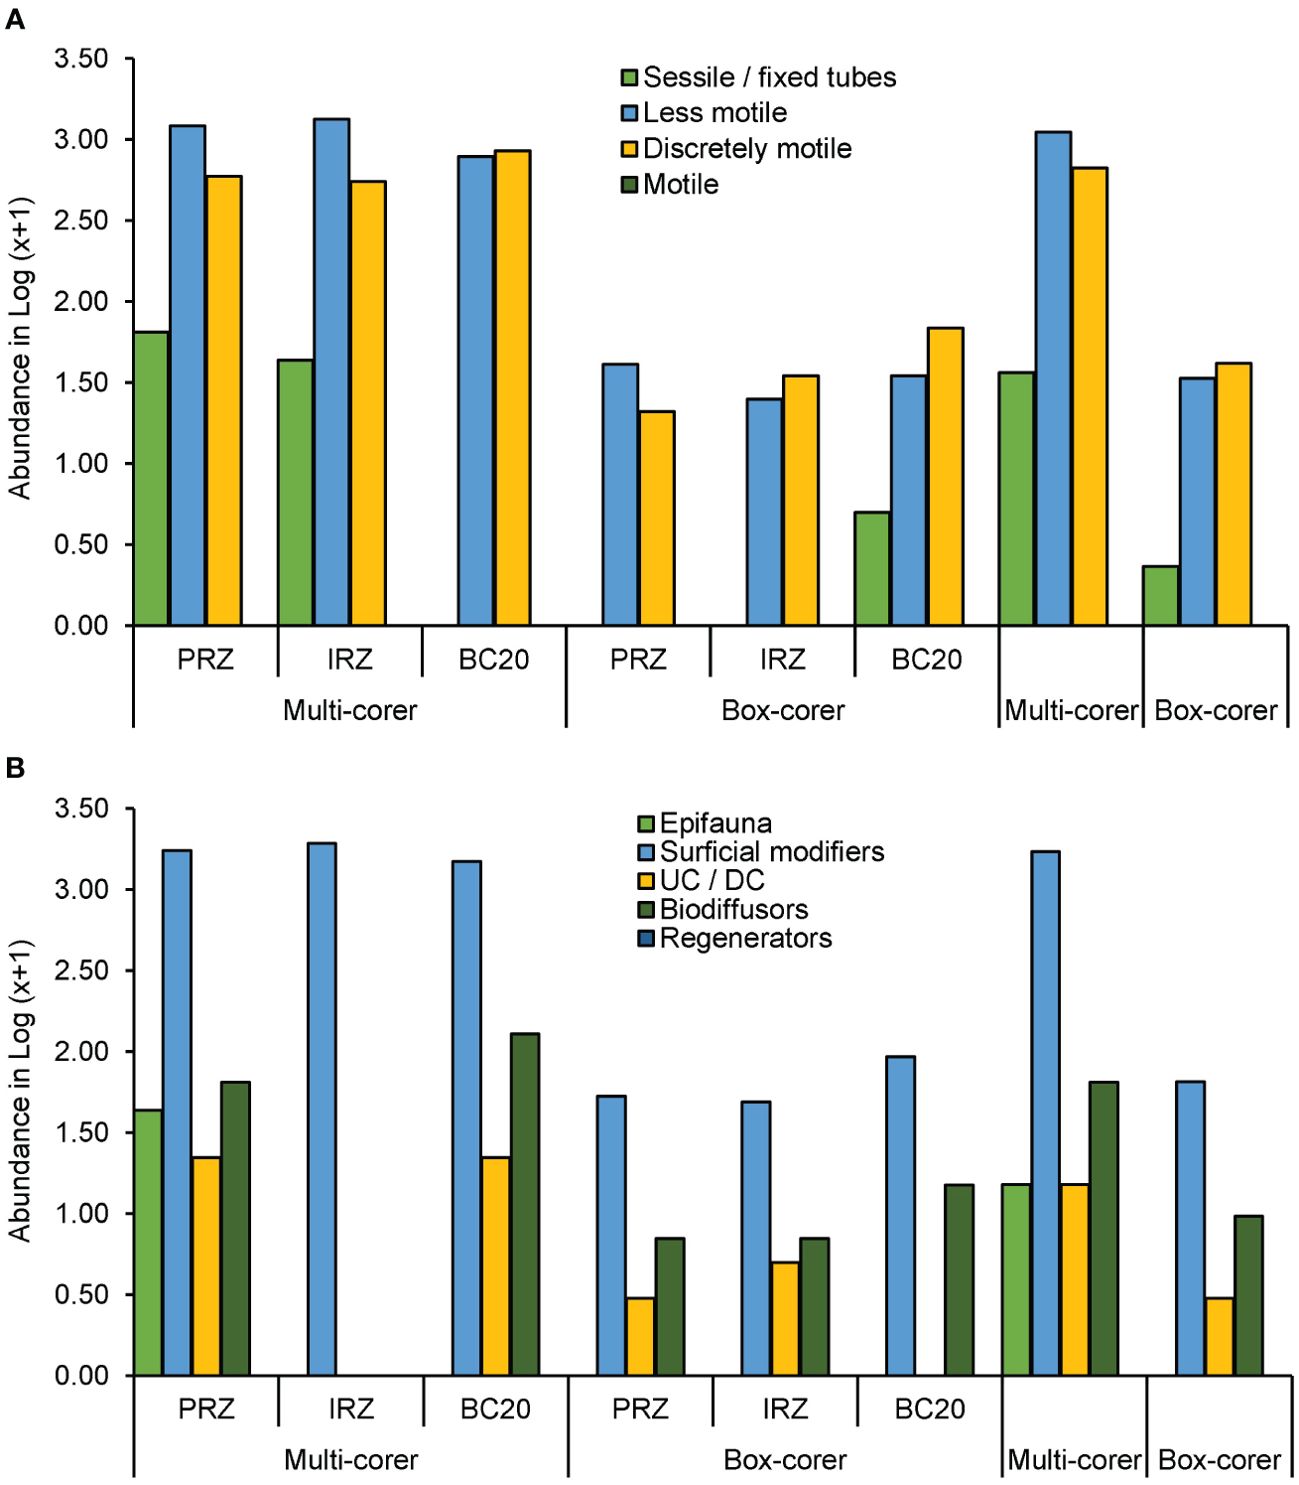
Figure 7. Distribution of functional trait associated with bioturbation and abundance weighted by species density represented in Log(X+1): (A) Mobility trait abundance and (B) sediment reworking capability abundance.
Results of the CCA (first two axes) show the species–environmental correlations were explained by only two constrained first and second axes (Figure 8). Eigenvalues for axes CCA1 and CCA2 are 0.55 and 0.27, respectively, and the variation explained by these axes are 67.07% and 32.93%, respectively, indicating marginally high relationships with the environmental variables selected. Furthermore, the permutation test for CCA axes under a reduced model (999 permutations) showed that CCA1 was most efficient (near significance) in explaining the variation among parameters (p = 0.08). The analysis was performed separately in two groups: firstly, nutrients and pH, and secondly, food-related parameters to decrease the redundancy due to multicollinearity. The variables pH and PO4³−-P were highly correlated with CCA2 (Figure 8A), and CCA1 was correlated with CHO and TOC. CCA showed that the pH and PO4³−-P were high towards the IRZ site as the IRZ and PRZ were aligned with CCA2. However, CHO and TOC were majorly related to the BC20 site.
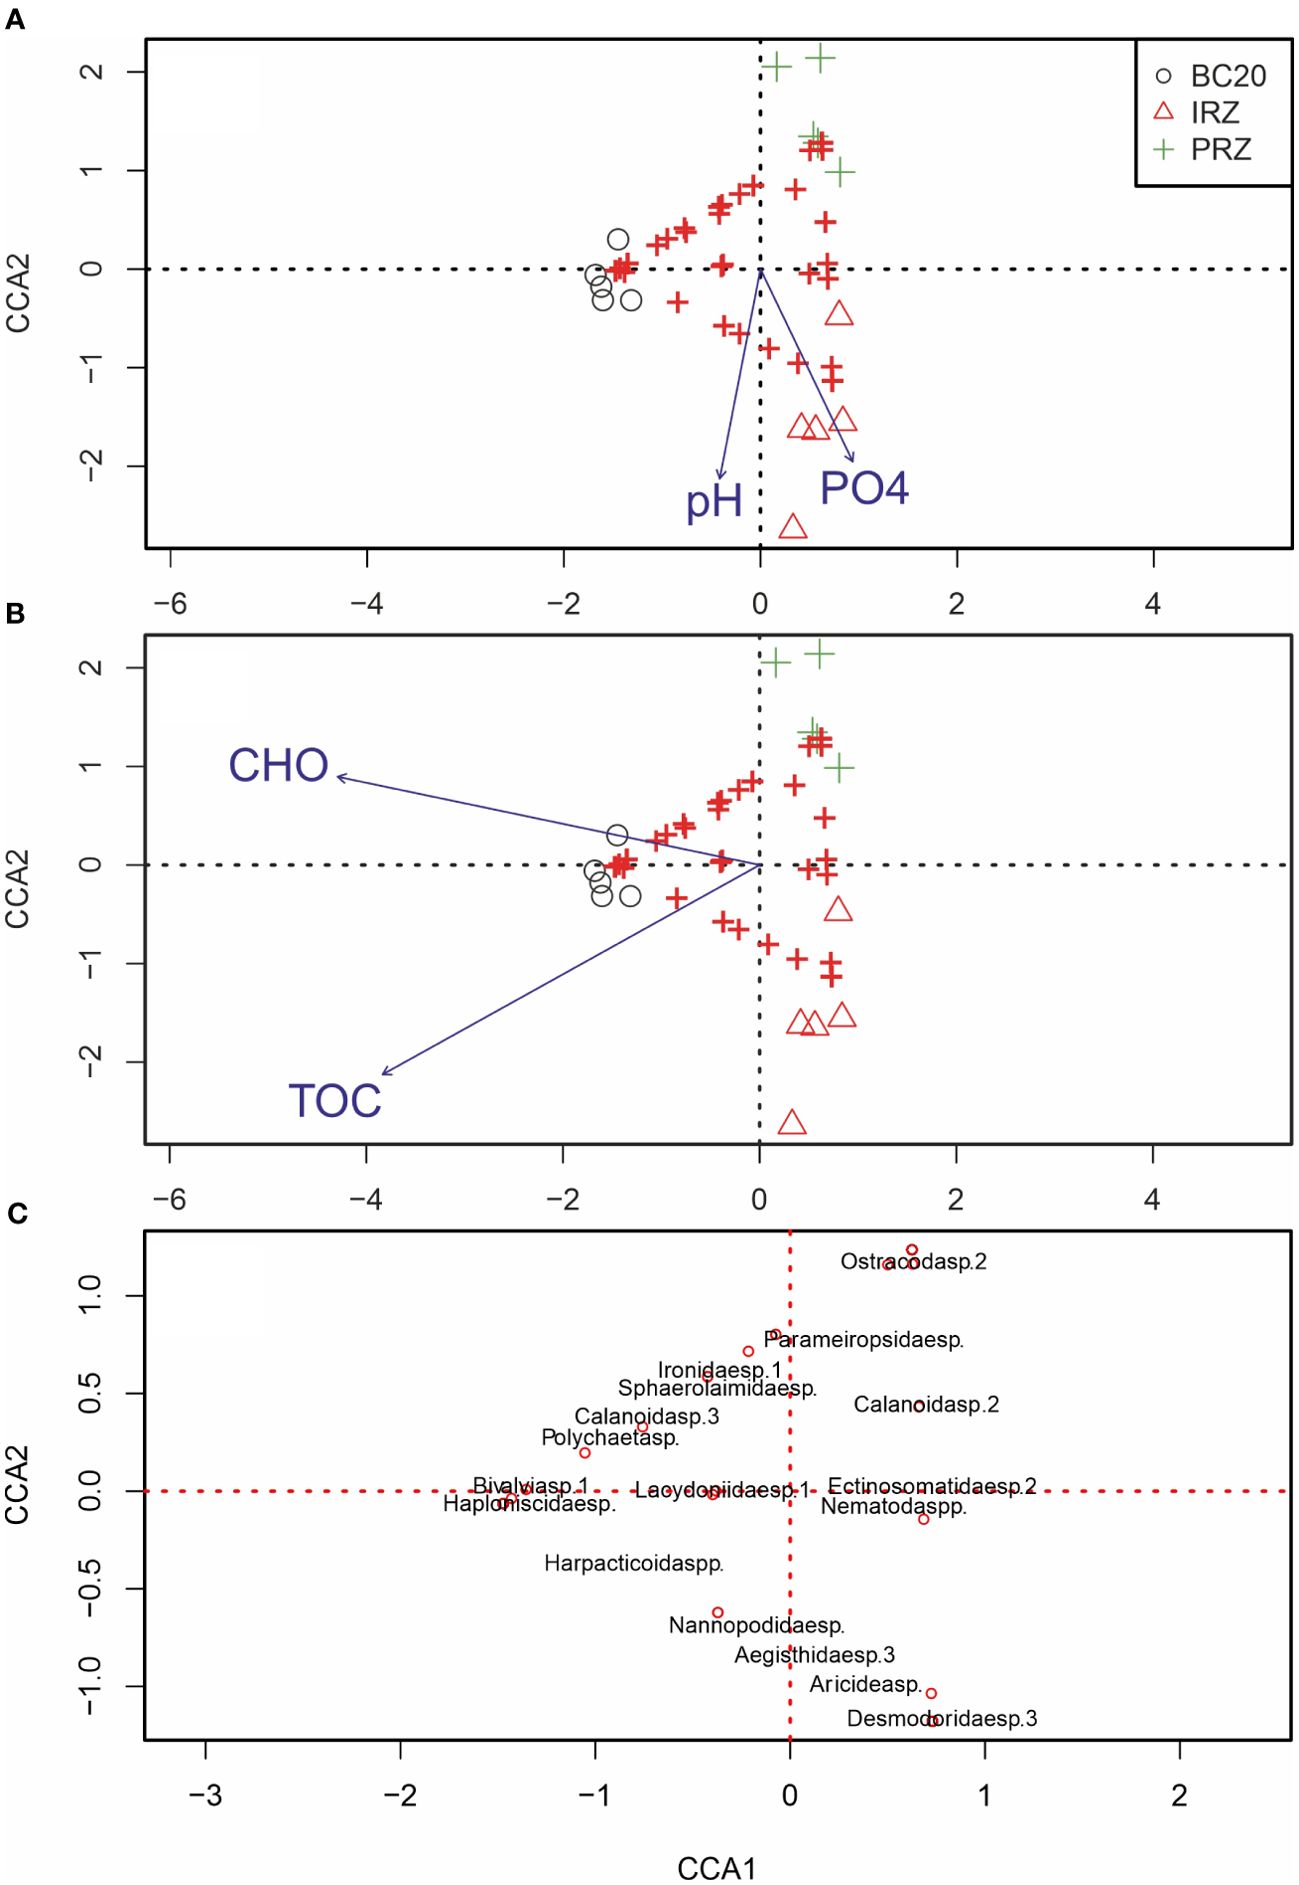
Figure 8. Canonical correspondence analysis (CCA) compares the macrobenthic community structure (plus symbols; multi- and box corer data combined) and environmental factors (blue arrows). Environmental factors displayed were selected based on significance calculated from individual CCA results calculated during CCA. Salinity, sand, silt, and clay were removed from the analysis. (A) Pore water chemical parameters (pH, phosphate, nitrate, nitrite, and silicate); (B) sediment characteristics, mainly food-related parameters (TOC, carbohydrates, protein, lipid, and LOM); (C) the majorly influenced species were fitted on the same CCA plot.
The harpacticoid copepods (Harpacticoida spp., Nannopodidae sp., and Aegisthidae sp.3), polychaete Aricidea sp. (family Paraonidae), and the nematode Desmodoridae sp.3 were positively related to pH and PO4³−-P. Whereas, ostracods (Ostracoda sp.2), harpacticoid copepods (Parameiropsidae sp.), and nematodes (Ironidae sp.1 and Sphaerolaimidae sp.) were negatively related. The copepods (Harpacticoida spp. and Calanoida sp.3), Bivalvia sp.1, isopod (Haploniscidae sp.), nematodes (Ironidae sp.1 and Sphaerolaimidae sp.), and polychaetes (Polychaeta sp. and Lacydoniidae sp.1) were significantly positively related to CHO and TOC.
Univariate indices and environment relationship showed S was significantly positively related to NO3−-N, CHO, PRO, and LOM (Supplementary Table S7). The negative relations were observed between S and NO2−-N and LIP. The d and H’ were directly proportional to S, and J’ was also proportional to d and H’. These indirect relations explained that d, J’, and H’ were also positively related to NO3−-N, CHO, PRO, and LOM, as well as a similar relation to S.
The examination and comparison of available literature data from similar surveys were pivotal in our quest to understand metazoan abundance and distribution within the abyss nodule fields, particularly in different PMN regions. One notable observation was the varying mesh sizes used in macrofaunal studies conducted in the CIOB and the Clarion–Clipperton Fracture Zone (CCFZ) regions. In the CIOB, where studies focused on nodule fields employed large mesh-sized sieves of 500 μm, a unique scenario emerged. This choice of sieve size, while capturing macrobenthic organisms, also contributed to relatively low recorded animal abundance in comparison to studies employing smaller mesh sizes (Ingole et al., 2005b; Pavithran et al., 2007). The utilization of large mesh sizes is not uncommon in the deep-sea research community, as it can aid in the collection of larger and more conspicuous organisms. On the other hand, macrofaunal surveys conducted in the Central North Pacific and Peru Basin within the CCFZ region typically adopted a smaller mesh size sieve of 300 and 250 μm (De Smet et al., 2017; Wilson, 2017; Stratmann et al., 2018; Yu et al., 2018; Sweetman et al., 2019; Chuar et al., 2020; Francesca et al., 2021). This choice was consistent with established deep-sea sampling practices and allowed for the collection of a broader spectrum of metazoan taxa. However, it’s important to note that these surveys opted to exclude meiofaunal taxa, i.e., Nematoda, Copepoda, Ostracoda, Acari, and Kinorhyncha, from their analyses to ensure meaningful comparisons with most previous studies in the CCFZ region (De Smet et al., 2017; Wilson, 2017; Francesca et al., 2021; Washburn et al., 2021). In essence, the mesh size utilized in deep-sea sampling can significantly influence the recorded abundance and diversity of metazoan communities. The contrasting mesh sizes used in the CIOB and CCFZ studies reflect the diverse approaches employed by researchers in different PMN regions, each driven by unique research objectives and considerations. Understanding these variations in sampling methodologies is crucial when interpreting and comparing metazoan abundance data from various abyss nodule fields, ultimately advancing our knowledge of these complex deep-sea ecosystems. Few CIOB studies have reported 336 ind. m−2, 376.39 ind. m−2, and 507 ind. m−2, which was the highest faunal abundance among other studies from CIOB, including “meiofaunal” taxa, i.e., Nematoda (Ingole et al., 2001; Ingole and Koslow, 2005; Ingole et al., 2005a). The notion that the inclusion of meiofaunal taxa in the macrofaunal community (macrobenthos) is extremely useful and commendable and is gaining ground recently (Ingels et al., 2021). In the present study, both densities (macrobenthos and macrofauna) were mentioned for a clear understanding of benthic community structure and comparison. It has been recommended that the whole box corer should be used for macrofauna analysis (De Smet et al., 2017). Nevertheless, pseudoreplicates were used in studies from CIOB in the past (Ingole et al., 2005a; Pavithran et al., 2007) and also compared in Supplementary Table S1, thus creating discrepancies in macrobenthic faunal density. Hence, meaningful comparisons between CIOB and Pacific Ocean studies have been challenging so far. In 2009, a similar study reported a total of 66 species in 120 individuals (> 500 μm) from PMN, Indian Ocean (Pavithran et al., 2009a). Contrastingly, 5,199 metazoans (> 250 μm) were collected from 12 box corers in CCFZ and encountered 33 higher taxa (Chuar et al., 2020). The present study encountered 117 metazoan (> 300 μm) individuals in the box corer. Therefore, the available data strongly suggest that the CIOB nodule field has the relatively lowest macrobenthic faunal abundance and higher taxa diversity.
In the current investigation, our examination of the Shannon–Wiener index (H’) revealed a lower diversity compared to other PMN areas within the CCFZ (> 2.0 along the GSR [De Smet et al., 2017]). Polychaetes, widely acknowledged as prominent members of deep-sea macrofaunal communities (Sanders, 1968; Hessler and Jumars, 1974; Wilson, 2017), emerged as the most dominant macrofaunal taxon (macrofauna) in our study, encompassing 17 distinct morphospecies. Surprisingly, tanaidaceans, traditionally recognized as the predominant taxon in the CCFZ located in the northeastern Pacific Ocean (Yu et al., 2018), took a secondary role in our findings. The present study, incorporating nematodes and copepods into the macrobenthos category, witnessed a shift in dominance, with nematodes securing the top position, followed by copepods. This contrasts with the conventional hierarchy, where polychaetes and tanaidaceans typically hold sway. Our observations align with similar dominance patterns reported in the easternmost region of the CCFZ (Chuar et al., 2020; Kaiser et al., 2024).
For vertical distribution, Montagna et al. (2017) reported that more multicorer samples from the top 5 cm sediment depths in various locations of the northern Gulf of Mexico revealed that approximately 90% of faunal communities were concentrated in this uppermost layer. Meiofaunal communities dominated the top 2 cm, while macrofauna extended further down to 10 cm. Similar findings were documented in the Clarion–Clipperton Fracture Zone (CCFZ), with 67% observed in the upper 2 cm, 25% up to 5 cm, and 8% down to 10 cm depths (Chuar et al., 2020). The current study, conducted in the CIOB, aligns with these patterns, highlighting that maximum communities were harbored in the top 5 cm sediment layer across all three sites. Interestingly, previous research in the CIOB contradicted this trend, revealing that benthic fauna was more abundant in the middle (2–5 cm) and lower layers, with traces even in the 20 to 30 cm layer (Pavithran et al., 2009b). This discrepancy may be attributed to the scarce food and surface competition, which may cause the benthic fauna to migrate downward, forming protective tubes that, during sampling, serve as escape routes, leading to inadvertent transport through the sediment layers (Ingole et al., 2005b; Pavithran et al., 2009b).
The methods employed for collection may significantly influence the results of benthic analysis (Jensen, 1981, 1983; Bett, 1994; Hughes and Gage, 2004; Shields and Hughes, 2009). Since 1970, box corers have been used primarily for quantification of deep sediment (Gage and Tyler, 1991); however, few studies have tackled the issue of inefficiency in box corer sampling for macrofauna (Hughes and Gage, 2004; Shields and Hughes, 2009; Blomqvist et al., 2015; Montagna et al., 2017). In this study, we attempt to investigate the differences in methodologies in the abyssal plain of the world’s lowest productive zone (Pavithran et al., 2007). The box corer area coverage at each station was 12.82 times larger than the combined multiple corer sample area. However, a higher mean density of macrofauna (“sensu stricto”) was reported in multicorer (Supplementary Table S6). Polychaetes were dominant in the present study, similarly observed in CCFZ (Bonifácio et al., 2024). Furthermore, total biomass estimates were higher in multicorer samples with less variation between the stations (Figures 5A, B), owing to two possibilities: (1) box corer may have led to a loss of the fauna due to a bow-wave effect before settling on surface sediment and (2) multicorer captured all sized range effectively with much smoother approach near sediment than box corer.
Intriguingly, only multicorer samples were deemed suitable for discerning the densities of small-body-sized fauna (especially Meiofauna). Particularly, nematodes and copepods showed high abundance in the multicorer samples, and many morphospecies captured by the multicorer exclusively did not occur in the box corer samples (Supplementary Table S3; Figure 4). These results indicate the suitability of multicorer usage for macrobenthic fauna collection in the deep sea. Nevertheless, the contribution of smaller organisms retained on a 300 µm mesh to community biomass is relatively minor (Gage et al., 2002). Despite this, there are 11 morphospecies of polychaetes, including motile subsurface deposit feeders, i.e., Cirratulidae sp., Lacydoniidae sp.2, Lumbrineris sp., Opheliidae sp., Amphicorina bansei, and Spiophanes sp. exclusively occurred in multicorer samples and were associated with increased biomass. In contrast, sessile or less motile and large-sized polychaetes, i.e., Glyphanostomum sp., Capitellidae sp.1, Brada sp., Glycera sp., and Sabellidae sp. were found in the box corer samples. Multicorer showed inefficiency in capturing isopods and tanaids, as represented by the low contribution of these taxa to total abundance. Box corer showed the presence of all isopod and tanaids species listed except Leptognathiidae sp.3.
Morphospecies richness and diversity were higher in the box corer compared to the multicorer samples (Supplementary Table S6). This is not surprising, as diversity tends to increase with the sampling area (Lomolino, 2000), and the area covered by the box corers is larger than that of the multicorer. Margalef richness (d) is three times higher in box corer than in multicorer samples. While Shannon–Wiener diversity (H’) was also higher in box corer.
The findings highlighted that smaller fauna, particularly meiofauna, were more likely to be captured by the multicorer, suggesting a potential escape from the box corer. Utilizing box corers for benthic sampling presents a notable advantage by allowing the collection of a more extensive and quantifiable representation of individual organisms over a relatively large area. This comprehensive sampling approach facilitates a nuanced exploration of the diverse benthic community, enhancing the understanding of species diversity within the study area (Montagna et al., 2017). However, it is crucial to recognize the potential drawbacks associated with the use of box corers. One significant concern stems from the generation of bow waves during the sampling process, which can disturb the seabed, resulting in the resuspension of surface sludge and the potential loss of sediments (Blomqvist et al., 2015). This disturbance may result in the displacement or loss of individual organisms within the sampled area, affecting the accuracy of biodiversity assessments and compromising the integrity of ecological data. Furthermore, the present study underscores the advantages of multicorer sampling in some aspects for investigating the vertical distribution of benthic communities and capturing small-sized faunal fractions (Meiofauna). Particularly, where small-sized fractions could be an important component to understanding the whole ecological perspective in the ecosystems characterized by low food availability, such as open water of deep sea zones and potential mining sites. However, the box corer yielded scant additional information regarding the macrobenthic faunal community compared to the insights gained from the much smaller multiple corer samples. The considerable variation in density and diversity responses to the two sampling methods poses a challenge to confidently recommending one technique over the other (Montagna et al., 2017). Thus, the use of both sampling gears will offer more detailed insights into biodiversity and ecosystem functioning.
The composition of functional traits did not differ between the sites and gear types, indicating that there was no discernible influence of spatial structure or gear effects. This lack of differentiation could stem from the fact that many species share similar functions across these traits, highlighting redundancy in their functional roles. However, these functions may still impact the local flux of available nutrients in the sediment. Macrobenthos contributes to increased organic matter inputs through biodeposition, a process where organic materials are released into the sediment as metabolic by-products (Graf and Rosenberg, 1997). Simultaneously, these organisms engage in bioturbation, stirring and mixing the sediments, thereby distributing and incorporating organic materials into deeper strata (Kristensen, 2000; Welsh, 2003). These fundamental aspects of the functional traits, including mobility and sediment reworking, of macrobenthic fauna lie in their ability to enhance organic matter (OM) flux within sediments, influencing nutrient cycling, sediment structure, and overall benthic community dynamics. In the present study, the less motile and discretely motile macrobenthic faunal communities were dominant along all the sites, while sessile fauna very rarely occurred in both the sampling gears (multi- and box corer). These findings can be attributed to the burrowing behavior exhibited by a majority of species, namely polychaete families (Ampharetidae, Capitellidae, Cirratulidae, Glyceridae, Lacydoniidae, Lumbrineridae), tanaid families (Leptognathiidae, Neotanaidae, Tanaellidae), and other taxa. This behavior classifies them as less motile, with their movements primarily confined to the sediment. Less motile macrobenthic faunal communities in the deep sea typically include organisms with limited mobility, relying on structural adaptations or passive transport for movement (Jones et al., 1998; Billett et al., 2001). Furthermore, less motile organisms may contribute to sediment stability and long-term habitat structure, while discretely motile species actively participate in bioturbation processes, influencing nutrient availability and community composition (Ruhl and Smith, 2004). Discretely motile macrobenthic faunal communities comprise organisms such as mobile predators, scavengers, and deposit-feeders like crustaceans and agile polychaetes, capable of more pronounced and intentional movements within the sediment and across the seafloor to locate food resources and suitable habitats (Thistle et al., 2008). Biodiffusors, organisms that enhance the vertical mixing of sediments through their burrowing and feeding activities, are significant contributors to sediment reworking (Aller, 1982; Aller and Aller, 1992; Aller, 1994), which dominated the macrobenthos population in the present study. Upward and downward conveyors refer to transporting sediment particles vertically within the sediment column. For example, upward conveyors such as certain polychaetes (Capitellidae sp.1 and Capitellidae sp.2) exhibit upward conveyance by ingesting deeper sediments and excreting processed material at the surface, influencing nutrient distribution (Miri et al., 2023). Furthermore, organisms exhibiting upward and downward conveyance, such as certain burrowing fauna (e.g., Glyphanostomum sp., Brada sp., and Spiophanes sp., see Supplementary Table S3), transport surface sediments into deeper layers and vice versa, affecting sediment structure and biogeochemical cycling (Shull and Yasuda, 2001).
Three key environmental factors, i.e., food availability, sediment texture, and nodule distribution may significantly influence the benthic community structure assemblages in the deep sea. The deep-sea floor is distinguished by exceedingly low organic material inputs, rendering it a food-limited ecosystem (Smith et al., 2008). Similarly, CIOB exhibits low productivity both at the surface and in the water column (Matondkar et al., 2005). Additionally, the region has a diminished organic carbon content attributable to low sediment accretion in the bottom surficial sediments (Pattan et al., 2005), despite the Ganges–Bramhaputra fan has been involved in the changes in nutrient chemistry up to 10°S. The reason attributed to low productivity may be the South Equatorial Counter Current (SECC) and South Equatorial Current (SEC) between 0° and 10°S may have prevented nutrient-rich water of the north Indian Ocean from entering the CIOB (Peng et al., 2015). It progressively diminishes toward the south, leading to a decrease in the flux of particulate organic carbon (POC) from the north to the south. The limited nutrient enrichment potentially holds influential capabilities in shaping benthic communities (Bonifácio et al., 2020, 2024) in the southern region of the CIOB. In the current study, the IRZ and PRZ are situated to the south, while BC20 is positioned to the north within the CIOB. This spatial arrangement may contribute to a slightly higher TOC value in BC20 compared to that in the IRZ and PRZ. The previous studies from CIOB evidently showed that a relatively higher TOC ranging from 0.52% to 1.31% near 10°S latitude (Nair et al., 2000), whereas the present (12°S –13°S) study reported 0.35%–0.47% of TOC. The presence or absence of TOC exerts a significant (positive/negative depending on feeding behavior) influence on the diversity, population dynamics, and interspecies interactions of macrobenthic fauna. The highest Margalef richness (d) and Shannon–Wiener diversity (H’) of macrobenthos at BC20 could have been associated with increased TOC and CHO compared to IRZ and PRZ (Supplementary Table S6). Contrastingly, a negative correlation was observed between food availability and macrofaunal community structure (Kaiser et al., 2024). Polychaete species Capitellidae sp.2, Opheliidae sp., Sabellidae sp., Lumbrineris sp., and Glycera sp. are exclusively found in BC20, of which Capitellidae sp.2, Opheliidae sp., and Sabellidae sp. were highly dependent on suspended or deposited organic food on surface sediment. Similarly, deposit feeder polychaetes dominated Ifremer and APEI No. 3 sites associated with high POC flux (Bonifácio et al., 2024). However, Lumbrineris sp. and Glycera sp. were carnivorous in life habits (Jumars et al., 2015), which could potentially be attributed to complex interspecific relationships within the ecosystem. This has been supported by a notable contrast that emerged in the abundance of nematodes at BC20, IRZ, and PRZ sites, with BC20 displaying lower numbers compared to PRZ and IRZ (Supplementary Table S6). This variance in nematode abundance could also support interspecific relationships due to the dependence of macrofauna on meiofaunal components. Interestingly, copepods (including harpacticoid) were more pronounced in BC20, and it is noteworthy that some of the harpacticoid species predominantly follow carnivorous feeding strategies (Bröhldick, 2005; Shimanaga et al., 2009).
Despite the limitation of sampling effort (logistical constraints) and a small sample size restricting definitive conclusions, the findings of this study highlight the significant influence of different investigative methodologies on observed macrobenthic faunal assemblages. Future research in the CIOB should indeed aim to increase sample size and use consistent sampling techniques to enhance reliability, but the current approach provides a critical foundation for understanding macrobenthic communities in the polymetallic nodule fields of the CIOB. For the first time, this research on macrobenthos provides quantitative insights into multicorer sampling within the PMN field in the Indian Ocean. The study examined differences in macrobenthic community structure, diversity indices, and functional composition between sites. The results revealed a relatively homogeneous nature at the PMN mining sites, encompassing both PRZ and IRZ areas. Relationships between the macrobenthic faunal community and the environment were analyzed to gain a comprehensive understanding of the ecological drivers. The findings highlight the importance of environmental relationships, particularly the influence of total organic carbon and related components, such as carbohydrates, in extremely low-productive zones. Furthermore, we advocate for the combined use of both multi- and box corers to achieve more accurate estimates of diversity and abundance, ultimately enhancing our knowledge of species richness and functional understanding. Through this study, we aimed to provide general recommendations for the collection of high-quality data that can be utilized for monitoring purposes. The present research contributes valuable insights into seabed community patterns, encompassing both structural and functional aspects by including large-sized meiofaunal taxa in the macrofauna, which may prove instrumental in managing the mining site in the CIOB. Furthermore, understanding the relationship between benthos and environmental factors is crucial for regulating deep-sea bed mining activities, as they significantly shape community structures. By integrating these insights, the study provides valuable guidance for the sustainable management of deep-sea resources and emphasizes the need for careful consideration of environmental factors in future mining operations. Thus, the scientific endeavor is pivotal for informing and shaping the regulations that will govern future mining exploitations in the deep-sea bed, ensuring a legally sound and ecologically responsible approach to this emerging industry. As the ISA continues its regulatory development, incorporating such scientific findings becomes essential for the sustainable management of deep-sea resources and the preservation of biodiversity in these ecologically sensitive areas.
The original contributions presented in the study are included in the article/Supplementary Material. Further inquiries can be directed to the corresponding author.
The study presents research on animals that do not require ethical approval.
SG: Writing – review & editing, Writing – original draft, Visualization, Validation, Software, Methodology, Investigation, Formal analysis, Conceptualization. SS: Writing – review & editing, Writing – original draft, Visualization, Validation, Supervision, Resources, Project administration, Methodology, Investigation, Funding acquisition, Data curation, Conceptualization. SD: Writing – review & editing, Validation, Resources, Project administration, Funding acquisition, Data curation. MM-P: Writing – review & editing, Validation, Supervision, Resources, Project administration, Funding acquisition, Formal analysis, Data curation. VG: Writing – review & editing, Methodology. JP: Writing – review & editing, Methodology, Formal analysis. MN: Writing – review & editing, Validation, Supervision, Resources, Project administration. SB: Writing – review & editing, Validation, Supervision.
The author(s) declare financial support was received for the research, authorship, and/or publication of this article. This study is funded by the Ministry of Earth Sciences (MoES), the Government of India, and the Council of Scientific and Industrial Research (CSIR).
This research is made possible with the support of the Ministry of Earth Sciences (MoES), the Government of India, and the Council of Scientific and Industrial Research (CSIR). Special thanks are extended to the Director of CSIR-National Institute of Oceanography (CSIR-NIO). The authors are thankful to the captain and crew members of cruise No. SSD062 and RVM staff (Sheldon Rebello, Mahesh Korgaonkar, Shashikant Velip, and Kuldeep Kumar) for all the operational support during sampling. The authors are also thankful to the reviewers and the editor for improving the article. Santosh Gaikwad acknowledges CSIR for providing the Senior Research Fellowship (File No. 31/0026(12239)/2021-EMR-I). The present work is a part of Santosh Gaikwad’s Ph.D. thesis. This is CSIR-NIO’s contribution No.7287.
The authors declare that the research was conducted in the absence of any commercial or financial relationships that could be construed as a potential conflict of interest.
All claims expressed in this article are solely those of the authors and do not necessarily represent those of their affiliated organizations, or those of the publisher, the editors and the reviewers. Any product that may be evaluated in this article, or claim that may be made by its manufacturer, is not guaranteed or endorsed by the publisher.
The views expressed in the present study are those of the author(s) and not necessarily those of the MoES and CSIR.
The Supplementary Material for this article can be found online at: https://www.frontiersin.org/articles/10.3389/fmars.2024.1395892/full#supplementary-material
Aller R. C. (1982). “The Effects of Macrobenthos on Chemical Properties of Marine Sediment and Overlying Water,” in Animal-Sediment Relations. Ed. McCall P. L. (Springer Science + Business Media, New York), 53–102. doi: 10.1007/978-1-4757-1317-6_2
Aller R. C. (1994). Bioturbation and remineralization of sedimentary organic matter: effects of redox oscillation. Chem. Geol. 114, 331–345. doi: 10.1016/0009-2541(94)90062-0
Aller R. C., Aller J. Y. (1992). Meiofauna and solute transport in marine muds. Limnol. Oceanogr. 37, 1018–1033. doi: 10.4319/lo.1992.37.5.1018
Anderson M. J. (2001). A new method for non-parametric multivariate analysis of variance. Austral Ecol. 26, 32–46. doi: 10.1046/j.1442-9993.2001.01070.x
Anderson M. J., Gorley R. N., Clarke K. R. (2008). PERMANOVA+ for PRIMER: Guide to Software and Statistical Methods. (Plymouth: Primer-E), 214.
Armstrong C. W., Foley N., Tinch R., van den Hove S. (2010). Ecosystem goods and services of the deep sea. Deliv. D6.2 HERMIONE Proj. Available online at: http://median-sustainability.com/IMG/pdf/ecosystem_goods_and_services.pdf (Accessed July 15, 2021).
Bett B. J. (1994). Sampler bias in the quantitative study of deep-sea meiobenthos. Mar. Ecol. Prog. Ser. 104, 197–203. doi: 10.3354/meps104197
Billett D. S. M., Bett B. J., Rice A. L., Thurston M. H., Galéron J., Sibuet M., et al. (2001). Long-term change in the megabenthos of the Porcupine Abyssal Plain (NE Atlantic). Prog. Oceanogr. 50, 325–348. doi: 10.1016/S0079-6611(01)00060-X
Blomqvist S., Ekeroth N., Elmgren R., Hall P. O. J. (2015). Long overdue improvement of box corer sampling. Mar. Ecol. Prog. Ser. 538, 13–21. doi: 10.3354/meps11405
Bluhm H. (2001). Re-establishment of an abyssal megabenthic community after experimental physical disturbance of the seafloor. Deep. Res. Part II. Top. Stud. Oceanogr. 48, 3841–3868. doi: 10.1016/S0967-0645(01)00070-4
Bonifácio P., Kaiser S., Washburn T. W., Smith C. R., Vink A., Arbizu P. M. (2024). Biodiversity of the Clarion-Clipperton Fracture Zone: a worm perspective. Mar. Biodivers. 54, 1–22. doi: 10.1007/s12526-023-01396-3
Bonifácio P., Martínez Arbizu P., Menot L. (2020). Alpha and beta diversity patterns of polychaete assemblages across the nodule province of the eastern Clarion-Clipperton Fracture Zone (equatorial Pacific). Biogeosciences 17, 865–886. doi: 10.5194/bg-17-865-2020
Bridges A. E. H., Barnes D. K. A., Bell J. B., Ross R. E., Voges L., Howell K. L. (2023). Filling the data gaps: Transferring models from data-rich to data-poor deep-sea areas to support spatial management. J. Environ. Manage. 345, 118325. doi: 10.1016/j.jenvman.2023.118325
Bröhldick K. S. T. (2005). A new taxon of Idyanthidae (Copepoda, Harpacticoida) from the deep sea of the Angola Basin. Org. Divers. Evol. 5, 43–57. doi: 10.1016/j.ode.2004.10.004
Cardoso P., Rigal F., Carvalho J. C. (2015). BAT - Biodiversity Assessment Tools, an R package for the measurement and estimation of alpha and beta taxon, phylogenetic and functional diversity. Methods Ecol. Evol. 6, 232–236. doi: 10.1111/2041-210X.12310
Chan B. K. K., Ju S. J., Kim D. S., Kim S. J. (2020). First discovery of the sessile barnacle Eochionelasmus (Cirripedia: Balanomorpha) from a hydrothermal vent field in the Indian Ocean. J. Mar. Biol. Assoc. United. Kingdom. 100, 585–593. doi: 10.1017/S0025315420000466
Chen W., Wallhead P., Hynes S., Groeneveld R., O’Connor E., Gambi C., et al. (2022). Ecosystem service benefits and costs of deep-sea ecosystem restoration. J. Environ. Manage. 303, 114127. doi: 10.1016/j.jenvman.2021.114127
Choi J. W., Kim D. S., Hyun J. H., Lee C. H. (2004). Macrozoobenthic communities of the deep sea sediments in the northeastern Pacific Ocean. Ocean. Polar. Res. 26, 367–376. doi: 10.4217/OPR.2004.26.2.367
Chuar C. H., Tong S. J. W., Chim C. K., Wong H. P. S., Tan K. S. (2020). Abyssal macrofaunal community structure in the polymetallic nodule exploration area at the easternmost region of the Clarion-Clipperton Fracture Zone, Pacific Ocean. Deep. Res. Part I. Oceanogr. Res. Pap. 161, 103284. doi: 10.1016/j.dsr.2020.103284
Clarke K. R., Gorley R. N. (2006). PRIMER v6: User Manual/Tutorial (Plymouth UK: Prim), 192 p. doi: 10.1111/j.1442-9993.1993.tb00438.x
Danovaro R. (Ed.) (2010). Methods for the study of of Deep-sea Sediments, Thier Functioning and Biodiversity (Boca Raton, London, New York: CRC Press Taylor & Francis Group).
De Smet B., Pape E., Riehl T., Bonifácio P., Colson L., Vanreusel A. (2017). The community structure of deep-sea macrofauna associated with polymetallic nodules in the eastern part of the Clarion-Clipperton Fracture Zone. Front. Mar. Sci. 4. doi: 10.3389/fmars.2017.00103
Fauchald K., Jumars P. A. (1979). The diet of worms: A studie of polychaete feeding gilds. Oceanogr. Mar. Biol. Annu. Rev. 17, 193–284. doi: 10.1017/CBO9781107415324.004
Fox J., Weisberg S. (2019). An R Companion to Applied Regression. Available online at: https://socialsciences.mcmaster.ca/jfox/Books/Companion/.
Francesca P., Mevenkamp L., Pape E., Błażewicz M., Bonifácio P., Riehl T., et al. (2021). A local scale analysis of manganese nodules influence on the Clarion-Clipperton Fracture Zone macrobenthos. Deep. Res. Part I. Oceanogr. Res. Pap. 168, 103449. doi: 10.1016/j.dsr.2020.103449
Gage J. D., Hughes D. J., Gonzalez Vecino J. L. (2002). Sieve size influence in estimating biomass, abundance and diversity in samples of deep-sea macrobenthos. Mar. Ecol. Prog. Ser. 225, 97–107. doi: 10.3354/meps225097
Gage J. D., Tyler P. A. (1991). Deep-sea biology: a natural history of organisms at the deep-sea floor (Cambridge, UK: Cambridge University Press). doi: 10.2307/5527
Glasby G. P. (2010). Incorporation of transition and Platinum Group Elements (PGE) in Co-rich Mn crusts at Afanasiy-Nikitin Seamount (AFS) in the Equatorial S Indian Ocean. Resour. Geol. 60, 212–215. doi: 10.1111/j.1751-3928.2010.00128.x
Graf G., Rosenberg R. (1997). Bioresuspension and biodeposition: A review. J. Mar. Syst. 11, 269–278. doi: 10.1016/S0924-7963(96)00126-1
Grasshoff K., Kremling K., Ehrhardt M. (1999). Methods of seawater analysis-third edition. (Weinheim: Wiley-VCH Verlag GmbH), 203–2223. doi: 10.1002/9783527613984
Hadley A., Vaughan D., Girlich M., Ushey K., Posit Software P. (2024). Package ‘ tidyr ‘: Tidy Messy Data.(CRAN). doi: 10.32614/CRAN.package.tidyr
Hein J. R., Koschinsky A., Kuhn T. (2020). Deep-ocean polymetallic nodules as a resource for critical materials. Nat. Rev. Earth Environ. 1, 158–169. doi: 10.1038/s43017-020-0027-0
Hein J. R., Mizell K., Koschinsky A., Conrad T. A. (2013). Deep-ocean mineral deposits as a source of critical metals for high- and green-technology applications: Comparison with land-based resources. Ore. Geol. Rev. 51, 1–14. doi: 10.1016/j.oregeorev.2012.12.001
Henseler C., Nordström M. C., Törnroos A., Snickars M., Pecuchet L., Lindegren M., et al. (2019). Coastal habitats and their importance for the diversity of benthic communities: A species- and trait-based approach. Estuar. Coast. Shelf. Sci. 226, 106272. doi: 10.1016/j.ecss.2019.106272
Hessler R. R., Jumars P. A. (1974). Abyssal community analysis from replicate box cores in the central North Pacific. Deep. Res. Oceanogr. Abstr. 21, 246. doi: 10.1016/0011-7471(74)90058-8
Hughes D. J., Gage J. D. (2004). Benthic metazoan biomass, community structure and bioturbation at three contrasting deep-water sites on the northwest European continental margin. Prog. Oceanogr. 63, 29–55. doi: 10.1016/j.pocean.2004.09.002
Hui W., Gel Y. R., Gastwirth J. L. (2008). Lawstat: An R package for law, public policy and biostatistics. J. Stat. Software 28, 1–26. doi: 10.18637/jss.v028.i03
Ingels J., Vanreusel A., Pape E., Pasotti F., Macheriotou L., Arbizu P. M., et al. (2021). Ecological variables for deep-ocean monitoring must include microbiota and meiofauna for effective conservation. Nat. Ecol. Evol. 5, 27–29. doi: 10.1038/s41559-020-01335-6
Ingole B. S., Ansari Z. A., Rathod V., Rodrigues N. (2001). Response of deep-sea macrobenthos to a small-scale environmental disturbance. Deep. Res. Part II. Top. Stud. Oceanogr. 48, 3401–3410. doi: 10.1016/S0967-0645(01)00048-0
Ingole B., Koslow J. A. (2005). Deep-sea ecosystems of the Indian ocean. Indian J. Mar. Sci. 34, 27–34. Available online at: https://drs.nio.res.in/drs/bitstream/handle/2264/222/I_J_Mar_Sci_34_27.pdf?sequence=4&isAllowed=y.
Ingole B. S., Pavithran S., Ansari Z. A. (2005a). Restoration of deep-sea macrofauna after simulated benthic disturbance in the central Indian basin. Mar. Georesour. Geotechnol. 23, 267–288. doi: 10.1080/10641190500446573
Ingole B. S., Pavithran S., Goltekar R. (2005b). Benthic communities associated with ferromanganese nodules from the Central Indian Ocean. Proc. Natl. Semin. Polymetallic. Nodules., 32–37.
ISBA/16/LTC/7 (2010). Recommendations for the guidance of contractors for the assessment of the possible environmental impacts arising from exploration for polymetallic nodules in the Area. Sixt. Sess. International Seabed Authority Leg. Tech. Comm. 1–22. Available at: https://www.eu-midas.net/sites/default/files/Library_docs/ISBA-16LTC-7.pdf
ISBA/25/LTC/6/Rev.1 (2020). Recommendations for the guidance of contractors for the assessment of the possible environmental impacts arising from exploration for marine minerals in the Area. Twenty-fifth Sess. ISA Leg. Tech. Comm. part I. Available online at: https://www.isa.org.jm/wp-content/uploads/2022/06/25ltc-6-rev1-en.pdf.
Jang S. J., Ho P. T., Jun S. Y., Kim D., Won Y. J. (2020). A newly discovered Gigantidas bivalve mussel from the Onnuri Vent Field in the northern Central Indian Ridge. Deep. Res. Part I. Oceanogr. Res. Pap. 161, 103299. doi: 10.1016/j.dsr.2020.103299
Jensen K. (1981). Comparison of two bottom samplers for benthos monitoring. Environ. Technol. Lett. 2, 81–84. doi: 10.1080/09593338109384026
Jensen P. (1983). Meiofaunal abundance and vertical zonation in a sublittoral soft bottom, with a test of the Haps corer. Mar. Biol. 74, 319–326. doi: 10.1007/BF00403458
Johnson J. E., Phillips S. C., Torres M. E., Piñero E., Rose K. K., Giosan L. (2014). Influence of total organic carbon deposition on the inventory of gas hydrate in the Indian continental margins. Mar. Pet. Geol. 58, 406–424. doi: 10.1016/j.marpetgeo.2014.08.021
Jones E. G., Collins M. A., Bagley P. M., Addison S., Priede I. G. (1998). The fate of cetacean carcasses in the deep sea: Observations on consumption rates and succession of scavenging species in the abyssal north-east Atlantic Ocean. Proc. R. Soc B. Biol. Sci. 265, 1119–1127. doi: 10.1098/rspb.1998.0407
Jones D. O. B., Kaiser S., Sweetman A. K., Smith C. R., Menot L., Vink A., et al. (2017). Biological responses to disturbance from simulated deep-sea polymetallic nodule mining. PloS One 12, e0171750. doi: 10.1371/journal.pone.0171750
Jumars P. A., Dorgan K. M., Lindsay S. M. (2015). Diet of worms emended: an update of polychaete feeding guilds. Ann. Rev. Mar. Sci. 7, 497–520. doi: 10.1146/annurev-marine-010814-020007
Kaiser S., Bonifácio P., Kihara T. C., Menot L., Vink A., Wessels A. K., et al. (2024). Effects of environmental and climatic drivers on abyssal macrobenthic infaunal communities from the NE Pacific nodule province. Mar. Biodivers. 54, 1–20. doi: 10.1007/s12526-024-01427-7
Krishna K. S. (2003). Structure and evolution of the Afanasy Nikitin seamount, buried hills and 85°E Ridge in the northeastern Indian Ocean. Earth Planet. Sci. Lett. 209, 379–394. doi: 10.1016/S0012-821X(03)00081-5
Kristensen E. (2000). Organic matter diagenesis at the oxic/anoxic interface in coastal marine sediments, with emphasis on the role of burrowing animals. Hydrobiologia 426, 1–24. doi: 10.1023/A:1003980226194
Kung A., Svobodova K., Lèbre E., Valenta R., Kemp D., Owen J. R. (2021). Governing deep sea mining in the face of uncertainty. J. Environ. Manage. 279, 111593. doi: 10.1016/j.jenvman.2020.111593
Lee J., Kim D., Kim I. H. (2020). Copepoda (Siphonostomatoida: Dirivultidae) from hydrothermal vent fields on the Central Indian Ridge, Indian Ocean. Zootaxa 4759, 301–337. doi: 10.11646/zootaxa.4759.3.1
Levin L. A., Mengerink K., Gjerde K. M., Rowden A. A., Van Dover C. L., Clark M. R., et al. (2016). Defining “serious harm” to the marine environment in the context of deep-seabed mining. Mar. Policy 74, 245–259. doi: 10.1016/j.marpol.2016.09.032
Lim J. K., Kim Y. J., Yang J. A., Namirimu T., Yang S. H., Park M. J., et al. (2020). Thermococcus indicus sp. nov., a Fe(III)-reducing hyperthermophilic archaeon isolated from the Onnuri Vent Field of the Central Indian Ocean ridge. J. Microbiol. 58, 260–267. doi: 10.1007/s12275-020-9424-9
Lins L., Brandt A. (2020). Comparability between box-corer and epibenthic-sledge data on higher taxon level: A case study based on deep-sea samples from the NW Pacific. Prog. Oceanogr. 182, 102273. doi: 10.1016/j.pocean.2020.102273
Lomolino M. (2000). Ecology ‘ s most general, yet protean 1 pattern: the species-area relationship. J. Biogeogr. 27, 17–26. doi: 10.1046/j.1365-2699.2000.00377.x
Matondkar S. G. P., Nair K. K. C., Ansari Z. A. (2005). Biological characteristics of central Indian basin waters during the southern summer. Mar. Georesour. Geotechnol. 23, 299–313. doi: 10.1080/10641190500446649
McCune B., Grace J. (2002). Analysis of Ecological Communities (Oregon: MJM Software, Gleneden Beach).
McLaverty C., Eigaard O. R., Olsen J., Brooks M. E., Petersen J. K., Erichsen A. C., et al. (2023). European coastal monitoring programmes may fail to identify impacts on benthic macrofauna caused by bottom trawling. J. Environ. Manage. 334, 117510. doi: 10.1016/j.jenvman.2023.117510
Miljutin D. M., Miljutina M. A., Arbizu P. M., Galéron J. (2011). Deep-sea nematode assemblage has not recovered 26 years after experimental mining of polymetallic nodules (Clarion-Clipperton Fracture Zone, Tropical Eastern Pacific). Deep. Res. Part I Oceanogr. Res. Pap. 58, 885–897. doi: 10.1016/j.dsr.2011.06.003
Miri M., Seyfabadi J., Ghodrati Shojaei M., Rahimian H., Valipour M. (2023). Polychaete diversity and functional trait composition in subtropical mangrove ecosystems. Diversity 15, 1–20. doi: 10.3390/d15090998
MoES (2020). Environmental Impact Statement: Environmental conditions and likley impact in the area selected for nodule Environmental conditions and likley impact in the area selected for nodul (Jamaica: Ministry of Earth Sciences, Government of India). Available at: https://moes.gov.in/writereaddata/files/India_PMN_EIS_Jan_2020.pdf.
Montagna P. A., Baguley J. G., Hsiang C. Y., Reuscher M. G. (2017). Comparison of sampling methods for deep-sea infauna. Limnol. Oceanogr. Methods 15, 166–183. doi: 10.1002/lom3.10150
Mukhopadhyay R., Ghosh A. K., Iyer S. D. (2008). The Indian ocean nodule field. Handb. Explor. Environ. Geochem. 10, 1–36. doi: 10.1016/S1874-2734(07)10001-2
Nair S., Mohandass C., Loka Bharathi P. A., Sheelu G., Chandralata R. (2000). Microscale response of sediment variables to benthic disturbance in the central Indian ocean basin. Mar. Georesour. Geotechnol. 18, 273–283. doi: 10.1080/10641190009353795
Oksanen J., Blanchet F. G., Friendly M., Kindt R., Legendre P., Mcglinn D., et al. (2020). Package “vegan” Title Community Ecology Package Version 2.5-7. cran.ism.ac.jp. Available online at: http://cran.ism.ac.jp/web/packages/vegan/vegan.pdf (Accessed August 17, 2021).
Orcutt B. N., Bradley J. A., Brazelton W. J., Estes E. R., Goordial J. M., Huber J. A., et al. (2020). Impacts of deep-sea mining on microbial ecosystem services. Limnol. Oceanogr. 65, 1489–1510. doi: 10.1002/lno.11403
Painting S. J., van der Molen J., Parker E. R., Coughlan C., Birchenough S., Bolam S., et al. (2013). Development of indicators of ecosystem functioning in a temperate shelf sea: A combined fieldwork and modelling approach. Biogeochemistry 113, 237–257. doi: 10.1007/s10533-012-9774-4
Parulekar A. H., Harkantra S. N., Ansari Z. A., Matondkar S. G. P. (1982). Abyssal benthos of the central Indian Ocean. Deep. Sea. Res. Part A. Oceanogr. Res. Pap. 29, 1531–1537. doi: 10.1016/0198-0149(82)90041-3
Parulekar A. H., Ingole B., Harkantra S. N., Ansari Z. (1992). Deep sea benthos of the western and central Indian ocean. Oceanogr. Indian Ocean., 261–267.
Pattan J. N., Masuzawa T., Borole D. V., Parthiban G., Jauhari P., Yamamoto M. (2005). Biological productivity, terrigenous influence and noncrustal elements supply to the Central Indian Ocean Basin: Paleoceanography during the past ∼ 1 Ma. J. Earth Syst. Sci. 114, 63–74. doi: 10.1007/BF02702009
Pavithran S., Ingole B. S. (2005). “Macrobenthic standing stock in the nodule areas of Central Indian Ocean Basin,” in National Seminar on Polymetallic Nodules (Regional Research LZaboratory, Bhubaneswar, Orissa, India), 16–31.
Pavithran S., Ingole B., Nanajkar M., Goltekar R. (2009a). Importance of sieve size in deep-sea macrobenthic studies. Mar. Biol. Res. 5, 391–398. doi: 10.1080/17451000802441285
Pavithran S., Ingole B., Nanajkar M., Nath N. N. (2007). Macrofaunal diversity in the central Indian ocean basin. Biodiversity 8, 11–16. doi: 10.1080/14888386.2007.9712824
Pavithran S., Ingole B. S., Nanajkar M., Raghukumar C., Nath B. N., Valsangkar A. B. (2009b). Composition of macrobenthos from the central Indian ocean Basin. J. Earth Syst. Sci. 118, 689–700. doi: 10.1007/s12040-009-0051-4
Peng S., Qian Y. K., Lumpkin R., Du Y., Wang D., Li P. (2015). Characteristics of the near-surface currents in the Indian Ocean as deduced from satellite-tracked surface drifters. Part I: Pseudo-Eulerian statistics. J. Phys. Oceanogr. 45, 441–458. doi: 10.1175/JPO-D-14-0050.1
Petersen S., Krätschell A., Augustin N., Jamieson J., Hein J. R., Hannington M. D. (2016). News from the seabed – Geological characteristics and resource potential of deep-sea mineral resources. Mar. Policy 70, 175–187. doi: 10.1016/j.marpol.2016.03.012
Pinheiro J., Bates D., DebRoy S., Sarkar D., Team R. C. (2021). nlme: Linear and Nonlinear Mixed Effects Models. Available online at: https://cran.r-project.org/package=nlme.
QGIS Development Team (2020). QGIS Geographic Information System (Open Source Geospatial Foundation Project). Available at: https://qgis.org/.
Queirós A. M., Birchenough S. N. R., Bremner J., Godbold J. A., Parker R. E., Romero-Ramirez A., et al. (2013). A bioturbation classification of European marine infaunal invertebrates. Ecol. Evol. 3, 3958–3985. doi: 10.1002/ece3.769
Radziejewska T. (2002). Responses of deep-sea meiobenthic communities to sediment disturbance simulating effects of polymetallic nodule mining. Int. Rev. Hydrobiol. 87, 457–477. doi: 10.1002/1522-2632(200207)87:4<457::AID-IROH457>3.0.CO;2-3
Raghukumar C., Sheelu G., Loka Bharathi P. A., Nair S., Mohandass C. (2001). Microbial biomass and organic nutrients in the deep-sea sediments of the Central Indian Ocean Basin. Mar. Georesour. Geotechnol. 19, 1–16. doi: 10.1080/10641190009353795
R Core Team (2021). R: A language and environment for statistical computing. R. Found. Stat. Comput. Vienna, Austria. Available online at: https://www.R-project.org/.
Ruhl H. A., Smith K. L. (2004). Shifts in deep-sea community structure linked to climate and food supply. Sci. (80-.). 305, 513–515. doi: 10.1126/science.1099759
Shah S., Damare S. R., Mascarenhas-Pereira M. B. L., Patil J., Parab S., Nair S., et al. (2024). An insight into the prokaryotic diversity from a polymetallic nodule-rich region in the Central Indian Ocean Basin using next generation sequencing approach. Front. Microbiol. 15. doi: 10.3389/fmicb.2024.1295149
Shannon C. E., Weaver W. (1949). The mathematical theory of communication. (University of Illinois Press), 144p. Available online at: https://pure.mpg.de/rest/items/item_2383164/component/file_2383163/content.
Shields M. A., Hughes D. J. (2009). Large-scale variation in macrofaunal communities along the eastern Nordic Seas continental margin: A comparison of four stations with contrasting food supply. Prog. Oceanogr. 82, 125–136. doi: 10.1016/j.pocean.2009.05.001
Shimanaga M., Lee W., Nomaki H., Jijima K. (2009). Sex Ratio and Gut Contents of the Deep-Sea Harpacticoid Neocervinia itoi and Other Cerviniids: A Possibility of Reduced Foraging among Males. J. Crustac. Biol. 29, 183–191. doi: 10.1651/08-3036.1
Shull D. H., Yasuda M. (2001). Size-selective downward particle transport by cirratulid polychaetes. J. Mar. Res. 59, 453–473. doi: 10.1357/002224001762842271
Simon-Lledó E., Bett B. J., Huvenne V. A. I., Schoening T., Benoist N. M. A., Jeffreys R. M., et al. (2019). Megafaunal variation in the abyssal landscape of the Clarion Clipperton Zone. Prog. Oceanogr. 170, 119–133. doi: 10.1016/j.pocean.2018.11.003
Singh R., Sautya S., Ingole B. S. (2019). The community structure of the deep-sea nematode community associated with polymetallic nodules in the Central Indian Ocean Basin. Deep. Res. Part II. Top. Stud. Oceanogr. 161, 16–28. doi: 10.1016/j.dsr2.2018.07.009
Smith C. R., Demopoulos A. W. J. (2003). “The deep Pacific Ocean floor,” in Ecosystems of the World, Volume 28: Ecosystems of the Deep Oceans. Ed. Tyler P. A. (Elsevier, Amsterdam), 179–218.
Smith C. R., Drazen J., Mincks S. L. (2006).Deep-sea Biodiversity and Biogeography: Perspectives from the Abyss. In: International Seabed Authority Seamount Biodiversity Symposium. Available online at: http://www.soest.hawaii.edu/oceanography/mincks/publications/Smith_etal_Abyssal_biogeography_synthesis.pdf (Accessed July 15, 2021).
Smith C., Leo F., Bernardino A., Sweetman A., Arbizu P. (2008). Abyssal food limitation, ecosystem structure and climate change. Trends Ecol. Evol. 23, 518–528. doi: 10.1016/j.tree.2008.05.002
Snelgrove P. V. R. (1999). Getting to the bottom of marine biodiversity: Sedimentary habitats: Ocean bottoms are the most widespread habitat on earth and support high biodiversity and key ecosystem services. Bioscience 49, 129–130. doi: 10.2307/1313538
Stratmann T., Mevenkamp L., Sweetman A. K., Vanreusel A., van Oevelen D. (2018). Has phytodetritus processing by an abyssal soft-sediment community recovered 26 years after an experimental disturbance? Front. Mar. Sci. 4. doi: 10.3389/fmars.2018.00059
Sweetman A. K., Smith C. R., Shulse C. N., Maillot B., Lindh M., Church M. J., et al. (2019). Key role of bacteria in the short-term cycling of carbon at the abyssal seafloor in a low particulate organic carbon flux region of the eastern Pacific Ocean. Limnol. Oceanogr. 64, 694–713. doi: 10.1002/lno.11069
Thistle D., Eckman J. E., Paterson G. L. J. (2008). Large, motile epifauna interact strongly with harpacticoid copepods and polychaetes at a bathyal site. Deep. Res. Part I. Oceanogr. Res. Pap. 55, 324–331. doi: 10.1016/j.dsr.2007.11.008
Thurber A. R., Sweetman A. K., Narayanaswamy B. E., Jones D. O. B., Ingels J., Hansman R. L. (2014). Ecosystem function and services provided by the deep sea. Biogeosciences 11, 3941–3963. doi: 10.5194/bg-11-3941-2014
Van Dover C. L., Ardron J. A., Escobar E., Gianni M., Gjerde K. M., Jaeckel A., et al. (2017). Biodiversity loss from deep-sea mining. Nat. Geosci. 10, 464–465. doi: 10.1038/ngeo2983
Van Hoey G., Permuy D. C., Vandendriessche S., Vincx M., Hostens K. (2013). An ecological quality status assessment procedure for soft-sediment benthic habitats: Weighing alternative approaches. Ecol. Indic. 25, 266–278. doi: 10.1016/j.ecolind.2012.09.024
Venables W. N., Ripley B. D. (2002). Modern Applied Statistics with S. Springer Science & Business Media, 495.
Washburn T. W., Menot L., Bonifácio P., Pape E., Błażewicz M., Bribiesca-Contreras G., et al. (2021). Patterns of macrofaunal biodiversity across the clarion-clipperton zone: an area targeted for seabed mining. Front. Mar. Sci. 8. doi: 10.3389/fmars.2021.626571
Weatherall P. A., Sandwell D. T., Arndt J. E., Bringensparr C., Dorschel B., Ferrini V., et al. (2019). The GEBCO_2019 Grid - a continuous terrain model of the global oceans and land (Publ. Data Libr). doi: 10.5285/836f016a-33be-6ddc-e053-6c86abc0788e
Welsh D. T. (2003). It’s a dirty job but someone has to do it: The role of marine benthic macrofauna in organic matter turnover and nutrient recycling to the water column. Chem. Ecol. 19, 321–342. doi: 10.1080/0275754031000155474
Wickham H., Chang W., Henry L., Pedersen T. L., Takahashi K., Wilke C., et al. (2024). ggplot2: Create Elegant Data Visualisations Using the Grammar of Graphics. Available online at: https://github.com/tidyverse/ggplot2 (Accessed August 17, 2021).
Wickham H., François R., Henry L., Muller L. H., Vaughan D. (2023). Package “dplyr”: A Grammar of Data Manipulation. (CRAN). Available at: https://dplyr.tidyverse.org, https://github.com/tidyverse/dplyr.
Wilson G. D. F. (2017). Macrofauna abundance, species diversity and turnover at three sites in the Clipperton-Clarion Fracture Zone. Mar. Biodivers. 47, 323–347. doi: 10.1007/s12526-016-0609-8
Keywords: macrobenthos, functional trait, biodiversity, sampling comparison, deep sea, ecology
Citation: Gaikwad S, Sautya S, Damare S, Mascarenhas-Pereira MBL, Gawas V, Patil J, Nanajkar M and Bukhari S (2024) Macrobenthic communities in the polymetallic nodule field, Indian Ocean, based on multicore and box core analysis. Front. Mar. Sci. 11:1395892. doi: 10.3389/fmars.2024.1395892
Received: 04 March 2024; Accepted: 12 July 2024;
Published: 05 September 2024.
Edited by:
Annemiek Vink, Federal Institute for Geosciences and Natural Resources, GermanyReviewed by:
Daniel Pech, El Colegio de la Frontera Sur, MexicoCopyright © 2024 Gaikwad, Sautya, Damare, Mascarenhas-Pereira, Gawas, Patil, Nanajkar and Bukhari. This is an open-access article distributed under the terms of the Creative Commons Attribution License (CC BY). The use, distribution or reproduction in other forums is permitted, provided the original author(s) and the copyright owner(s) are credited and that the original publication in this journal is cited, in accordance with accepted academic practice. No use, distribution or reproduction is permitted which does not comply with these terms.
*Correspondence: Sabyasachi Sautya, c2F1dHlhQG5pby5yZXMuaW4=
Disclaimer: All claims expressed in this article are solely those of the authors and do not necessarily represent those of their affiliated organizations, or those of the publisher, the editors and the reviewers. Any product that may be evaluated in this article or claim that may be made by its manufacturer is not guaranteed or endorsed by the publisher.
Research integrity at Frontiers
Learn more about the work of our research integrity team to safeguard the quality of each article we publish.