 Yang Sun1
 ChengYang Hou
 XinQiang Chen
94% of researchers rate our articles as excellent or good
Learn more about the work of our research integrity team to safeguard the quality of each article we publish.
Find out more
ORIGINAL RESEARCH article
Front. Mar. Sci. , 21 May 2024
Sec. Ocean Observation
Volume 11 - 2024 | https://doi.org/10.3389/fmars.2024.1395614
This article is part of the Research Topic Deep Learning for Marine Science, volume II View all 27 articles
Efficient and rapid deployment of maritime search and rescue(MSAR) resources is a prerequisite for maritime emergency search and rescue, in order to improve the efficiency and accuracy of MSAR. This paper proposes an integrated approach for emergency resource allocation. The approach encompasses three main steps: identifying accident black spots, assessing high-risk areas, and optimizing the outcomes through a synergistic combination of an optimization algorithm and reinforcement learning. In the initial step, the paper introduces the iterative self-organizing data analysis technology (ISODATA) for identifying accident spots at sea. A comparative analysis is conducted with other clustering algorithms, highlighting the superiority of ISODATA in effectively conducting dense clustering. This can effectively carry out dense clustering, instead of the situation where the data spots are too dispersed or obvious anomalies that affect the clustering. Furthermore, this approach incorporates entropy weighting to reassess the significance of accident spots by considering both the distance and the frequency of accidents. This integrated approach enhances the allocation of search and rescue forces, ensuring more efficient resource utilization. To address the MSAR vessel scheduling problem at sea, the paper employs the non-dominated sorting genetic algorithm II combined with reinforcement learning (NSGAII-RL). Comparative evaluations against other optimization algorithms reveal that the proposed approach can save a minimum of 7% in search and rescue time, leading to enhanced stability and improved efficiency in large-scale MSAR operations. Overall, the integrated approach presented in this paper offers a robust solution to the ship scheduling problem in maritime search and rescue operations. Its effectiveness is demonstrated through improved resource allocation, enhanced timeliness, and higher efficiency in responding to maritime accidents.
With the rapid growth of global trade, the maritime industry is flourishing. Given that over 80% of cargo transportation relies on ships, maritime activities have become increasingly intricate. Furthermore, they are susceptible to the impact of extreme weather phenomena, posing significant challenges for the industry (Rezaee and Pelot, 2016; Li et al., 2023; Zhang et al., 2023). Therefore, to better cope with maritime emergencies and to safeguard the service capability of ports, it is essential for ports to have emergency response capabilities. Effective search and rescue strategies in the aftermath of maritime accidents are essential to improving shipping safety and reducing the level of hazard from the accident (Caunhye et al., 2012; Chen et al., 2024b).In maritime search and rescue (MSAR), existing studies have focused on determining the location of accident centers and the dispatch of search and rescue forces.
The key aspect of MSAR is accurately predicting the potential location of an accident to effectively concentrate search and rescue efforts on crucial areas for swift response and rescue operations (Choi et al., 2020). Since the location of the target at sea fluctuates due to various factors, it is necessary to anticipate future changes in the marine environment throughout the process of solving the response model (Shchekinova et al., 2016; Zhang et al., 2021c). This model is reactive, meaning that it can accurately dispatch the resources required for the accident based on the needs. However, during the implementation process, it often encounters unforeseen circumstances, such as, shortage of resources, coordination of personnel, and adverse environmental conditions. Meanwhile, the design of an MSAR program is often viewed as a complex unstructured multi-criteria decision problem. Researchers focus on search planning decision support systems and intelligent algorithms to solve the resource scheduling problem during MSAR (Agbissoh Otote et al., 2019; Chen Z. et al., 2020). However, evaluating MSAR scheduling programs relies more on the experience of experts than on quantitative indicators, which makes it difficult to guarantee its efficiency and reliability (Xiong et al., 2020a).
This study presents a novel contingency resource optimization model to address the aforementioned challenges, which proposes an optimization model for allocating emergency resources in the deployment of maritime search and rescue vessels, taking into account multiple accident black spots and rescue bases. Specifically, initially, the iterative self-organizing data analysis technology algorithm (ISODATA) is initially employed to cluster historical accident locations and identify black spots, while the entropy weight method is used to evaluate and classify the significance of each accident black spot. Subsequently, the non-dominated sorting genetic algorithm II combined with reinforcement learning (NSGAII-RL) is utilized to solve the mathematical model and obtain the optimal strategy for emergency resource allocation. The remainder of the paper is organized as follows: Section 2 provides a summary of related research, while Section 3 presents a detailed description of the problem and constructs the overall framework of this study. In Section 4, the validity of the overall framework is verified using the actual case of Shanghai Port, and the experimental results are presented. The concluding section summarizes the findings and discusses future research directions.
The identification of accident black spots is crucial in identifying high-risk areas deserving special attention. Historical accident data serves as a valuable resource in this endeavor. By considering variables such as the marine environment, historical accident data, and search and rescue conditions, clustering models can be established to identify locations with a high incidence of marine accidents. These accident black spots provide valuable insights for developing effective risk control measures and optimizing the allocation of emergency response resources, particularly when resources are scarce.
With the emergence of new techniques and theories, the identification of accident black spots has been extensively studied (Xu et al., 2023), such as through the Poisson-Tweedie model to identify accident black spots (Debrabant et al., 2018), kernel density estimation (Davis et al., 2011), K-Means clustering algorithm (Zhang et al., 2021b) and density-based spatial clustering of applications with noise (DBSCAN) (Szénási and Jankó, 2017), as well as the combination of advanced algorithms such as machine learning neural networks (Fan et al., 2019; Jang, 2020; Szénási et al., 2021). Among them, the K-Means method is popular in road and water traffic accident analysis due to its simplicity of implementation and significant clustering effect. It operates by minimizing the similarity within each cluster and maximizing the sum of squares of distances between different clusters (Ghadi et al., 2018). Furthermore, some researchers have optimized maritime search and rescue systems by incorporating accident black spots. For example, Ma et al. proposed an optimization model for emergency resource allocation that considers multiple accident black spot regions, various rescue bases, different accident types, and numerous emergency resource types. This model demonstrates considerable potential in enhancing resource allocation efficiency in disaster relief operations (Ma et al., 2022). Overall, the identification of accident black spots and their integration into search and rescue systems can greatly improve response capabilities and optimize resource allocation in maritime accidents.
Maritime search and rescue resource scheduling is a complex problem that requires efficient algorithms to find optimal solutions. Traditional heuristic algorithms have been widely used in resource scheduling, but researchers have begun exploring the combination of multiple algorithms to improve the scheduling process. For instance, Xiong et al. used two intelligent algorithms, Differential Evolutionary Algorithm (DE) and Non-dominated sorting genetic algorithm II (NSGAII), to find a suitable MSAR scheme and aid in resource scheduling (Xiong et al., 2020a). Cai et al. proposed a model solved using the Particle Swarm Optimization (PSO) algorithm and Genetic Algorithm (GA) algorithm. A two-stage mixed integer programming (MIP) model was used to determine the type and number of maritime search and rescue (MSAR) equipment to be assigned to the activation station based on historical accidents and existing equipment information (Cai et al., 2020). In addition to these approaches, researchers have also introduced innovative algorithms for resource scheduling. Cho et al. proposed a heuristic crossover search and rescue optimization algorithm (HC-SAR) (Cho et al., 2021), and Ansari et al. proposed a new Competency-Based Maintenance Planning (CBMP) methodology (Ansari et al., 2023). Chu et al. proposed a particle swarm genetic hybrid algorithm (Chu et al., 2022). Aminzadegan et al. proposed two meta-heuristic solutions based on Adaptive Genetic Algorithm (AGA) and Tabu Search Algorithm (TS) (Aminzadegan et al., 2021). These efforts have demonstrated the significant potential of optimization algorithms in solving resource scheduling problems in MSAR operations. By combining different algorithms or developing new ones, researchers aim to improve the efficiency and effectiveness of resource allocation in emergency situations.
In recent years, with the rapid development of technology in the field of artificial intelligence, reinforcement learning has been continuously introduced into various fields. Compared to traditional optimization algorithms, Chen et al. found that optimization algorithms combined with reinforcement learning exhibit significant advantages in the field of path optimization (Chen et al., 2024a). By analyzing the internal structure of the population, these algorithms can select appropriate parameters, thereby avoiding the trap of traditional optimization algorithms converging to local optimal solutions, thereby improving search and rescue efficiency. For instance, Müller-Zhang et al. applied deep Q-learning to integrated process planning and scheduling, demonstrating that this deep reinforcement learning algorithm can rapidly identify the optimal solution in complex environments. By adjusting parameters in real-time, search and rescue algorithms can better adapt to changes in the MSAR environment, thus enhancing search and rescue effectiveness (Müller-Zhang et al., 2023). Li et al. creatively proposed genetic algorithm based on reinforcement learning (GSAA-RL), which enhances the search capability of the algorithm by transforms dynamic parameters into a Markov decision process, effectively defining the states, actions, and reward functions within GSAA-RL (Li et al., 2022a). These combined studies demonstrate the immense potential of reinforcement learning in the field of optimization scheduling. By adaptively adjusting the parameters of optimization algorithms, search and rescue processes can continuously learn and optimize algorithms to make them more suitable for practical application scenarios.
While reinforcement learning has been employed for tuning and optimizing the parameters of heuristic algorithms in various areas, such as shop floor scheduling, product manufacturing, and power systems, improving the performance of optimization algorithms and the quality of problem-solving. There is limited evidence indicating that reinforcement learning has been utilized to optimize the scheduling of ships during maritime search and rescue missions. The ability to adaptively adjust the parameters of optimization algorithms through reinforcement learning enables them to better handle the dynamic and complex nature of search and rescue missions, leading to improved efficiency and effectiveness of maritime operations (Xiao et al., 2024). Therefore, further research is needed to explore the potential of reinforcement learning in ship scheduling during maritime search and rescue missions.
To take proactive and effective measures against possible future maritime accidents, the relationship between existing search and rescue bases and accident-prone locations should be fully considered in advance. To do this, it is necessary to identify the most suitable accident locations and to ensure that rapid and systematic assistance is provided at each location at the first sign of an accident. Therefore, in addressing this problem, this section is divided into the following three steps for consideration, which are identifying the location of accident black areas, to evaluate the importance of each accident-prone place to reduce the unnecessary waste of resources, and to dispatch each accident black spot accordingly through the optimization algorithm.
Figure 1 illustrates the general organizational framework of this study, which is divided into four modules. The first module is the dataset section, which contains information on recorded maritime accidents. This dataset is cleaned and organized to obtain a dataset that includes information on the latitude, longitude, and number of accidents. The second module adopts the ISODATA algorithm, which inputs historical accident data and selects appropriate algorithm parameters to cluster historical accidents and identify accident black spots. The third module evaluates the black spots generated in the second step by using the entropy weight method, which considers the location of the black spots from the MSAR base and the number of accidents in each black spot. This helps to assess each blackspot’s importance and rank them in order of importance, with priority scheduling for key areas. The last module uses NSGAII-RL for optimization to find the optimal scheduling plan for each accident black spot by building a mathematical model and setting the corresponding parameters. The mathematical model focuses on formulate a resource allocation problem, considering factors such as response time, the distance between the MSAR base and the accident black spot, resource availability, and the importance of the accident black spot. Finally, the corresponding ship dispatching plan is provided according to the dispatching arrangement of different accident black spots.
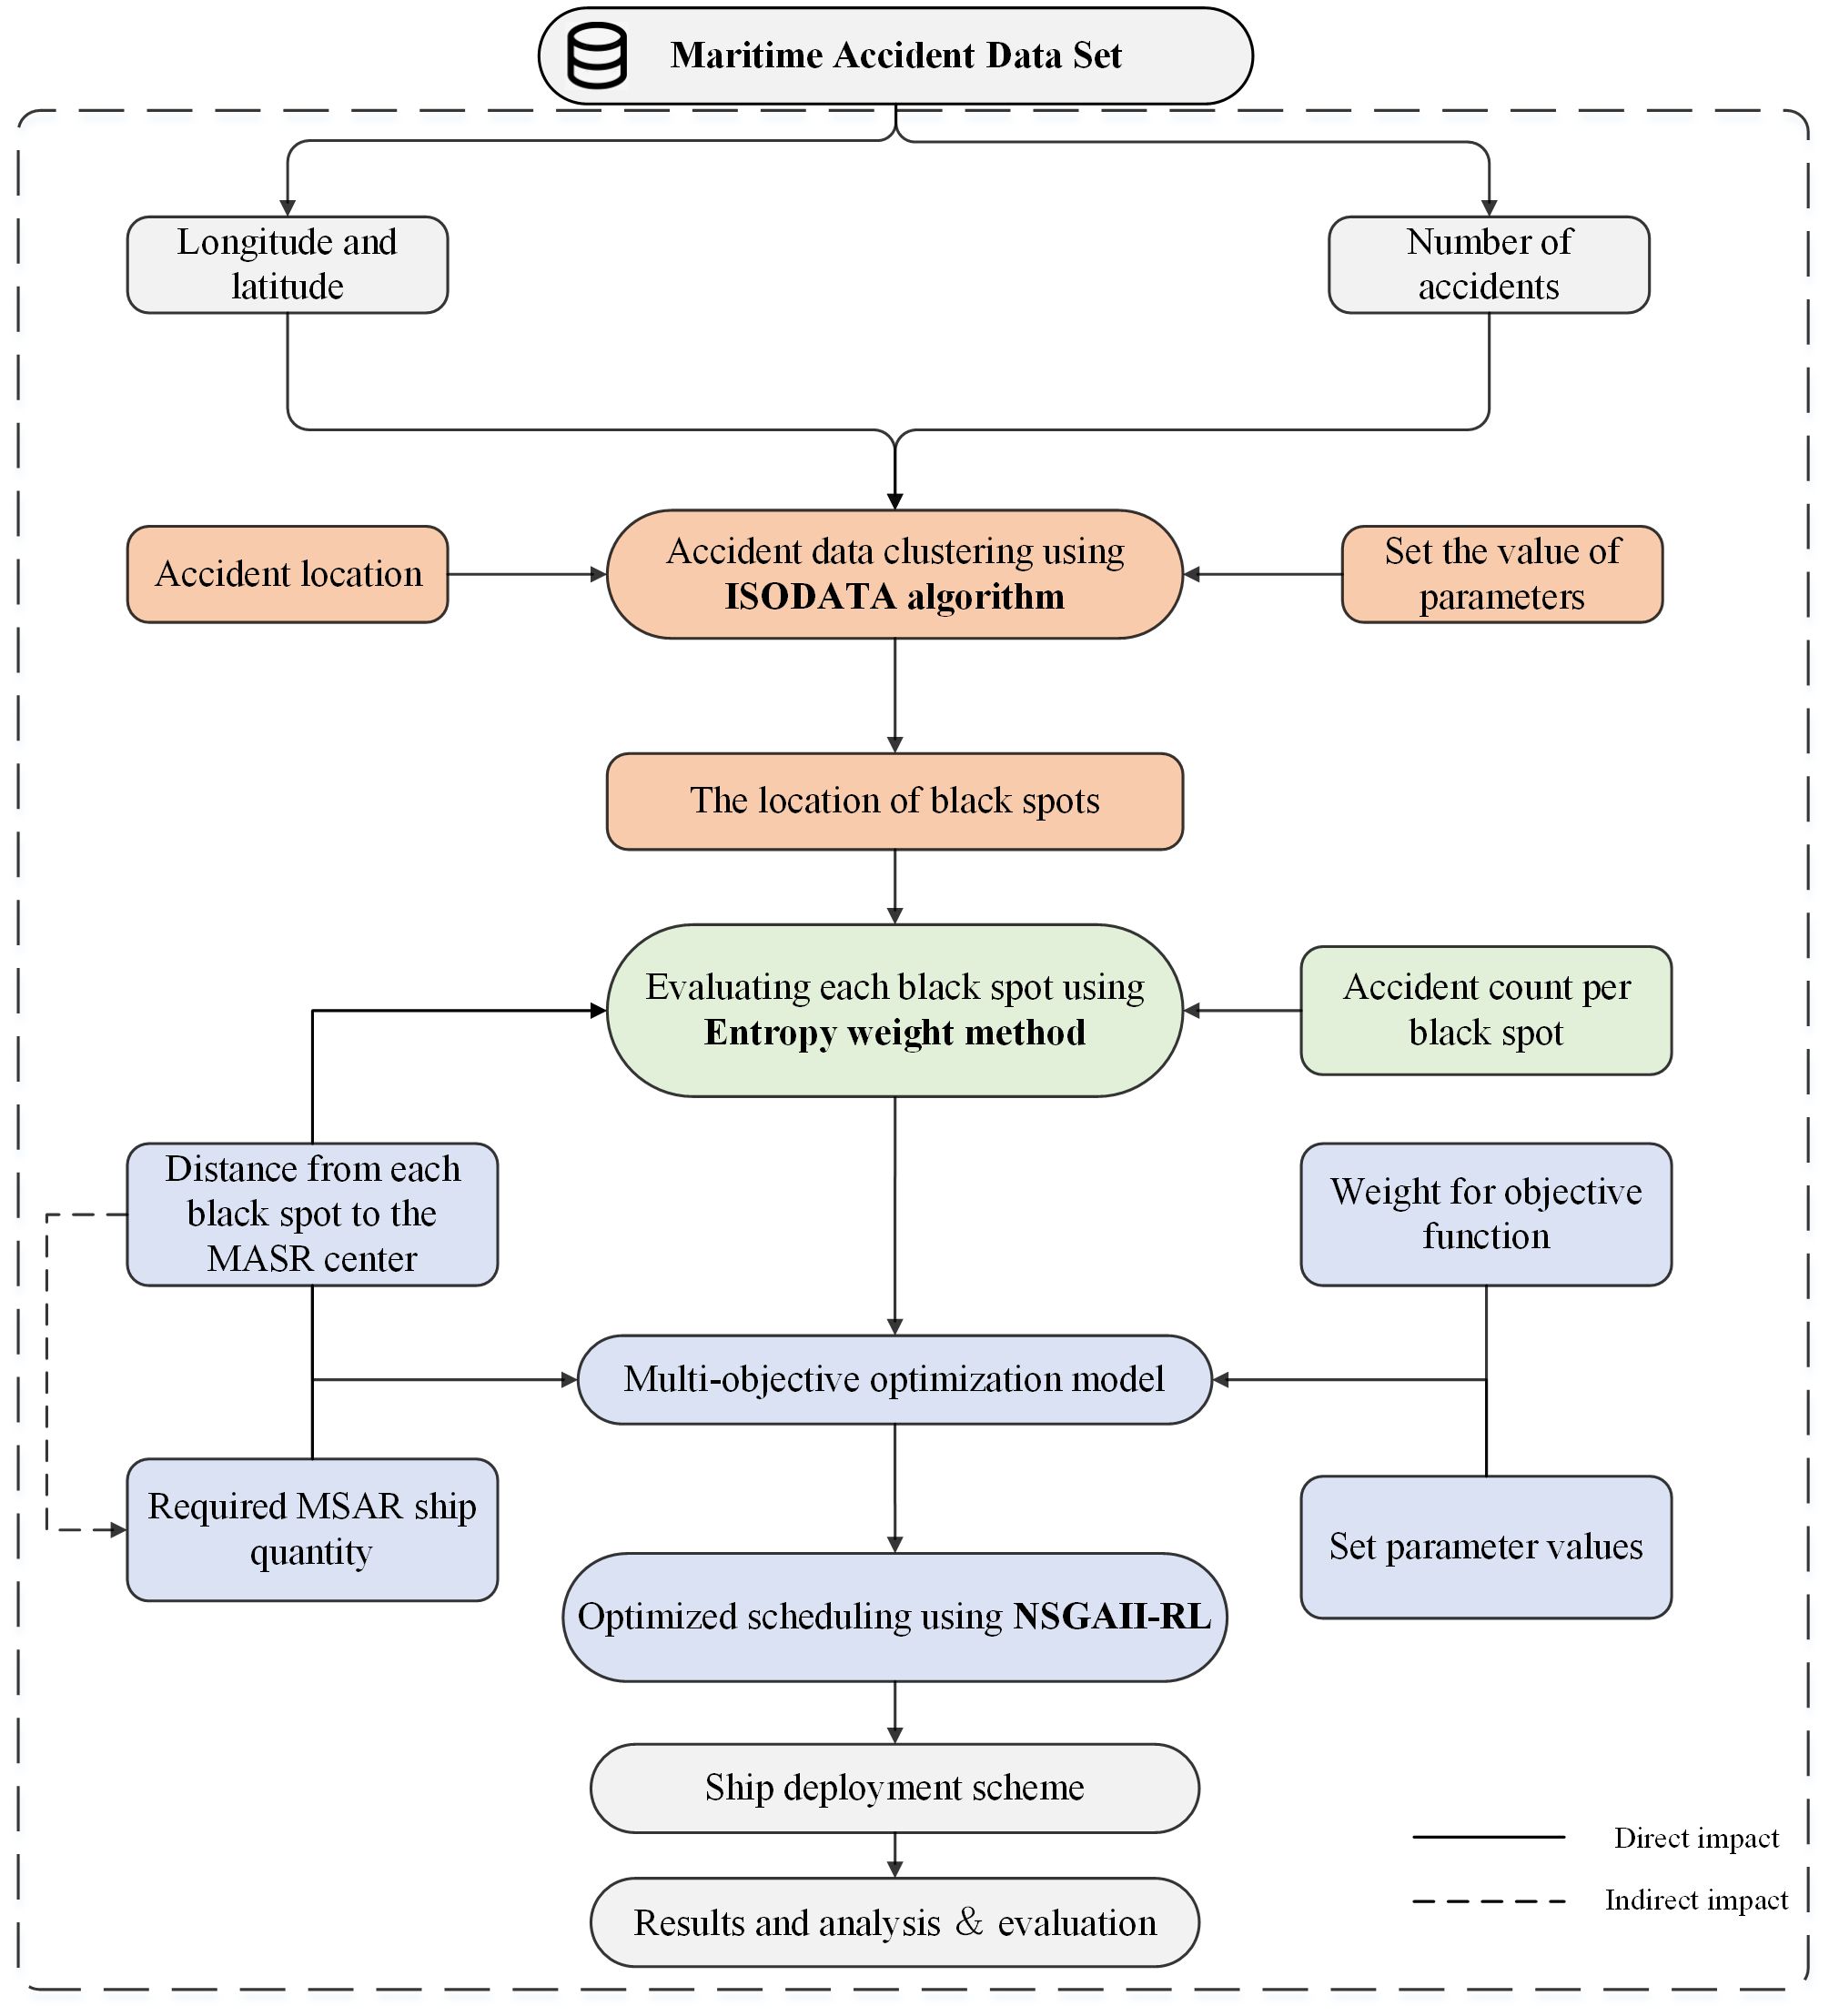
Figure 1 Overall framework of this paper.
Accident black spots are locations where accidents occur more frequently than in other areas of the water (Zhang et al., 2021a). In this study, an accident black spot is defined as a specific spot, rather than an entire area, and the location of an accident black spot serves as a proxy for surrounding accidents. Emergency Response Resources refer to the total materials, funds, and other resources required by the Emergency Management System (EMS) to effectively execute emergency response activities and ensure the efficiency of the maritime transportation system during MSAR.
The ISODATA algorithm is an improved method based on the popular unsupervised classification machine learning technique, the K-Means algorithm. It overcomes some of the limitations of the traditional K-means algorithm by automating the determination of clustering result K. The ISODATA algorithm sets a threshold parameter and iteratively merges or splits classes based on specific criteria. This dynamic adaptation of classes allows for optimal division of sample data into clusters, improving overall clustering performance. By adjusting the number of clusters K, the algorithm can adapt to different datasets and achieve better clustering results. Overall, the ISODATA algorithm provides a more flexible and accurate approach for clustering analysis compared to the traditional K-means algorithm (Shan and Zhang, 2019). In the context of this study, the ISODATA algorithm will be used alongside three other algorithms to compare their performance and verify the applicability of the ISODATA algorithm in the field of maritime accidents. This comparison will help evaluate the effectiveness of the ISODATA algorithm in clustering historical accident locations and identifying accident black spots.
ISODATA mainly consists of three parts: the main algorithm, the splitting operation, and the merging operation, and each part is briefly introduced. The main algorithm of ISODATA includes the following 3 steps:
(1) Initial value setting
a) Randomly select samples from the data set as the initial clustering center ; b) Based on the distance of each sample to the center of all clusters, assign the samples to the class with the smallest distance; c) Discard the class if the elements within the class are less than , so that , and reassign the samples within the class according to step; d) Recalculate the cluster centers for each class as Equation (1).
e) Where K< , a merge operation is performed; f) Where K< 2 , it means that the current number of categories is too small, and split operation is performed; g) Where the maximum number of iterations is reached, terminate the algorithm, otherwise go back to step b) to continue execution.
(2) Merge operation
The merge operation of ISODATA consists of the following two steps: a) Calculate the current distance between the clustering centers of each category, denoted by the matrix D, where = 0; b) Combine the two categories with into a new class, which has a cluster center position as Equation (2).
Where and denote the number of samples in these two categories.
(3) Splitting operation
The split operation of ISODATA consists of the following four steps: a) Calculate the variance of all samples under each category for each dimension; b) Calculate the largest variance in each category ;c) If > for a class and the number of samples within the class ≥ 2 , then proceed to step d),and exit the splitting operation if the condition is not satisfied; d) Split the class that satisfies the condition into two subcategories and make K=K+1. Which = , = .
The Entropy Weight Method is a multi-indicator decision-making approach rooted in information entropy concept, which quantifies the degree of change in evaluation indices. A higher information entropy value suggests that an index provides more information, making it more crucial in the evaluation process. Conversely, a lower information entropy implies a reduced weight for the index in the final decision-making process. By leveraging information entropy, the Entropy Weight Method enables a comprehensive and nuanced assessment of multiple indicators, facilitating informed and weighted decision-making based on the significance of each index in the overall evaluation (Chen et al., 2022; Wen et al., 2022).
Given the irregular distribution of accidents at sea, the entropy weighting method lays the groundwork for ship scheduling by assessing the importance of each accident black spot. This assessment takes into account both the number of accidents occurring at the black spot and the proximity of the black spot to the MSAR base (Shu et al., 2023). By adopting the entropy weight method, the importance of each accident black spot can be assessed so that effective decisions can be made in ship scheduling This method ensures the rational allocation of resources by prioritizing areas where accidents are more concentrated and farther away from search and rescue bases.
Assume that there are m evaluation objects and n evaluation indicators, constituting a judgment matrix . The steps for determining the weights using the weight entropy method are as follows: the entropy weight method used in this paper is divided into the following four main steps.
In this study Equation 3 Euclidean distance formula was used to calculate the distance between each clustering center and MSAR.
Where, p= (p1, p2) and q= (q1, q2) represent the coordinates of the accident spot.
(1) The entropy method was used to calculate the ratio of one indicator to the sum of the values of the same indicator for each program as Equation (4):
Where is the weight of the sample in the j-indicator.
(2) As shown in Equation 5 for the evaluation indicator, the entropy value of the evaluation indicator is calculated using the data corresponding to that evaluation indicator.
Where, only when .
(3) This indicates that the weight coefficients of the attribute values are determined by the discrepancy between the schemes. Hence, let’s define as the degree of consistency between the contribution of the next scheme and attribute J. With the weight for each attribute can be calculated as Equation (6):
Where = 0, the attribute can be eliminated with a weight equal to 0.
(4) Calculate the composite score for each accident black spot as Equation (7), where denotes the value of the .
Ship scheduling is a continuous aspect of the maritime search and rescue process. A safe and feasible scheduling program can reduce resource consumption and ensure the safety of rescue vessels. The ship scheduling problem falls under the category of complex discrete combinatorial optimization problems. It is challenging to enumerate all possible solutions using the enumeration method, making it necessary to adopt an optimization algorithm that offers high computational efficiency for finding the optimal solution. To address this issue NSGAII is employed as the base algorithm. It retains the individuals with the highest fitness, effectively avoiding the loss or destruction of the best genes during the optimization process. The NSGAII algorithm adopts a non-dominated sorting genetic algorithm with an elite strategy, which is widely used in various fields of combinatorial optimization.
However, this algorithm has the obvious disadvantage of being extremely sensitive to parameter configurations, a property that makes many evolutionary algorithms dependent on specific problems and scenarios. When the problem or scenario changes, the parameters need to be adjusted or reset. The parameter tuning process is very time-consuming. Based on the characteristics of evolutionary algorithms and reinforcement learning methods, a non-dominated sorting genetic algorithm based on reinforcement learning is designed for the search and rescue scheduling problem, NSGAII-RL uses NSGAII as the basic algorithm for population iteration and selection and uses the Q-learning algorithm to compute the reward value of the corresponding cross variant, which guides the population to evolve in the direction of a more optimal direction. However, NSGAII has a drawback—it is highly sensitive to parameter configurations. This means that parameter adjustments or resets are necessary when the problem or scenario changes. Unfortunately, parameter tuning can be time-consuming. To address this limitation, a novel approach called NSGAII-RL, based on evolutionary algorithms and reinforcement learning, has been developed for the search and rescue scheduling problem.
NSGAII-RL combines the population iteration and selection mechanisms of NSGAII with the Q-learning algorithm. The Q-learning algorithm computes the reward value for each crossover variant, guiding the population towards more optimal solutions. By integrating reinforcement learning into NSGAII, NSGAII-RL overcomes the parameter sensitivity issue and enables the algorithm to adapt to changing problem scenarios more effectively. This approach enhances the efficiency and effectiveness of ship scheduling in maritime search and rescue operations.
(1) Chromosome representation and population initialization
The process of generating chromosomes is considered to be the initialization of chromosomes. In this paper, a two-layer chromosome coding format is used to specify a 7-bit chromosome coding format, where the first layer is binary coded to represent different vessel information, and the second layer of coding is really coded to represent vessel performance information. Figure 2 shows an example of a chromosome that randomly initializes the population according to the population size.
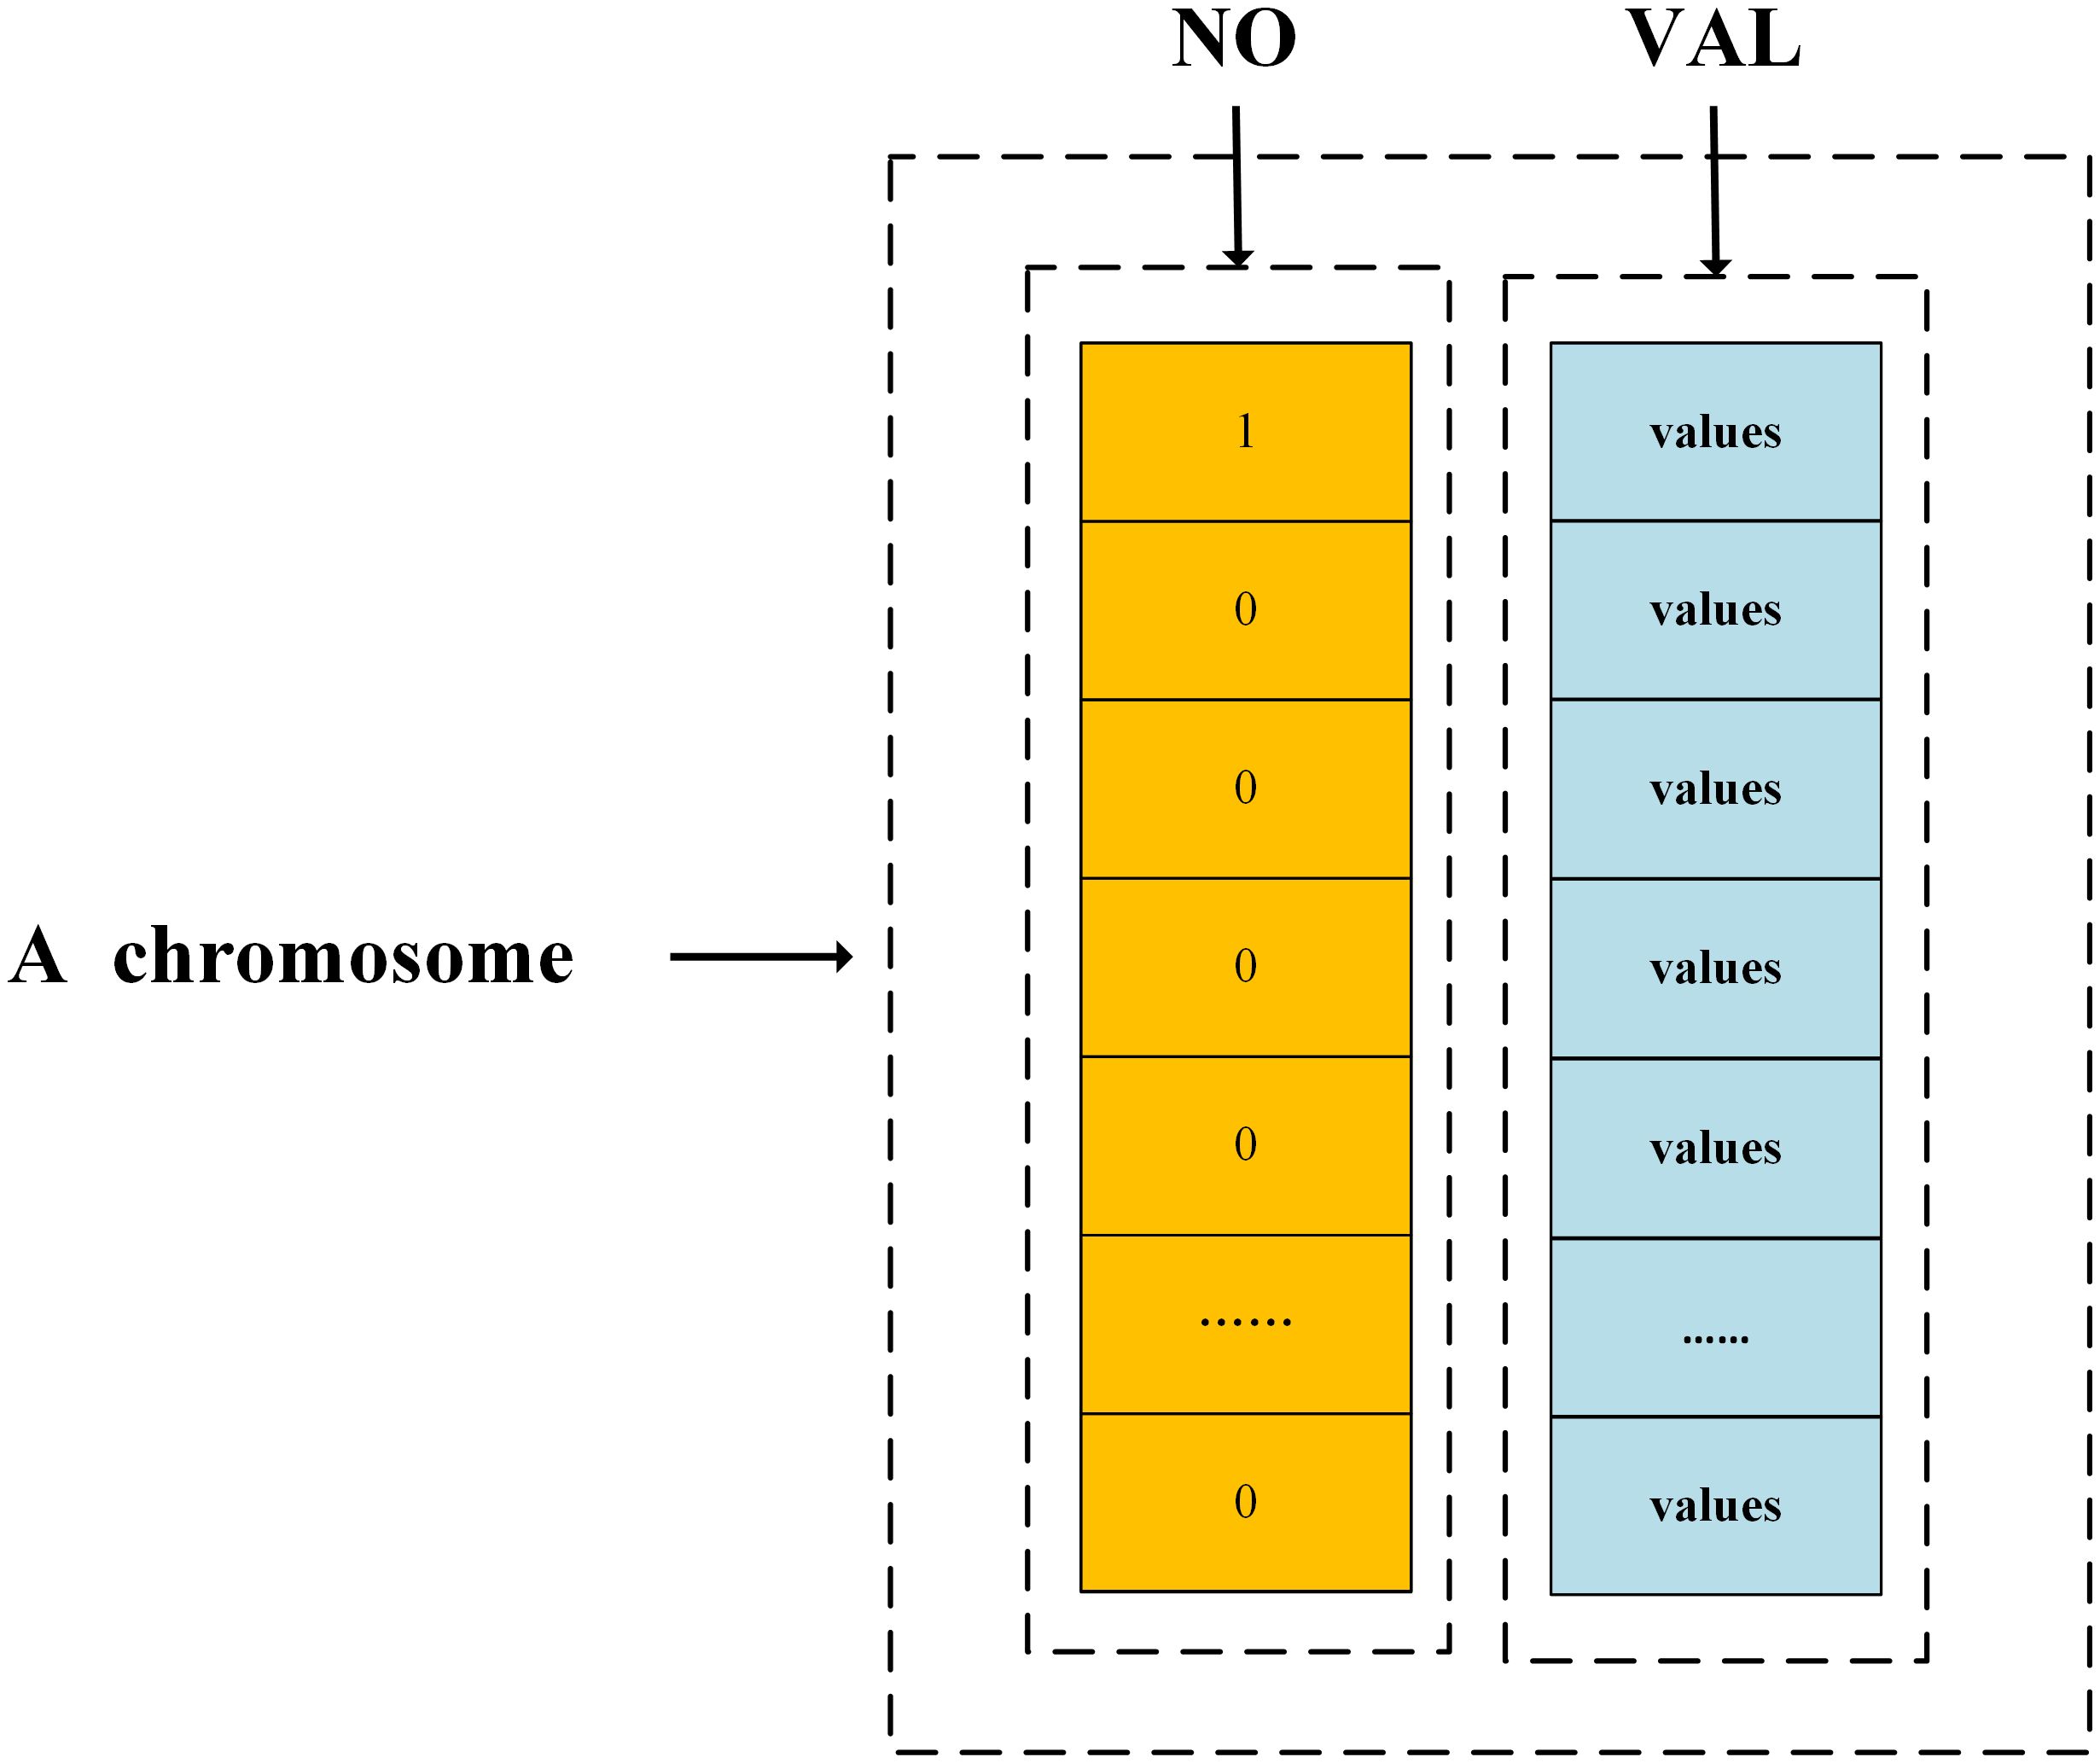
Figure 2 Chromosome coding forms.
(2) Optimization of NSGAII-RL algorithm
When the initial individuals are generated, the population will continuously select the non-dominated individuals according to the non-dominance rank and crowding distance, where the crowding distance is calculated as shown in Equation (8).
Where i represents the congestion at the spot and f represents the value of the corresponding objective function.
This selection strategy employs a stochastic universal selection method, which randomly selects a subset of parents with higher fitness values as the progeny probability. Upon completion of the selection process, the selected outstanding individuals are paired and undergo cross-mutation. For the crossover operation, we utilize the single-spot crossover technique. Reinforcement learning excels at dynamically selecting appropriate parameters, which is why it is introduced to tune crossover () and mutation () probabilities, in this study. after several iterations, the reinforcement learning process is activated, and and selection is optimized based on past and current learning experiences. This iterative process ensures that the genetic algorithm converges efficiently and generates promising new individuals, ultimately leading to improved solution quality and faster computation times. This approach enables the solution effect to better align with actual circumstances.
During each iteration, the agent dynamically selects unique actions to achieve the optimal crossover and mutation probabilities. For the crossover probability, values typically range from 0.4 to 0.9, divided into 10 intervals with an interval value of 0.05 in this study. Similarly, the mutation probability ranges from 0.01 to 0.21 and is divided into 10 intervals, each with an interval value of 0.02, as detailed in Table 1. For example, when selecting action a2 from the action set , is randomly selected from the range of 0.01 to 0.21. It may also be excluded from consideration based on the optimization of the objective function, conversely, the same.
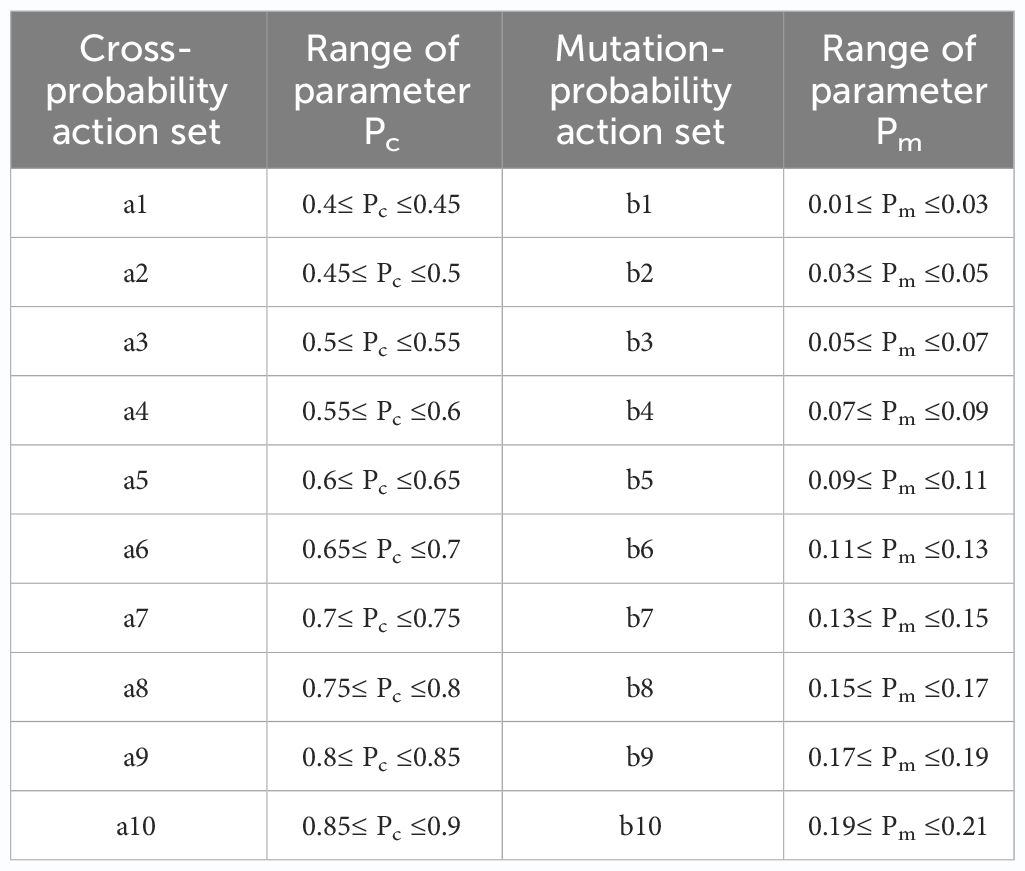
Table 1 Crossover & Mutation probabilistic action sets.
(3) Iteration of the Q-learning algorithm
By employing reinforcement learning, the adjustment of the two main parameters in the algorithm can be divided into four steps. (a) At time step t during the iteration of the non-dominated sorting genetic algorithm, the agent acquires the state. (b) the agent executes a corresponding action according to a pre-specified action selection policy. This is followed by genetic, congestion, and non-dominated sorting operations. (c) The state of the non-dominated sorting genetic algorithm shifts to step+1, and feedback is provided to the agent. (d) The agent proceeds to the next action step +1.
During the learning process, the agent guides the iterations of the population by recording the current state and selecting appropriate crossover and mutation operators. Simultaneously, the agent updates a Q-table based on this information shown in Figure 3, where highlighted cells represent actions taken in previous iterations. In particular, the agent employs a greedy policy to select actions for the population’s evolution, leveraging past experiences to identify optimal action sequences. The outcomes of the population’s iterations are fed back into the Q-table to inform subsequent iterations. Throughout the algorithm’s iterations, the agent explores various combinations of strategies, including crossover-only, mutation-only, and combined crossover-mutation operations, to continuously enhance the population’s fitness. The agent’s exploration of the environment is assessed by a reward function, with reward values closely tied to improvements in fitness. This framework enables the agent to utilize past experiences to determine optimal action sequences, meeting the demand for fast, robust, and high-quality solutions. Over time, the agent’s performance is improved through this iterative process.
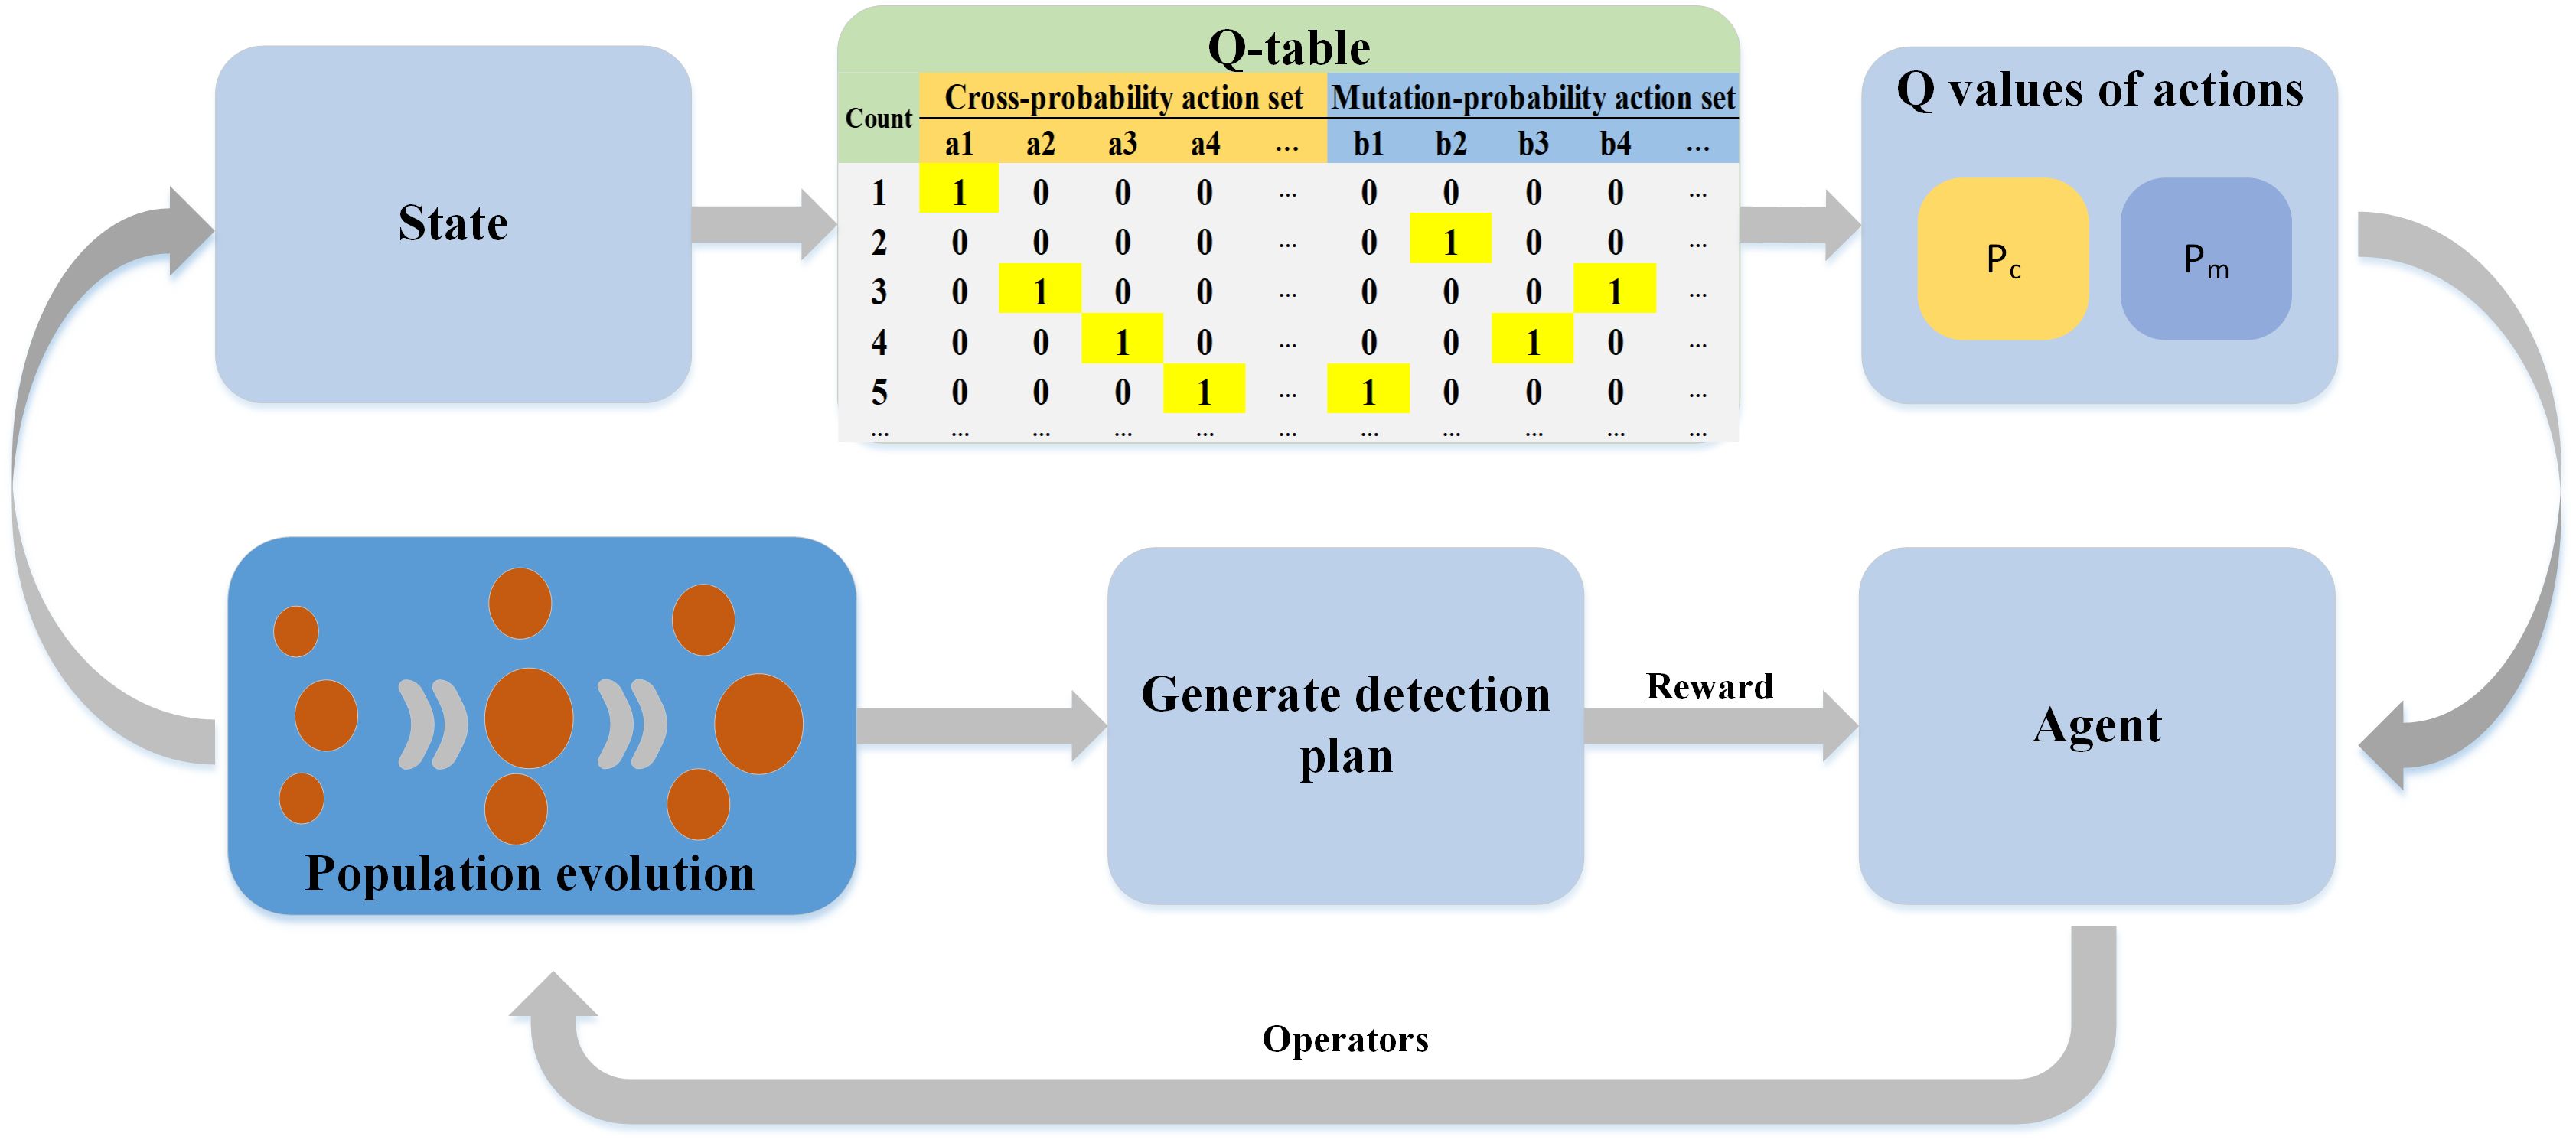
Figure 3 Q-table data flow.
Next, it is crucial to design reward functions for the crossover and mutation probabilities to assess whether the chosen values are rational. Different reward functions under the same algorithm may lead to distinct outcomes, and the selection of the reward function determines the convergence speed and efficiency of the algorithm (Chen R. et al., 2020). The following reward functions are established to evaluate the crossover and mutation probabilities in each iteration, with each function defined separately as Equation (9) and Equation (10):
Where, the value representing the minimum fitness value during the search for the goal state, not only < and < ,but also, in this case, ≥ and ≥ occurring in each iteration must be considered. If ≥ and ≥ , the agent must reward a negative value as a penalty forcing its state to change towards a good trend.
The ε-greedy strategy from reinforcement learning is employed as the action selection method. This strategy strikes a balance between exploitation and exploration, utilizing the maximum action value function while still allowing for the possibility of searching non-optimal actions. The ε-greedy policy can be expressed using Equation (11), where ε represents the greedy rate and is a random number between 0 and 1. When ε is greater than or equal to r, the probability of selecting the crossover and mutation with the highest Q-value is chosen. However, when ε is less than r, the probability of picking the crossover and mutation is randomized. Based on the above description, the algorithm flowchart of NSGAII-RL in Figure 4 is as follows four steps: First, we need to initialize the population and obtain the current state , of the population. Then, based on the ε-greedy strategy, we select the corresponding actions and calculate the respective objective function values. We filter the population using the NSGAII algorithm. At this spot, the state of the NSGAII algorithm transitions to st+1, and the feedback is provided to the agent. The agent takes action at , records the learning process based on the current state, action, and received feedback, and updates the Q-table. If the reward value is positive, the action selection of NSGAII will be strengthened; if the reward is negative, the action will be weakened accordingly. The continuous process of obtaining states, taking action, receiving feedback, and adjusting the strategy constitutes the entire reinforcement learning process.
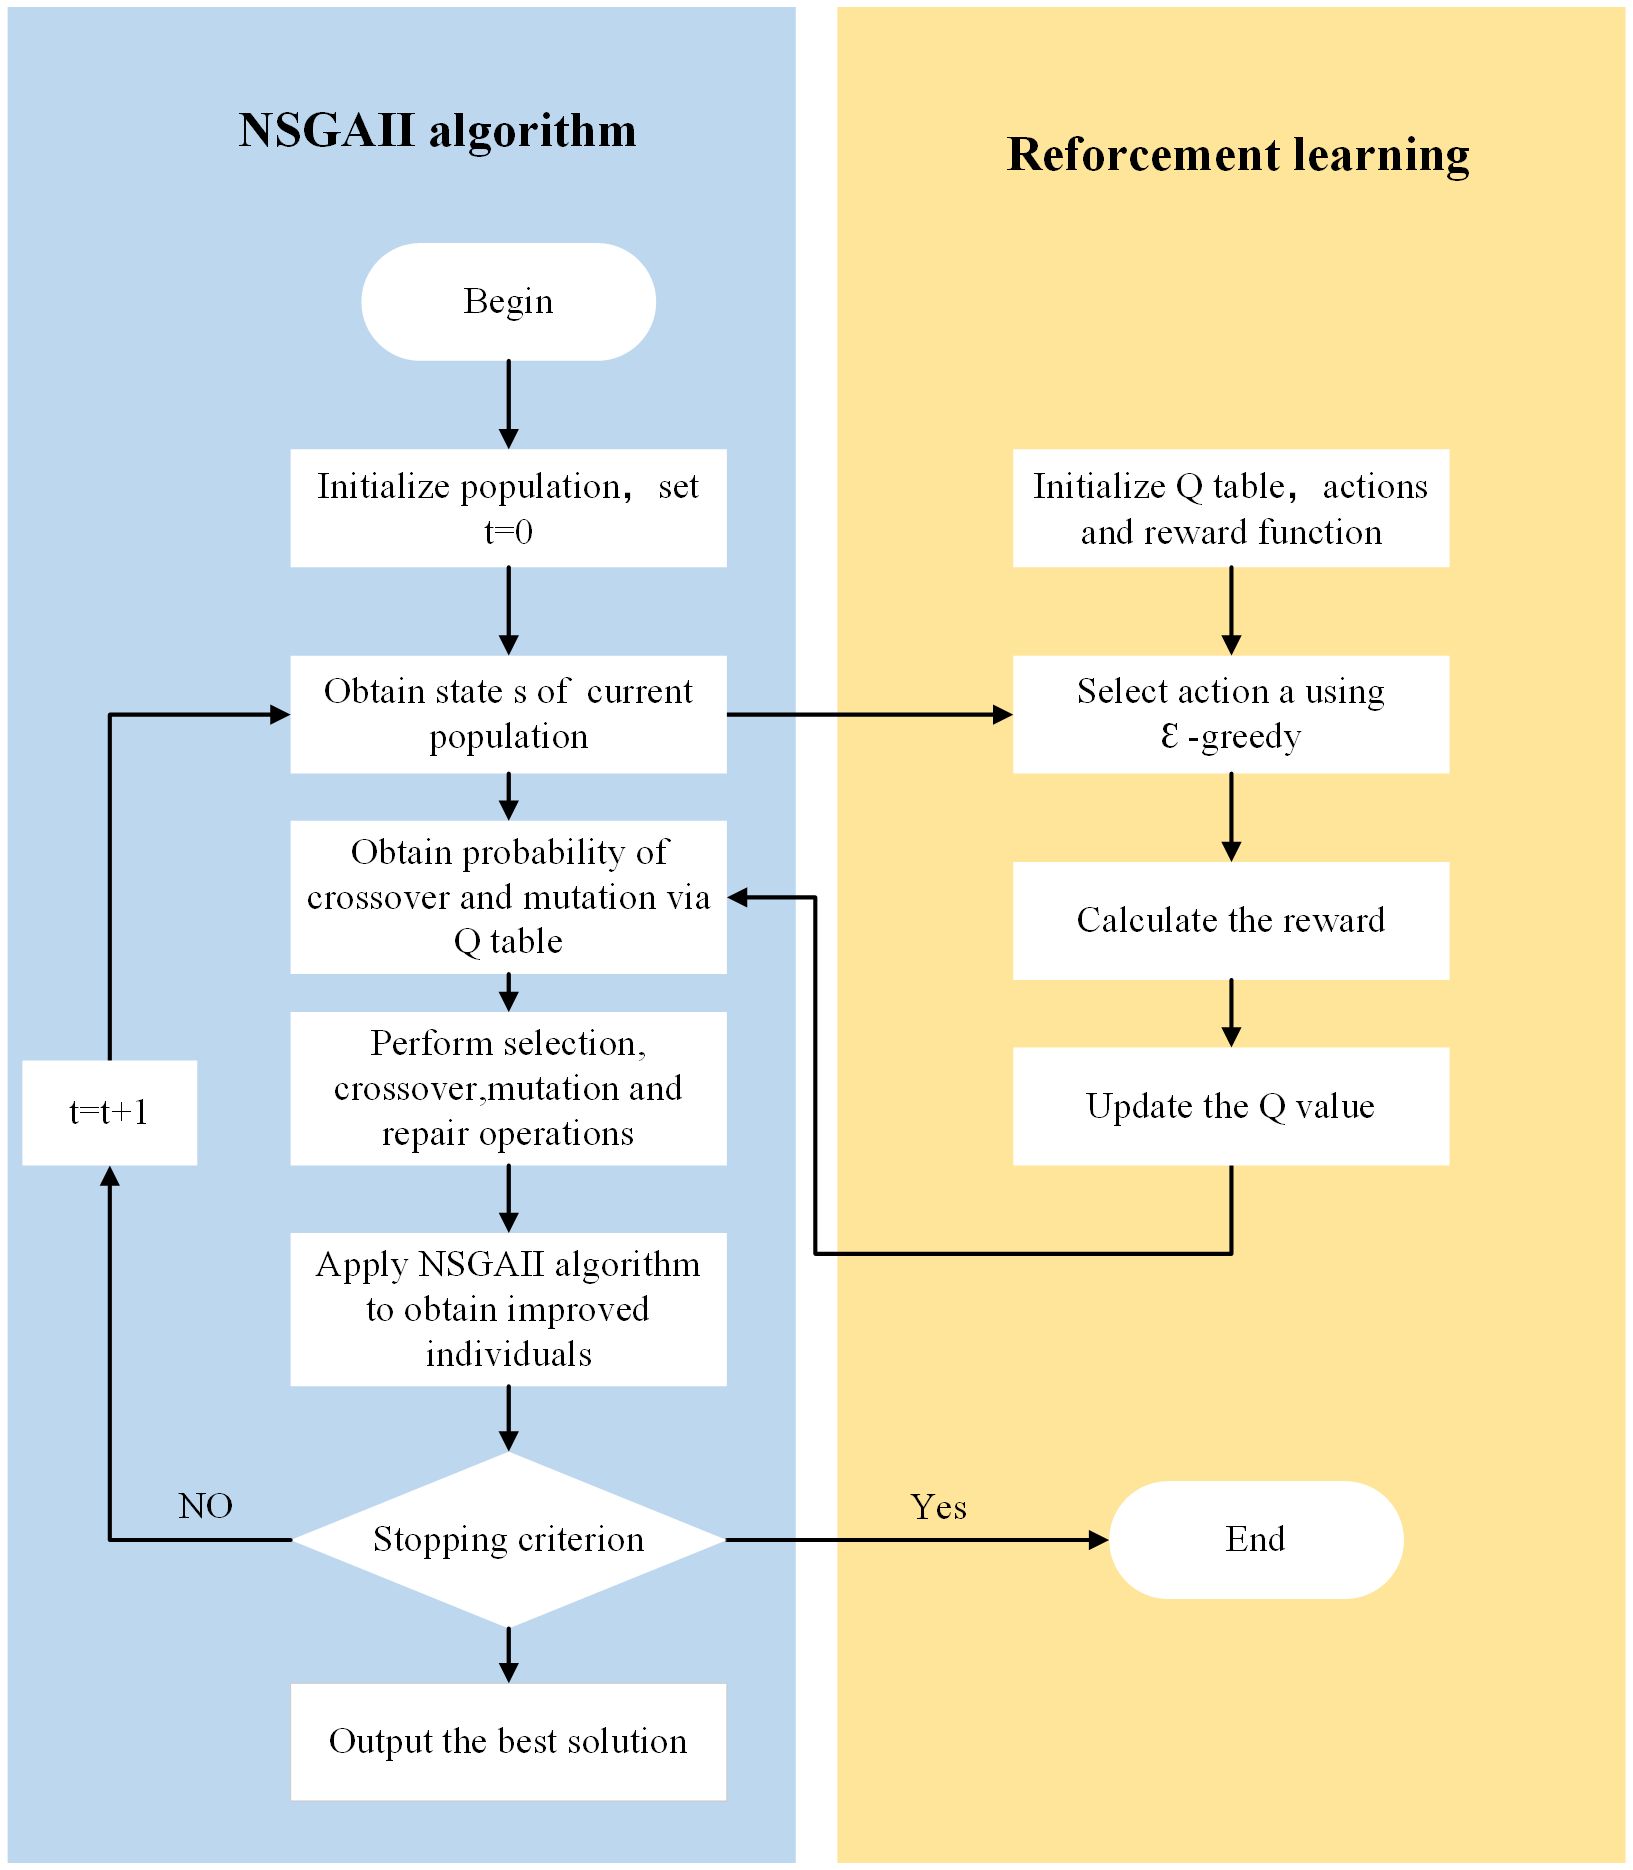
Figure 4 Flow chart of NSGAII-RL algorithm.
(4) Optimization Objectives
In this paper, the mean square deviation of the minimum sailing time of the MSAR vessel, and the minimum response time of the MSAR vessel are chosen as the objective functions. To address the allocation optimization of maritime emergency resources, a multi-objective optimization model is established. The objective function and constraints are expressed in Equations (12–19).
Constraints:
Where, is the speed of each vessel; is the total number of rescue vessels dispatched; is the set of all candidate rescue vessels within the response time of MSAR site i; denotes the response time of the MSAR vessel; represents the distance between black spot j and candidate rescue site i;μ denotes the mean value of the response time, and. is taken as 1 when the rescue site i is selected, and 0 otherwise;
There are many complex factors affecting the scheduling of maritime MSAR vessels and the following assumptions are made for the convenience of modeling and solving:
1) Simplify the base of call for search and rescue vessels, and the annual operational availability of each rescue vessel is 365 days;
2) Assume that each vessel carries a corresponding sufficient of supplies and has the ability to conduct search and rescue at the corresponding accident spot;
3) It is assumed that the probability of the existence of the search and rescue target at each location in the surrounding sea area within the accident spot to be searched is equal, i.e., the search and rescue target is uniformly distributed in the sea area to be searched;
4) Each search and rescue vessel sails at its maximum speed when performing the search and rescue mission;
5) At least 8 ships are assigned to each accident clustering center spot for corresponding guarding and each ship can only correspond to one accident center.
Equation (12) is the objective function 1, which indicates that the total time cost is minimized, where the total time cost is the sum of the time for each MSAR vessel to arrive at the accident center. Equation (13) represents the minimization of the root mean square error of the response time of the MSAR vessels, i.e., the MSAR vessel is able to arrive at the accident center with as little fluctuation of the arrival time as possible. The combination of objective functions 1 and 2 can ensure that the MSAR vessel arrives at each accident spot at the fastest speed possible Equations (14) ~ (19) are the constraints: Equations (14) and (15) denote that the demand of each accident spot is satisfied and there exists at least one corresponding MSAR vessel to realize the full coverage of the whole accident water; Equation (16) denotes that the set of all candidate rescue sites j within the emergency response time of the accident spot; Equations (17) and (18) denote that the distance of search and rescue and the number of search and rescue vessels are not higher than the upper limit of the vessel, respectively; Equation (19) denotes whether the ship is selected or not.
Silhouette Coefficient is used as a clustering evaluation metric which measures the tightness of the cluster in which each sample is located and its separation from other clusters. In terms of the observed values of the silhouette coefficient, higher values indicate better separation of the clustering results, indicating that the samples are more similar within the clusters to which they belong and are more differentiated from other clusters. The range of values is -1 to 1. The formula is derived as Equation (20) where a denotes the average distance of a given sample from other samples within the cluster to which it belongs and b denotes the average distance of a given sample from samples in other clusters.
The total profile coefficients SC for clustering are Equation (21).
The Calinski-Harabasz Index (CHI) assesses the quality of clustering by comparing the mean-variance within clusters with the mean-variance between clusters. Higher values of the Calinski-Harabasz Index indicate better clustering results, i.e., less variance within clusters and more variance between clusters. The formula for the index is Equation (22).
Where is the covariance matrix between each class and is the covariance matrix of the data within each class
The Davies-Bouldin Index (DBI) calculates two pieces of information: the closeness of the distance between the samples within each cluster and the separation of the distances between different clusters. A smaller Davies-Bouldin Index indicates better clustering results, i.e., higher closeness of samples within clusters and greater separation of distances between different clusters.
Si calculates the average distance from the data within a class to the center of mass of the cluster, which is calculated as in Equation (23). It represents the degree of dispersion of each time series in the cluster class i, in which represents the data spot in the cluster class i, Ai is the center of mass of the cluster class i, Ti is the number of data in the cluster class i, and p is taken to be 2 in the usual case, which makes it possible to compute the Euclidean distance between the independent data spots and the center of mass.
Where, represents the value of the center of the mass spot of cluster class i, and is the distance between cluster class i and the center of mass of cluster class j, which is calculated as Equation (24):
DBI defines a value that measures similarity, calculated as Equation (25):
For each cluster class i calculate the maximum value of , denoted as which is calculated as Equation (26):
That is, the maximum similarity value of cluster class i with other classes, that is, the worst result is taken out. Then the maximum similarity of all classes is averaged to get the DBI index, which is calculated as Equation (27):
We collated and filtered the collected historical accident data pertaining to the target sea area. The experimental procedure in this section is as follows: Firstly, the ISODATA algorithm is used to cluster the historical data of the target sea area, find out the corresponding accident centers, and record the distance of the accident centers from the MSAR bases as well as the number of accidents contained in each accident center. Secondly, the entropy weight method is used to evaluate the importance of each accident center, taking into account the size of the accident center and its distance from the MSAR base. The accident centers are then sorted according to their importance level. Subsequently, the collection of ships from the five MSAR bases was collated. It was assumed that all ships were in their respective ports during the dispatch. The NSGAII-RL algorithm is used to dispatch according to the corresponding scheduling order, and eight vessels are assigned to each accident center without repeated use of the vessels. The changes in the objective function are recorded.
The model selected for this study utilizes maritime accident data spanning four years (2019-2022) recorded at five MSAR bases within the Shanghai port, and all the MSAR vessels that can be mobilized from the five MSAR bases. The configuration of the experiment in this paper is Core I9-12900 5 GHz CPU, 16 GB memory, Windows 11 operating system desktop computer, coding is performed using Python 3.11. All algorithms are executed under the same system configuration.
In 2022, Shanghai Port’s container throughput will reach 47.330 million, ranking first in the world for 13 consecutive years. The substantial cargo volume and the multitude of ships navigating near port waters contribute to a high traffic density. For instance, the Shanghai Maritime Search and Rescue Center handled 2,542 various types of accidents and near-miss accidents within its responsibility area from 2018 to 2022.
To evaluate the effectiveness of the proposed model, we conducted a case study on the sea area surrounding the Shanghai port. We collected maritime accident data samples from the Shanghai Maritime Administration, and the time span ranged from January 2019 to December 2022. Five MSAR bases were selected as the starting spot for the departure of MSAR vessels in this paper. Figure 5 depicts the approximate range of waters selected for this experiment. Among them, A~E represents the five selected MSAR bases. While these bases are derived from data provided by the maritime department, their specific names are not disclosed due to data sensitivity. Therefore, they are referred to as A~E in this paper.
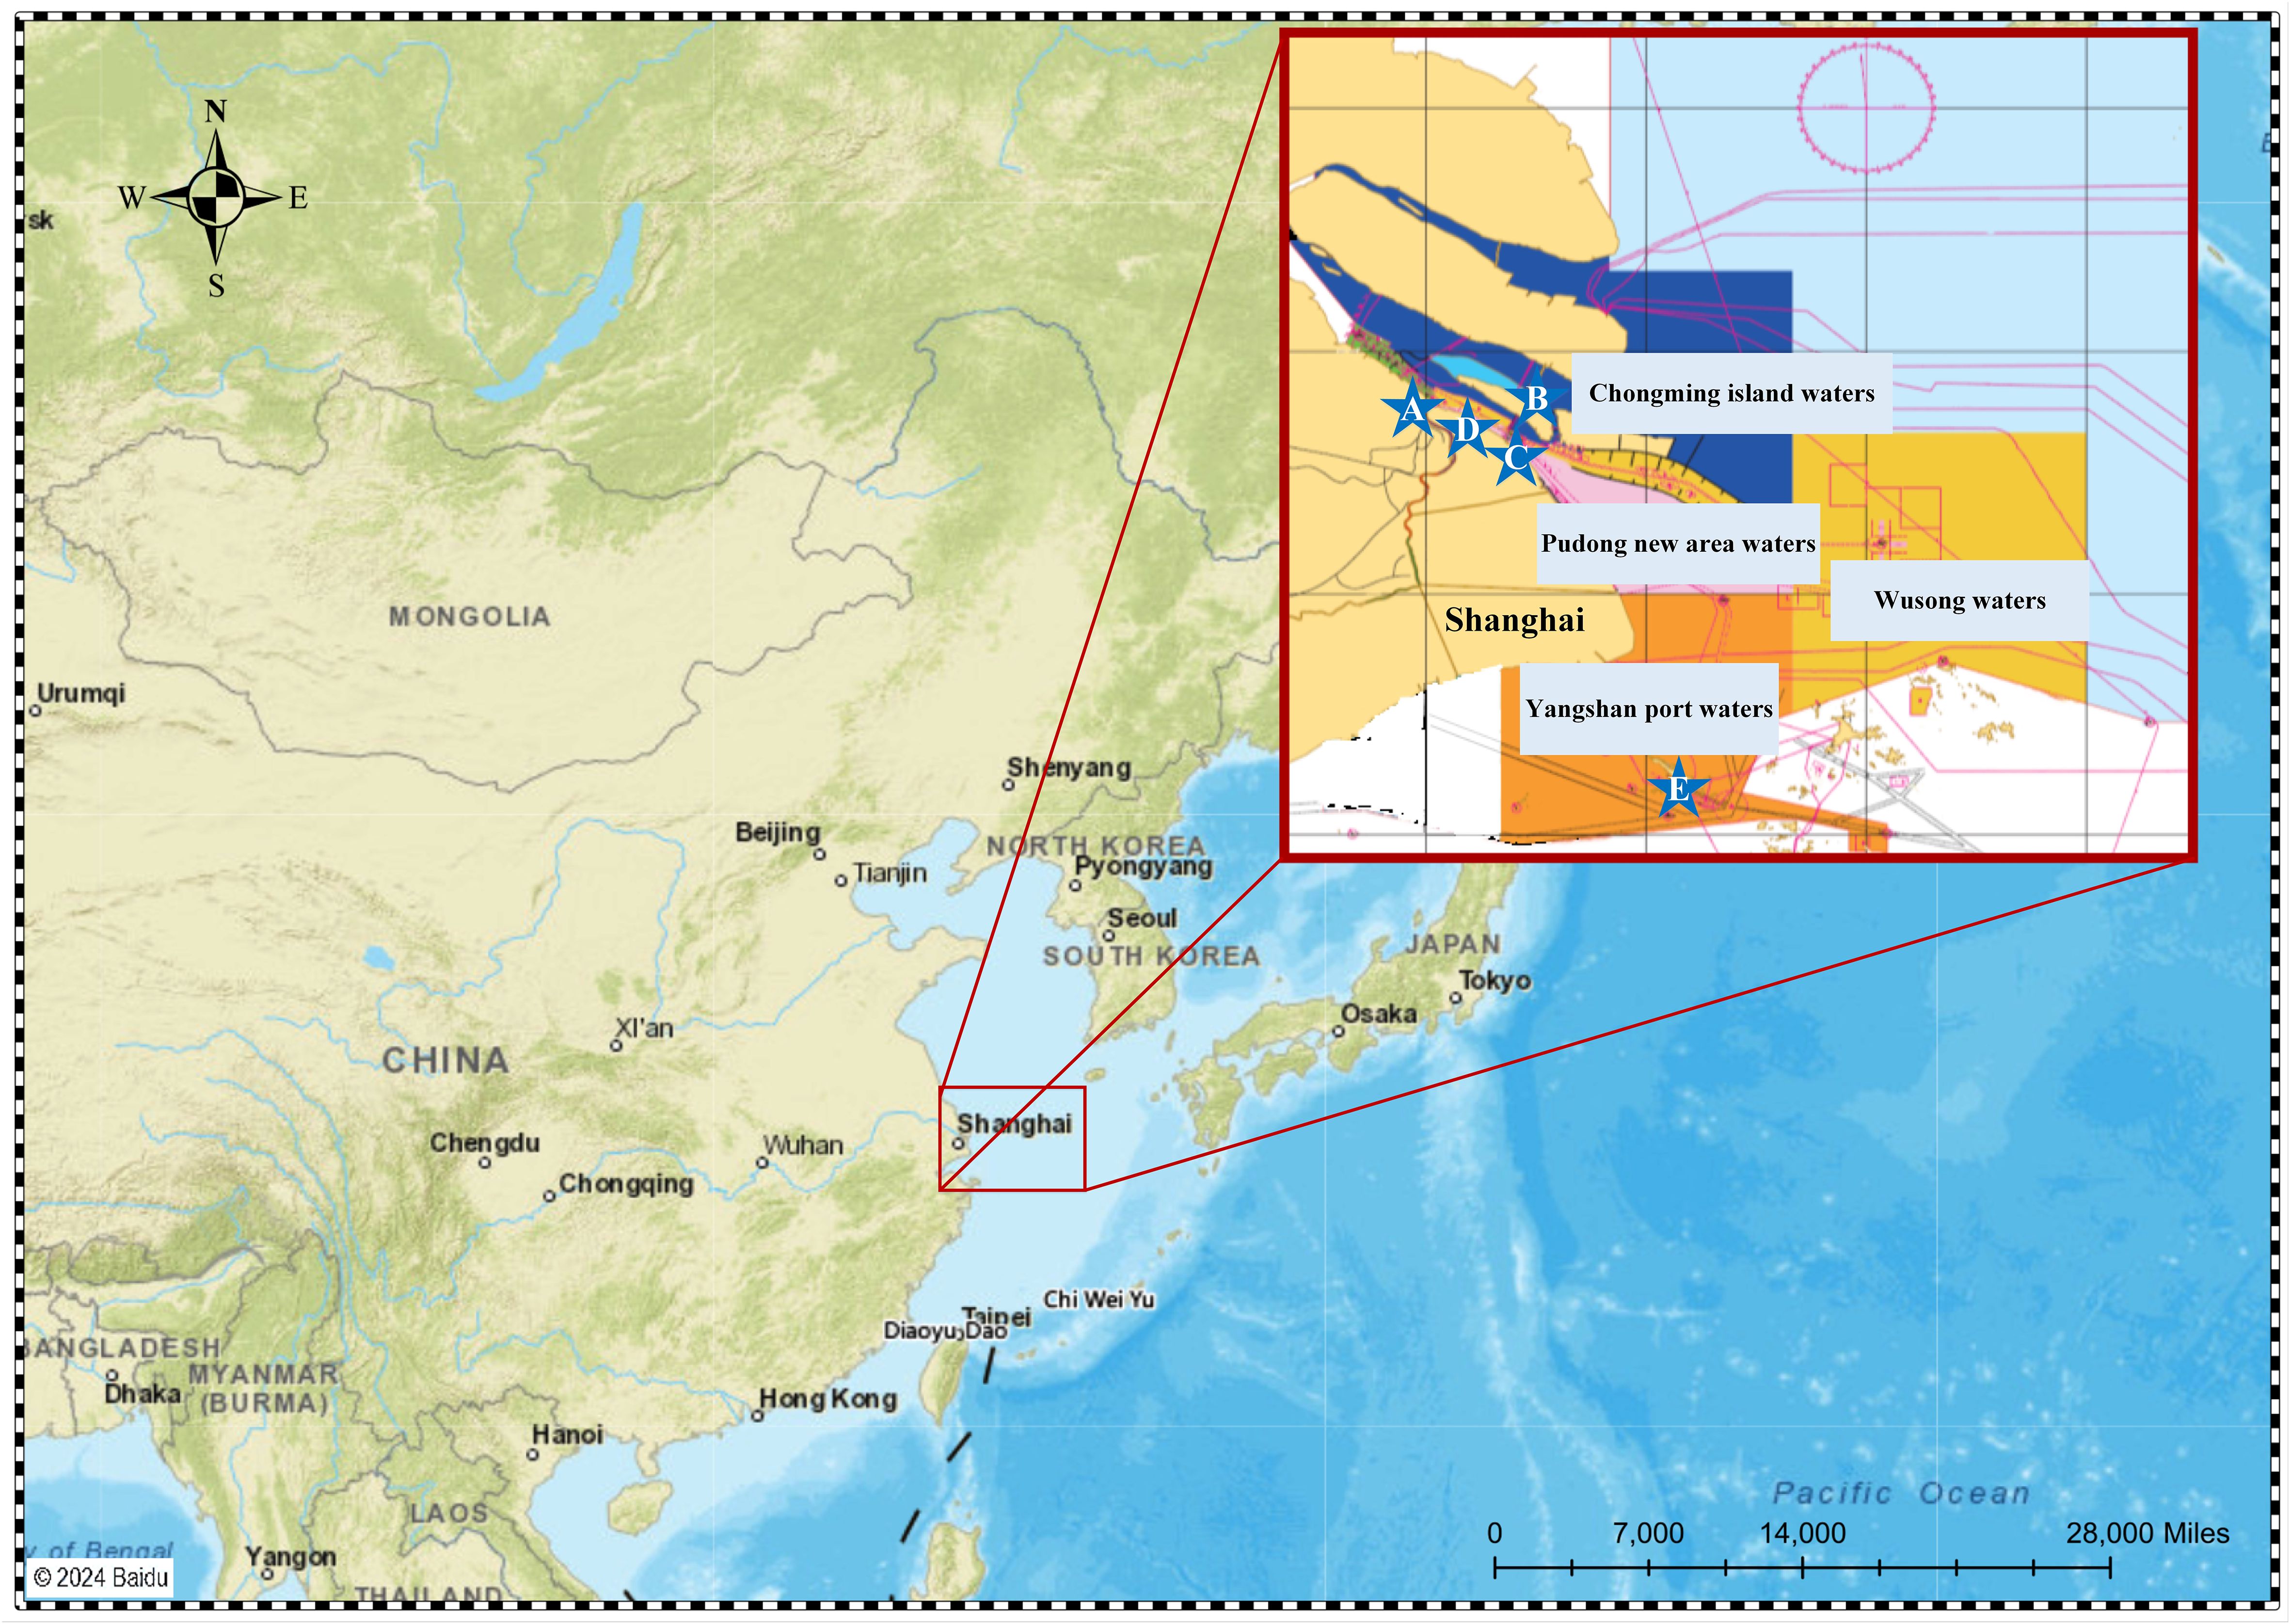
Figure 5 Schematic diagram of Shanghai harbor.
In traditional maritime accident clustering, the large discrepancy in the size of clusters often arises due to the uneven distribution of maritime accident data across different regions. Therefore, in this study, the ISODATA algorithm is compared with K-Means, DBSCAN, and grid clustering algorithms. The minimum and maximum number of accident spots in a cluster is set to 10 and 100, respectively. Based on experience, this range can effectively capture potential clusters in the data. Smaller clusters might not provide sufficient information about accident hot spots, while larger clusters could lead to oversimplification.
The threshold parameter in the ISODATA algorithm is crucial in determining the distance between cluster centers. To substantiate the appropriateness of the threshold parameter, a series of experiments were conducted. As depicted in Figure 6, the threshold’s common value space from 0.05 to 0.5 was divided into ten intervals, and the clustering effect was assessed under each threshold value. Three clustering quality metrics, including SC, DBI, and CHI, were employed for evaluation. The results indicated that the optimal SC and CHI, coupled with the minimized DBI, were attained at a threshold of 0.2. Consequently, 0.2 was selected as the algorithm’s parameter. Additionally, 500 iterations were set, and the number of clusters was defined as 6 as a reference value. However, the execution of the ISODATA algorithm yielded 16 clusters, contrary to the expected number. Thus, further experimentation with the K-means algorithm implementing 16 parameters for clustering was deemed necessary.
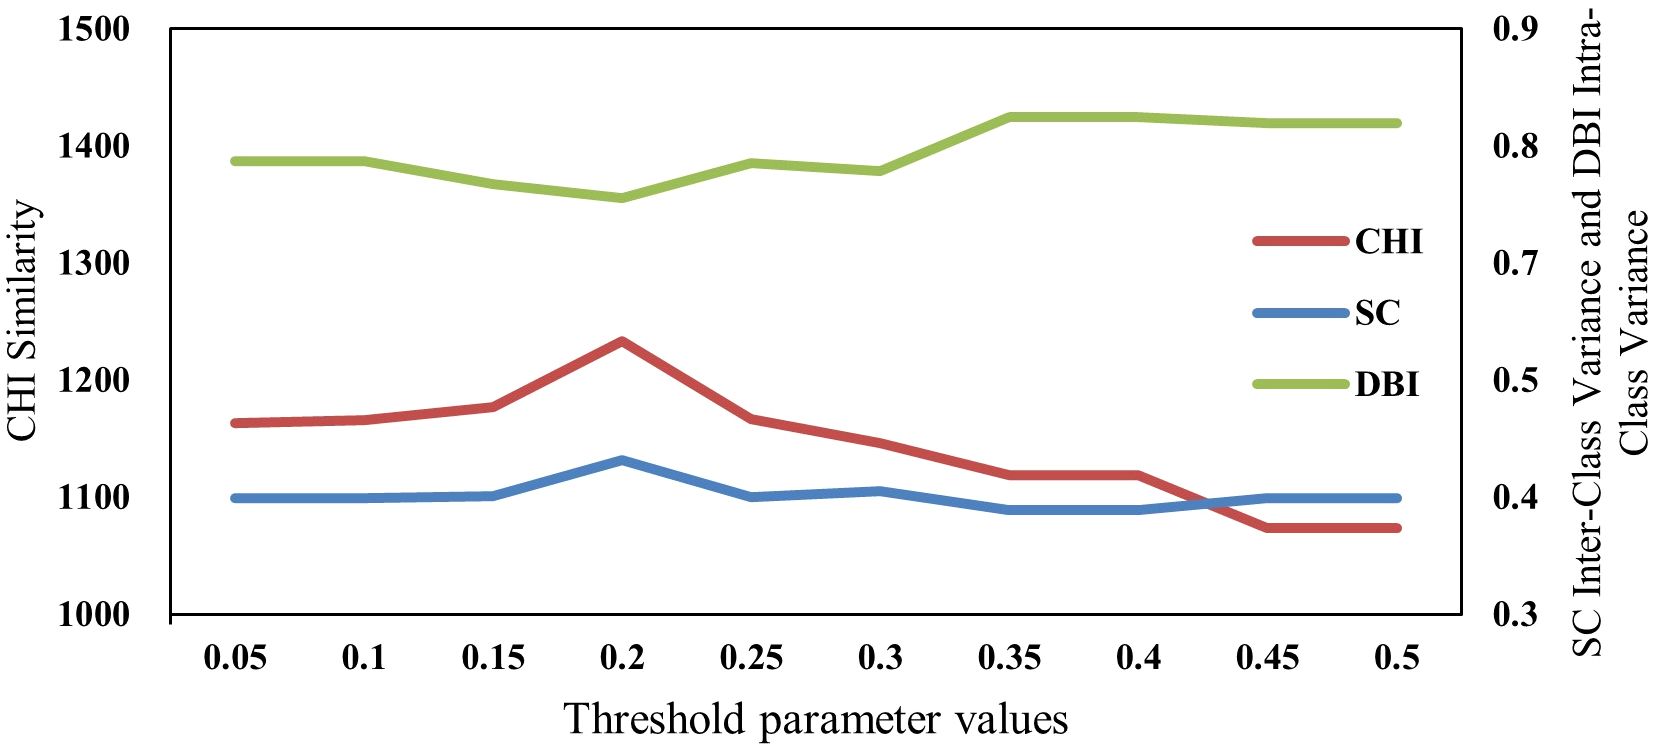
Figure 6 Impact of ISODATA algorithm parameter changes on three indicators.
The clustering performance of four algorithms for maritime accidents in the Shanghai Port is depicted in Figure 7. It is apparent that both DBSCAN and Grid-based Clustering display suboptimal performance in effectively clustering and identifying accident locations. Grid-based clustering offers only a rudimentary categorization of accidents, with numerous accident centers mistakenly identified on land. Similarly, DBSCAN struggles to accurately depict the distribution of accident spots, a limitation attributed to the non-uniform distribution of accident data across various regions, causing certain clustering algorithms to overlook underlying data patterns. Conversely, both the ISODATA algorithm and the KMEANS algorithm demonstrate the ability to identify areas with high accident rates. However, upon closer inspection of the magnified section of the Yangtze River estuary in the figure, it becomes evident that the K-means algorithm’s clustering results exhibit significant variance and do not neatly align with a predetermined number of clusters. In contrast, the adaptive nature of the ISODATA algorithm allows it to effectively handle varying densities and irregular cluster shapes, thereby capturing the nuances and complexity inherent in the accident data more adeptly. From an algorithmic stand spot, the ISODATA algorithm’s superiority over KMEANS lies in its capability to dynamically adjust the number of clusters based on the data distribution, proficiently addressing issues such as varying density and irregular cluster shapes. This adaptability enables the ISODATA algorithm to more accurately capture the complex and non-linear structures evident in the accident data, resulting in more effective clustering outcomes.
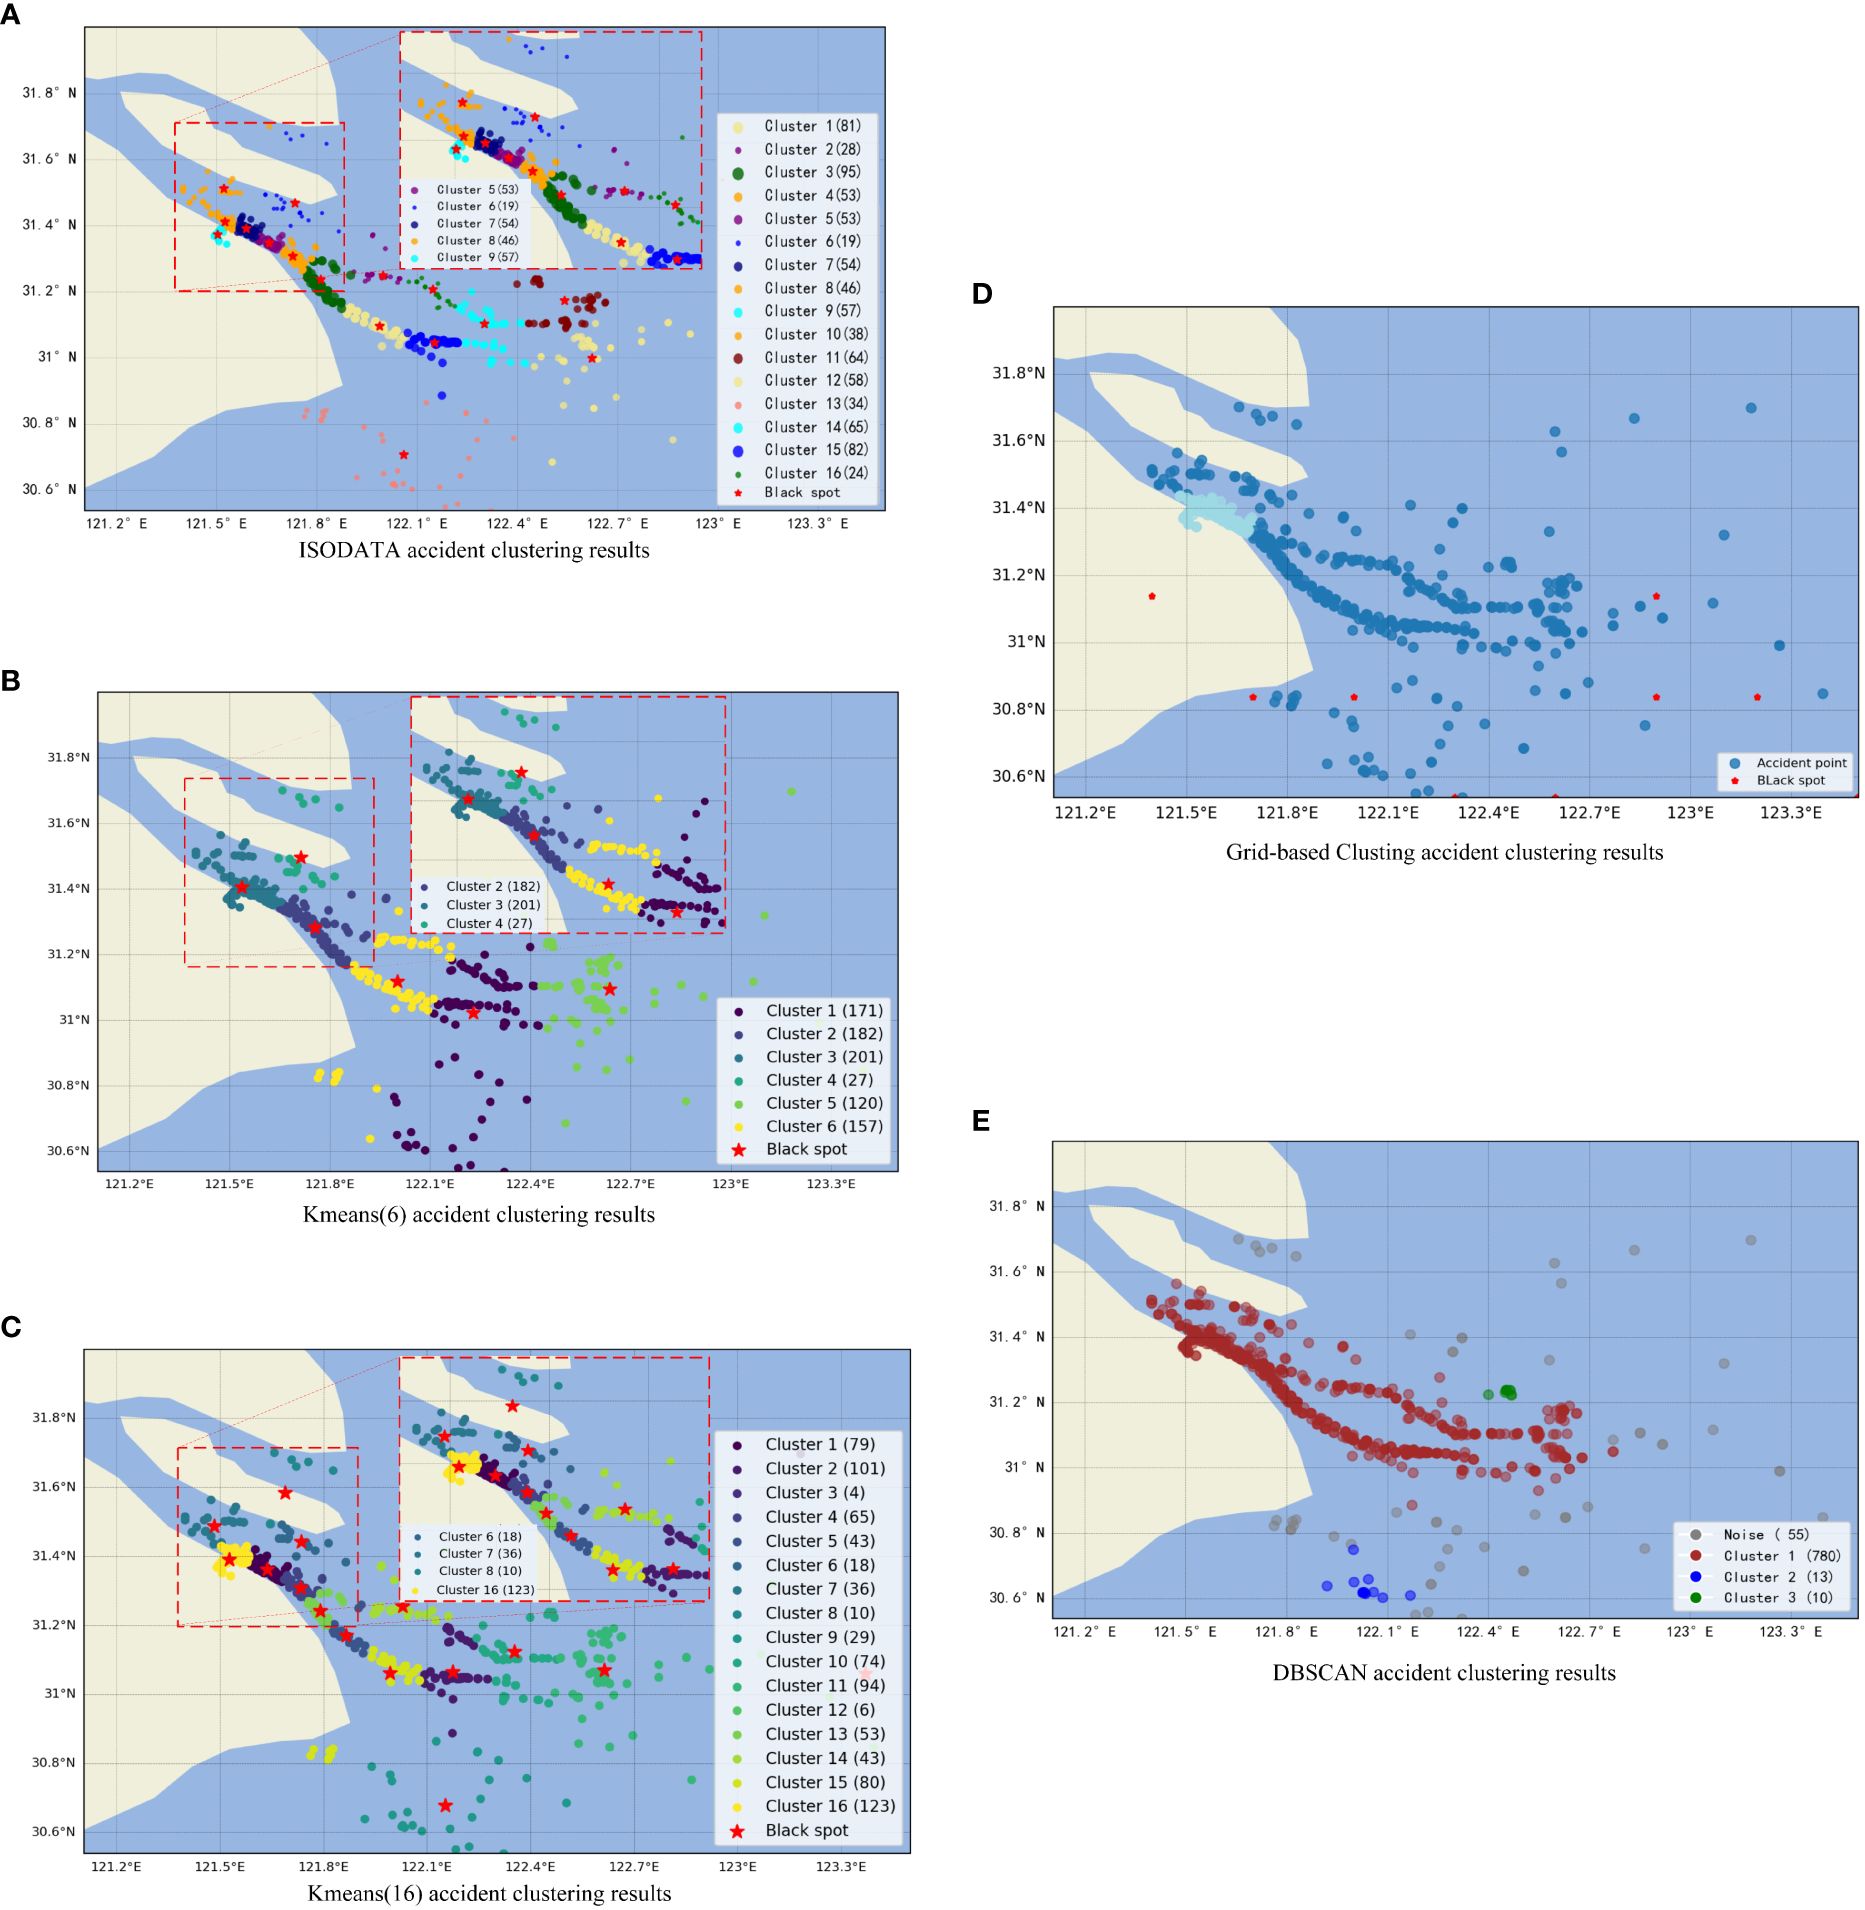
Figure 7 Comparison of four clustering algorithms (A–E).
This is well verified by the evaluation indicators in the following Table 2 ISODATA algorithm has a balanced performance in all aspects. ISODATA algorithm has the highest CHI value, indicating that the dissimilarity between clusters is greater than the dissimilarity within clusters, resulting in a superior clustering effect. In other words, by combining Table 2; Figure 7, it is evident that a smaller CHI value means that relatively similar data spots are assigned to the same cluster, while dissimilar data spots are allocated to different clusters. For instance, the small CHI values of the DBSCAN and Grid-based Clustering algorithms indicate their failure to identify specific outlier spots. Additionally, the higher SC and lower DBI values respectively denote a higher dissimilarity between the data within and nearest clusters, as well as a more compact distribution of data spots within the clusters. These findings collectively indicate that the ISODATA algorithm outperforms other algorithms in terms of clustering effectiveness.
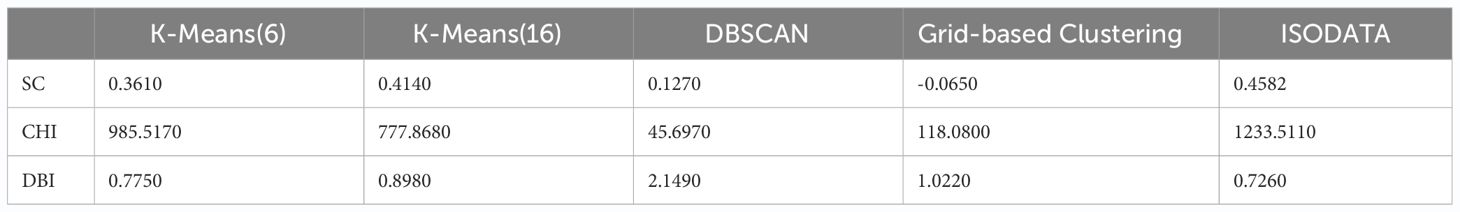
Table 2 Evaluation metrics for different algorithms.
According to the clustering results obtained by the ISODATA algorithm, illustrated in the heat map distribution in Figure 8, with the asterisk representing the location of the MSAR base and the light blue indicating the accident clustering center, it is evident that the accident clustering center is densely concentrated near the mouth of the Huangpu River in the figure. This phenomenon can be attributed to the complex hydrological conditions in and around the Huangpu River inlet. The convergence of ship traffic from the Wusongkou anchorage area results in numerous ship traffic flows with frequent interchanges. This situation is further compounded by the narrowness of the waterways and the high number of anchorages in the area, contributing to a heightened potential for accidents.

Figure 8 Heatmap of ISODATA algorithm.
In this experiment, the distance from each accident black spot to the MSAR base and the size of each accident black spot were chosen as inputs to comprehensively assess the priority of dispatching MSAR forces. Cluster centers with a high frequency of accidents and long distances from each maritime MSAR center should be prioritized for centralized dispatching. As shown in Figure 9, the horizontal axis represents the accident point number. The dashed line on each bar indicates the entropy weight score of the five maritime MSAR centers to the sixteen accident centers, with the blue bar representing the frequency of each accident black spot and the green bar representing the distance weight of each accident black spot. It is apparent that the twelfth accident black spot should be given priority due to its distance from the MSAR bases and the number of accidents in the cluster. Conversely, accident center No.3, which experiences a higher frequency of accidents, is placed behind accident center No.12 due to its proximity to the major MSAR bases. The subsequent Table 3 displays the scheduling order of the MSAR bases and the corresponding index scores.
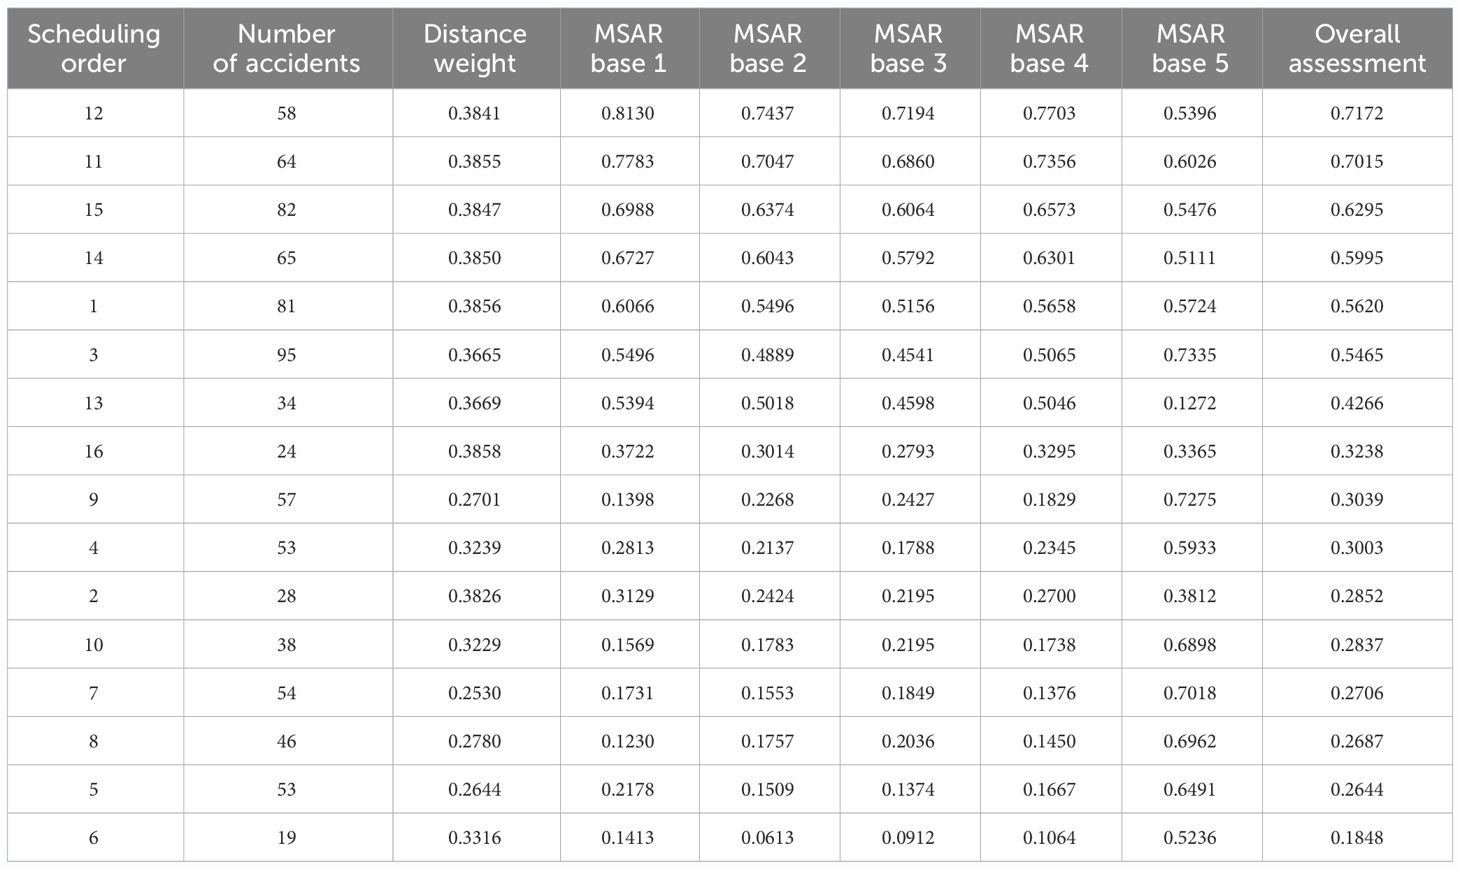
Table 3 Dispatch order of accident black spots and scoring.
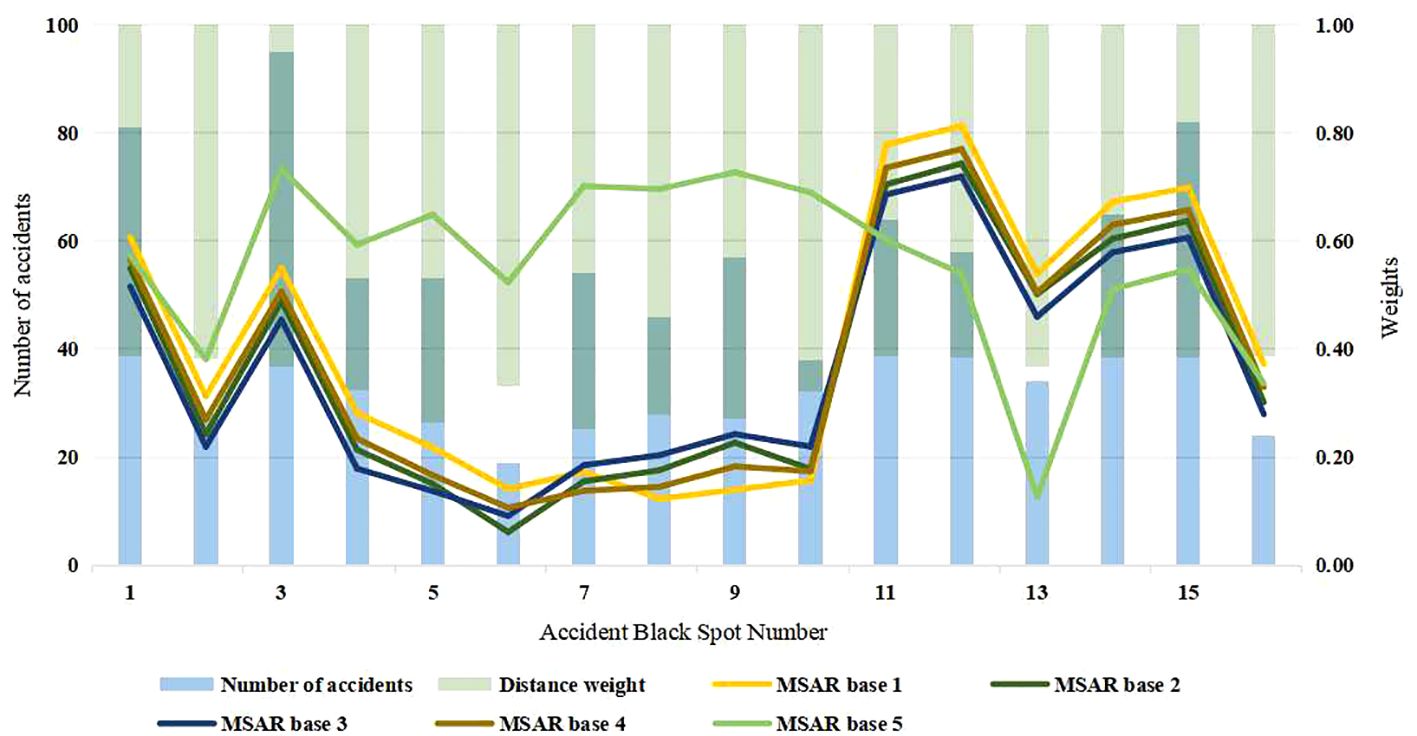
Figure 9 Degree of importance of each accident spot.
Based on the above conclusions the NSGAII-RL algorithm developed in this paper will be compared with three well-known methods: PSO, MOEAD and NSGAII.
Using each algorithm, select ships from all available vessels based on the priority of accident black spots. The selected ships will be removed from the pool of available vessels and the other vessels used for the next black spot, and this process will continue for the comparison of sixteen accident black spots. Each algorithm cycles 10 times and is considered has a set of parameters that remain constant during the search process. The parameters associated with the NSGAII-RL algorithm are set as follows: learning rate α = 0.1, discount factor γ = 0.9, greedy rate ε = 0.5 (Li et al., 2022a), crossover and mutation probabilities, and an initial Q value of 0. Parameters associated with the MOEAD and the NSGAII algorithm are set as follows: the maximum number of iterations MAXGEN = 400, crossover probability Pc = 0.85, and mutation probability Pm = 0.21. The PSO algorithm has an acceleration constant of 2, an inertia weight of 0.5, a chromosome length of 7, and a population size of 8 (Song et al., 2023).
Figure 10 illustrates the fluctuations of parameters and over multiple iterations. The blue line represents the crossover probability, while the red line indicates the mutation probability. Initially, and exhibit substantial oscillations between their maximum and minimum values. However, as the algorithm continues to iterate, and gradually converge within a narrow range. Obviously, and , as the actions that can be selected from the Q-table, are always exploring and obtaining the execution results of the actions through the greedy strategy, and updating the Q-value according to each obtained result to achieve the optimal objective function.
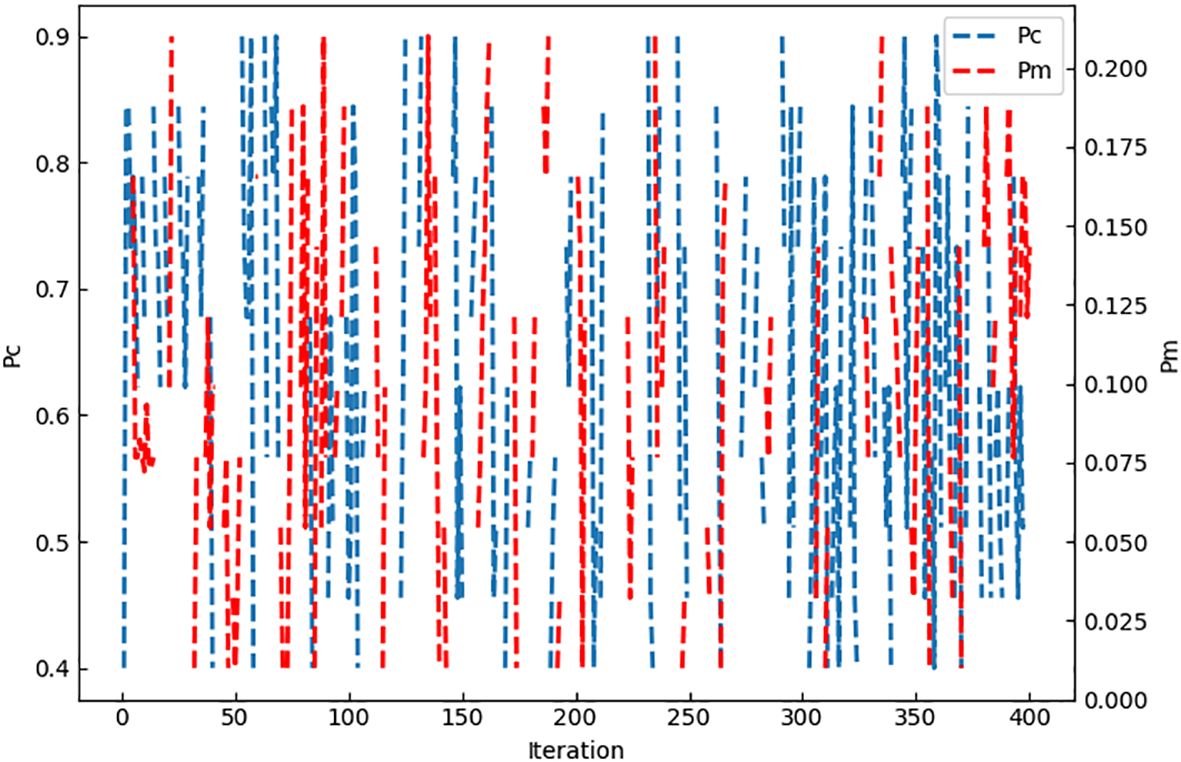
Figure 10 Variation of Pc, Pm with the number of iterations.
Figure 11 depicts the results of four optimization algorithms (NSGAII-RL, NSGAII, MOEAD, and PSO) after iterating through the 16 black spots. As seen in the figure, the optimization solution obtained by the NSGAII-RL algorithm exhibits a significantly broader population distribution, indicating that the algorithm excels in maintaining population diversity. This diversity allows for thorough exploration of all facets of the solution space, considerably increasing the likelihood of discovering the optimal solution. Furthermore, data from Table 4 reveals that the NSGAII-RL algorithm achieves an improvement of over 7% in Obj 1 optimization, suggesting that the algorithm can save at least 7% of the time spent scheduling ships in the ship scheduling problem. In Obj 2, the algorithm also makes significant improvements, effectively reducing the time gaps between ships and thereby enhancing the efficiency of ship scheduling in actual MSAR operations, thus increasing search and rescue probability to a certain extent. Compared to other algorithms, these improvements are primarily attributed to the algorithm’s adaptive iteration, which enables learning from interactions and further refining its search strategy. This results in a strong performance in population diversity and convergence, suggesting that the model can indeed assist the maritime sector in reducing MSAR scheduling time and, consequently, improving the operational efficiency of the search and rescue system.
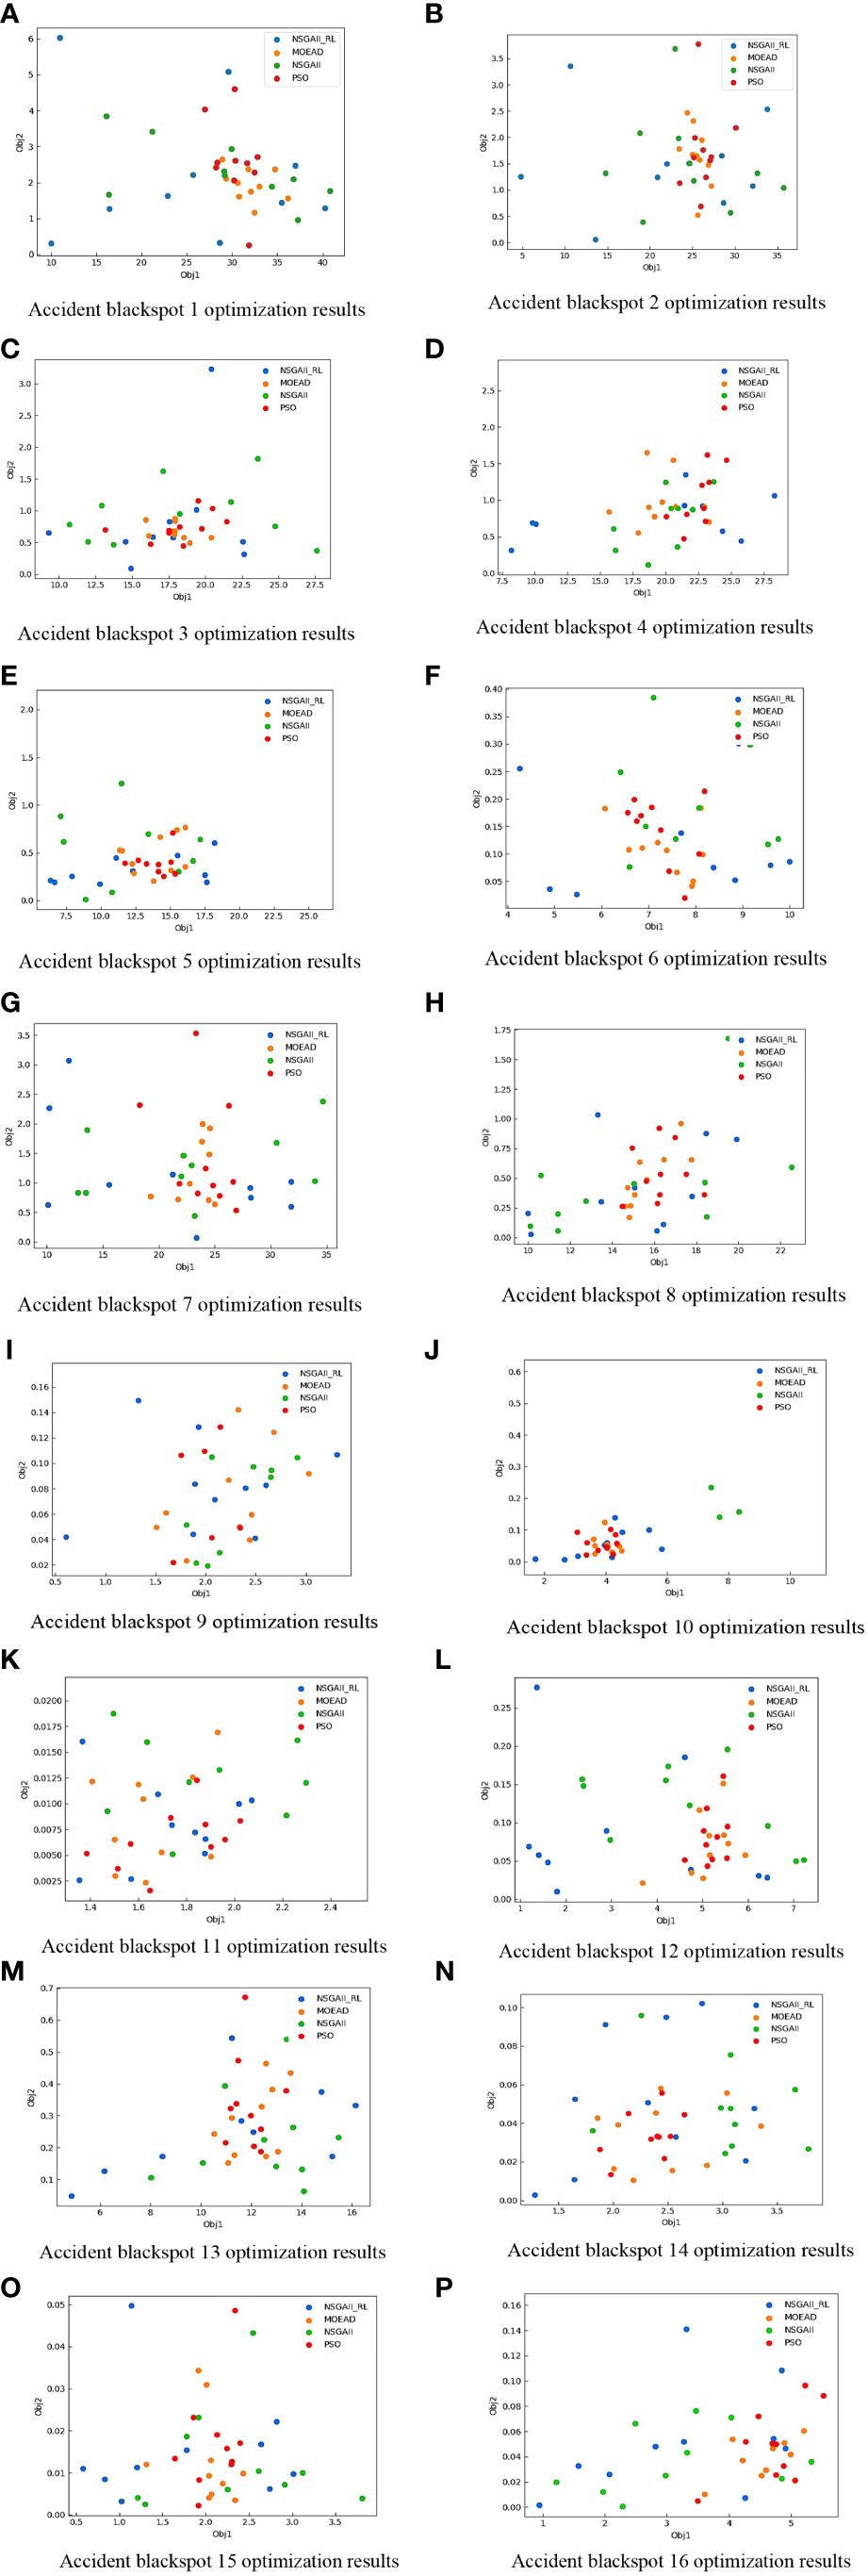
Figure 11 Optimal results for each of the four algorithms (A–P).
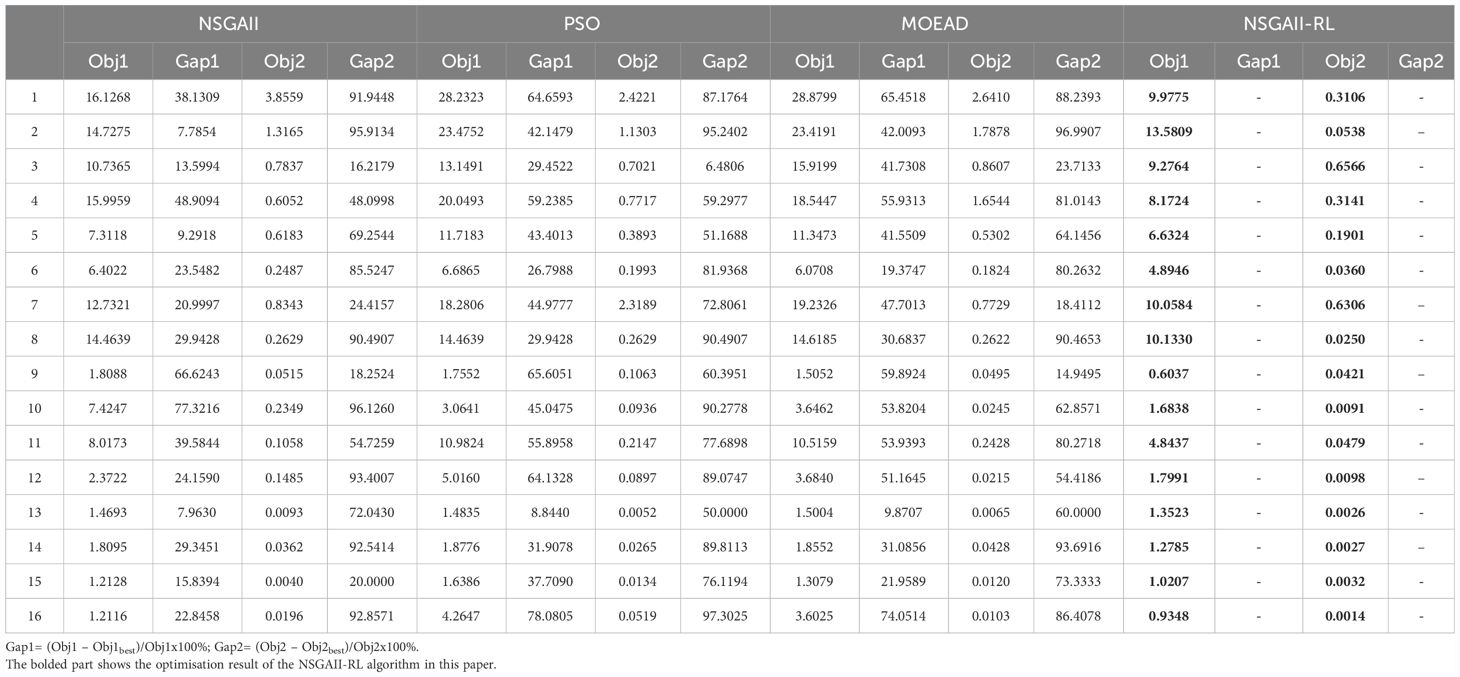
Table 4 Optimization results and running time of the three algorithms.
The rapid development of global maritime trade has posed significant challenges for maritime regulatory authorities, particularly when considering the occurrence of maritime accidents. Maritime accidents not only cause serious harm to personnel and the environment but also result in extensive damages to vessels, cargo, and trade networks. Therefore, there is a need for more effective emergency resource allocation strategies to address this phenomenon. This study presents an integrated approach to emergency resource allocation, consisting of three main steps. Firstly, the accident blackspots within the study area are identified, and the optimal number of clusters is determined using the ISODATA algorithm, accounting for the inherent characteristics of the data. This approach removes the subjectivity and uncertainty associated with manually setting the number of clusters. Moreover, the entropy weighting method is employed to evaluate the accident blackspots, effectively identifying high-risk areas and establishing a prioritized scheduling order. Subsequently, the NSGAII-RL algorithm is employed to efficiently schedule each clustering center. To verify the effectiveness of the proposed method, an extensive comparison with various algorithms is conducted. The experimental results demonstrate that the selected method can reduce the vessel scheduling time by at least 7% and substantially reduce the volatility of the arrival time of the MSAR vessels. Furthermore, the framework proposed in this paper was integrated with actual exercises conducted by the East China Sea Rescue Bureau and underwent field verification in the vicinity of the Yangtze River estuary in Shanghai. Compared to the traditional method, the proposed framework enables faster scheduling of ship resources and reduces losses.
Here are several limitations in this study. Firstly, due to the constraints of accident data, the data used in this study is based on the initial latitude and longitude of the accident report. However, in reality, the position of the search and rescue target may change due to the effects of wind and wave currents, which is a factor not considered in this study. Secondly, the study did not classify accidents according to severity, and all accidents were considered with the same weight, potentially leading to inaccurate assessment results. Additionally, limited by data sensitivity, the consideration of search and rescue capabilities in this study was relatively narrow, focusing only on dispatching search and rescue vessels without fully considering the incorporation of other search and rescue capabilities such as helicopters, intelligent search and rescue vessels, and social search and rescue forces like passing ships.
To address the aforementioned limitations, our team’s future research in the field of MSAR will predominantly concentrate on three key areas. Firstly, the incorporation of relevant drift prediction algorithms to forecast the required time for vessels to reach the scene and subsequently estimate the location of the search and rescue targets. Secondly, the classification of accidents according to severity, and the consideration of multiple factors when scheduling the search and rescue sequence for accident black spots. Thirdly, the consideration of the involvement of additional search and rescue resources, such as helicopters and social search and rescue forces, during the search and rescue process.
The original contributions presented in the study are included in the article/supplementary material. Further inquiries can be directed to the corresponding author.
YS: Writing – review & editing, Writing – original draft, Resources, Project administration, Methodology, Investigation, Data curation, Conceptualization. HC: Writing – review & editing, Writing – original draft, Visualization, Software, Data curation. XC: Supervision, Resources, Methodology, Funding acquisition, Conceptualization, Writing – review & editing, Writing – original draft. YW: Writing – original draft, Supervision, Resources, Methodology, Funding acquisition, Data curation. LD: Writing – original draft, Supervision, Resources, Methodology, Funding acquisition, Data curation. QH: Supervision, Resources, Project administration, Funding acquisition, Formal analysis, Writing – original draft.
The author(s) declare financial support was received for the research, authorship, and/or publication of this article. This work was jointly supported by National Natural Science Foundation of China (52331012, 52372316, 635 52102397, 52071200, 52372316).
Author YW was employed by the company China Construction Harbor and Channel Engineering Bureau Group. Author LD was employed by the company Shanghai Harbor Engineering Design & Research Institute.
The remaining authors declare that the research was conducted in the absence of any commercial or financial relationships that could be constructed as a potential conflict of interest.
All claims expressed in this article are solely those of the authors and do not necessarily represent those of their affiliated organizations, or those of the publisher, the editors and the reviewers. Any product that may be evaluated in this article, or claim that may be made by its manufacturer, is not guaranteed or endorsed by the publisher.
Agbissoh Otote D., Li B., Ai B., Gao S., Xu J., Chen X., et al. (2019). A decision-making algorithm for maritime search and rescue plan. Sustainability 11, 2084. doi: 10.3390/su11072084
Aminzadegan S., Tamannaei M., Fazeli M. (2021). An integrated production and transportation scheduling problem with order acceptance and resource allocation decisions. Appl. Soft Comput. 112, 107770. doi: 10.1016/j.asoc.2021.107770
Ansari F., Kohl L., Sihn W. (2023). A competence-based planning methodology for optimizing human resource allocation in industrial maintenance. CIRP Ann. 72, 389–392. doi: 10.1016/j.cirp.2023.04.050
Cai L., Wu Y., Zhu S., Tan Z., Yi W. (2020). Bi-level programming enabled design of an intelligent maritime search and rescue system. Adv. Eng. Inform. 46, 101194. doi: 10.1016/j.aei.2020.101194
Caunhye A. M., Nie X., Pokharel S. (2012). Optimization models in emergency logistics: A literature review. Socioecon. Plann. Sci. 46, 4–13. doi: 10.1016/j.seps.2011.04.004
Chen R., Yang B., Li S., Wang S. (2020a). A self-learning genetic algorithm based on reinforcement learning for flexible job-shop scheduling problem. Comput. Ind. Eng. 149, 106778. doi: 10.1016/j.cie.2020.106778
Chen Z., Liu H., Tian Y., Wang R., Xiong P., Wu G. (2020b). A particle swarm optimization algorithm based on time-space weight for helicopter maritime search and rescue decision-making. IEEE Access 8, 81526–81541. doi: 10.1109/ACCESS.2020.2990927
Chen X., Liu S., Liu R. W., Wu H., Han B., Zhao J. (2022). Quantifying Arctic oil spilling event risk by integrating an analytic network process and a fuzzy comprehensive evaluation model. Ocean Coast. Manage. 228, 106326. doi: 10.1016/j.ocecoaman.2022.106326
Chen X., Liu S., Zhao J., Wu H., Xian J., Montewka J. (2024a). Autonomous port management based AGV path planning and optimization via an ensemble reinforcement learning framework. Ocean Coast. Manage. 251, 107087. doi: 10.1016/j.ocecoaman.2024.107087
Chen X., Wang M., Ling J., Wu H., Wu B., Li C. (2024b). Ship imaging trajectory extraction via an aggregated you only look once (YOLO) model. Eng. Appl. Artif. Intell. 130, 107742. doi: 10.1016/j.engappai.2023.107742
Cho S. W., Park H. J., Lee H., Shim D. H., Kim S.-Y. (2021). Coverage path planning for multiple unmanned aerial vehicles in maritime search and rescue operations. Comput. Ind. Eng. 161, 107612. doi: 10.1016/j.cie.2021.107612
Choi J.-W., Kwon J.-I., Heo K.-Y., Choi J.-Y. (2020). Hindcasting of Search and Rescue Cases using the Trajectory Model based on KOOS (Korea Operational Oceanographic System). J. Coast. Res. 95, 900–904. doi: 10.2112/SI95-175.1
Chu H., Dong K., Li R., Cheng Q., Zhang C., Huang K., et al. (2022). Integrated modeling and optimization of production planning and scheduling in hybrid flow shop for order production mode. Comput. Ind. Eng. 174, 108741. doi: 10.1016/j.cie.2022.108741
Davis R. A., Lii K.-S., Politis D. N. (Eds.) (2011). Selected Works of Murray Rosenblatt (New York, NY: Springer). doi: 10.1007/978-1-4419-8339-8
Debrabant B., Halekoh U., Bonat W. H., Hansen D. L., Hjelmborg J., Lauritsen J. (2018). Identifying traffic accident black spots with Poisson-Tweedie models. Accid. Anal. Prev. 111, 147–154. doi: 10.1016/j.aap.2017.11.021
Fan Z., Liu C., Cai D., Yue S. (2019). Research on black spot identification of safety in urban traffic accidents based on machine learning method. Saf. Sci. 118, 607–616. doi: 10.1016/j.ssci.2019.05.039
Ghadi M., Török Á., Tanczos K. (2018). Integration of probability and clustering based approaches in the field of black spot identification. Period. Polytech. Civ. Eng. 63(1):46–52. doi: 10.3311/PPci.11753
Jang J. (2020). Wheel slip-based road surface slipperiness detection. Open Transp. J. 14(1):186–193. doi: 10.2174/1874447802014010186
Li R., Zhang X., Jiang L., Yang Z., Guo W. (2022a). An adaptive heuristic algorithm based on reinforcement learning for ship scheduling optimization problem. Ocean Coast. Manage. 230, 106375. doi: 10.1016/j.ocecoaman.2022.106375
Li J., Zhang G., Jiang C., Zhang W. (2023). A survey of maritime unmanned search system: Theory, applications and future directions. Ocean Eng. 285, 115359. doi: 10.1016/j.oceaneng.2023.115359
Ma Q., Zhang D., Wan C., Zhang J., Lyu N. (2022). Multi-objective emergency resources allocation optimization for maritime search and rescue considering accident black-spots. Ocean Eng. 261, 112178. doi: 10.1016/j.oceaneng.2022.112178
Müller-Zhang Z., Kuhn T., Antonino P. O. (2023). Towards live decision-making for service-based production: Integrated process planning and scheduling with Digital Twins and Deep-Q-Learning. Comput. Ind. 149, 103933. doi: 10.1016/j.compind.2023.103933
Rezaee S., Pelot R. (2016). The effect of extratropical cyclone weather conditions on fishing vessel incidents’ severity level in Atlantic Canada. Saf. Sci. 85, 33–40. doi: 10.1016/j.ssci.2015.12.006
Shan Y., Zhang R. (2019). Study on the allocation of a rescue base in the arctic. Symmetry 11, 1073. doi: 10.3390/sym11091073
Shchekinova E. Y., Kumkar Y., Coppini G. (2016). Numerical reconstruction of trajectory of small-size surface drifter in the Mediterranean sea: Reconstruction of surface drift in the Mediterranean sea. Ocean Dyn. 66, 153–161. doi: 10.1007/s10236-015-0916-9
Shu Y., Hu A., Zheng Y., Gan L., Xiao G., Zhou C., et al. (2023). Evaluation of ship emission intensity and the inaccuracy of exhaust emission estimation model. Ocean Eng. 287, 115723. doi: 10.1016/j.oceaneng.2023.115723
Song Y., Wei L., Yang Q., Wu J., Xing L., Chen Y. (2023). RL-GA: A reinforcement learning-based genetic algorithm for electromagnetic detection satellite scheduling problem. Swarm Evol. Comput. 77, 101236. doi: 10.1016/j.swevo.2023.101236
Szénási S., et al. (2021). Available online at: https://dl.acm.org/doi/abs/10.3233/JCM-204186 (Accessed January 9, 2024).
Szénási S., Jankó D. (2017). A method to identify black spot candidates in built-up areas. J. Transp. Saf. Secur. 9, 20–44. doi: 10.1080/19439962.2015.1084409
Wen T., Gao Q., Chen Y., Cheong K. H. (2022). Exploring the vulnerability of transportation networks by entropy: A case study of Asia–Europe maritime transportation network. Reliab. Eng. Syst. Saf. 226, 108578. doi: 10.1016/j.ress.2022.108578
Xiao G., Yang D., Xu L., Li J., Jiang Z. (2024). The application of artificial intelligence technology in shipping: A bibliometric review. J. Mar. Sci. Eng. 12, 624. doi: 10.3390/jmse12040624
Xiong W., Van Gelder P. H. A. J. M., Yang K. (2020a). A decision support method for design and operationalization of search and rescue in maritime emergency. Ocean Eng. 207, 107399. doi: 10.1016/j.oceaneng.2020.107399
Xu Y., Zhang C., He J., Liu Z., Chen Y., Zhang H. (2023). Comparisons on methods for identifying accident black spots using vehicle kinetic parameters collected from road experiments. J. Traffic Transp. Eng. Engl. Ed. 10, 659–674. doi: 10.1016/j.jtte.2021.08.007
Zhang F., Liu Y., Du L., Goerlandt F., Sui Z., Wen Y. (2023). A rule-based maritime traffic situation complex network approach for enhancing situation awareness of vessel traffic service operators. Ocean Eng. 284, 115203. doi: 10.1016/j.oceaneng.2023.115203
Zhang J., Wan C., He A., Zhang D., Soares C. G. (2021a). A two-stage black-spot identification model for inland waterway transportation. Reliab. Eng. Syst. Saf. 213, 107677. doi: 10.1016/j.ress.2021.107677
Zhang M., Conti F., Le Sourne H., Vassalos D., Kujala P., Lindroth D., et al. (2021b). A method for the direct assessment of ship collision damage and flooding risk in real conditions. Ocean Eng. 237, 109605. doi: 10.1016/j.oceaneng.2021.109605
Keywords: MSAR resource allocation, iterative self-organizing data analysis algorithm, accident black spot, entropy weighting method, hybrid non-dominated sorting genetic algorithm
Citation: Sun Y, Hou C, Chen X, Wang Y, Dai L and Hu Q (2024) Accident black spot clustering oriented maritime search and rescue resource allocation and optimization. Front. Mar. Sci. 11:1395614. doi: 10.3389/fmars.2024.1395614
Received: 04 March 2024; Accepted: 29 April 2024;
Published: 21 May 2024.
Edited by:
Jie Nie, Ocean University of China, ChinaCopyright © 2024 Sun, Hou, Chen, Wang, Dai and Hu. This is an open-access article distributed under the terms of the Creative Commons Attribution License (CC BY). The use, distribution or reproduction in other forums is permitted, provided the original author(s) and the copyright owner(s) are credited and that the original publication in this journal is cited, in accordance with accepted academic practice. No use, distribution or reproduction is permitted which does not comply with these terms.
*Correspondence: XinQiang Chen, Y2hlbnhpbnFpYW5nQHN0dS5zaG10dS5lZHUuY24=
Disclaimer: All claims expressed in this article are solely those of the authors and do not necessarily represent those of their affiliated organizations, or those of the publisher, the editors and the reviewers. Any product that may be evaluated in this article or claim that may be made by its manufacturer is not guaranteed or endorsed by the publisher.
Research integrity at Frontiers
Learn more about the work of our research integrity team to safeguard the quality of each article we publish.