 Zhisen Luo1†
 Murong Yi1†
 Xiaodong Yang1Hui Wen1
 Changping Jiang1
 Xiongbo He1
 Hung-Du Lin2*
 Yunrong Yan1,3*
- 1College of Fisheries, Guangdong Ocean University, Zhanjiang, China
- 2The Affiliated School of National Tainan First Senior High School, Tainan, Taiwan
- 3Guangdong Provincial Engineering and Technology Research Center of Far Sea Fisheries Management and Fishing of South China Sea, Guangdong Ocean University, Zhanjiang, China
Despite the critical role of mitochondrial genomes (mitogenomes) in species identification and evolutionary studies in the genus Parupeneus, current resources are inadequate, given the species richness. Although previous studies have suggested a complex evolutionary history, the detailed mitogenomic variations and their implications remain largely unexplored. Therefore, we sequenced and assembled the mitogenomes of P. barberinoides, P. barberinus, P. biaculeatus, P. crassilabris, P. cyclostomus, P. heptacanthus, P. multifasciatus, and P. chrysopleuron, to enrich the molecular data and provide novel insights into the genetic diversity, evolutionary dynamics and phylogenetics of the family Mullidae. Our analysis revealed a novel gene rearrangement in P. chrysopleuron, Cytb-T-P-CR-Q-I-F-12S-V-16S-ND1-M-ND2, which differed from the conventional sequence of Cytb-T-P-CR-F-12S-V-16S-ND1-I-Q-M-ND2 observed in other species. In the novel rearrangement, four non-coding regions are inserted between ND1 and M, Q and I, I and ψM (tRNA-Met pseudogene), ψM and F. We assume that two tandem duplication/random loss events occur in the CR and IQM, making the entire sequence longer than that in other Parupeneus species. The phylogenetic results indicated that Mullidae formed a sister group relationship with the family Dactylopteridae, contradicting previous studies that identified a sister group relationship between Mullidae and Callionymoidei. The genera Parupeneus and Mullus formed a sister group, and discrepancies were found in the topological structure of the interspecies relationships within the genus Parupeneus compared with those reported by previous studies. Through combined phylogenetic and mitochondrial structural analysis, we found that phylogenetic topology is closely related to mitochondrial structural abnormalities. This study not only expands the mitogenomic dataset available for Mullidae but also underscores the importance of mitochondrial DNA studies in resolving taxonomic ambiguities and understanding the evolutionary history of marine fishes. Our study contributes to the ongoing research on marine fish taxonomy, mitogenomics, and evolutionary biology by providing new insights into the genetic diversity of marine ecosystems.
1 Introduction
The family Mullidae, known as goatfish, comprises six genera, including Parupeneus Bleeker, 1863, Upeneus Cuvier, 1829, Mullus Linnaeus, 1758, Upeneichthys Bleeker, 1853, Mulloidichthys Whitley, 1929, and Pseudupeneus Bleeker, 1862. Their species are prevalent in the Pacific and Indian Oceans, with only a few found in the Atlantic Ocean (Randall, 2004). A distinctive morphological feature of Parupeneus setting it apart from the other genera is its uniserial arrangement of stout, blunt-tipped and widely spaced teeth within the jaws, and the notable absence of the vomer and palatine teeth (Schultz et al., 1960). Parupeneus represents a significantly diverse group within Mullidae, comprising 35 of 100 species (Fricke et al., 2024).
Several taxonomic studies on Parupeneus have contributed greatly to the exploration of its phylogeny. For example, Kim (2002) analyzed the phylogenetic evolutionary relationships between genera of Mullidae based on osteological and myological systems; however, the relationships between species remain unclear, and the Parupeneus branch exhibits a comb-like structure, making it difficult to clearly discern interspecies relationships. As molecular biology advances and species samples accumulate, genomic datasets have the potential to significantly improve the resolution of phylogenetic trees (Dettai and Lecointre, 2005; Lim et al., 2021; Yi et al., 2021). Longo et al. (2017) were the first to employ ultra-conserved elements (UCEs) to analyze molecular phylogenetic relationships within the order Syngnathiformes, including six species from Parupeneus. Their study predominantly concentrated on the phylogenetic relationships between different families. The findings revealed that the family Callionymidae shares a close phylogenetic connection with Mullidae, which is characterized by short branches. This pattern suggests that Mullidae, particularly its genus Parupeneus, experienced rapid evolutionary diversification. Santaquiteria et al. (2021) analyzed the biogeography of Syngnathiformes and found that Mullidae diverged approximately 18.0 million years ago, and Parupeneus diverged approximately 5.0 million years ago. Similar to Longo et al. (2017), they reported that Mullidae underwent a rapid radiation event, and their phylogenetic tree showed consistent relationships among Parupeneus species. Although Longo et al. (2017) and Santaquiteria et al. (2021) did not focus directly on Mullidae, their studies provide valuable insights into the phylogeny of this group. Nash et al. (2022) enhanced the phylogenetic analysis of Mullidae by expanding on prior studies. They incorporated a wider range of species into their study and increased the representation of Parupeneus species, providing a more comprehensive understanding of the evolutionary relationships of Mullidae. However, the systematic positions of certain Parupeneus species, such as Parupeneus chrysopleuron (Temminck & Schlegel, 1843), Parupeneus cyclostomus (Lacepède, 1801) and Parupeneus chrysonemus (Jordan & Evermann, 1903), highlighting the need for further investigation.
Mitochondrial genomes (mitogenomes) are characterized by their compact structures, strict maternal inheritance, minimal or no recombination, and rapid evolutionary rates. These unique features have led to the extensive utilization of mitogenomes in a variety of molecular analyses, including species taxonomy, lineage biogeography, molecular ecology, species evolution, and population genetics (Shaffer and McKnight, 1996; Ward et al., 2005; Couvreur et al., 2010; Yi et al., 2018; Gu et al., 2022). However, studies on goatfish are scarce, particularly with respect to the mitogenome. The earliest study involving the entire goatfish mitogenome was conducted by Song et al. (2014) in which they only assembled the complete mitochondrial sequences of four goatfish species, with only one Parupeneus species. Subsequently, Song et al. (2017) published a complete mitogenome of Parupeneus barberinus (Lacepède, 1801). Sun and Xu (2020) identified an unusual mitogenomic structure in P. chrysopleuron, which differed from the typical mitochondrial gene order observed in other fish species. tRNA-Ile (I) and tRNA-Gln (Q) were mapped after tRNA-Pro (P), followed by tRNA-Met (M). However, the mechanism underlying this rearrangement remains unclear. Overall, the availability of whole mitogenomes of Parupeneus species is limited, given their high diversity. This limits our ability to fully comprehend the phylogeny of Parupeneus. According to the National Center for Biotechnology Information (NCBI, https://www.ncbi.nlm.nih.gov/) and as of 2023, only three Parupeneus species have complete and effective whole mitogenomes, and the complete mitochondrial structures and phylogenetic status of many other Parupeneus species remain unknown.
The mitogenomes of animals are relatively conserved, and only a few species exhibit gene rearrangements (Miya and Nishida, 1999; Miya et al., 2001; Dowton et al., 2003; Miya et al., 2003; Mabuchi et al., 2004; Luo et al., 2019; Wang et al., 2020). Various forms of gene rearrangements have been observed in fish mitogenomes. These rearrangements can be categorized into three main types (Satoh et al., 2016): (1) shuffling, in which genes migrate from one side of the same coding strand to the other, often occurring within gene clusters such as IQM, WANCY, and HSL; (2) transpositions, in which single or multiple genes are relocated over significant distances along the same coding strand; (3) and inversions, in which genes shift from their original coding strands to different coding strands without undergoing transposition. With the increasing availability of mitogenomic data and the expansion of sampling areas, different types of gene rearrangement models have been found in many vertebrates, suggesting that gene rearrangement is related to phylogeny (Haring et al., 2001; Kong et al., 2009; Zhang et al., 2021), but the two aspects appear unconnected in some species (Inoue et al., 2003; Xu et al., 2012; Xia et al., 2014). Whether the genetic rearrangement of Parupeneus is linked to phylogeny remains unknown, and the mechanism of rearrangement remains unclear. The scarcity of comprehensive mitogenomic studies within the genus Parupeneus restricts our ability to advance the classification, phylogeny, molecular ecology, species evolution, and population genetics of Mullidae.
In this study, we sequenced and assembled the complete mitogenomes of eight species, including Parupeneus barberinoides (Bleeker, 1852), P. barberinus, Parupeneus biaculeatus (Richardson, 1846), Parupeneus crassilabris (Valenciennes, 1831), P. cyclostomus, Parupeneus heptacanthus (Lacepède, 1802), Parupeneus multifasciatus (Quoy & Gaimard, 1825) and P. chrysopleuron. Notably, five whole mitogenomes (P. barberinoides, P. biaculeatus, P. crassilabris, P. cyclostomus, and P. heptacanthus) have been published for the first time in NCBI. Previous studies by Longo et al. (2017) and Santaquiteria et al. (2021) have reported that Mullidae is closely related to four families: Pegasidae, Dactylopteridae, Draconettidae, and Callionymidae. Therefore, we compared the complete mitogenomes of all goatfish species from the NCBI database and the present study with those of the above four families. We proposed an explanation for the mechanism of gene rearrangement in P. chrysopleuron using the tandem duplication/random loss (TDRL) model combining intramitochondrial recombination and discussed the relationship between rearrangement and phylogeny. Our study aimed to enhance our understanding of the taxonomic status and genetics of Parupeneus and Mullidae.
2 Materials and methods
2.1 Specimen collection and DNA extraction
All specimens were morphologically identified based on Randall (2004) and deposited at the College of Fisheries, Guangdong Ocean University (Zhanjiang, China). Muscle tissues were isolated from eight specimens of Parupeneus (P. barberinoides, P. barberinus, P. biaculeatus, P. crassilabris, P. cyclostomus, P. heptacanthus, P. multifasciatus, and P. chrysopleuron) and stored in a 95% alcohol solution and in -20°C freezer for later study. Whole DNA was extracted using an E.Z.N.A® Tissue DNA kit (Omega Bio-Tek, Inc., Norcross, GA, USA). Detailed information on the specimen collection and voucher numbers of specimens is provided in Supplementary Table S1.
2.2 Mitogenome sequencing and assembly
A genomic DNA library was prepared with a 300–500 base pair (bp) insert size and sequenced using an Illumina Hiseq2500 sequencer (Illumina, San Diego, CA, USA). Low-quality reads and adapter sequences were filtered out using Cutadapt v1.16 (Martin, 2011). Sequencing-related quality assessment was performed on the raw sequencing data of each sample based on FastQC v0.11.4 (https://www.bioinformatics.babraham.ac.uk/projects/fastqc/). Optimal genomic de novo assemblies were generated using NOVOPlasty (https://github.com/ndierckx/NOVOPlasty).
2.3 Mitogenome annotation and analysis
Mitogenome annotation was conducted using MITOS (Donath et al., 2019), and the results were manually corrected. The secondary structures and locations of mitochondrial tRNA genes were identified using ARWEN (Laslett and Canback, 2008) and the tRNAscan-SE Search Server v2.0 (Lowe and Chan, 2016; Chan and Lowe, 2019). The mitogenomic sequences were uploaded to GenBank with the accession numbers listed in Supplementary Table S1. CGView Server v1.0 (Grant and Stothard, 2008) was used to create mitogenome circular maps. Nucleotide base composition and codon usage of the 13 protein-coding genes (PCGs) were obtained using MEGA X (Tamura et al., 2013). AT-skew ([A-T]/[A+T]) and GC-skew ([G-C]/[G+C]) were used to measure the differences in nucleotide composition between genes. The synonymous (Ks) and non-synonymous (Ka) substitution rates were determined, and the p-distance of 13 PCGs was conducted to determine the nucleotide diversity using DnaSP 6.0 (Rozas et al., 2017). The gene rearrangement in P. chrysopleuron, was considered to be a novel gene order, while mitogenomes of other species of Parupeneus were ancestral gene orders. All sequence comparison plots were generated using the ESPrint 3.0 tool (http://espript.ibcp.fr/) (Robert and Gouet, 2014) and subsequently manually edited. We then compared the mitogenomes in pairs by manual alignment and referred to examples of gene rearrangement by Gong et al. (2020) to reconstruct potential gene order rearrangement events (Dowton et al., 2003) and explain the gene rearrangement in P. chrysopleuron.
2.4 Phylogenetic analysis
Phylogenetic datasets with 13 PCGs, two rRNAs, and 22 tRNAs from 33 sequences were analyzed, including eight sequences from this study and 25 from NCBI, of which three Syngnathidae sequences were utilized as the outgroup (Miya et al., 2003; Kawahara et al., 2008; Song et al., 2012, 2014; Wang and Zhou, 2019; Sun and Xu, 2020; Liu et al., 2021; He et al., 2022; Wang et al., 2022). The accession numbers of the sequences are listed in Supplementary Table S1. The DNA sequences of the 13 PCGs, two rRNAs, and 22 tRNAs were aligned using MAFFT (Katoh and Standley, 2013) with default parameters. MACSE v.2.03 (Ranwez et al., 2018) was used to optimize the 13 PCG sequences, and Gblocks (Talavera and Castresana, 2007) was employed to clear the ambiguously aligned fragments. Phylogenetic trees were constructed based on the alignment dataset (13 PCGs+2 rRNAs+22 tRNAs) using maximum likelihood (ML) and Bayesian inference (BI) methods conducted by IQ-TREE (Nguyen et al., 2015) and MrBayes 3.2.6 (Ronquist et al., 2012) plugin integrated into PhyloSuite v1.2.2 (Zhang et al., 2020). The 13 PCGs were divided into three predefined partitions for the best partitioning scheme, and ModelFinder (Kalyaanamoorthy et al., 2017) was used to select the best-fit models using the BIC criterion for all datasets. The selections results are listed Supplementary Table S2. Maximum likelihood phylogenies were inferred using an edge-linked partition model for 10,000 ultrafast bootstraps (Minh et al., 2013), as well as the Shimodaira–Hasegawa-like approximate likelihood-ratio test (Guindon et al., 2010). Bayesian inference phylogenies were inferred using a partition model (two parallel runs, 5,000,000 generations) in which the initial 25% of the sampled data were discarded as burn-in.
3 Results
3.1 Genome organization and base composition
The complete mitogenomes of the eight species, namely, P. barberinoides, P. barberinus, P. biaculeatus, P. crassilabris, P. cyclostomus, P. heptacanthus, P. multifasciatus, and P. chrysopleuron, ranged in size from 16,570–17,402 bp and were typically composed of circular double-stranded DNA containing 37 genes. Similar to those of other teleosts (Boore, 1999; Yi et al., 2022), each mitogenome (Figure 1) contained 13 PCGs on the heavy strand (H-strand), with the except for ND6, which was located on the light strand (L-strand). In addition, there were two rRNA genes on the H-strand and 22 tRNAs, 14 on the H-strand and eight on the L-strand.
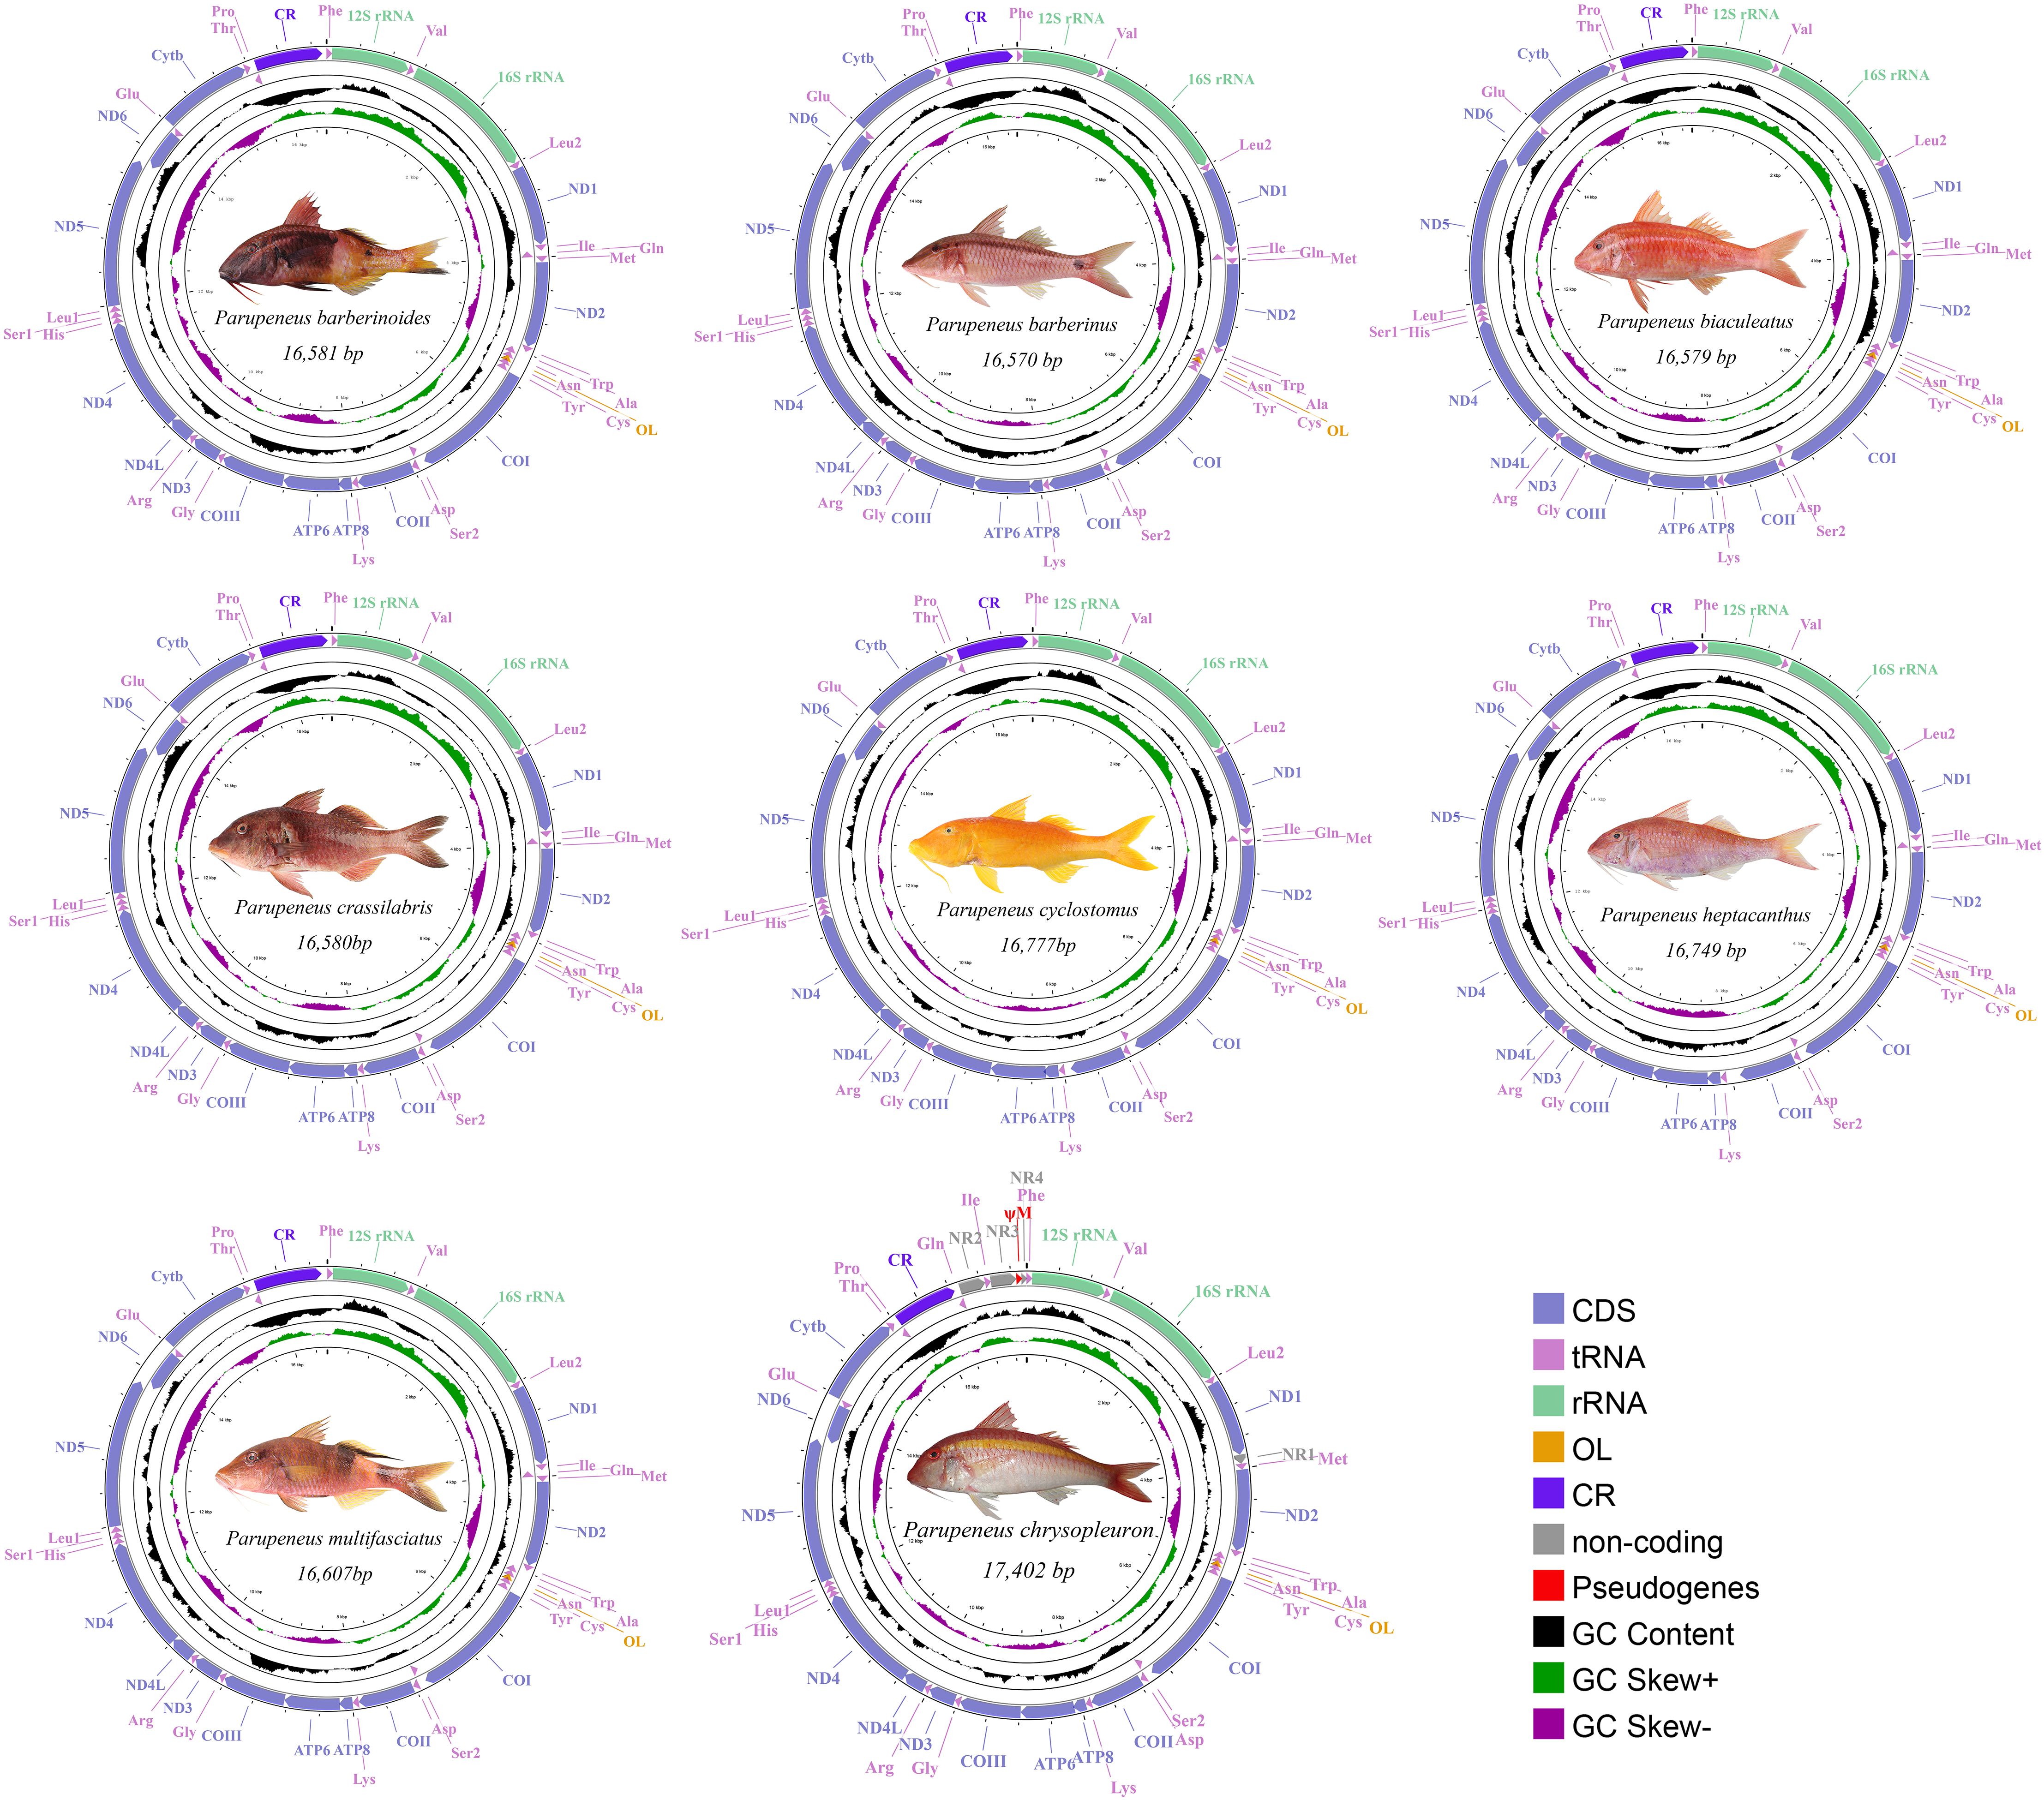
Figure 1 Mitogenomes of P. barberinoides, P. barberinus, P. biaculeatus, P. crassilabris, P. cyclostomus, P. heptacanthus, P. multifasciatus, P. chrysopleuron (From left to right, from top to bottom).
The mitogenomic sequences of vertebrates are conserved, featuring a typical order of gene arrangement: Phe (F)-12S rRNA (12S)-Val (V)-16S rRNA (16S)-Leu2 (L2)-ND1-Ile (I)-Gln (Q)-Met (M)-ND2-Trp (W)-Ala (A)-Asn (N)-Cys (C)-Tyr (Y)-COI-Asp (D)-Ser2 (S2)-COII-Lys (K)-ATP8-ATP6-COIII-Gly (G)-ND3-Arg (R)-ND4L-ND4-His (H)-Ser1 (S1)-Leu1 (L1)-ND5-ND6-Glu (E)-Cytb-Thr (T)-Pro (P) (Anderson et al., 1981). Seven species in this study have a typical gene arrangement order, whereas P. chrysopleuron, had two rearrangements (Figure 1, Figure 2, Supplementary Tables S3 and S4). First, the I-Q gene was located behind the control region (CR) instead of between ND1 and M. Secondly, the order of those genes was altered to Q-I (Figure 1, Supplementary Table S4). The overall gene order for P. chrysopleuron is presented as Cytb-T-P-CR-Q-I-F-12S-V-16S-ND1-M-ND2, diverging from the traditional arrangement of Cytb-T-P-CR-F-12S-V-16S-ND1-I-Q-M-ND2.
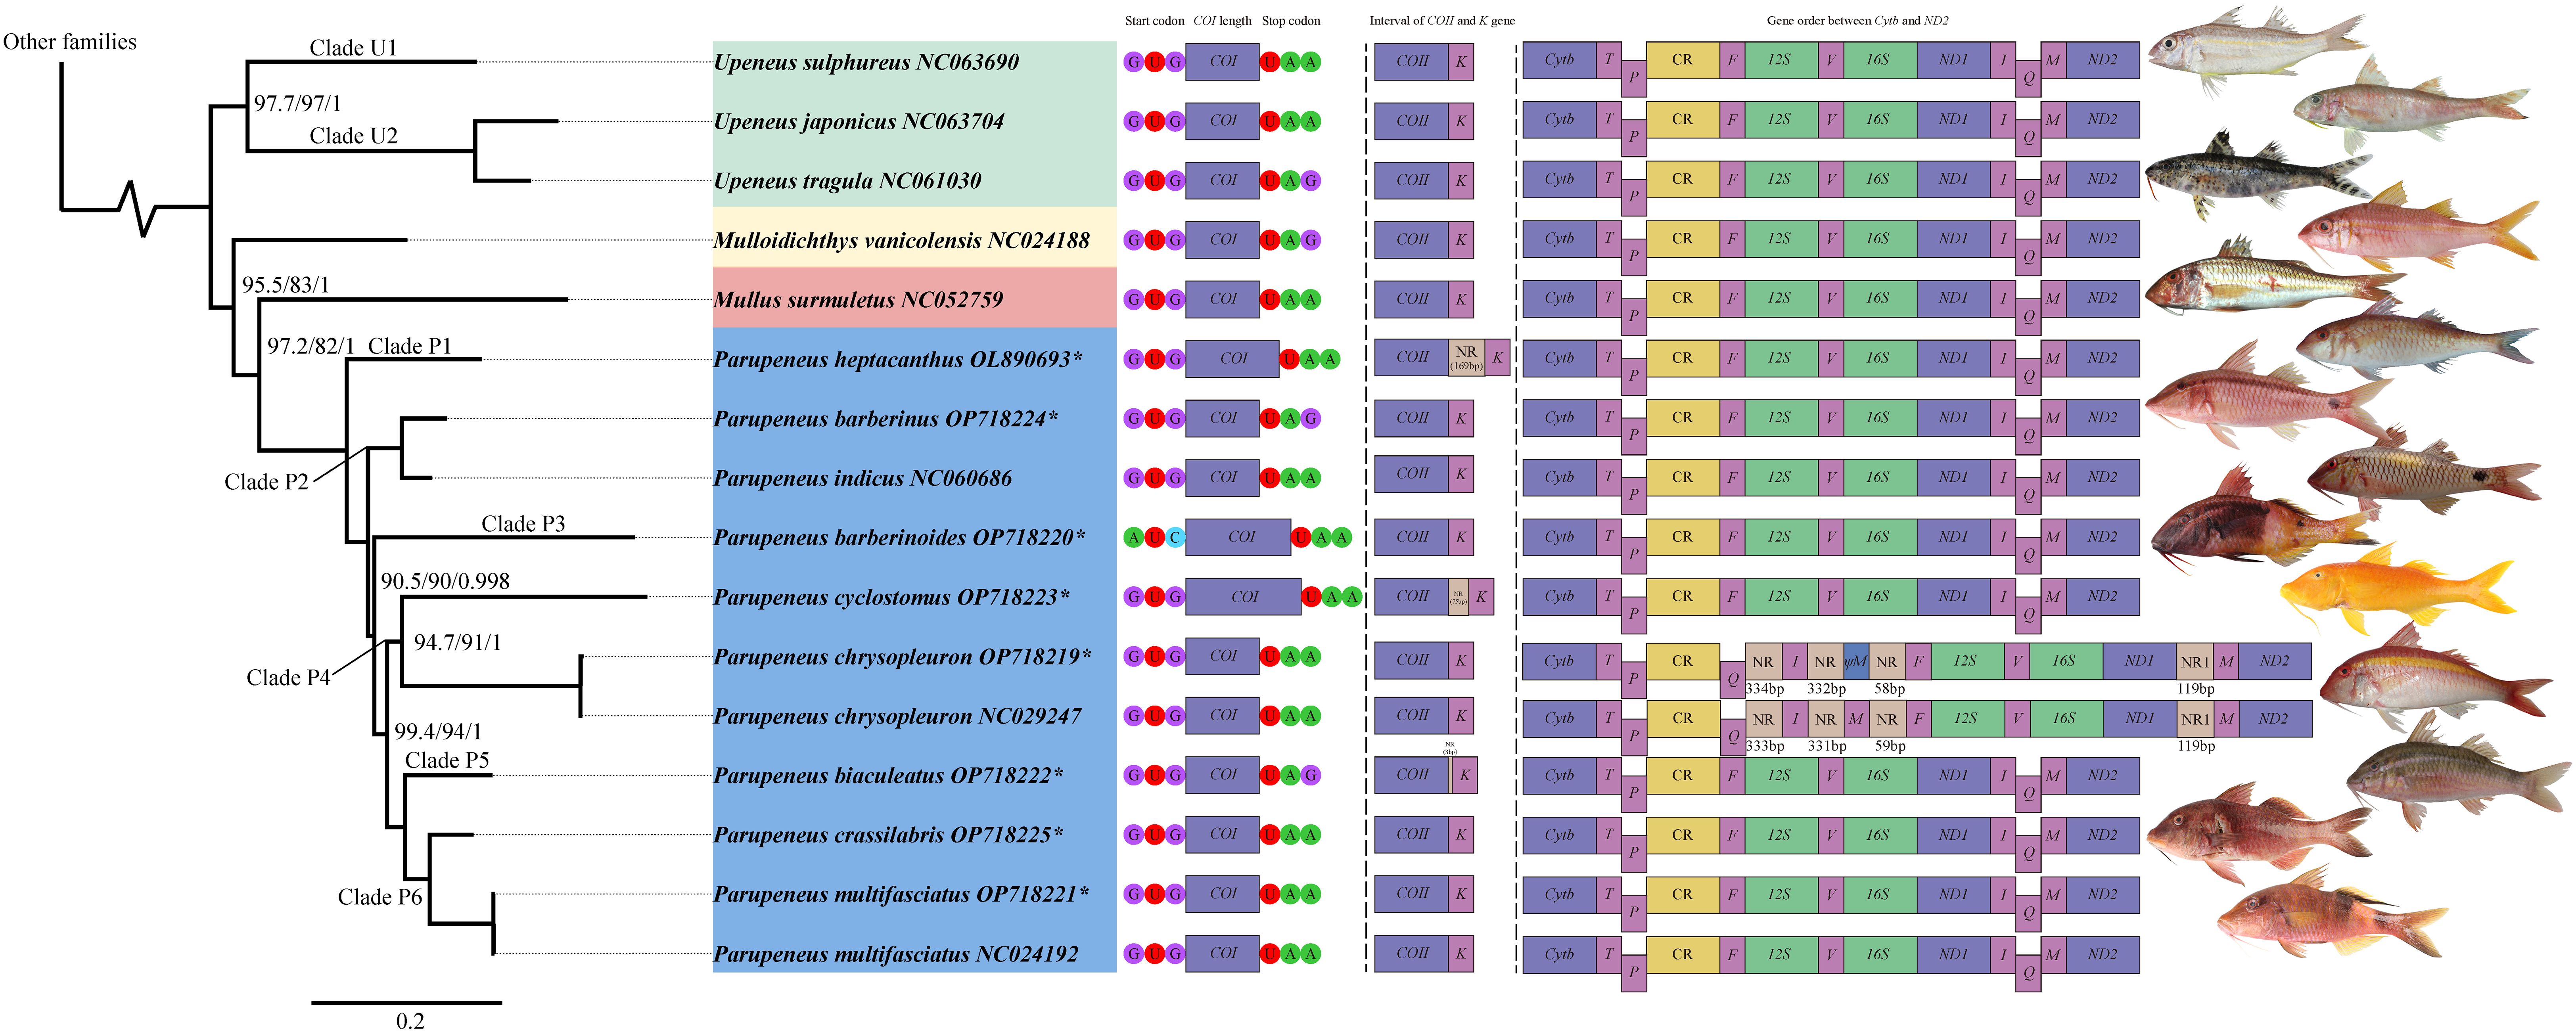
Figure 2 Phylogenetic tree of Mullidae. Numbers in node are SH-aLRT support (%) / ultrafast bootstrap support (%) / posterior probability. Without number in node means 100/100/1. The characters following the species name represents the GenBank accession number. The pattern of (*) means sequence in this study. Green area in species information: Upeneus genus. Yellow area in species information: Mulloidichthys genus. Red area in species information: Mullus genus. Blue area in species information: Parupeneus genus. Species information is followed by the COI length and its start and stop codon; then the spacing between the COII and K genes; then the gene order between Cytb and ND2. The species figures correspond to the species names.
The overall base composition results are presented in Supplementary Table S4. A slight AT bias (50.2–51.5%) was revealed in the complete mitogenomes, especially in the CR, which had the highest A+T content (56.9–62.5%). GC skews were consistently negative in the complete mitogenomes, 13 PCGs, 22 tRNAs, two rRNAs, CRs and the three codon positions of the 13 PCGs. Only the second codon position displayed negative AT skew results, whereas the others showed positive results (Supplementary Figure S1).
3.2 Protein-coding genes
The total length of the protein-coding genes (PCGs) in the eight species ranged from 11,340–11,475 bp, with the A+T content ranging from 48.8–50.7% (Supplementary Table S5). The lengths of the individual PCGs ranged from 168 (ATP8) to 1,845 bp (ND5).
The start codons in the 13 PCGs included AUG, AUC, AUA, and GUG. AUA is specifically utilized as a start codon in the ATP6 gene of P. multifasciatus. The AUC start codon, on the other hand, is exclusive to the COI and ATP6 genes of P. barberinoides. The COI gene in seven species (excluding P. barberinoides); the ND2 genes of P. multifasciatus, P. biaculeatus, P. cyclostomus, P. barberinus, and P. crassilabris; and the ATP6 gene of P. heptacanthus employed GUG as their start codon. UAN (where N=U or G), UGU, UA-, and U– were the identified stop codons, with UGU and UA- appearing least frequently.
Of the 22 amino acids, tRNA-Leu2 was most frequent and tRNA-Cys was the least (Supplementary Figure S2). Additionally, relative synonymous codon usage (RSCU) analysis indicated that tRNA-Ser2 (UCC), tRNA-Ala (GCC), and tRNA-Pro (CCC) were most frequent, whereas tRNA-Leu2 (UUG) was least frequent (Supplementary Figure S3).
In selective pressure analysis (Supplementary Figure S4), all 13 PCGs showed Ka/Ks values below 1.0, suggesting that they evolved under purifying selection in the eight species. ATP8 (0.2048) had the highest substitution rate, making it the most rapidly evolving gene, whereas COI (0.0145) evolved the slowest. Correspondingly, ATP8 exhibited the highest nucleotide diversity, while COI had the lowest.
3.3 rRNA and tRNA genes
The H-strand transcribes 12S rRNA and 16S rRNA located between tRNA-Phe and tRNA-Leu2, with tRNA-Val separating them. The length of 12S rRNA ranged from 952 (P. chrysopleuron) to 960 bp (P. barberinoides), whereas the length of 16S rRNA ranged from 1,665 (P. chrysopleuron) to 1,676 bp (P. multifasciatus). The combined length of the entire rRNA sequence ranged from 2,617 (P. chrysopleuron) to 2,632 bp (in P. barberinoides).
Each mitogenome sequence contained 22 tRNAs in scattered locations. In P. chrysopleuron, a tRNA-Met pseudogene (ψM) was identified between the tRNA genes for I and F. This pseudogene not only exhibited similarity to sequential tRNA-Met but also possessed a cloverleaf structure. Sun and Xu (2020) considered this to be a normal and functional M gene (GenBank No.: NC029247) (Figure 2). However, Mabuchi et al. (2004) posited that this unique gene sequence belonged to the pseudogenes and lacked function. Through comparison of the M gene across all species (Supplementary Figure S5), we discovered that the ψM sequenced were distinctly different from those of the normal gene sequences. Therefore, we believe that the superfluous M gene is a pseudogene. The predicted secondary structures of all tRNAs in the eight species showed a the typical cloverleaf structure, except for tRNA-Ser1, which lacked the dihydrouridine arm observed in the other teleosts (Supplementary Figure S6).
3.4 Control region
The control region (CR), also known as the D-loop region (Supplementary Figure S7), is typically located between P and F, although in some species, it can be found in other specific locations (Gong et al., 2020; Wang et al., 2020). The differences in the CR lengths among the eight species were minimal, ranging from 817 –938 bp. However, the lengths of the tandem repeats within the CR showed considerable variability, ranging from 20–183 bp. P. chrysopleuron had a single type of tandem repeat with the shortest length of 20 bp, whereas P. barberinoides and P. cyclostomus had five types of tandem repeats with lengths of 110 and 183 bp, respectively. The remaining species had two to four tandem repeats, each exceeding 57 bp in length.
3.5 Phylogenetic tree
Phylogenetic tree analysis (Figure 3) of the benthic-associated fish lineage in the order Syngnathiformes revealed a close relationship with strong branch node support, indicating sister group status between the families Mullidae and Dactylopteridae. Mullidae (Figure 2) was divided into two major branches: one branch exclusively comprises the genus Upeneus, while the other encompasses the genera Mulloidichthys, Mullus, and Parupeneus. In the second major branch, Mulloidichthys was located at the outermost edge, followed by Mullus, and Parupeneus. Within the genus Upeneus, a clear subdivision into two subgroups is evident. Clade U1 included U. sulphureus, whereas Clade U2 comprised U. japonicus and U. tragula. In Parupeneus, P. heptacanthus occupied the outermost position and formed the distinct Clade P1. P. barberinus and P. indicus constituted Clade P2, which was sister to the remaining species. Additionally, P. barberinoides branches out independently in Clade P3. Clade P4 consisted of P. cyclostomus and P. chrysopleuron as sister taxa. P. biaculeatus was isolated in Clade P5, whereas P. crassilabris and P. multifasciatus formed a sister clade known as Clade P6. Clades P5 and P6 are sisters to each other, and together, they are sisters to Clade P4. These clades are nested within the innermost positions of the entire phylogenetic tree. In addition, the SH-aLRT support, ultrafast bootstrap support, and posterior probability values for each branch node were relatively high.
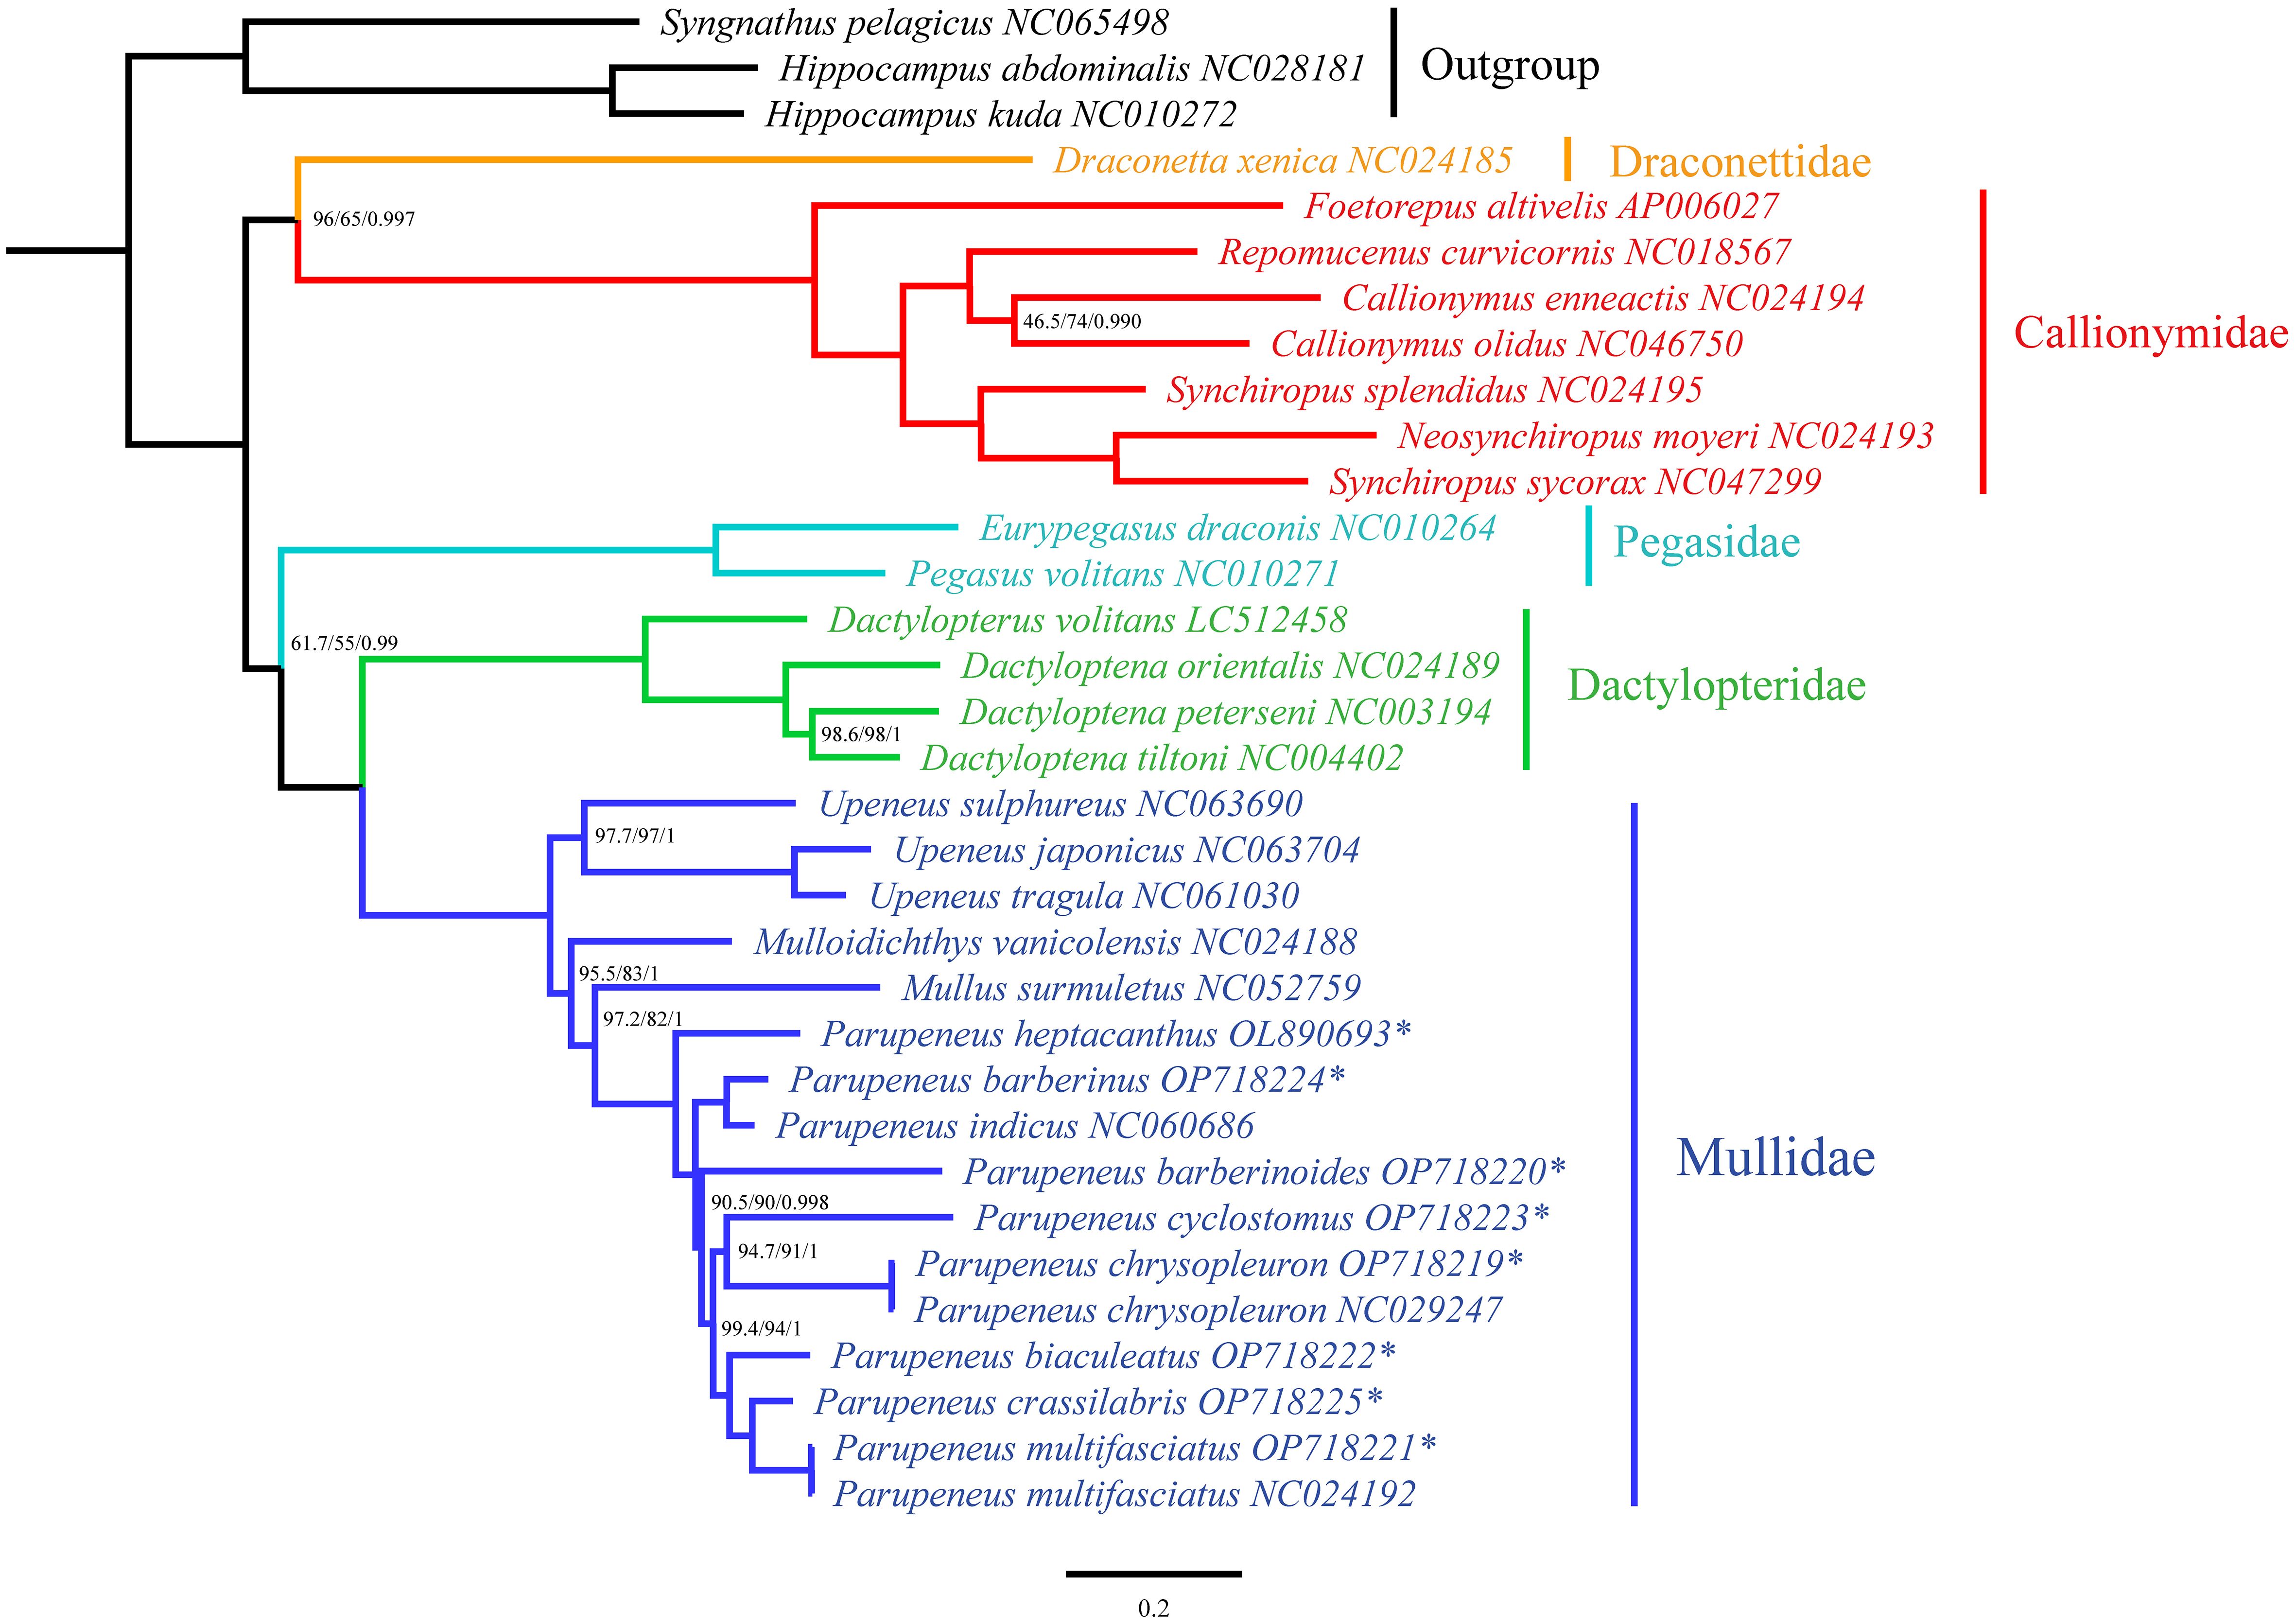
Figure 3 Phylogenetic tree of benthic associated fish lineage in Syngnathiformes. Numbers in node are SH-aLRT support (%) / ultrafast bootstrap support (%) / posterior probability. Without number in node means 100/100/1. The pattern of (*) means sequence in this study.
4 Discussion
4.1 Mitogenomic structural analysis
In general, the mitogenomes of fish species range from 15–20 kb in length (Boore, 1999), with variations among species primarily attributed to differences in the lengths of CRs and the presence of non-coding regions or pseudogenes (Mabuchi et al., 2004; Gong et al., 2020; Xu et al., 2021). In this study, the complete mitogenomes of the eight Parupeneus species ranged from 16,570–17,402 bp in length. The P. chrysopleuron mitogenome was 625–832 bp longer than the others; however, the CRs were similar in length. We found that the non-coding region (excluding the CR) in P. chrysopleuron was 979 bp, which was more than four times longer than those in the other species (61–243 bp). A comparative analysis with the other species showed that the structure of the P. chrysopleuron mitogenome was abnormal. This anomaly is likely related to the duplication/random loss model (TDRL), as such abnormalities often accompany an increase in non-coding regions or the duplication of certain genes, resulting in an elongated mitogenome (Bernt et al., 2013). Furthermore, the mitogenomes of P. cyclostomus and P. heptacanthus were 142–207 bp longer than those of P. multifasciatus, P. biaculeatus, P. barberinus, P. barberinoides, and P. crassilabris. We also found that P. cyclostomus and P. heptacanthus contained an additional non-coding segment between tRNA-Lys and COII. Similar instances of an additional non-coding segment have also been observed in other fish species, and this additional non-coding segment is considered one of the key distinguishing features of species (Zhong et al., 2021).
Understanding the implications of mitochondrial gene mutations, particularly those leading to translational extension or termination, is pivotal to understanding the functional dynamics of mitochondrial DNA (mtDNA). Jiang et al. (2020) underscored the significant impact of mutations leading to the premature termination of codons on mitochondrial functionality, highlighting the necessity of a balanced mitochondrial translation process for cellular integrity. Such minor disruptions can profoundly affect mitochondrial and overall cellular health. Ronayne et al. (2023) investigated how inhibition of mitochondrial ribosome elongation in cells with disease-causing mutations emphasized the importance of precise translational mechanisms for mitochondrial health and cellular survival. These studies highlight the essential role of accurate translation in the maintenance of mitochondrial functional integrity, particularly in the context of genetic mutations. In our study, the COI gene lengths for P. barberinoides, P. cyclostomus, and P. heptacanthus were observed to be 1,560, 1,578, and 1,557 bp respectively, deviating from the typical 1,551 bp length seen in other goatfishes. Notably, sequence inspection revealed abnormalities in the termination codon positions at the 3’ end of the COI gene in P. cyclostomus, where the usual TAA codon was altered to CAA, resulting in translation elongation (Supplementary Figure S8A). Similarly, the COI gene in P. heptacanthus exhibited additional VQ proteins at its 3’ end compared to those in other Parupeneus species (Supplementary Figure S8C), suggesting an extension attributed to mitochondrial genome replication events. In P. barberinoides, a distinctive mutation at the 5’ end of the COI gene was identified, where the start codon GTG was replaced with TTG (Supplementary Figures S8B, D), a significant departure from the norm observed in other species within the genus. We hypothesized that this phenomenon may be attributable to mutations arising during mitochondrial replication, given that the COI gene is widely regarded as highly conserved. These mutations, which lead to variations in the start or termination codons, ultimately result in extended translation. The observed abnormalities suggest alterations in the translation process, which could have significant implications for mitochondrial function and, consequently, cellular energy metabolism (Wang et al., 2021). Although the complex variations observed in COI gene lengths and the presence of additional non-coding segments among different Parupeneus species may be attributed to mitogenomic replication events, the impact of such variations, potentially arising from mutations, on goatfish remains unknown.
4.2 Phylogenetic analyses and mitogenomic variants
Recent phylogenetic studies have shown that Mullidae is closest to Callionymoidei (Longo et al., 2017; Santaquiteria et al., 2021; Nash et al., 2022). However, our results indicate that Mullidae is a sister to the family Dactylopteridae, supported by 100% confidence coefficient and high posterior probability (Figure 3). Such differences may be due to differences in the molecular markers and methods used to process the molecular data, as well as differences in taxonomic sampling. The relationships among goatfish in this study (Figure 2) corroborate findings from previous studies (Nash et al., 2022), despite the use of different molecular datasets. The phylogenetic tree derived from our mitogenomic dataset clearly separated U. sulphureus from the clade comprising U. japonicus and U. tragula into distinct groups. Similarly, a study employing a UCE dataset by Nash et al. (2022) classified the genus Upeneus into two categories: Upeneus 1, which includes U. sulphureus, and Upeneus 2, encompassing U. japonicus and U. tragula. Although the methodologies vary, both approaches consistently support the bifurcation of Upeneus into two distinct groups. In addition, the results are shown in terms of morphology (Kim, 2002). For the genus Parupeneus, our results indicated that P. barberinus and P. indicus, P. cyclostomus and P. chrysopleuron, and P. crassilabris and P. multifasciatus, form sister clades. This is consistent with the findings of Nash et al. (2022), despite the absence of intermediate samples between P. crassilabris and P. multifasciatus in our study. However, a discrepancy was observed within this clade. In the present study, P. heptacanthus was the outermost branch of all species, P. barberinoides was embedded inside, and there was also a very short branch, whereas Nash et al. (2022) placed P. barberinoides in the outermost location and P. heptacanthus inside. P. biaculeatus, a previously unexplored species, has an intermediate phylogenetic position, linking two distinct clades: one constituted by P. cyclostomus and P. chrysopleuron and the other by P. crassilabris and P. multifasciatus. Notably, it exhibits a sister relationship with a clade that includes P. crassilabris and P. multifasciatus.
Previous studies have shown that goatfish originated in the Western Atlantic from the Tethys Sea (Santaquiteria et al., 2021) and have indicated a significant change in the accumulation rate of goatfish lineages from the late Miocene to early Pliocene (Betancur et al., 2017; Santaquiteria et al., 2021; Nash et al., 2022). This diversity rate variation was hypothesized to be closely related to paleogeographic, climatic, and sea-level changes during the Miocene–Pliocene transition. At the end of the Miocene, the separation of the Arabian Plate from the African Plate enhanced the exchange of fish species between the Indian and Western Pacific regions (Briggs, 1995; Corrigan and Beheregaray, 2009). Moreover, significant geological changes alter fish habitats, affecting their dispersal capabilities and subsequent diversification (Briggs, 1995; Bromfield and Pandolfi, 2011; Nash et al., 2022). Mitogenomic structural abnormalities in the family Mullidae seem to be linked to their evolutionary history. Species with structural abnormalities include P. barberinoides, which has an aberrant COI gene; P. cyclostomus and P. heptacanthus, both of which have aberrant COI genes and a non-coding region between COII and tRNA-Lys; and P. chrysopleuron, which exhibits a significant mitochondrial gene rearrangement. These species all display long, independent branches in the phylogenetic tree topology of the family Mullidae, and to date, no further diversification has been observed (Figure 2; similar to Nash et al., 2022, except for P. heptacanthus). The species began to diversify during the Late Miocene to Early Pliocene, except for P. heptacanthus, which diverged from a recent common ancestor with P. procerigena in the Middle Pleistocene (Nash et al., 2022). Species with traditional mitogenomic orders or normal mitochondrial gene structures tend to diversify from a recent common ancestor into several other species. This indicates that historical geological events have influenced variations in the mitogenome structure, causing these species to occupy unique positions in the phylogenetic tree.
4.3 Possible gene rearrangement mechanism
In P. chrysopleuron, gene rearrangements involve both shuffling and transposition. Specifically, the I and Q genes underwent an exchange before being repositioned at the rear end of the CR. Our observations revealed that the mitochondrial gene arrangement in P. chrysopleuron resembles that in Cynoglossus melampetalus, as both species exhibit the same type of pseudogene and gene rearrangement within the IQM block, albeit with some notable differences. First, the CR of P. chrysopleuron is located in its normal position after P, similar to that of other species, which differs from that of C. melampetalus (Gong et al., 2020), whose CR is recognized downstream of ND1. Secondly, in P. chrysopleuron, there is a 119 bp non-coding gap (NR1) in front of the M gene. Between the Q and I genes, as well as between the I gene and the ψM pseudogene, there are long non-coding gaps of 334 (NR2) and 332 bp (NR3), respectively. Additionally, there is a 59 bp non-coding gap (NR4) following the ψM pseudogene in P. chrysopleuron. Third, the order and position of IQM are completely different in their mitogenomes.
Several models have been used to explain gene rearrangements, most prominently: (1) tandem duplication and random loss (TDRL), (2) intramitochondrial recombination, and (3) mitogenome dimerization and nonrandom loss (Bernt et al., 2013). Shuffling and transposition are widely associated with TDRL because they involve gene duplication and movement (Mabuchi et al., 2004; Papetti et al., 2021). Here, we refer to the TDRL model (Dowton et al., 2003) to explain the novel gene rearrangement of P. chrysopleuron (Figure 4). We assumed that the ancestral mitochondrial gene sequence was the traditional type (Figure 4A). Firstly, the first-time tandem duplicate occurred in the IQM block, forming the I0Q0ψM 0-I1Q1M1 block. The first M degenerated into ψM0, and the last M1 was left in the original location (Figure 4B). The I0 and Q1 were randomly lost to form the NR1, while other genes (marked by underlining) translocated behind the CR, forming a new block, CRQ0ψM0I1. This phase can be explained by intramolecular recombination (Poulton et al., 1993; Lunt and Hyman, 1997). Next, CRQ0ψM0I1 had been continuously duplicated twice, forming a CRQ0ψM0I1-CR1Q2ψM1I2-CR2Q3ψM2I3 tripolymer (Figures 4C, D). The three underlined gene blocks were degraded to NR2, NR3, and NR4, respectively (Figures 4D, E). Finally, the special gene rearrangement sequence observed in the P. chrysopleuron mitogenome formed.
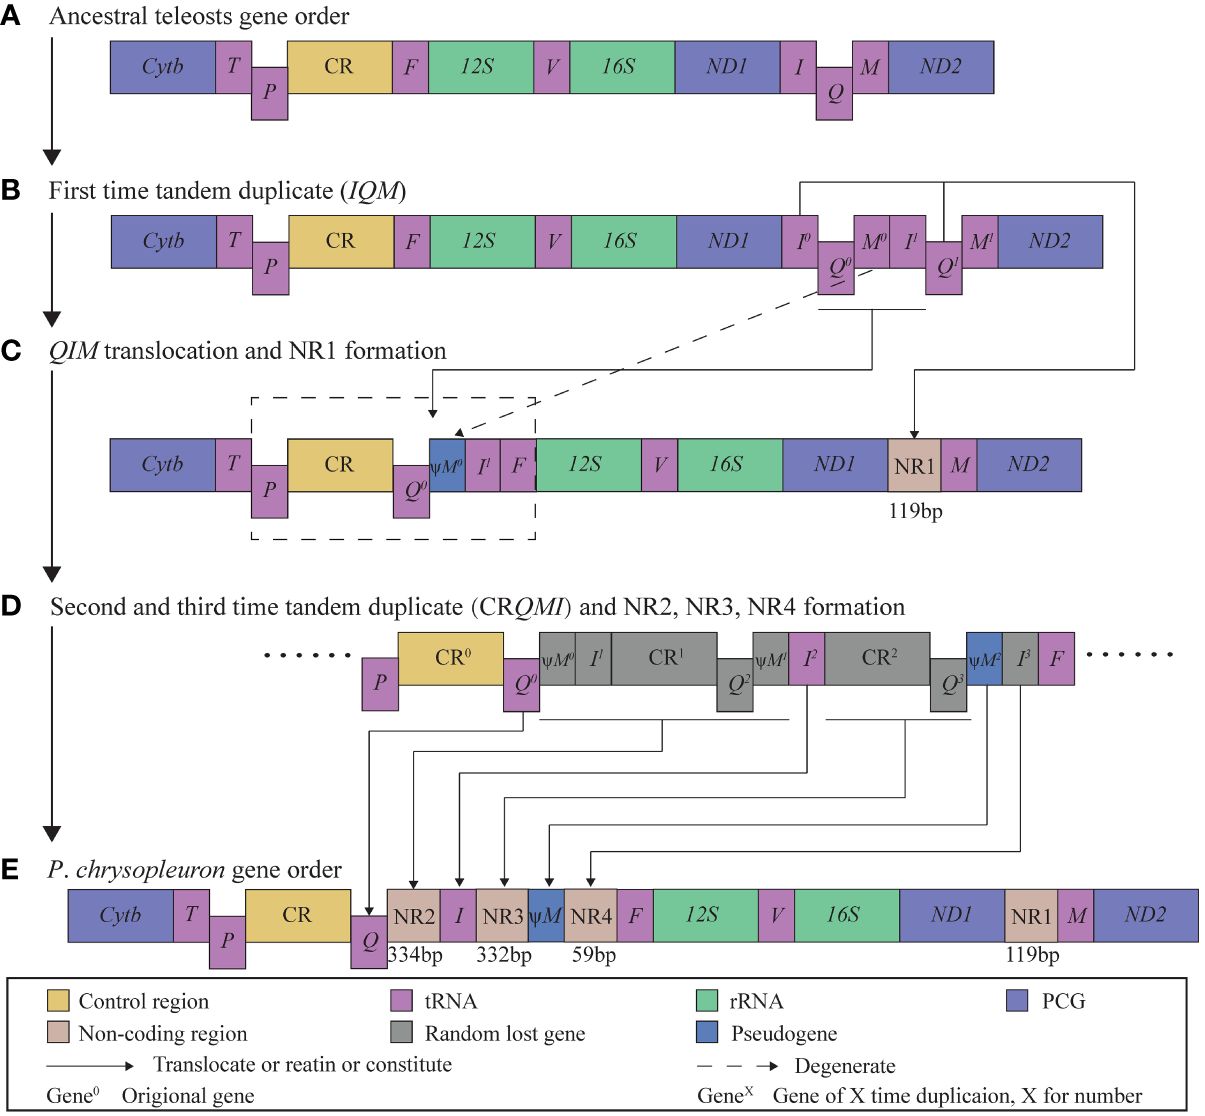
Figure 4 Inferred intermediate steps between the gene order of ancestral teleosts and the mitogenome of Parupeneus chrysopleuron. (A) Ancestral teleosts gene order. (B) First time tandem duplicate (IQM). (C) IQM translocation and NR1 formation. (D) Second and third time tandem duplicate (CRQMI) and NR2, NR3, NR4 formation. (E) P. chrysopleuron gene order.
4.4 Evidence for the TDRL model
The occurrence of TDRL models is often accompanied by the generation of pseudogenes and non-coding regions left behind due to random loss (Dowton et al., 2003). One pseudogene was found in the P. chrysopleuron mitogenome, and four NRs were discovered simultaneously. The NR1 (119 bp) gene was in the front of the normal M, while the others were located between Q and I (NR2), I and ψM (NR3), and ψM and F (NR4), which were 334, 332, and 59 bp, respectively. First, we considered that NR1 might be caused by CR degeneration, because in some cases, when CR is translocated after ND1 and then IQM, and duplicated together with IQM, the CR will also participate in random loss to form non-coding regions (Kong et al., 2009; Wang et al., 2020). However, there were no large blocks of continuously paired bases in the CR and NR1 alignments (Figure 5A). We further hypothesized that NR1 might be affected by IQM duplication/random loss. First, IQM replicates to form the I0Q0M0-I1Q1M1 block, Q0M0-I1 should translocate to the front of the CR for second- and third-time tandem duplicates, whereas M1 remains in its original position; therefore, only the I0Q1 block experiences random loss to form NR1. We aligned I0Q1 to NR1, and there were two highly continuous matching bases in Q, meaning that for the random bases that were lost, a large part of the Q base was retained. This provided evidence of the remains of I0Q1 after random loss (Figure 5B); therefore, we believe that NR1 comes from IQ. NR2 and NR3 were of almost the same length (334 and 332 bp, respectively). Thus, we believe they are also from the CR. The alignments of NR2 and NR3 to the CR showed high continuity of the same base parts, and both parts of the locations in the two non-coding regions were surprisingly similar (Figures 5C, D) and were located at the rear end of the CR region.
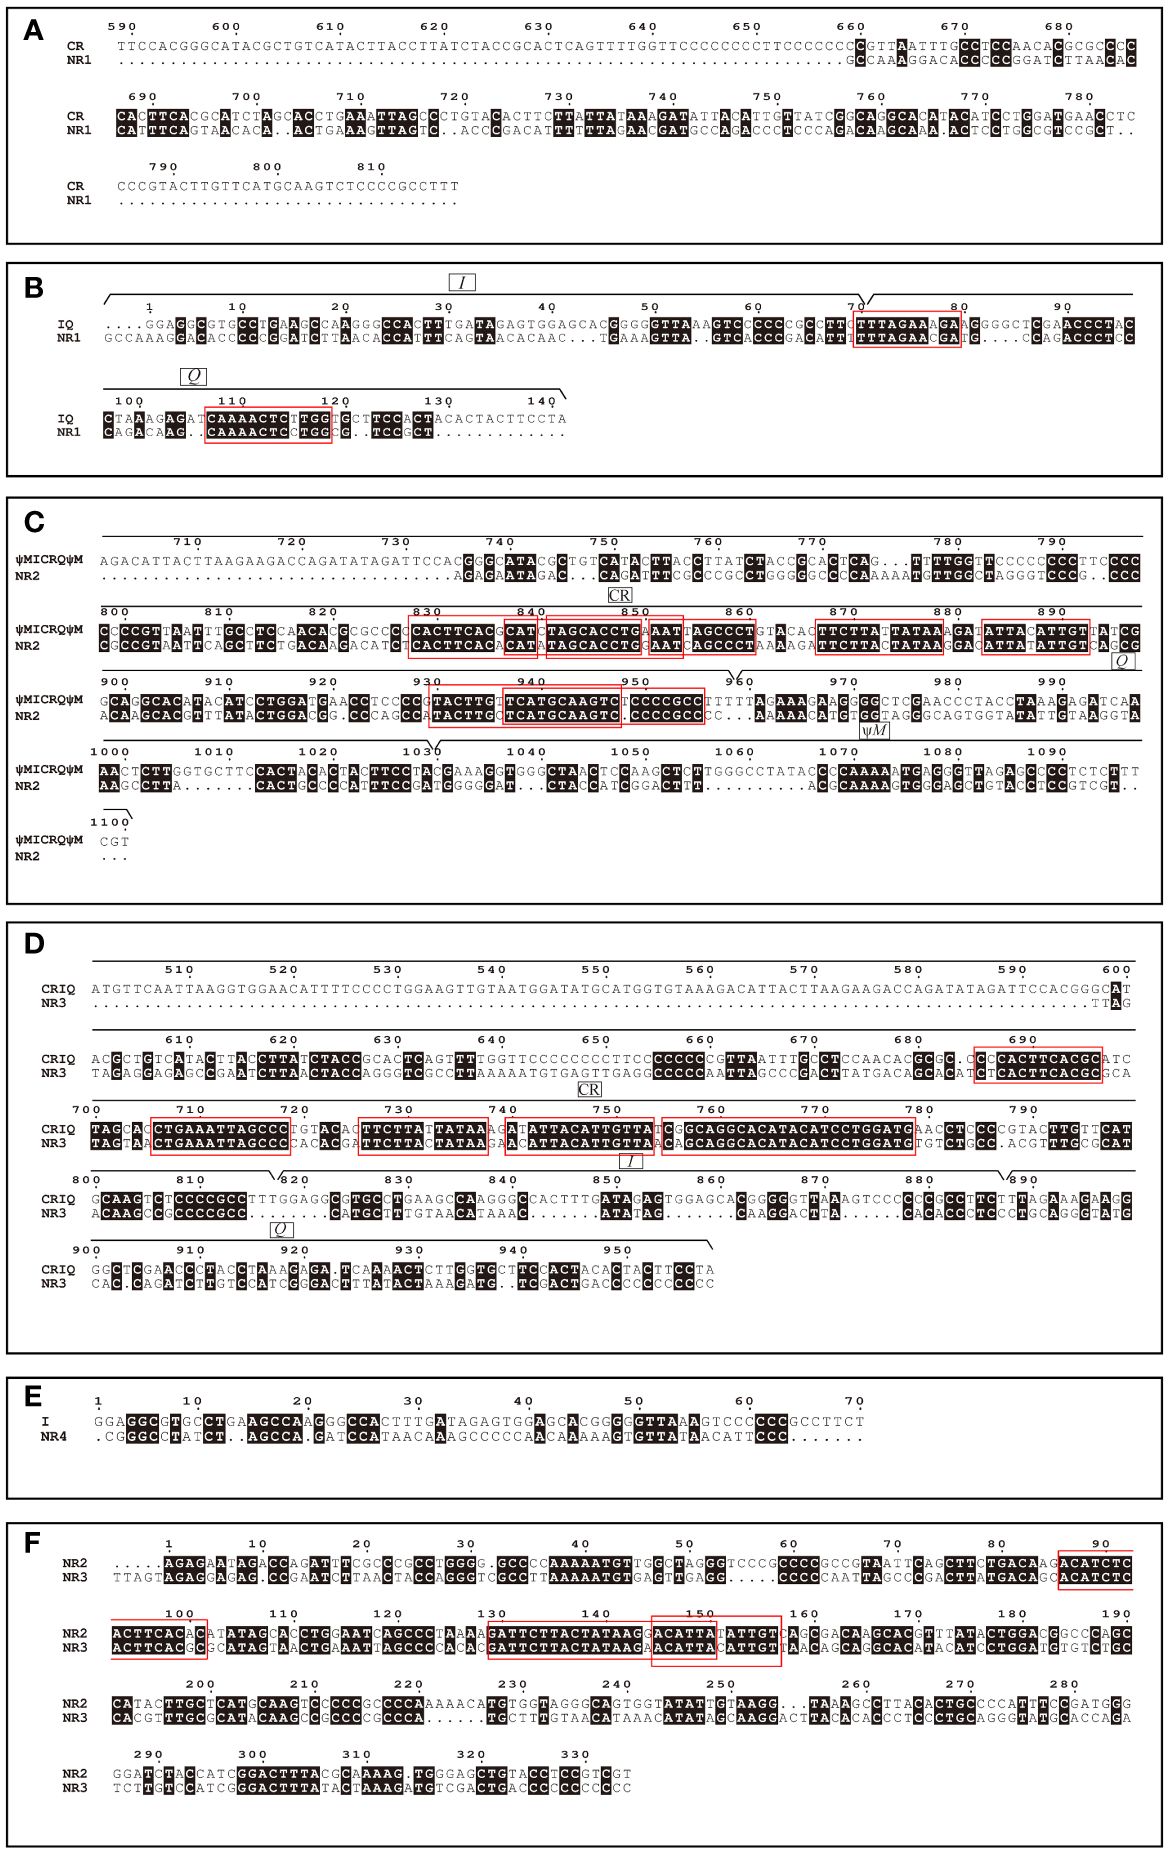
Figure 5 Sequence alignment of CR and NR1 (A); IQ and NR1 (B); ψMICRQψM and NR2 (C); CRIQ and NR3 (D); I and NR4 (E); NR2 and NR3 (F). The dots (.) indicate alignment gaps. The black filled areas indicate nucleotide identity with each other. The red boxes indicate regions of highly continuous matching bases.
An explanation of why we did not directly align the CR region with NR2 and NR3 is warranted. During the replication process, not only does the CR region undergo duplication, but other adjacent genes are also duplicated simultaneously. These genes may also contribute to NR formation. If we aligned the CR region directly with NR2 and NR3 separately, we would have overlooked the influence of these other genes. The above evidence showed that most bases in the NR2 and NR3 regions were derived from the remainder of the CR random loss (Figures 5C, D). Furthermore, the alignment of NR2 and NR3 revealed several highly continuous regions with the same bases (Figure 5F). This segment may have a special significance or function in this species, such that the two non-coding regions are located at almost the same position in the CR. This directly substantiates the occurrence of the two duplications in the CR region. We infer that NR4 is related to the I gene, but the degree of matching with the I gene was relatively low, probably owing to its high mutation rate during replication (Figure 5E). In general, the sources of evidence for NR1, NR2, and NR3 are sufficient.
5 Conclusion
This study assembled the mitogenomes of eight species within the genus Parupeneus and published mitogenomic data of five of the species for the first time. Phylogenetic analysis indicated a close relationship between the families Mullidae and Dactylopteridae. The connection between mitogenome structures and phylogenetic trees suggests that mitogenomic structures are associated with historical geographical events, indicating that goatfish are ideal subjects for examining variations in mitogenomic structures and exploring the underlying factors that drive evolutionary radiation. Although this study has made progress in studying mitogenomic data and phylogenetic relationships within Mullidae, there is a relative lack of such data for the family, and the phylogenetic relationships between genera and species have not yet been fully clarified. Further research involving additional mitochondrial data from goatfish is necessary to explore mitochondrial structural variations.
Data availability statement
The datasets presented in this study can be found in online repositories. The names of the repository/repositories and accession number(s) can be found here: NCBI GenBank (https://www.ncbi.nlm.nih.gov/genbank/), accession numbers: OP718219-OP718225 and OL890693.
Ethics statement
Ethical approval was not required for the study involving animals in accordance with the local legislation and institutional requirements because Ethical review and approval were not required for the animal study. Because in this study, all species were not protected species listed in the CITES. No ethics declaration was required for this study because no experiment was conducted on live individuals. The samples were obtained from fish markets. Moreover, the fresh individuals from fish market were already dead.
Author contributions
ZL: Formal analysis, Investigation, Resources, Software, Visualization, Writing – original draft. MY: Conceptualization, Methodology, Supervision, Writing – review & editing. XY: Data curation, Resources, Writing – review & editing. HW: Data curation, Resources, Writing – review & editing. CJ: Data curation, Resources, Writing – review & editing. XH: Conceptualization, Project administration, Supervision, Validation, Writing – review & editing. HL: Conceptualization, Methodology, Supervision, Writing – review & editing. YY: Conceptualization, Funding acquisition, Project administration, Supervision, Validation, Writing – review & editing.
Funding
The author(s) declare financial support was received for the research, authorship, and/or publication of this article. This research study was funded by National Natural Science Foundation of China (U20A2087), Response mechanism of structure and function evolution of fishery resources to fishing and environmental stress in Beibu Gulf
Acknowledgments
We extend our heartfelt gratitude to Professor Li Gong from Zhejiang Ocean University, Dr. Qi Liu from School of Geographical Sciences of Lingnan Normal University and Dr. Chunxu Zhao from Southern Marine Science and Engineering Guangdong Laboratory (Zhanjiang) in China for their invaluable insights and contributions.
Conflict of interest
The authors declare that the research was conducted in the absence of any commercial or financial relationships that could be construed as a potential conflict of interest.
Publisher’s note
All claims expressed in this article are solely those of the authors and do not necessarily represent those of their affiliated organizations, or those of the publisher, the editors and the reviewers. Any product that may be evaluated in this article, or claim that may be made by its manufacturer, is not guaranteed or endorsed by the publisher.
Supplementary material
The Supplementary Material for this article can be found online at: https://www.frontiersin.org/articles/10.3389/fmars.2024.1395579/full#supplementary-material
References
Anderson S., Bankier A. T., Barrell B. G., de Bruijn M. H. L., Coulson A. R., Drouin J., et al. (1981). Sequence and organization of the human mitochondrial genome. Nature. 290, 457–465. doi: 10.1038/290457a0
Bernt M., Braband A., Schierwater B., Stadler P. F. (2013). Genetic aspects of mitochondrial genome evolution. Mol. Phylogenet. Evol. 69, 328–338. doi: 10.1016/j.ympev.2012.10.020
Betancur R. R., Wiley E. O., Arratia G., Acero A., Bailly N., Miya M., et al. (2017). Phylogenetic classification of bony fishes. BMC Evol. Biol. 17, 1–40. doi: 10.1186/s12862-017-0958-3
Boore J. L. (1999). Animal mitochondrial genomes. Nucleic Acids Res. 27, 1767–1780. doi: 10.1093/nar/27.8.1767
Bromfield K., Pandolfi J. M. (2011). Regional patterns of evolutionary turnover in Neogene coral reefs from the central Indo-West Pacific Ocean. Evol. Ecol. 26, 375–391. doi: 10.1007/s10682-011-9483-9
Chan P. P., Lowe T. M. (2019). tRNAscan-SE: searching for tRNA genes in genomic sequences. Methods Mol. Biol. 1962, 1–14. doi: 10.1007/978–1-4939–9173-0_1
Corrigan S., Beheregaray L. B. (2009). A recent shark radiation: Molecular phylogeny, biogeography and speciation of wobbegong sharks (family: Orectolobidae). Mol. Phylogenet. Evol. 52, 205–216. doi: 10.1016/j.ympev.2009.03.007
Couvreur T. L., Franzke A., Al-Shehbaz I. A., Bakker F. T., Koch M. A., Mummenhoff K. (2010). Molecular phylogenetics, temporal diversification, and principles of evolution in the mustard family (Brassicaceae). Mol. Biol. Evol. 27, 55–71. doi: 10.1093/molbev/msp202
Dettai A., Lecointre G. (2005). Further support for the clades obtained by multiple molecular phylogenies in the acanthomorph bush. C. R. Biol. 328, 674–689. doi: 10.1016/j.crvi.2005.04.002
Donath A., Juhling F., Al-Arab M., Bernhart S. H., Reinhardt F., Stadler P. F., et al. (2019). Improved annotation of protein-coding genes boundaries in metazoan mitochondrial genomes. Nucleic Acids Res. 47, 10543–10552. doi: 10.1093/nar/gkz833
Dowton M., Castro L. R., Campbell S. L., Bargon S. D., Austin A. D. (2003). Frequent mitochondrial gene rearrangements at the hymenopteran nad3-nad5 junction. J. Mol. Evol. 56, 517–526. doi: 10.1007/s00239-002-2420-3
Fricke R., Eschmeyer W. N., van der Laan R. (2024) Eschmeyer’s catalog of fishes: genera, species, references. Available online at: https://www.calacademy.org/scientists/projects/catalog-of-fishes (Accessed 2. February.2024).
Gong L., Lu X., Luo H., Zhang Y., Shi W., Liu L., et al. (2020). Novel gene rearrangement pattern in Cynoglossus melampetalus mitochondrial genome: new gene order in genus Cynoglossus (Pleuronectiformes: Cynoglossidae). Int. J. Biol. Macromol. 149, 1232–1240. doi: 10.1016/j.ijbiomac.2020.02.017
Grant J. R., Stothard P. (2008). The CGView Server: a comparative genomics tool for circular genomes. Nucleic Acids Res. 36, W181–W184. doi: 10.1093/nar/gkn179
Gu S., Yan Y. R., Yi M. R., Luo Z. S., Wen H., Jiang C. P., et al. (2022). Genetic pattern and demographic history of cutlassfish (Trichiurus nanhaiensis) in South China Sea by the influence of Pleistocene climatic oscillations. Sci. Rep. 12, 14716. doi: 10.1038/s41598–022-18861-x
Guindon S., Dufayard J. F., Lefort V., Anisimova M., Hordijk W., Gascuel O. (2010). New algorithms and methods to estimate maximum-likelihood phylogenies: assessing the performance of PhyML 3.0. Syst. Biol. 59, 307–321. doi: 10.1093/sysbio/syq010
Haring E., Kruckenhauser L., Gamauf A., Riesing M. J., Pinsker W. (2001). The complete sequence of the mitochondrial genome of Buteo buteo (Aves, Accipitridae) indicates an early split in the phylogeny of raptors. Mol. Biol. Evol. 18, 1892–1904. doi: 10.1093/oxfordjournals.molbev.a003730
He X., Luo Z., Yi M., Yan Y. (2022). Characterization of the mitochondrial genome of Parupeneus indicus (Perciformes, Mullidae). Mitochondrial DNA B 7, 859–860. doi: 10.1080/23802359.2022.2075287
Inoue J. G., Miya M., Tsukamoto K., Nishida M. (2003). Evolution of the deep-sea gulper eel mitochondrial genomes: large-scale gene rearrangements originated within the eels. Mol. Biol. Evol. 20, 1917–1924. doi: 10.1093/molbev/msg206
Jiang H., Pederson S. M., Newman M., Dong Y., Barthelson K., Lardelli M. (2020). Transcriptome analysis indicates dominant effects on ribosome and mitochondrial function of a premature termination codon mutation in the zebrafish gene psen2. PloS One 15, e0232559. doi: 10.1371/journal.pone.0232559
Kalyaanamoorthy S., Minh B. Q., Wong T. K. F., von Haeseler A., Jermiin L. S. (2017). ModelFinder: fast model selection for accurate phylogenetic estimates. Nat. Methods 14, 587–589. doi: 10.1038/nmeth.4285
Katoh K., Standley D. M. (2013). MAFFT multiple sequence alignment software version 7: improvements in performance and usability. Mol. Biol. Evol. 30, 772–780. doi: 10.1093/molbev/mst010
Kawahara R., Miya M., Mabuchi K., Lavoue S., Inoue J. G., Satoh T. P., et al. (2008). Interrelationships of the 11 gasterosteiform families (sticklebacks, pipefishes, and their relatives): a new perspective based on whole mitogenome sequences from 75 higher teleosts. Mol. Phylogenet. Evol. 46, 224–236. doi: 10.1016/j.ympev.2007.07.009
Kim B. J. (2002). Comparative anatomy and phylogeny of the family Mullidae (Teleostei: Perciformes). Memoirs Graduate School Fisheries Sciences Hokkaido Univ. 49, 1–74.
Kong X. Y., Dong X. L., Zhang Y. C., Shi W., Wang Z. M., Yu Z. N. (2009). A novel rearrangement in the mitochondrial genome of tongue sole, Cynoglossus semilaevis: control region translocation and a tRNA gene inversion. Genome 52, 975–984. doi: 10.1139/G09-069
Laslett D., Canback B. (2008). ARWEN: a program to detect tRNA genes in metazoan mitochondrial nucleotide sequences. Bioinformatics 24, 172–175. doi: 10.1093/bioinformatics/btm573
Lim H. C., Habib A., Chen W. J. (2021). Comparative phylogeography and phylogeny of pennah croakers (Teleostei: Sciaenidae) in Southeast Asian waters. Genes 12, 1926. doi: 10.3390/genes12121926
Liu Y., Wang Y., Yin J., Li D., Tang S., Gu X., et al. (2021). The complete mitochondrial genome of Callionymus olidus (Perciformes Callionymidae). Mitochondrial DNA B. 6, 154–155. doi: 10.1080/23802359.2020.1745098
Longo S. J., Faircloth B. C., Meyer A., Westneat M. W., Alfaro M. E., Wainwright P. C. (2017). Phylogenomic analysis of a rapid radiation of misfit fishes (Syngnathiformes) using ultraconserved elements. Mol. Phylogenet. Evol. 113, 33–48. doi: 10.1016/j.ympev.2017.05.002
Lowe T. M., Chan P. P. (2016). tRNAscan-SE On-line: integrating search and context for analysis of transfer RNA genes. Nucleic Acids Res. 44, W54–W57. doi: 10.1093/nar/gkw413
Lunt D. H., Hyman B. C. (1997). Animal mitochondrial DNA recombination. Nature 387, 247. doi: 10.1038/387247a0
Luo H., Kong X., Chen S., Shi W. (2019). Mechanisms of gene rearrangement in 13 bothids based on comparison with a newly completed mitogenome of the threespot flounder, Grammatobothus polyophthalmus (Pleuronectiformes: Bothidae). BMC Genomics 20, 792. doi: 10.1186/s12864-019-6128-9
Mabuchi K., Miya M., Satoh T. P., Westneat M. W., Nishida M. (2004). Gene rearrangements and evolution of tRNA pseudogenes in the mitochondrial genome of the parrotfish (Teleostei: Perciformes: Scaridae). J. Mol. Evol. 59, 287–297. doi: 10.1007/s00239-004-2621-z
Martin M. (2011). Cutadapt removes adapter sequences from high-throughput sequencing reads. EMBnet J. 17, 10–12. doi: 10.14806/ej.17.1.200
Minh B. Q., Nguyen M. A., von Haeseler A. (2013). Ultrafast approximation for phylogenetic bootstrap. Mol. Biol. Evol. 30, 1188–1195. doi: 10.1093/molbev/mst024
Miya M., Kawaguchi A., Nishida M. (2001). Mitogenomic exploration of higher teleostean phylogenies: a case study for moderate-scale evolutionary genomics with 38 newly determined complete mitochondrial DNA sequences. Mol. Biol. Evol. 18, 1993–2009. doi: 10.1093/oxfordjournals.molbev.a003741
Miya M., Nishida M. (1999). Organization of the mitochondrial genome of a deep-sea fish, Gonostoma gracile (Teleostei: Stomiiformes): first example of transfer RNA gene rearrangements in bony fishes. Mar. Biotechnol. 1, 416–426. doi: 10.1007/PL00011798
Miya M., Takeshima H., Endo H., Ishiguro N. B., Inoue J. G., Mukai T., et al. (2003). Major patterns of higher teleostean phylogenies: a new perspective based on 100 complete mitochondrial DNA sequences. Mol. Phylogenet. Evol. 26, 121–138. doi: 10.1016/S1055-7903(02)00332-9
Nash C. M., Lungstrom L. L., Hughes L. C., Westneat M. W. (2022). Phylogenomics and body shape morphometrics reveal recent diversification in the goatfishes (Syngnatharia: Mullidae). Mol. Phylogenet. Evol. 177, 107616. doi: 10.1016/j.ympev.2022.107616
Nguyen L. T., Schmidt H. A., von Haeseler A., Minh B. Q. (2015). IQ-TREE: a fast and effective stochastic algorithm for estimating maximum-likelihood phylogenies. Mol. Biol. Evol. 32, 268–274. doi: 10.1093/molbev/msu300
Papetti C., Babbucci M., Dettai A., Basso A., Lucassen M., Harms L., et al. (2021). Not frozen in the ice: large and dynamic rearrangements in the mitochondrial genomes of the Antarctic fish. Genome Biol. Evol. 13. doi: 10.1093/gbe/evab017
Poulton J., Deadman M. E., Bindoff L., Morten K., Land J., Brown G. (1993). Families of mtDNA rearrangements can be detected in patients with mtDNA deletions: duplications may be a transient intermediate form. Hum. Mol. Genet. 2, 23–30. doi: 10.1093/hmg/2.1.23
Randall J. E. (2004). Revision of the goatfish genus Parupeneus (Perciformes: Mullidae) with descriptions of two new species (Hawaii: Bishop Museum).
Ranwez V., Douzery E. J. P., Cambon C., Chantret N., Delsuc F. (2018). MACSE v2: toolkit for the alignment of coding sequences accounting for frameshifts and stop codons. Mol. Biol. Evol. 35, 2582–2584. doi: 10.1093/molbev/msy159
Robert X., Gouet P. (2014). Deciphering key features in protein structures with the new ENDscript server. Nucleic Acids Res. 42, W320–W324. doi: 10.1093/nar/gku316
Ronayne C. T., Bennett C. F., Perry E. A., Kantorovich N., Puigserver P. (2023). Tetracycline-dependent inhibition of mitoribosome protein elongation in mitochondrial disease mutant cells suppresses IRE1α to promote cell survival. BioRxiv. doi: 10.1101/2023.03.09.531795
Ronquist F., Teslenko M., van der Mark P., Ayres D. L., Darling A., Hohna S., et al. (2012). MrBayes 3.2: efficient Bayesian phylogenetic inference and model choice across a large model space. Syst. Biol. 61, 539–542. doi: 10.1093/sysbio/sys029
Rozas J., Ferrer-Mata A., Sánchez-DelBarrio J. C., Guirao-Rico S., Librado P., Ramos-Onsins S. E., et al. (2017). DnaSP 6: DNA sequence polymorphism analysis of large data sets. Mol. Biol. Evol. 34, 3299–3302. doi: 10.1093/molbev/msx248
Santaquiteria A., Siqueira A. C., Duarte-Ribeiro E., Carnevale G., White W. T., Pogonoski J. J., et al. (2021). Phylogenomics and historical biogeography of seahorses, dragonets, goatfishes, and allies (Teleostei: Syngnatharia): assessing factors driving uncertainty in biogeographic inferences. Syst. Biol. 70, 1145–1162. doi: 10.1093/sysbio/syab028
Satoh T. P., Miya M., Mabuchi K., Nishida M. (2016). Structure and variation of the mitochondrial genome of fishes. BMC Genomics 17, 719. doi: 10.1186/s12864-016-3054-y
Schultz L. P., Chapman W. M., Lachner E. A., Woods L. P. (1960). “Family mullidae,” in Fishes of the Marshall and Marianas Islands, vol. 2 . Ed. Lachner E. A. (Bulletin of the United States National Museum, Washington), 1–36.
Shaffer H. B., McKnight M. L. (1996). The polytypic species revisited: genetic differentiation and molecular phylogenetics of the tiger salamander Ambystoma tigrinum (Amphibia: Caudata) complex. Evolution 50, 417–433. doi: 10.2307/2410811
Song H. Y., Hyun Y. S., Jo S., Jung S. H., Hwang H. J., Kim S. Y., et al. (2017). Complete mitochondrial genome of Parupeneus barberinus (Perciformes, Mullidae): mitogenome characterization and phylogenetic analysis. Mitochondrial DNA B 2, 785–786. doi: 10.1080/23802359.2017.1398613
Song H. Y., Mabuchi K., Satoh T. P., Moore J. A., Yamanoue Y., Miya M., et al. (2014). Mitogenomic circumscription of a novel percomorph fish clade mainly comprising “Syngnathoidei” (Teleostei). Gene 542, 146–155. doi: 10.1016/j.gene.2014.03.040
Song H. Y., Satoh T. P., Mabuchi K. (2012). Complete mitochondrial genome sequence of the dragonet Callionymus curvicornis (Perciformes: Callionymoidei: Callionymidae). Mitochondrial DNA 23, 290–292. doi: 10.3109/19401736.2012.674124
Sun Y., Xu T. (2020). Particular gene order and complete mitochondrial genome of Parupeneus chrysopleuron (Perciformes, Mullidae). Mitochondrial DNA B 5, 1537–1539. doi: 10.1080/23802359.2020.1742216
Talavera G., Castresana J. (2007). Improvement of phylogenies after removing divergent and ambiguously aligned blocks from protein sequence alignments. Syst. Biol. 56, 564–577. doi: 10.1080/10635150701472164
Tamura K., Stecher G., Peterson D., Filipski A., Kumar S. (2013). MEGA6: molecular evolutionary genetics analysis version 6.0. Mol. Biol. Evol. 30, 2725–2729. doi: 10.1093/molbev/mst197
Wang C., Zhou S. (2019). Next-generation sequencing yields the first complete mitochondrial genome of the ruby dragonet Synchiropus sycorax (Syngnathiformes, Callionymidae). Mitochondrial DNA B. 5, 346–347. doi: 10.1080/23802359.2019.1703601
Wang C., Chen H., Tian S., Yang C., Chen X. (2020). Novel gene rearrangement and the complete mitochondrial genome of Cynoglossus monopus: insights into the envolution of the family Cynoglossidae (Pleuronectiformes). Int. J. Mol. Sci. 21, 6895. doi: 10.3390/ijms21186895
Wang F., Zhang D., Zhang D., Li P., Gao Y. (2021). Mitochondrial protein translation: emerging roles and clinical significance in disease. Front. Cell Dev. Biol. 9. doi: 10.3389/fcell.2021.675465
Wang L., Wang S., Lin Y., Liu S., Liang P., Zhao L. (2022). Mitochondrial genome assembly and phylogenetic analysis of Upeneus japonicus (Houttuyn 1782) from the East China sea. Mitochondrial DNA B. 7, 1308–1309. doi: 10.1080/23802359.2022.2095939
Ward R. D., Zemlak T. S., Innes B. H., Last P. R., Hebert P. D. (2005). DNA barcoding Australia’s fish species. Philos. Trans. R. Soc Lond. B Biol. Sci. 360, 1847–1857. doi: 10.1098/rstb.2005.1716
Xia Y., Zheng Y. C., Miura I., Wong P. B., Murphy R. W., Zeng X. M. (2014). The evolution of mitochondrial genomes in modern frogs (Neobatrachia): nonadaptive evolution of mitochondrial genome reorganization. BMC Genomics 15, 691. doi: 10.1186/1471-2164-15-691
Xu W., Ding J., Lin S., Xu R., Liu H. (2021). Comparative mitogenomes of three species in Moenkhausia: Rare irregular gene rearrangement within Characidae. Int. J. Biol. Macromol. 183, 1079–1086. doi: 10.1016/j.ijbiomac.2021.05.049
Xu X., Wu X., Yu Z. (2012). Comparative studies of the complete mitochondrial genomes of four Paphia clams and reconsideration of subgenus Neotapes (Bivalvia: Veneridae). Gene 494, 17–23. doi: 10.1016/j.gene.2011.12.002
Yi M. R., Hsu K. C., Gu S., He X. B., Luo Z. S., Lin H. D., et al. (2022). Complete mitogenomes of four Trichiurus species: a taxonomic review of the T. lepturus species complex. Zookeys 1084, 1–26. doi: 10.3897/zookeys.1084.71576
Yi M. R., Hsu K.-C., Luo Z. S., Gu S., Feng B., Lin H.-D., et al. (2021). Diversity of the family Apogonidae along the northwestern coastline of the South China Sea. Cah. Biol. Mar. 62, 381–391. doi: 10.21411/CBM.A.A90D1ED2
Yi M. R., Zhao C. X., Su X., Tao Y. J., Yan Y. R. (2018). New record of Japanese snake blenny Xiphasia matsubarai (Perciformes: Blenniidae) from South China Sea. J. Oceanol. Limnol. 36, 1401–1407. doi: 10.1007/s00343-018-7105-x
Zhang D., Gao F., Jakovlic I., Zou H., Zhang J., Li W., et al. (2020). PhyloSuite: an integrated and scalable desktop platform for streamlined molecular sequence data management and evolutionary phylogenetics studies. Mol. Ecol. Resour. 20, 348–355. doi: 10.1111/1755-0998.13096
Zhang J., Miao G., Hu S., Sun Q., Ding H., Ji Z., et al. (2021). Quantification and evolution of mitochondrial genome rearrangement in Amphibians. BMC Ecol. Evol. 21, 19. doi: 10.1186/s12862-021-01755-3
Keywords: mitogenome, goatfish, tandem duplication/random loss, phylogeny, species identification
Citation: Luo Z, Yi M, Yang X, Wen H, Jiang C, He X, Lin H-D and Yan Y (2024) Mitochondrial genome analysis reveals phylogenetic insights and gene rearrangements in Parupeneus (Syngnathiformes: Mullidae). Front. Mar. Sci. 11:1395579. doi: 10.3389/fmars.2024.1395579
Received: 04 March 2024; Accepted: 04 June 2024;
Published: 26 June 2024.
Edited by:
Li Gong, Zhejiang Ocean University, ChinaReviewed by:
Jiao Cheng, Chinese Academy of Sciences (CAS), ChinaYingying Ye, Zhejiang Ocean University, China
Copyright © 2024 Luo, Yi, Yang, Wen, Jiang, He, Lin and Yan. This is an open-access article distributed under the terms of the Creative Commons Attribution License (CC BY). The use, distribution or reproduction in other forums is permitted, provided the original author(s) and the copyright owner(s) are credited and that the original publication in this journal is cited, in accordance with accepted academic practice. No use, distribution or reproduction is permitted which does not comply with these terms.
*Correspondence: Yunrong Yan, eXJ5YW5fZ2RvdUAxNjMuY29t; Hung-Du Lin, dmFyaWNvcmhpbnVzQGhvdG1haWwuY29t
†These authors have contributed equally to this work and share first authorship