- 1College of Meteorology and Oceanography, National University of Defense Technology, Changsha, China
- 2College of Advanced Interdisciplinary Studies, National University of Defense Technology, Nanjing, China
- 3Ministry of Education Key Laboratory for Earth System Modeling, Department of Earth System Science, Tsinghua University, Beijing, China
- 4State Key Laboratory of Severe Weather, Chinese Academy of Meteorological Sciences, Beijing, China
- 5Hunan Meteorological Disaster Prevention Technology Center, Hunan Meteorological Bureau, Changsha, China
Introduction: The impact of upper-ocean temperature on tropical cyclone (TC) activity is an open issue. Compared to the attention devoted to the effect of sea-surface temperature (SST) on TC activities, much less is known about the effect of ocean mixed layer depth (OMLD) on TC activities, which is determined by the ocean temperature below the surface.
Methods: In this study, a series of idealized numerical experiments were conducted to investigate the possible responses of TC activities to OMLD.
Results: It was found that while OMLD exerts a minor influence on TC track, it evidently affects TC intensity, size, and destructiveness before reaching a certain OMLD threshold (approximately 15 m). Once the OMLD exceeds the threshold, changes in TC intensity, size, and destructiveness become marginal with further increase in OMLD. The threshold of OMLD is largely determined by TC intensity, which in turn is dictated by surface wind speed.
Discussion: Specifically, before reaching the threshold of OMLD, the surface wind, namely TC-related surface wind, may bring the cold water from below the OMLD, and effectively decreases the upper ocean temperature (including the SST). As OMLD increases, the effect of surface wind on SST cooling gradually decreases, leading to an increase of SST below the TC. Subsequently, the SST increase leads to more surface enthalpy flux (SEF) input into the TC by increasing air-sea temperature and moisture differences. By altering TC's thermodynamic and dynamic structures, the increase of SEF eventually results in the increase of TC intensity and size, and thus its destructiveness.
1 Introduction
Tropical cyclones (TCs) are among the most destructive natural disasters on Earth (Pielke et al., 2008; Peduzzi et al., 2012). The ocean serves as the primary energy source for TC intensification. During the development of a TC, warmer sea-surface temperature (SST) facilitates enhanced air-sea interactions, with increased sensible heat flux (SHF) and latent heat fluxes (LHF) favoring the strengthening and expansion of the TC (Emanuel, 1986; Rotunno and Emanuel, 1987; Holland, 1997; Persing and Montgomery, 2005). Concurrently, surface wind (e.g., TC wind) exerts a negative influence on SST via air-sea interactions, with higher wind speeds accelerating SST cooling. Wind drives horizontal dispersion of the sea-surface layer, leading to the upwelling of colder water and subsequent SST cooling. In fact, 75%-90% of SST cooling can be ascribed to turbulence from wind-induced vertical shear in the upper ocean, which transports colder water from deeper layers into the ocean mixed layer (Cheng et al., 2015; Halliwell et al., 2015; Potter, 2018). Thus, TC-induced SST cooling largely depends on the ocean mixed layer depth (OMLD) prior to the passage of the TC. Analysis of observational data suggested that the passages of consecutive TCs can lead to a deepening of OMLD, which may subsequently affect the activity of subsequent TCs (He et al., 2023; Zhang, 2023). Additionally, research indicated that with global warming, there is a trend toward an increase in ocean heat content in the future (Rosenthal et al., 2013; Xiao et al., 2019; Xia et al., 2021). The change in ocean heat content is largely determined by both SST and OMLD; however, relatively little is known about the change of OMLD with global warming.
Despite the weak impact of OMLD on TC track, OMLD contributes greatly to TC intensity (Chan et al., 2001; Zhao and Chan, 2017). Studies highlighted the role of ocean heat content in the genesis, growth, and trajectories of TCs (Gray, 1979; Dowdy et al., 2012); and OMLD is regarded as a crucial indicator for ocean heat content that plays an important role in determining TC intensity (Vissa et al., 2012; Sun et al., 2014a). Based on their numerical simulations, Nigam et al. (2019) indicated that upper-ocean temperature stratification, which is closely associated with OMLD, plays a vital role in determining the magnitude of TC-induced SST cooling, and thus affects TC intensity. This aligns with the simulated results in Zhao and Chan (2017) and Li et al. (2020), which collectively indicated a substantial contribution of OMLD to TC intensity. Subsequent observational studies revealed that it is the deepening of ocean mixed layer that contributes to the increased proportion of intense typhoons during 1980-2015 over the western North Pacific (Wu et al., 2018). Despite these studies concerning the impact of OMLD on TC intensity, the mechanisms remain obscure. Furthermore, relative to the impact on TC intensity, the impact of OMLD on TC size and destructiveness has received less attention and warrants thorough investigation. This study focuses on the impact of OMLD on TC activities (including TC track, intensity, size, and PDS (size-dependent destructive potential)) and the underlying physical mechanisms by conducting a series of semi-idealized, high-resolution, downscaled OMLD sensitivity experiments with modified upper-ocean temperature structure. The organization of this paper is as follows. In Section 2, we describe the data, model configuration, and experimental design. In Section 3, we present the results of the model simulations. Physical mechanisms are analyzed in Section 4, followed by conclusions and discussion.
2 Data, model configuration, and experimental design
2.1 Data
We use the historical scenario outputs from the EC-Earth3 model for the sixth phase of the Coupled Model Intercomparison Project (CMIP6; https://pcmdi.llnl.gov/CMIP6/), to establish the initial atmospheric and lateral boundary conditions for the Weather Research and Forecasting (WRF) model. The historical scenario run (Historical) of the EC-Earth3 is a historical climate simulation which started in the 19th century, from 1840 to 2014, and was driven by various external forces based on observations (Feng et al., 2023). The EC-Earth3 encompasses the modules of atmosphere, land surface, ocean, and sea ice. Vidale et al. (2021) reported that the EC-Earth3 for the CMIP6 is excellent in simulating TCs because of its high horizontal resolution and stochastic physics schemes. Our experiments primarily utilize the historical scenario outputs from the EC-Earth3 model with a spatial resolution of 0.7°×0.7° and a temporal resolution of once every six hours. Specifically, this study utilizes the climatology mean state of 1985-2014 derived from the historical scenario.
2.2 Model configuration
The WRF model is one of the mainstream models for studying TCs; and its accuracy in simulating TCs in various regions has been widely recognized (Rajeswari et al., 2020; Mahala et al., 2021; Calvo-Sancho et al., 2023). Beginning in version 3.5, the WRF model introduced atmosphere-ocean coupled models, including a simple one-dimensional ocean mixed layer and the three-dimensional Price-Weller-Pinkel (3DPWP; Price et al., 1986). The 3DPWP model is widely used and performs fairly well in simulating upper-ocean responses to TCs (Sanford et al., 2007, 2011; Lin et al., 2023). The 3DPWP computes upper-ocean responses to a moving TC by solving the momentum, heat, and salinity equations as described in Srinivas et al. (2016). The ocean mixed layer model merely alters the vertical distribution of ocean temperature, whereas the 3DPWP model is more comprehensive, incorporating important physical processes such as upwelling (Podeti et al., 2022). Yablonsky and Ginis (2009) noted that one-dimensional ocean models neglect upwelling, consequently underestimating the SST cooling induced by strong winds. Therefore, the adoption of a three-dimensional ocean model is crucial for atmosphere-ocean coupling in TC studies. Additionally, utilizing the integrated ocean model in the WRF model can significantly boost the efficiency of atmosphere-ocean coupling and reduce computational cost.
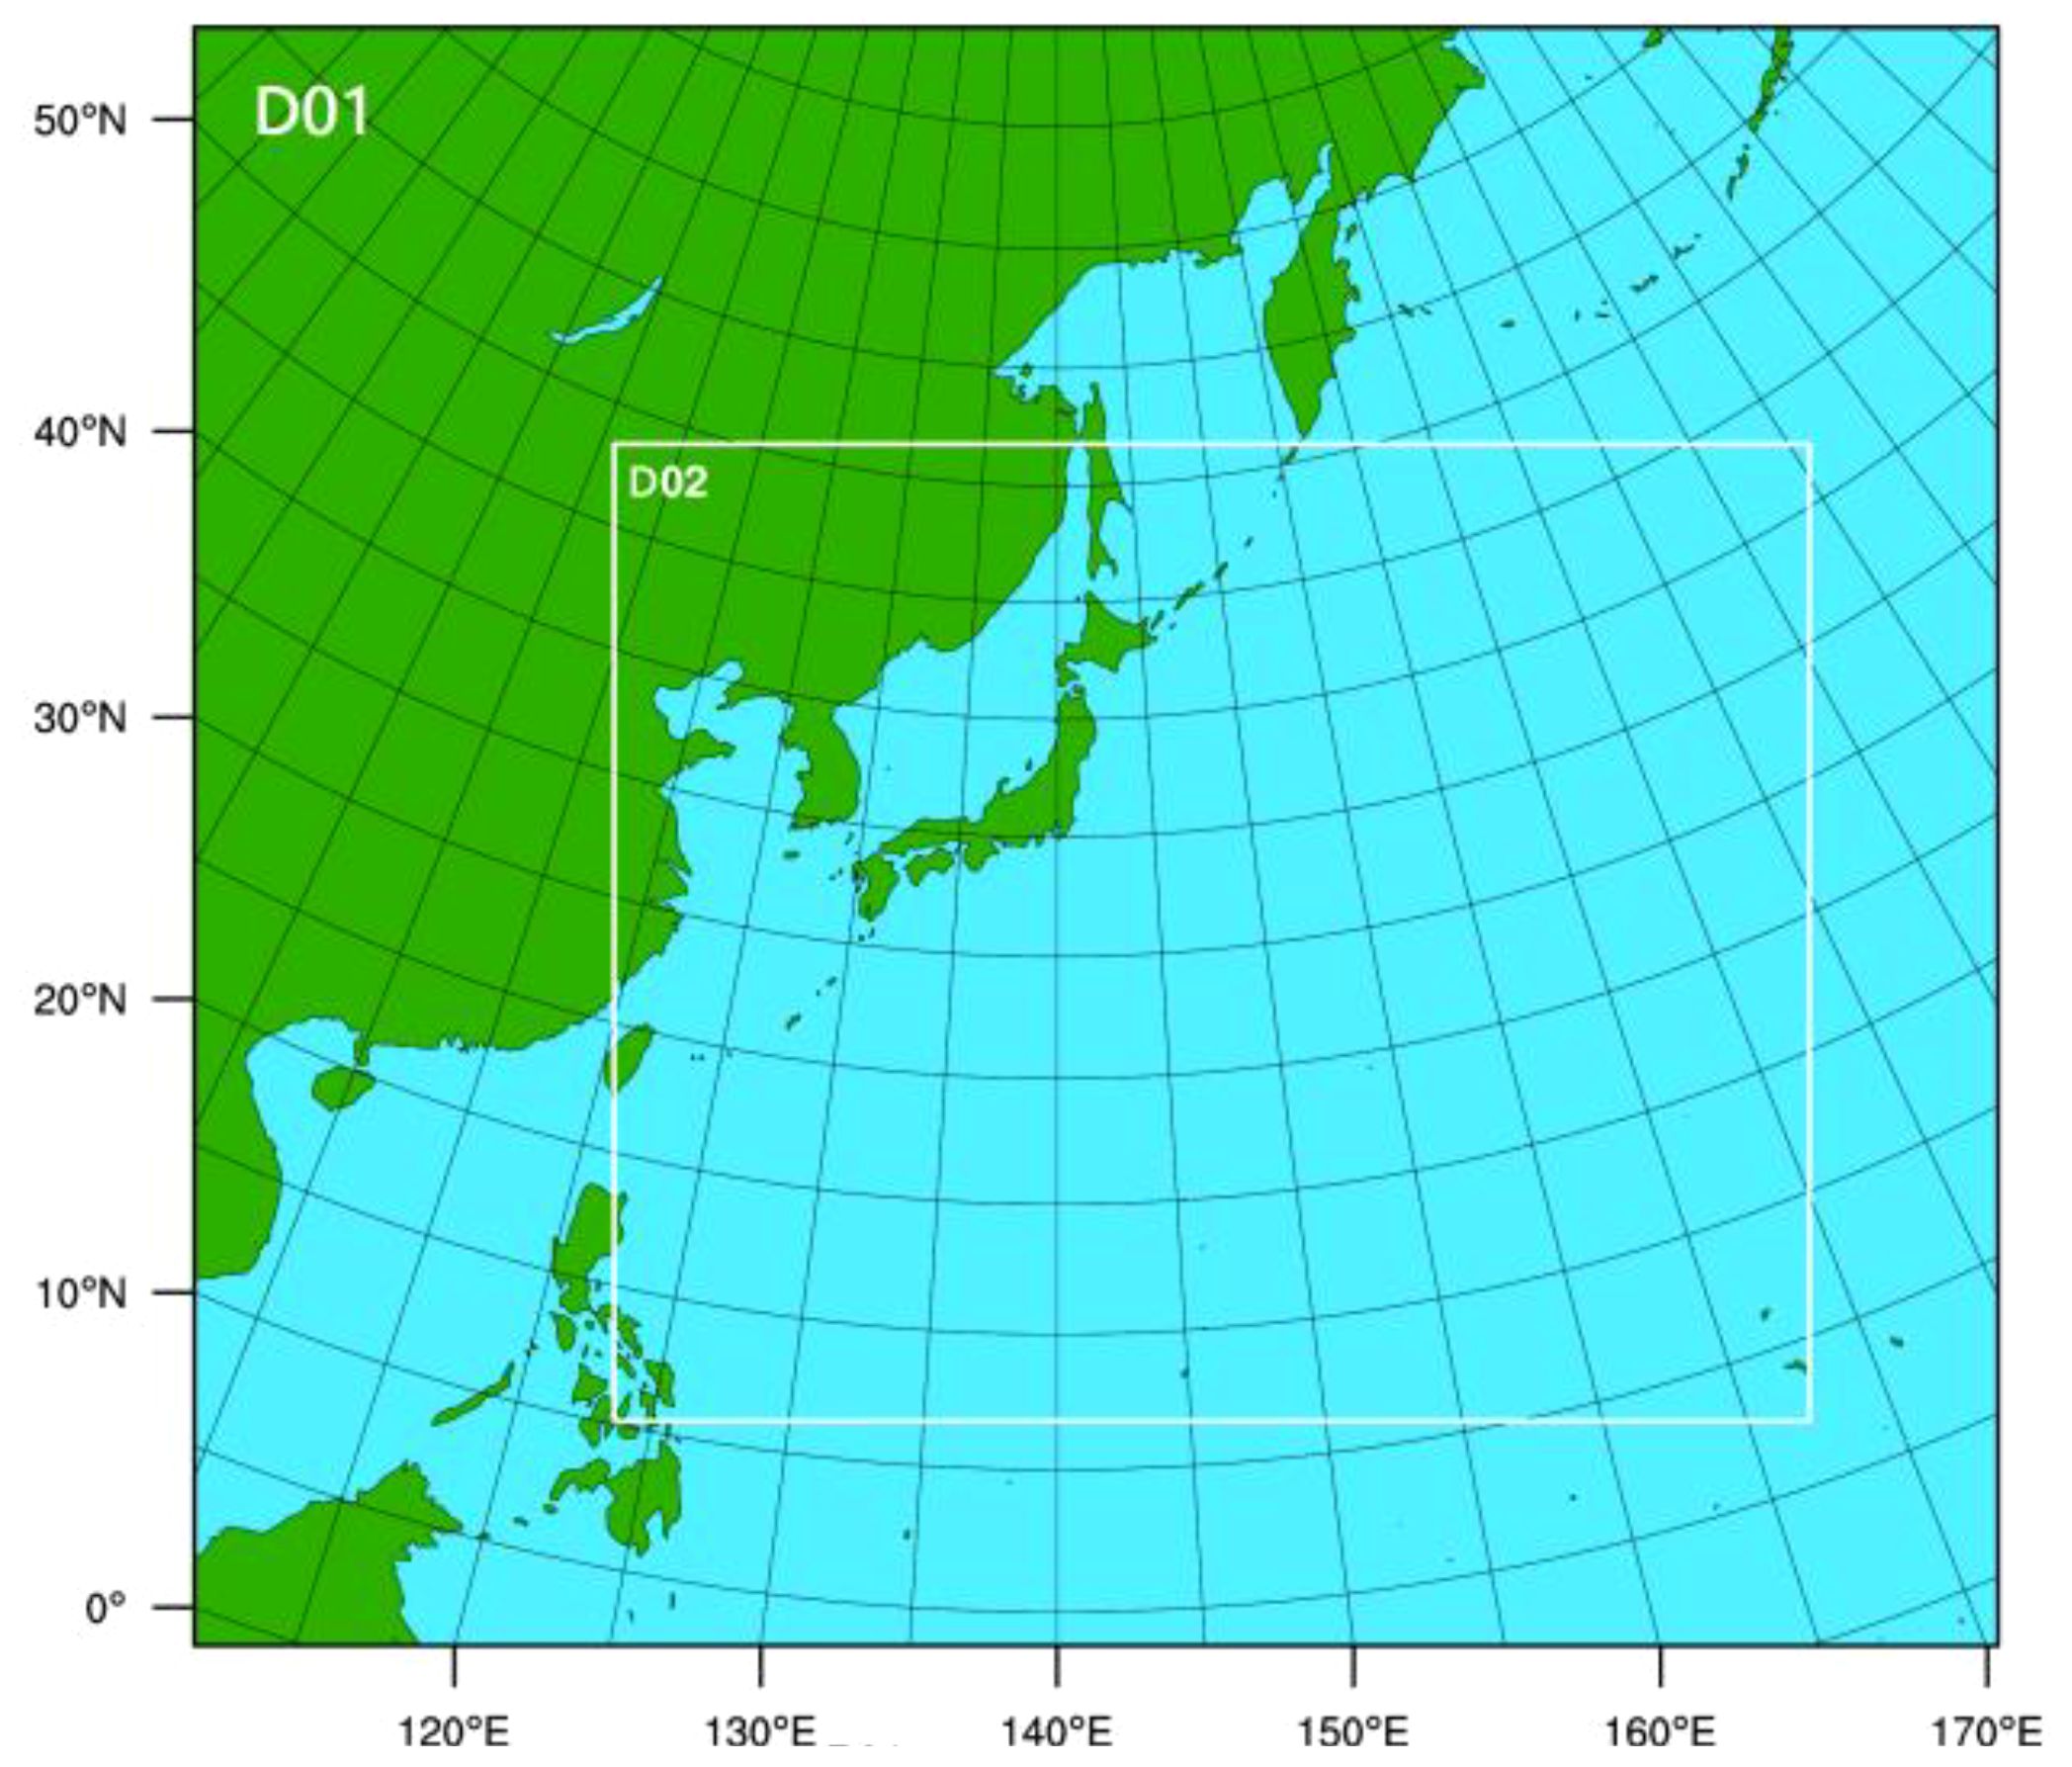
We utilize the advanced research WRF model (v.4.5.1) and 3DPWP model provided by the WRF for seven high-resolution downscaling experiments with different OMLDs (i.e., 2, 5, 10, 15, 20, 50, and 100 m). The modeling system was configured in a two-way interactive mode with two nested domains, featuring horizontal resolutions of 20 and 4 km, respectively. Figure 1 illustrates the two-way nested domains of the experimental setup. The first domain (20 km) encompasses 400 300 grid points, covering nearly the entire western North Pacific. The second domain (4 km) contains 1000 650 grid points. The simulation duration is set for four days covering most lifetimes of the TCs used in this study, with the D01 domain outputting data every six hours and the D02 domain every three hours. The atmosphere model employs a hybrid-sigma coordinate system, with both grids featuring 41 vertical levels. The physical parameterization used in the experiments are as follows: the Tiedtke cumulus parameterization (Tiedtke, 1989); the WSM 6-class graupel scheme for cumulus (Hong and Lim, 2006); the Rapid Radiative Transfer Model for shortwave and longwave physics (Iacono et al., 2008); the planetary boundary layer scheme of the Yonsei University scheme (Hong et al., 2006); land surface physics from the Unified Noah Land Surface model (Ek et al., 2003); and a revised MM5 Monin-Obukhov scheme for the surface-layer physics (Skamarock et al., 2021).
The ocean model used is the 3DPWP provided by the WRF. The 3DPWP was developed based on the formulations of Price et al (Price et al., 1986, 1994). In the 3DPWP, we primarily consider the effect of upper-level wind stress on the ocean, which induces advection, mixing, and surface heat fluxes, altering the vertical structure of the upper-ocean layer. The ocean model’s vertical resolution is set in the 3DPWP model. Although the WRF-3DPWP model is three-dimensional, the initial ocean temperature setting (ocean_t) is one-dimensional (vertical). In this study, the ocean is segmented into 30 layers, with the vertical resolution becoming lower with increasing depth (i.e., 0.5, 1.0, 1.5, 2, 3, 4, 5, 10, 15, 20, 25, 30, 40, 50, 60, 70, 80, 90, 100, 110, 130, 150, 170, 190, 210, 230, 250, 270, 290, and 310 m). The ocean temperature initialization uses the temperature data provided in the WRF sample. (See ocean_t in README.namelist file of the WRFV4.5.1 model).
2.3 Experimental design
We conduct a series of idealized experiments with different initial OMLDs using the WRF model. The TC bogus scheme is used to build the initial TC centered at (130°E, 20°N) (Skamarock et al., 2021), which is within the main TC generation region in the Pacific. The initial TC intensity is set to 16 m s-1, which is moderate and allows the TCs with different OMLDs to develop without rapid decline during the four-day integration. During their lifetimes, these TCs are predominantly resided within the D02 domain.
We conduct seven experiments with different OMLDs, namely at 2, 5, 10, 15, 20, 50, and 100 m, which are referred to as E2m, E5m, E10m, E15m, E20m, E50m, and E100m, respectively. Figure 2 illustrates the initial temperature profile setting for each experiment. The initial TC settings for all seven experiments remain uniform. (e.g., location, intensity). Within the OMLD for each experiment, the temperature is set to a constant value; below the OMLD, a standard ocean temperature is utilized. In other words, the ocean temperature within the OMLD is adjusted to a constant value (28.20°C), while the temperature below the OMLD is consistent for all the experiments. To avoid the influence of salinity on the model’s calculation of density and thus OMLD, salinity is uniformly assigned a value of 34.01 (a reasonable salinity value) in all the experiments.
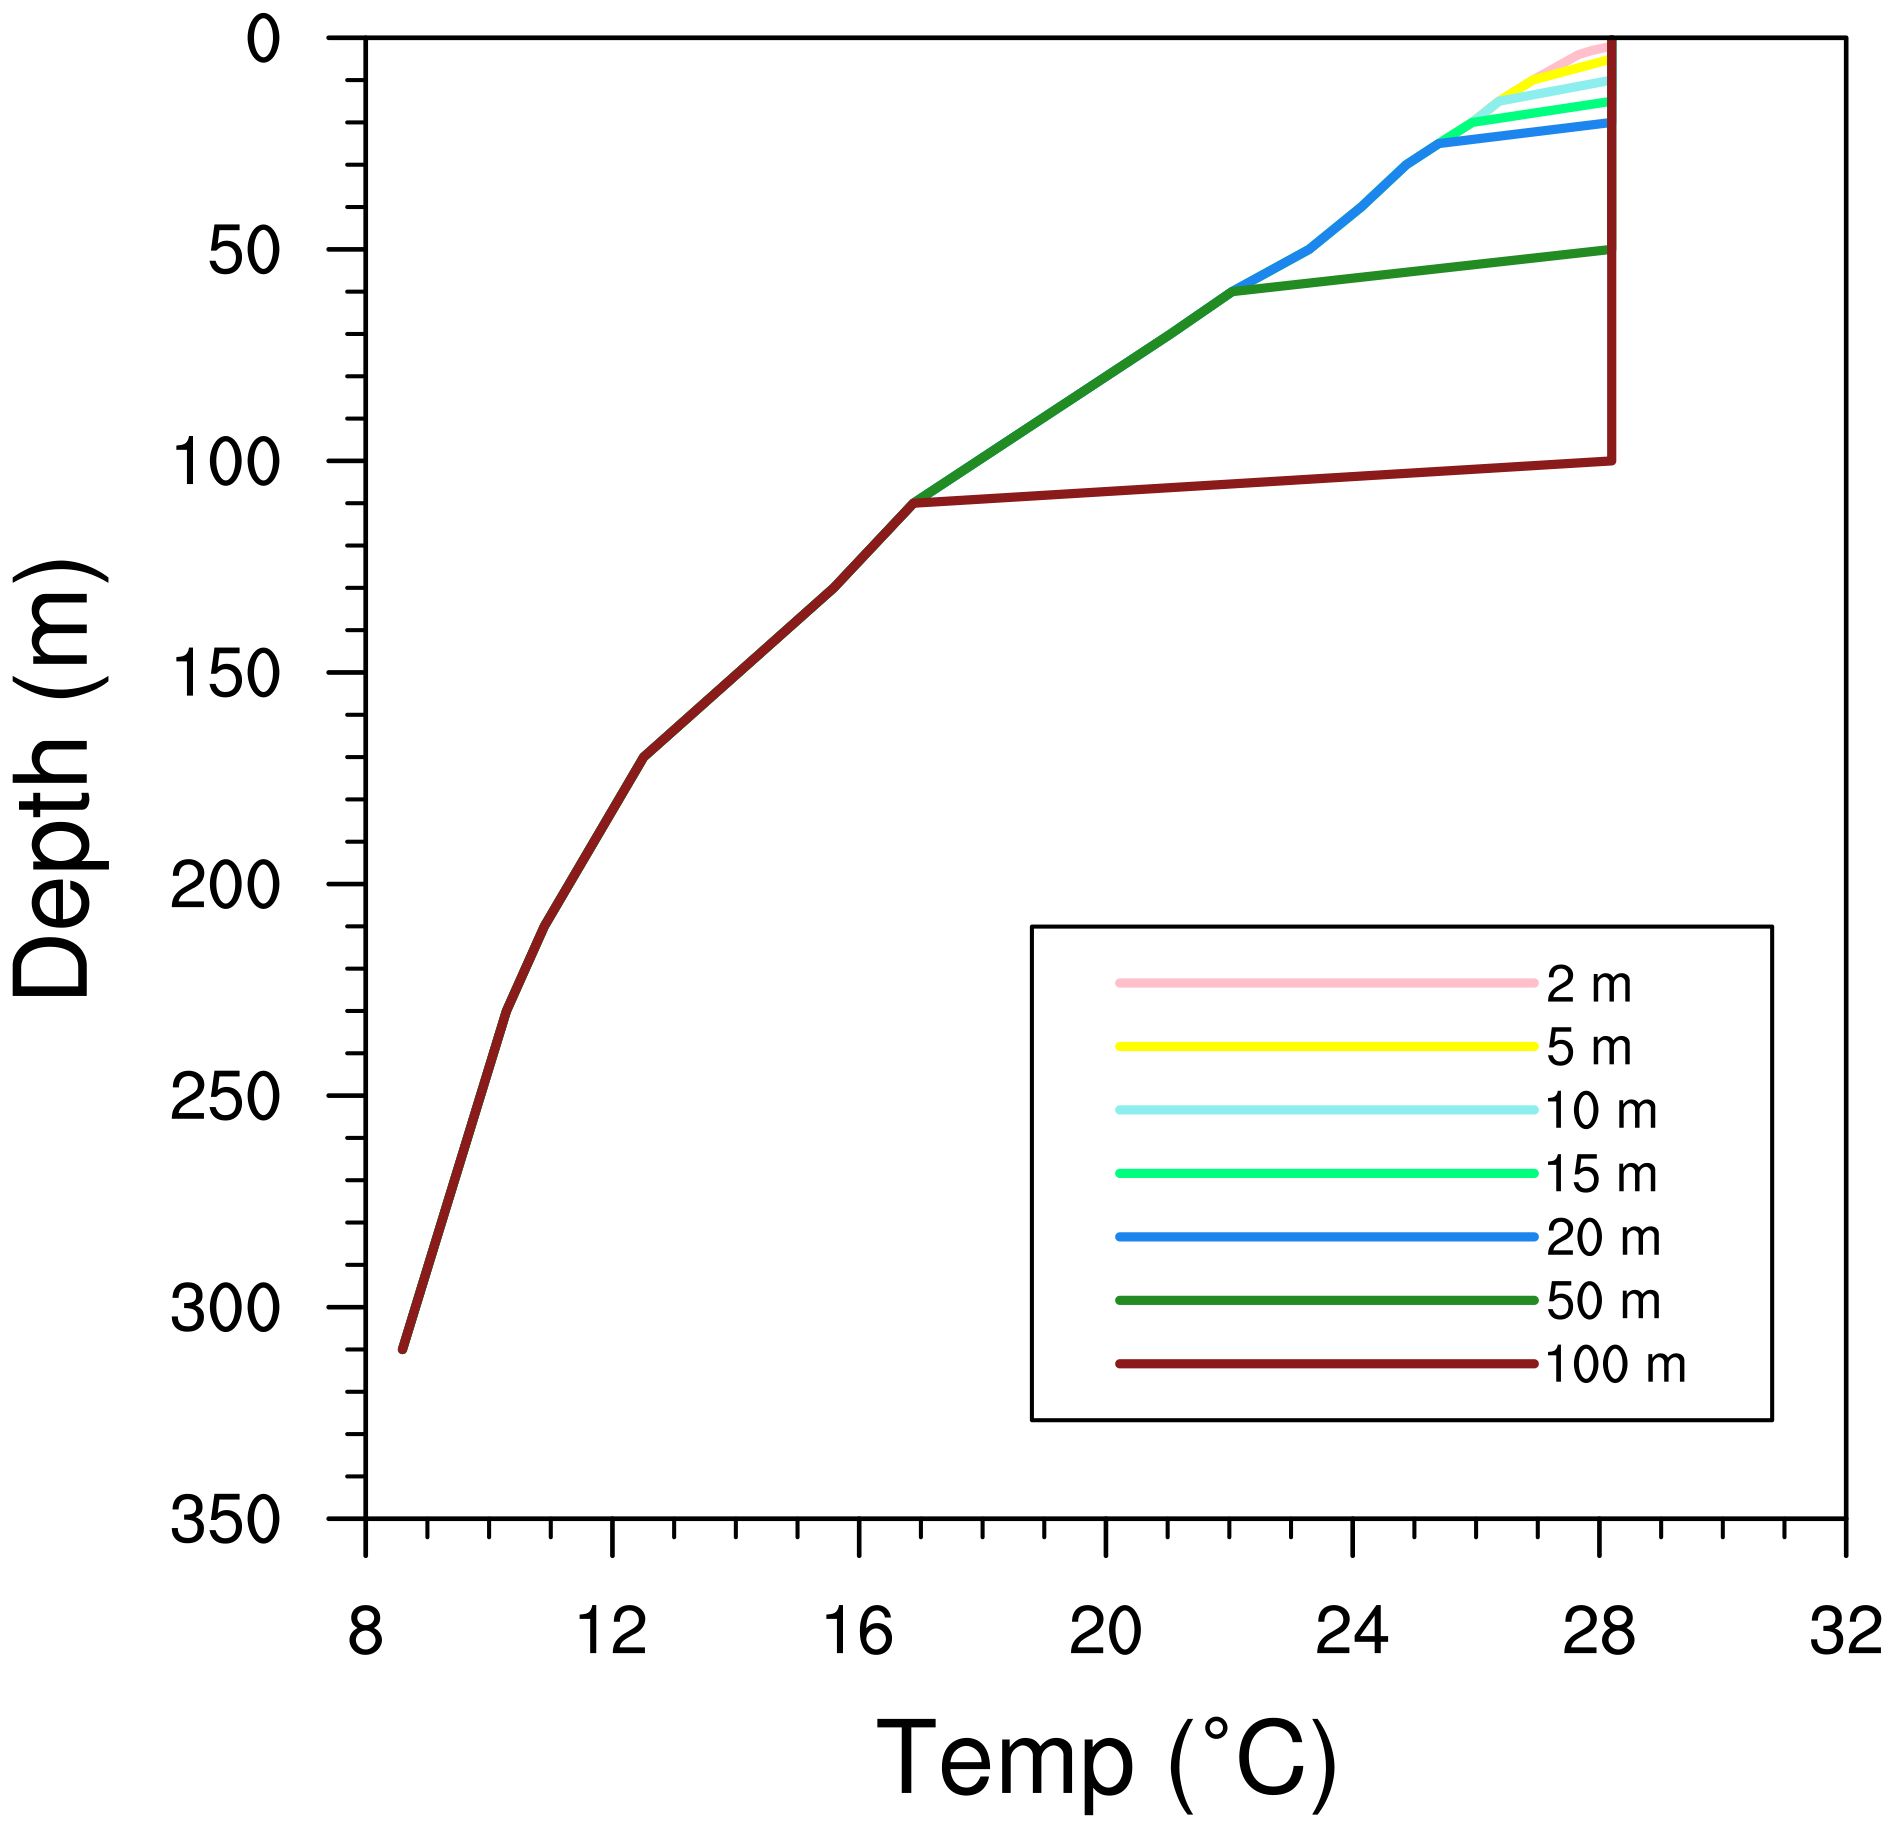
Figure 2 Different depths with varying temperature (°C) configurations at initial time. Pink, yellow, blue, green, navy blue, forest green, and dark red lines indicate the tracks from E2m, E5m, E10m, E15m, E20m, E50m, and E100m, respectively.
3 Simulation results
3.1 Upper-ocean temperature
Figure 3 illustrates the upper-ocean temperature 24 hours after the integration starts. Compared to the initial upper-ocean temperature profile, there are notable changes in the structure after 24 hours. This is due to the strong stirring effect of the TC on the upper ocean (Ma et al., 2013), which induces upwelling and vertical shear-driven turbulence in the upper ocean, leading to the upwelling of colder water from deeper layers and a rapid SST reduction (Wu et al., 2005). In the experiments with initial OMLD ranging from 2 to 15 m (i.e., E2m, E5m, E10m, and E15m), the OMLD remains relatively stable around 15 m after 24 hours, with the overall upper-ocean temperature being warmer in experiments with larger initial OMLDs. In the experiments with OMLD of 20 to 100 m (i.e., E20m, E50m, and E100m), the OMLD persists unchanged from the initial state. This implies that the stirring depth of the TC is approximately 15 m in this study. When the initial OMLD is set above this threshold, the TC cannot effectively mix the cold water below the OMLD with the water within the OMLD, and the effect of causing a decrease in upper-ocean temperature becomes less pronounced. Note that the OMLD is intricately linked to the intensity of surface wind. As is shown, the closer to the area with strong wind, e.g., TC eyewall region, the greater the OMLD (Figure 3). Conversely, in the regions distant from the TC with weak surface wind, the OMLD is largely reduced (Supplementary Figure S1).
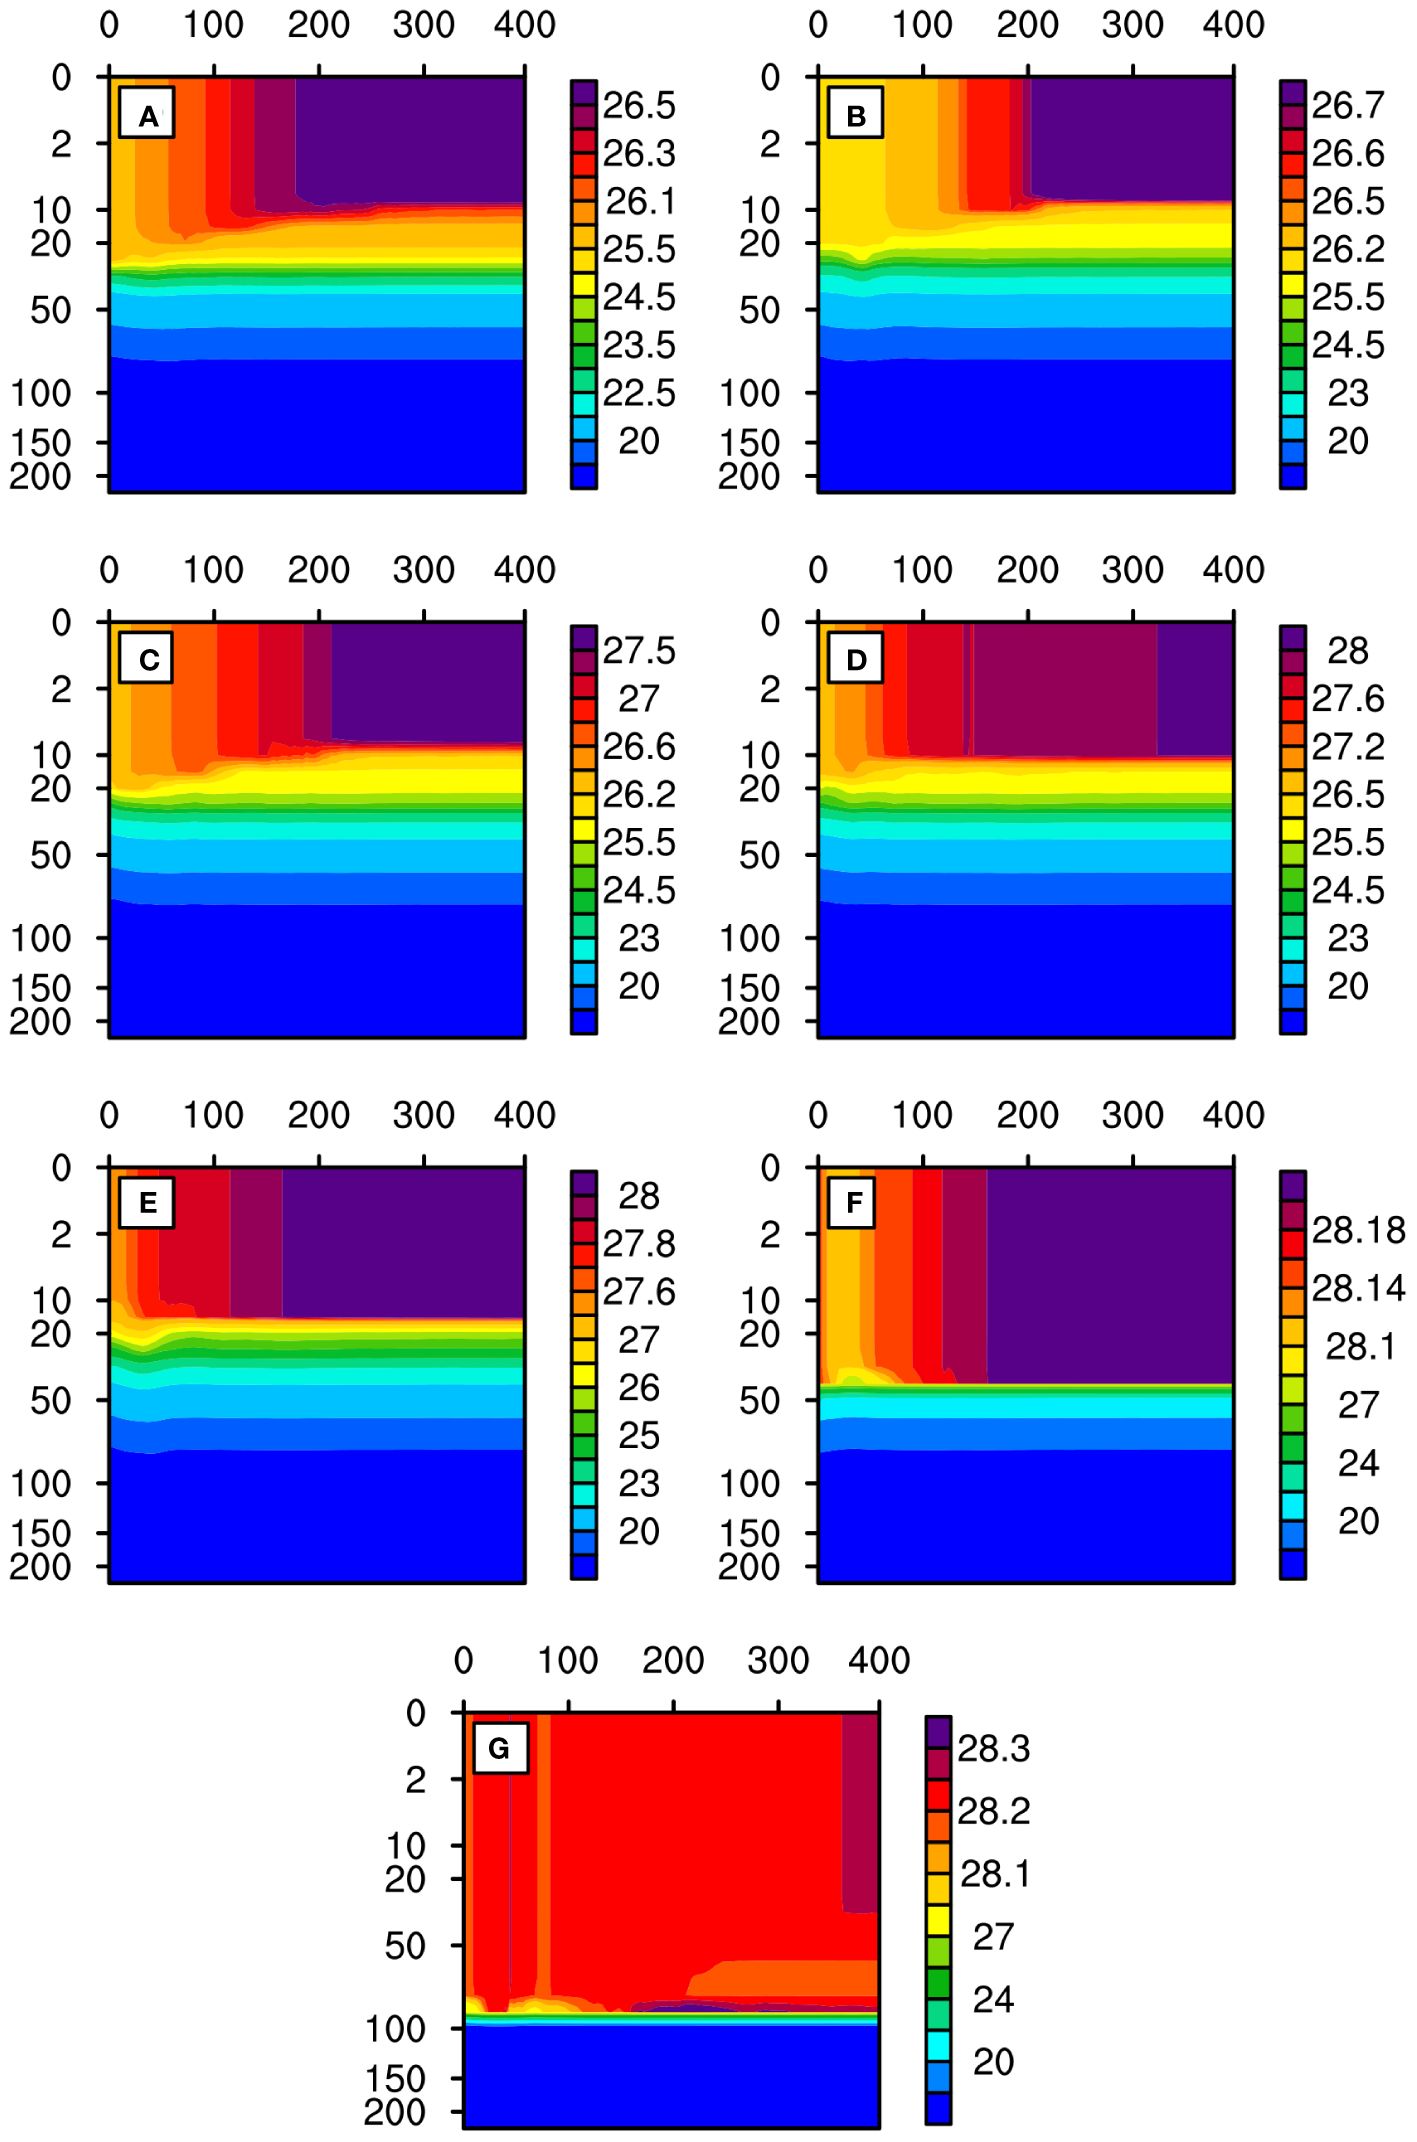
Figure 3 Upper-ocean temperature (°C) after 24-hour integration: (A) E2m; (B) E5m; (C) E10m; (D) E15m; (E) E20m; (F) E50m; and (G) E100m. The horizontal axis represents the radial distance from the TC center in kilometers (km), and the vertical axis indicates water depth in meters (m).
3.2 TC track
Figure 4 displays the simulated TC tracks with different initial OMLDs. There is no substantial difference among the simulated TC tracks. This aligns with prior research indicating that the simulated TC track exhibits low sensitivity to the initial OMLD (Chan et al., 2001; Zhao and Chan, 2017). This is because the initial changes in OMLD do not substantially influence the large-scale environmental steering winds at the 5880-m geopotential height (Supplementary Figure S2), and consequently do not alter the direction of the TC. Similar tracks help eliminate the interference of atmospheric environmental differences between experiments, which is crucial for analyzing the physical mechanisms in Section 4. Despite the patterns of TC tracks in these experiments are consistent, subtle differences are observed, that is, the smaller the OMLD, the slower the TC translation speed, resulting in a difference in TC center positions among the sensitivity experiments; The difference is small initially, but grows with time (Supplementary Figure S3; Supplementary Table S1). As suggested by Gong et al. (2022), the smaller the TC intensity, the slower the TC translation speed. Thus, the difference in TC track may be partly attributed to the difference in TC intensity among the OMLD sensitivity experiments. In addition, the differences in TC track between E2m and the other experiments are pronounced stemming from the asymmetric structure associated with the weaker TC intensity in E2m (Supplementary Figure S4).
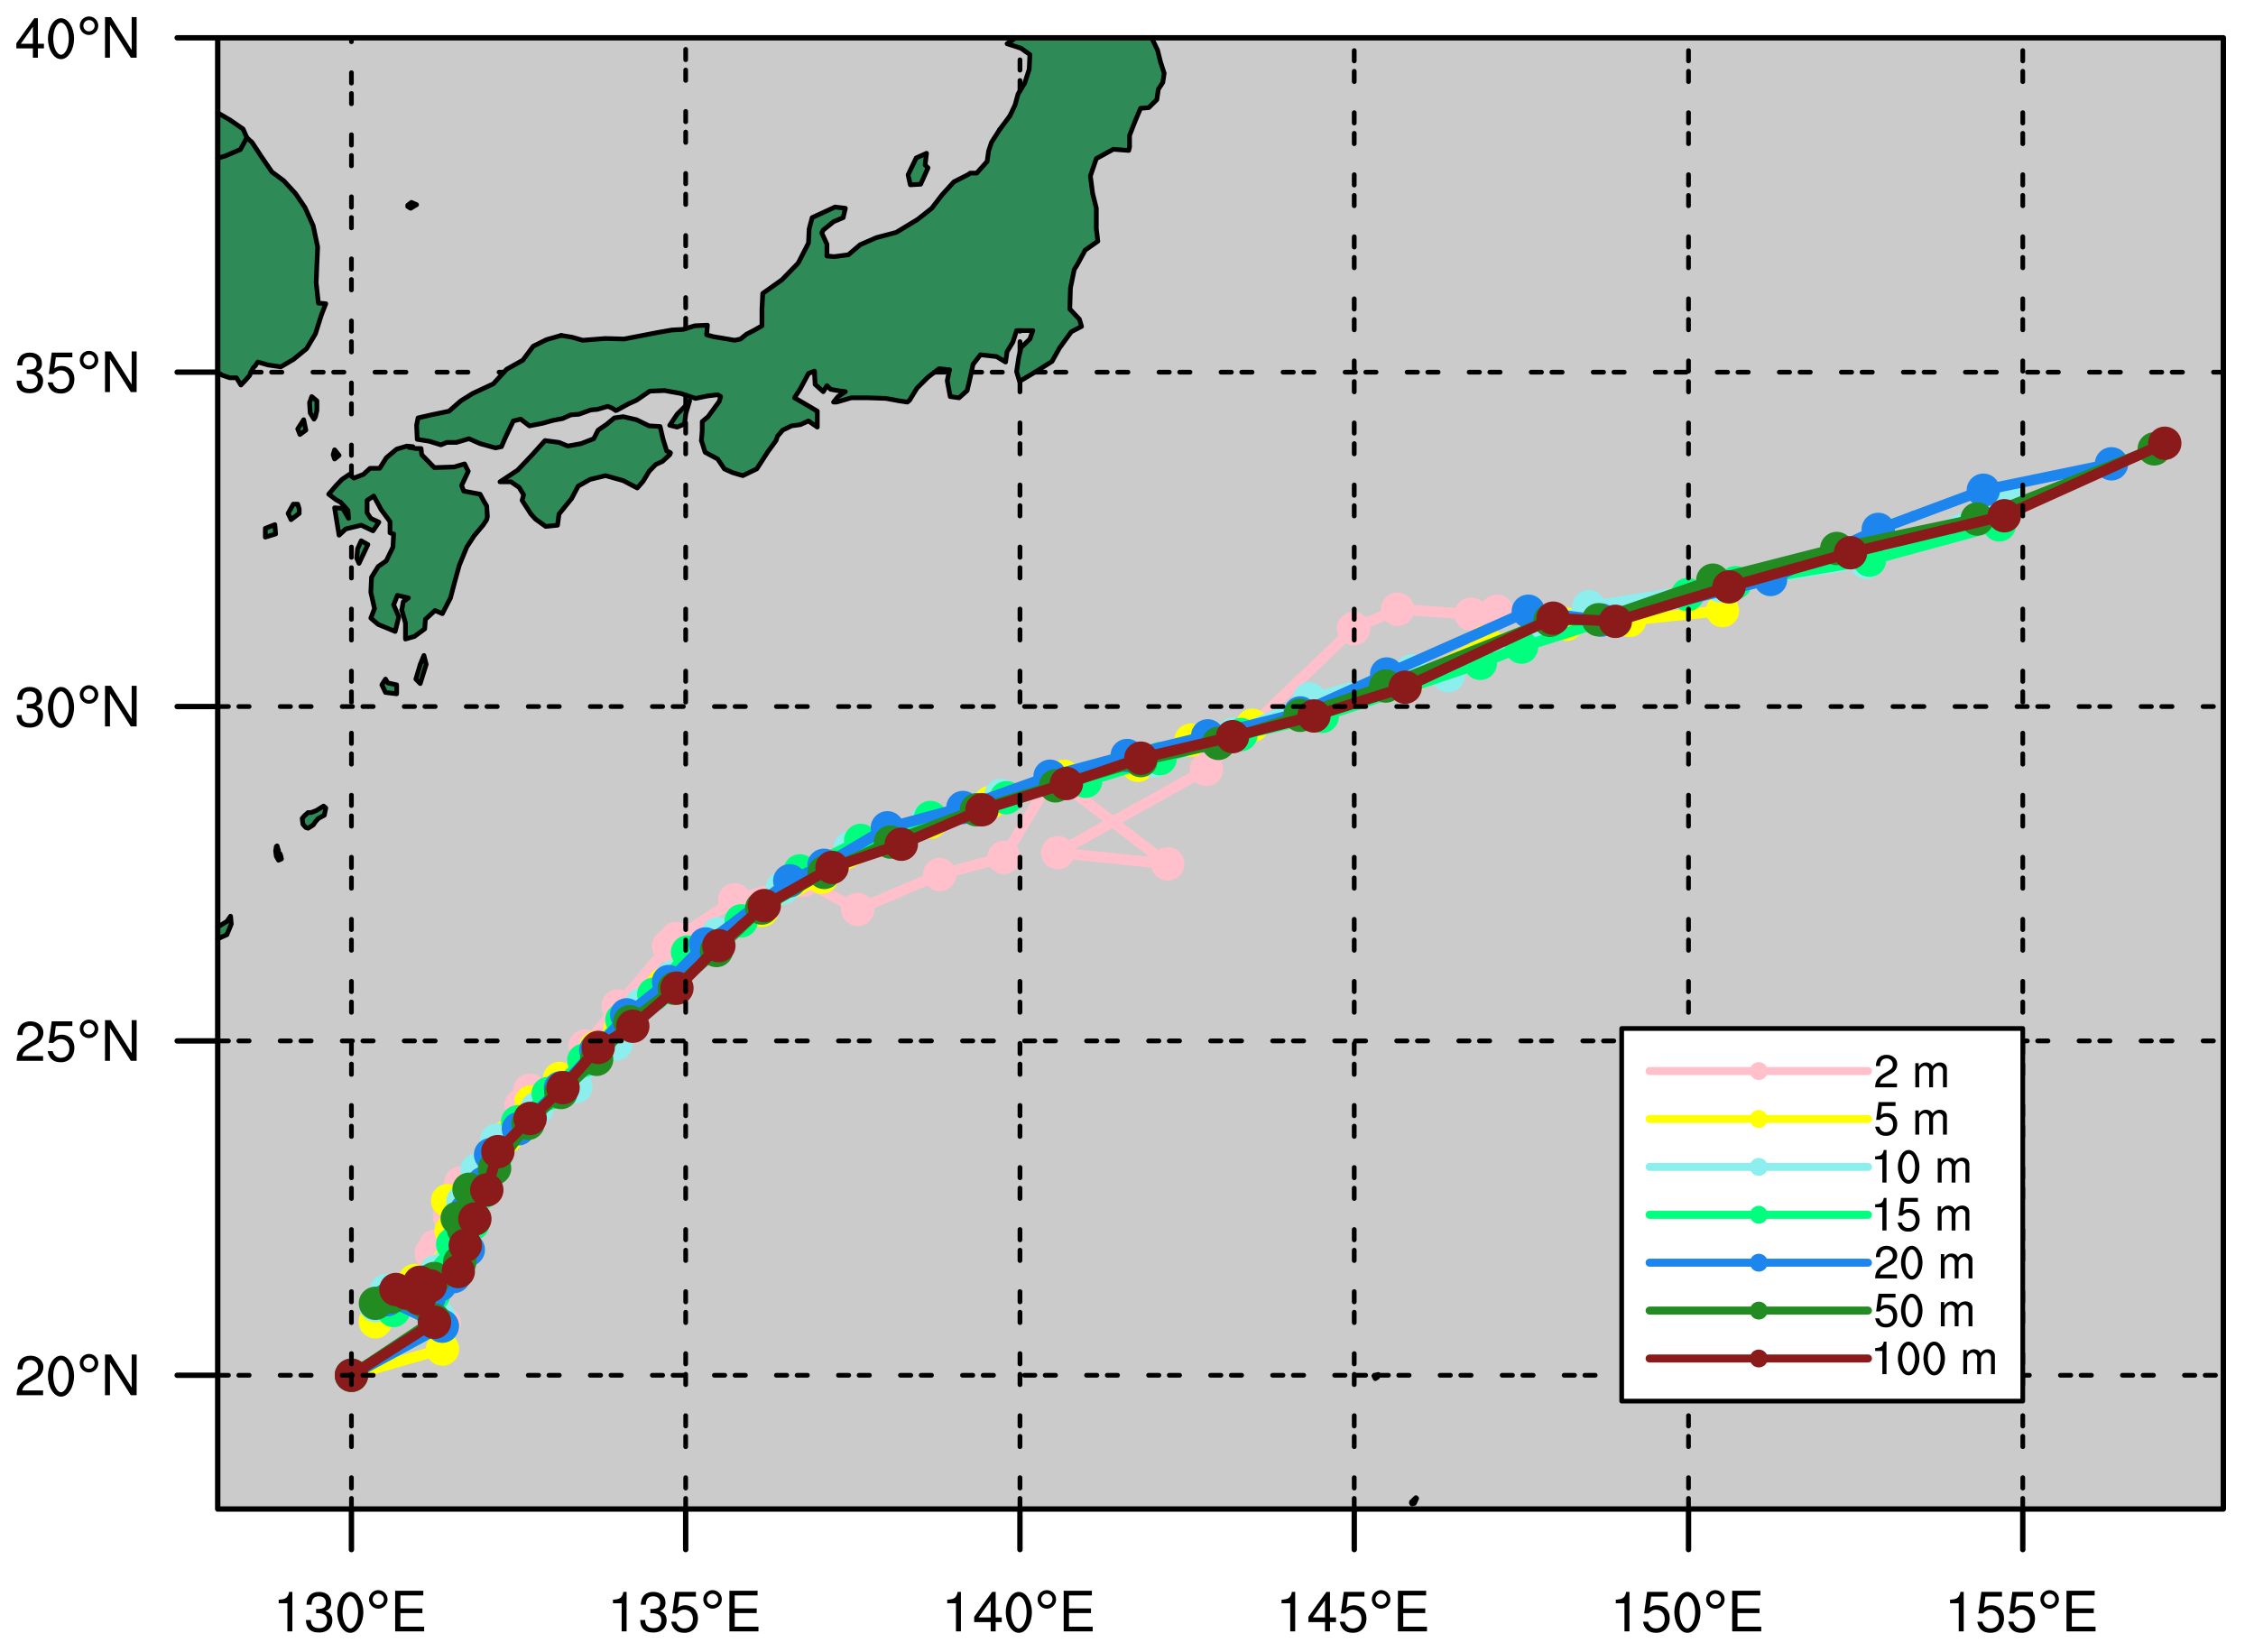
Figure 4 Model-simulated and observed tracks of TC from 0 to 96 h. Pink, yellow, blue, green, navy blue, forest green, and dark red lines indicate the tracks from E2m, E5m, E10m, E15m, E20m, E50m, and E100m, respectively. The TC center location (dot) is presented at 3-h interval.
3.3 TC intensity
Figure 5 shows the time evolution of TC intensity in the seven experiments, in terms of minimum sea-level pressure (MSLP) and maximum wind speed (MWS) at 10-m height. All seven experiments reach peak intensity within 72 to 84 hours following the simulation onset, which can be considered the mature stage of TC development. Figure 5 also compares the peak intensity during the mature phase and the overall variation of TC intensity throughout the simulation period.
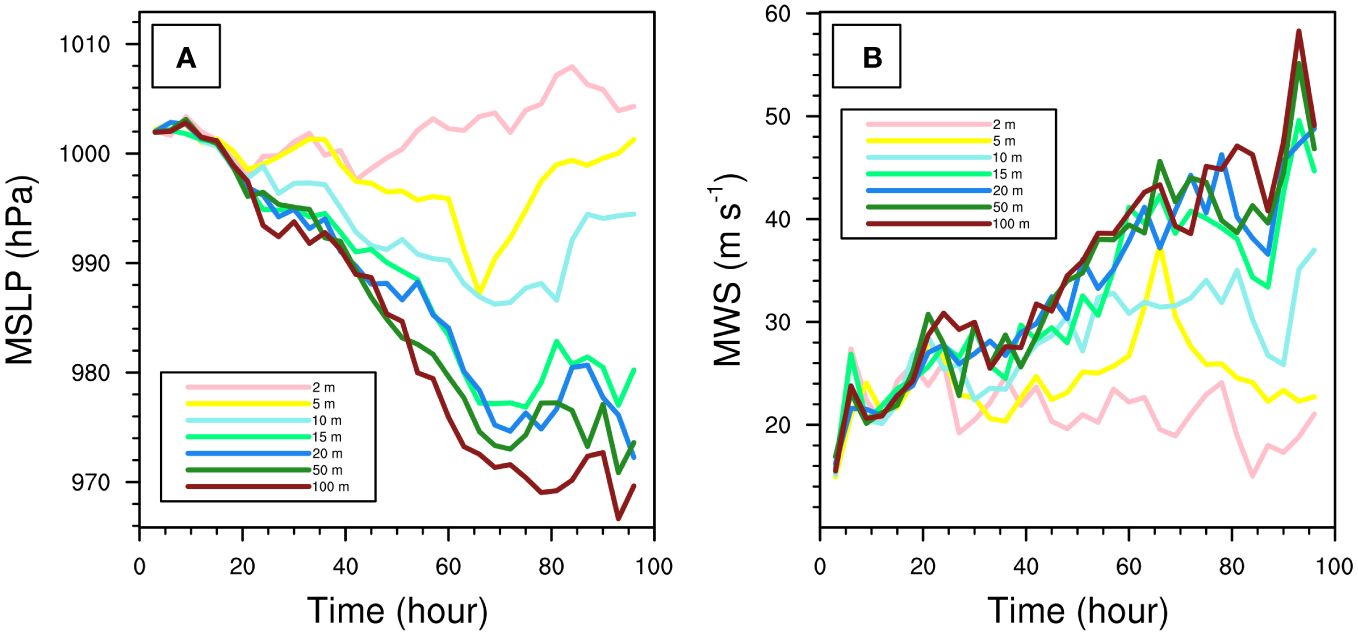
Figure 5 Temporal evolutions of MSLP (hPa; A) and MWS (m s-1; B) for the seven experiments. Pink, yellow, blue, green, navy blue, forest green, and dark red lines indicate the tracks from E2m, E5m, E10m, E15m, E20m, E50m, and E100m, respectively.
First, we compare the TC intensity during the mature phase across the seven experiments. As the OMLD increases from 2 to 5 m, the TC intensity increases notably, as lifetime MSLP deepens by 10.4 hPa and lifetime MWS increases by 10.2 m s-1. As the OMLD further increase from 5 to 10 m, the TC intensity also experiences a notable increase in most of the TC lifetime despite of relatively little change in lifetime MSLP (1.0 hPa) and MWS (0.5 m s-1). More importantly, when the OMLD increases from 10 to 15 m, there is a drastic surge in TC intensity in terms of both MSLP (about 9.4 hPa) and MWS (about 12.6 m s-1). However, the increase of TC intensity becomes small when the OMLD increases further. When the OMLD increases from 15 to 20 m, the MSLP decreases by 4.6 hPa, and the MWS increases by 0.8 m s-1. When the OMLD further increases from 20 to 50 m (50 to 100 m), despite the notable change in OMLD, the MSLPs of the two TCs differ by only 1.4 hPa (4.2 hPa), and the MWSs, by just 6.3 m s-1 (3.1 m s-1). Therefore, the TC intensity increases notably (slightly) with the OMLD before (after) the OMLD reaching its threshold of 15 m. This indicates there is a sensitive range for TC lifetime maximum intensity with OMLD; and once the OMLD changes beyond a threshold, the variation of its impact on TC lifetime maximum intensity will weaken.
Second, we compare the evolution of TC intensity among the seven experiments. Throughout the entire simulation period, the TC in E2m has a very short duration when MSLP is below 1000 hPa, indicating a weak intensity. It implies that the initial oceanic environment with OMLD<=2 m is unfavorable for TC development. In the experiments with OMLD<=10 m, the TC goes through a complete life cycle of initial development, followed by weakening, and eventual dissipation. From E10m to E15m, the TC intensity shows a drastic enhancement. In the experiments with OMLD>=15 m, the TC experiences an initial development phase of about 70 hours, followed by a brief weakening phase of approximately 10 hours, after which the TC intensity continues to increase over time without dissipating within the simulation period of four days. This indicates that OMLD not only affects TC intensity but also has an impact on TC lifetime. Since our simulation time is set to 96 hours, we did not extend the simulation for experiments with OMLD>=15 m to fully simulate the TC life cycle. This is because the TC merges with a mid-latitude cyclone in the later stages, and is no longer classified as a TC.
3.4 TC size
To investigate the effect of OMLD on TC size, we pay attention to the changes in 17 m s-1 wind speed radius (R17) of TC in the seven experiments (Figure 6). During the initial 20 hours of the simulation, there is no evident difference in R17 across the experiments. However, after 20 hours, the impact of OMLD on TC size becomes obvious: As the OMLD increases, the TC size also increases. When OMLD increases from 2 to 5 m, TC size increases drastically in terms of both maximum value (43.9 km) and average value (38.5 km), mainly due to the increase of TC intensity. Comparing E5m and E10m, although the peak TC size in E10m does not show an evident advantage over that in E5m, the TC size is clearly larger in the latter hours of the simulation period. When the OMLD increases from 10 to 15 m, there is a noticeable increase in TC size, with a difference of 17.3 km in peak values (of 10.6 km in average values). The average TC size in E20m exceeds that in E15m by a mere 2.2 km; and the differences in peak TC size among E15m, E20m, E50m, and E100m are relatively small. Moreover, the TC sizes in E50m and E100m exhibit negligible difference throughout the simulation period. This aligns with the intensity results shown in Figure 5, indicating that when OMLD<=15 m, there is a clear tendency for TC size to increase with increasing OMLD; once OMLD >15 m, the tendency weakens. This suggests there is a sensitive range for the variation of TC size with OMLD. Once the OMLD goes beyond a threshold, the impact on TC size will change little. In this study, TC size is more sensitive to changes in OMLD smaller than 15 m.
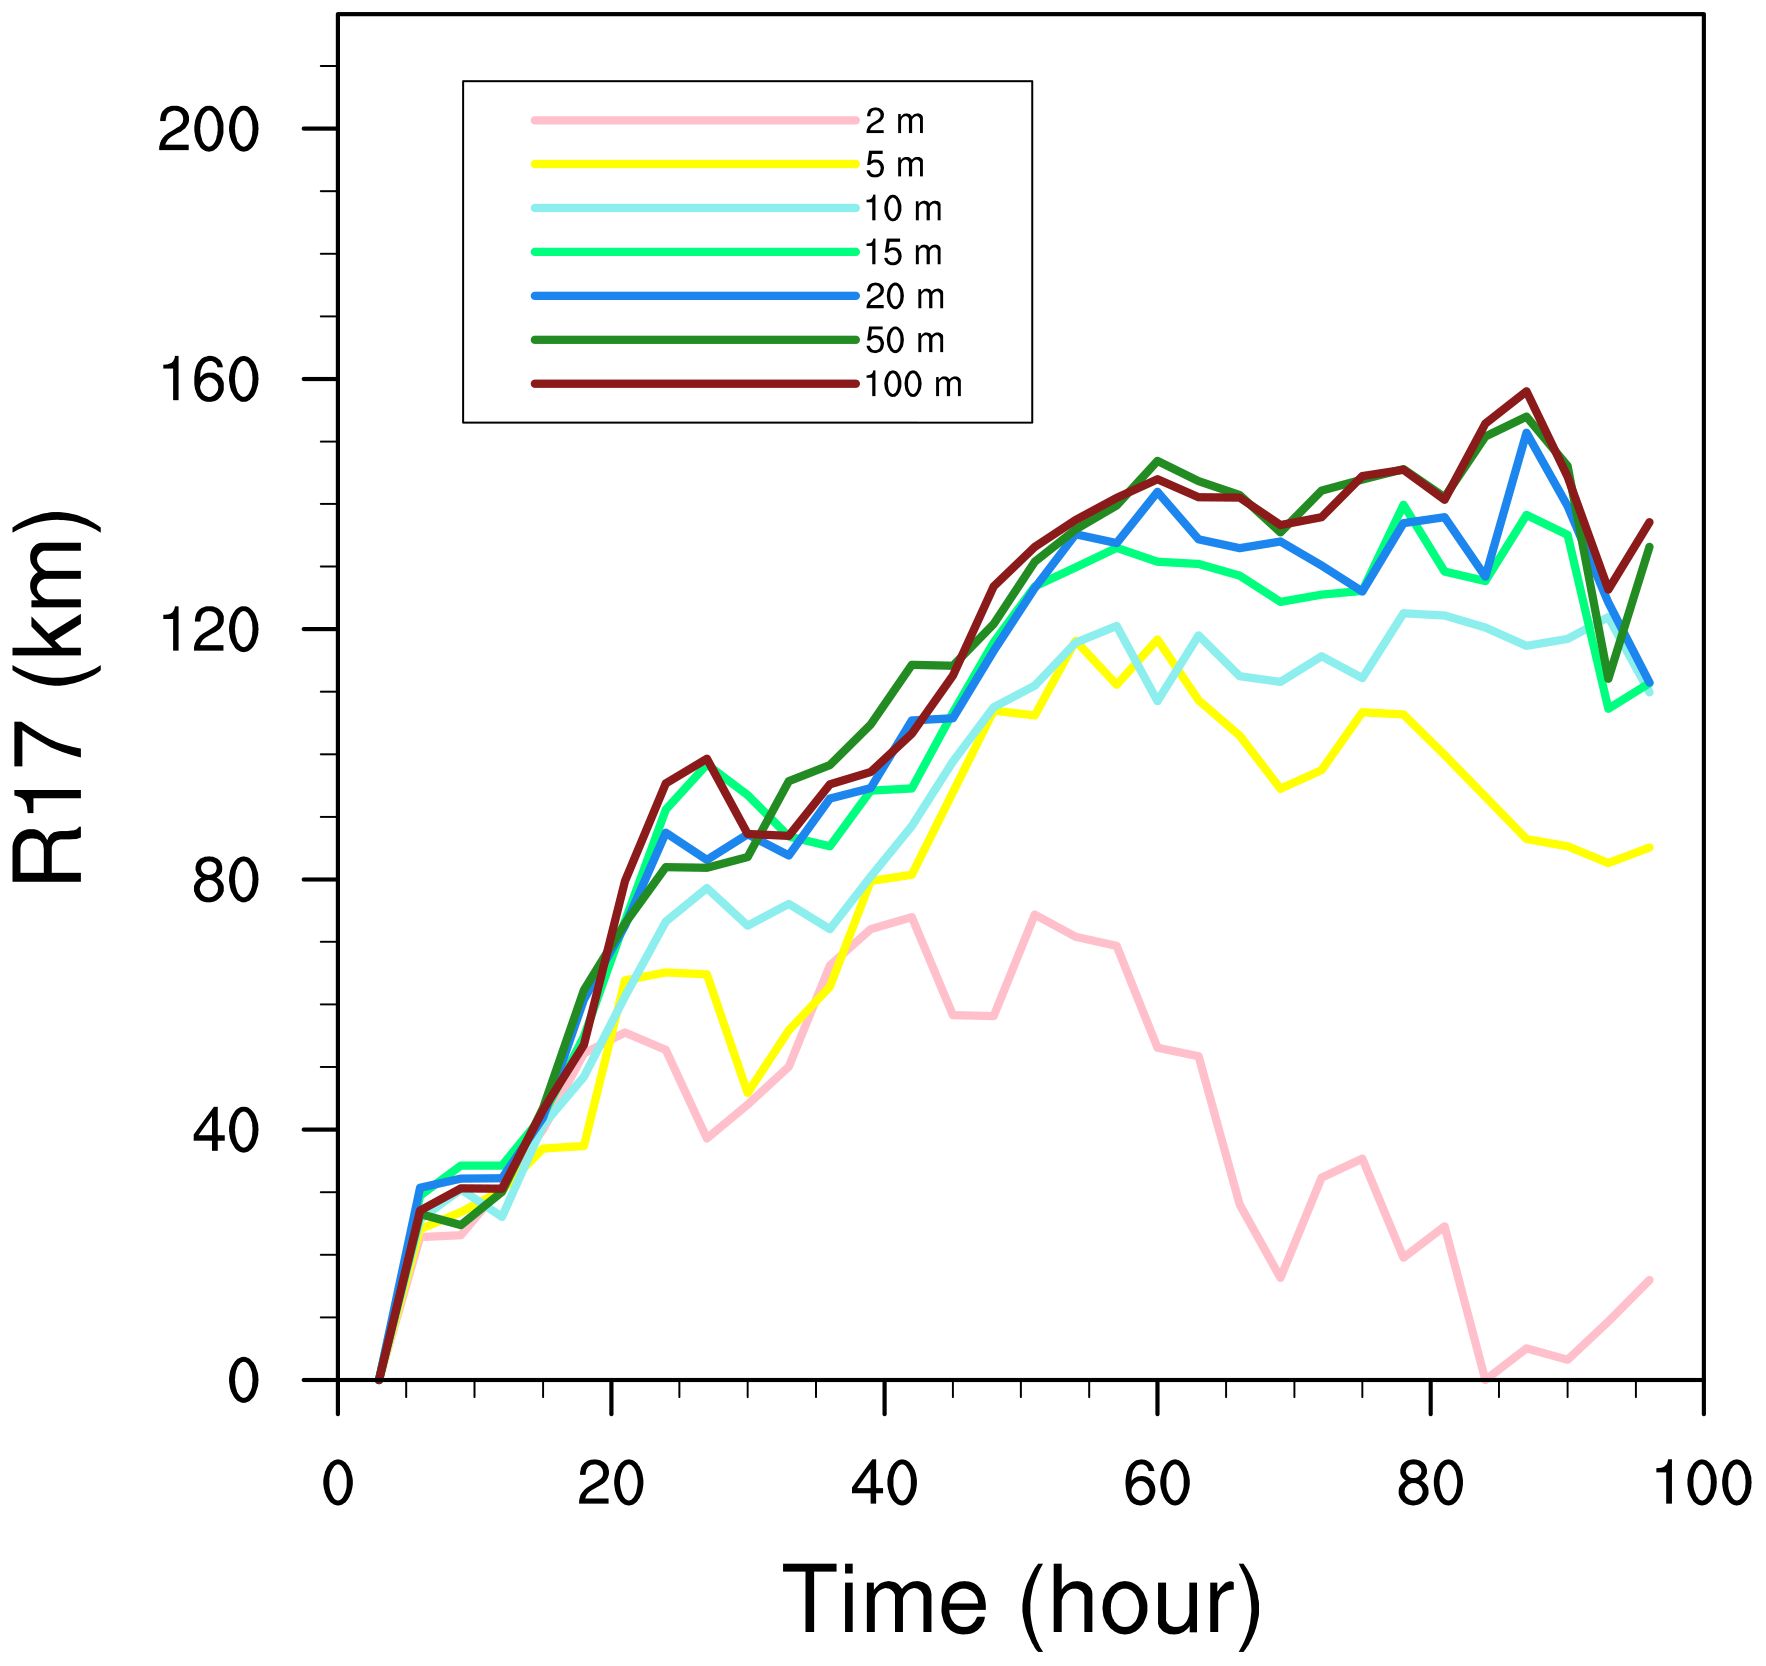
Figure 6 Time evolutions of R17 (km) in the seven OMLD experiments. Pink, yellow, blue, green, navy blue, forest green, and dark red lines indicate the tracks from E2m, E5m, E10m, E15m, E20m, E50m, and E100m, respectively.
3.5 Destructiveness of TC
Compared to TC intensity and size, the public is more concerned with the destructiveness of TC (Emanuel, 2005; Sun et al., 2017; Xu et al., 2020; Busireddy et al., 2022). Emanuel (2005) defined the power dissipation index (PDI) as the sum of the cube of MWS during the lifetime of the TC, which is widely used to assess the destructive potential of TCs (Wolf, 2020; Zhang et al., 2020; Mohapatra and Sharma, 2021). However, the PDI does not adequately reflect the destructive potential of TCs as it neglects TC size. In contrast, the destructive potential considering TC size (PDS) is calculated over an area occupied by gale-force (>17 m s−1) wind near the TC and over the TC lifetime. The PDS is given by Equation 1:
where ρ is surface air density, CD is surface drag coefficient, |V| is the magnitude of 10-m wind, A0 is the area of gale-force wind, and τ is the lifetime of TC. It reflects the total power of gale-force wind dissipated by the TC over its lifetime.
Figure 7 presents the calculated TC PDS in the seven experiments. Similar to the results of TC intensity and size, there is also an OMLD threshold of 15 m as the PDS increases notably (slightly) with OMLD when OMLD is ≤ (>) 15 m. Specifically, when the OMLD increases from 2 to 5 m, due to substantial changes in TC intensity and size, the PDS in E5m experiences a sharp increase, growing by 325.2% compared to that in E2m. The TC PDS in E10m (E15m) is increased by 58.2% (50.0%) compared to that in E5m (E10m). As the OMLD increases beyond 20 m, the growth variation is gradually saturated, with the PDS in E50m (E20m) increasing by only 14.9% (15.5%) compared to that in E20m (E15m). Moreover, the PDS in E100m increases by 6.9% compared to that in E50m. Thereby, the TC activities (i.e., TC intensity, size, and destructiveness) are highly sensitive to changes in OMLD smaller than 15 m.
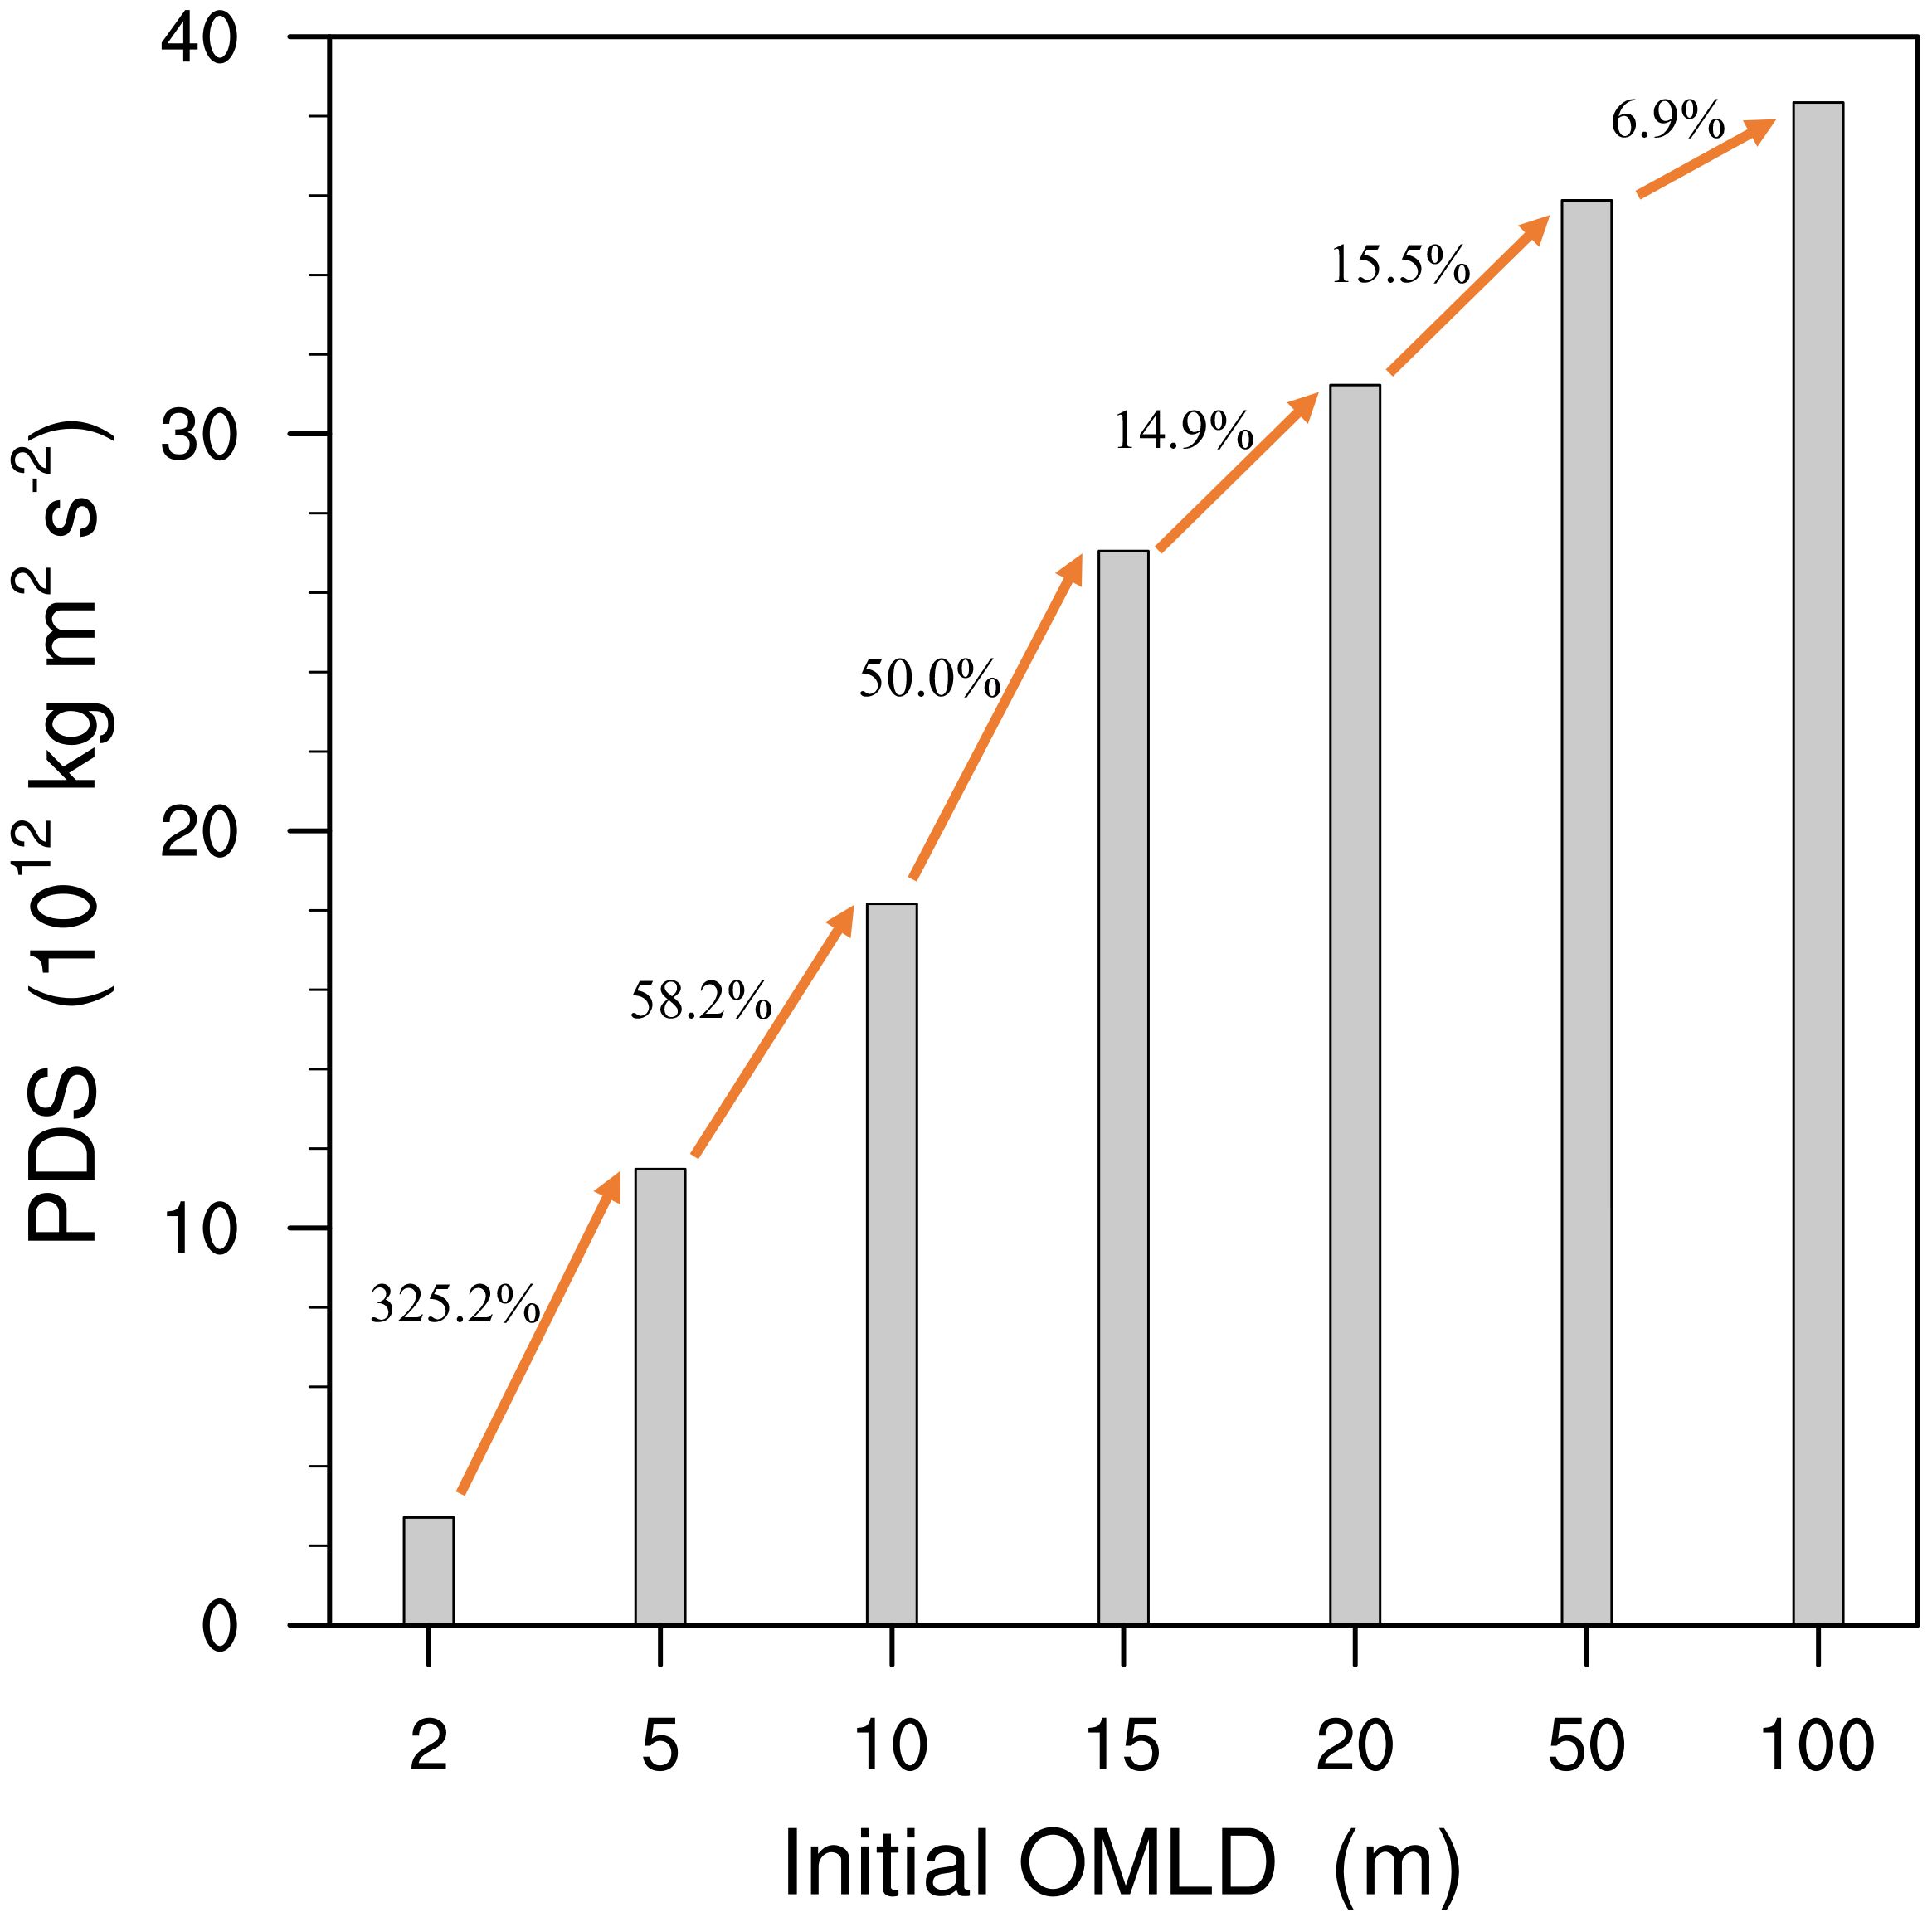
Figure 7 Calculated TC size-dependent destructive potential in the seven experiments with different initial OMLDs (1012 kg m2 s-2). The annotated values indicate the percentage increase of PDS with initial OMLD.
4 Physical mechanisms
4.1 Response of SST to OMLD in view of “cold wake effect”
In this study, despite identical initial SST settings in all seven experiments, the SST shows evident differences under different OMLDs after several hours of integration due to the stirring effect of the TC on the upper ocean. After 72 hours of integration, both SST and SEF are the minimum (maximum) in E2m (E100m) (Supplementary Figure S5). SST and SEF gradually increase notably with OMLD increasing from 2 to 15 m, but the increases in SST and SEF become smaller when the OMLD exceeded 15 m, especially when OMLD increases from 50 to 100 m (Supplementary Figure S5). Results on SST radial distribution in TC mature period further show that the SST increases with OMLD and is close to the initial SST. Specifically, in the TC mature period, the SSTs in E50m and E100m are close to the initial values, but the SSTs in the other five experiments evidently decrease, especially in the experiments with small OMLDs (e.g., E2m and E5m) (Supplementary Figure S5A).
Figure 8 illustrates the changes in SST after 72 hours of integration in each experiment. A marked SST reduction is observed in the TC’s wake, where ocean currents diverge, known as the “cold wake effect” induced by the TC (Jaimes and Shay, 2009; Jaimes and Shay, 2015). The “cold wake effect” in E2m (E100m) is the largest (smallest). Note that the “cold wake effect” does not decrease monotonically with the increase of OMLD. The “cold wake effect” changes notably with the decrease of initial OMLD when initial OMLD is below 15m. However, as the OMLD increases from 15 to 100 m, the surface wind is not strong enough to upwell the water below the thick OMLD. As a result, the “cold wake effect” is imperceptible among the experiments with larger OMLDs (≥15 m), and the decrease in SST diminishes. Since the TC in this study can stir the seawater at a depth of 15 m (Figure 3), it becomes difficult for the TC to affect the SST through stirring once the OMLD exceeds this threshold. This is the critical reason for the existence of a sensitive range for TC activity in relation to OMLD in this study. In addition, the decrease of SST caused by “cold wake” contributes to the decreases of TC intensity and size. This in turn decreases sea-surface wind speed and leads to a weakening of the “cold wake effect”. This will eventually reduce the magnitude of TC intensity and size decreases, resulting in negative feedback between the change of TC activities (i.e., TC intensity and size) and the change of SST (i.e., cold wake effect). In fact, this negative feedback can partly offset but cannot inhibit the decreases of TC intensity and size caused by the strong “cold wake effect” in the small OMLD experiments.
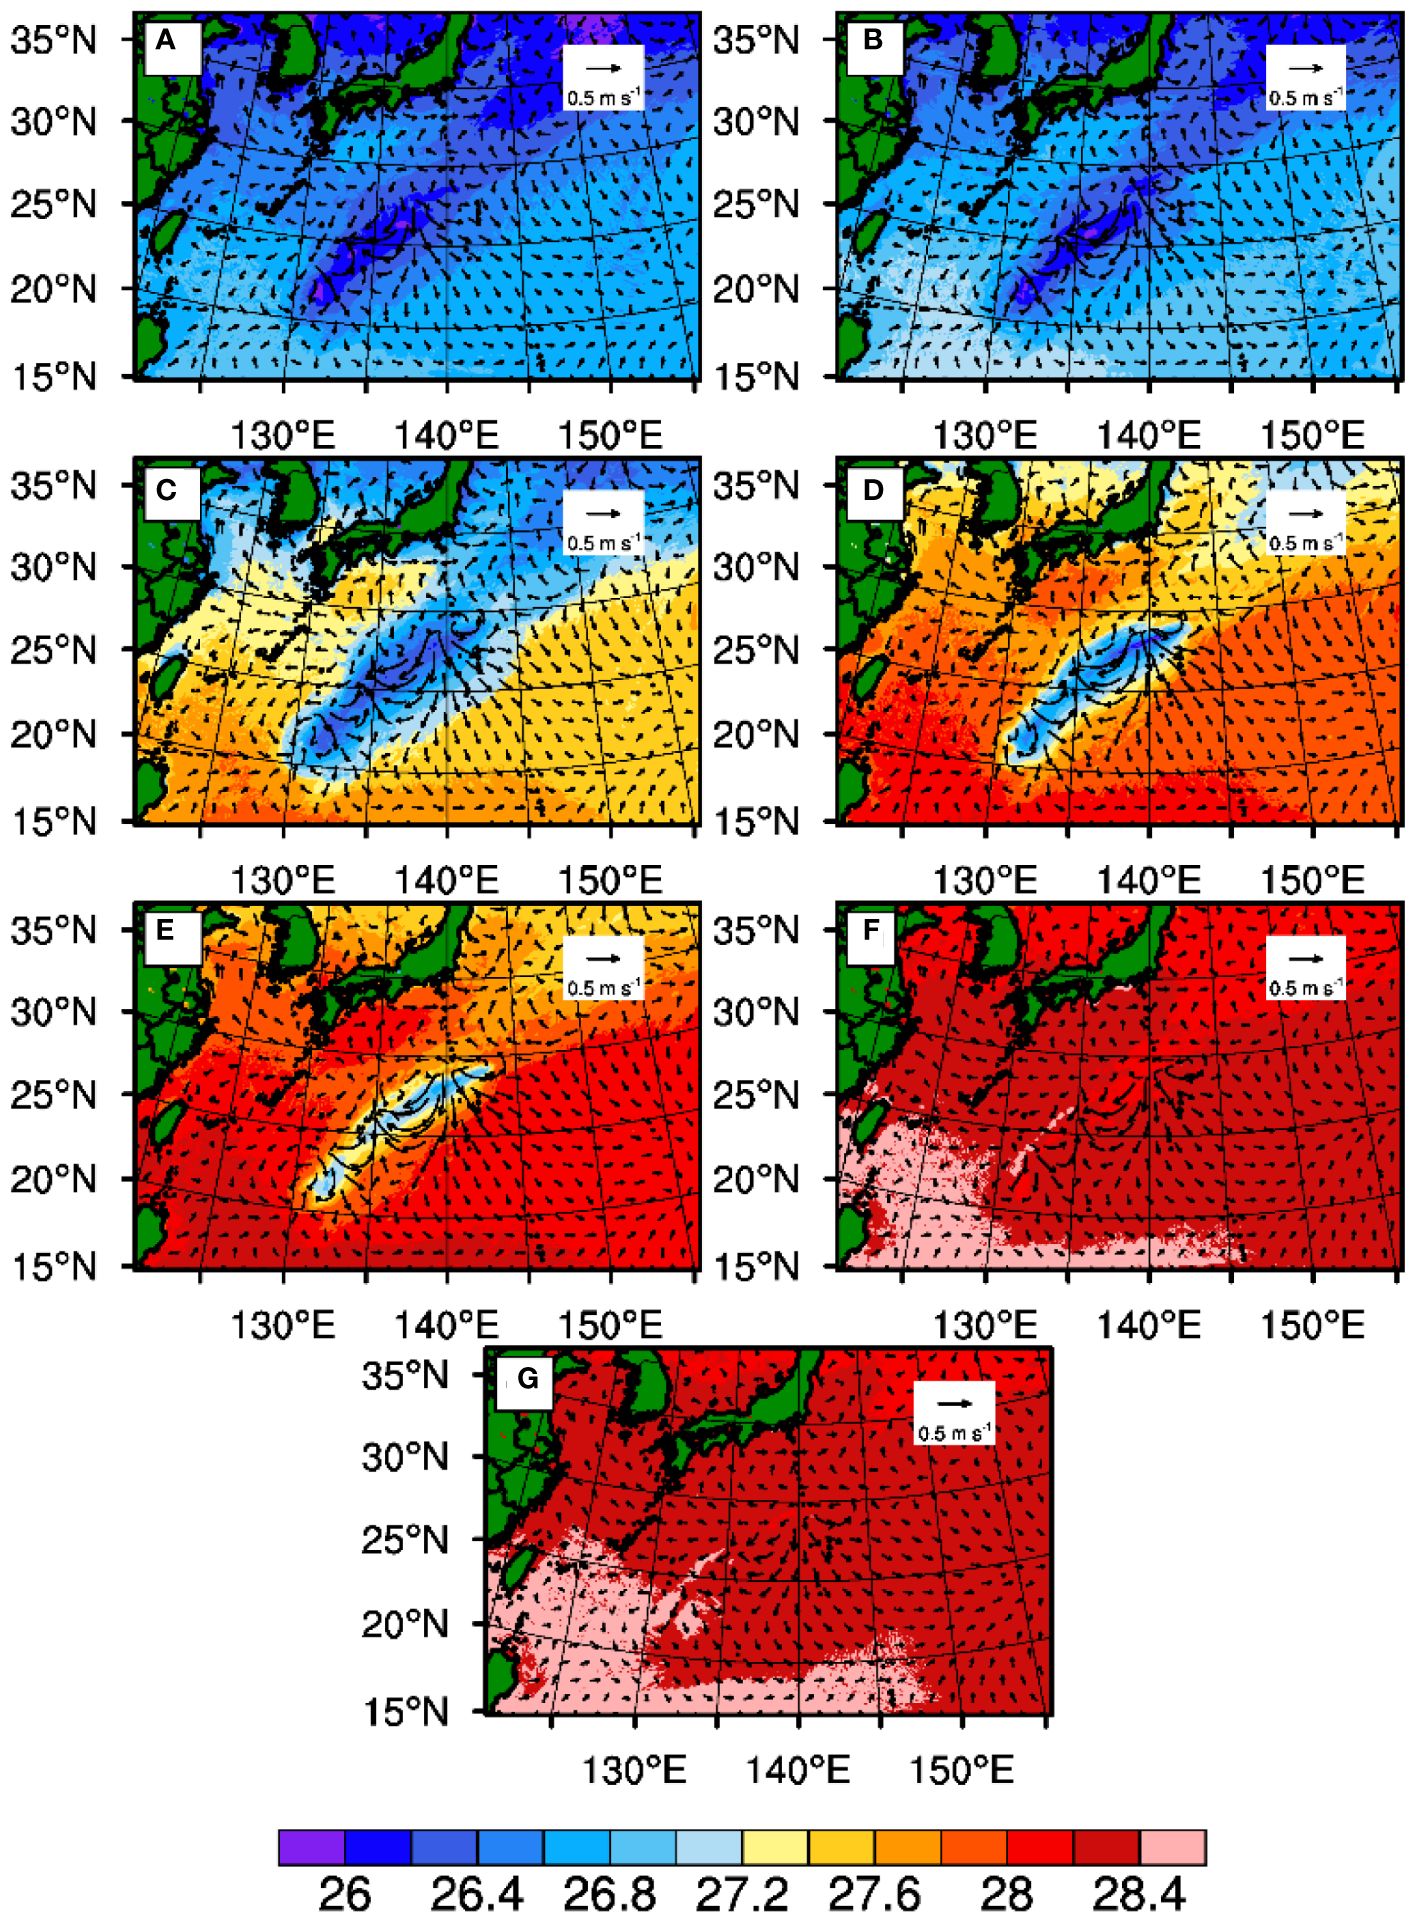
Figure 8 Simulated SST (contour; °C) and upper-ocean currents (vector, m s-1) after 72 hours of integration: (A) E2m; (B) E5m; (C) E10m; (D) E15m; (E) E20m; (F) E50m; and (G) E100m.
The SST of the surrounding region far away from the TC center shows a large difference after a period of model integration (i.e., Supplementary Figures S6; Figure 9). That is because weak surface wind can stir the shallow water (Supplementary Figure S1). Thereby, when the OMLD is small, weak surface wind can still cause an obvious decrease in SST despite the environmental SST being set up the same at the initial time as the other experiments. In E2m, due to the small OMLD, the SST is strongly affected by weak winds, and thus decreases notably in the nearly entire domain including the “cold wake” behind the TC. As the OMLD increases from 2 to 15 m, the weak wind outside the TC becomes weaker, which is not strong enough to upwell the water from below the OMLD; but the wind near the TC is still strong enough to upwell the deeper water. Thus, the SST difference between “cold wake” and its surrounding area is not the largest in E2m compared with those in the other experiments (e.g., E5m, E10m, E15m, and E20m). However, the difference of environmental SST is not the reason why the TC intensity in the small OMLD experiments is weaker than that in the large OMLD experiments. As suggested by Xu and Wang (2010a) and by Sun et al. (2014a), the environmental SST, which is far from the TC center, has a negative impact on TC intensity, namely the decrease of the environment SST contributes to the increase of TC intensity. Thereby, the difference in TC intensity is mainly attributed to the difference in SST near the TC (e.g., “cold wake”), rather than the difference in environmental SST among the OMLD sensitivity experiments.
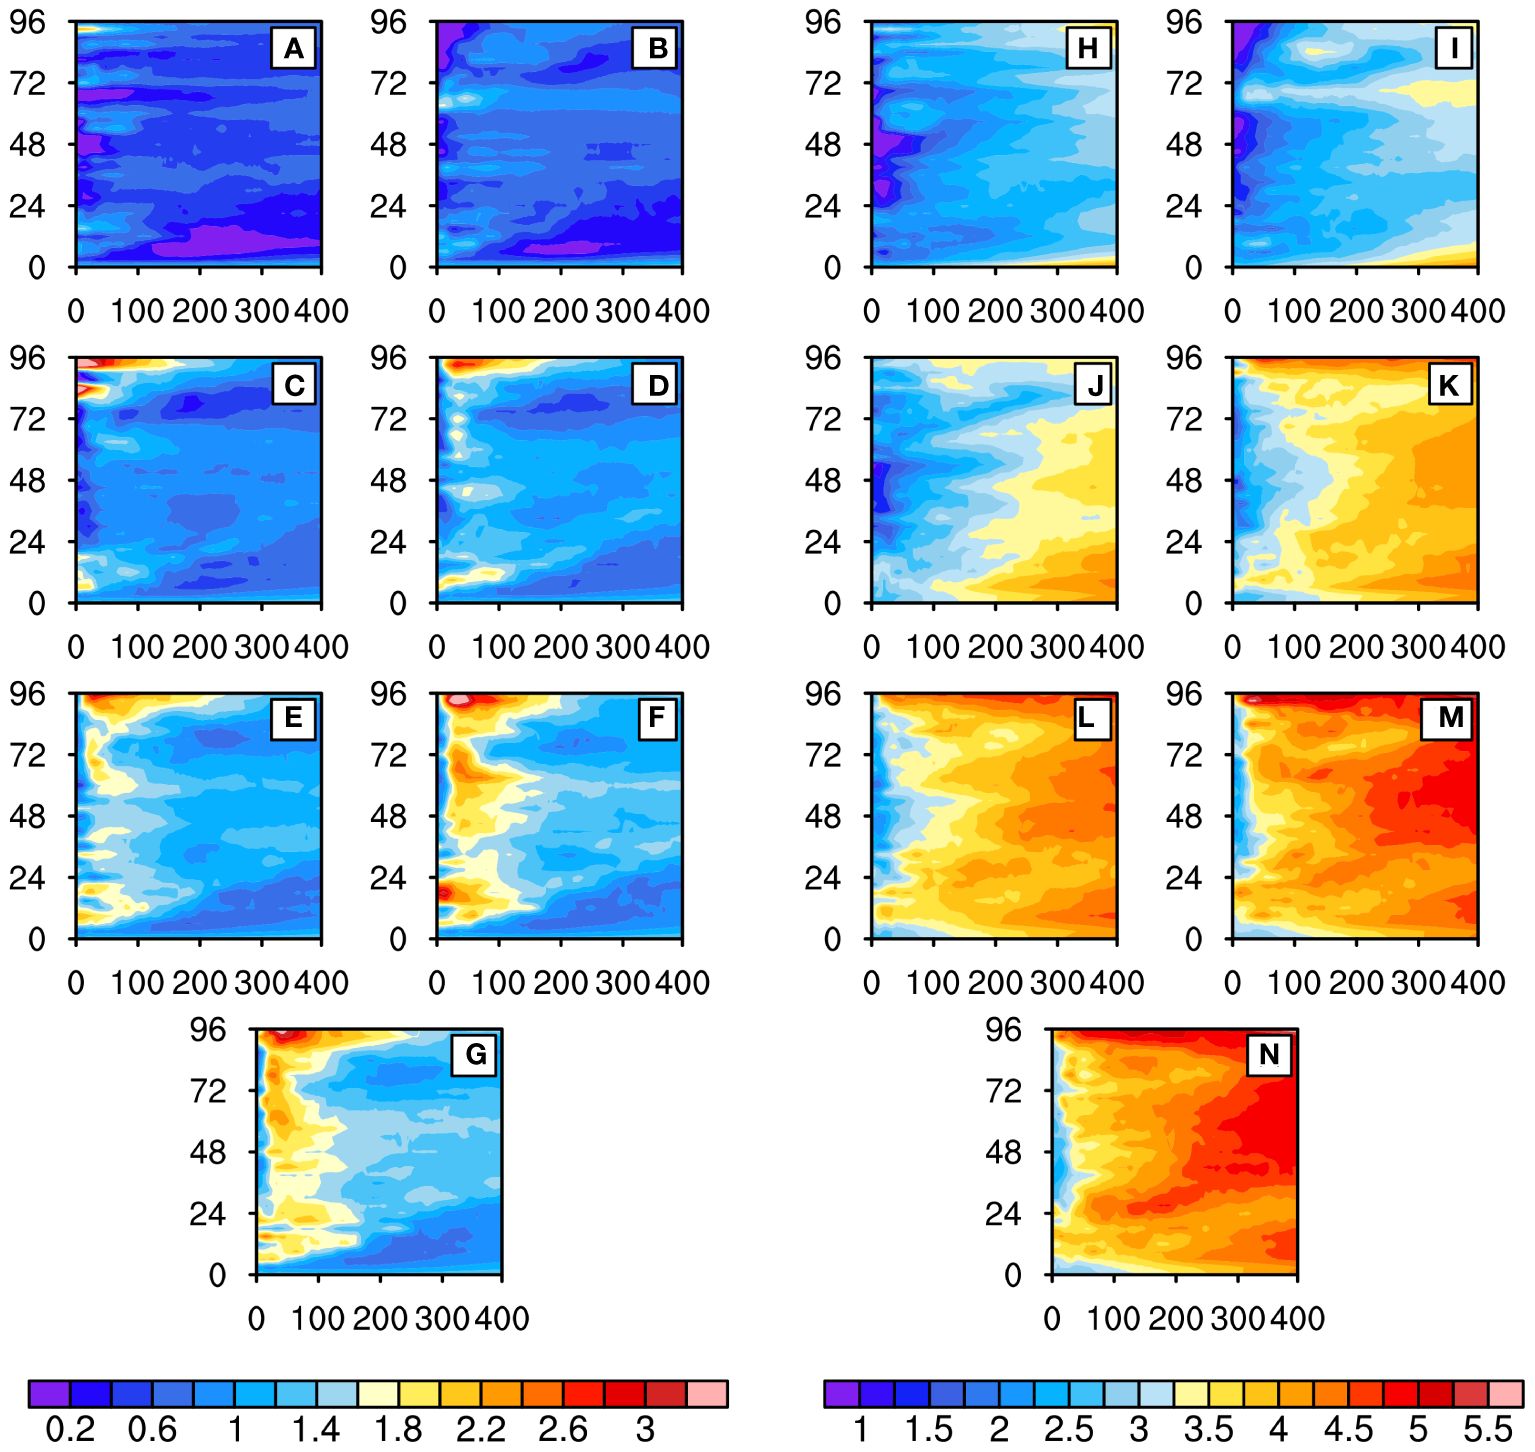
Figure 9 Hovmöller diagrams of azimuthally averaged ASTD (°C) and ASMD (103 g kg-1). The left panels are ASTD (A-G), and the right panels are ASMD (H-N). The horizontal axis represents radial distance (km), and the vertical axis represents time (hour): (A, H) E2m; (B, I) E5m; (C, J) E10m; (D, K) E15m; (E, L) E20m; (F, M) E50m; and (G, N) E100m.
4.2 Impact of OMLD in view of surface enthalpy flux
Previous studies showed that underlying SST transfers energy to TC through surface enthalpy flux (SEF) (Emanuel, 1986; Rotunno and Emanuel, 1987; Xu and Wang, 2010a). Thus, the key to understanding the impact of OMLD on SEF lies in comprehending the underlying mechanisms on how OMLD affects SST.
SEF is closely associated with SST, as SEF is the sum of SHF and LHF. Specifically, SHF is determined by the air-sea temperature difference (ASTD) and surface wind speed, and LHF is determined by the air-sea humidity difference (ASMD) and surface wind speed. ASTD is defined as the difference between the temperature at 2 m above the sea surface and SST; and ASMD is defined as the difference between the specific humidity at 2 m above the sea surface and the saturation water vapor pressure at the sea surface.
Generally, LHF is an order of magnitude larger than SHF, making ASMD the key in understanding the response of LHF and thus of SEF to changes in SST. Figure 9 shows the differences in ASTD and ASMD among the seven experiments. On one hand, in each experiment, ASTD is stronger at the eyewall and tends to expand outwardly over time; ASMD is stronger in the peripheral regions and tends to expand inward over time. This radial distribution difference of ASTD in various experiments is mainly due to the relatively high wind speed near the TC eyewall, which induces a strong evaporation effect, leading to a remarkable decrease in air temperature at 2 m and resulting in a large ASTD near the eyewall. The strong evaporation also leads to a remarkable increase in humidity, resulting in a smaller ASMD near the eyewall. As the TC develops, the growth rate of ASMD outside the eyewall exceeds that near the eyewall, which further increases the LHF outside the eyewall and causes the TC size to expand. On the other hand, ASTD and ASMD all increase with the increase in OMLD in the seven experiments. ASTD mainly depends on the air-sea temperature difference and surface wind speed, which are directly affected by changes in SST. ASMD mainly depends on the air-sea specific humidity difference, with SST being a direct determinant of sea-surface saturation water-vapor pressure. This indicates that SST is the direct cause of the differences in ASMD and ASTD among the experiments. The increase in OMLD leads to an increase in SST, which in turn leads to increases in both ASTD and ASMD. When the OMLD ≥ 15 m, the increase in SST with a thicker OMLD decreases, and the increases of ASMD and ASTD also become smaller (Figure 9).
Consistent with the changes in ASTD and ASMD, SEF gradually increases with the increase of OMLD (Supplementary Figures S5B; Figure 10). More SEF enters the TC eyewall, leading to a stronger TC. As the OMLD increases, the overall enhancement of SEF also tends to expand outward. Numerous studies showed that changes in SEF radial distribution contribute to changes in tangential wind, and thus TC intensity and size, namely the SEF near (outside) the eyewall favors the tangential wind near (outside) the eyewall, which contributes to the increase of TC intensity (size) (Miyamoto and Takemi, 2010; Xu and Wang, 2010a; Sun et al., 2013; Sun et al., 2014b). This provides an essential theoretical basis for explaining the increases in TC intensity and size as OMLD increases. In other words, as OMLD increases, the SEF near the TC eyewall gradually increases and expands outward, leading to increases in TC intensity and size, ultimately resulting in an increase in TC PDS.
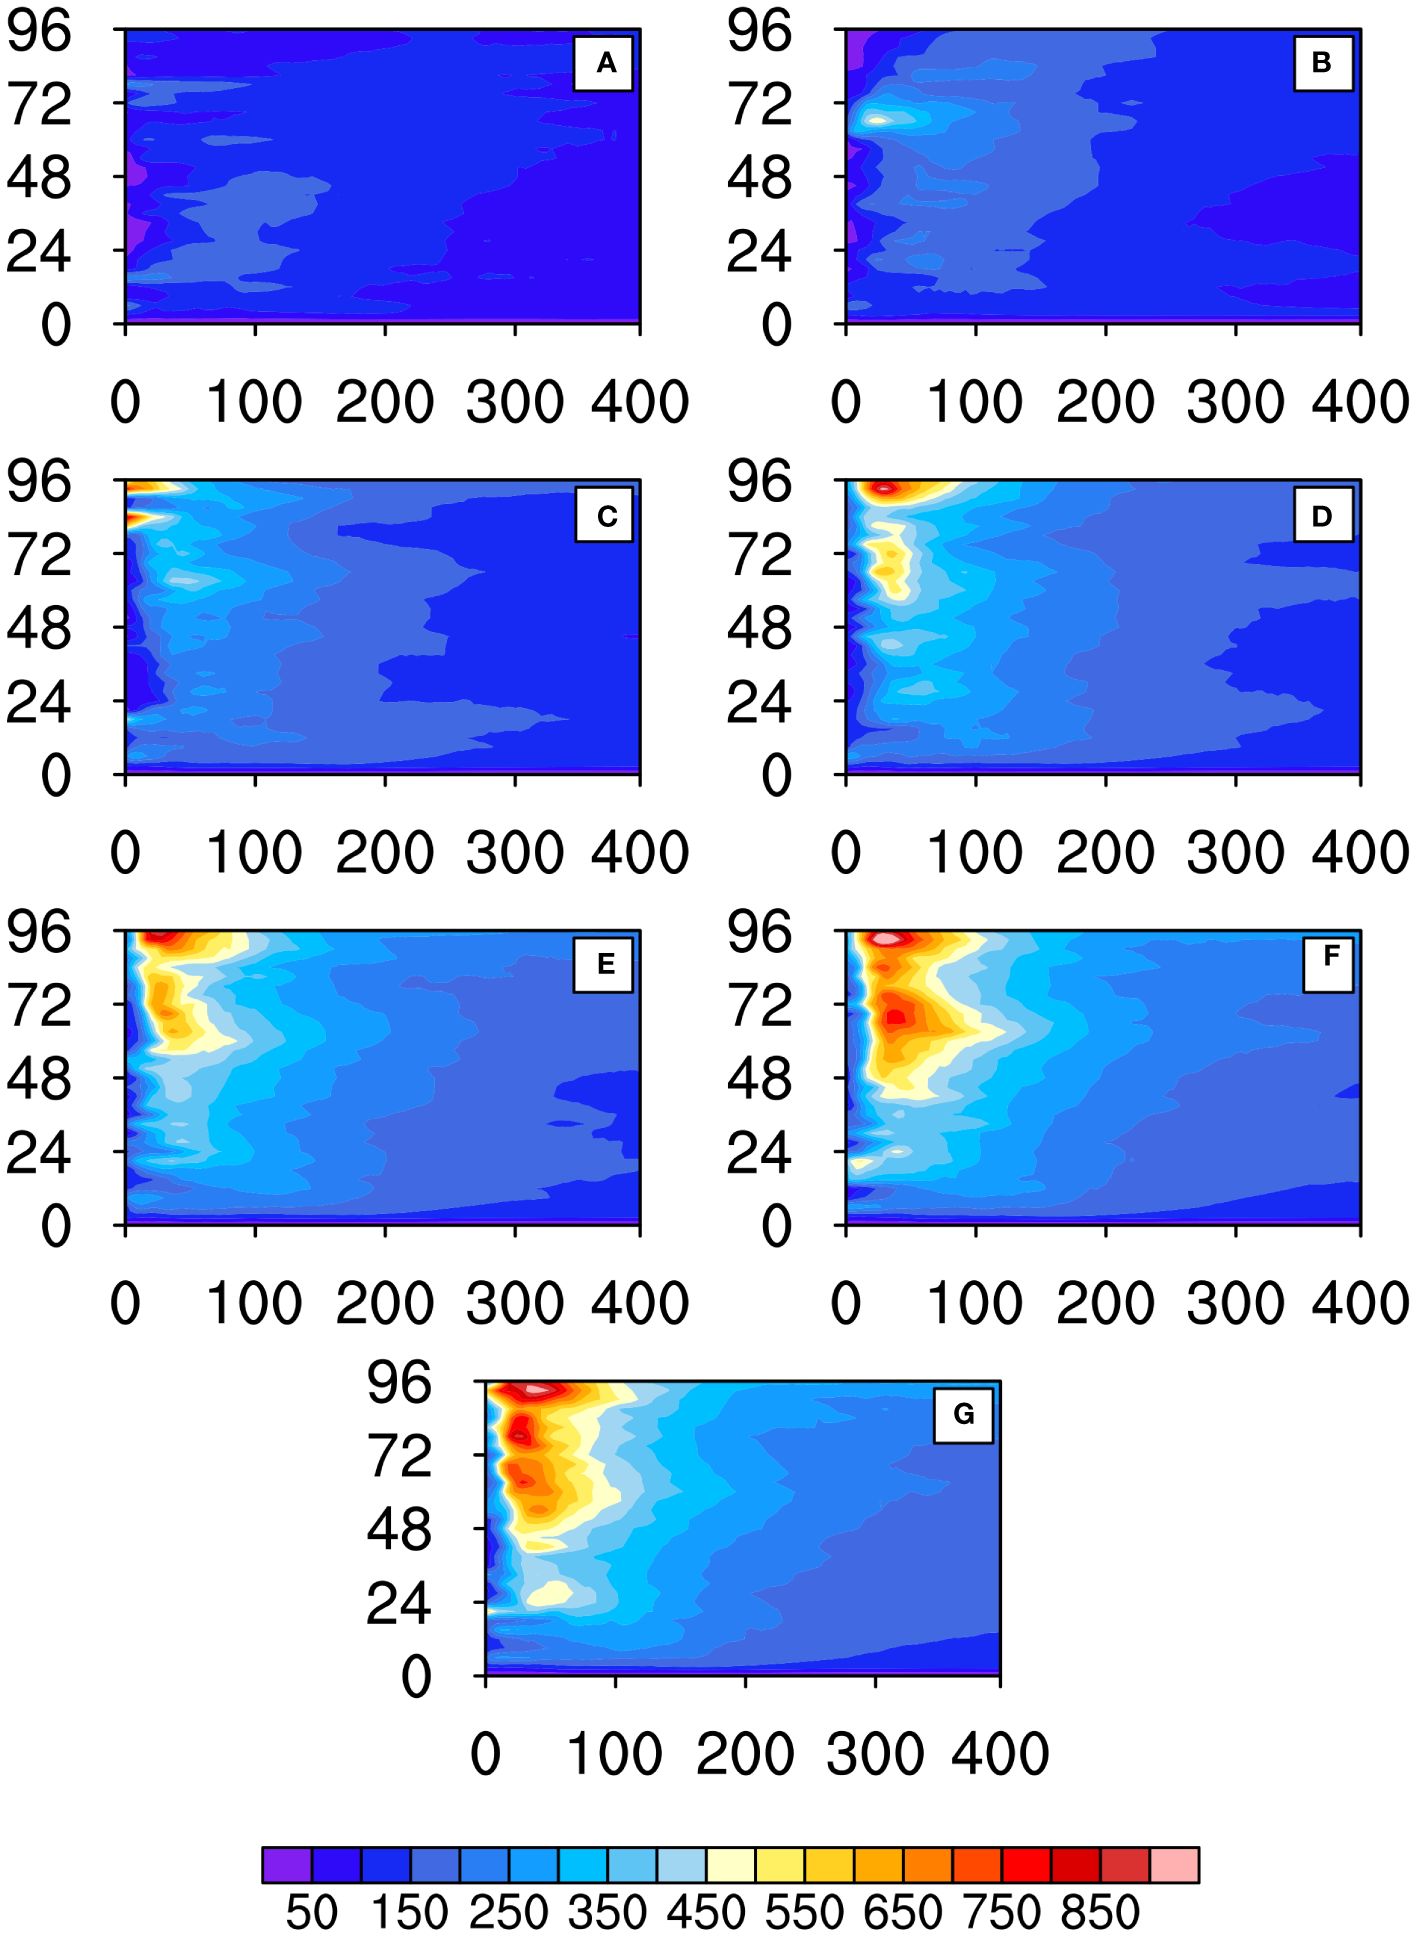
Figure 10 Hovmöller diagrams of azimuthally averaged SEF (W m-2): (A) E2m; (B) E5m; (C) E10m; (D) E15m; (E) E20m; (F) E50m; and (G) E100m. The horizontal axis represents radial distance (km), and the vertical axis represents time (hour).
4.3 Impact of SEF on TC activities in view of TC thermodynamic structure
Previous studies suggested that energy exchange between the ocean and atmosphere plays an important role in determining TC thermodynamic structure (e.g., Chen et al., 2010; Lee and Chen, 2012). In Section 4.1, we analyzed the differences in SEF among the seven experiments. These differences can lead to changes in TC intensity and size by altering TC’s thermodynamic structure. TCs gain most of their thermal energy through latent heat release (LHR) during condensation. Yanai et al. (1973) pointed out that the LHR near TC is proportional to the production of condensation. Here, we compare the differences in LHR among the seven experiments by comparing the sum of their liquid and solid condensations. Previous research demonstrated that besides the amount of LHR, the location of LHR also contributes greatly to TC intensity and size (Schubert and Hack, 1982; Hack and Schubert, 1986; Sun et al., 2014a). The LHR near the eyewall (within the spiral-rainband region) facilitates (hinders) TC intensification but hinders (favors) TC expansion (Sun et al., 2014a; Wu et al., 2021). Note that the spiral-rainband region is defined as the region outside the eyewall and within a radius of 200 km from the TC center, which is featured with spiral rainbands and strong wind. Figure 11 shows TC hydrometeor radial distributions during the mature period. Due to the higher wind speeds near the TC eyewall where water-vapor flux is also greater, the source of water vapor is relatively more abundant, which is conducive to LHR. This process contributes to the development of a warm core structure within the TC, thereby amplifying TC intensity. Additionally, the LHR heats up the entire atmospheric layer near the eyewall, causing a local decrease in pressure and an increase in the radial pressure gradient near the eyewall (Figure 12A), which in turn leads to an increase in TC wind near the eyewall and establishes positive feedback between SEF and TC wind near the eyewall. Moreover, the large differences in LHR among the seven experiments are primarily concentrated within a 200-km radius from the TC center (Figure 11); and the TC pressure gradient and wind speeds also show evident differences within this range (Figure 12). Namely as the OMLD increases, the LHR in TC also gradually increases, leading to gradual enhancements of both TC intensity in terms of TC wind near the eyewall and TC size in terms of R17. Note that both TC eyewall and R17 are within a radius of 200 km from the TC center in the seven experiments (Figure 12B). Besides the thermodynamic structure of TC, SEF, which is closely related to OMLD, can also affect TC activities through its impact on TC’s dynamic structure.
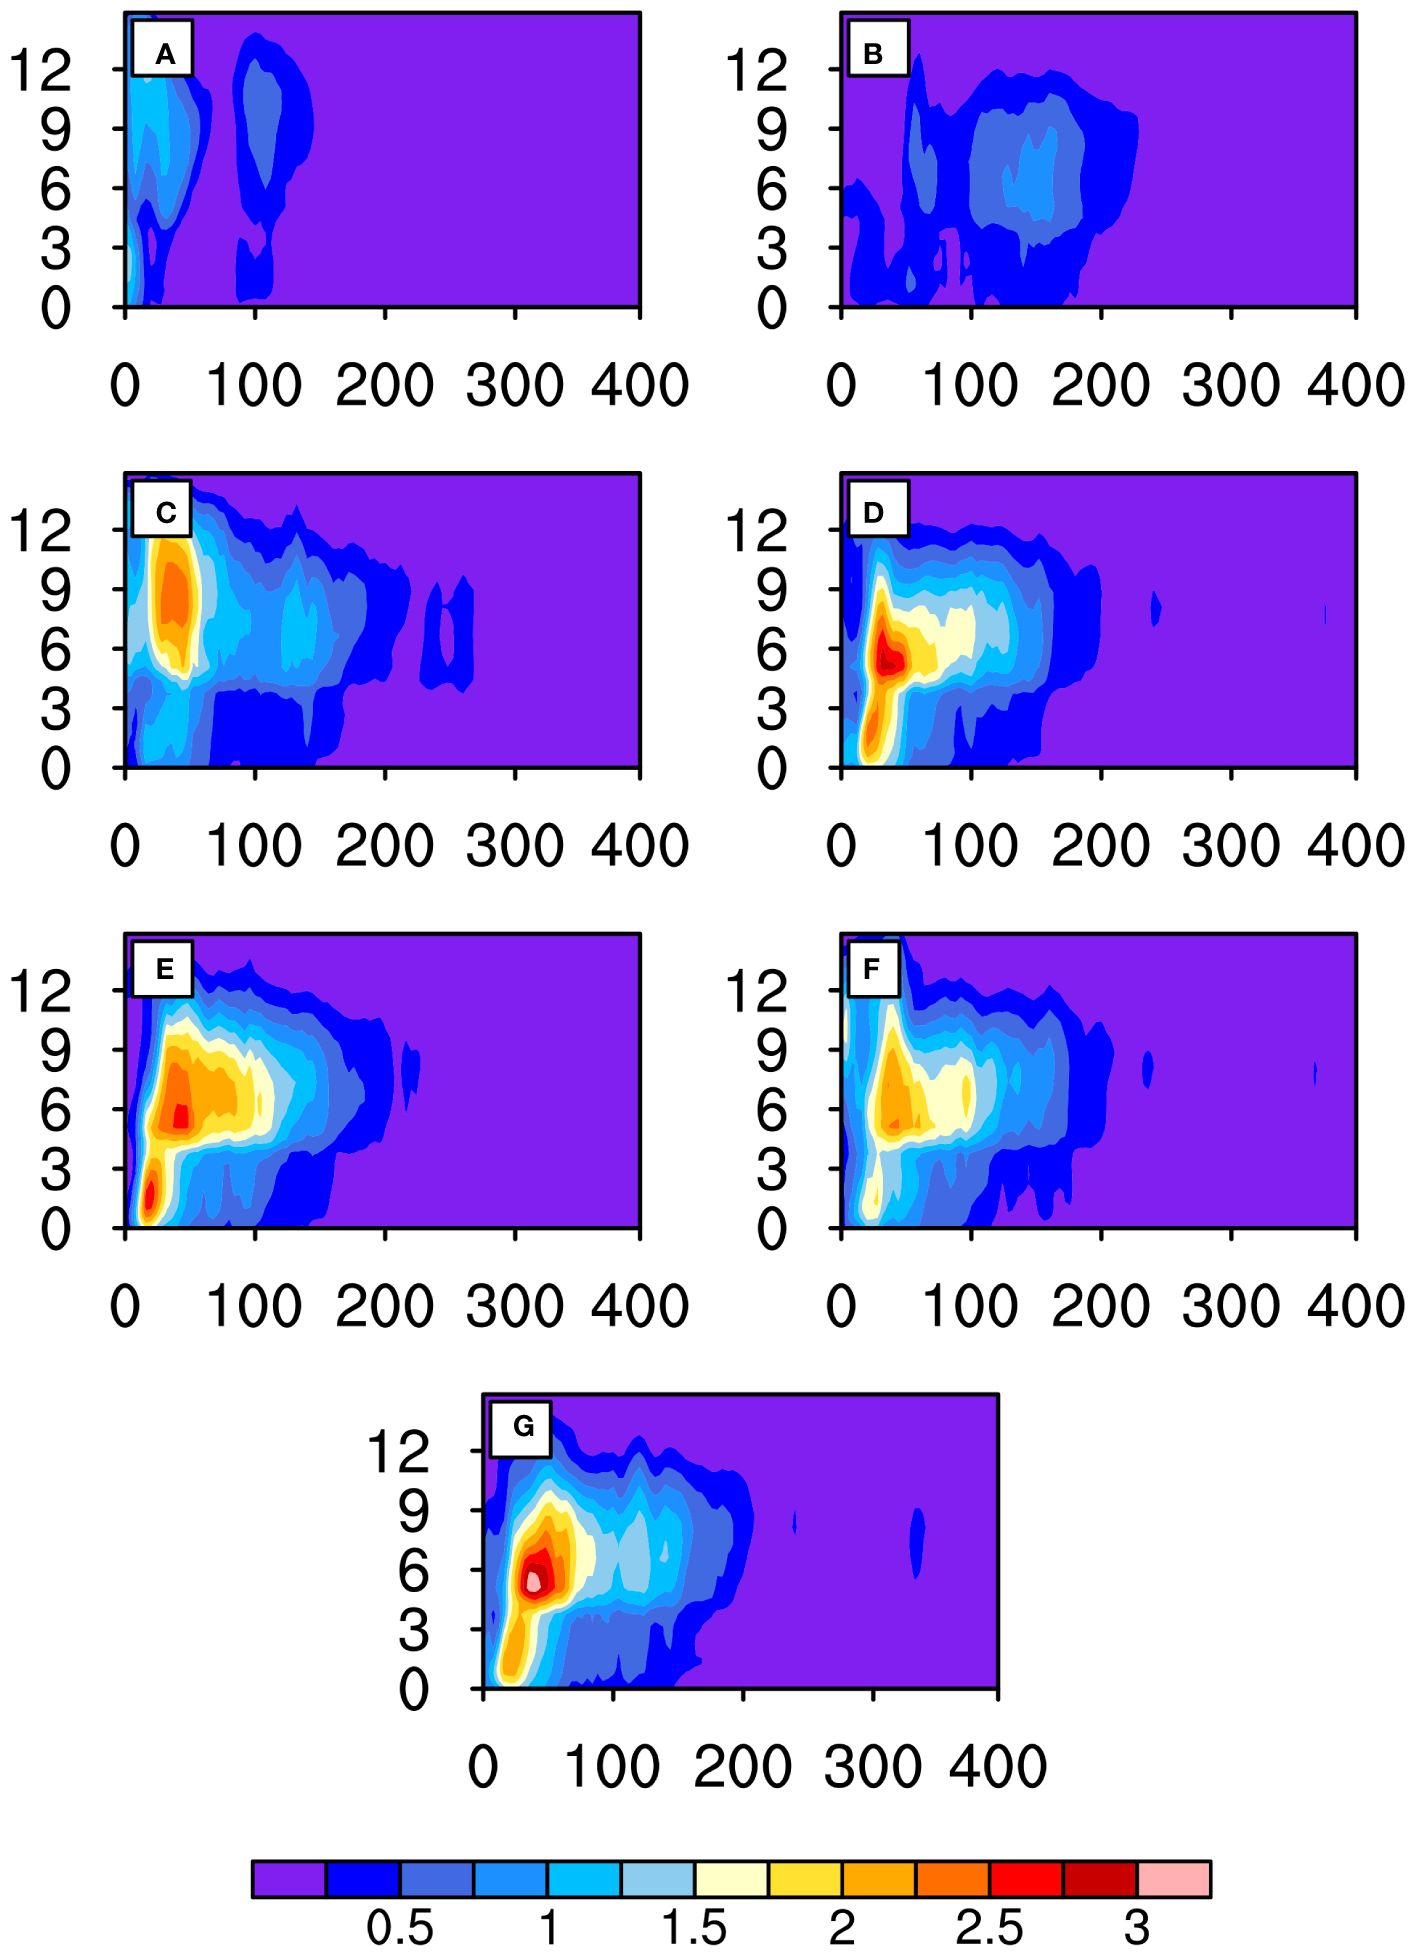
Figure 11 Azimuthally averaged hydrometeor (kg kg-1) radial distribution (TC mature period): (A) E2m; (B) E5m; (C) E10m; (D) E15m; (E) E20m; (F) E50m; and (G) E100m. The horizontal axis represents radial distance (km), and the vertical axis represents height (km).
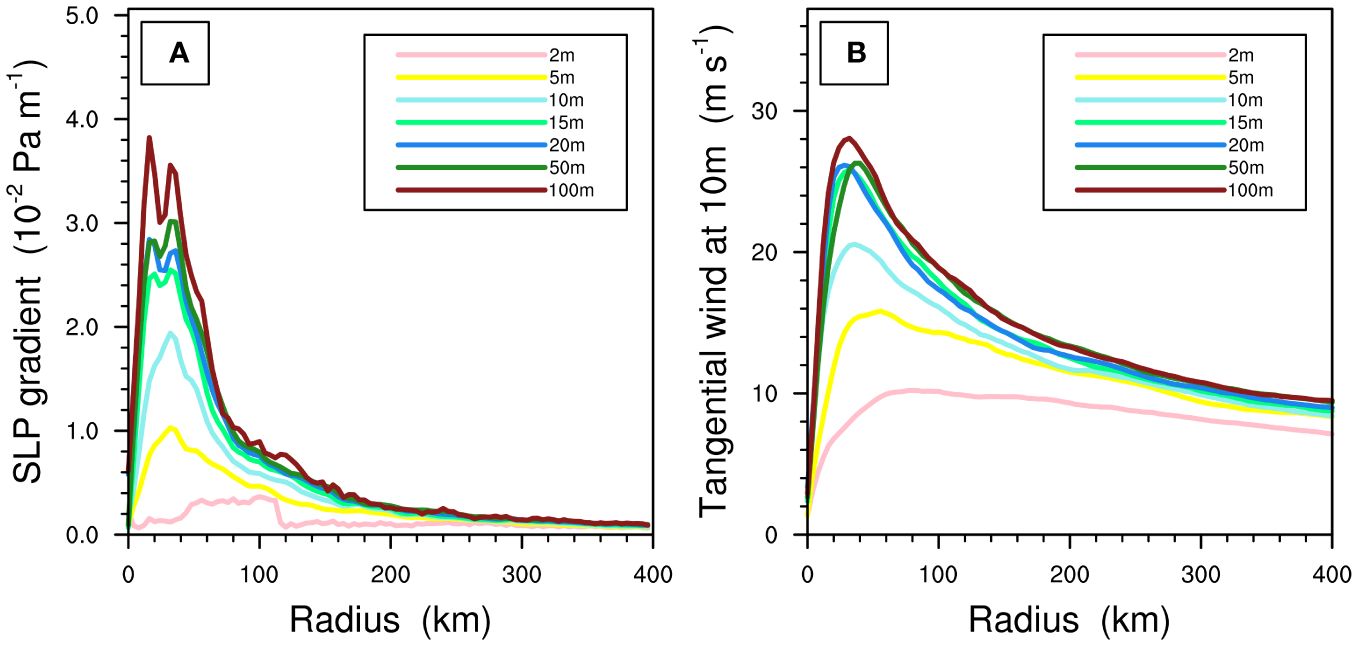
Figure 12 Azimuthally averaged radial distribution of (A) SLP gradient (10-2 Pa m-1) and (B) tangential wind at 10 m (m s-1) in TC mature period. The TC mature period is defined as simulation time from 72 to 84 h. Pink, yellow, blue, green, navy blue, forest green, and dark red lines indicate the tracks in E2m, E5m, E10m, E15m, E20m, E50m, and E100m, respectively.
4.4 Impact of SEF on TC activity in view of TC dynamic structure
To analyze the impact of OMLD-induced SEF change on TC dynamic structure and thus TC intensity and size, we perform momentum budget analysis. As in Xu and Wang (Xu and Wang, 2010a, b), the budget equations for the azimuthally averaged radial and tangential winds can be approximated by
and
where t is time; z is height; r is radius; f is the Coriolis parameter; , , and are azimuthally averaged radial and tangential winds, and vertical velocity, respectively; is azimuthally averaged absolute vertical vorticity; and are air density and pressure, respectively; , , , and are the deviations of radial, tangential, vertical winds, and vertical relative vorticity azimuthally averaged, respectively; and are parameterized subgrid-scale vertical diffusions of radial and tangential winds (including surface fraction), respectively; and horizontal diffusions of radial and tangential winds, respectively.
We calculate momentum budget at the sea surface to investigate the possible causes for the changes in surface radial and tangential winds. Figure 13 shows the Hovmöller diagrams of azimuthally averaged absolute vorticity and radial wind at 10 m. As mentioned in Section 4.2, with the increase in OMLD, SEF and thus LHR of TC also increase in these experiments. The stronger LHR near the TC eyewall (in the spiral-rainbands region) heats up the lower atmosphere, causing a sharp (additional) increase in SLP gradient ( term) near the eyewall within a radius of 60 km from the TC center (in the spiral-rainband region within a belt of 60-200 km from the TC center) (Figure 12A). As suggested in Xu and Wang (Xu and Wang, 2010a, b), it is the change in the pressure gradient( term) that leads to the gradient wind imbalance ( term) and thus the change in the lower-level inflow, which further affects the radial distribution of tangential wind through (Equations 2 and 3). Equation (2) reflects the gradient wind imbalance. As suggested by Xu and Wang (2010a), the terms on the right-hand side in Equation (3) are contributions of radial advection (), vertical advections (), vertical diffusion (), eddy radial and vertical advections ( and ), and horizontal diffusion () to the local tendency of tangential wind (). Previous studies indicated that the contributions to the tangential momentum budget by eddy transport and horizontal diffusion in Equation (3) are negligible after the spin-up (Xu and Wang, 2010a, b; Yang et al., 2022). Yang et al. (2022) further showed that contributes positively to the tangential wind in the boundary layer, while and have negative contributions. Due to space limitation, we do not provide systematic analysis of the budget analysis for every term. Instead, we pay more attention to the terms associated with SST. In Equation (3), OMLD-induced SEF change can influence radial wind (), and thus , which results in the change of TC intensity in terms of TC tangential winds (). In contrast, no significant relationship between vertical advection () and SST was found.
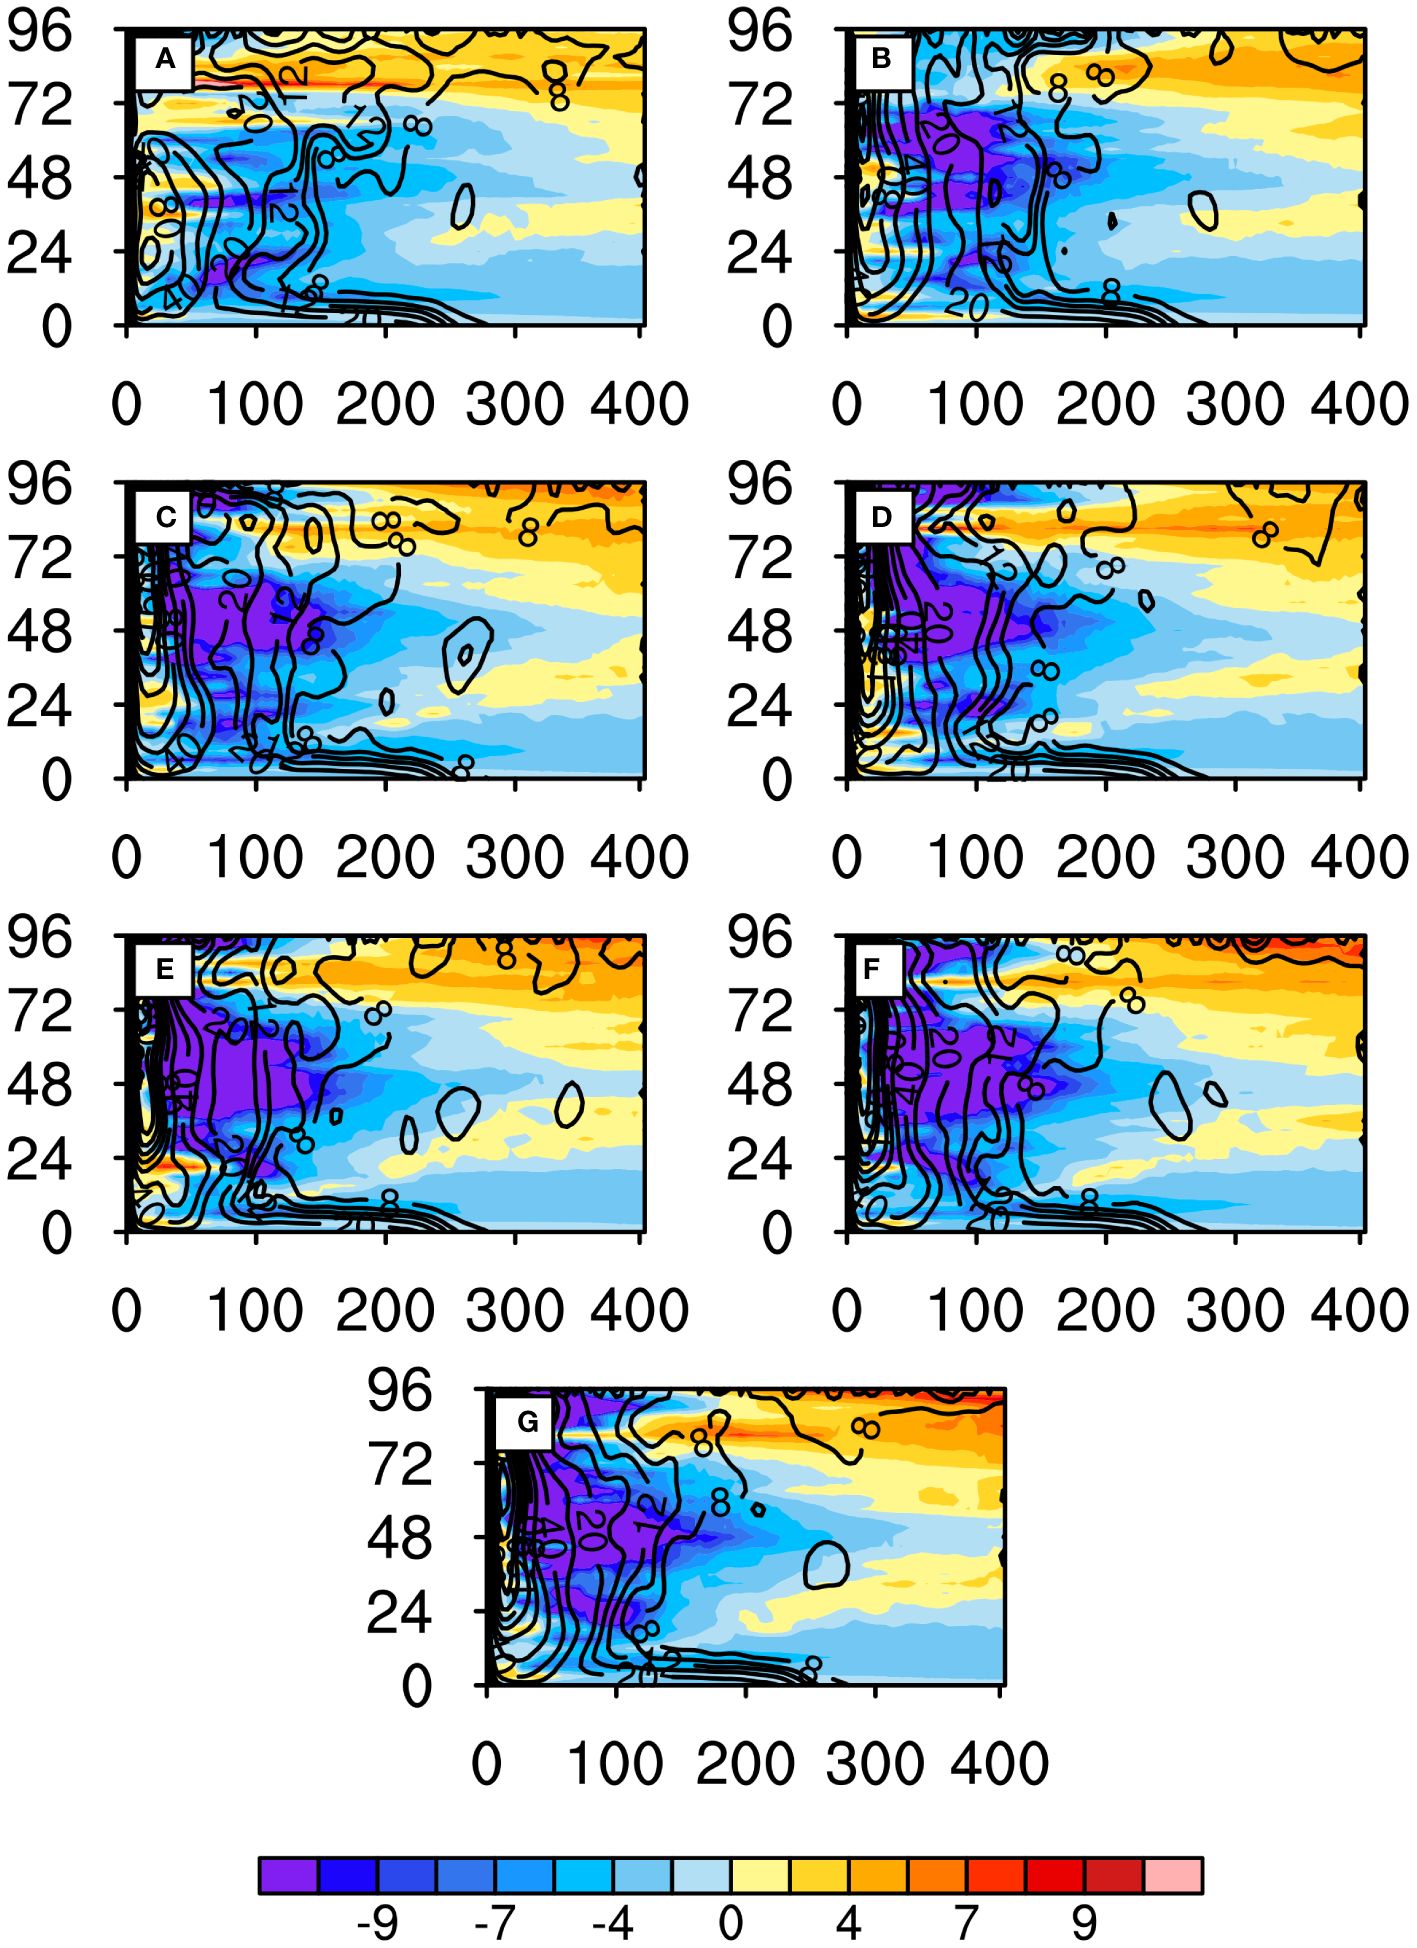
Figure 13 Hovmöller diagrams of azimuthally averaged absolute vorticity (; 10-3 s-1; shading) and radial wind (; m s-1; contour) at 10 m: (A) E2m; (B) E5m; (C) E10m; (D) E15m; (E) E20m; (F) E50m; and (G) E100m. The horizontal axis represents radial distance (km), and the vertical axis represents time (hour).
The impact of LHR on the pressure gradient is not limited to the surface; its influence can extend to the height of the boundary layer containing the lower-level inflow (Sun et al., 2017). Following the increase of OMLD, the LHR increase facilitates the increase of the inward radial wind (i.e., inflow) within the boundary layer in Equation (2). The inflow tends to increase with a gradual outward expansion with the increase of OMLD (Figure 13). Moreover, the LHR is conducive to the development of convection and thus absolute vorticity. As the OMLD increases, the absolute vorticity within the TC eyewall increases (Figure 13). Together with the increase of the inflow, this can partly explain the increase of tangential wind near the eyewall and thus the increase of TC intensity according to Equation (3). However, the increase of absolute vorticity is less pronounced outside the eyewall (Figure 13). According to Equation (3), as the OMLD increases, despite of no evident absolute vorticity difference in the TC spiral-rainband region, the radial pressure gradient and thus the inward lower-level inflow increase, leading to an increase in tangential wind outside the eyewall. The increase in tangential wind, in turn, promotes the increase in spiral-rainband SEF, creating positive feedback loop that causes the outward expansion of TC wind and thus the increase of TC size. Therefore, due to the SEF increase caused by the increase of OMLD, the TC dynamic structure changes favoring the increases of both TC intensity and size, which eventually lead to an increase in TC PDS.
5 Conclusions and discussion
In this study, we conducted seven experiments using a high-resolution WRF model to investigate sensitivity of TC activities to OMLD change. Previous research focused more on the impact of SST on TC activities. However, owing to the interaction between TC and upper ocean, the ocean heat content related to OMLD is more important in affecting TC activities. Since most of the studies focused on the impact of OMLD on TC intensity, we pay more attention to the process and related physical mechanisms, namely how OMLD affects TC size and PDS. We find that OMLD exerts only a minor effect on TC track, aligning with previous findings. The analogous TC tracks in these experiments allow us to examine the sensitivity of simulated TC activities to OMLD changes in a comparable environment. Our results show that there is a threshold of OMLD (approximately 15 m) in terms of its impact on TC activities. Below the threshold, TC intensity, size, and PDS increase notably with the increase of OMLD; beyond this threshold, the increases of TC intensity, size, and PDS taper off, signifying a diminished impact of OMLD on TC activities. The threshold of OMLD can be considered as the maximum depth that TC wind can effectively influence the upper ocean. Thus, the OMLD threshold is largely determined by the surface wind speed and thus TC intensity, namely the OMLD threshold of a stronger (weaker) TC with high (low) surface wind speed is likely to be larger (smaller) than 15 m.
We systematically analyzed the mechanisms of OMLD impact on TC intensity, size, and PDS from the perspectives of SEF, thermodynamics, and dynamics. Figure 14 presents a schematic diagram summarizing the possible mechanisms involved over the western North Pacific. Despite of having the same initial SST, evident differences in SST are observed shortly after the initial time, due to the difference in “cold wake effect” among the experiments. Following the increase of OMLD, the increase in SST directly affects both ASMD and ASTD, leading to an increase in SEF. The increase in SEF alters the thermodynamic and dynamic structures of the TC, particularly LHR and tangential wind speed, both contributing to the increase in tangential wind. Near the TC eyewall, LHR is relatively strong and varies among the experiments, causing a local decrease in pressure and an increase in SLP gradient near the eyewall, which in turn strengthens the tangential wind and enhances TC intensity. Within the TC spiral-rainband region, the increase of SEF cannot be neglected, which directly affects the radial convergence and leads to an increase in tangential wind. The increase in spiral-rainband wind leads to an expansion of TC size. Moreover, there is a positive feedback mechanism between the tangential wind and SEF, which further strengthens the tangential wind, resulting in an increase in TC intensity in terms of MWS and TC size (measured by R17). Furthermore, the increases in TC intensity and size, especially the surge in spiral-rainband wind speed, also lead to an increase in PDS.
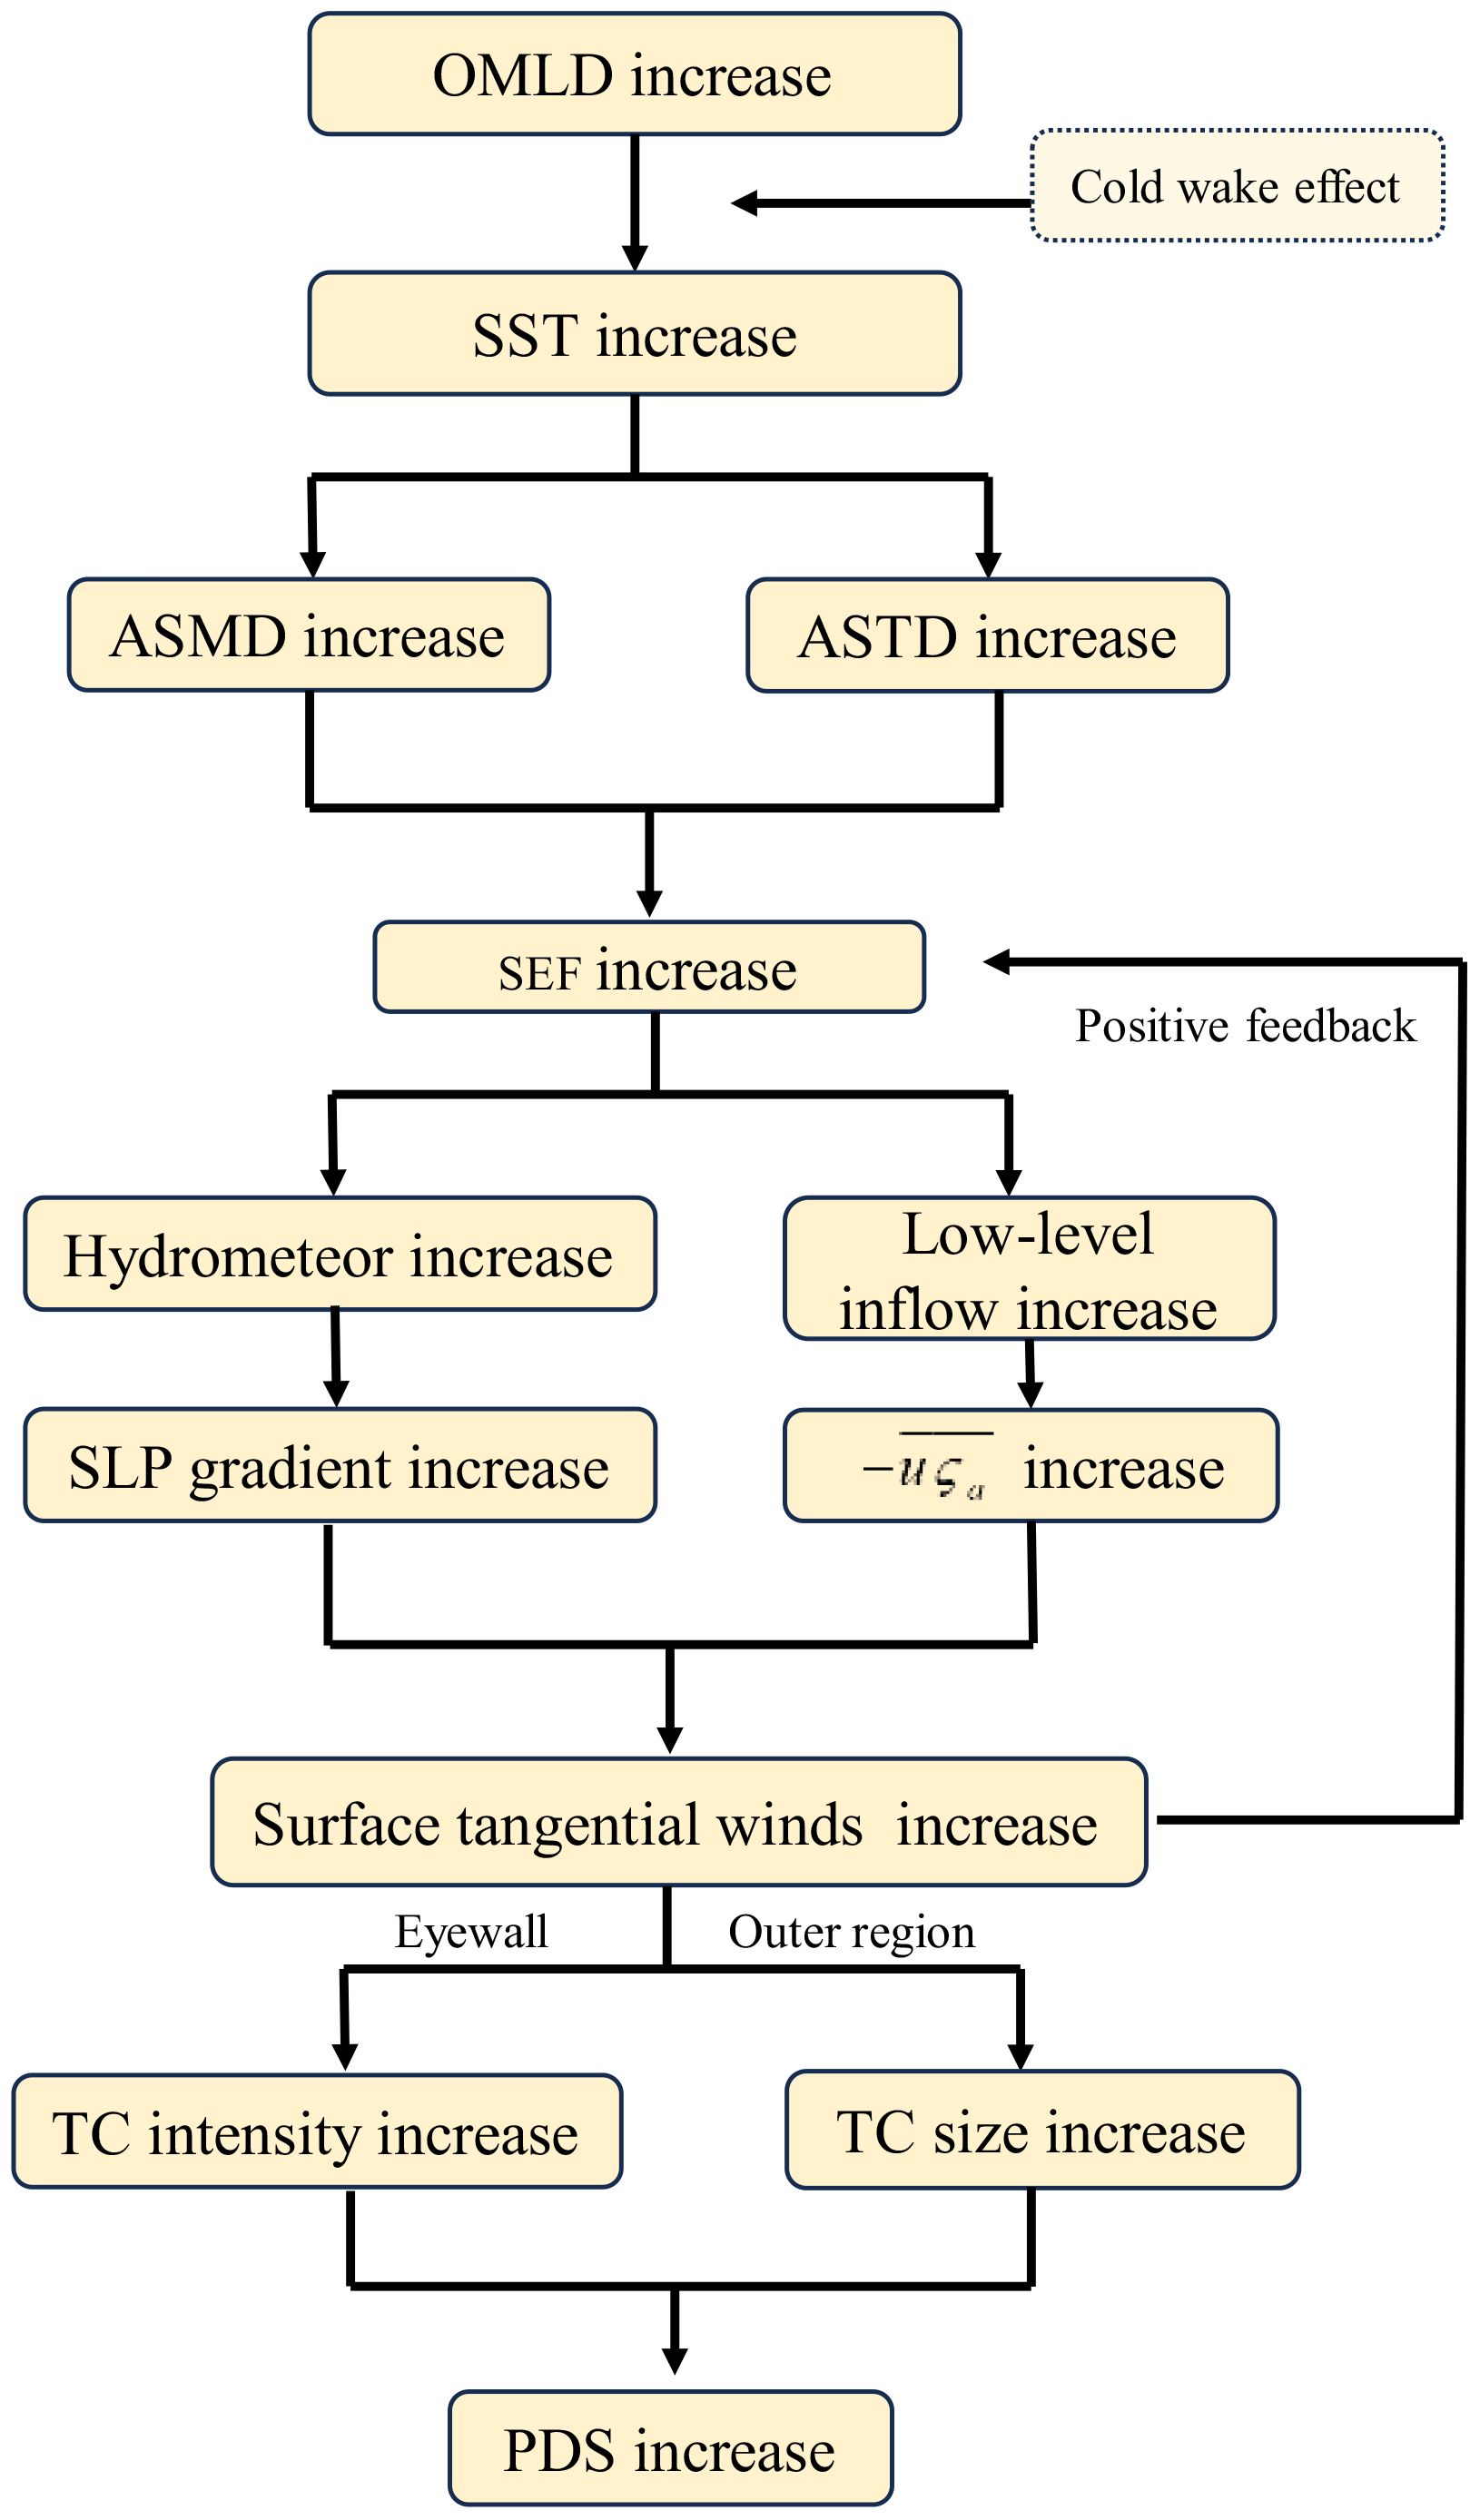
Figure 14 Schematic diagram summarizing the possible mechanisms responsible for the impact of OMLD on TC activities over the western North Pacific.
The results presented in this paper help our understanding of the changes of TC activities under a changing ocean environment. The western North Pacific, known for its frequent TC occurrences, often experiences successive TC passages. This study sheds light on possible changes of TC activities when a new TC follows the passage of a previous TC. Moreover, with ongoing global warming, the ocean heat content related to OMLD may also undergo changes (Xiao et al., 2019; Xia et al., 2021). This study also helps our understanding of the impact of OMLD changes on TC activities under global warming. Next, we will focus on consecutive TC passages, to validate the results of the experiments against observational data. We will further explore the impact of OMLD changes on TC activities under the global warming scenarios from the CMIP6.
It is important to note that the TC thermodynamic and dynamic processes were analyzed to reveal the physical mechanisms of the influence of OMLD, yet these processes interdependent rather than isolated. Moreover, although this is a case study, the derived conclusions may also be applicable to other regions or other types of TCs. Further validation with more observational data and simulated cases is required to substantiate these conclusions.
Data availability statement
The original contributions presented in the study are included in the article/Supplementary Material. Further inquiries can be directed to the corresponding author.
Author contributions
YZ: Conceptualization, Data curation, Formal analysis, Writing – original draft, Writing – review & editing. KH: Conceptualization, Methodology, Writing – review & editing. YS: Conceptualization, Formal analysis, Project administration, Writing – review & editing. YL: Conceptualization, Formal analysis, Writing – review & editing. PZ: Conceptualization, Writing – review & editing. XG: Conceptualization, Resources, Writing – review & editing. WZ: Conceptualization, Data curation, Writing – review & editing.
Funding
The author(s) declare financial support was received for the research, authorship, and/or publication of this article. This work is sponsored by the National Natural Science Foundation of China (Grants 42075035 and 42075011).
Acknowledgments
We thank Prof. Haishan Chen, Dr. Yixuan Shen, and Mr. Zhihao Feng for their valuable suggestions.
Conflict of interest
The authors declare that the research was conducted in the absence of any commercial or financial relationships that could be construed as a potential conflict of interest.
Publisher’s note
All claims expressed in this article are solely those of the authors and do not necessarily represent those of their affiliated organizations, or those of the publisher, the editors and the reviewers. Any product that may be evaluated in this article, or claim that may be made by its manufacturer, is not guaranteed or endorsed by the publisher.
Supplementary material
The Supplementary Material for this article can be found online at: https://www.frontiersin.org/articles/10.3389/fmars.2024.1395492/full#supplementary-material
References
Busireddy N. K., Reddy A. K., Osuri K. K., Niyogi D. (2022). Modelled impact of ocean warming on tropical cyclone size and destructiveness over the Bay of Bengal: A case study on FANI cyclone. Atmos. Res. 279, 1–11. doi: 10.1016/j.atmosres.2022.106355
Calvo-Sancho C., Quitián-Hernández L., Bolgiani P., González-Alemán J. J., Santos-Muñoz D., Martín M. L. (2023). Assessment of HARMONIE-AROME in the simulation of the convective activity associated to a subtropical transition using satellite data. Atmos. Res. 290, 106794. doi: 10.1016/j.atmosres.2023.106801
Chan J. C. L., Duan Y., Shay L. K. (2001). Tropical cyclone intensity change from a simple ocean–atmosphere coupled model. J. Atmos. Sci. 58, 154–172. doi: 10.1175/1520-0469(2001)058<0154:TCICFA>2.0.CO;2
Chen S., Campbell T. J., Jin H., Gaberšek S., Hodur R. M., Martin P. (2010). Effect of two-way air–sea coupling in high and low wind speed regimes. Mon. Weather Rev. 138, 3579–3602. doi: 10.1175/2009MWR3119.1
Cheng L., Zhu J., Sriver R. L. (2015). Global representation of tropical cyclone–induced short-term ocean thermal changes using Argo data. Ocean Sci. 11, 719–741. doi: 10.5194/os-11-719-2015
Dowdy A. J., Qi L., Jones D., Ramsay H., Fawcett R., Kuleshov Y. (2012). Tropical cyclone climatology of the South Pacific Ocean and its relationship to El Niño–Southern Oscillation. J. Climate 25, 6108–6122. doi: 10.1175/JCLI-D-11-00647.1
Ek M. B., Mitchell K. E., Lin Y., Rogers E., Grunmann P. (2003). Implementation of Noah land surface model advances in the National Centers for Environmental Prediction operational mesoscale Eta model. J. Geophys. Res. 108, GCP12–GCP11. doi: 10.1029/2002JD003296
Emanuel K. A. (1986). An air-sea interaction theory for tropical cyclone: Part I: Steady state maintenance. J. Atmos. Sci. 43, 585–604. doi: 10.1175/1520-0469(1986)043<0585:AASITF>2.0.CO;2
Emanuel K. (2005). Increasing destructiveness of tropical cyclones over the past 30 years. Nature 436, 686–688. doi: 10.1038/nature03906
Feng Z., Shi J., Sun Y., Zhong W., Shen Y. X., Lv S., et al. (2023). Impact of global warming on tropical cyclone track and intensity: A numerical investigation. Remote Sens. 15, 2763. doi: 10.3390/rs15112763
Gong D., Tang X., Chan J. C. L., Wang Q. (2022). Trends of Tropical Cyclone Translation Speed over the Western North Pacific during 1980–2018. Atmosphere 13, 896. doi: 10.3390/atmos13060896
Gray W. M. (1979). “Hurricanes: Their Formation, Structure and Likely Role in the Tropical Circulation,” in Meteorology over the Tropical Oceans, Royal Meteorological Society. Ed. Shaw D. B. (James Glaisher House, Grenville Place, Bracknell), 155–218.
Hack J. J., Schubert W. H. (1986). Nonlinear response of atmospheric vortices to heating by organized cumulus convection. J. Atmos. Sci. 43, 1559–1573. doi: 10.1175/1520-0469(1986)043<1559:NROAVT>2.0.CO;2
Halliwell G. R., Gopalakrishnan S., Marks F., Willey D. (2015). Idealized study of ocean impacts on tropical cyclone intensity forecasts. Month. Weather Rev. 143, 1142–1165. doi: 10.1175/MWR-D-14-00022.1
He S., Cheng X., Fei J., Li X., Wei Z., Huang X. (2023). Thermal response to sequential tropical cyclone passages: statistical analysis and idealized experiments (vol 11, 1142537, 2023). Front. Earth Sci. 11. doi: 10.3389/feart.2023.1211902
Holland G. J. (1997). The maximum potential intensity of tropical cyclones. J. Atmos. Sci. 54, 2519–2541. doi: 10.1175/1520-0469(1997)054<2519:TMPIOT>2.0.CO;2
Hong S. Y., Lim J. O. J. (2006). The WRF single-moment 6-class microphysics scheme (WSM6). J. Korean Meteor. Soc. 42, 129–151.
Hong S. Y., Noh Y., Dudhia J. (2006). A new vertical diffusion package with an explicit treatment of entrainment processes. Month. Weather Rev. 134, 2318–2341. doi: 10.1175/MWR3199.1
Iacono M. J., Delamere J. S., Mlawer E. J., Shephard M. W., Clough S. A., Collins W. D. (2008). Radiative forcing by long-lived greenhouse gases: Calculations with the AER radiative transfer models. J. Geophys. Res. 113, D13103. doi: 10.1029/2008JD009944
Jaimes B., Shay L. K. (2009). Mixed layer cooling in mesoscale oceanic eddies during hurricanes Katrina and Rita. Month. Weather Rev. 137, 4188–4207. doi: 10.1175/2009MWR2849.1
Jaimes B., Shay L. K. (2015). Enhanced wind-driven downwelling flow in warm oceanic eddy features during the intensification of tropical cyclone Isaac, (2012): observations and theory. J. Phys. Oceanogr. 45, 1667–1689. doi: 10.1175/JPO-D-14-0176.1
Lee C.-Y., Chen S. S. (2012). Symmetric and asymmetric structures of hurricane boundary layer in coupled atmosphere–wave–ocean models and observations. J. Atmos. Sci. 69, 3576–3594. doi: 10.1175/JAS-D-12-046.1
Li S., Chen C., Wu Z., Beardsley R. C., Li M. (2020). Impacts of oceanic mixed layer on hurricanes: A simulation experiment with hurricane sandy. J. Geophys. Res.: Oceans 125, 1–21. doi: 10.1029/2019JC015851
Lin I. I., Camargo S. J., Lien C. C., Shi C. A., Kossin J. P. (2023). Poleward migration as global warming’s possible self-regulator to restrain future western North Pacific Tropical Cyclone’s intensification. NPJ Clim Atmos Sci. 6, 34. doi: 10.1038/s41612-023-00329-y
Ma Z., Fei J., Liu L., Huang X., Cheng X. (2013). Effects of the cold core eddy on tropical cyclone intensity and structure under idealized air-sea interaction conditions. Month. Weather Rev. 141, 1285–1303. doi: 10.1175/MWR-D-12-00123.1
Mahala B. K., Mohanty P. K., Xalxo K. L., Routray A., Misra S. K. (2021). Impact of WRF parameterization schemes on track and intensity of extremely severe cyclonic storm “Fani. Pure Appl. Geophys. 178, 245–268. doi: 10.1007/s00024-020-02629-3
Miyamoto Y., Takemi T. (2010). An effective radius of the sea surface enthalpy flux for the maintenance of a tropical cyclone. Atmos. Sci.Lett. 11, 278–282. doi: 10.1002/asl.292
Mohapatra M., Sharma M. (2021). Comparative analysis of vital parameters of extremely severe cyclonic storms Phailin and Hudhud over the Bay of Bengal. J. Earth Sys. Sci. 130, 233. doi: 10.1007/s12040-021-01719-7
Nigam T., Prakash R. K., Pant V. (2019). An assessment of the impact of oceanic initial conditions on the interaction of upper ocean with the tropical cyclones in the Arabian Sea. J. Operation. Oceanogr. 13, 121–137. doi: 10.1080/1755876X.2019.1658567
Peduzzi P., Chatenoux B., Dao H., De Bono A., Herold C., Kossin J., et al. (2012). Global trends in tropical cyclone risk. Nat. Climate Change 2, 289–294. doi: 10.1038/nclimate1410
Persing J., Montgomery M. T. (2005). Is environmental CAPE important in the determination of maximum possible hurricane intensity? J. Atmos. Sci. 62, 542–550. doi: 10.1175/JAS-3370.1
Pielke R. A., Gratz J., Landsea C. W., Collins D., Saunders M. A., Musulin R. (2008). Normalized hurricane damage in the United States: 1900–2005. Natural Hazards Rev. 9, 29–42. doi: 10.1061/(ASCE)1527-6988(2008)9:1(29
Podeti S. R., Viswanadhapalli Y., Nellipudi N. R., Rao S. R., Ramakrishna S. S. V. S. (2022). Impact of ocean–atmosphere coupling on the simulation of a monsoon depression over the bay of Bengal. Pure Appl. Geophys. 179, 1–24. doi: 10.1007/s00024-022-03041-9
Potter H. (2018). The cold wake of Typhoon Chaba, (2010). Deep-Sea Res. I 140, 136–141. doi: 10.1016/j.dsr.2018.09.001
Price J. F., Sanford T. B., Forristall G. Z. (1994). Forced stage response to a moving hurricane. J. Phys. Oceanogr. 24, 233–260. doi: 10.1175/1520-0485(1994)024<0233:FSRTAM>2.0.CO;2
Price J. F., Weller R. A., Pinkel R. (1986). Diurnal cycling: observations and models of the upper ocean response to diurnal heating, cooling, and wind mixing. J. Geophys. Res. 91, 8411–8427. doi: 10.1029/JC091iC07p08411
Rajeswari J. R., Srinivas C. V., Mohan P. R., Venkatraman B. (2020). Impact of boundary layer physics on tropical cyclone simulations in the bay of Bengal using the WRF model. Pure Appl. Geophys. 177, 5523–5550. doi: 10.1007/s00024-020-02572-3
Rosenthal Y., Linsley B. K., Oppo D. W. (2013). Pacific ocean heat content during the past 10,000 years. Science 342, 617–621. doi: 10.1126/science.1240837
Rotunno R., Emanuel K. A. (1987). An air–sea interaction theory for tropical cyclones. Part II: Evolutionary study using a nonhydrostatic axisymmetric numerical model. J. Atmos. Sci. 44, 542–561. doi: 10.1175/1520-0469(1987)044<0542:AAITFT>2.0.CO;2
Sanford T. B., Price J. F., Girton J. B. (2011). Upper-ocean response to hurricane Frances, (2004) observed by profiling EM-APEX floats. J. Phys. Oceanogr. 41, 1041–1056. doi: 10.1175/2010JPO4313.1
Sanford T. B., Price J. F., Girton J. B., Webb D. C. (2007). Highly resolved observations and simulations of the ocean response to a hurricane. Geophys. Res. Lett. 34, L13604. doi: 10.1029/2007GL029679
Schubert W. H., Hack J. J. (1982). Inertial stability and tropical cyclone development. J. Atmos. Sci. 39, 1687–1697. doi: 10.1175/1520-0469(1982)039<1687:ISATCD>2.0.CO;2
Skamarock W. C., Klemp J. B., Dudhia J., Gill D. O., Liu Z., Berner J., et al. (2021). A description of the advanced research WRF model version 4.3 (No. NCAR/TN-556+STR). doi: 10.5065/1dfh-6p97
Srinivas C. V., Mohan G. M., Naidu C. V., Baskaran R., Venkatraman B. (2016). Impact of air-sea coupling on the simulation of tropical cyclones in the North Indian Ocean using a simple 3-D ocean model coupled to ARW. J. Geophys. Research-Atmos. 121, 9400–9421. doi: 10.1002/2015JD024431
Sun Y., Zhong Z., Ha Y. J., Wang Y., Wang X. D. (2013). The dynamic and thermodynamic perspectives of relative and absolute sea surface temperature on tropical cyclone intensity. Acta Meteor. Sin. 27, 40–49. doi: 10.1007/s13351-013-0105-z
Sun Y., Zhong Z., Li T., Lan Y., Hu Y., Wan H., et al. (2017). Impact of ocean warming on tropical cyclone size and its destructiveness. Sci. Rep. 7, 8154. doi: 10.1038/s41598-017-08533-6
Sun Y., Zhong Z., Lu W., Hu Y. J. (2014b). Why are tropical cyclone tracks over the western North Pacific sensitive to the cumulus parameterization scheme in regional climate modeling? A case study for Megi, (2010). Mon. Weather Rev. 142, 1240–1249. doi: 10.1175/MWR-D-13-00232.1
Sun Y., Zhong Z., Yi L., Ha Y., Sun Y. M. (2014a). The opposite effects of inner and outer sea surface temperature on tropical cyclone intensity. J. Geophys. Res.: Atmos. 119, 2193–2208. doi: 10.1002/2013JD021354
Tiedtke M. (1989). A comprehensive mass flux scheme for cumulus parameterization in large-scale models. Month. Weather Rev. 117, 1779–1800. doi: 10.1175/1520-0493(1989)117<1779:ACMFSF>2.0.CO;2
Vidale P. L., Hodges K., Vannière B., Davini P., Roberts M. J., Strommen K., et al. (2021). Impact of stochastic physics and model resolution on the simulation of tropical cyclones in climate GCMs. J. Climate 34, 4315–4341. doi: 10.1175/JCLI-D-20-0507.1
Vissa N. K., Satyanarayana A. N. V., Prasad K. B. (2012). Response of upper ocean during passage of MALA cyclone utilizing ARGO data. Int. J. Appl. Earth Observ. Geoinform. 14, 149–159. doi: 10.1016/j.jag.2011.08.015
Wolf E. L. (2020). Critical behavior of tropical cyclones. Theor. Appl. Climatol. 139, 1231–1235. doi: 10.1007/s00704-019-03040-2
Wu S.-N., Soden B. J., Miyamoto Y., Nolan D. S., Buehler S. A. (2021). Using satellite observations to evaluate the relationships between ice condensate, latent heat release, and tropical cyclone intensification in a mesoscale model. Month. Weather Rev. 149, 113–129. doi: 10.1175/MWR-D-19-0348.1
Wu L., Wang B., Braun S. A. (2005). Impacts of air–sea interaction on tropical cyclone track and intensity. Month. Weather Rev. 133, 3299–3314. doi: 10.1175/MWR3030.1
Wu L. G., Wang R. F., Feng X. F. (2018). Dominant role of the ocean mixed layer depth in the increased proportion of intense typhoons during 1980–2015. Earth’s Future 6, 1518–1527. doi: 10.1029/2018EF000973
Xia R., Li B., Chen C. (2021). Response of the mixed layer depth and subduction rate in the subtropical Northeast Pacific to global warming. Acta Oceanol. Sin. 40, 1–9. doi: 10.1007/s13131-021-1818-y
Xiao F. A., Wang D. X., Zeng L. L., Liu Q. Y., Zhou W. (2019). Contrasting changes in the sea surface temperature and upper ocean heat content in the South China Sea during recent decades. Climate Dynam. 53, 1597–1612. doi: 10.1007/s00382-019-04697-1
Xu Z., Sun Y., Li T., Zhong Z., Liu J., Ma C. (2020). Tropical cyclone size change under ocean warming and associated responses of tropical cyclone destructiveness: idealized experiments. J. Meteorol. Res. 34, 163–175. doi: 10.1007/s13351-020-8164-4
Xu J., Wang Y. Q. (2010a). Sensitivity of Tropical Cyclone Inner-Core size and intensity to the radial distribution of surface entropy flux. J. Atmos. Sci. 67, 1831–1852. doi: 10.1175/2010JAS3387.1
Xu J., Wang Y. Q. (2010b). Sensitivity of the simulated Tropical Cyclone Inner-Core size to the initial vortex size. Month. Weather Rev. 138, 4135–4157. doi: 10.1175/2010MWR3335.1
Yablonsky R. M., Ginis I. (2009). Limitation of one-dimensional ocean models for coupled hurricane–ocean model forecasts. Month. Weather Rev. 137, 4410–4419. doi: 10.1175/2009MWR2863.1
Yanai M., Esbensen S., Chu J. (1973). Determination of bulk properties of tropical cloud clusters from large-scale heat and moisture budgets. J. Atmos. Sci. 30, 611–627. doi: 10.1175/1520-0469(1973)030<0611:DOBPOT>2.0.CO;2
Yang B. L., Guo X., Gu J. F., Nie J. (2022). Cloud-Radiation Feedback prevents Tropical Cyclones from reaching higher intensities. Geophys. Res. Lett. 49, e2022GL100067. doi: 10.1029/2022GL100067
Zhang H. (2023). Modulation of upper ocean vertical temperature structure and heat content by a fast-moving tropical cyclone. J. Phys. Oceanogr. 53, 493–508. doi: 10.1175/JPO-D-22-0132.1
Zhang W., Gao J., Cheung K. K. W., Chen J.-M., You L. (2020). Intraseasonal variability of the genesis potential index and its relationship with tropical cyclogenesis over the western North Pacific. Int. J. Climatol. 40, 22–35. doi: 10.1002/joc.6190
Keywords: tropical cyclone, sea-surface temperature, ocean mixed layer depth, cold wake, surface enthalpy flux
Citation: Zhang Y, Han K, Sun Y, Lin Y, Zhai P, Guo X and Zhong W (2024) Impact of ocean mixed layer depth on tropical cyclone characteristics: a numerical investigation. Front. Mar. Sci. 11:1395492. doi: 10.3389/fmars.2024.1395492
Received: 04 March 2024; Accepted: 21 June 2024;
Published: 12 July 2024.
Edited by:
Chunyan Li, Louisiana State University, United StatesReviewed by:
Jing Ma, Nanjing University of Information Science and Technology, ChinaJian Cao, Nanjing University of Information Science and Technology, China
Copyright © 2024 Zhang, Han, Sun, Lin, Zhai, Guo and Zhong. This is an open-access article distributed under the terms of the Creative Commons Attribution License (CC BY). The use, distribution or reproduction in other forums is permitted, provided the original author(s) and the copyright owner(s) are credited and that the original publication in this journal is cited, in accordance with accepted academic practice. No use, distribution or reproduction is permitted which does not comply with these terms.
*Correspondence: Yuan Sun, c3VueXVhbjEyMTRAMTI2LmNvbQ==; c3VueXVhbjE3YUBudWR0LmVkdS5jbg==
 Yalan Zhang1
 Yuan Sun
 Yanluan Lin