 Tomoya Aono1,2*
 Tatsuya Sakamoto3†
 Toyoho Ishimura2,4*
 Motomitsu Takahashi3
 Tohya Yasuda5
 Satoshi Kitajima3
 Kozue Nishida2,6Takayoshi Matsuura2Akito Ikari2
 Shin-ichi Ito1*
- 1Atmosphere and Ocean Research Institute, The University of Tokyo, Kashiwa, Chiba, Japan
- 2National Institute of Technology, Ibaraki College, Hitachinaka, Ibarakid, Japan
- 3Fisheries Resources Institute, Japan Fisheries Research and Education Agency, Nagasaki, Japan
- 4Graduate School of Human and Environmental Studies, Kyoto University, Kyoto, Japan
- 5Fisheries Resources Institute, Japan Fisheries Research and Education Agency, Yokohama, Kanagawa, Japan
- 6School of Environment and Society, Tokyo Institute of Technology, Tokyo, Japan
The Japanese sardine (Sardinops sagax melanostictus) is a small pelagic fish found in the Sea of Japan, the marginal sea of the western North Pacific. It is an important species for regional fisheries, but their dispersal and migration patterns during early life stages remain unclear. In this study, we analyzed the stable oxygen isotope ratios of otoliths of young-of-the-year (age 0) Japanese sardines collected from the northern offshore and southern coastal areas of the Sea of Japan in 2015 and 2016. The ontogenetic shifts of the geographic distribution were estimated by comparing the profiles of life-long isotope ratios and temporally varying isoscape, which was calculated using the temperature and salinity fields produced by an ocean data assimilation model. Individuals that were collected in the northern and southern areas hatched and stayed in the southern areas (west offshore of Kyushu) until late June, and thereafter, they can be distinguished into two groups: one that migrated northward at shallow layer and one that stayed around the southern area in the deep layer. A comparison of somatic growth trajectories of the two groups, which was reconstructed based on otolith microstructure analysis, suggested that individuals that migrated northward had significantly larger body lengths in late June than those that stayed in the southern area. These results indicate that young-of-the-year Japanese sardines that hatched in the southern area may have been forced to choose one of two strategies to avoid extremely high water temperatures within seasonal and geographical limits. These include migrating northward or moving to deeper layers. Our results indicate that the environmental variabilities in the southern area could critically impact sardine population dynamics in the Sea of Japan.
1 Introduction
The Japanese sardine (Sardinops sagax melanostictus; Temminck and Schlegel, 1846) is a species with large biomass fluctuations. The abundance of Japanese sardines showed substantial fluctuations of several orders of magnitude during the last 3000 years (Kuwae et al., 2017), and fluctuations have also been reported regarding the associated fisheries catch in recent centuries (Yasuda et al., 2019). These fluctuations are considered to be driven by environmental variabilities, which are often represented by the Pacific Decadal Oscillation (e.g., Chavez et al., 2003). Clarification of the mechanistic links between climate and marine environments and population fluctuation is necessary for the accurate prediction of resource abundance and fisheries management. Variations in survival rates during the post-hatching larval and juvenile stages are hypothesized to be of great importance for population fluctuations (e.g., Hjort, 1914). Therefore, the knowledge of the geographical distributions and environment of Japanese sardines during its critical life stages are essential for revealing the impact of climate and marine environment changes on population fluctuations.
Current fisheries management of the Japanese sardine assumes two management units or stocks—the Pacific stock (distributed in the western North Pacific) and the Tsushima Warm Current Stock (distributed in the Sea of Japan), both of which show large fluctuations in abundance at similar time scales. While the patterns of transport and migration during the early life stages have been reported for the Pacific stock (e.g., Okunishi et al., 2009; Sakamoto et al., 2019), such knowledge for the Tsushima Warm Current Stock is insufficient. Spawning of the Tsushima Warm Current Stock occurs in coastal areas from west Kyushu to the Noto Peninsula from winter to early summer (January–June, Figure 1). The main spawning ground changes depending on the sea surface temperature and spawning stock biomass (Furuichi et al., 2020). The young-of-the-year Japanese sardine is widely found from the off Noto Peninsula to the west coast of Kyushu in late summer (Ito, 1961; Yasuda et al., 2021). A recent study showed that the environment of the northern offshore area of the Sea of Japan with larger and lipid-rich prey zooplankton is suitable for the energy acquisition of sardine juveniles (Yasuda et al., 2021). In addition, the distribution of the stock is known to expand and shrink in response to population fluctuations; during periods of increased biomass, the distribution of the stock area expands to the northern offshore area of the Sea of Japan (Muko et al., 2018). These observations lead to the hypothesis that the successive and successful transportation (or migration) of juveniles to the northern offshore area might be the driver of the increase in stock (Muko et al., 2018; Yasuda et al., 2021). However, the origin, transportation, and migration routes of the individuals that reach the northern offshore area of the Sea of Japan have not yet been clarified. Understanding the movement patterns and their variety, and mechanisms that create this variety may, therefore, provide insights into energy acquisition strategies, population dynamics, and ultimately management of sardines in the region.
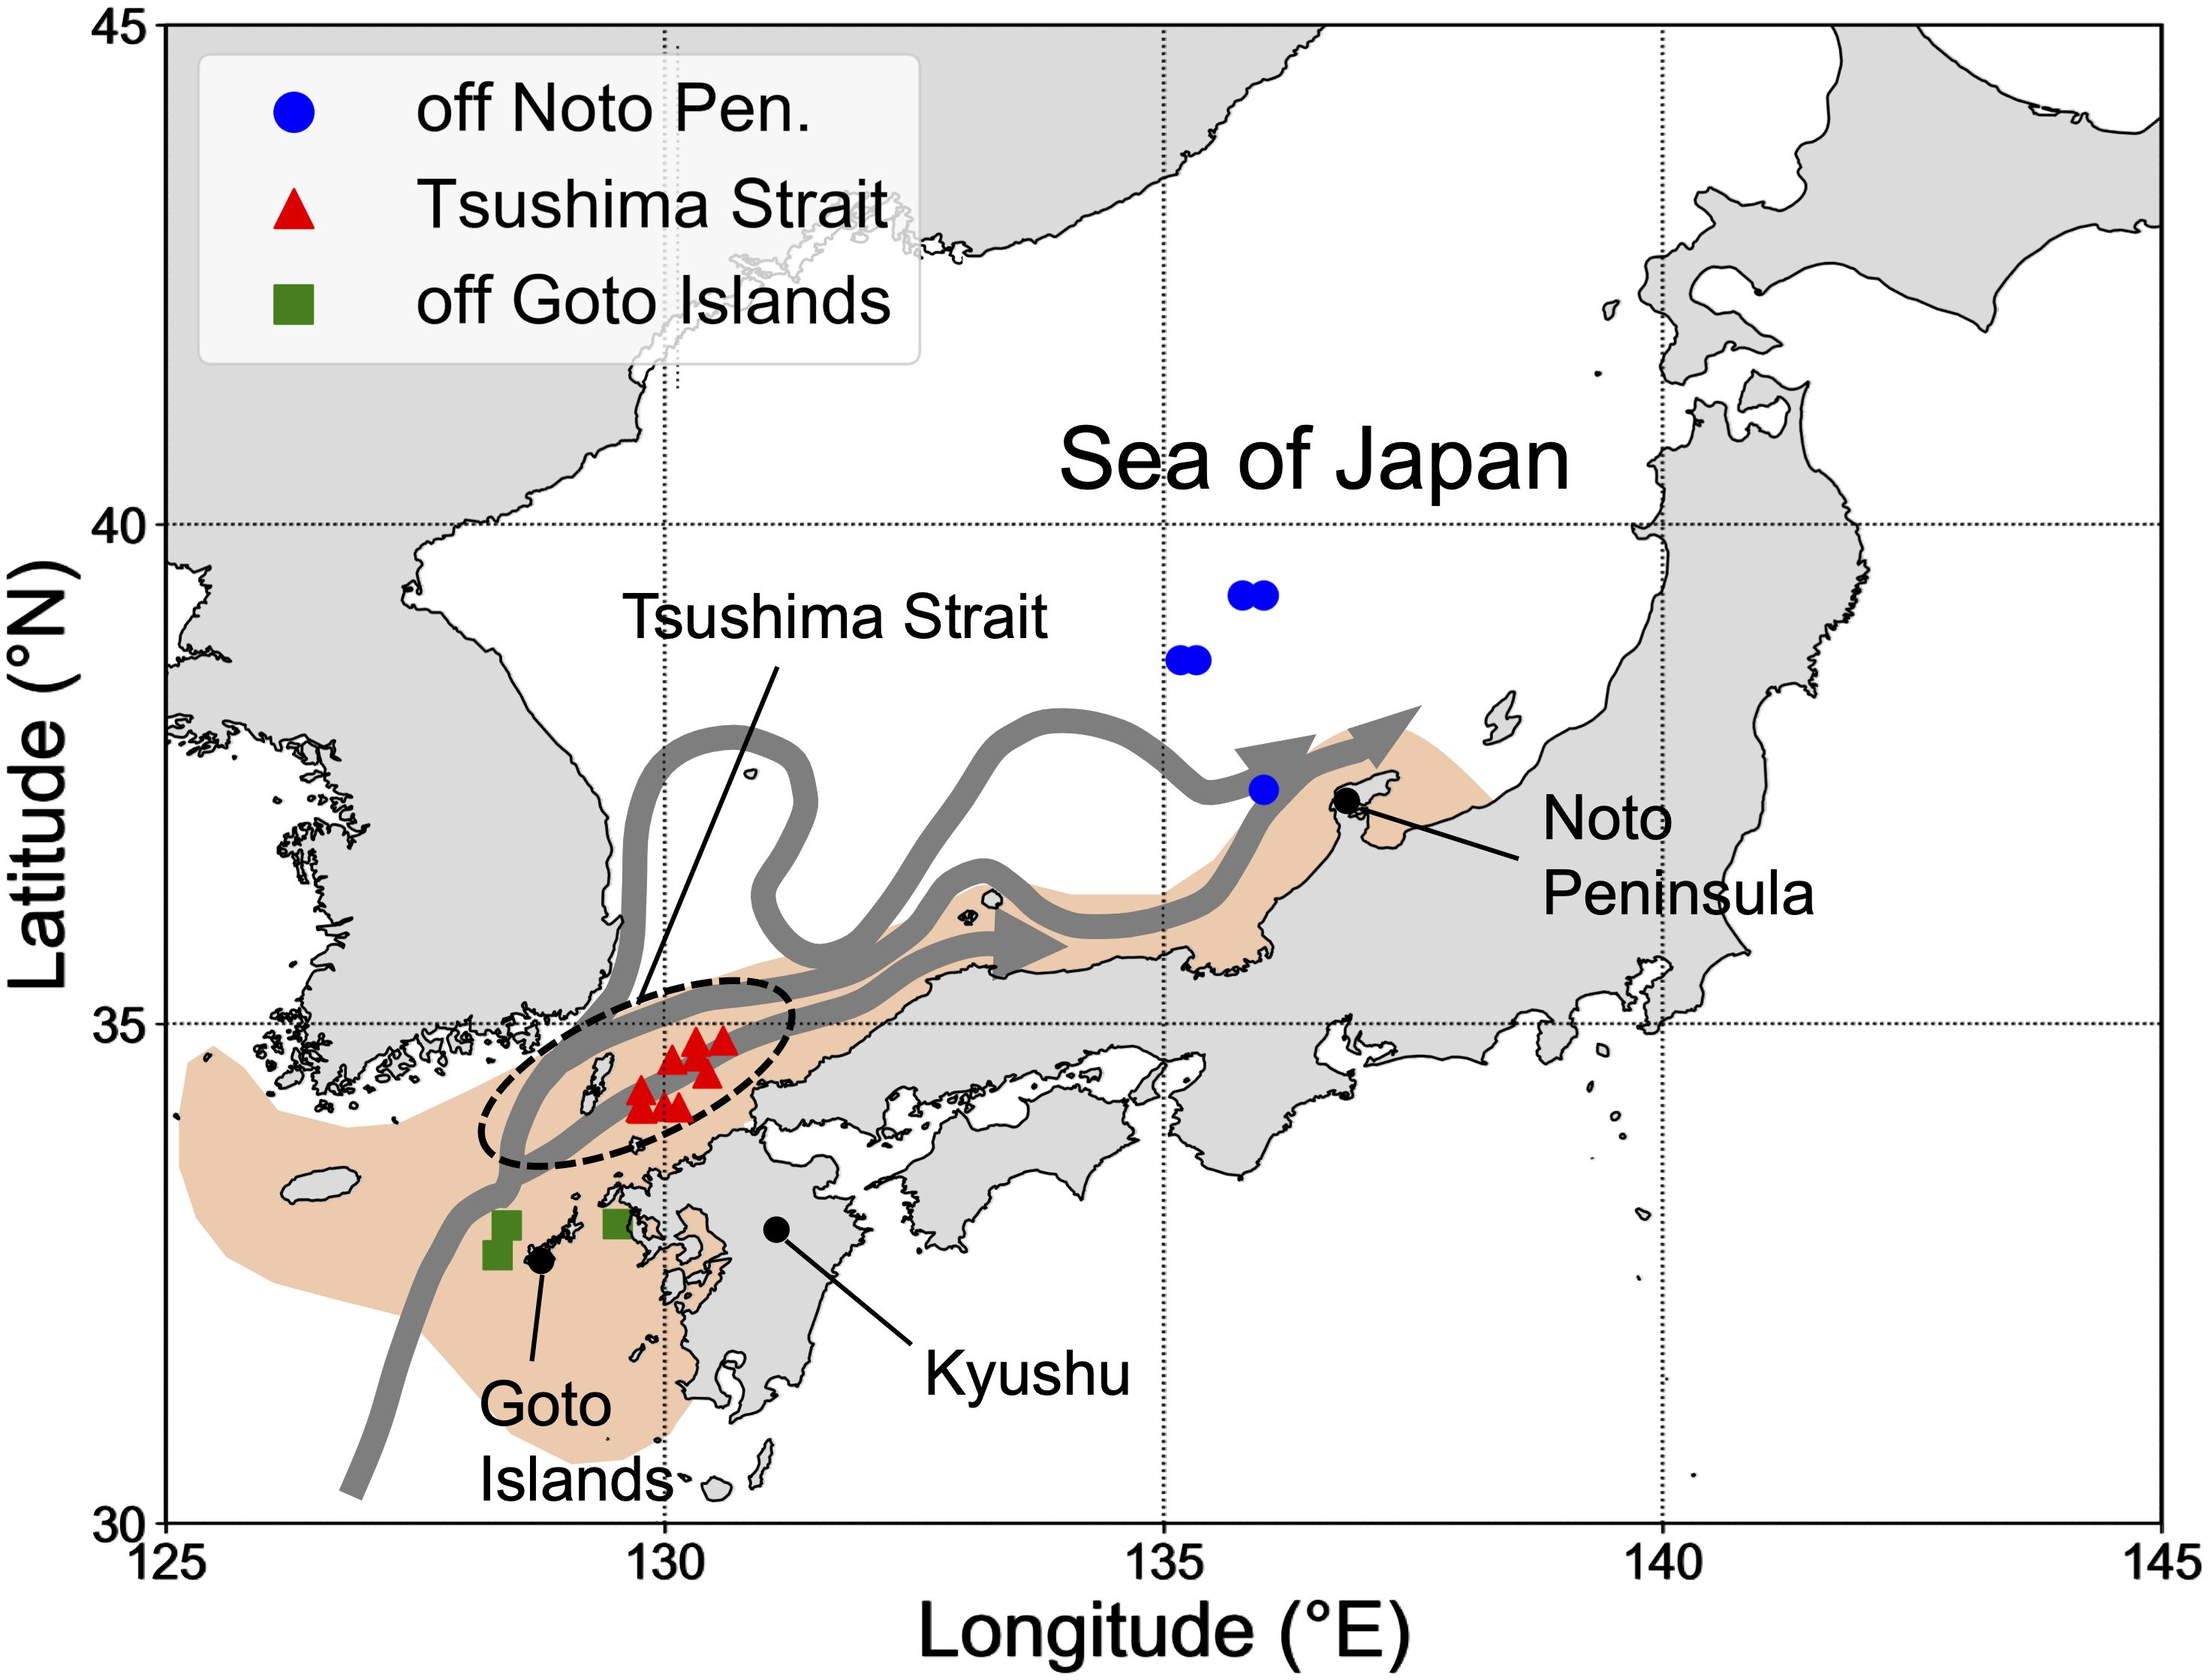
Figure 1 Study area in the Tsushima Warm Current stock. Blue, red, and green points indicate the locations of sampling stations. Gray arrows show the branches of the Tsushima Warm Current (based on Yabe et al., 2021). Orange area indicates the spawning ground of Japanese sardine in the Sea of Japan (based on Yasuda et al., 2019).
The chemical composition of otoliths is a promising tool for revealing transportation and migration patterns during early life stages (e.g., Sturrock et al., 2012; Mu et al., 2021). Otolith is a hard tissue composed of calcium carbonate (CaCO3: aragonite) that continuously grows every day, forming one growth ring per day, which allows the inference of the hatch date (Campana, 1990). Once it crystallized, the calcium carbonate composition remained unchanged. Therefore, the environmental history of individuals is preserved in the otolith in terms of chemical composition (Campana, 1999). The stable oxygen isotope ratio (δ18O) is a chemical signal that is used to trace the migration of marine organisms (Hanson et al., 2013; Darnaude et al., 2014; Shiao et al., 2016; Torniainen et al., 2017; Darnaude and Hunter, 2018; Sakamoto et al., 2019; Chiang et al., 2020). The δ18O of the otolith (δ18Ooto) is mainly affected by two parameters: the ambient water temperature and δ18O of the surrounding seawater (δ18Owater) (Kim et al., 2007). δ18Owater is strongly correlated with salinity in region-specific linear relationships (e.g., LeGrande and Schmidt, 2006; Kodaira et al., 2016). This indicates that by comparing the δ18Ooto actually analyzed and the δ18Ooto isoscape predicted from temperature and salinity fields, the location of the fish can be inferred (Torniainen et al., 2017). Recent developments in high-precision micromilling systems (Sakai, 2009) and microscale isotopic analytical methods (Ishimura et al., 2004, 2008) have realized δ18Ooto analyses with a temporal resolution of 10 days for the Japanese sardine (Sakamoto et al., 2019), which may allow reconstruction of early life migration histories of the Japanese sardine in the Sea of Japan.
In this study, we aimed to understand the seasonal movements of larval and juvenile Japanese sardines in the Sea of Japan by using δ18Ooto. High temporal resolution analysis of δ18Ooto was conducted for the young-of-the-years collected in the northern offshore and southern coastal areas of the Sea of Japan during the late summer of 2015 and 2016. The relationship between δ18Owater and salinity in the entire Sea of Japan from 2015 and 2016 was also established to allow the prediction of δ18Owater from salinity. Using the relationship, temperature, and salinity outputs from an ocean data assimilation model, possible ontogenetic shifts in the distribution of the young-of-the-year Japanese sardines were estimated. As the existence of two different migratory types, namely the northward migration group and resident group, was indicated, we tested whether biological characteristics (body length and growth rate) were related to the selection of the migration patterns.
2 Materials and methods
2.1 Fish sampling and Otolith δ18O analysis
The young-of-the-years of Japanese sardines were collected for otolith analyses in three sampling areas (off Noto Peninsula, Tsushima Strait, and off Goto Islands) in the Sea of Japan in August and September in 2015 and 2016 by the R/V Yoko-maru, Japan Fisheries Research and Education Agency (Figure 1, Table 1). Fish were frozen immediately after capture and preserved in -80 or -20°C. Thereafter, the specimens were thawed in a laboratory on land and their scaled-body length (length measured from the tip of the snout to the end of the last scale: BL) and body weight were measured. The “scaled-body length” has been routinely used in observations by Japan Fisheries Agency, and only “scaled-body length” was consistently available for our sample. This measure has been used instead of total, fork and standard length as it can still be easily taken when the caudal fin has been damaged or is missing, which is often the case for the species. Sagittal otoliths were extracted, cleaned using a brush, rinsed with ethanol and distilled water, and dried at room temperature for several hours. The dried otoliths were embedded in epoxy resin (p-resin, Nichika Inc.) on a glass slide, and then placed in a dryer at 40°C for at least a day to fix the otoliths. Thereafter, the embedded otoliths were polished with sandpaper (No. 1000, 2000) until the otolith core was exposed from the epoxy resin, and then the entire otolith was polished with alumina suspension (BAIKOWSKI International Corporation) to ensure that the daily rings could be easily observed under a microscope. The number of daily rings of the otolith and otolith daily increment widths were measured using an otolith measurement system (RATOC System Engineering Co. Ltd.). The otoliths of 154 individuals from 18 stations were used for daily ring measurements (Table 1).
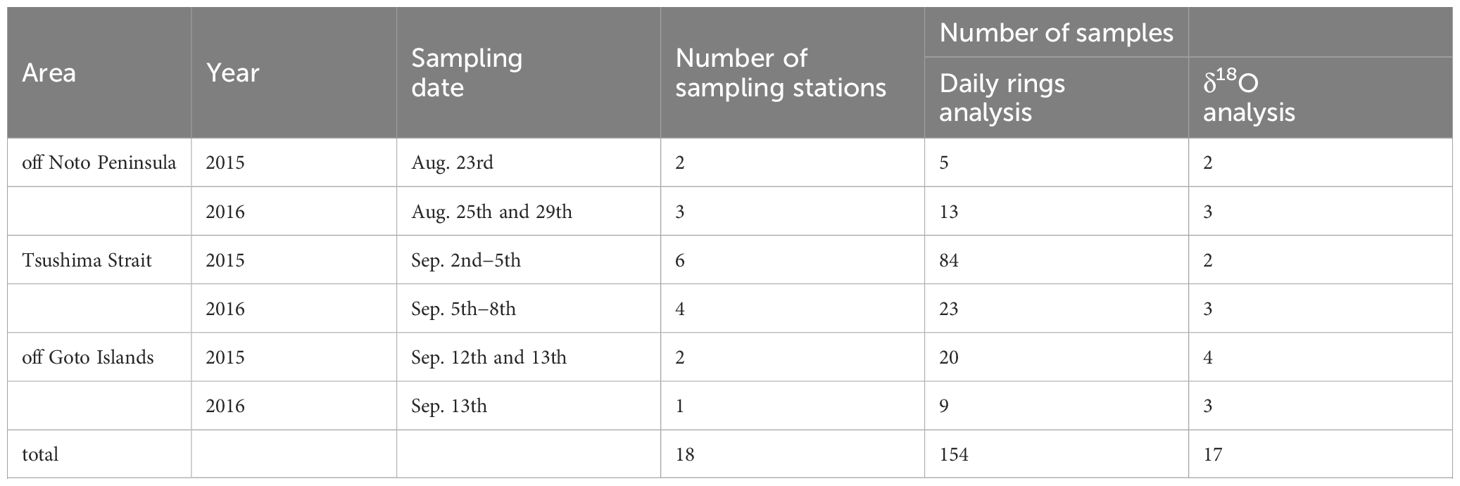
Table 1 Summary of sample data showing the sampling date, number of sampling stations and samples numbers for daily ring analysis and δ18O analysis.
The δ18Ooto was analyzed for a random sample of 17 out of the 154 individuals considering equitable number of specimens among the three sampling areas. The otolith portions that were formed every 10–30 days were milled sequentially from the edge to the core using a high-precision micro-milling system (GEOMILL326, Izumo-Web Ltd., Japan) (an example of the milling procedure is shown in Supplementary Video 1). The δ18Ooto was determined using an IsoPrime100 isotope ratio mass spectrometer (Isoprime Ltd., Cheadle Hulme, UK) equipped with a customized continuous-flow gas preparation system (MICAL3c) at the National Institute of Technology, Ibaraki College, Hitachinaka, Japan. This system is capable of analyzing δ18O of calcium carbonates of > 0.2 μg with an analytical precision of within ± 0.1 ‰, which allows high sensitivity and accuracy analysis (Ishimura et al., 2004, 2008; Nishida and Ishimura, 2017). Otolith powders were reacted with phosphoric acid at 25°C, and the evolved CO2 was purified and introduced into the mass spectrometry system. The δ18O values of each sample were reported in standard δ notation (‰) relative to the Vienna Pee Dee Belemnite (VPDB) standard. We used the calcite acid fractionation factor of 1.01025 (Sharma and Clayton, 1965) to calculate isotopic values in order to compare them with isotopic values reported in previous studies. The analytical precision was better than ± 0.1 ‰ for δ13C and δ18O. Some samples were excluded from the results because of insufficient CaCO3 or handling failure (Supplementary Table S1).
2.2 Seawater sampling and relationship between seawater δ18O and salinity
Seawater samples were collected in the Sea of Japan and East China Sea between July 27th and September 15th in 2015 and March 9th to September 18th in 2016, including information from 237 stations that were selected from a dataset of Kodama et al. (2024). Samples were collected using a bucket from the surface of the sea or using a pump that was installed at the hull of a ship (≤ 5 m). Salinity was measured using a salinometer (Autosal8400B, Guildline) for the seawater collected with the bucket, whereas it was measured using a thermosalinometer (SBE45, Seabird) for the seawater collected from the bottom of the ship. Samples for the δ18O analysis were poured into two high density polyethylene bottles or glass bottles (the bottles were rinsed twice with the seawater before use). To avoid evaporation of water, the bottles were sealed tightly and stored at 5°C until further analysis was conducted on land. The δ18O in the seawater samples (δ18Owater) was determined using a wavelength-scanned cavity ring-down spectroscopy isotopic water analyzer (L2130-i; Picarro Inc., Santa Clara, CA, USA) at the National Institute of Technology, Ibaraki College. All samples were subsampled and filtered through a 0.45 μm filter prior to analysis. The long-term external precision was within ± 0.05 ‰ for δ18O. Isotopic values of water samples were reported relative to Vienna Standard Mean Ocean Water (VSMOW).
2.3 Estimation of migration history
The following equation relating δ18Ooto (‰) and water temperature T (°C) was established for Japanese sardines using laboratory rearing experiments (Sakamoto et al., 2017):
Based on Equation 1, δ18Ooto can be estimated if the temperature and δ18Owater are given. The δ18Owater and salinity S during 2015 and 2016 in the Sea of Japan and East China Sea showed significant positive correlations, as represented by the following equation:
From Equations 1 and 2, the estimation of δ18O of otoliths that would be produced at each location (δ18Oest) can be expressed as
Based on Equation 3, δ18Oest can be estimated if the temperature and salinity are known. Thus, the isoscape of δ18Oest can be drawn from datasets of horizontal distributions of temperature and salinity fields, and areas where δ18Oest is similar to the analyzed δ18Ooto can be considered as possible locations for the fish.
At the medians of the date ranges corresponding to each δ18Ooto, water temperature and salinity in the Sea of Japan and East China Sea (125–142°E, 30–50°N) were used to calculate the isoscape of δ18Oest. Temperature and salinity data were extracted from an ocean data assimilation model, the FRA-ROMS (Kuroda et al., 2013, 2017). The FRA-ROMS ocean forecast system was developed by the Japan Fisheries Research and Education Agency (FRA) to conduct ocean forecasts using assimilated initial conditions. In the present study, we used the reanalysis data of FRA-ROMS, which is based on the Regional Ocean Modelling System (ROMS; Haidvogel et al., 2008) as an ocean circulation model with three-dimensional variational (3D-Var) analysis schemes as a data assimilation method. Satellite-derived sea surface temperature and sea surface height and in-situ hydrographic observations of temperature and salinity were assimilated. The horizontal resolution in the Sea of Japan is 1/10-degree, with the vertical structure comprising 48 layers defined by a specific S-coordinate function in both models. Further detailed model specifications can be found in Kuroda et al. (2013, 2017), and its accuracy assessments can be found in Sakamoto et al. (2019). Because the Japanese sardine has mainly been found in the surface mixed layer (e.g., Yatsu et al., 2005) and mixed layer depths are generally 10–50 m in this region from spring (March–May) to summer (June–August), temperature and salinity fields at 10 m and 30 m depth have been considered for the subsequent analyses. Equation 3 was used to calculate δ18Oest, and the areas at which the difference between δ18Oest and δ18Ooto was less than or equal to ± 0.18 ‰ were considered as estimated distribution areas of the Japanese sardine. Here, 0.18 ‰ corresponds to the root mean square error of Equation 1 (Sakamoto et al., 2017), which represents the sum of biological and analytical errors.
To validate the estimated results, the estimated distribution area on the date closest to the sampling date for each individual was compared with the actual sampling area. In addition, the estimated distribution area on the date closest to the hatch date was compared with the results of a monthly egg and larval survey conducted at prefectural fisheries field stations (Oozeki et al., 2007; Furuichi et al., 2021).
2.4 Statistical analysis
To examine the seasonal variation in δ18Ooto, we calculated the monthly mean of δ18Ooto for all individuals from February to September and compared the monthly mean of δ18Ooto in the preceding and following months using the Mann-Whitney U test (excluding February, March, and September, because data was available only in one year). To compare the δ18Ooto history of individuals between sampling areas, the monthly mean δ18Ooto of individuals in each sampling area was compared using the Kruskal-Wallis test for each month. When a significant difference was detected, a post-hoc Steel-Dwass test was performed to identify the sampling areas that had significant differences.
To examine the differences in biological characteristics between potentially different migratory types, namely the northward migration group (off Noto Peninsula individuals) and resident group (Tsushima Strait and off Goto Islands individuals; see Results and Discussion), we compared somatic growth trajectories between these groups. The Mann-Whitney U test for comparisons of hatching date and BL at the time of sampling was conducted between groups. We also compared the BL before sampling. BL before the time of sampling was calculated using the biological intercept method, assuming a linear relationship between the otolith radius and BL with fixed 5.9 mm of BL at the deposition of the first increment of the otolith, following Takahashi et al. (2008). To test for differences in the daily growth rates among the groups, normalized anomalies of otolith increment width were compared. To reduce the noise signals, the 3-day running-mean otolith increment width of individual n when daily age is i (W3day(n,i)) was calculated (Equation 4).
where W(n,j) is the otolith increment width of individual n when daily age is j. Average (W3day_avg) and standard deviation (W3day_std) of the 3-day running-mean otolith increment width were used to calculate normalized anomalies (GA3day) of the 3-day running-mean otolith increment width (Equation 5–7).
where N is total number of individuals. The normalized anomalies were compared among the three sampling areas using the Kruskal-Wallis test. The normalized anomalies were also compared among the three sampling areas for each calendar day (days from January 1st each year) Equation (8).
where i_date is daily age of individual n on calendar day date. When a significant difference was detected, a post-hoc Steel-Dwass test was performed to identify areas with significant differences.
3 Results
3.1 Otolith δ18O analysis
The average δ18Ooto gradually decreased from +0.08 ± 0.27 ‰ at the core to –1.36 ± 0.24 ‰ at the edge in 2015 and from –0.07 ± 0.44 ‰ at the core to –1.41 ± 0.11 ‰ in 2016 (Figure 2). The δ18Ooto values of individuals in 2015 varied between +0.6 ‰ and –2.0 ‰, and those of individuals in 2016 varied between +0.5 ‰ and –2.2 ‰. For all individuals, the monthly mean δ18Ooto was always lower than that of the previous month, resulting in consistently decreasing trends. There were significant differences in δ18Ooto in all months preceding and following (p< 0.05, Mann-Whitney U test). As for the differences in δ18Ooto history among sampling areas, there were no significant differences in the monthly mean δ18Ooto of individuals among regions in all months, except for those off the Noto Peninsula and off the Goto Islands in June (p = 0.049, Steel-Dwass test).
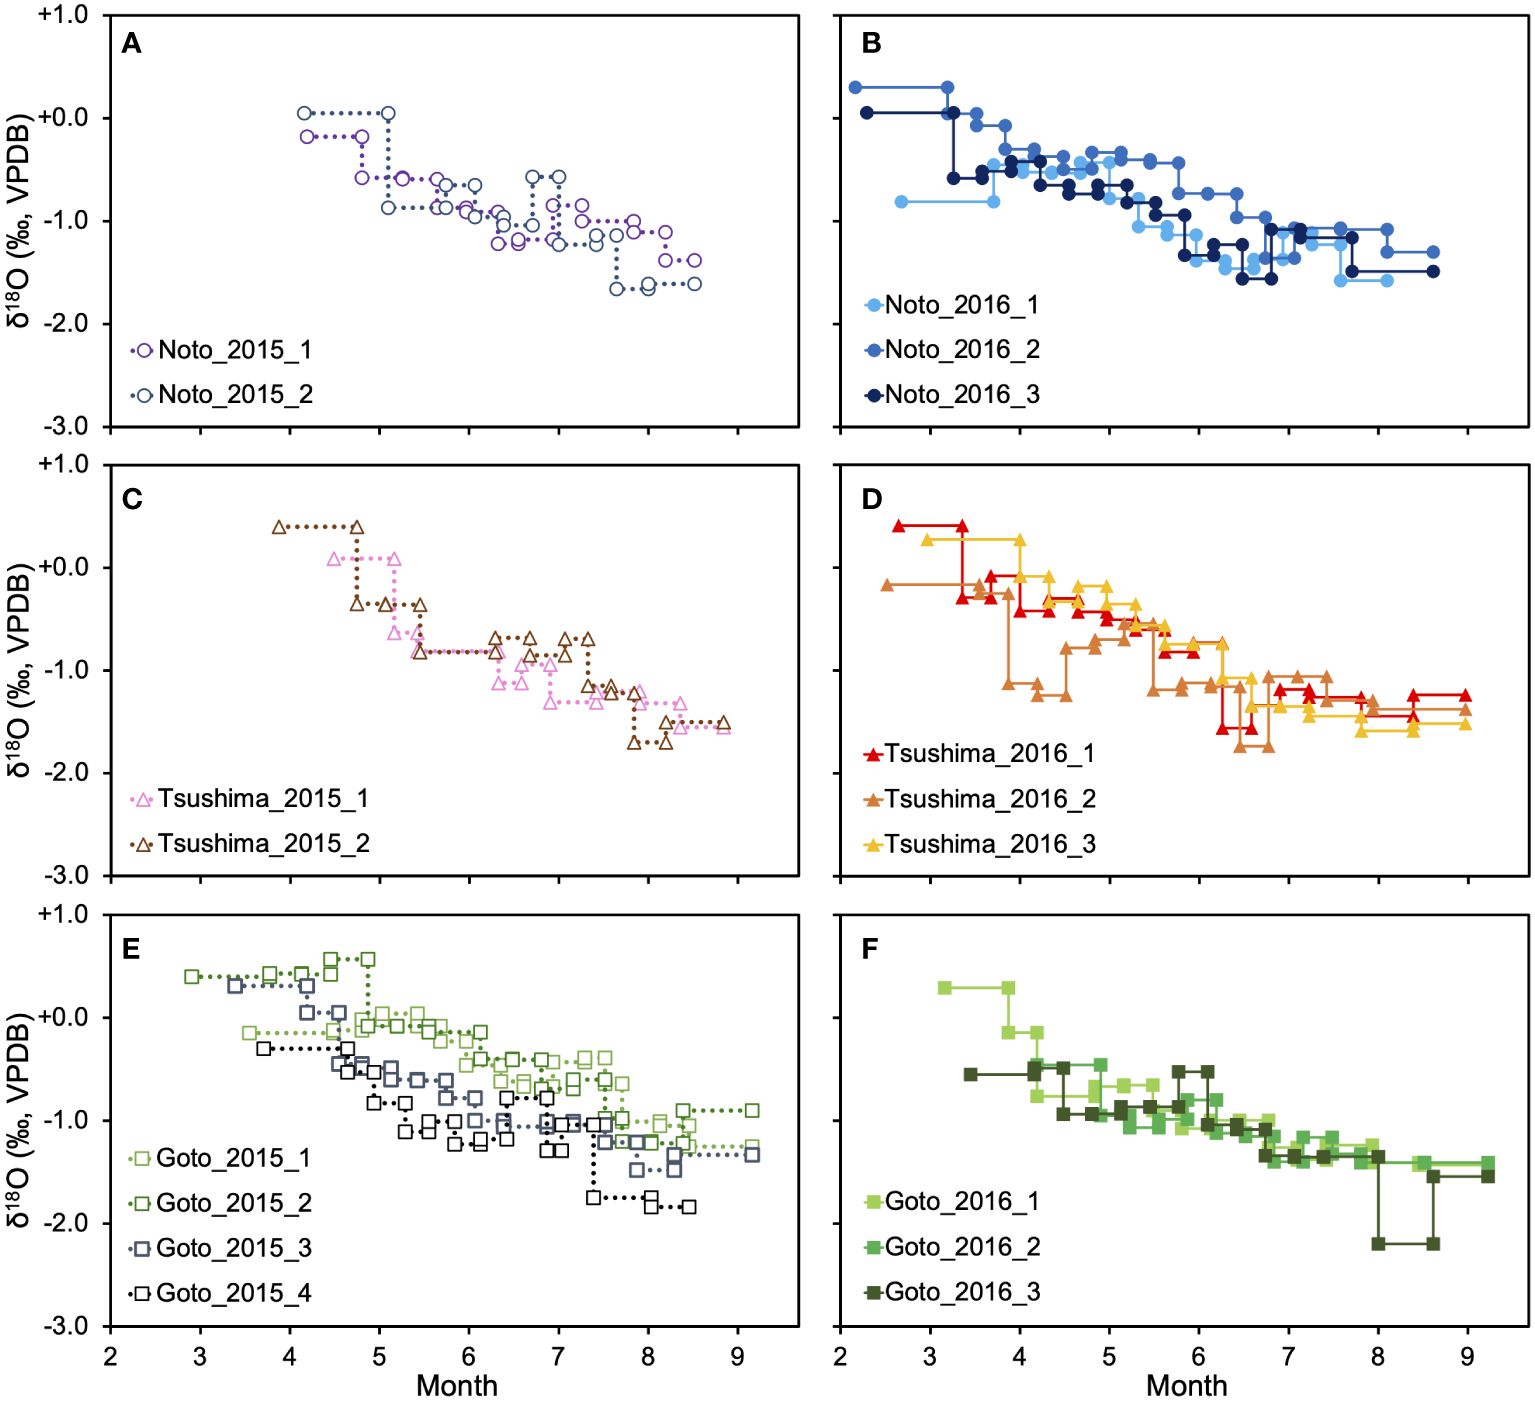
Figure 2 The δ18Ooto profiles. The left panel shows the δ18Ooto profile of individuals that were collected in 2015 (A, C, E), and the right panel shows the δ18Ooto profile of individuals that were collected in 2016 (B, D, F). The upper column shows the result of off Noto Peninsula (A, B), the middle column shows Tsushima Strait (C, D), and the lower column shows off Goto Islands (E, F).
3.2 Relationship between seawater δ18O and salinity
The δ18Owater ranged from -1.37 ‰ to +0.41 ‰, and relatively low δ18O values (< -0.50 ‰) were concentrated in the northern East China Sea. Similar to the δ18Owater, salinity that ranged from 27.213 to 34.861 tended to be low in the northern East China Sea. Both the δ18Owater and salinity gradually increased from west to east. There was a significant positive linear relationship between the salinity and δ18Owater (n=201, p< 0.0001, r2 = 0.969) and the coefficients are determined as a = 0.23 ± 0.003 and b = −7.54 ± 0.095 in Equation 2. The slope a and intercept b are close to those reported in previous studies in this area (Supplementary Figure S1; Horikawa et al., 2015; Kodaira et al., 2016).
3.3 Estimated migration history
Seasonal movements consistent with the locations of spawning grounds and sampling points were successfully illustrated for all individuals by applying systematic adjustments for the habitat depth assumption (Figure 3, Supplementary Figures S2, S3). For all individuals, the estimated distribution areas (i.e., where the difference of δ18Oest and δ18Ooto was smaller than 0.18) were located in the western offshore of Kyushu (south of 34°N) until mid-June to early July from hatching, regardless of the habitat depth assumption (Figure 4). The estimated distribution areas at the date closest to the time of hatching included areas where eggs were found in surveys for most individuals, regardless of the habitat depth assumption. These areas were shown to be west offshore of Kyushu (Figure 3; Supplementary Figure S3). However, after July, the estimated distribution areas varied significantly with the depth assumptions. In general, the estimated distribution areas calculated at a depth of 10 m moved rapidly northward, whereas those calculated at 30 m depth showed limited movement (Figure 4). For individuals off the Noto Peninsula, the estimated distribution areas at the time of sampling were located near the actual sampling point when the habitat depth was assumed to be 10 m (Figure 5). There were significant inconsistencies between the estimated distribution areas and sampling points calculated at 30m (Figure 5). In contrast, for the Tsushima Strait and the off Goto Islands individuals, the estimated area came close to the sampling point when the depth was assumed to be 30 m, but became far away when 10 m was assumed (Figure 5).
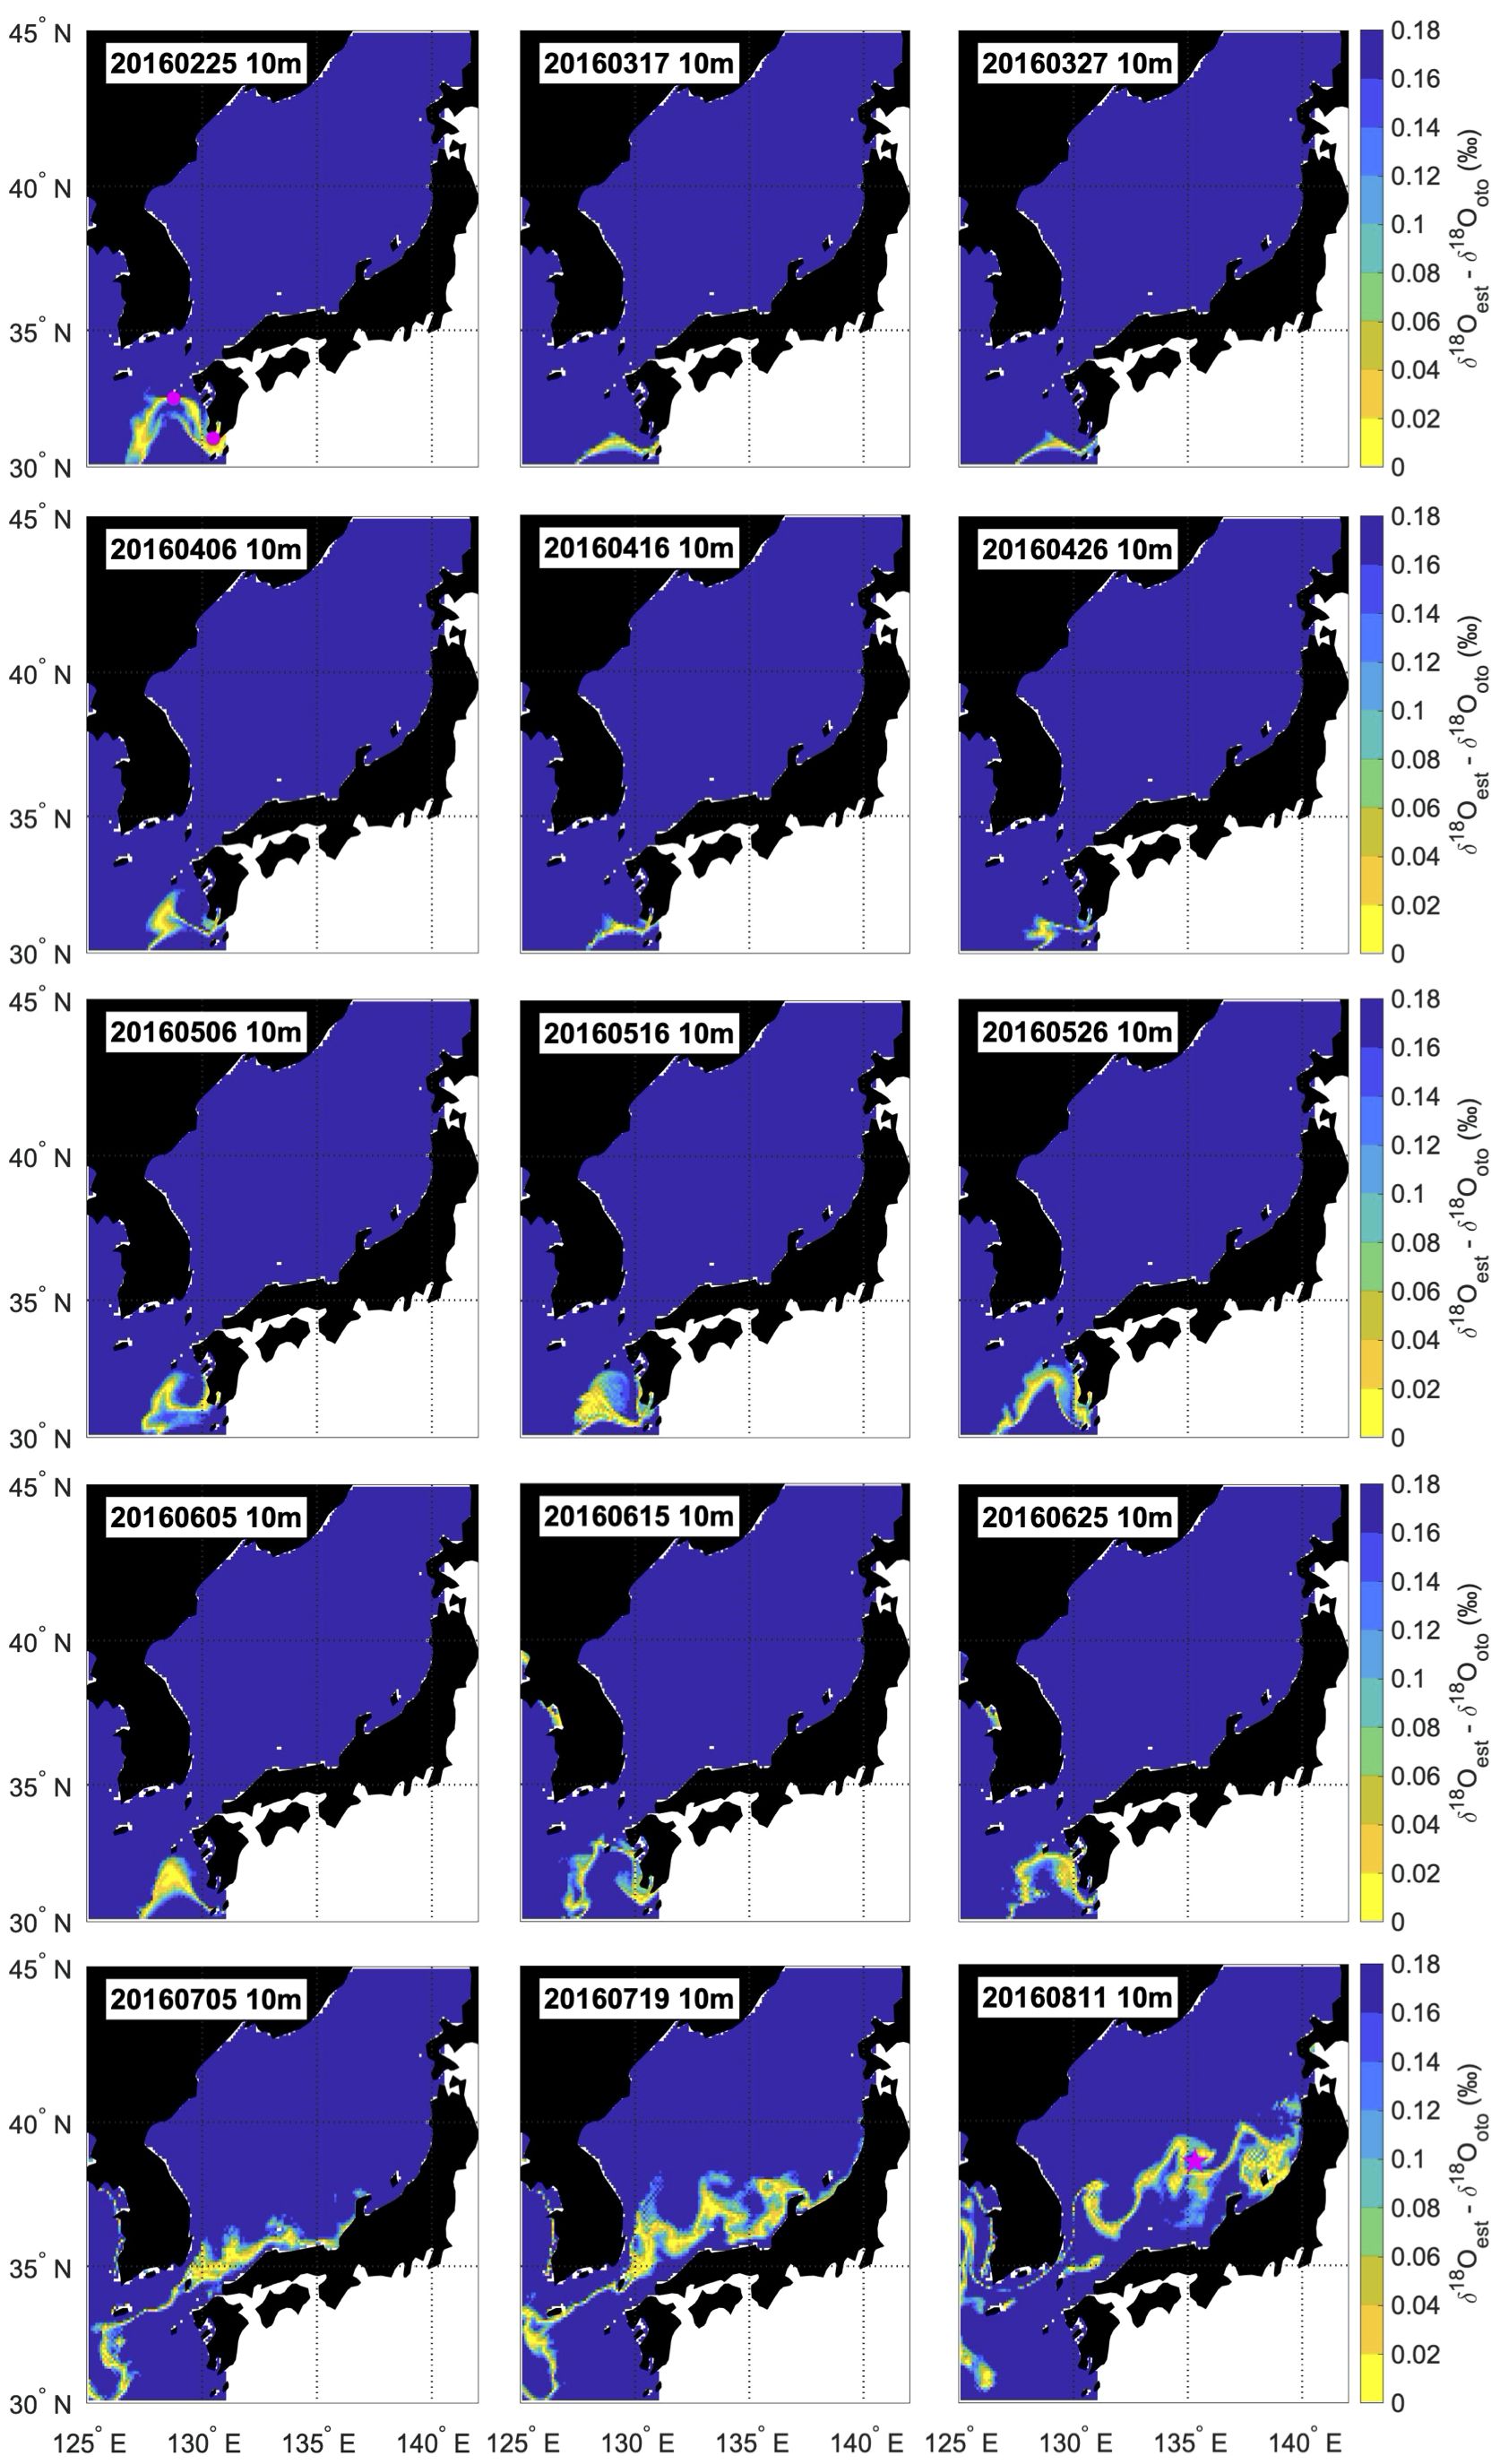
Figure 3 Example of estimated distribution areas of the individual collected off Noto Peninsula in 2016 (Noto_2016_3), assuming the habitat depth of 10 m. The blue to yellow gradation indicates the estimated distribution areas. Spawning grounds are presented as pink circles. Sampling station is presented as pink star. The upper leftmost Figure shows the estimated distribution area of the nearest hatching date and the lower rightmost Figure shows the estimated distribution area of the nearest sampling date.
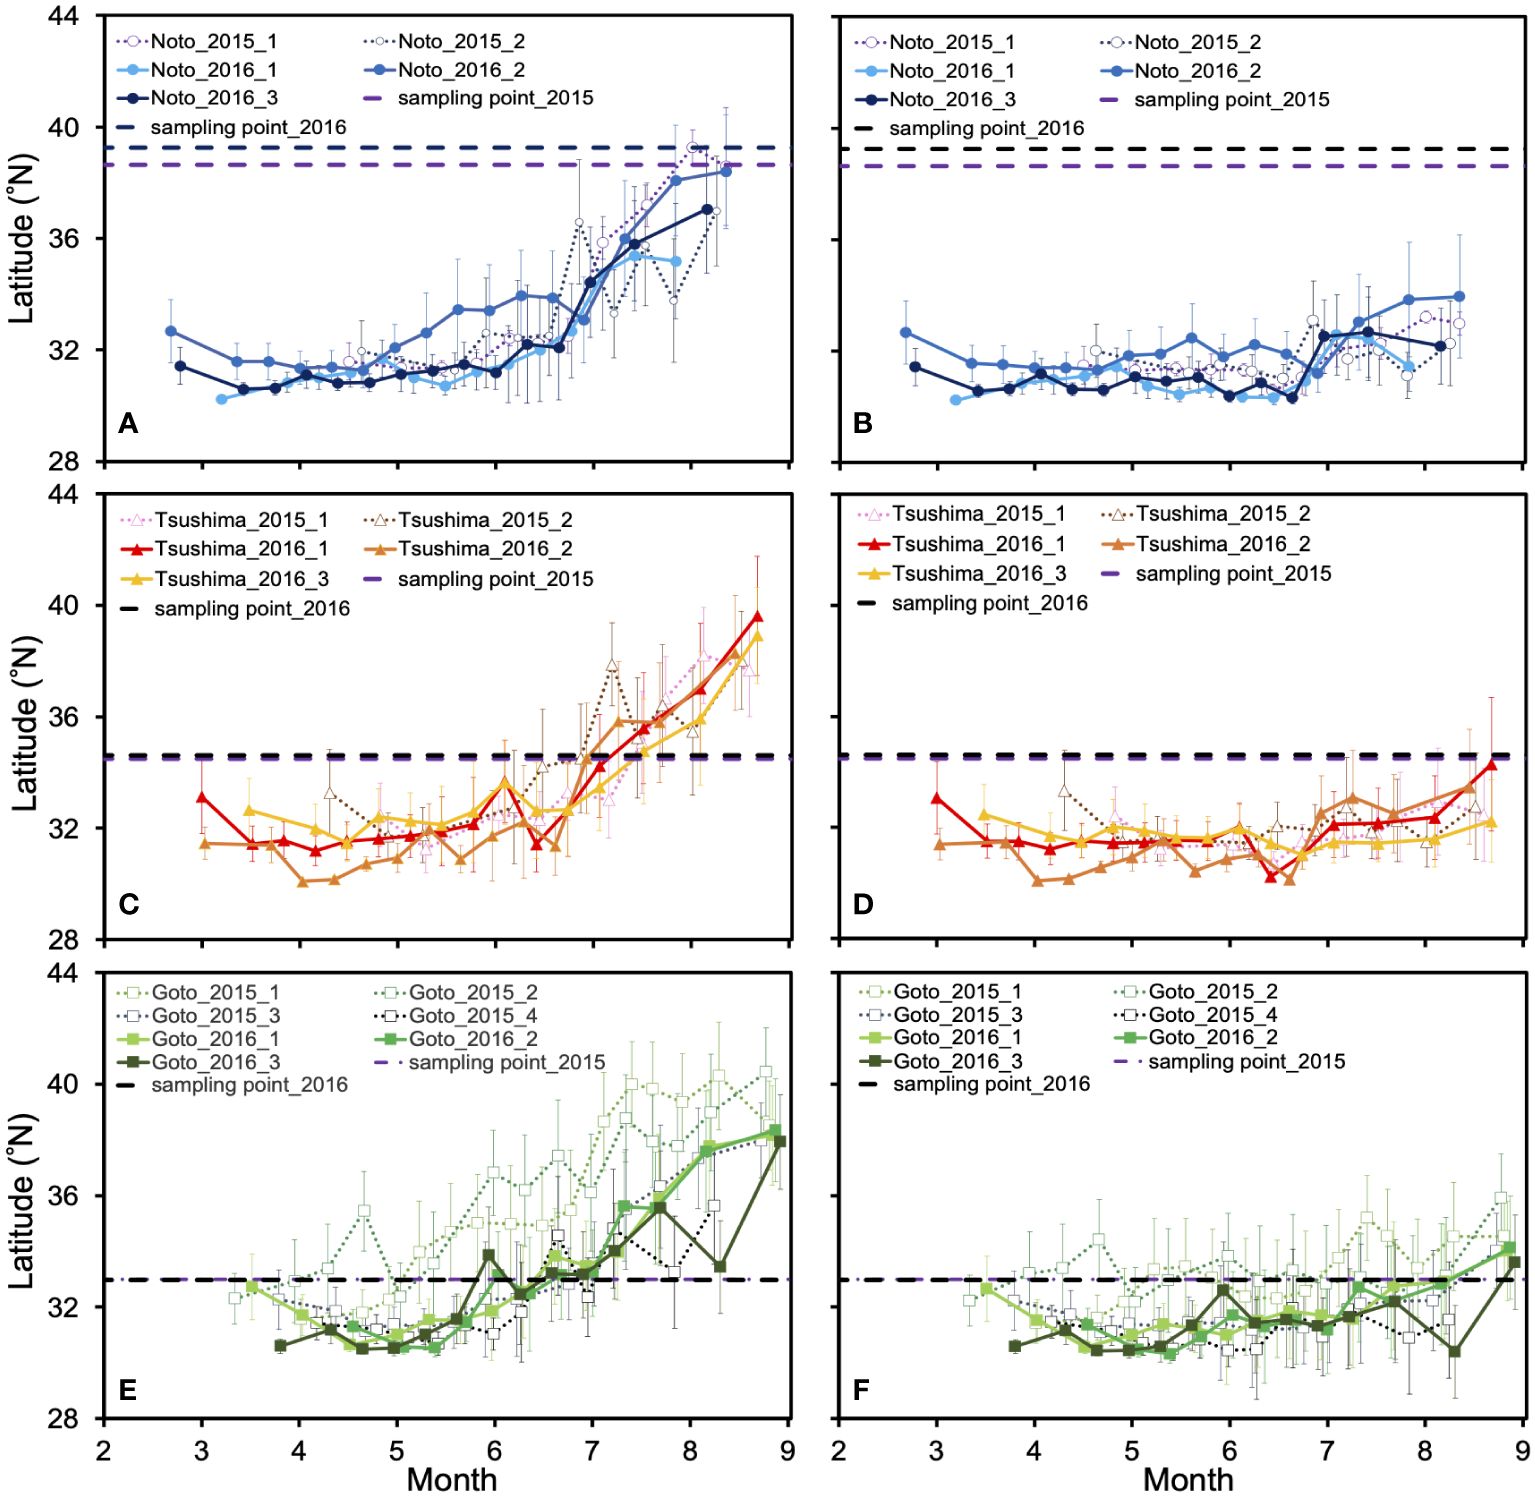
Figure 4 Temporal variation in mean latitude of estimated distribution areas for each individual. The vertical bars in each plot indicate the standard deviation. The upper panel shows the latitudinal variation of individuals from off Noto Peninsula (A, B), the middle panel shows Tsushima Strait (C, D), and the lower panel shows off Goto Islands (E, F). The left column shows the results of 10 m depth (A, C, E), and the right column shows 30 m depth (B, D, F). The purple and black dashed lines indicate the latitude of the sampling points in 2015 and 2016.
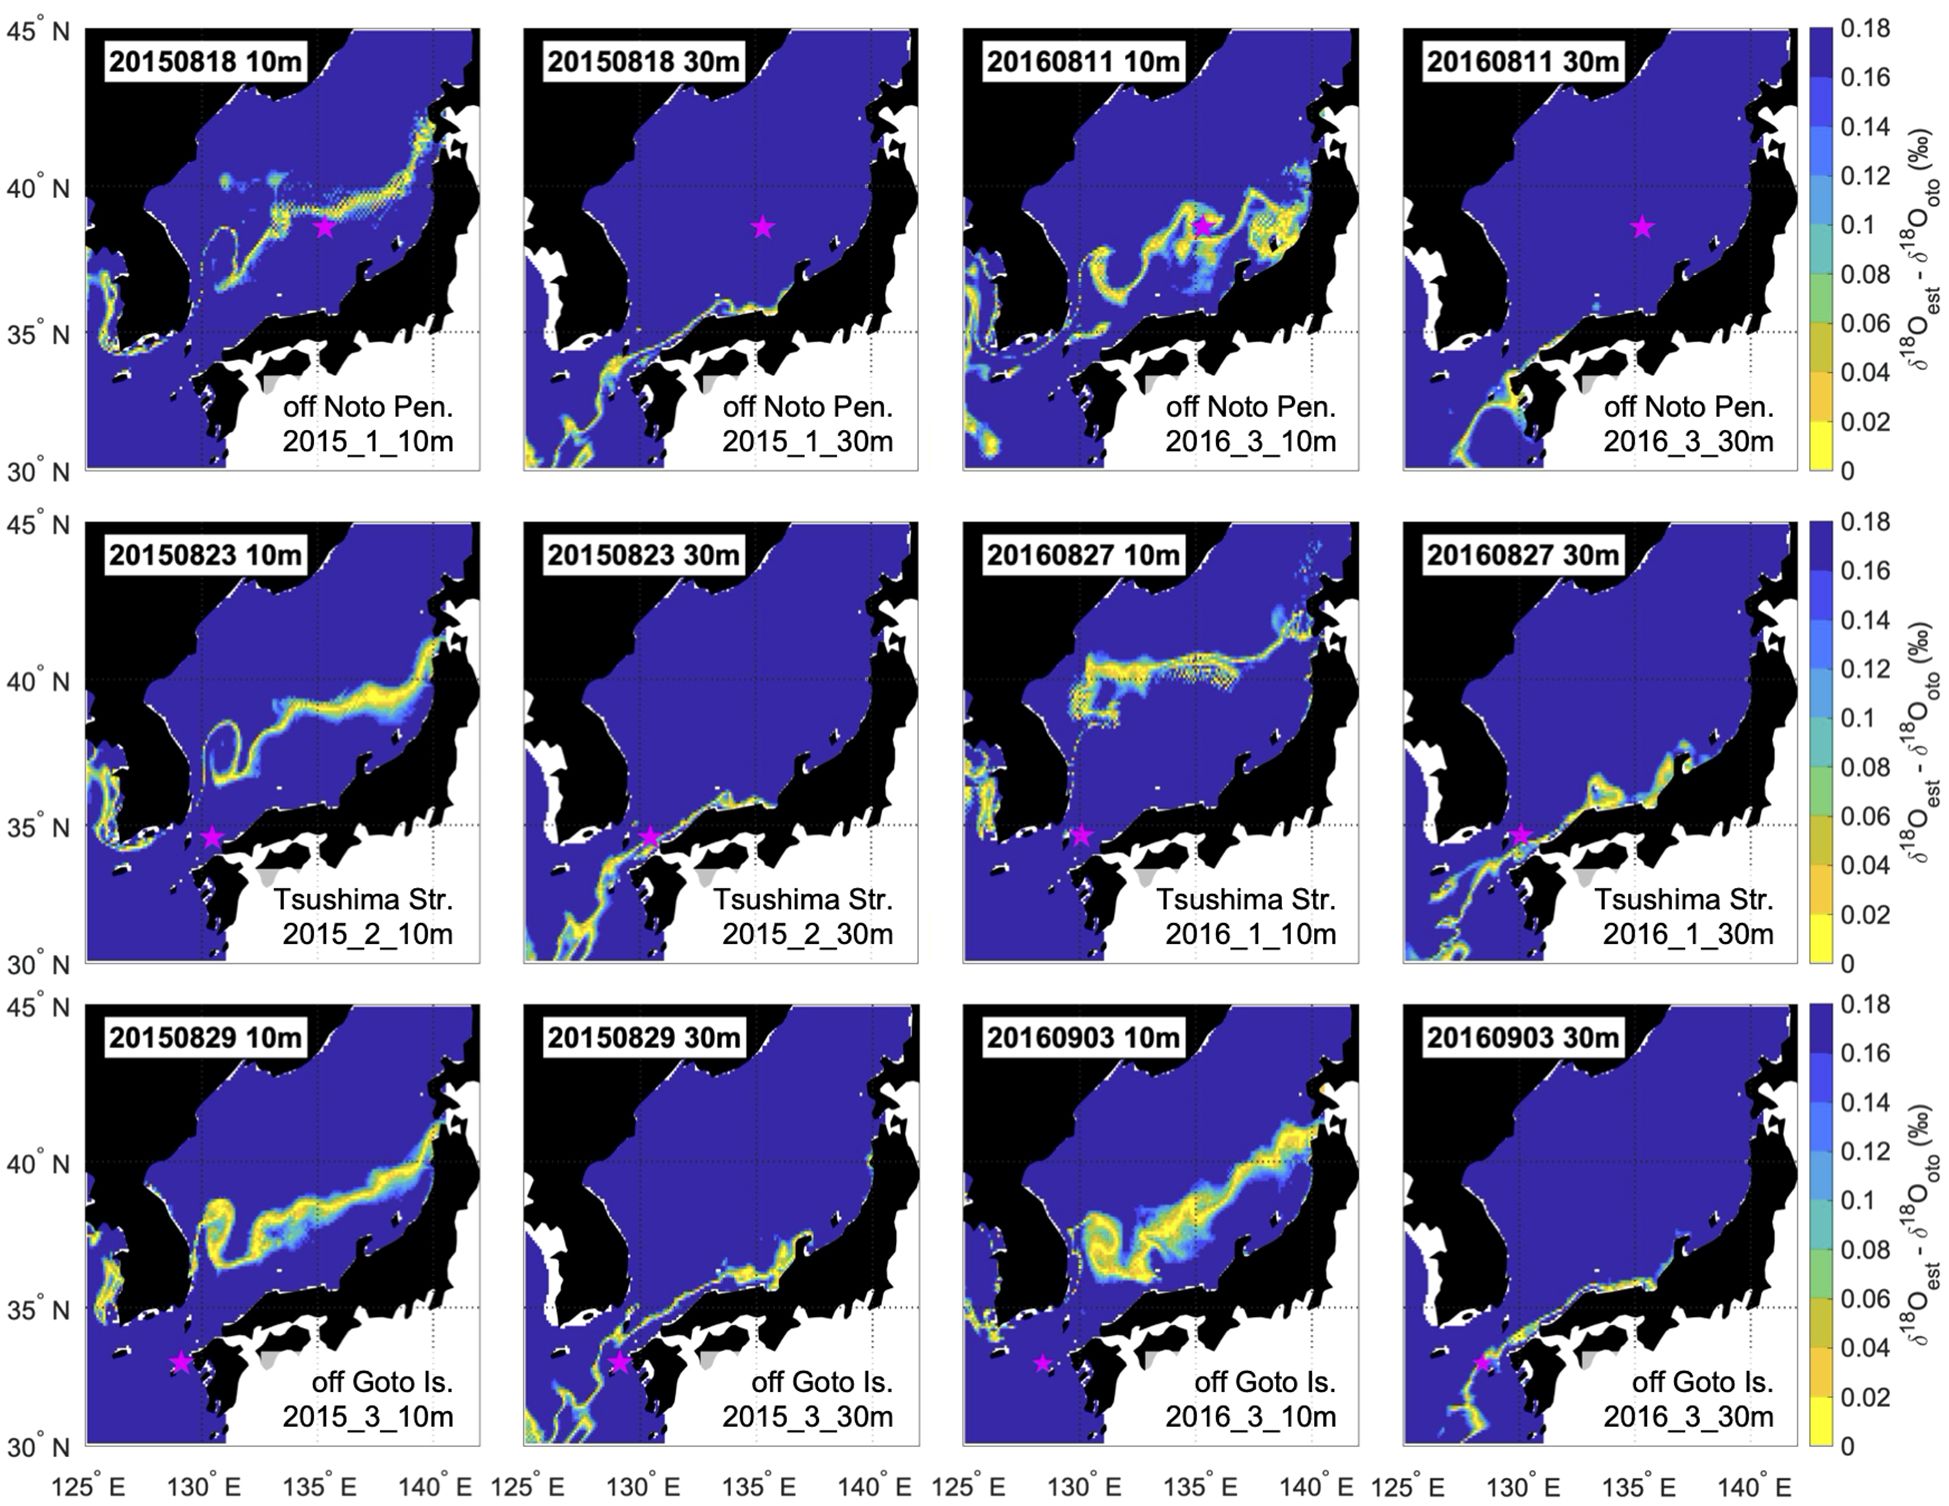
Figure 5 The estimated distribution areas nearest to the date of sampling, calculated at depths of 10 and 30 m for one representative individual from each sampling area and year. Sample ID and calculated water depth are shown in the lower right corner of each panel. The upper row shows the result of off Noto Peninsula, the middle row shows Tsushima Strait, and the lower row shows off Goto Islands. The left two columns show the estimated distribution areas for individuals sampled in 2016, and the right two columns show the estimated distribution areas for individuals sampled in 2015.
3.4 Comparison of hatching dates, BL and daily growth rate differences
There was a significant difference in the hatching dates between the northward migration group (63 ± 32 days from January 1st; mean ± 1SD) and the resident group (43 ± 30 days from January 1st) (Table 2, p< 0.02, Mann-Whitney U test). The mean BL of the northward group was 136.7 ± 6.4 mm and that of the resident group was 118.9 ± 9.4 mm. The BL of the northward group was significantly larger than that of the resident group (Table 2, p< 0.001, Mann-Whitney U test). In spring (March-May), the mean back-calculated BL of the resident group was larger than that of the northward migration group (Figure 6). However, from June, the mean back-calculated BL of the northward migration group was higher than that of the resident group. The mean BL at July 1st, which roughly corresponds to the timing when migration patterns started to diverge, was significantly larger in the northward migration group (northward migration: 104.8 ± 14.4 mm, resident: 95.1 ± 14.8 mm, Mann-Whitney U test, p< 0.01, Table 2). When compared by daily age, the normalized deviation of daily growth rate among the three sampling areas was significantly different during 56–147 (with exception for 69, 76–78, and 140) daily age (p< 0.05, Kruskal-Wallis test). Between the off Noto Peninsula and off Goto Islands individuals, the post-hoc Steel-Dwass test showed that the normalized deviation of daily growth rate was significantly different during 56–103 (with exception for 69, 76–78, 89, and 97–98) daily age (Figure 7, p< 0.05). Between the off Noto Peninsula and Tsushima Strait individuals, the deviation was significantly different between 58–147 (with exception for 65–70, 76–78, 87, 140) daily age (Figure 7, p< 0.05). When compared by calendar days, there was a significant difference among groups during 113–233 (with exception for 120, 152–157, 170, 192, 207–210, 214, 221–223, 229 and 231) days from January 1st (late April to late July) (p< 0.05, Kruskal-Wallis test). The post-hoc Steel-Dwass test results showed that the normalized deviation of daily growth rate of the off Goto Islands individuals were significantly different from those of the off Noto Peninsula individuals during 114–230 (with exception for 119–120, 122–140, 143–148, 151–162, 167–180, 182–184, 192, 207–210, 214, 220–229) days. Between the off Noto Peninsula and Tsushima Strait individuals, the deviation was significantly different during 113–213 (with exception for 120, 152–157, 170, 207–212) days. The differences were commonly significant during 114–118 days (late April) and 185–191 (early July) and 194–206 days (middle July to late July) (Figure 7, p< 0.05), if the periods that showed significance more than 5 sequential days.
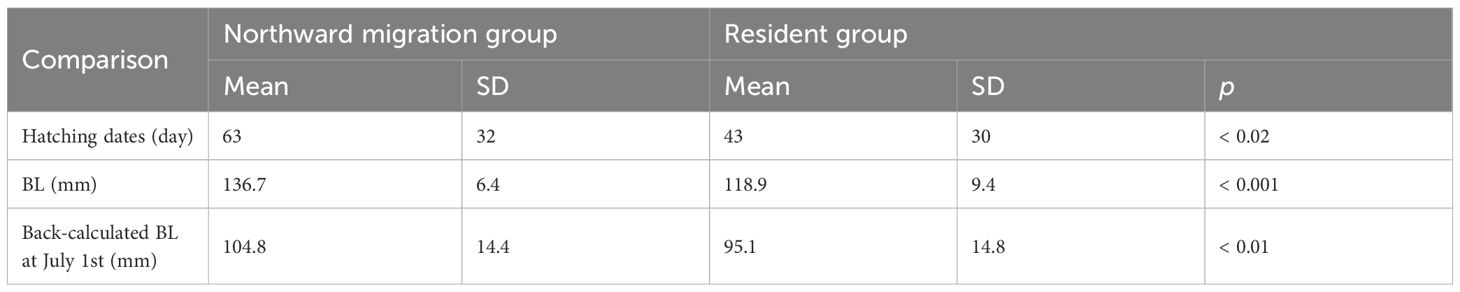
Table 2 Summary of each characteristic compared by Mann-Whitney U test among groups with different migration patterns.
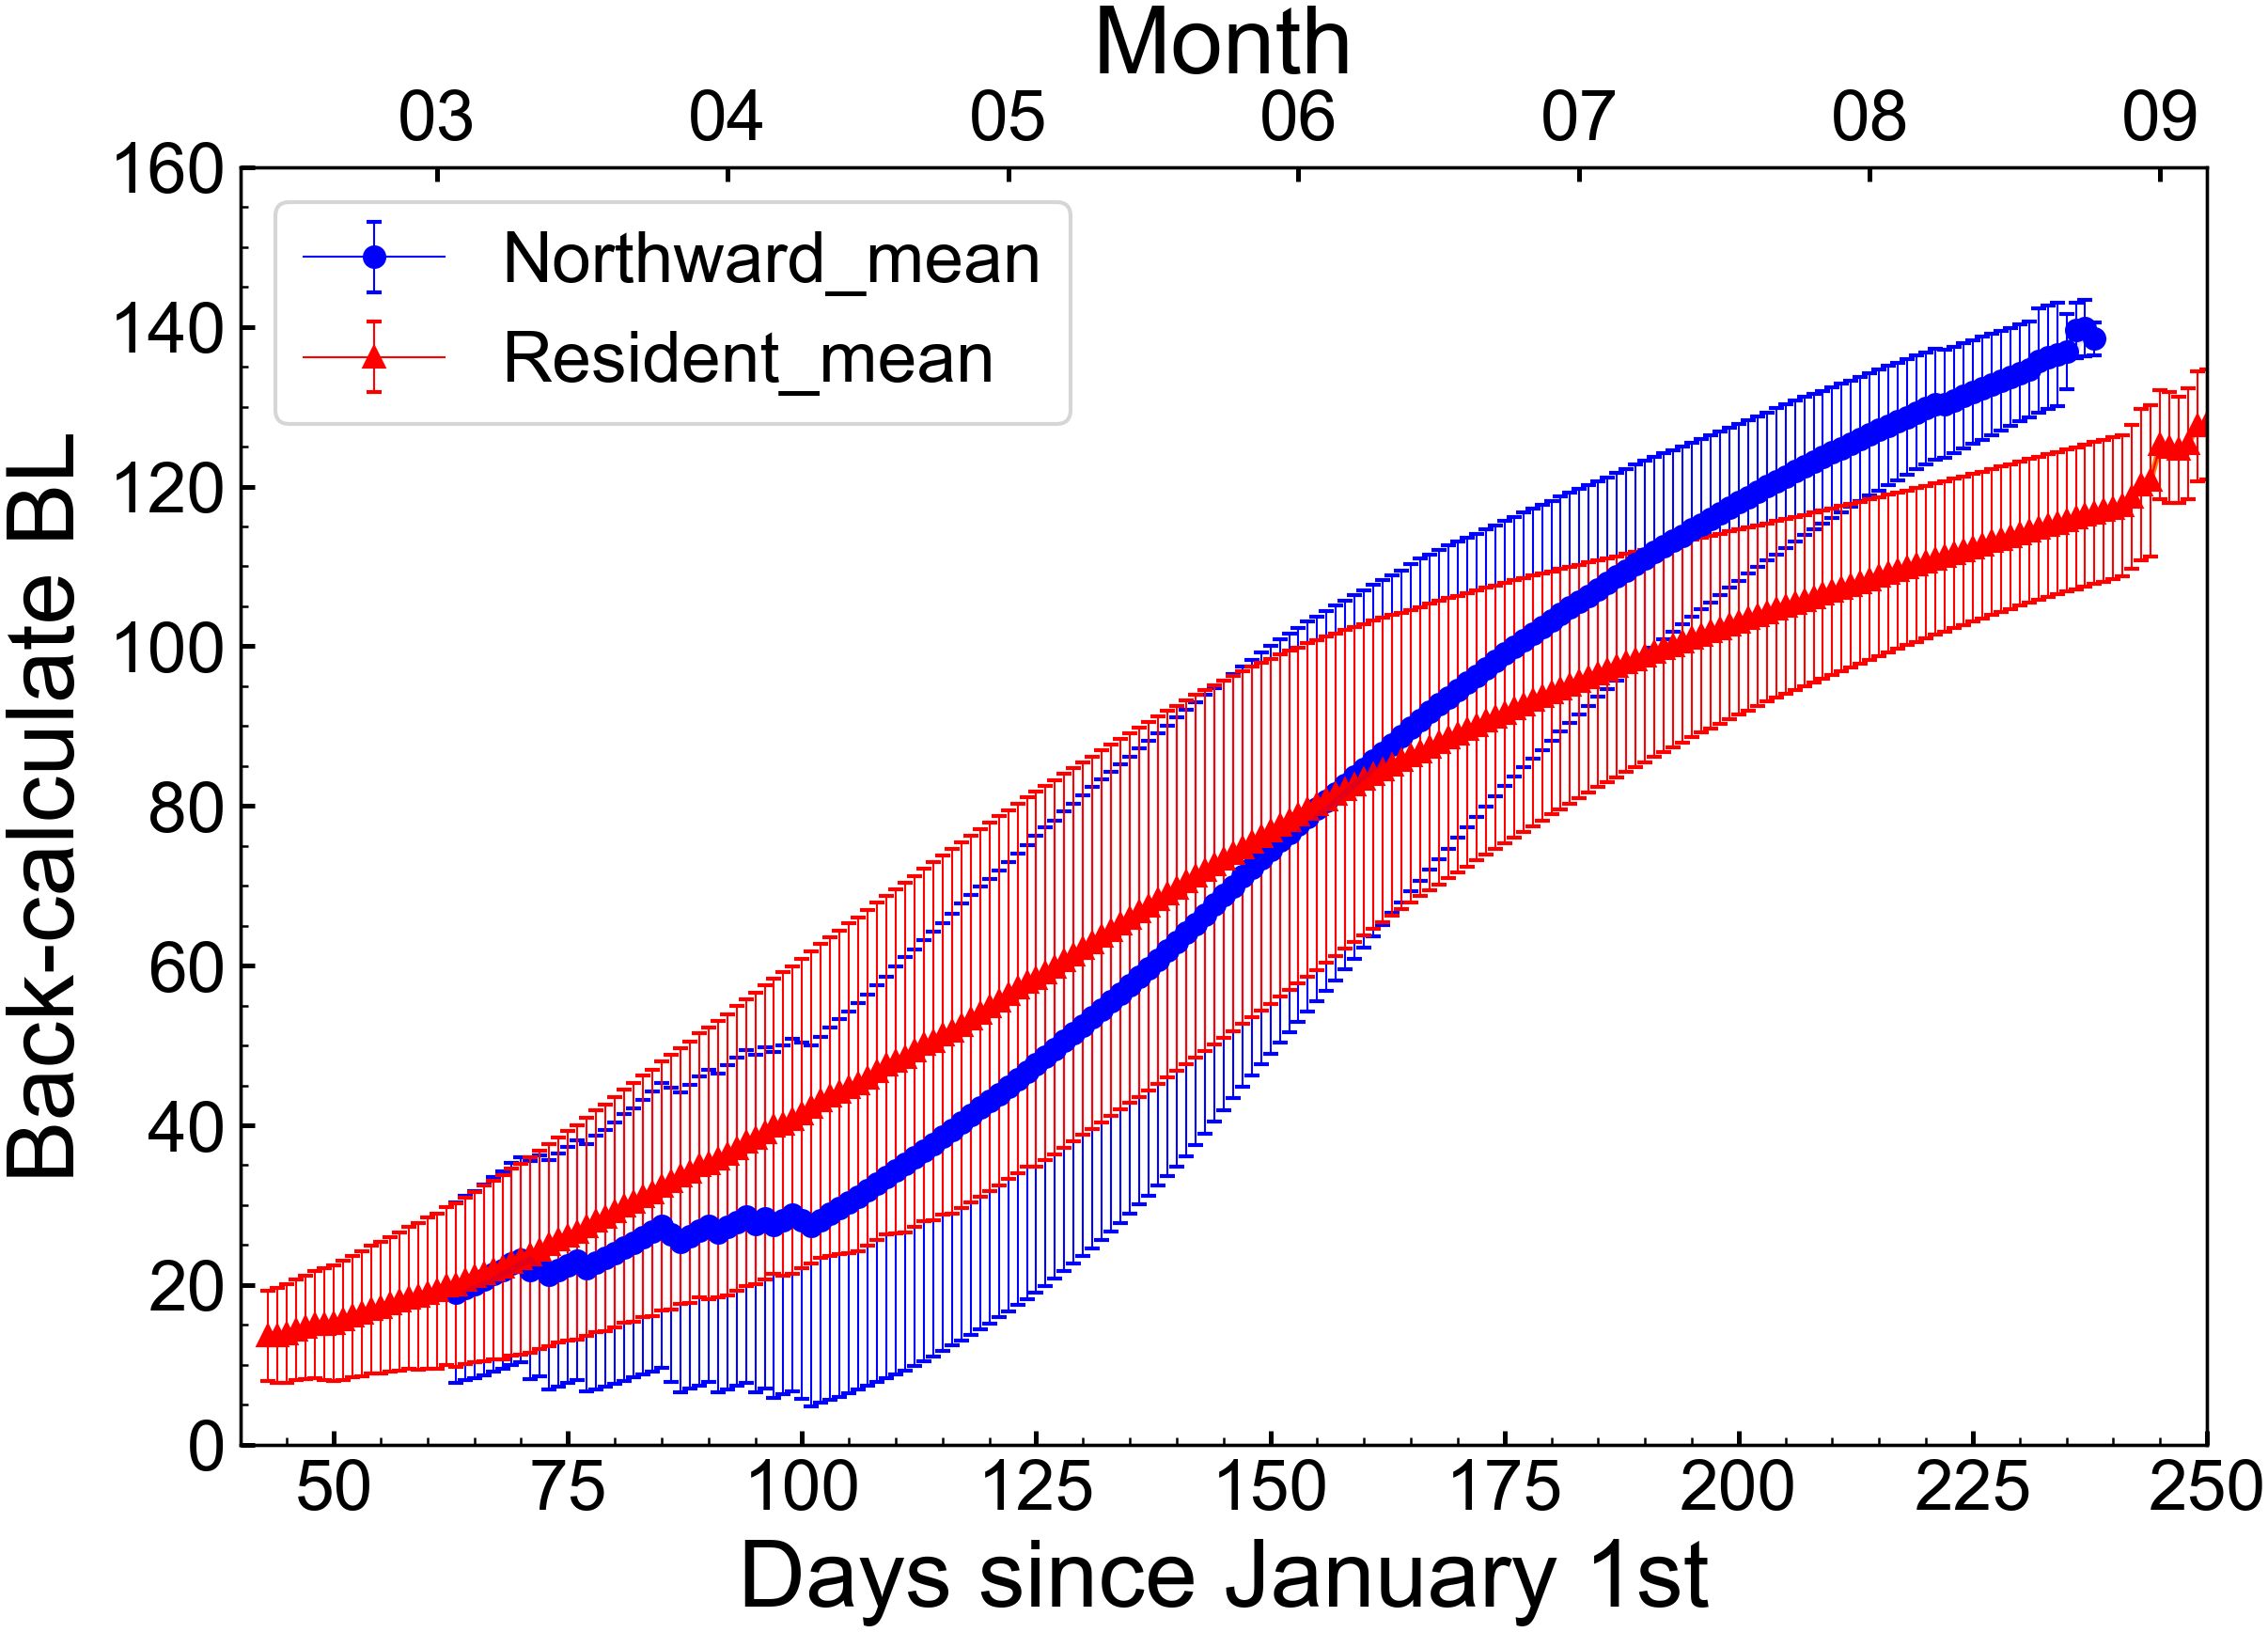
Figure 6 Back-calculate body length (BL) of the northward migration group (blue line) and the resident group (red line) at each calendar day.
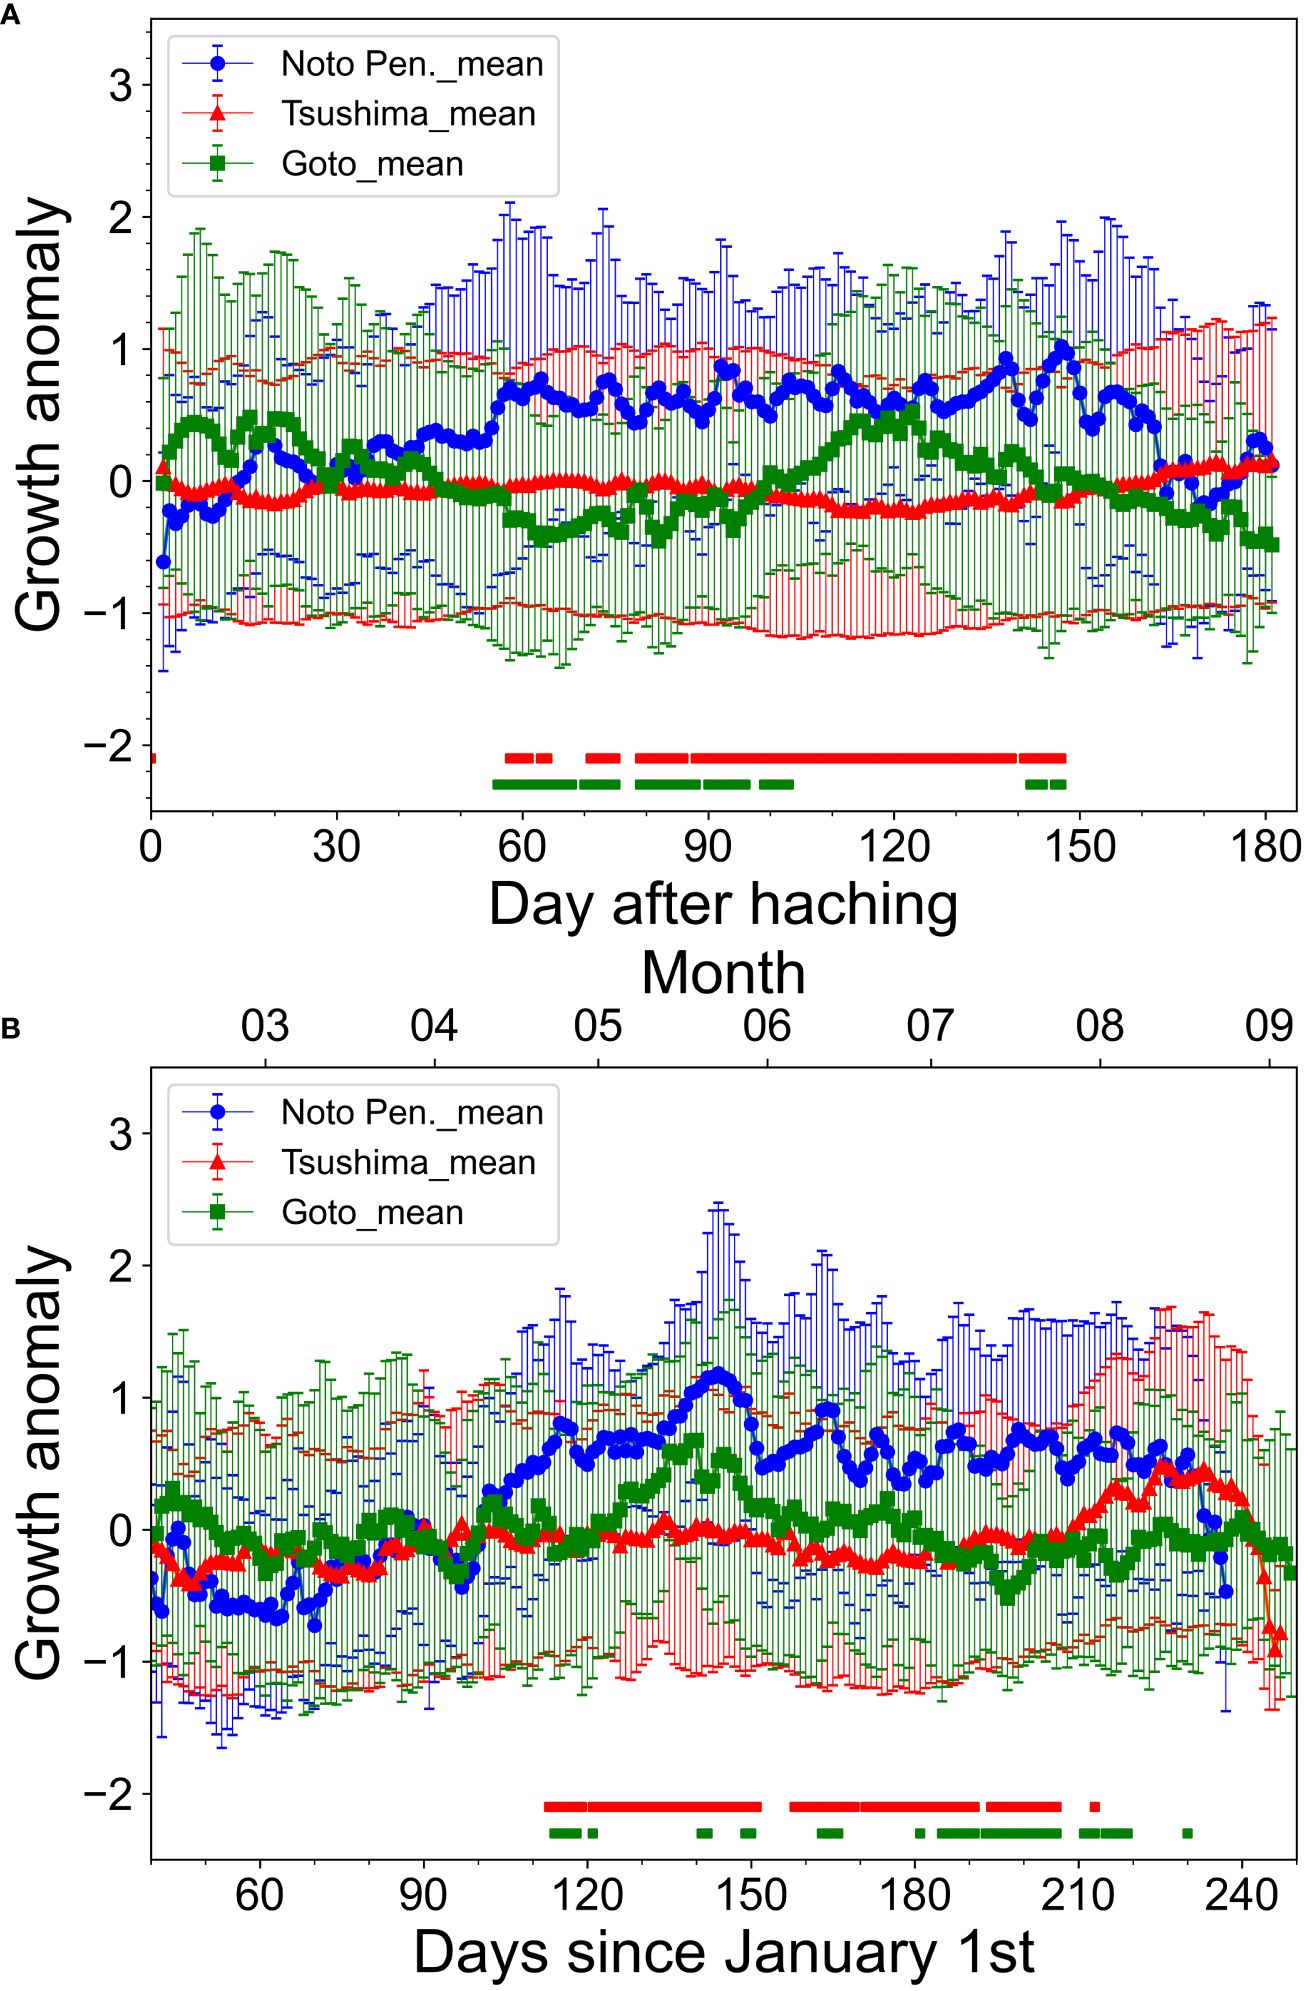
Figure 7 Normalized anomaly of daily growth rate averaged for each sampling areas (blue line: off Noto Peninsula, red line: Tsushima strait, and green line: off Goto Islands). The upper panel shows daily age (A) and the lower panel shows calendar day (B). The red and green intervals at the bottom of the Figure indicate the range of significant differences in the daily growth rate between off Noto Peninsula and Tsushima Strait (red), and between off Noto Peninsula and off Goto Islands (green), respectively (p< 0.05, Steel-Dwass test).
4 Discussion
In this study, we conducted a high temporal resolution analysis of δ18Ooto for the young-of-the-year Japanese sardines collected in the Sea of Japan in 2015 and 2016 and reconstructed their migration histories based on a simple method that combines δ18Ooto and an ocean data assimilation model. The values of δ18Ooto showed similar declines with daily age, presenting almost no significant differences among individuals that were collected from the northern and southern sampling locations. This was contrary to our hypothesis that higher δ18Ooto value would be associated with fish collected in the northern area due to the cooler sea surface temperature compared to the southern region; this was attributed to the negative correlation between temperature and δ18Ooto (Sakamoto et al., 2017). Moreover, δ18Owater was similar in the northern and southern areas (Supplementary Figure S4) and hence, similarity in δ18Ooto profiles in fish collected from the three sampling areas cannot be explained by the compensation of δ18Owater. However, these similarities could be attributed to the differences in habitat depth. For the specimens that were collected off the Noto Peninsula, the estimated distribution areas at a depth of 10 m were consistent with the actual sampling areas, but those at a depth of 30 m were significantly different from the actual sampling areas (Figure 5). In contrast, for the specimens that were collected off Goto Islands and Tsushima Strait, the estimated distribution areas at a depth of 30 m were consistent with the actual sampling areas, whereas those at a depth of 10 m were different (Figure 5). This suggests that individuals in the northern and southern regions were distributed at different depths in late summer. However, the estimated distribution areas suggested that the northward migration and the resident groups shared the west offshore of Kyushu as a nursery ground, at least until mid-June to early July, regardless of the estimated habitat depth. These results suggest that there were two migration patterns in individuals that hatched offshore of Kyushu in the west: one migration group started to migrate northward using a shallow layer at some period after mid-June, and a resident group that stayed in the southern area of the Sea of Japan but at a relatively deeper depth in summer. Of course, the estimated distribution areas from δ18Ooto include uncertainties generated by errors in the relationship between δ18Ooto and temperature, relationship between δ18Owater and salinity, and temperature and salinity from the ocean data assimilation model. The estimated δ18Ooto profiles of individuals from different locations were all similar, which suggests both groups share the habitats during the unstratified season and differentiate the water depth during the stratified season. We simplified the distribution depth to a fixed layer, but the actual vertical habitat layer might vary seasonally or ontogenetically in addition to diel vertical migration. As a future work, a migration model could improve understanding of three-dimensional migration route of Japanese sardine combined with δ18Ooto information.
The northward migration and the resident groups showed significant differences in growth trajectories. Of course, the back-calculated BL includes errors originating from the assumption of the fixed initial BL. But, the mean BL in spring (March-May) was substantially larger in the resident group (Figure 6). This was likely because the mean hatch date of the resident group was earlier than that of the northward migration group (Table 2). No difference in the growth rate was observed between the resident group and the northward migration group up to 50 days after hatching (Figure 7). However, the northward migration group grew faster 50 days after hatching than the resident group, and they became larger in June, despite their smaller size in spring (March-May). This suggests that individuals that grow relatively well during late spring and early summer within the population migrated northward.
A migration pattern that includes both migratory and resident individuals is called partial migration, which is observed in various animals, including fish (Chapman et al., 2011, 2012). There are three types of seasonal partial migration of fish species (Chapman et al., 2012). The first is non-breeding partial migration, in which migrants and residents breed sympatrically, but spend non-breeding seasons separately. The second type is partial breeding migration, in which migrants and residents share a non-breeding habitat but breed separately. The third is skipped breeding partial migration, in which migrants and residents share a non-breeding habitat, and individuals migrate to breed, but not every year, leading to partial migration. In addition to the above three types of partial migration, a shorter spatio-temporal partial migration is identified: partial diel vertical migration, in which migrants move vertically during the day or night while residents remain at the same depth (more details see Chapman et al., 2012). In the family of Japanese sardine, Clupea harengus shows the characteristic of the breeding partial migrants—they share a common feeding ground but migrate to different areas to spawn in the North Sea (Ruzzante et al., 2006). The Celtic Sea populations of C. harengus migrate into the Irish Sea for spawning; these migrants of age-1 juveniles grow more slowly than residents and are therefore recruited later to the adult population (Burke et al., 2008). It is often observed that the body sizes of migrants and residents differ in animals who undergo partial migration (e.g., Kerr et al., 2009). Various hypotheses have been proposed regarding the factors that contribute to size differences (Chapman et al., 2011). The traditional “body size” hypothesis states that a larger body size is advantageous for residents because of their high physiological tolerance to adverse winter conditions (Ketterson and Nolan, 1976). However, exceptions to this hypothesis have been confirmed. Larger individuals of the offspring of Oncorhynchus mykiss, which have high energy requirements, tend to migrate (Liberoff et al., 2014). Within skipjack tuna (Katsuwonus pelamis) tagged and released from the same location in the western North Pacific, higher percentages of larger (46 cm or larger) individuals were collected at higher latitudes than smaller (44 cm or smaller) individuals (Nihira, 1996). In addition, northward-migrated skipjack tuna had higher energy consumption than those at lower latitudes (Aoki et al., 2017). These findings suggest that the higher energy requirements of larger individuals promote migration, even for fish species. Similarly, in the case of the Japanese sardine in the Sea of Japan, larger individuals might migrate to acquire more energy due to the increase in sea surface temperature around Kyushu.
The water temperatures at depths of 10 m and 30 m on the west offshore of Kyushu were almost the same from February to June (Figure 8). After June, however, the increase in water temperature at 10 m depth accelerated, and there was a difference between the water temperature at the depths of 10 m and 30 m due to the development of stratification. Excessive higher temperatures result in higher energy dissipation and demand substantial energy intake by consumption (Rudstam, 1988; Ito et al., 2013). The Japanese sardine might have avoided this by selecting one of the following two strategies: horizontally migrating northward at shallower depths or moving to deeper habitat depths and staying in the same area. Individuals with better growth and larger body size would have higher energy demands (Noguchi et al., 1990). Meanwhile, the abundance of zooplankton in the western Sea of Japan gradually decreases from spring to summer (Hirakawa et al., 1995); and zooplankton abundance and energy content in the northern Sea of Japan are higher than those in the western Sea of Japan during the summer months (Yasuda et al., 2021). The Japanese sardine in the northern offshore area had larger sizes and higher lipid contents (Yasuda et al., 2021). The Japanese sardines that were able to successfully reach the northern offshore area were rewarded with a better prey field. Thus, larger individuals that required more food may have migrated northward to remain in the optimal water temperature range and seek places where food is abundant. As partial migration was accompanied by habitat depth differences, this case may be considered a combination of non-breeding partial migration and partial vertical migration with larger migrants.
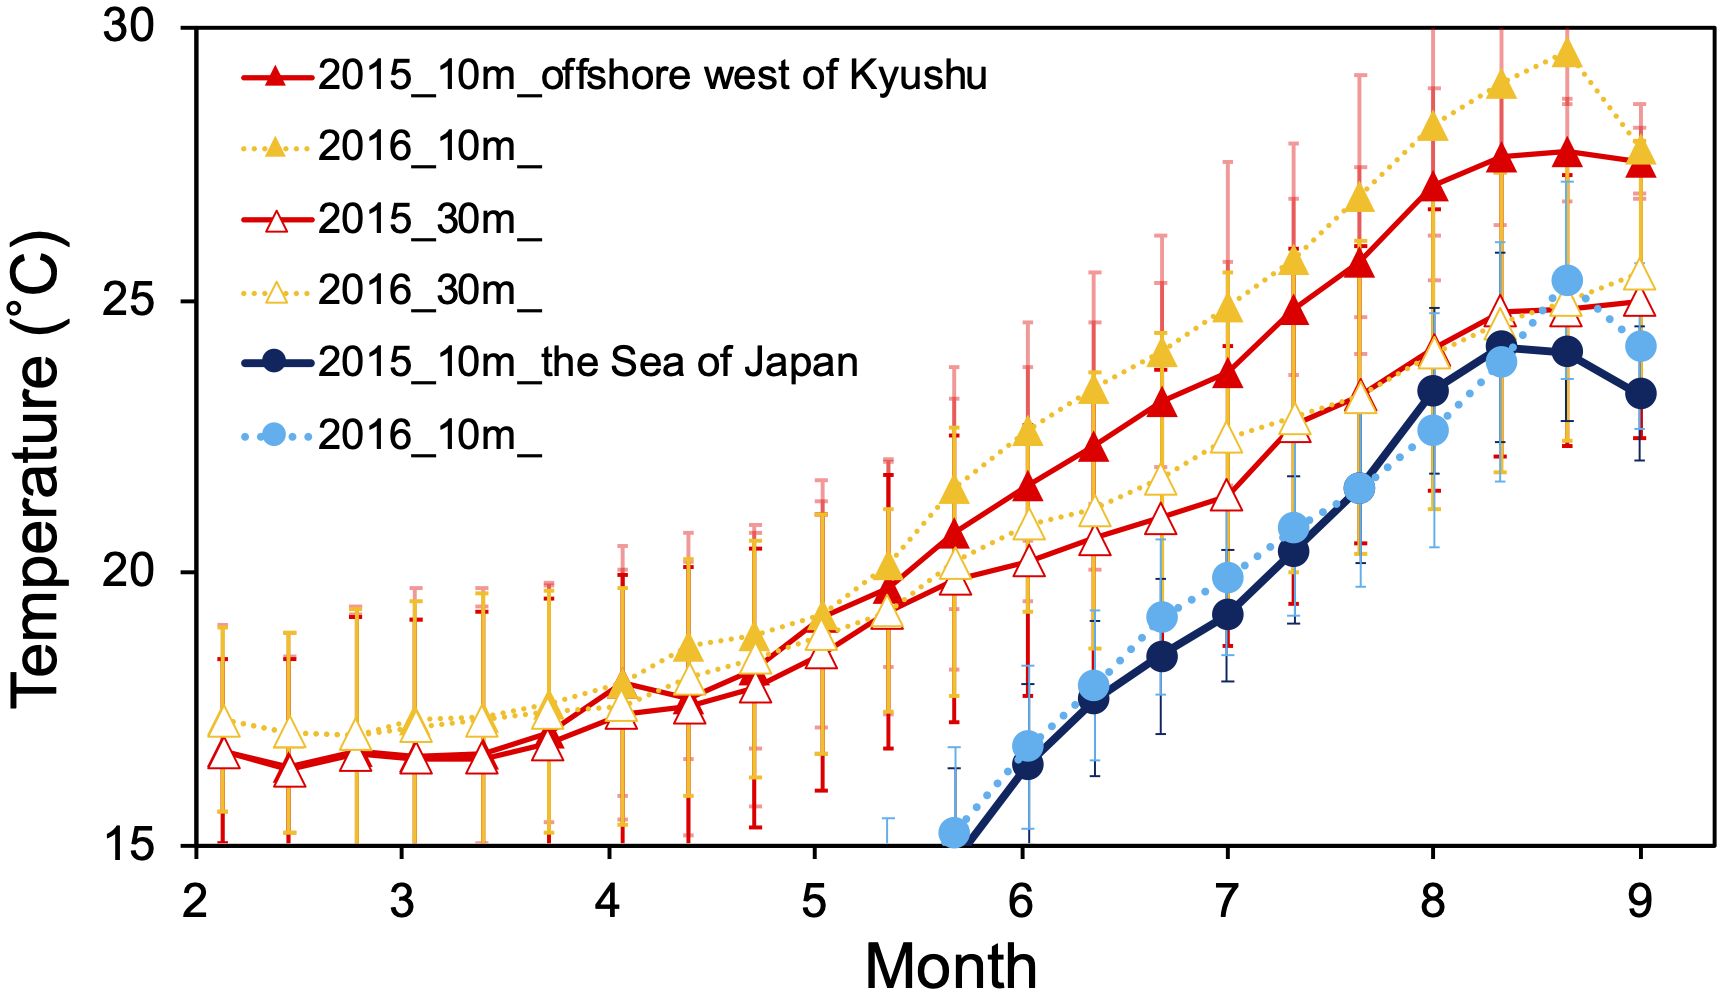
Figure 8 Water temperature variations extracted from FRA-ROMS on the offshore west of Kyushu (127–130°E, 30–34°N; solid triangles indicate 10 m depth, open triangles indicate 30 m depth) and the northern offshore area of the Sea of Japan (130–140°E, 36–40°N; solid circles indicate 10 m depth). The error bar of each plot shows the standard deviation in the area.
Size dependence in the selection of migration patterns provides insights into the mechanisms of population growth. If only larger individuals in summer migrate from the west offshore of Kyushu to reach a better prey field in the northern offshore area, growth rates from late spring to early summer in the southern area may determine the proportion of migratory individuals to the northern offshore area of the Sea of Japan. Enhanced feeding conditions and larval growth in the west offshore of Kyushu could increase the number of young-of-the-years that have better nutritional conditions in the northern offshore, and ultimately increase the reproduction rate of the Tsushima Warm Current stock. Consistent with this hypothesis, historical analysis of the distribution of the Tsushima Warm Current stock showed an abundance increase in the northern offshore area of the Sea of Japan during the high biomass period (Muko et al., 2018). Thus, the west offshore of Kyushu can be considered as a key area for stock fluctuations. However, these discussions have caveats. All of the samples we analyzed δ18Ooto were estimated to have hatched in the west offshore of Kyushu, but the eggs and larvae were found in the wide coastal area of the Sea of Japan, and the contributions of the other areas to the northward migration group have not been determined. Moreover, the proportion of the northward migration group to the recruitment of the Tsushima Warm Current stock remains unclear. Further studies on population structure are needed to understand the importance of the environment west offshore of Kyushu for the stock.
In conclusion, we revealed migrations in the early life stages of the young-of-the-year Japanese sardine in the Sea of Japan in 2015 and 2016. They all hatched and grew west offshore of Kyushu until late June, and may have chosen one of the two strategies to avoid high temperatures within seasonal and geographical limits: migrating northward or moving deeper. Relatively well-grown individuals in summer were more likely to migrate northward to better feeding grounds, thereby suggesting that the environmental conditions in spawning and nursery grounds west offshore of Kyushu may be important for total energy acquisition during the first year of life. In future, it will be necessary to elucidate the factors that control the growth of individuals west of Kyushu. In addition, further analysis of the population structure is necessary to examine the contribution of individuals from spawning grounds in the Sea of Japan to the Tsushima Warm Current Stock.
Data availability statement
The original contributions presented in the study are publicly available for otolith microchemistry analyses at https://doi.org/10.6084/m9.figshare.25241842. Other data supporting the conclusions of this article will be made available by the authors, without undue reservation..
Ethics statement
Ethical approval was not required for the study involving animals in accordance with the local legislation and institutional requirements because this study used sardine samples which were captured by the Fisheries Research and Education Agency for fishery stock assessment.
Author contributions
TA: Data curation, Formal analysis, Investigation, Methodology, Visualization, Writing – original draft. TS: Conceptualization, Methodology, Writing – original draft. TI: Conceptualization, Funding acquisition, Investigation, Methodology, Project administration, Resources, Supervision, Writing – original draft. MT: Data curation, Funding acquisition, Investigation, Project administration, Resources, Writing – review & editing. TY: Data curation, Investigation, Resources, Writing – review & editing. SK: Investigation, Resources, Writing – review & editing. KN: Investigation, Supervision, Writing – review & editing. TM: Investigation, Writing – review & editing. AI: Investigation, Writing – review & editing. S-I: Formal analysis, Funding acquisition, Supervision, Writing – review & editing.
Funding
The author(s) declare financial support was received for the research, authorship, and/or publication of this article. This study was partly supported by grants from the Fisheries Agency of Japan, Kurita Water and Environment Foundation, JSPS KAKENHI (16H02944, 18H04921, 19H04247, 21H04735, 21K18653, and 22H05030), and JST FOREST Program (JPMJFR221F).
Acknowledgments
The preprint of this article is on arXiv: http://arxiv.org/abs/2402.18602; Aono et al. (2024). We express special thanks to Dr. Akira Hayashi for providing otolith daily ring analysis data. We thank S. Sakai for technical advice on micromilling and J. Ibuki and S. Namekawa for technical support with the isotopic analysis. T. Setou provided the hydrodynamic model outputs (Aono et al., 2024).
Conflict of interest
The authors declare that the research was conducted in the absence of any commercial or financial relationships that could be construed as a potential conflict of interest.
The author(s) declared that they were an editorial board member of Frontiers, at the time of submission. This had no impact on the peer review process and the final decision.
Publisher’s note
All claims expressed in this article are solely those of the authors and do not necessarily represent those of their affiliated organizations, or those of the publisher, the editors and the reviewers. Any product that may be evaluated in this article, or claim that may be made by its manufacturer, is not guaranteed or endorsed by the publisher.
Supplementary material
The Supplementary Material for this article can be found online at: https://www.frontiersin.org/articles/10.3389/fmars.2024.1394801/full#supplementary-material
References
Aoki Y., Kitagawa T., Kiyofuji H., Okamoto S., Kawamura T. (2017). Changes in energy intake and cost of transport by skipjack tuna (Katsuwonus pelamis) during northward migration in the northwestern Pacific Ocean. Deep Sea Res. Part II: Topical Stud. Oceanogr. 140, 83–93. doi: 10.1016/j.dsr2.2016.05.012
Aono T., Sakamoto T., Ishimura T., Takahashi M., Yasuda T., Kitajima S., et al. (2024). Estimation of migrate histories of the Japanese sardine in the Sea of Japan by combining the microscale stable isotope analysis of otoliths and a data assimilation model. arXiv. 2402.18602.
Burke N., Brophy D., King P. A. (2008). Shape analysis of otolith annuli in Atlantic herring (Clupea harengus); a new method for tracking fish populations. Fisheries Res. 91, 133–143. doi: 10.1016/j.fishres.2007.11.013
Campana S. E. (1990). How reliable are growth back-calculations based on otoliths? Can. J. Fisheries Aquat. Sci. 47, 2219–2227. doi: 10.1139/f90-246
Campana S. E. (1999). Chemistry and composition of fish otoliths: Pathways, mechanisms and applications. Mar. Ecol. Prog. Ser. 188, 263–297. doi: 10.3354/meps188263
Chapman B. B., Brönmark C., Nilsson J. Å., Hansson L. A. (2011). The ecology and evolution of partial migration. Oikos 120, 1764–1775. doi: 10.1111/j.1600-0706.2011.20131.x
Chapman B. B., Skov C., Hulthén K., Brodersen J., Nilsson P. A., Hansson L. A., et al. (2012). Partial migration in fishes: Definitions, methodologies and taxonomic distribution. J. Fish Biol. 81, 479–499. doi: 10.1111/j.1095-8649.2012.03349.x
Chavez F. P., Ryan J., Lluch-Cota S. E., Niquen C M. (2003). From anchovies to sardines and back: Multidecadal change in the Pacific Ocean. Science 299, 217–221. doi: 10.1126/science.1075880
Chiang C. I., Chung M. T., Shiao J. C., Wang P. L., Chan T. Y., Yamaguchi A., et al. (2020). Seasonal Movement Patterns of the Bigfin Reef Squid Sepioteuthis lessoniana Predicted Using statolith δ18O Values. Front. Mar. Sci. 7. doi: 10.3389/fmars.2020.00249
Darnaude A. M., Hunter E. (2018). Validation of otolith δ18O values as effective natural tags for shelf-scale geolocation of migrating fish. Mar. Ecol. Prog. Ser. 598, 167–185. doi: 10.3354/meps12302
Darnaude A. M., Sturrock A., Trueman C. N., Mouillot D., Campana S. E., Hunter E. (2014). Listening in on the past: What can otolith δ18O values really tell us about the environmental history of fishes? PloS One 9, e108539. doi: 10.1371/journal.pone.0108539
Furuichi S., Kamimura Y., Yukami R. (2021). Length–length and length–weight relationships for four dominant small pelagic fishes in the Kuroshio–Oyashio Current system. Thalassas: Int. J. Mar. Sci. 37, 651–657. doi: 10.1007/s41208-021-00300-9
Furuichi S., Yasuda T., Kurota H., Yoda M., Suzuki K., Takahashi M., et al. (2020). Disentangling the effects of climate and density-dependent factors on spatiotemporal dynamics of Japanese sardine spawning. Mar. Ecol. Prog. Ser. 633, 157–168. doi: 10.3354/meps13169
Haidvogel D. B., Arango H., Budgell W. P., Cornuelle B. D., Curchitser E., Di Lorenzo E., et al. (2008). Ocean forecasting in terrain-following coordinates: Formulation and skill assessment of the Regional Ocean Modeling System. J. Comput. Phys. 227, 3595–3624. doi: 10.1016/j.jcp.2007.06.016
Hanson N. N., Wurster C. M., Todd C. D. (2013). Reconstructing marine life-history strategies of wild Atlantic salmon from the stable isotope composition of otoliths. Mar. Ecol. Prog. Ser. 475, 249–266. doi: 10.3354/meps10066
Hirakawa K., Kawano M., Nishimura S., Ueno S. (1995). Seasonal variability in abundance and composition of zooplankton vicinity of the Tsushima Straits, Southwestern Japan sea. Bull. Japan Sea Natl. Fisheries Res. Institute 45, 25–38.
Hjort J. (1914). Fluctuations in the great fisheries of northern Europe viewed in the light of biological research. Rapp. P.-v. Reum. Cons. Int. Explor. Mer 20, 1–228.
Horikawa K., Kodaira T., Zhang J., Murayama M. (2015). δ18Osw estimate for Globigerinoides ruber from core-top sediments in the East China Sea. Prog. Earth Planet. Sci. 2, 19. doi: 10.1186/s40645-015-0048-3
Ishimura T., Tsunogai U., Gamo T. (2004). Stable carbon and oxygen isotopic determination of sub-microgram quantities of CaCO3 to analyze individual foraminiferal shells. Rapid Commun. Mass Spectrometry: RCM 18, 2883–2888. doi: 10.1002/rcm.1701
Ishimura T., Tsunogai U., Nakagawa F. (2008). Grain-scale heterogeneities in the stable carbon and oxygen isotopic compositions of the international standard calcite materials (NBS 19, NBS 18, IAEA- CO-1, and IAEA-CO-8). Rapid Commun. Mass Spectrometry: RCM 22, 1925–1932. doi: 10.1002/rcm.3571
Ito S. (1961). Fisheries biology of the sardine, Sardinops melanostictus (T. & S.), in the waters around Japan. Bull. Jpn. Sea. Natl. Fish. Res. Inst. 9, 1–227.
Ito S., Okunishi T., Kishi M. J., Wang M. (2013). Modelling ecological responses of Pacific saury (Cololabis saira) to future climate change and its uncertainty. ICES J. Mar. Sci. 70, 980–990. doi: 10.1093/icesjms/fst089
Kerr L. A., Secor D. H., Piccoli P. M. (2009). Partial migration of fishes as exemplified by the estuarine-dependent white perch. Fisheries 34, 114–123. doi: 10.1577/1548-8446-34.3.114
Ketterson E. D., Nolan V. Jr. (1976). Geographic variation and its climatic correlates in the sex ratio of eastern-wintering dark-eyed juncos (Junco hyemalis Hyemalis). Ecology 57, 679–693. doi: 10.2307/1936182
Kim S. T., O’Neil J. R., Hillaire-Marcel C., Mucci A. (2007). Oxygen isotope fractionation between synthetic aragonite and water: Influence of temperature and Mg2+ concentration. Geochim. Cosmochim. Acta 71, 4704–4715. doi: 10.1016/j.gca.2007.04.019
Kodaira T., Horikawa K., Zhang J., Senjyu T. (2016). Relationship between seawater oxygen isotope ratio and salinity in the Tsushima Current, the Sea of Japan. Chikyukagaku (Geochemistry) 50, 263–277. doi: 10.14934/chikyukagaku.50.263
Kodama T., Kitajima S., Takahashi M., Ishimura T. (2024). Spatiotemporal variations of seawater δ18O and δD in the Western North Pacific marginal seas near Japan. Geochem. J., GJ24009. doi: 10.2343/geochemj.GJ24009
Kuroda H., Setou T., Aoki K., Takahashi D., Shimizu M., Watanabe T. (2013). A numerical study of the Kuroshio-induced circulation in Tosa Bay, off the southern coast of Japan. Continental Shelf Res. 53, 50–62. doi: 10.1016/j.csr.2012.12.005
Kuroda H., Setou T., Kakehi S., Ito S., Taneda T., Azumaya T., et al. (2017). Recent advances in Japanese fisheries science in the Kuroshio-Oyashio region through development of the FRA-ROMS ocean forecast system: Overview of the reproducibility of reanalysis products. Open J. Mar. Sci. 07, 62–90. doi: 10.4236/ojms.2017.71006
Kuwae M., Yamamoto M., Sagawa T., Ikehara K., Irino T., Takemura K., et al. (2017). Multidecadal, centennial, and millennial variability in sardine and anchovy abundances in the western North Pacific and climate–fish linkages during the Late Holocene. Prog. Oceanogr. 159, 86–98. doi: 10.1016/j.pocean.2017.09.011
LeGrande A. N., Schmidt G. A. (2006). Global gridded data set of the oxygen isotopic composition in seawater. Geophys. Res. Lett. 33, 1–5. doi: 10.1029/2006GL026011
Liberoff A. L., Miller J. A., Riva-Rossi C. M., Hidalgo F. J., Fogel M. L., Alberto M. (2014). Transgenerational effects of anadromy on juvenile growth traits in an introduced population of rainbow trout (Oncorhynchus mykiss). Can. J. Fisheries Aquat. Sci. 71, 398–407. doi: 10.1139/cjfas-2013-0466
Mu X., Zhang C., Zhang C., Yang J., Ren Y. (2021). Age-structured otolith chemistry profiles revealing the migration of Conger myriaster in China Seas. Fisheries Res. 239, 105938. doi: 10.1016/j.fishres.2021.105938
Muko S., Ohshimo S., Kurota H., Yasuda T., Fukuwaka M. A. (2018). Long-term change in the distribution of Japanese sardine in the Sea of Japan during population fluctuations. Mar. Ecol. Prog. Ser. 593, 141–154. doi: 10.3354/meps12491
Nihira A. (1996). Studies on the behavioral ecology and physiology of migratory fish Schools of Skipjack Tuna (Katsuwonus pelamis) in the oceanic frontal area. Boll. Tohoku. N. Atl. Fish. Res. Inst. 58, 137–233.
Nishida K., Ishimura T. (2017). Grain-scale stable carbon and oxygen isotopic variations of the international reference calcite, IAEA-603. Rapid Commun. Mass Spectrometry: RCM 31, 1875–1880. doi: 10.1002/rcm.7966
Noguchi M., Takahashi Y., Hirota Y. (1990). The relationship between food consumption and growth of sardine Sardinops melanostictus by the feeding experiment. Bull. Jpn. Sea Natl. Fish. Res. Inst. 40, 1–14.
Okunishi T., Yamanaka Y., Ito S. (2009). A simulation model for Japanese sardine (Sardinops melanostictus) migrations in the western North Pacific. Ecol. Model. 220, 462–479. doi: 10.1016/j.ecolmodel.2008.10.020
Oozeki Y., Takasuka A., Kubota H., Barange M. (2007). Characterizing spawning habitats of Japanese sardine, Sardinops melanostictus, Japanese anchovy, Engraulis japonicus, and Pacific round herring, Etrumeus teres, in the northwestern pacific. California Cooperative Oceanic Fisheries Invest. Rep. 48, 191–203.
Rudstam L. G. (1988). Exploring the dynamics of herring consumption in the Baltic: Applications of an energetic model of fish growth. Kieler Meeresforschung Sonderheft 6, 312–322.
Ruzzante D. E., Mariani S., Bekkevold D., André C., Mosegaard H., Clausen L. A. W., et al. (2006). Biocomplexity in a highly migratory pelagic marine fish, Atlantic herring. Proc. Biol. Sci. 273, 1459–1464. doi: 10.1098/rspb.2005.3463
Sakai S. (2009). Micromilling and sample recovering techniques using high-precision micromill GEOMILL326 JAMSTEC-reports. Japan Agency Marine–Earth Sci. Technol. 10, 4–5.
Sakamoto T., Komatsu K., Shirai K., Higuchi T., Ishimura T., Setou T., et al. (2019). Combining microvolume isotope analysis and numerical simulation to reproduce fish migration history. Methods Ecol. Evol. 10, 59–69. doi: 10.1111/2041-210X.13098
Sakamoto T., Komatsu K., Yoneda M., Ishimura T., Higuchi T., Shirai K., et al. (2017). Temperature dependence of δ18O in otolith of juvenile Japanese sardine: Laboratory rearing experiment with micro-scale analysis. Fisheries Res. 194, 55–59. doi: 10.1016/j.fishres.2017.05.004
Sharma T., Clayton R. N. (1965). Measurement of O18O16 ratios of total oxygen of carbonates. Geochim. Cosmochim. Acta 29, 1347–1353. doi: 10.1016/0016-7037(65)90011-6
Shiao J. C., Liu E. Y., Sui T. D. (2016). Up-and-down shift in residence depth of slickheads (Alepocephalidae) revealed by otolith stable oxygen isotopic composition. J. Fish Biol. 88, 1265–1272. doi: 10.1111/jfb.12904
Sturrock A. M., Trueman C. N., Darnaude A. M., Hunter E. (2012). Can otolith elemental chemistry retrospectively track migrations in fully marine fishes? J. Fish Biol. 81, 766–795. doi: 10.1111/j.1095-8649.2012.03372.x
Takahashi M., Nishida H., Yatsu A., Watanabe Y. (2008). Year-class strength and growth rates after metamorphosis of Japanese sardine (Sardinops melanostictus) in the western North Pacific Ocean during 1996–2003. Can. J. Fisheries Aquat. Sci. 65, 1425–1434. doi: 10.1139/F08-063
Temminck C. J., Schlegel H. (1846). Pisces, parts 10-14:173-269. In: Fauna Japonica, sive descriptio animalium quae in itinere per Japoniam suscepto annis 1823-30 collegit, notis observationibus et adumbrationibus illustravit P.F. de Siebold. Leiden.
Torniainen J., Lensu A., Vuorinen P. J., Sonninen E., Keinänen M., Jones R. I., et al. (2017). Oxygen and carbon isoscapes for the Baltic Sea: Testing their applicability in fish migration studies. Ecol. Evol. 7, 2255–2267. doi: 10.1002/ece3.2841
Yabe I., Kawaguchi Y., Wagawa T., Fujio S. (2021). Anatomical study of Tsushima Warm Current system: Determination of Principal Pathways and its Variation. Prog. Oceanogr. 194, 102590. doi: 10.1016/j.pocean.2021.102590
Yasuda T., Kitajima S., Hayashi A., Takahashi M., Fukuwaka M. (2021). Cold offshore area provides a favorable feeding ground with lipid-rich foods for juvenile Japanese sardine. Fisheries Oceanogr. 30, 455–470. doi: 10.1111/fog.12530
Yasuda T., Kurota H., Hayashi A., Yoda M., Suzuki K., Takahashi M. (2019). “Stock assessment of the Tshushima Warm Current stock of Japanese sardine in fiscal 2018 year,” in Marine fisheries stock assessment and evaluation for Japanese waters (Tokyo: Fisheries Agency of Japan and Japan Fisheries and Education Agency), 57–95. Available at: http://abchan.fra.go.jp/digests2018/details/201802.pdf.
Yatsu A., Watanabe T., Ishida M., Sugisaki H., Jacobson L. D. (2005). Environmental effects on recruitment and productivity of Japanese sardine Sardinops melanostictus and chub mackerel Scomber japonicus with recommendations for management. Fisheries Oceanogr. 14, 263–278. doi: 10.1111/j.1365-2419.2005.00335.x
Keywords: otolith, stock structure, stable oxygen isotope, sardine, partial migration
Citation: Aono T, Sakamoto T, Ishimura T, Takahashi M, Yasuda T, Kitajima S, Nishida K, Matsuura T, Ikari A and Ito S-i (2024) Migration patterns of the Japanese sardine in the Sea of Japan by combining the microscale stable isotope analysis of otoliths and an ocean data assimilation model. Front. Mar. Sci. 11:1394801. doi: 10.3389/fmars.2024.1394801
Received: 02 March 2024; Accepted: 20 May 2024;
Published: 03 June 2024.
Edited by:
Bernardo Patti, National Research Council (CNR), ItalyReviewed by:
Fabio Fiorentino, National Research Council (CNR), ItalyMarco Torri, National Research Council (CNR), Italy
Copyright © 2024 Aono, Sakamoto, Ishimura, Takahashi, Yasuda, Kitajima, Nishida, Matsuura, Ikari and Ito. This is an open-access article distributed under the terms of the Creative Commons Attribution License (CC BY). The use, distribution or reproduction in other forums is permitted, provided the original author(s) and the copyright owner(s) are credited and that the original publication in this journal is cited, in accordance with accepted academic practice. No use, distribution or reproduction is permitted which does not comply with these terms.
*Correspondence: Tomoya Aono, YW9udG9tMDlAZ21haWwuY29t; Toyoho Ishimura, aXNoaW11cmEudG95b2hvLjhyQGt5b3RvLXUuYWMuanA=; Shin-ichi Ito, Z29pdG9AYW9yaS51LXRva3lvLmFjLmpw
†Present address: Tatsuya Sakamoto, The Hakubi Center for Advanced Research, Kyoto University, Yoshida-honmachi, Sakyo-ku, Kyoto, Japan