 Dai Jia
 Xinyu Liu
 Xin Guan1
 Yiyang Jin
 Jun Sun
- 1College of Marine and Environmental Sciences, Tianjin University of Science and Technology, Tianjin, China
- 2State Key Laboratory of Biogeology and Environmental Geology, China University of Geosciences (Wuhan), Wuhan, China
With the proposal of dual carbon goals, enhancing carbon sinks and reducing carbon emissions has become a critical issue. Fisheries, as a component of agriculture, possess the dual attributes of being a “carbon sink” (biological carbon fixation) and a “carbon source” (the carbon emissions from fishing vessels). Therefore, it is necessary to assess the carbon sink and carbon emission levels of fisheries. The northern marine economic circle, which includes Liaoning, Hebei, Tianjin, and Shandong, is an important site for fisheries in China, characterized by abundant aquatic resources. However, a comprehensive assessment of the carbon budget for fisheries in this region is still unclear. This study calculated the carbon sinks, carbon emissions, and net carbon emissions associated with fisheries in the region from 2013 to 2020. Additionally, we used sensitivity analysis and scenario simulation to explore the factors influencing the net carbon emissions. The results revealed that the carbon budget of the northern marine economic circle was in a carbon deficit (the amount of carbon emissions was higher than that of carbon sinks) from 2013 to 2020. However, a downward trend in the net carbon emissions was observed, indicating the potential of achieving carbon neutrality. From the perspective of provinces, significant differences among provinces (cities) were found in terms of carbon sinks, carbon emissions, and net carbon emissions, with Shandong having the largest net carbon emissions. Furthermore, the production of clams and the use of seawater trawl net have a significant impact on the net carbon emissions. Increasing the production of clams while reducing the power of trawling operations can significantly decrease net carbon emissions. Based on these results, this study provides relevant suggestions to enhance the carbon sink capacity and decrease the carbon emissions of fisheries in the northern marine economic circle.
1 Introduction
In September 2020, China announced achieving “carbon peaking” by 2030 and “carbon neutrality” by 2060 (The Chinese Foreign Ministry, 2020). This announcement came as a pleasant surprise for the fight against climate change, it is essential to reduce carbon dioxide concentration in the atmosphere (Jiao et al., 2010; Zeng et al., 2022). To reduce the concentration of carbon dioxide, two ways must be implemented simultaneously. One way is to increase carbon sinks by enhancing the biological absorption of carbon dioxide, while the other is to reduce carbon emissions by decreasing fossil fuel consumption or promoting fossil energy utilization efficiency (Zhou et al., 2019; Ren, 2021; Zhao et al., 2023; Lin and Ge, 2019). Fisheries are a component of agriculture, with the dual attributes of being a “carbon sink” due to biological fixation and a “carbon source” due to fishing vessels (Chen et al., 2022; Wang and Feng, 2023; Chen et al., 2024). Aquaculture and capture fisheries play key roles in the fisheries sector in China (Kang et al., 2017; Huang and He, 2019), and they also make a significant contribute to the carbon budget (Wang and Wang, 2022). Cultivating aquatic organisms with carbon sink capacities can contribute to enhancing carbon storage (Wu and Li, 2022). Tang et al. (2011) discovered the role of aquaculture algae and shellfish in seawater in carbon sinks are highly significant. Algae convert inorganic carbon in seawater into organic carbon through photosynthesis, storing it in their organisms through assimilation (Song et al., 2020). Shellfish efficiently filter phytoplankton and organic particles, absorbing dissolved inorganic carbon (DIC) for shell growth, and filtering suspended particulate organic carbon (POC) for soft tissue development (Jia et al., 2023; Le et al., 2023). Furthermore, significant contributions of fishes to carbon flux are non-negligible (Saba et al., 2021). Fishing must be considered an important contributor to carbon emissions due to the usage of fuel by fishing vessels (Greer et al., 2019; Hornborg and Smith, 2020). However, considering that fisheries play dual roles as both carbon sinks and emissions, whether they are a carbon sink or source remains controversial and unclear, particularly from a regional or national perspective. Assessing the carbon sink and source of fisheries is a matter of urgency.
Despite the acknowledged significance of carbon sinks and emissions, there are still many problems and difficulties due to the uncertainty of the assessment method. There is no systematic, scientific conclusion and a lack of data about the carbon budget. First, most studies only focused on one side (carbon sinks or emissions), and there have been limited joint studies on both sides. Shao et al. (2019); Song et al. (2020), and Hong et al. (2022) only considered the carbon sink capacity of mariculture. Greer et al. (2019); Gao et al. (2022), and Tian et al. (2023) concentrated on the carbon emissions of marine fisheries. Second, there are four main forms of fishery carbon sink: the biomass carbon sink (also called removable carbon), dissolved organic carbon (DOC), recalcitrant DOC (RDOC), particulate organic carbon (POC) (Liu et al., 2022; Pessarrodona et al., 2023). However, the release of particulate organic carbon (POC) and dissolved organic carbon (DOC) during the growth of shellfish and algae are always neglected and excluded in previous studies (Ren, 2021; Gu et al., 2022; Lai et al., 2022; Hao et al., 2024; Tan et al., 2024). It is crucial to assess the level of carbon sinks through a range of scientifically reliable indicators. Third, although some scholars consider both carbon sinks and emissions in their research, existing studies in the coastal regions mainly focus on marine fisheries, and freshwater fisheries receive less attention (Shao et al., 2018; Guan et al., 2022; Li et al., 2022; Wang and Feng, 2023; Li et al., 2023a).
In order to achieve carbon neutrality, it is vital to improve the marine environmental quality by controlling carbon emissions from the fishery ecosystem (Entrena-Barbero et al., 2022; Liu et al., 2023). The northern marine economic circle of China is administratively managed by three provinces and one city (Liaoning, Hebei, Tianjin, and Shandong) surrounding the Bohai Sea (Chen et al., 2022; Liu et al., 2023). This region offers a solid foundation for marine economic development and serves as a significant fisheries base (Guo et al., 2022). However, the region faces a series of environmental problems such as carbon reduction while developing the fishery economy (Li and Jin, 2019; Xu et al., 2023). It is significant to identify the carbon budget of the coastal provinces (cities) in protecting the environment of the region Therefore, this study mainly focused on the carbon budget of the northern marine economic circle.
Here, we comprehensively explore the carbon budget of fisheries in the northern marine economic circle based on the modified model that integrates particulate organic carbon (POC) and dissolved organic carbon (DOC) into a calculation method. We also consider the direct or indirect contribution of freshwater fisheries to carbon sinks and emissions. This study is aimed to (1) reveal whether fisheries in the region are a carbon sink or source; (2) estimate the levels of carbon sinks and emissions within the region; (3) analyze the main influencing factors of net carbon emissions and predict the net carbon emissions under different scenarios; (4) propose new insights and a scientific reference for regional carbon reduction policies in the aspect of carbon reduction, based on the preliminary findings of the Monte Carlo simulation.
2 Data and methods
2.1 Study area
The northern marine economic circle encompasses Liaoning, Hebei, Tianjin, and Shandong surrounding the Bohai Sea, located between approximately 35.0°N to 41.5°N and 116.5°E to 123.5°E (Sun et al., 2023; Zhang and Wang, 2024). The influx of the Kuroshio, a branch of Japan’s warm current, has bestowed Bohai with abundant economic and biological resources (Chen et al., 2022). With its favorable geographical location and abundant resources, the region has seen its coastline expand seaward, setting a strong foundation for enhancing its fishing industry (Sawut et al., 2023; Zhang et al., 2023).
2.2 Data sources
We collected data on the species production, aquaculture area, and fishing vessel operation power of the four provinces (cities) in the study area from 2013 to 2020. The data used in this study were sourced from the China Fishery Statistics Yearbook [Fishery Bureau of Ministry of Agriculture and Rural Affairs of China (2014–2021)]. The fuel consumption coefficient of fishing vessels was from the domestic motor fishing vessels oil subsidies oil measuring standard reference (http://www.moa.gov.cn/govpublic/YYJ/201006/t20100606_1538704.htm).
2.3 Calculation methods
2.3.1 Calculation of carbon sinks
Aquaculture includes both marine and freshwater aquaculture. Carbon sinks in marine aquaculture mainly include shellfish, algae, marine fish, and crustaceans. Some options for shellfish include oysters, mussels, scallops, clams, razor clams, snails, abalones, cockles, and conch. For algae, options include kelp, laver, wakame, and ogonori. Freshwater aquaculture mainly involves carbon sinks of freshwater fish and crustaceans. The dry weight ratio of shellfish and algae, the quality weight ratio of soft tissue and shell in shellfish, and the carbon sink coefficients of shellfish and algae were acquired from relevant studies (Ross et al., 2017; Liu et al., 2019; Shao et al., 2019; Lai et al., 2022). These parameters are listed in Tables 1, 2, respectively. The carbon sink model used in this article is based on Yang Lin’s research (Yang et al., 2022).
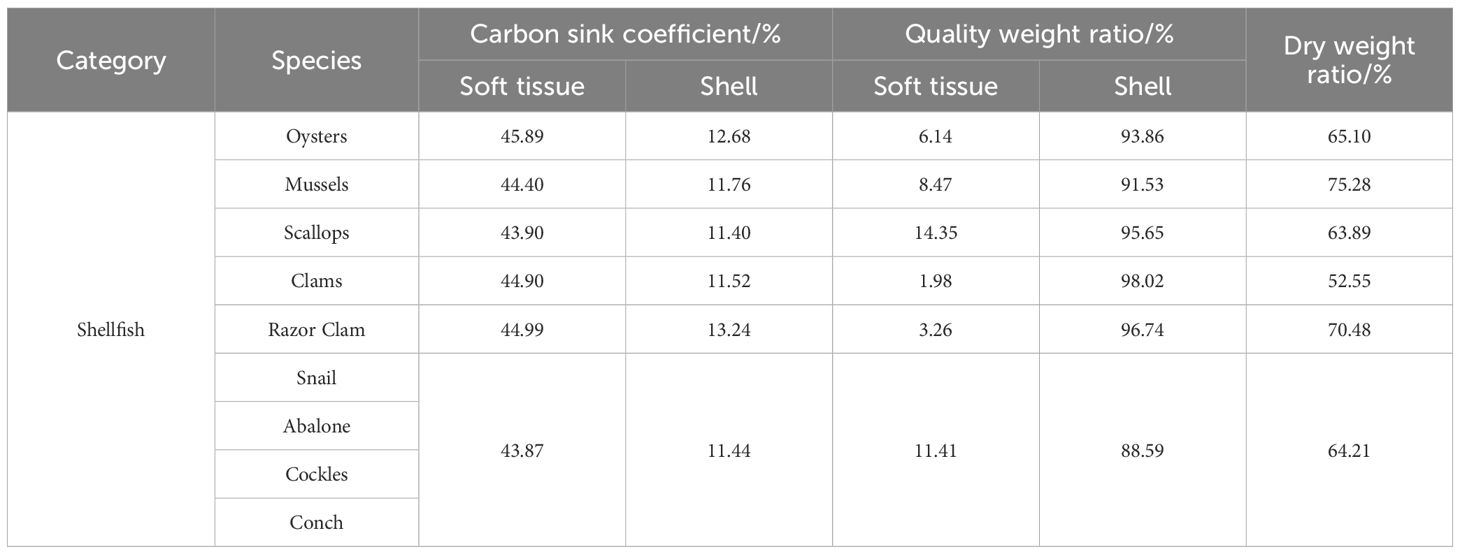
Table 1 Calculation coefficient of the carbon sink capacity of Shellfish.
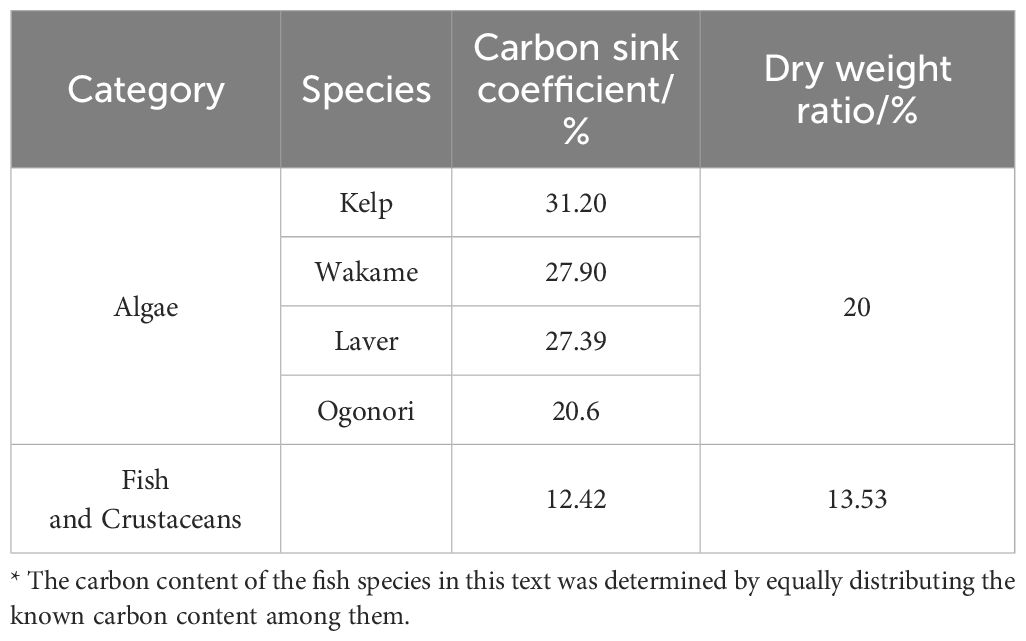
Table 2 Calculation coefficient of the carbon sink capacity of Algae, Fish, and Crustaceans.
2.3.1.1 Estimation of shellfish carbon sinks
In Equations (1-4), denotes the carbon sinks of shellfish, which comprise two components: the shell carbon sinks and the carbon sinks formed by the release of POC and DOC through the shellfish growth process ; represents types of shellfish; , , and represent respectively shellfish production (wet weight), dry weight ratio, and carbon content of shells; denotes the proportion of organic carbon compared to total shell carbon in marine sediment, which is 20% in this article; represents the carbon sinks of soft tissue; represents the dry weight ratio of soft tissue; represents the carbon content within soft tissue; denotes the POC and DOC released through the growth process of shellfish; denotes the proportion of released POC and DOC converted into carbon sinks, which is set to 1 in this article.
2.3.1.2 Estimation of algae carbon sinks
In Equations (5-7), denotes the carbon sinks of algae, which are composed of two segments: the algae carbon sinks and the carbon sinks are facilitated by the release of POC and DOC during algae growth ; denotes types of algae; , , and represent respectively algae production, carbon content, and dry weight ratio. is the proportion of released POC and DOC converted into carbon sinks, typically equaling 1. denotes the proportion of photosynthetic activity occupied by POC and DOC release, which is 24%.
2.3.1.3 Estimation of fish and crustacean’s carbon sinks
In Equations (8-10), represents fish and crustacean’s carbon sinks, which consist of two parts: the carbon sinks in fish and crustaceans themselves , and the carbon sinks formed through the release of both POC and DOC . Here, represents fish or crustaceans, and represents different categories of fish or crustaceans. , , and respectively represent production, dry weight ratio, and carbon content. represents the proportion of consuming natural feed, which is 20%. denotes the released POC and DOC during the growth process, which is 1. represents the proportion of released POC and DOC converted into carbon sinks, typically equal to 1.
2.3.2 Calculation of carbon emissions
The carbon emissions are predominantly generated by the consumption of fuel from capturing fishing vessels. The fishing operation modes are categorized into six types: seawater trawl net, seawater seine net, seawater gill net, seawater cast net, seawater fishing gear, seawater others and freshwater fishing. The method for calculating carbon emissions in this article is based on the approach for calculating carbon emissions that was proposed by the Oak Ridge National Laboratory (ORNL) in 1990. The equation is as follows (Zhang et al., 2010):
In Equations (11, 12), denotes the direct carbon emissions from the fishing industry; denotes the different operation modes of capture fishing vessels; denotes the fuel consumption of fishing vessels; denotes the coal equivalent coefficient of fuel, which is 1.4751; denotes the effective oxidation fraction, which is 0.982; denotes the carbon content per ton of standard coal, which is 0.73257; denotes the ratio of CO2 emissions from fuel oil to coal combustion while generating an equal amount of heat energy, which is 0.813; denotes the constant for conversing of carbon to CO2, which is 3.67; denotes the primary engine power of fishing vessels during different operation modes; denotes the oil consumption coefficient of fishing vessels varies under different operational modes.
2.3.3 Calculation of net carbon emissions
The net carbon emissions are equal to the amount of carbon emissions from fishing minus the amount of carbon sinks from aquaculture. The calculation formula (13) for this is outlined below:
2.4 Monte Carlo simulation method
We run Monte Carlo simulation to quantify the uncertainty factors from the net carbon emissions model by defining triangular distribution for each uncertainty parameter. The Oracle Crystal Ball (United States) was used to assist with random sampling, and 10,000 trials were defined to support the simulation. Sensitivity analysis was conducted for calculation model to evaluate the influence of uncertain variables on the carbon sinks, carbon emissions, net carbon emissions.
In 2020, the national aquaculture production increased by 2.86% compared to the previous year (Ministry of Agriculture and Rural Affairs, 2021a). From 2016 to 2020, the percentage of trawler fishing vessels has decreased by nearly 10% (Ministry of Agriculture and Rural Affairs, 2020). Hence, combined with the sensitivity analysis, we have designed three possible scenario models: (1) Improving clams production (α1), it is suggested to increase the benchmark values (0.25) to 5% (0.2625) and 10% (0.275), respectively, while keeping all other parameters constant. (2) Lowering the percentage of seawater trawl net usage (α2), it is advisable to adjust the benchmark values (0.47) to 0.423 (10% reduction) and 0.376 (20% reduction), while maintaining the consistency of all other parameters. (3) Adjust both the production of clams and the proportion of seawater trawl net simultaneously to increase clams production to 0.275 and decrease the proportion of seawater trawl net to 0.376, while keeping all other factors constant.
3 Results
3.1 The current situation of fisheries
3.1.1 The spatial and temporal changes in aquaculture area
Based on the relevant data from the China Fishery Statistical Yearbook, the development of aquaculture area in the northern marine economic circle between 2013 and 2020 is presented in Table 3. Over this period from 2013 to 2020, the area of aquaculture in the region has shown a fluctuating trend, with the maximum area of 2232.108 thousand ha in 2015. We further divided the period from 2013–2020 into two periods: 2013–2015 and 2015–2020, and the trends in area changes in these two periods were different. From 2013 to 2015, the aquaculture area consistently increased annually from 2213.553 to 2232.108 thousand ha, representing an increase rate of 0.838%. Conversely, from 2015 to 2020, the region experienced a decreasing trend in aquaculture area, with a decrease rate of 21.658%. Overall, from 2013 to 2020, the aquaculture area in the region decreased from 2213.553 to 1748.674 thousand ha, showing a 21.001% decline rate.
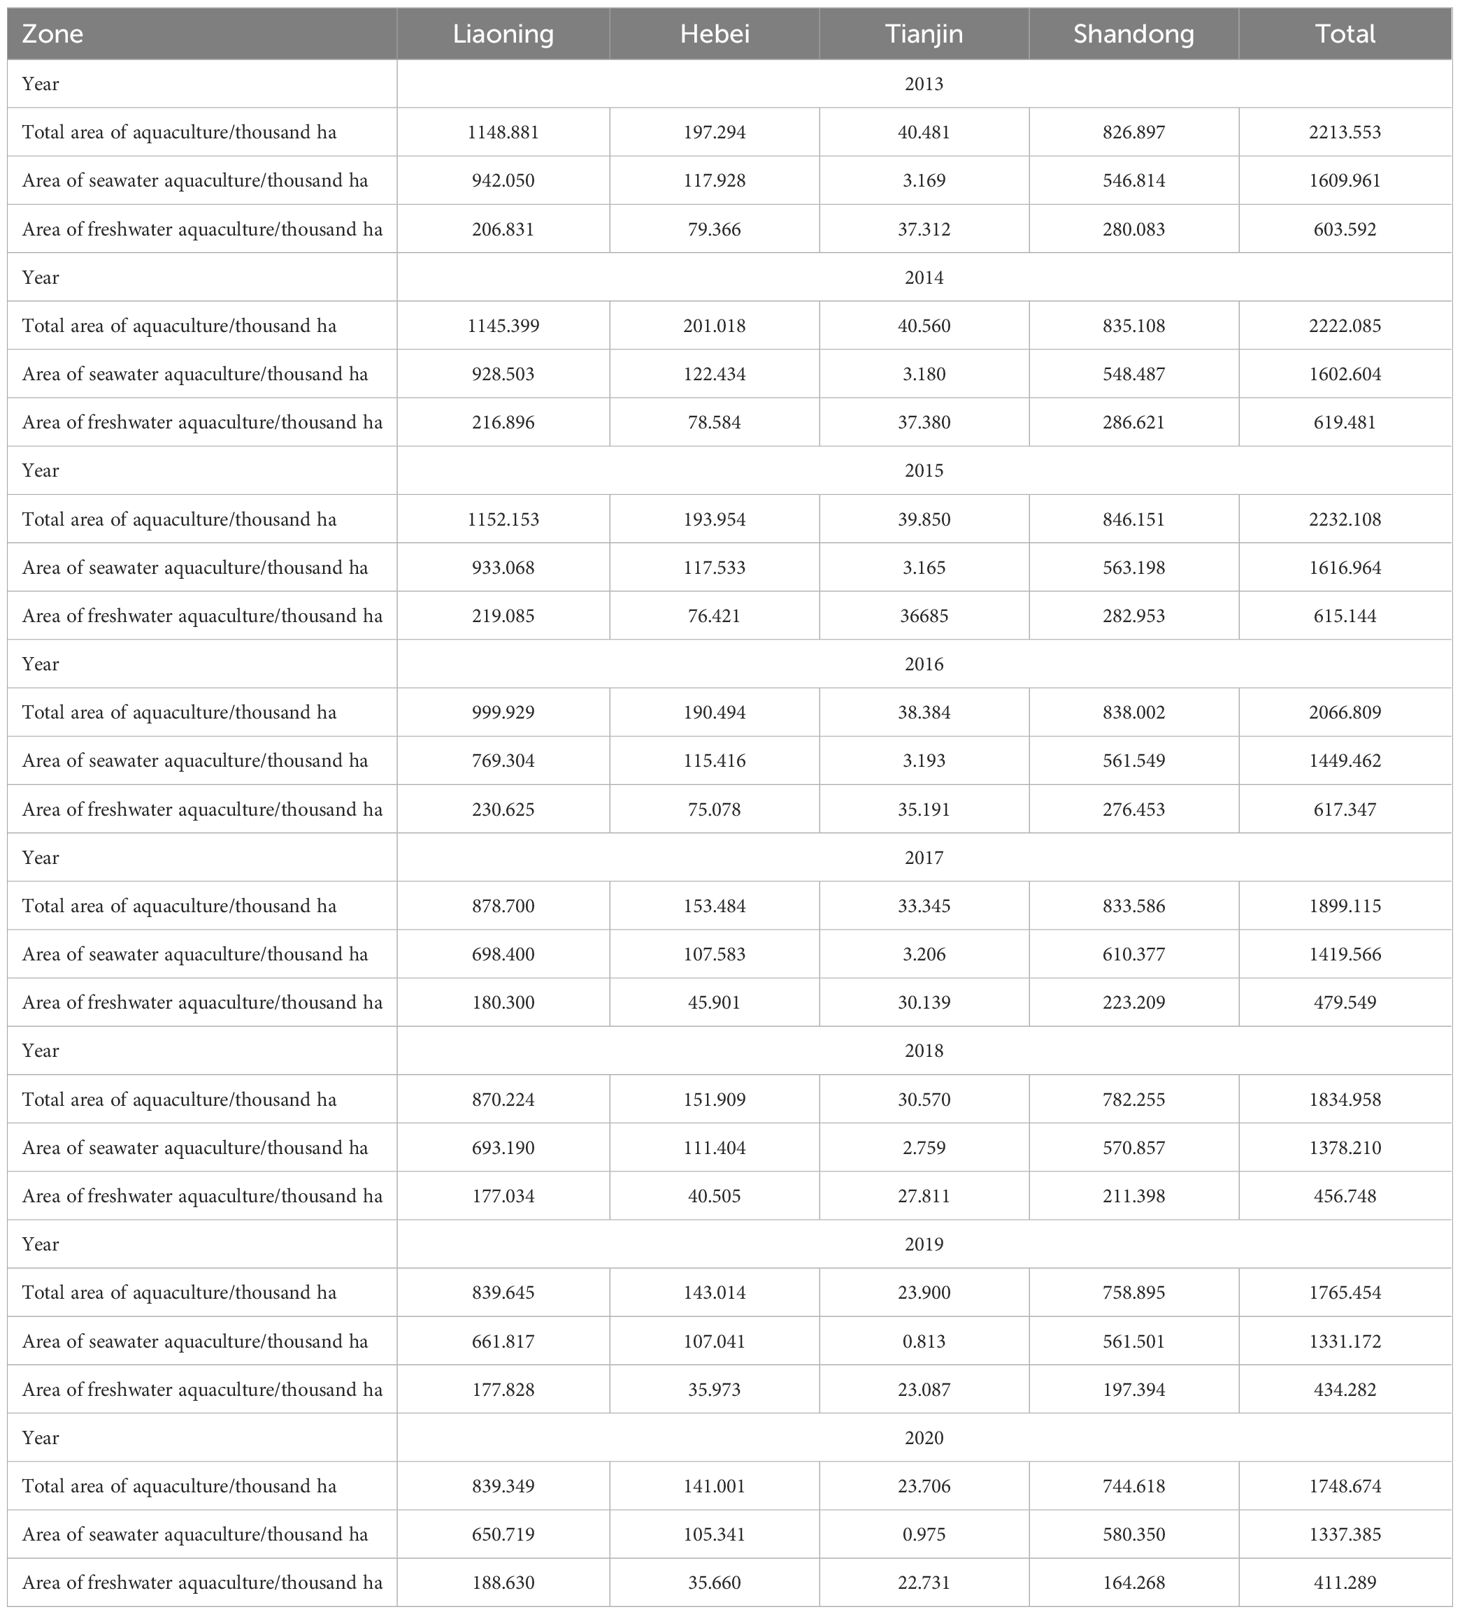
Table 3 Aquaculture area of four provinces (cities).
In terms of spatial distribution, aquaculture in the region was predominantly concentrated in Liaoning and Shandong, with less distribution of area in Hebei and Tianjin. Meanwhile, the aquaculture areas in Liaoning, Hebei, Tianjin, and Shandong showed an overall trend of “increase–decrease” from 2013 to 2020, with a maximum area of 1152.153 thousand ha, 201.018 thousand ha, 40.560 thousand ha, and 846.151 thousand ha, respectively. Specifically, Liaoning and Shandong reached a peak in 2015, while Tianjin and Hebei had the highest points in 2014. The negative correlation between aquaculture and year, suggests a potential decrease in the aquaculture area in the future (Supplementary Figure 1).
3.1.2 The changes in species production and coal consumption
In the entire region, from 2013 to 2016, species production increased from 1099.568 to 1193.878 ten thousand tons (Figure 1A). The production experienced its first dip in 2017 over eight years, followed by a subsequent upward trend to 1101.132 ten thousand tons in 2020. The species production increased by 0.142% from 2013 to 2020. From a provincial perspective, the production of four provinces (cities) showed a dynamic wave trend, reaching a highest point in 2016. The provinces with relatively high production were Shandong and Liaoning, with production ranging from 605.233 to 656.417 ten thousand tons and from 366.236 to 407.972 ten thousand tons, respectively. The relatively low were Hebei and Tianjin, with production ranging from 70.776 to 97.117 ten thousand tons and from 22.215 to 33.094 ten thousand tons, respectively.
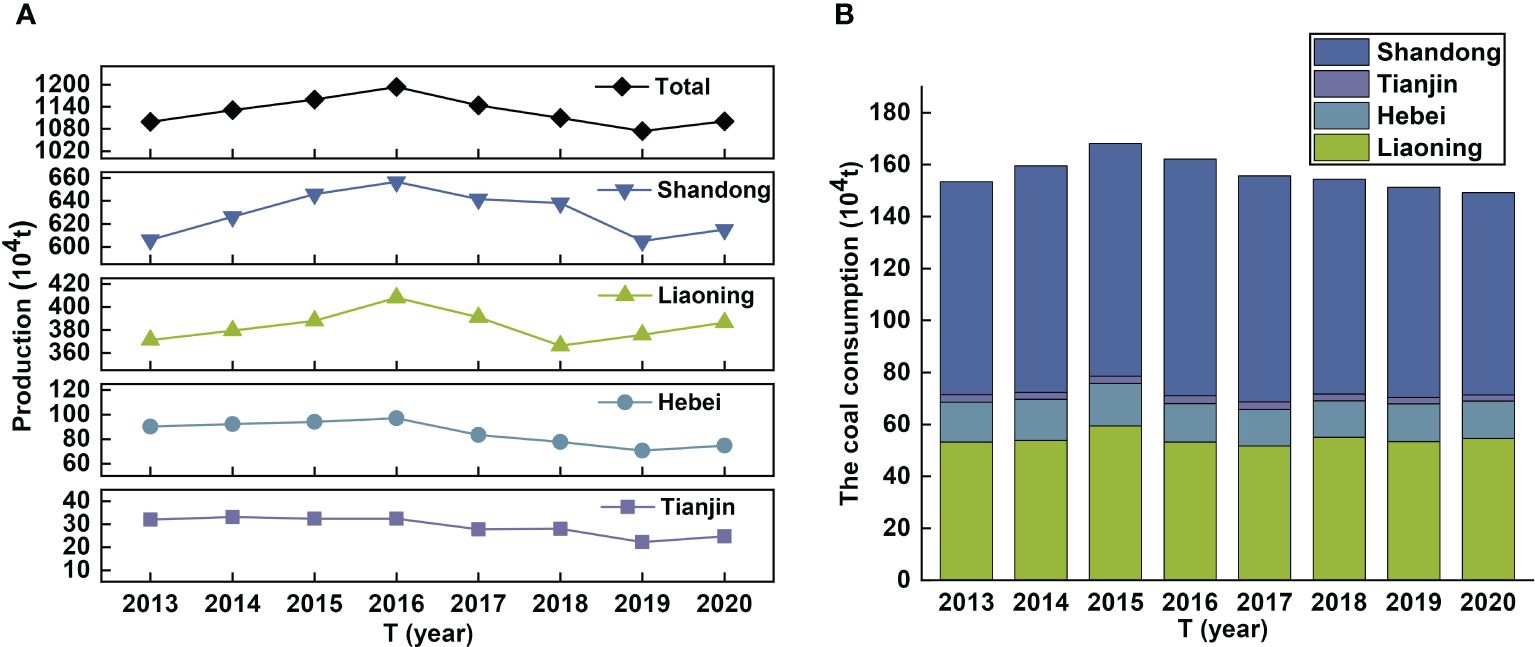
Figure 1 Changes in species production and the coal consumption from the fisheries of the four provinces (cities) from 2013 to 2020. (A) Species production (B) The coal consumption of fishing vessels.
The primary source of carbon emissions is the fuel consumption on fishing vessels (Hornborg and Smith, 2020). From 2013 to 2020, the coal consumption of the region demonstrated an “increase-decrease” trend, with a maximum value of 168.219 ten thousand tons in 2015 and a minimum value of 149.312 ten thousand tons in 2020 (Figure 1B). The value of coal consumption provided by different provinces (cities) was different. Shandong contributed the most, followed by the contributions of Liaoning and Hebei, Tianjin contributed the least.
3.2 Spatial-temporal changes of carbon sink, source and budget
3.2.1 Spatial-temporal changes from the entire region’s perspective
As can be seen from Figure 2A, a total of 100.187 ten thousand tons of carbon sinks and 466.983 ten thousand tons of carbon emissions in the region were generated between 2013 and 2020. The amount of carbon emissions was more significant than that of carbon sinks, indicating that the region was a carbon source. The net carbon emissions from fisheries were maintained at 366.795–427.313 ten thousand tons from 2013 to 2020, the highest value was observed in 2015. The trend was downward as a whole, using 2013 as the base year, decreased from 391.293 to 366.795 ten thousand tons in 2020, showing a 6.261% decline rate. Moreover, the carbon sinks and emissions of mariculture were far larger than those of freshwater in the region. The highest net carbon emissions were in Shandong, followed by Liaoning and Hebei, while the net carbon emissions of Tianjin were relatively low (Figure 2B).
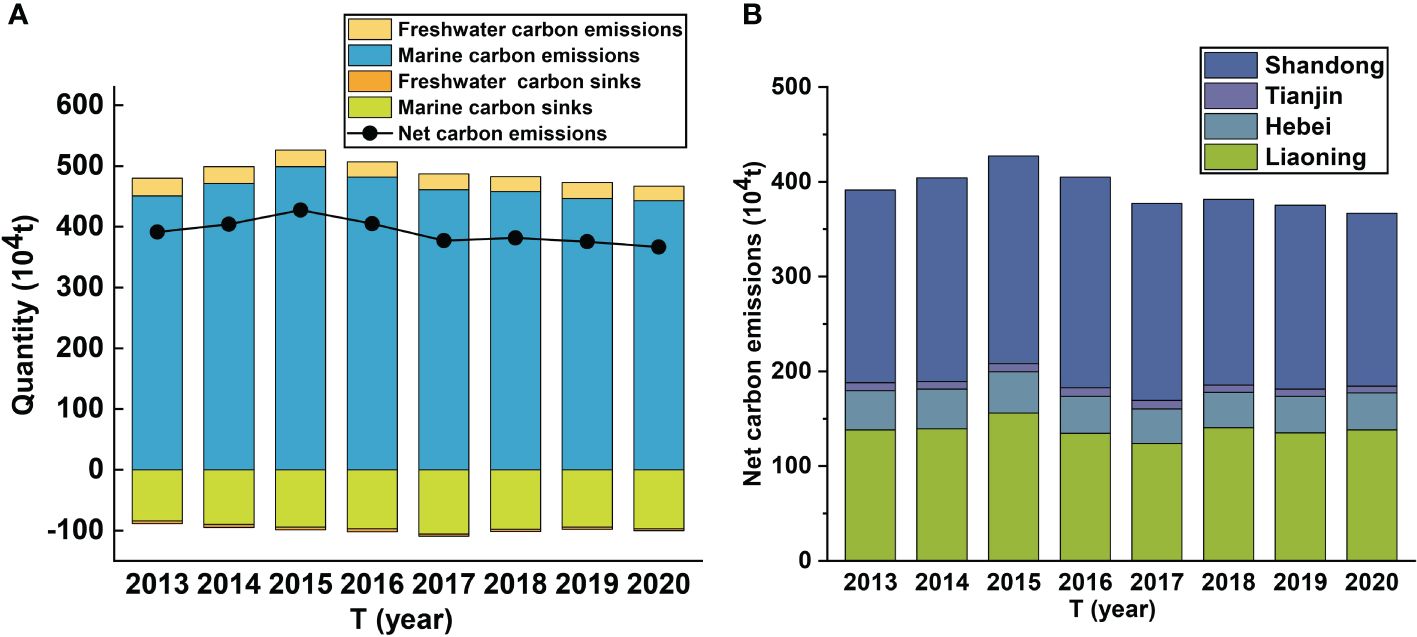
Figure 2 Time evolutionary characteristics of net carbon emissions, carbon sinks, and carbon emissions of fisheries, as well as the proportion of net carbon emissions in each province between 2013 and 2020. (A) Change characteristics of net carbon emissions in the entire region. (B) Change characteristics of net carbon emissions in different provinces.
In terms of the total amount of carbon sinks, it exceeded 1 million tons in 2016. From 2013 to 2020, carbon sinks increased from 88.765 to 100.187 thousand tons, with an increase rate of 12.868%. During 2013–2017, the carbon sink capacity of this region has been continuously improved, however, it showed a downward trend after 2017 (Figure 3A). The carbon sinks facilitated by shellfish were as high as 97.248 ten thousand tons in 2017, accounting for 88.721% of the total amount. Those facilitated by algae accounted for 7.031%. It is apparent that seawater shellfish and algae played an important role in carbon sinks. Additionally, freshwater aquaculture also made some contributions to carbon sinks, accounting for an average of 4.135% of the total amount.
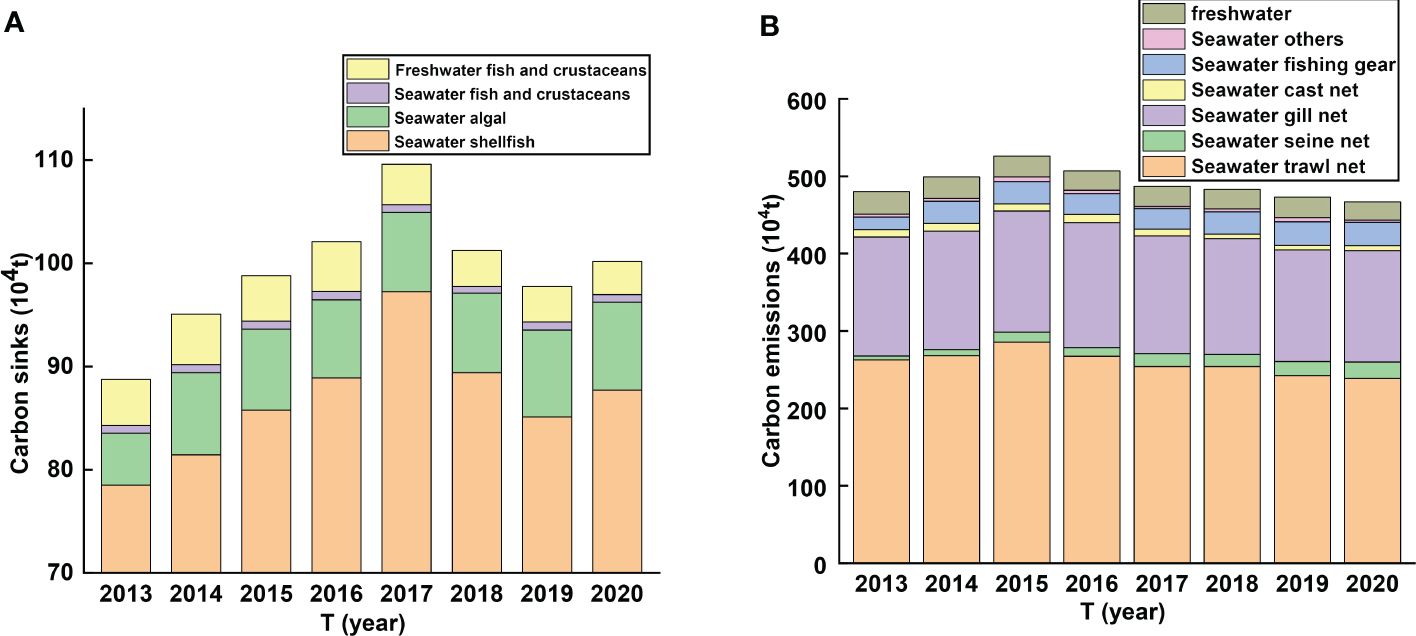
Figure 3 The total carbon sinks and emissions of fisheries. (A) Carbon sinks of different species (B) Carbon emissions of different fishing method.
The total carbon emissions exhibited a fluctuating trend, peaking in 2015. From 2013 to 2020, carbon emissions decreased from 480.058 to 466.983 thousand tons, with a decrease rate of 2.724%. Seawater trawl net was the main source of carbon emissions of the northern marine economic circle (Figure 3B). From 2013 to 2020, the carbon emissions of seawater trawl net played a leading role in the entire region, accounting for more than 52.871% on average of the total amount. The second was seawater gill net, which accounted for more than 30.980%. Freshwater accounted for 5.369%, while seawater other sources played a minor role, accounting for 0.819%.
3.2.2 Spatial-temporal changes from the provincial perspective
The results in Figure 4 show that the net carbon emissions in different provinces (cities) of the northern marine economic circle between 2013 and 2020. All provinces (cities) had positive net carbon emissions and did not achieve the carbon neutrality by 2020. However, there were significant differences among provinces (cities) in carbon emissions. Only Liaoning showed a slight increasing trend in overall net carbon emissions with each year, while the other three provinces (cities) experienced a decreasing trend. In Liaoning Province, carbon sinks have slightly increased, with a significant increase in carbon emissions. This has resulted in an overall slight increasing trend in the net carbon emissions from 2013 to 2020. The net carbon emissions in Liaoning reached a peak in 2015 with 156.195 ten thousand tons. Subsequently, they decreased to 123.839 ten thousand tons in 2017. From 2013 to 2020, there was a slight increase in the net carbon emissions from 138.208 to 138.419 ten thousand tons, representing a growth rate of 0.152%. For Hebei Province, which experienced its highest and lowest net carbon emissions in 2015 and 2017, respectively. Thereafter, the net carbon emissions steadily increased until 2020, but then showed a decreasing trend overall. From 2013 to 2020, the net carbon emissions decreased in Hebei from 41.279 to 38.972 ten thousand tons, with an increase rate of 5.589%. During the same period, the overall trend of net carbon emissions in Tianjin was downward, with one significant increase in 2017. Thereafter, the trend steadily decreased until 2020. The net carbon emissions decreased by 15.531% from 8.449 ten thousand tons in 2013 to 7.136 ten thousand tons in 2020. Conversely, the carbon emissions in Shandong significantly exceeded the carbon sinks, leading to a substantial increase in its net carbon emissions. The fisheries in Shandong served as a carbon source. The maximum net carbon emission from the fisheries occurred in 2016, reaching approximately 222.410 ten thousand tons. Since then, there has been a consistent annual decrease in carbon emissions, with the minimum observed in 2020, at 182.268 ten thousand tons. During 2013 and 2020, the net carbon emissions of Shandong have exhibited a downward trend, with a decrease rate of 10.371%.
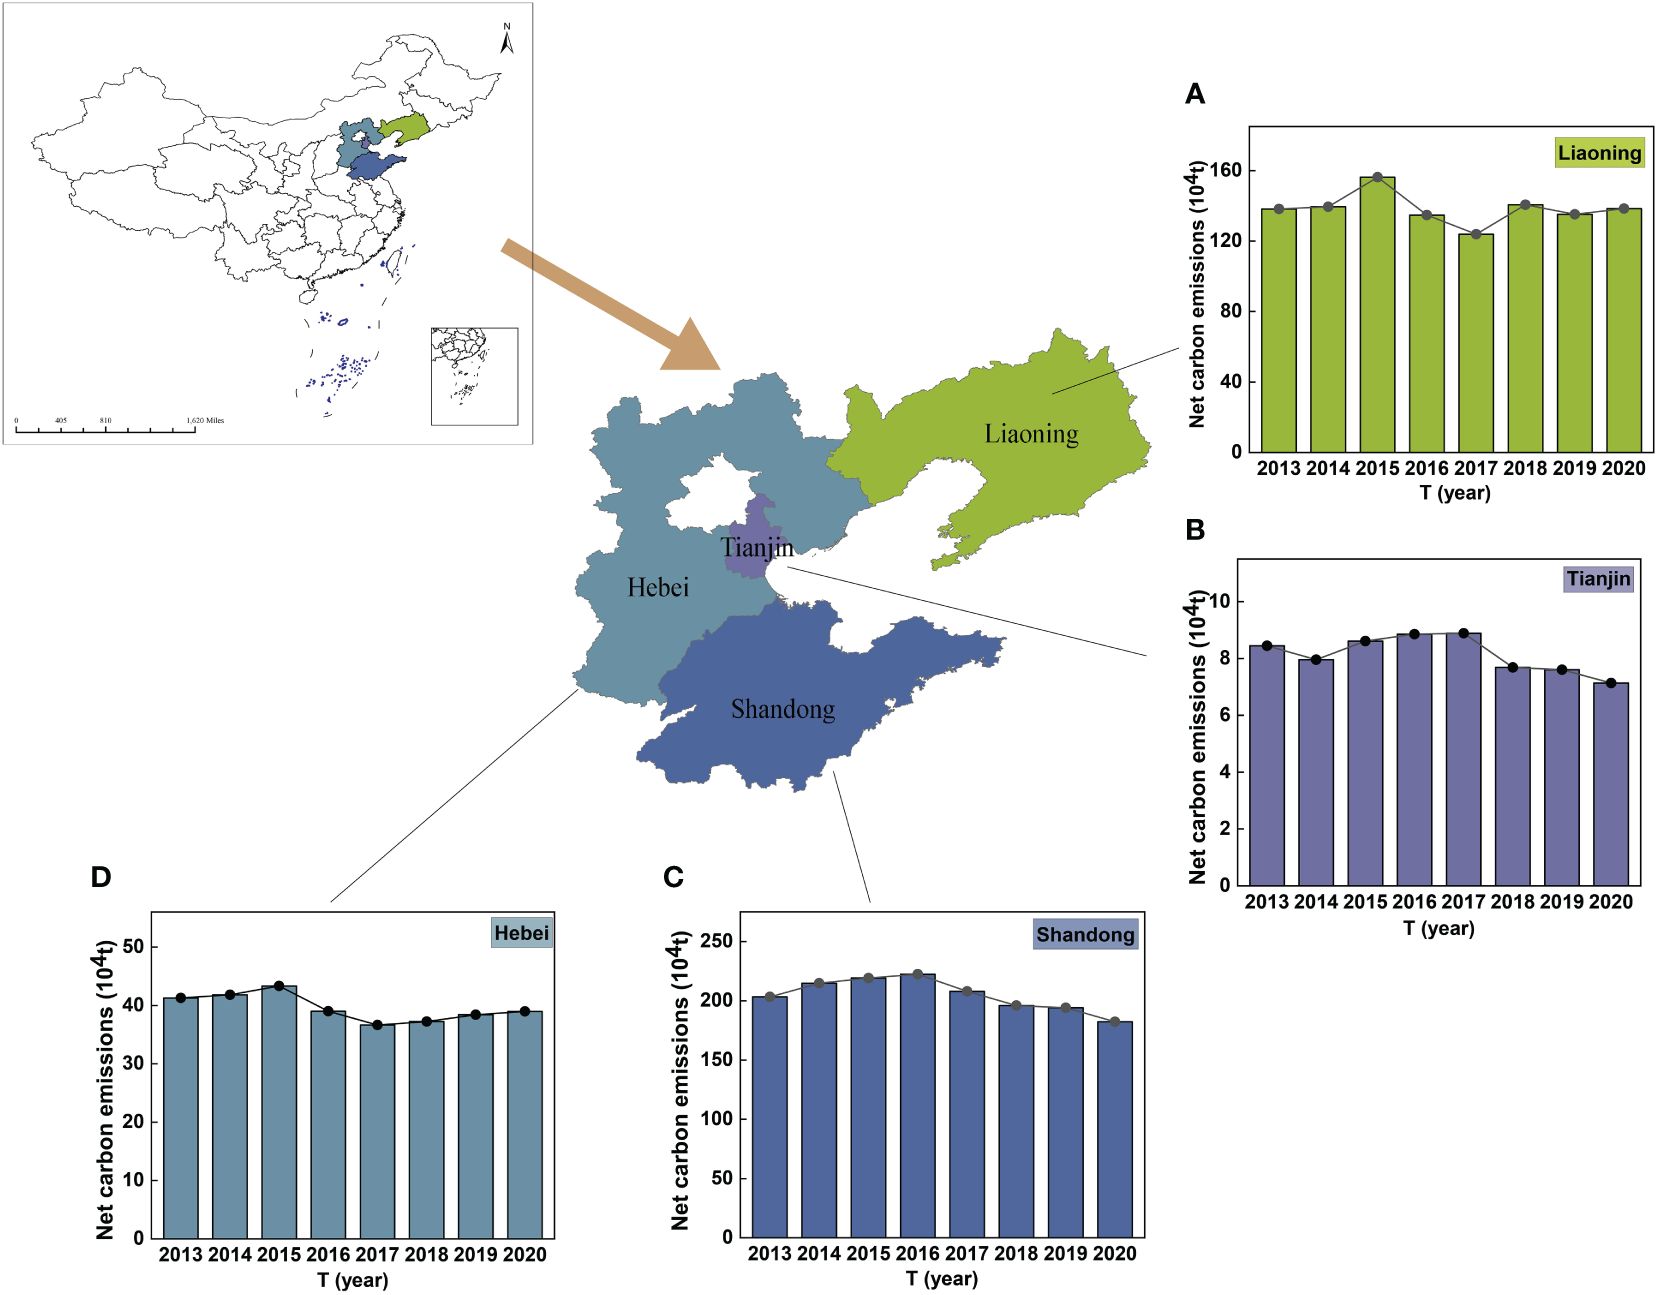
Figure 4 The net carbon emissions of each province (city) from 2013 to 2020. (A) Liaoning (B) Tianjin (C) Shandong (D) Hebei.
Figure 5 reflects the evolutionary trend of carbon sinks in four provinces (cities) between 2013 and 2020. During this period, the overall carbon sinks of Liaoning and Shandong were on an increasing trend, Hebei and Tianjin showed a decrease in carbon sinks. Between 2013 and 2020, the carbon sinks in Shandong and Liaoning were high. The carbon sinks from Tianjin were small, with the largest being in 2014 and primarily due to freshwater aquaculture. However, the carbon sinks of the remaining three provinces reached a peak value in 2017 and mainly relied on marine aquaculture. The carbon sinks of Liaoning increased from 28.263 ten thousand tons in 2013 to 32.443 ten thousand tons in 2020, reflecting an increase rate of 14.790%. The value of 37.712 ten thousand tons in 2017 was the highest. Taking 2013 as the baseline period, the carbon sinks in Hebei decreased by 10.565% from 6.803 to 6.084 ten thousand tons. It was in 2017 that the value peaked at 7.524 ten thousand tons. From 2013 to 2020, the carbon sinks of Tianjin decreased from 0.356 to 0.244 ten thousand tons, representing a reduction rate of 31.461%. The value of 0.367 ten thousand tons in 2016 was the highest. The carbon sinks increased from 53.343 to 61.416 ten thousand tons, reflecting a growth rate of 15.134%. The biggest increase in Shandong was 64.063 ten thousand tons in 2017.
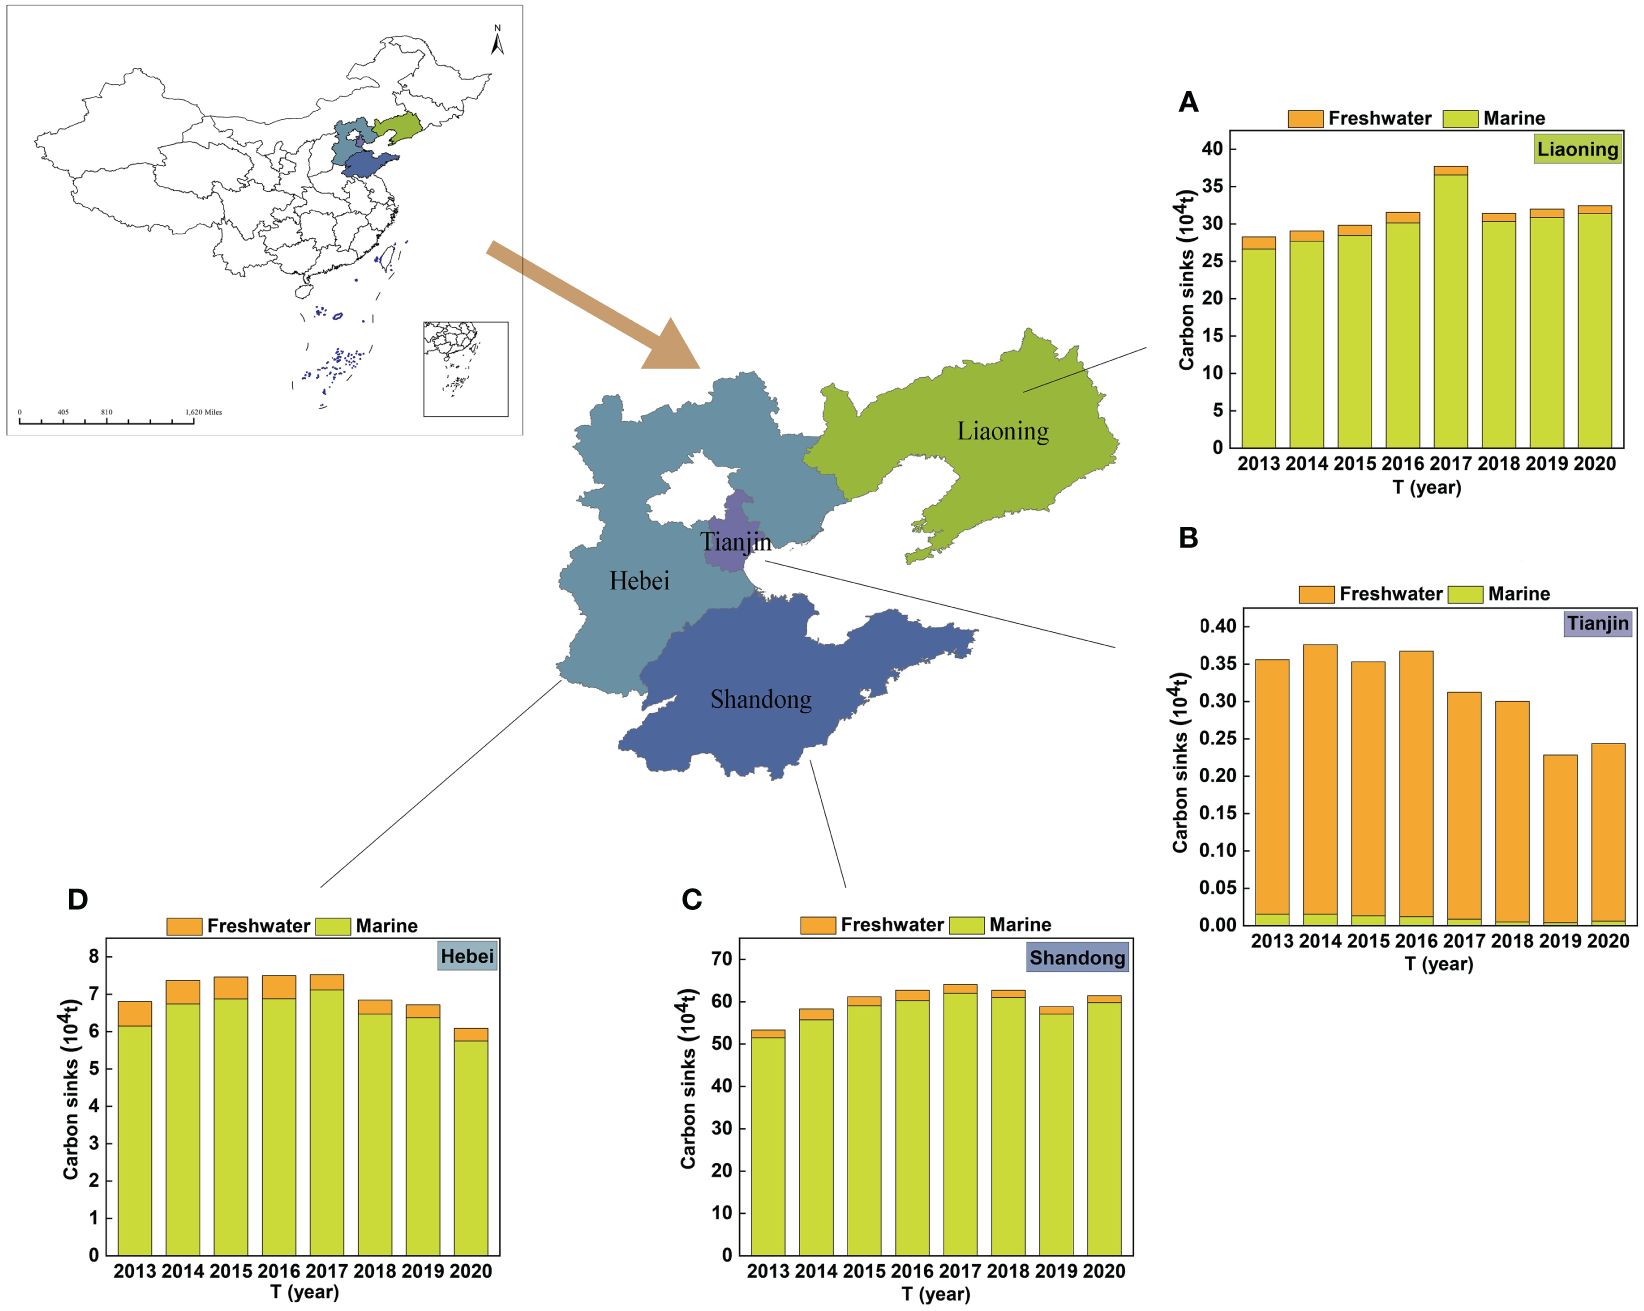
Figure 5 The carbon sinks of each province (city) from 2013 to 2020. (A) Liaoning (B) Tianjin (C) Shandong (D) Hebei.
According to Figure 6, Shandong and Liaoning contributed most to carbon emissions. Except for Liaoning, the carbon emissions of the remaining three provinces (cities) decreased from 2013 to 2020. During the period, Liaoning increased by 4.391 ten thousand tons from 166.471 to 170.862 ten thousand tons, with a growth rate of 2.638%. The carbon emissions of Hebei decreased by 3.026 ten thousand tons from 48.082 to 45.057 ten thousand tons, with a decrease rate of 6.292%. The highest carbon emission points of the two provinces were in 2015, about 186.018 and 50.811 ten thousand tons respectively. In Tianjin, there was a 16.178% decrease rate in the carbon emissions from 8.805 to 7.380 ten thousand tons. The carbon emissions of Shandong dropped from 256.700 to 243.684 ten thousand tons, reflecting a reduction rate of 5.070%. The highest carbon emission points of the two provinces were in 2016, about 9.224 and 285.087 ten thousand tons respectively.
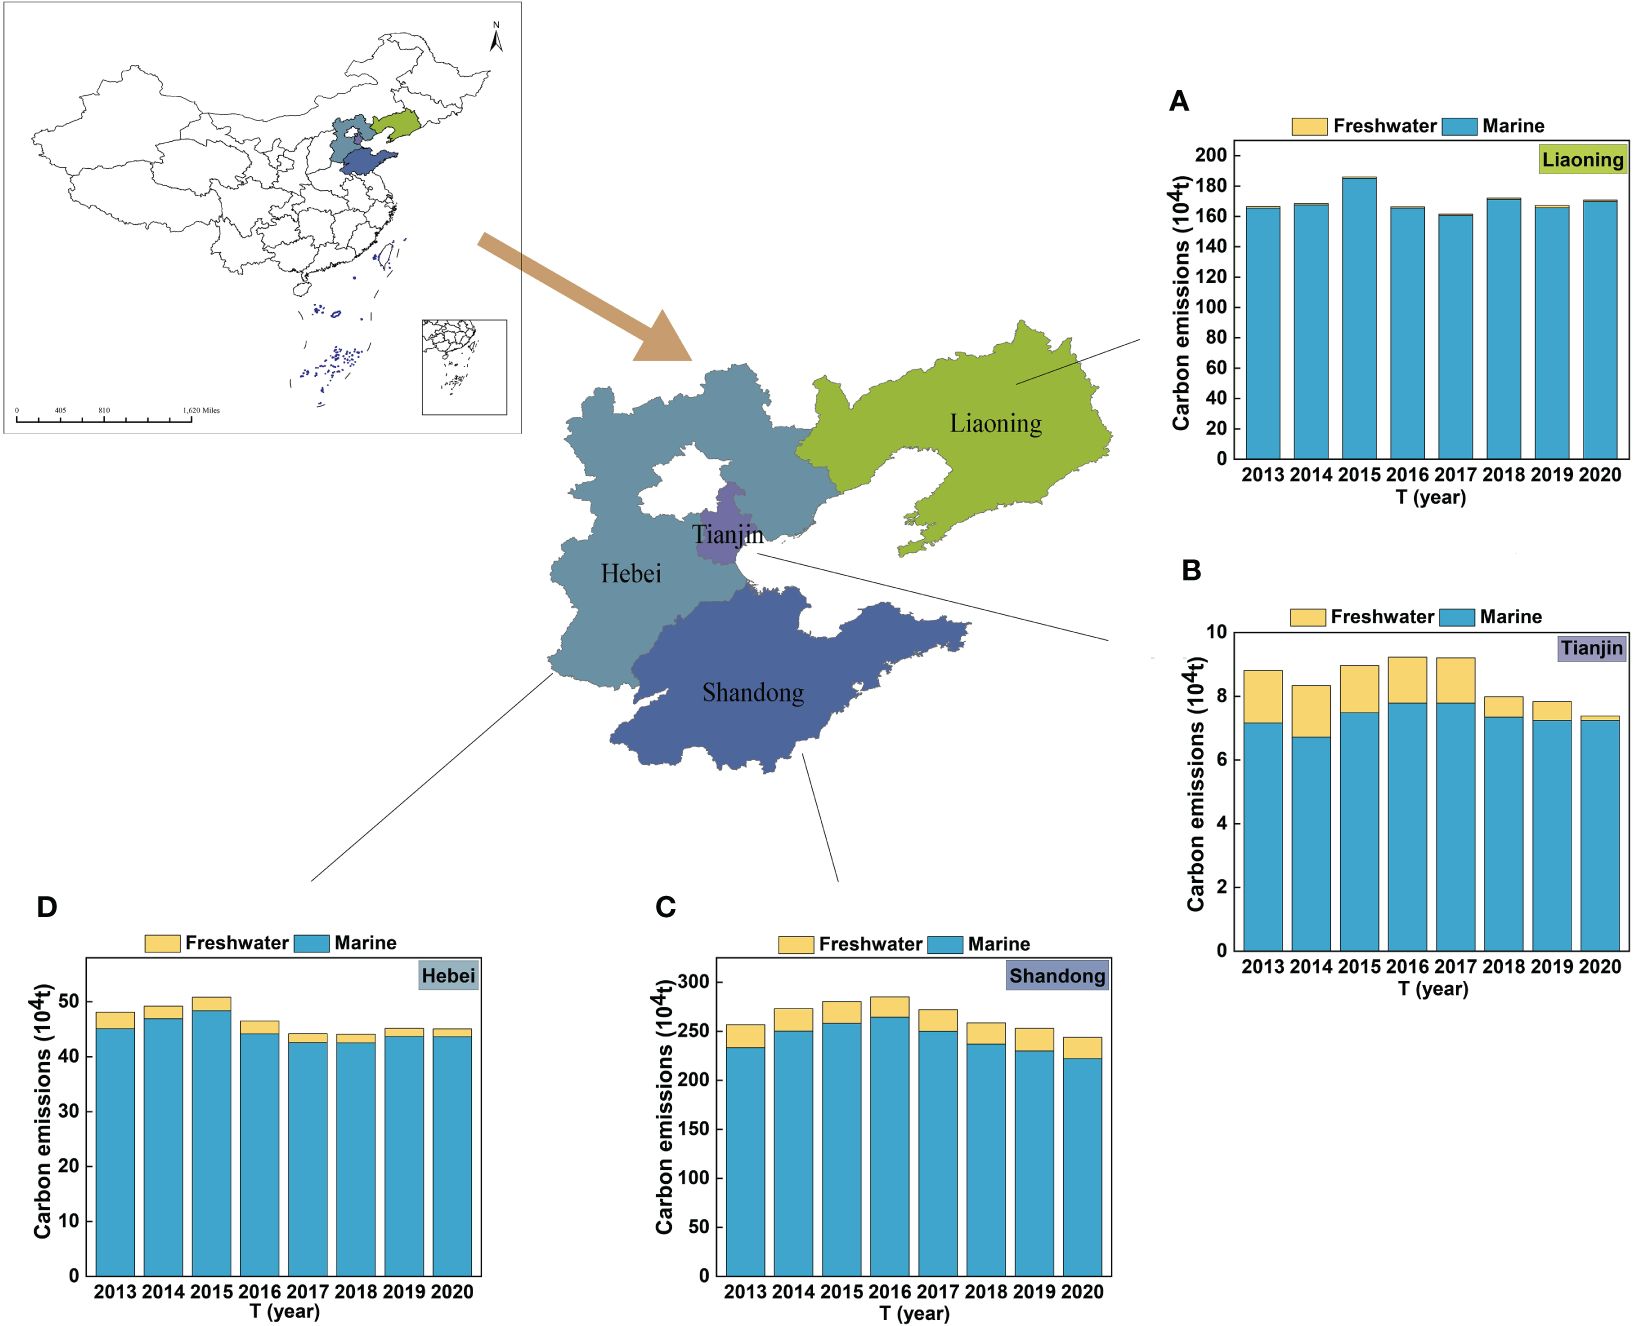
Figure 6 The carbon emissions of each province (city) from 2013 to 2020. (A) Liaoning (B) Tianjin (C) Shandong (D) Hebei.
3.3 Sensitivity analysis and scenario simulation
Sensitivity analysis shows that a slight increase or decrease in species production and the engine power of fishing vessels can cause varied net carbon emissions in the entire region. From Figure 7A, it can be seen that clams production and seawater trawl net were the predominant factors contributing to net carbon emissions. The clams were completely inhibited, and the seawater trawl net solely contributed to the net carbon emissions. Clams were the main positive factor of carbon sinks, followed by scallops and oysters, accounting for 86%, 32%, and 29%, respectively (Figure 7B). Based on Figure 7C, the seawater trawl net was the most sensitive and had a positive effect on carbon emissions, contributing to 80%. Thus, increasing the production of clams and decreasing the proportion of seawater trawl net is essential to carbon reduction in the entire region.
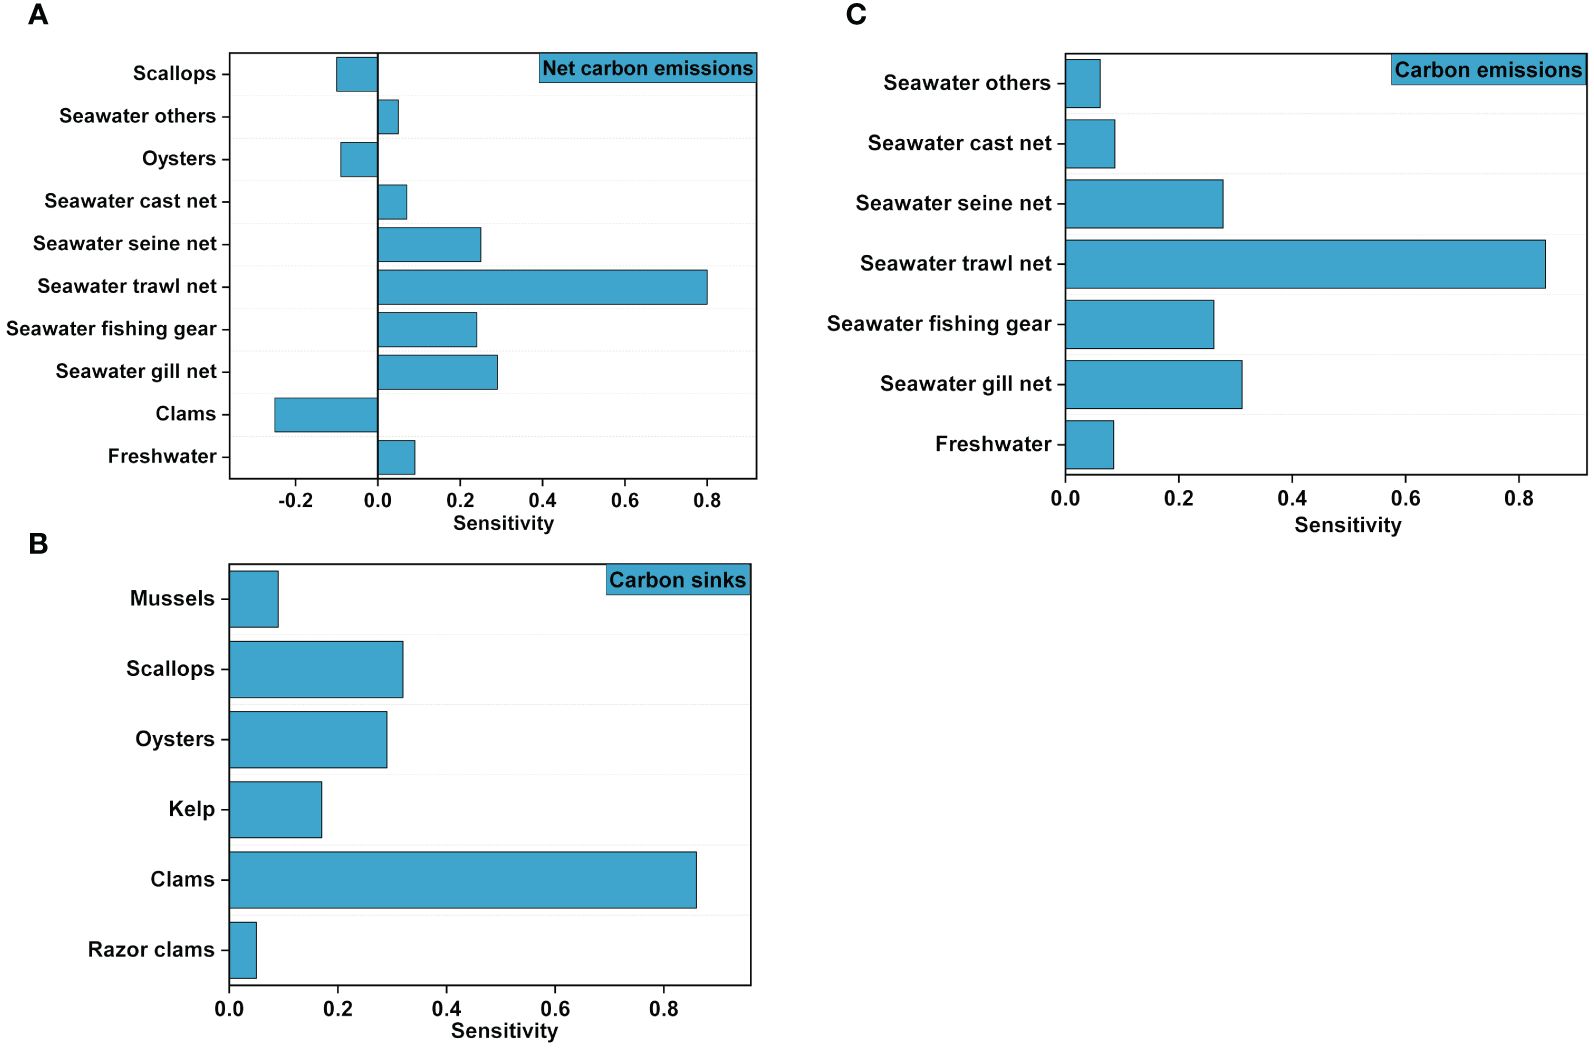
Figure 7 Sensitivity analysis for net carbon emissions, carbon sinks, and carbon emissions at the scale. (A) Net carbon emissions (B) Carbon sinks (C) Carbon emissions.
The results of the sensitivity analysis are shown from a provincial perspective (Supplementary Table 1). Among the most significant factors influencing carbon sinks in Liaoning, kelp made the largest contribution, accounting for 54%. The seawater trawl net showed the highest sensitivity to carbon emissions, at 87%. In contrast to Liaoning, Hebei exhibited the greatest sensitivity to carbon emissions from using seawater seine fishing methods, at approximately 88%. Its carbon sink was predominantly dependent on the carbon sinks facilitated by scallops, accounting for 97%. The sensitivity of the carbon sinks in Tianjin was notably driven by freshwater fish, with Cyprinus carpio and Carassius auratus as the top contributors at sensitivity levels of 68% and 47%, respectively. Freshwater fishing was the main factor in carbon emissions, accounting for 86%. In Shandong Province, the carbon sinks of clams were the most significant, representing 93% of the province’s total carbon sink capacity in the province. The primary contributor to carbon emissions was seawater trawl net, accounting for 94%, far exceeding the impact of other fishing methods.
Under the different scenarios, the influences on net carbon emissions are different. The findings of the scenario analysis are depicted in Figure 8. Specifically, increasing clams production by 5% and 10% resulted in a rise in carbon sinks of 0.17% and 0.18%, respectively, along with reductions in net carbon emissions by 4% and 4.3% (Figure 8A). Similarly, decreasing seawater trawl net by 10% and 20% resulted in carbon emissions reductions of 5% and 12%, and net carbon emissions decreases of 6% and 15% (Figure 8B). Notably, a simultaneous 10% increase in clams production and a 20% decrease in seawater trawl net triggered a substantial 19% decrease in net carbon emissions (Figure 8C). By modifying the proportion of clams production and decreasing the proportion of fishing types, it is possible to reduce net carbon emissions to some extent.
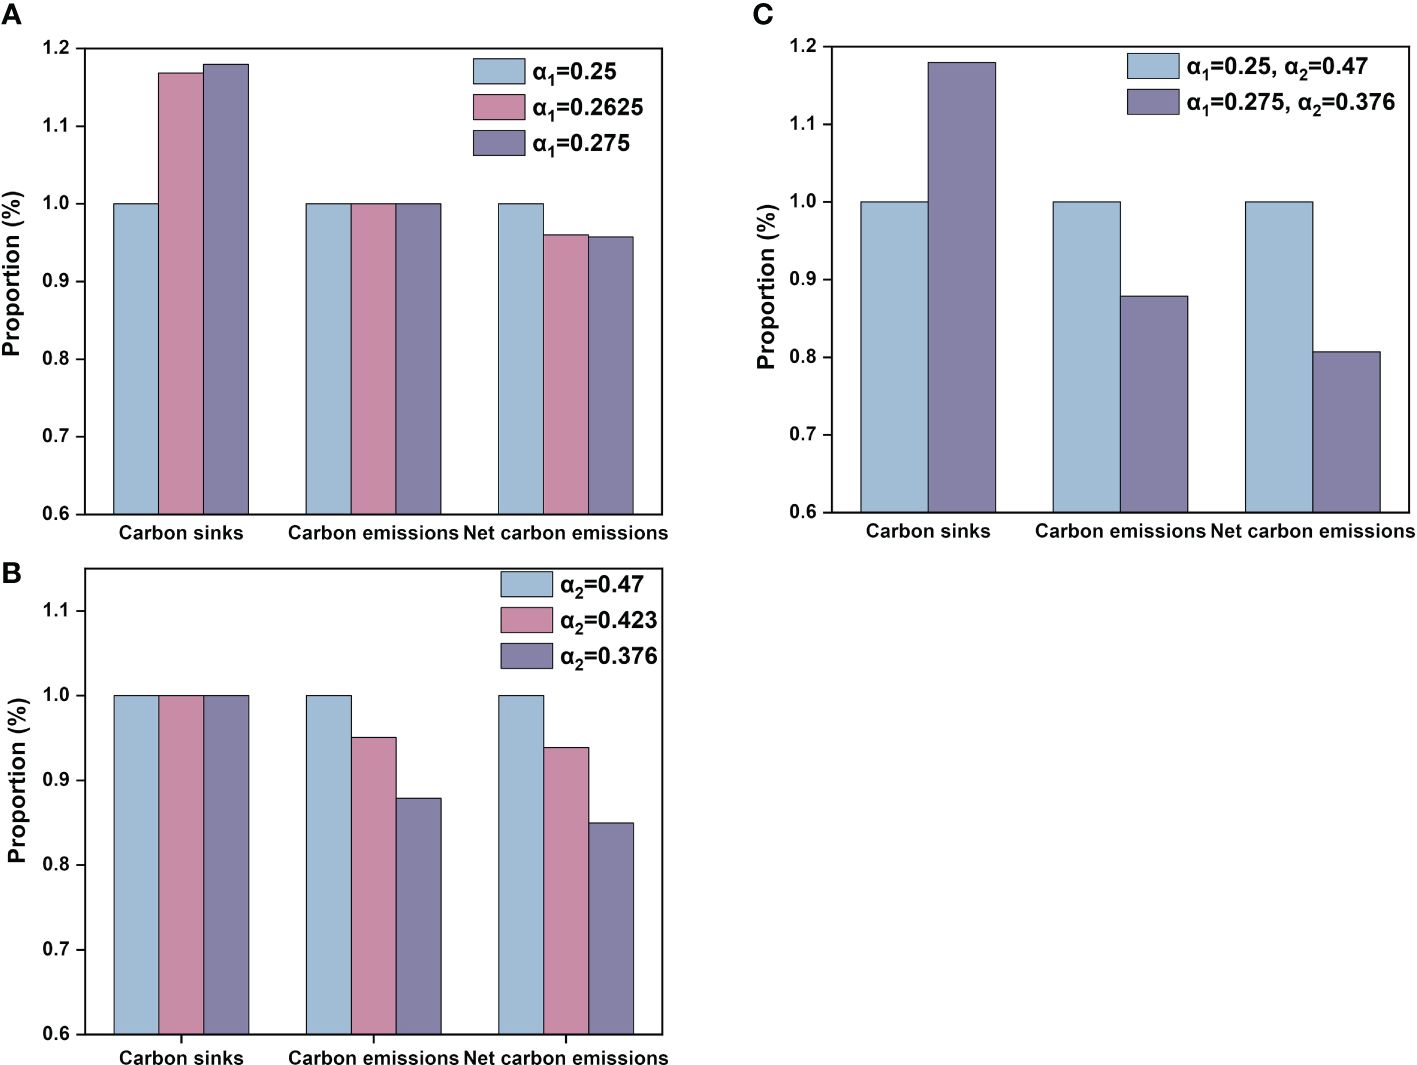
Figure 8 Analysis of scenario predictions on net carbon emissions, carbon sinks, and carbon emissions (blue denotes basic scenarios, pink and purple represent simulated scenarios). (A) Scenario 1 (B) Scenario 2 (C) Scenario 3.
4 Discussion
4.1 Improvement in the carbon assessment methods
First, compared to most previous research that explores the net carbon emissions of nine coastal provinces in China (Li et al., 2022; Tian et al., 2023), this study mainly focused on the net carbon emissions of the northern marine economic circle in detail, helping policymakers have a clearer comprehension of the carbon budget of this particular region. Second, earlier studies have explored the carbon budget of marine fisheries, while ignoring the importance of freshwater fisheries. This study explicitly addressed the carbon budget of both marine and freshwater fisheries in the study area. Third, this study comprehensively assessed the carbon sinks of fisheries in the northern marine economic circle. Compared to the modified carbon sink model, the traditional “removable carbon sink” model would underestimate the carbon sinks of fisheries by 28%-35% (Supplementary Table 2).
Freshwater fisheries, which used to assess the carbon budget of fisheries are relatively rare in the study of fisheries’ carbon budget. In our study, we provided a more accurate assessment of carbon sinks and emissions by including freshwater. We found that the fisheries of the provinces (cities) in the northern marine economic circle are all carbon sources. This result is consistent with existing literature (Wu and Li, 2022; Xiong et al., 2023).
4.2 The spatiotemporal characteristics of the carbon budget
4.2.1 Spatiotemporal evolutions of carbon budget from the regional perspective
According to the results of the assessment of the carbon budget in the fisheries industry, the entire region was not in a state of carbon neutrality by 2020. The fisheries industry mainly served as a carbon source. Carbon emissions in the northern marine economic circle have been decreasing, while carbon sinks are increasing, showing an overall decrease trend in net carbon emissions. This indicates that the fisheries industry has considerable potential for achieving carbon neutrality. In 2021, the Ministry of Agriculture and Rural Affairs of China issued a notice regarding the implementation of supportive policies for fishery development to promote high-quality development in fisheries. The notice proposes optimizing the structure of the fisheries industry and reducing the intensity of nearshore fishing, which contributes to achieving carbon neutrality (Ministry of Agriculture and Rural Affairs, 2021b).
From the perspective of the region, the net carbon emissions of fisheries reached a peak in 2015, and there has been a period of decline since 2016. This is because the “Twelfth Five-Year Plan” for fishery development achieved satisfactory results and maintained a good trend of stable and progressive fishery economy in 2015. The 13th Five-Year Plan mainly focused on accelerating the transformation and upgrading of the fishery industry, and adjusting the industrial structure to achieve green and sustainable development in 2016 (Ministry of Agriculture and Rural Affairs, 2016. Carbon sinks in the region showed an increasing trend and reached the highest point in 2017. In 2016, China implemented the Opinions on the Comprehensive Establishment of a Marine Ecological Red Line System, which included strict control over marine resource utilization and strengthened ecological preservation measures (The State Oceanic Administration, 2016). Additionally, carbon emissions initially increased and subsequently decreased over time, reaching a peak value in 2015. This trend is similar to that of net carbon emissions.
Through sensitivity analysis, it was found that the sensitive factors are mainly the species types and fishing methods. It is necessary to adjust these two aspects to decrease the net carbon emissions of fisheries. First, clams contributed the most in terms of carbon sinks, so the production of clams in aquaculture should be increased for dual carbon goals (Gu et al., 2022; Song et al., 2023). Second, seawater trawl net was an active fishing method and a significant source of carbon emissions, so the proportion of seawater trawl net in fishing methods should be reduced (Devi et al., 2021; Atwood et al., 2024).
4.2.2 Spatiotemporal evolutions of carbon budget from the provincial perspective
Overall, from 2013 to 2020, carbon emissions from fisheries in four provinces (cities) were much higher than carbon sinks, and the carbon budget was in a carbon deficit state. From the net carbon emissions perspective, Shandong and Liaoning were the major net carbon emission provinces, playing important roles in both carbon sinks and emissions. Shandong contributed the most among the provinces (cities), accounting for more than 50% of the total amount. It is necessary to strengthen carbon reduction in Shandong’s fisheries. In recent years, Shandong has implemented policies aimed at supporting the development of fisheries, including supporting fishermen in reducing their fishing vessels and transitioning to other industries (Ministry of Agriculture and Rural Affairs of Shandong Province, 2021). The government also encourages a decrease in fishing intensity to protect marine resources. Additionally, subsidies are provided for the conservation of fishing resources to offshore fishing vessels that comply with regulations. As the second contribution, Liaoning accounted for more than 30%. In Liaoning Province, efforts have been made to enhance algae cultivation in tidal flats and shallow seas, as well as to establish a national marine ranch demonstration region, aiming to create a three-dimensional ecological aquaculture system and enhance the carbon sink potential of fisheries. Moreover, initiatives to promote energy conservation and carbon reduction are being advanced through the renovation and upgrade of fishing vessels and equipment (Ministry of Agriculture and Rural Affairs of Liaoning Province, 2024). Hebei and Tianjin account for approximately 10% and 2%, respectively.
From the province’s perspective, the carbon budget across different provinces (cities) showed distinct characteristics. Liaoning reached a peak in 2015 for both net carbon emissions and carbon emissions, while the carbon sinks reached its highest value in 2017. The 13th Five-Year Plan of Liaoning aims to control greenhouse gas emissions, including increasing carbon sinks in the ecosystem. Compared to 2015, the province aims to reduce its carbon dioxide emissions per unit of GDP by 18% by 2020, effectively controlling the total carbon emissions (People's Government of Liaoning Province, 2017). The changing trend of Hebei is similar to that of Liaoning. In response to the national notification on reducing greenhouse gas emissions during the 13th Five-Year Plan, Hebei has exceeded the mandatory target of a 20.5% decrease set by the government (Department of ecology and environment of Hebei Province, 2021). Tianjin reached its highest net carbon emissions in 2017, while carbon sinks and emissions reached their peak in 2016. In 2017, the fisheries in Tianjin focused on promoting structural reform of the supply side, accelerating the transformation and upgrading of the industry, and striving to improve the sustainability of fisheries (Tianjin Municipal Bureau of Fisheries, 2017). Shandong reached its highest net carbon emissions and carbon emissions in 2016, while carbon sinks reached their highest level in 2017. The main reason for this phenomenon is that from 2013 to 2016, the number and total power of trawl and gillnet fishing vessels in Shandong have been increasing, despite a decrease in their proportion among marine fishing operations (Shao et al., 2018). In 2016, Shandong implemented a fishing and aquaculture subsidy policy. This policy encouraged fishermen to reduce the number of vessels and move towards sustainable production and ecological restoration. As a result, the number and power of fishing vessels decreased, effectively controlling fishing intensity and leading to a gradual reduction in carbon emissions from fisheries since that year (Li et al., 2022). These policies aim to reduce coal consumption during fishing operations and enhance the carbon sink of fisheries. They played a crucial role in carbon reduction of the fisheries sector from 2016 to 2020.
There are two ways to reduce net carbon emissions of fisheries. On one hand, as an important source of carbon sinks, the proportion of shellfish (mainly clams, scallops, and oysters) and algae in the fishery should be increased within the capacity of aquaculture (Food and Agriculture Organization (FAO), 2020; Gu et al., 2022; Jia et al., 2023; Le et al., 2023; Luo et al., 2023; Li et al., 2023b; Chen et al., 2024). Additionally, by providing bilateral subsidies for fishermen and consumers, this will fully stimulate the public’s motivation to increase the level of carbon sinks within fisheries (Zheng and Yu, 2022; Zhang et al., 2023). On the other hand, fishing exhibits considerable carbon emissions within fisheries. Upgrading the fishing capacity per energy consumption unit and transforming it into a low-energy and high-efficiency fishing mode will promote carbon reduction (Liu et al., 2023; Xu et al., 2023). Meanwhile, the government should distribute the emission reduction tasks in provinces according to their development reality, with a focus on those provinces that have substantial carbon emissions (Li et al., 2024).
4.3 Suggestions
Therefore, we suggest promoting energy conservation and carbon reduction and developing a low-carbon economy in fisheries at the regional level.
(1) The current fisheries policy mainly focuses on general management and conservation measures. However, they often do not fully consider the specific environmental and ecological needs of different geographical regions. As an important sea area in northern China, the northern marine economic circle has a unique marine ecosystem, fisheries resources, and environmental pressures. Therefore, it is essential to develop a specific fishery carbon reduction policy for the region due to its unique characteristics. Meanwhile, the local governments of the four provinces (cities) should attend together to implement strategic initiatives appropriate to the entire region’s development policies. Additionally, a specialized committee should be set up to handle carbon emission issues in order to manage and coordinate the four provinces (cities) as a whole.
(2) It is imperative to focus on enhance the capacity of carbon sinks. Fishermen should enhance the species with high carbon sink abilities. By actively promoting the selection and breeding of high-quality species, vigorously introducing and promoting scientific farming models, and increasing the farming share of clams (shellfish farming), there could be more benefits in carbon sinks. Additionally, establishing a carbon sink fishery demonstration zone in the area and promoting eco-friendly aquaculture techniques and methods would be beneficial.
(3) Simultaneously, there is a need to reduce carbon emissions from the coal consumption of fishing vessels. It is essential to upgrade and renovate fishing vessels, while also reducing the intensity of fishing in the northern marine economic circle. Changing the traditional bottom trawling operation can help reduce fuel consumption and minimize ecological damage. More attention should be paid to provinces with high carbon emissions, such as Shandong and Liaoning, which still need to strengthen their reduction efforts in the fisheries industry.
5 Conclusion
The key findings drawn from this article are as follows:
(1) This study demonstrated the carbon budget of fisheries within the northern marine economic circle based on modified methods of carbon assessment. The fisheries in the region served as carbon sources from 2013 to 2020. Net carbon emissions decreased by 6.261%, carbon sinks increased by 12.868%, and carbon emissions decreased by 2.724%. This indicates that the fisheries industry in this region has considerable potential for achieving carbon neutrality. In terms of proportion, the shellfish carbon sinks accounted for the highest proportion of the total carbon sinks, while the seawater trawl net accounted for the highest proportion of carbon emissions. Additionally, freshwater fisheries also made some contributions to carbon sinks and emissions.
(2) From the perspective of the provinces, all provinces (cities) did not achieve the carbon neutrality by 2020. Shandong exhibited the most substantial carbon deficit in the entire region, surpassing all other provinces in the area. After entering the 13th Five-Year Plan, the net carbon emissions of all provinces (cities) have decreased. Only Liaoning showed a slight increasing trend in net carbon emissions throughout the period, with a decrease trend observed in the remaining three provinces (cities).
(3) Net carbon emissions from fisheries showed a decreasing trend under different scenarios, with Scenario 3 having a significantly greater reduction rate than Scenarios 1 and 2. They decreased by 4% and 4.3% under Scenario 1, by 6% and 15% under Scenario 2, and by 19% under Scenario 3. Through scenario analysis, it was found that by increasing the proportion of clams and decreasing the utilization of seawater trawl net simultaneously, the net carbon emissions can be reduced.
Data availability statement
The original contributions presented in the study are included in the article/Supplementary Material. Further inquiries can be directed to the first author (jia-d11@tust.edu.cn) and corresponding author.
Author contributions
DJ: Conceptualization, Data curation, Writing – original draft. XL: Conceptualization, Software, Writing – original draft. XG: Investigation, Supervision, Writing – review & editing. JG: Formal Analysis, Methodology, Writing – review & editing. SZ: Investigation, Writing – original draft. HL: Software, Visualization, Writing – original draft. YJ: Investigation, Software, Writing – original draft. JS: Funding acquisition, Project administration, Validation, Writing – review & editing.
Funding
The author(s) declare that financial support was received for the research, authorship, and/or publication of this article. This research was financially supported by the National Nature Science Foundation of China grants (42006174 and 41876134), the National Key RD Program of China (2019YFC1407800), the State Key Laboratory of Biogeology and Environmental Geology, China University of Geosciences (GKZ22Y656), and the Changjiang Scholar Program of the Chinese Ministry of Education (T2014253) to JS.
Conflict of interest
The authors declare that the research was conducted in the absence of any commercial or financial relationships that could be construed as a potential conflict of interest.
The author(s) declared that they were an editorial board member of Frontiers, at the time of submission. This had no impact on the peer review process and the final decision.
Publisher’s note
All claims expressed in this article are solely those of the authors and do not necessarily represent those of their affiliated organizations, or those of the publisher, the editors and the reviewers. Any product that may be evaluated in this article, or claim that may be made by its manufacturer, is not guaranteed or endorsed by the publisher.
Supplementary material
The Supplementary Material for this article can be found online at: https://www.frontiersin.org/articles/10.3389/fmars.2024.1393659/full#supplementary-material
References
Atwood T. B., Romanou A., DeVries T., Lerner P. E., Mayorga J. S., Bradley D., et al. (2024). Atmospheric CO2 emissions and ocean acidification from bottom-trawling. Front. Mar. Sci. 10. doi: 10.3389/fmars.2023.1125137
Chen X., Di Q., Hou Z., Yu Z. (2022). Measurement of carbon emissions from marine fisheries and system dynamics simulation analysis: China’s northern marine economic zone case. Mar. Policy 145, 105279. doi: 10.1016/j.marpol.2022.105279
Chen X., Sun Z., Di Q., Liang C. (2024). Marine fishery carbon emission reduction and changing factors behind marine fishery eco-efficiency growth in China. Ecol. Inf. 80, 102478. doi: 10.1016/j.ecoinf.2024.102478
Department of ecology and environment of Hebei Province (2021) Hebei Workers' Daily: Our province successfully exceeds the "13th Five-Year Plan" dual carbon targets. Available online at: https://hbepb.hebei.gov.cn/hbhjt/xwzx/meitibobao/101631594201746.html.
Devi M. S., Xavier K. A. M., Singh A. S., Edwin L., Singh V. V., Shenoy L. (2021). Environmental pressure of active fishing method: A study on carbon emission by trawlers from north-west Indian coast. Mar. Policy 127, 104453. doi: 10.1016/j.marpol.2021.104453
Entrena-Barbero E., Feijoo G., González-García S., Moreira M. T. (2022). Blue carbon accounting as metrics to be taken into account towards the target of GHG emissions mitigation in fisheries. Sci. Total Environ. 847, 157558. doi: 10.1016/j.scitotenv.2022.157558
Fishery Bureau of Ministry of Agriculture and Rural Affairs of China (2014–2021). China Fishery statistical yearbook (Beijing: China Agriculture Press).
Food and Agriculture Organization (FAO) (2020). The state of world fisheries and aquaculture 2020 (Rome: FAO Fisheries and Aquaculture Department).
Gao Y., Fu Z., Yang J., Yu M., Wang W. (2022). Spatial–temporal differentiation and influencing factors of marine fishery carbon emission efficiency in China. Environ. Dev. Sustain. 26, 453–478. doi: 10.1007/s10668–022-02716–6
Greer K., Zeller D., Woroniak J., Coulter A., Winchester M., Palomares M. L. D., et al. (2019). Global trends in carbon dioxide (CO2) emissions from fuel combustion in marine fisheries from 1950 to 2016. Mar. Policy 107, 103382. doi: 10.1016/j.marpol.2018.12.001
Gu Y., Lyu S., Wang L., Chen Z., Wang X. (2022). Assessing the carbon sink capacity of coastal mariculture shellfish resources in China from 1981–2020. Front. Mar. Sci. 9. doi: 10.3389/fmars.2022.981569
Guan H., Sun Z., Zhao A. (2022). Spatio-temporal evolution and influencing factors of net carbon sink in marine aquaculture in China. Front. Environ. Sci. 10. doi: 10.3389/fenvs.2022.978073
Guo J., Yuan X., Song W. (2022). Driving forces on the development of China’s marine economy: Efficiency and spatial perspective. Ocean Coast. Manage. 224, 106192. doi: 10.1016/j.ocecoaman.2022.106192
Hao Y., Tan Z., Cai Y., Liang S., Zhang G., Wang Q., et al. (2024). Assessment of carbon sink capacity and its value accounting for a farmed shellfish in the coastal wetland of the Yalu River Estuary. Front. Aquacult. 3. doi: 10.3389/faquc.2024.1355741
Hong X., Wang K., Song H., Chu J., Zhang Z. (2022). Carbon sink accounting and capacity assessment of mariculture in Changdao, Shandong Province. Ocean Dev. Manage. 8, 12–16. doi: 10.3969/j.issn.1005–9857.2022.8.hykfygl202208002
Hornborg S., Smith A. D. M. (2020). Fisheries for the future: Greenhouse gas emission consequences of different fishery reference points. ICES J. Mar. Sci. 77, 1666–1671. doi: 10.1093/icesjms/fsaa077
Huang S., He Y. (2019). Management of China’s capture fisheries: Review and prospect. Aquacult. Fish. 4, 173–182. doi: 10.1016/j.aaf.2019.05.004
Jia R., Li P., Chen C., Liu L., Li Z.-H. (2023). Shellfish-algal systems as important components of fisheries carbon sinks: Their contribution and response to climate change. Environ. Res. 224, 115511. doi: 10.1016/j.envres.2023.115511
Jiao N., Herndl G. J., Hansell D. A., Benner R., Kattner G., Wilhelm S. W., et al. (2010). Microbial production of recalcitrant dissolved organic matter: Long-term carbon storage in the global ocean. Nat. Rev. Microbiol. 8, 593–599. doi: 10.1038/nrmicro2386
Kang B., Huang X., Li J., Liu M., Guo L., Han C.-C. (2017). Inland fisheries in China: past, present, and future. Rev. Fish. Sci. Aquacult. 25, 270–285. doi: 10.1080/23308249.2017.1285863
Lai Q., Ma J., He F., Zhang A., Pei D., Yu M. (2022). Current and future potential of shellfish and algae mariculture carbon sinks in China. Int. J. Environ. Res. Public Health 19, 8873. doi: 10.3390/ijerph19148873
Le C.-Y., Feng J.-C., Sun L., Yuan W., Wu G., Zhang S., et al. (2023). Co-benefits of carbon sink and low carbon food supply via shellfish and algae farming in China from 2003 to 2020. J. Clean. Product. 414, 137436. doi: 10.1016/j.jclepro.2023.137436
Li N., Duan X., Wang H., Mu H., Li Y., Yang W. (2023b). Influencing factors and prediction of net carbon sink in the primary sector of the coastal city in China. Environ. Sci. pollut. Res. 30, 48168–48178. doi: 10.1007/s11356-023-25709-y
Li H., Feng X., Xiong T., Shao W., Wu W., Zhang Y. (2023a). Particulate organic carbon released during macroalgal growth has significant carbon sequestration potential in the ocean. Environ. Sci. Technol. 57, 19723–19731. doi: 10.1021/acs.est.3c04959
Li B., Jin X. (2019). Spatio-temporal evolution of marine fishery industry ecosystem vulnerability in the Bohai rim region. Chin. Geograph. Sci. 29, 1052–1064. doi: 10.1007/s11769-019-1076-5
Li S., Yao L., Zhang Y., Zhao Y., Sun L. (2024). China’s provincial carbon emission driving factors analysis and scenario forecasting. Environ. Sustain. Indic. 22, 100390. doi: 10.1016/j.indic.2024.100390
Li Z., Zhang L., Wang W., Ma W. (2022). Assessment of carbon emission and carbon sink capacity of China’s marine fishery under carbon neutrality target. J. Mar. Sci. Eng. 10, 1179. doi: 10.3390/jmse10091179
Lin B., Ge J. (2019). Valued forest carbon sinks: How much emissions abatement costs could be reduced in China. Journal of Cleaner Production 224, 445–464. doi: 10.1016/j.jclepro.2019.03.221
Liu C., Liu G., Casazza M., Yan N., Xu L., Hao Y., et al. (2022). Current status and potential assessment of China’s ocean carbon sinks. Environ. Sci. Technol. 56, 6584–6595. doi: 10.1021/acs.est.1c08106
Liu G., Xu Y., Ge W., Yang X., Su X., Shen B., et al. (2023). How can marine fishery enable low carbon development in China? Based on system dynamics simulation analysis. Ocean Coast. Manage. 231, 106382. doi: 10.1016/j.ocecoaman.2022.106382
Liu Y., Yu R.-C., Kong F.-Z., Li C., Dai L., Chen Z.-F., et al. (2019). Contamination status of lipophilic marine toxins in shellfish samples from the Bohai Sea, China. Environ. pollut. 249, 171–180. doi: 10.1016/j.envpol.2019.02.050
Luo H., Fu Y., Shi J., Xie S., Yang Y. (2023). Carbon sink potential and environmental benefits of seaweed: A case study of the seaweed cultivation industry on China coast. Aquaculture 572, 739494. doi: 10.1016/j.aquaculture.2023.739494
Ministry of Agriculture and Rural Affairs of Liaoning Province (2024) Guidelines for Agricultural Ecological Environment Protection and Pollution Prevention and Control in the Province in 2024. Available online at: https://nync.ln.gov.cn/nync/index/zwgk/zszdgkwj/2024012615484233863/index.shtml.
Ministry of Agriculture and Rural Affairs of Shandong Province (2021) Implementation Plan for Promoting High-quality Development of Fisheries through the Implementation of Supportive Policies for Fisheries Development in Shandong Province. Available online at: http://nync.shandong.gov.cn/zwgk/cwgl/202307/t20230718_4378829.html.
Ministry of Agriculture and Rural Affairs of the People’s Republic of China (2010) Reference Standard for the Measurement of Oil Price Subsidy of Domestic Motor Fishing Vessel. Available online at: http://www.moa.gov.cn/govpublic/YYJ/201006/t20100606_1538704.htm.
Ministry of Agriculture and Rural Affairs of the People’s Republic of China (2016) Notice on Issuing the Key Points of Fisheries and Fishery Administration Work in 2016. Available online at: https://www.moa.gov.cn/govpublic/YYJ/201602/t20160203_5007519.htm.
Ministry of Agriculture and Rural Affairs of the People’s Republic of China (2020) Control fishing intensity and promote sustainable and healthy development of marine fisheries. Available online at: http://www.yyj.moa.gov.cn/gzdt/202012/t20201214_6358055.htm.
Ministry of Agriculture and Rural Affairs of the People’s Republic of China (2021a) National Fishery Economic Statistics Report in 2020. Available online at: http://www.yyj.moa.gov.cn/gzdt/202107/t20210728_6372958.htm.
Ministry of Agriculture and Rural Affairs of the People’s Republic of China (2021b) Notification on the Implementation of Supportive Policies for Fisheries Development to Promote High-Quality Development in the Fisheries Industry. Available online at: https://www.gov.cn/zhengce/zhengceku/2021–07/05/content_5622531.htm.
People's Government of Liaoning Province (2017) Thirteenth Five-Year Plan for Controlling Greenhouse Gas Emissions in Liaoning Province. Available online at: https://www.ln.gov.cn/web/zwgkx/lnsrmzfgb/2017n/zk/zk6/szfwj/B63C652A72D640419726F3D903D1B7BF/index.shtml.
Pessarrodona A., Franco-Santos R. M., Wright L. S., Vanderklift M. A., Howard J., Pidgeon E., et al. (2023). Carbon sequestration and climate change mitigation using macroalgae: A state of knowledge review. Biol. Rev. 98, 1945–1971. doi: 10.1111/brv.12990
Ren W. (2021). Study on the removable carbon sink estimation and decomposition of influencing factors of mariculture shellfish and algae in China—A two-dimensional perspective based on scale and structure. Environ. Sci. pollut. Res. 28, 21528–21539. doi: 10.1007/s11356-020-11997-1
Ross M. E., Stanley M. S., Day J. G., Semião A. J. C. (2017). A comparison of methods for the non-destructive fresh weight determination of filamentous algae for growth rate analysis and dry weight estimation. J. Appl. Phycol. 29, 2925–2936. doi: 10.1007/s10811-017-1157-8
Saba G. K., Burd A. B., Dunne J. P., Hernández-León S., Martin A. H., Rose K. A., et al. (2021). Toward a better understanding of fish-based contribution to ocean carbon flux. Limnol. Oceanogr. 66, 1639–1664. doi: 10.1002/lno.11709
Sawut R., Li Y., Kasimu A., Ablat X. (2023). Examining the spatially varying effects of climatic and environmental pollution factors on the NDVI based on their spatially heterogeneous relationships in Bohai Rim, China. J. Hydrol. 617, 128815. doi: 10.1016/j.jhydrol.2022.128815
Shao G., Chu R., Li C. (2018). Research on carbon balance of marine fishery in Shandong Province using the calculation results of carbon emission and carbon sink. Chin. Fish. Econ. 36, 105032.
Shao G., Liu B., Li C. (2019). Evaluation of carbon dioxide capacity and the effects of decomposition and spatio temporal differentiation of seawater in China’s main sea area based on panel data from 9 coastal provinces in China. Acta Ecol. Sin. 39, 2614–2625. doi: 10.5846/stxb201801080049
Song M., Pan X., Pan X. (2020). Analysis of the marine carbon sink capacity in China. In Sustain. Mar. Res. Utiliz. China pp, 103–144). doi: 10.1016/B978-0-12-819911-4.00004-7
Song C., Xiong Y., Jin P., Sun Y., Zhang Q., Ma Z., et al. (2023). Mariculture structure adjustment to achieve China’s carbon neutrality and mitigate climate change. Sci. Total Environ. 895, 164986. doi: 10.1016/j.scitotenv.2023.164986
State Oceanic Administration (2016) Opinions on Establishing an Ecological Red Line System in the Bohai Sea. Available online at: https://www.gov.cn/gzdt/2012–10/17/content_2245965.htm.
Sun S., Song Z., Chen B., Wang Y., Ran X., Fang Y., et al. (2023). Current and future potential soil organic carbon stocks of vegetated coastal ecosystems and their controls in the Bohai Rim Region, China. CATENA 225, 107023. doi: 10.1016/j.catena.2023.107023
Tan K., Liu X., Yan X., Huang L., Luo C., Tan K., et al. (2024). Performance of fishery carbon sink of oyster aquaculture (mainly Crassostrea hongkongensis) in Guangxi, China: A long-term, (2003–2022) analysis. Estuarine Coast. Shelf Sci. 300, 108707. doi: 10.1016/j.ecss.2024.108707
Tang Q., Zhang J., Fang J. (2011). Shellfish and seaweed mariculture increase atmospheric CO2 absorption by coastal ecosystems. Mar. Ecol. Prog. Ser. 424, 97–104. doi: 10.3354/meps08979
Tian P., Wang H., Li J., Liu Y., Zhang H., Zhong J., et al. (2023). Spatiotemporal variation characteristics and system dynamic simulation of China’s marine fishery carbon emissions. Resour. Sci. 45, 1074–1090. doi: 10.18402/resci.2023.05.15
Tianjin Municipal Bureau of Fisheries (2017) Key Points of Tianjin's Fisheries Work in 2017. Available online at: http://www.yyj.moa.gov.cn/gzdt/201904/t20190418_6195712.htm.
The Chinese Foreign Ministry. (2020). TCFM (The Chinese Foreign Ministry) Statement by Xi Jinping President of the People's Republic of China at the general debate of the 75th session of the United Nations General Assembly. Available at: https://www.fmprc.gov.cn/mfa_eng/zxxx_662805/t1817098.shtml.
Wang G., Feng Y. (2023). Assessment and prediction of net carbon emission from fishery in Liaoning Province based on eco-economic system simulation. J. Clean. Product. 419, 138080. doi: 10.1016/j.jclepro.2023.138080
Wang Q., Wang S. (2022). Carbon emission and economic output of China’s marine fishery – A decoupling efforts analysis. Mar. Policy 135, 104831. doi: 10.1016/j.marpol.2021.104831
Wu J., Li B. (2022). Spatio-temporal evolutionary characteristics of carbon emissions and carbon sinks of marine industry in China and their time-dependent models. Mar. Policy 135, 104879. doi: 10.1016/j.marpol.2021.104879
Xiong H., Wang X., Hu X. (2023). Research on the duality of China’s marine fishery carbon emissions and its coordination with economic development. Int. J. Environ. Res. Public Health 20, 1423. doi: 10.3390/ijerph20021423
Xu Y., Lin J., Yin B., Martens P., Krafft T. (2023). Marine fishing and climate change: A China’s perspective on fisheries economic development and greenhouse gas emissions. Ocean Coast. Manage. 245, 106861. doi: 10.1016/j.ocecoaman.2023.106861
Yang L., Hao X., Shen C., An D. (2022). Assessment of carbon sink capacity and potential of marine fisheries in China under the carbon neutrality target. Res. Sci. 44, 716–729. doi: 10.18402/resci.2022.04.06
Zeng N., Jiang K., Han P., Hausfather Z., Cao J., Kirk-Davidoff D., et al. (2022). The Chinese carbon-neutral goal: challenges and prospects. Adv. Atmos. Sci. 39, 1229–1238. doi: 10.1007/s00376-021-1313-6
Zhang Z., Wang W., He Y. (2010). The calculation of emissions of carbon during the process of fishing boats operations in China. Journal of Shanghai Ocean University 19, 848-852.
Zhang F., He Y., Xie S., Shi W., Zheng M., Wang Y. (2023). Research on the game of fishermen’s cooperative behavior in developing marine carbon sink fisheries from a complex network perspective. Ocean Coast. Manage. 244, 106832. doi: 10.1016/j.ocecoaman.2023.106832
Zhang H., Wang X. (2024). Regional disparities and dynamic distribution in the high-quality development of the marine economy. Sustainability 16, 839. doi: 10.3390/su16020839
Zhao N., Wang K., Yuan Y. (2023). Toward the carbon neutrality: Forest carbon sinks and its spatial spillover effect in China. Ecol. Econ. 209, 107837. doi: 10.1016/j.ecolecon.2023.107837
Zheng S., Yu L. (2022). The government’s subsidy strategy of carbon-sink fishery based on evolutionary game. Energy 254, 124282. doi: 10.1016/j.energy.2022.124282
Keywords: carbon sinks, carbon emissions, fisheries, sensitivity analysis, scenario simulation
Citation: Jia D, Liu X, Guan X, Guo J, Zhang S, Li H, Jin Y and Sun J (2024) Spatio-temporal differences and simulation studies of the carbon budget from fisheries in the northern marine economic circle of China. Front. Mar. Sci. 11:1393659. doi: 10.3389/fmars.2024.1393659
Received: 29 February 2024; Accepted: 28 May 2024;
Published: 11 June 2024.
Edited by:
Yu-Xi Feng, Jiangmen Laboratory of Carbon Science and Technology, ChinaReviewed by:
Jinlin Liu, Tongji University, ChinaZhihui Huang, Chinese Academy of Fishery Sciences (CAFS), China
Copyright © 2024 Jia, Liu, Guan, Guo, Zhang, Li, Jin and Sun. This is an open-access article distributed under the terms of the Creative Commons Attribution License (CC BY). The use, distribution or reproduction in other forums is permitted, provided the original author(s) and the copyright owner(s) are credited and that the original publication in this journal is cited, in accordance with accepted academic practice. No use, distribution or reproduction is permitted which does not comply with these terms.
*Correspondence: Jun Sun, cGh5dG9wbGFua3RvbkAxNjMuY29t
†These authors have contributed equally to this work