- 1Department of Ecosystems and Sediment Dynamics, Deltares, Delft, Netherlands
- 2Department of Physical Geography, Utrecht University, Utrecht, Netherlands
- 3Department of Coastal Systems, Royal Netherlands Institute for Sea Research (NIOZ), Texel, Netherlands
- 4Delft University of Technology (TU) Delft, Delft, Netherlands
This study investigates the influence of air exposure time on the erodibility of intertidal mud flats, emphasizing the role of evaporation in altering sediment strength and cohesion. Through a comprehensive approach combining laboratory experiments, fieldwork, and numerical modelling, it explores the dynamic interactions between sediment properties and environmental conditions. The research reveals that drying significantly reduces sediment erodibility, with pronounced effects observed during the initial hours of air exposure. Laboratory tests demonstrate a direct correlation between drying time and increased yield stress for both artificial and field-derived mud samples. Field observations further support these results, showing spatial and temporal variations in water content and shear strength across various locations on a tidal flat. The study emphasizes the critical impact of mud content on water retention and the subsequent effect on sediment stability. The incorporation of drying time into erosion formulations within a numerical model highlights the importance of considering evaporation processes in predicting the morphological evolution of tidal flats. This research contributes to a better understanding of sediment transport dynamics in intertidal zones, offering insights into the mechanisms driving the growth and stability of mud flats. It underscores the necessity of integrating evaporation effects into cohesive sediment transport models to enhance the accuracy of predictions concerning the erosion and accretion of intertidal environments.
1 Introduction
The erosion properties of tidal flats influence the morphological evolution of tidal flats. Erodibility is one of the key parameters in cohesive sediment transport models. A long and rich research history exists on this topic, with prominent attention to the influence of bed composition, sand-mud ratio, density, consolidation, and biota (Grabowski et al., 2011). These influences have been included, either schematically or in substantial detail, in many cohesive sediment transport models. However, in most models, formulations for the erodibility of intertidal mud flats and salt marshes are the same as for subtidal areas and do not depend on the duration of inundation and exposure to the atmosphere, which may influence the consolidation and strength development of the bed. The aim of this contribution is to investigate the importance of this effect. Is it a minor effect which may be safely neglected, or is it a major effect with an important influence on the growth and stability of mud flats and should it be added to our models?
The conventional erosion formula is expressed in Equation 1.
Where E is the erosion rate (kg/m2/s), (Pa) is the bed shear stress due to hydrodynamic forces, (Pa) is the critical shear strength for erosion of the sediment and M is its erosion parameter (kg/m2/s) depending on the (geotechnical) properties of the sediment (Van Kessel et al., 2011). In the simplest approach sediment properties are constant and the erosion rate only varies with hydrodynamic forcing. However, sediment properties may vary with depth, in space and time. This implies that in subsequent cases, the bed may respond differently to the same hydrodynamic forcing.
Coastal zones are reworked by hydrodynamic forces at different time scales. The tide is a cyclic force on a daily and monthly time scale whereas the wave forcing is related to seasons. These hydrodynamic forces impact the stability of coastal areas and cause erosion of the bed material if the shear stress induced by waves and the tide exceeds the critical shear stress for erosion of the bed material.
For muddy environments, the bed strength may also vary. Processes such as consolidation and thixotropy increase the critical shear stress for erosion as function of time. In case of thixotropy, physical-chemical processes between clay particles result in structural change over time and in an increase in the yield strength and critical shear stress for erosion (Van Kessel and Blom, 1998). With other words, that the yield strength and viscosity of mud decreases as its structure is collapsing upon shear. This is generally referred to as shear thinning. But after shearing and at rest, the structure gradually reforms and yield strength and viscosity increase. During consolidation, pore water drains out of the sediment bed driven by excess pore pressure gradients and the clay particles assemble, resulting in increased effective stresses between particles and higher critical shear stresses. Consolidation of submerged mud occurs due to the self-weight of the material. Hence, well-consolidated deeper layers are less erodible (Mehta and Partheniades, 1982). For muddy intertidal zones, the pore water may evaporate if the waterline retreats inducing suction (i.e. negative excess pore pressure). Therefore, evaporation enhances the consolidation process (Colosimo et al., 2023). In the intertidal zone the evaporation effect might be substantial because of the long emergence time of a part of the tidal flat and the strong hydraulic gradients induced by suction compared to self-weight consolidation.
Numerical models cover the time varying hydrodynamic forcing but do not sufficiently cover the time varying strength of mud. As a result, large scale models of estuaries and lagoons overestimate mud resuspension in the subtidal and intertidal zone (Grabowski et al., 2011). During flood, a thin layer of mud settles on a tidal flat. During ebb flow, a part of the material will remain on the tidal flat due to consolidation. When the tidal flat is exposed, the deposited material over-consolidates due to evaporation and the bed shear strength increases further (Amos et al., 1992, 1997; Colosimo et al., 2023). The time dependent strength increase due to self-weight consolidation was included in a numerical model by Zhou et al. (2016). Model simulations that included consolidation result in less erosion of the intertidal zone. However, the model does not include the evaporation processes and the parameters that represent the mud characteristics have a large uncertainty range. Hence, accretion and erosion processes of intertidal zones in estuaries are still not fully resolved. The potential evaporation rate at the sediment-water interface can be obtained from local measurements or atmosphere models. However, full coupling is not required, the potential evaporation rate may be applied as a boundary condition to a consolidation and drying model.
The parametrization of the mud properties and the erosion of consolidated material has been studied in laboratories and the field. Van Kessel and Fontijn (2000) concluded that the yield stress of undrained material increases for longer consolidation times. Tran and Strom (2019) studied the erodibility of deposited mud layers with different thicknesses under water. Thicker mud layers were more resistant to erosion because, the self-weight consolidation increases for thicker layers. Nguyen et al. (2019) tested the effect of drying time and temperature on the critical shear strength of mud samples. The critical shear strength increases with a factor 1.2 – 2.2 and temperature has a strong impact on the critical shear strength. These studies underline the relevance of the time dependent consolidation and importance of evaporation (Jacobs et al., 2011).
In the past decades, our understanding of the erosion processes, formulations, and parameters advanced. However, the impact of inundation and air exposure on the erosion properties of mud is still unresolved. In this research, we study the erosion properties of mud and the relevance of inundation and air exposure in a holistic approach with laboratory experiments, fieldwork and modelling. We measured material properties (e.g. particle size distribution (PSD), water content, bulk and dry density) and linked those to the material strength. The measured material strength properties are 1) the yield strength and viscosity measured with rheometer tests, and 2) erosion rates of samples with Gust chamber tests. For these lab measurements, we used different samples with varying air exposure times.
In the field we measured the in-situ strength of a tidal flat and we took samples for lab experiments and water content tests. The material properties obtained from the lab and the field were used as input data for the numerical model tests.
The lab protocols, field campaigns and model set-up are described in Section. 2. Section 3 presents the results of the various lab tests, fieldwork and model simulations with adapted erosion formulas. We discuss the obtained results in comparison with earlier studies in Section 4.
2 Material and methods
This study combined fieldwork, lab work, and the analysis of erosion models for under- and over-consolidated beds. Fieldwork aimed to find evidence of reduced soil water content and increased shear strength on tidal flats within one tidal cycle due to drying. To enhance our understanding of how drying affects the erodibility of mud, we conducted manipulative lab experiments. These experiments were designed to establish empirical relationships. A summary of the aims, used methods, used sediment and associated section in this paper for the field- and lab work can be find in Table 1. Moreover, to generalize from empirical cases to broader principles, we applied physics-based numerical models.
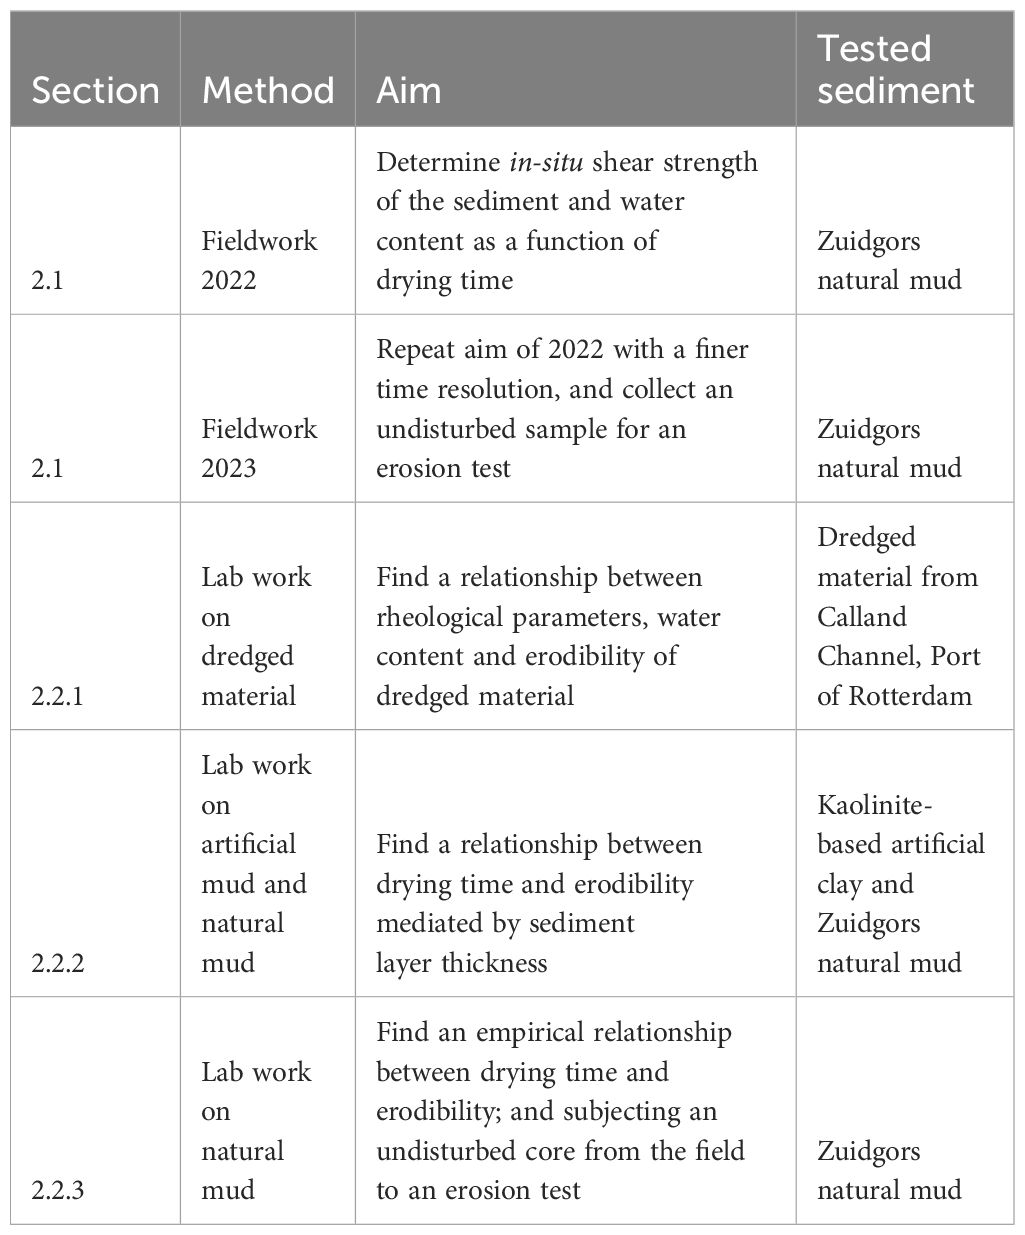
Table 1 Section, method, aim and tested sediment to summarize all applied methods for the field - and lab work.
2.1 Field work
Two small-scale field campaigns were initiated for sample collection and to determine in-situ water content and undrained shear strength of the top layer (using a Global Gilson HM-504A Torvane Pocket Shear Vane) as a function of exposure time. The shear vane had a range of 0–16kPa, with an accuracy of 0.25kPa. Both shear strength and water content depend on local environmental conditions, such as temperature, humidity, wind conditions, sediment properties and morphological context. To control for spatially variation, measurements were always taken within a 10 m radius from the plot coordinates on parts not located in micro-depression to ensure dry fall occurred. Additionally, to limit seasonal effects, we sampled in both years at the end of spring during spring tide conditions. Both field campaigns were carried out at the tidal flat Zuidgors (51.390763°N, 3.856090°E) in the Western Scheldt, the Netherlands on June 27, 2022 during a drought period and May 11, 2023 after a storm, see Figure 1. This site not only exemplifies typical environmental conditions for a tidal flat in an estuary, with a tidal range of 4.3 meters (Wang et al., 2019) and a salinity range of 18–28 PSU (Van Damme et al., 2005), but it has also been intensively studied in terms of morphodynamic tidal flat evolution (Hu et al., 2017; Willemsen et al., 2018; de Vet et al., 2020). This extensive research facilitates our efforts to contribute to the expanding body of literature associated with this site. Moreover, locations X1, X2, and X3 skipped 17%, 22%, and 41% of all tidal inundation in 2022, based on publicly accessible time series data on water levels form from the nearest tidal station at Terneuzen, and following the procedure described in Fivash et al. (2023). These values indicate that this location is comparable with other natural tidal flats that remain unvegetated given a low micro-topography intensity (Fivash et al., 2023).
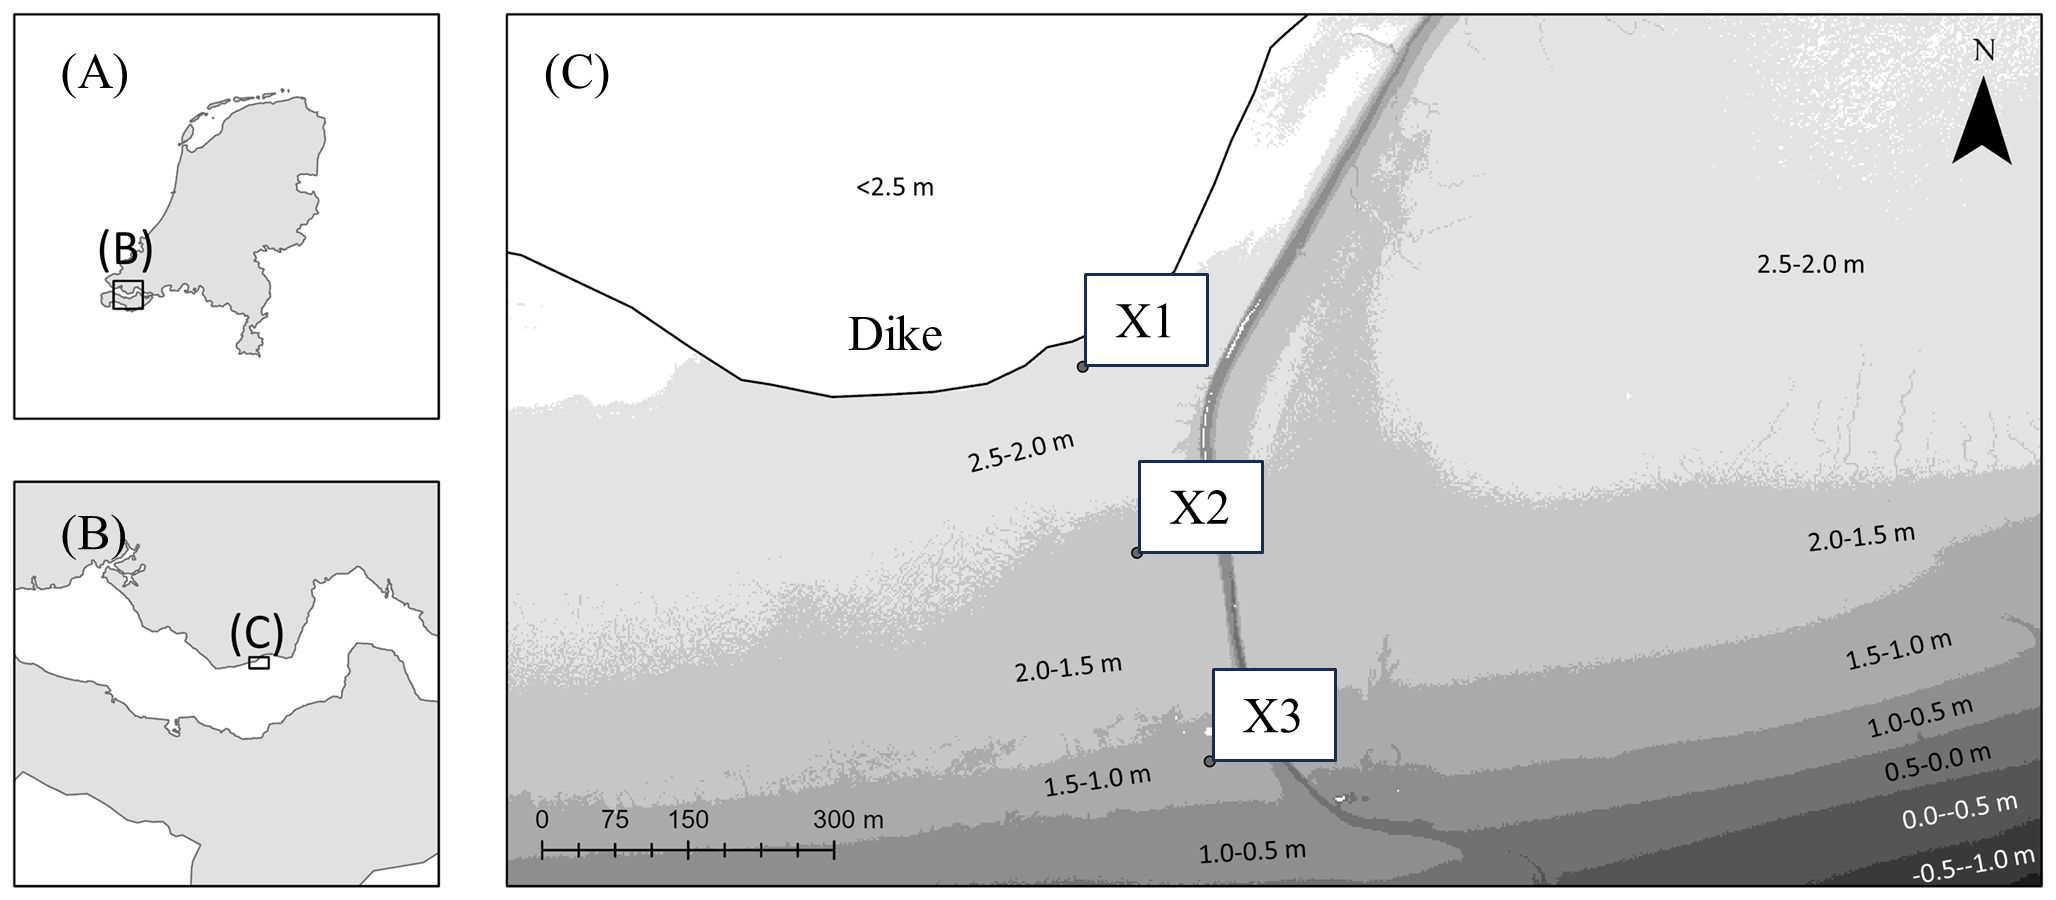
Figure 1 (A, B) shows index indicators of the location of the Western Scheldt within the administrative boundaries of the Netherlands and the field location respectively. (C) shows the field site with locations X1, X2 and X3. The background maps visualize the elevation in 2022, which is based on freely available LiDAR data of Actueel Hoogtebestand Nederland. The elevation of X1, X2 and X3 are 2.20 m, 1.95 m and 1.27 m respectively. These points lie 29 m, 227 m and 452 m from the dike. We utilized publicly accessible time series data on water levels from the nearest tidal station at Terneuzen to compute average dryfall time per day, spanning from 1st of januari 2022 to the 31st of December 2022, which were gathered by Rijkswaterstaat. This data can be accessed at https://waterinfo.rws.nl/. Locations X1, X2 and X3 were exposed to the atmosphere for 22:06h, 20:48h and 17:24h respectively.
During the first campaign in 2022, we measured the shear strength at 3 different locations on a transect between the dike and the tidal channel in the Western Scheldt to capture the spatial variability of the tidal flat, see Figure 1. To account for the impact of the air exposure time, we measured the sediment properties at different time steps between high water (HW) and low water (LW). The shear strength of the top layer was measured four times per location, and time step for statistical accuracy. At each time step and location, we took two bed samples to measure the water content and D50 in the lab. The top 1 cm of the bed (defined as top in 2022) was sampled and the 2 cm below (defined as bottom in 2022) was sampled with a syringe. The D50 was determined by the average of three measurements per sample with a Malvern Mastersizer 2000 laser diffraction instrument. This machine has a measurement range of 0.02–2000µm. A sample-to-sample variability of just 0.3% ensures consistent measurement reproducibility, allowing for a reliable verification of the dispersion units’ performance. All bed samples were duplicated for statistical accuracy. Finally, we sampled 20 litre bed material for erosion tests in the lab, see Section 2.2.2.
The second campaign had three aims: 1) to repeat the in-situ strength tests with the Global Gilson HM-504A Torvane Pocket Shear Vane, 2) to collect samples to measure water content and D50 of the sediment, and 3) to sample material for Gust tests directly in the field. The first two aims enabled us to evaluate the representation of the results of 2022. Samples were taken between HW and LW. For the in-situ strength and water content tests, we increased the temporal resolution at Location X1 compared to the first campaign to investigate the rate of changes in more detail. We took water content samples and 8 in-situ yield strength measurements every 30 min after HW. For the water content and D50, we scraped the top 5 mm with a scraper of the bed (defined as top in 2023) and we sampled the top 2 cm of the bed with a syringe (defined as bottom in 2023). All bed samples were duplicated to compute statistical variation. The D50 was determined by a Malvern Mastersizer 3000 laser diffraction instrument based on the average of seven measurements per sample. This is an updated machine compared with the device used in 2022. The Mastersizer 3000 system exhibits a wider measurement range (0.01 - 3500 µm) in comparison to the Mastersizer 2000. Additionally, there is an enhanced measurement resolution of less than 1µm for both wet and dry measurements. The change in resolution and range will not change measures of D50 because the particles sizes did not exceed the maximum of the range. Furthermore, we measured the in-situ strength and sampled the bed material at locations X2 and X3 at three different time steps for sufficient spatial coverage. The procedure for sediment sampling and strength tests were equal to location X1. Regarding the third aim, directly after HW, undisturbed samples were taken at location X1 that fit the geometry of an erosion device (Gust chamber) that was used to measure erosion rate as a function of bed shear stress.
2.2 Lab work
Besides field measurements, erodibility, and rheological parameters as a function of drying time were assessed in the laboratory. Rheological parameters such as accurately registered static yield stress (SYS) served as a bridging parameter between crude field measurements and data acquired in the controlled lab environment. Three series of Gust experiments and rheological measurements were conducted which differed slightly in approach and aim. The first set of experiments focused on finding the relationship between Bingham yield stress, water content and erodibility of dredged material of the Caland Channel of the Port of Rotterdam. The second set of experiments assessed the effect of layer thickness on this relationship for a clay mixture and sediment from the tidal flats of Zuidgors. The third set of experiments was conducted to quantify the effect of drying time on erodibility.
2.2.1 The relationship between yield stress, water content and erodibility of dredged material
Erodibility is assessed with a Gust chamber, as illustrated in Figure 2. The Gust chamber comprises a motorized disc and a cylindrical structure with an internal diameter of 9.2 cm, housing a sediment bed sample covered by 10 cm of water. The motorized disc imparts rotational motion, inducing bed shear stress on the sediment bed by displacing the water. The calibrated range for bed shear stress for reliable measurements spans from 0.01 Pa to 0.65 Pa (De Lucas Pardo et al., 2013).
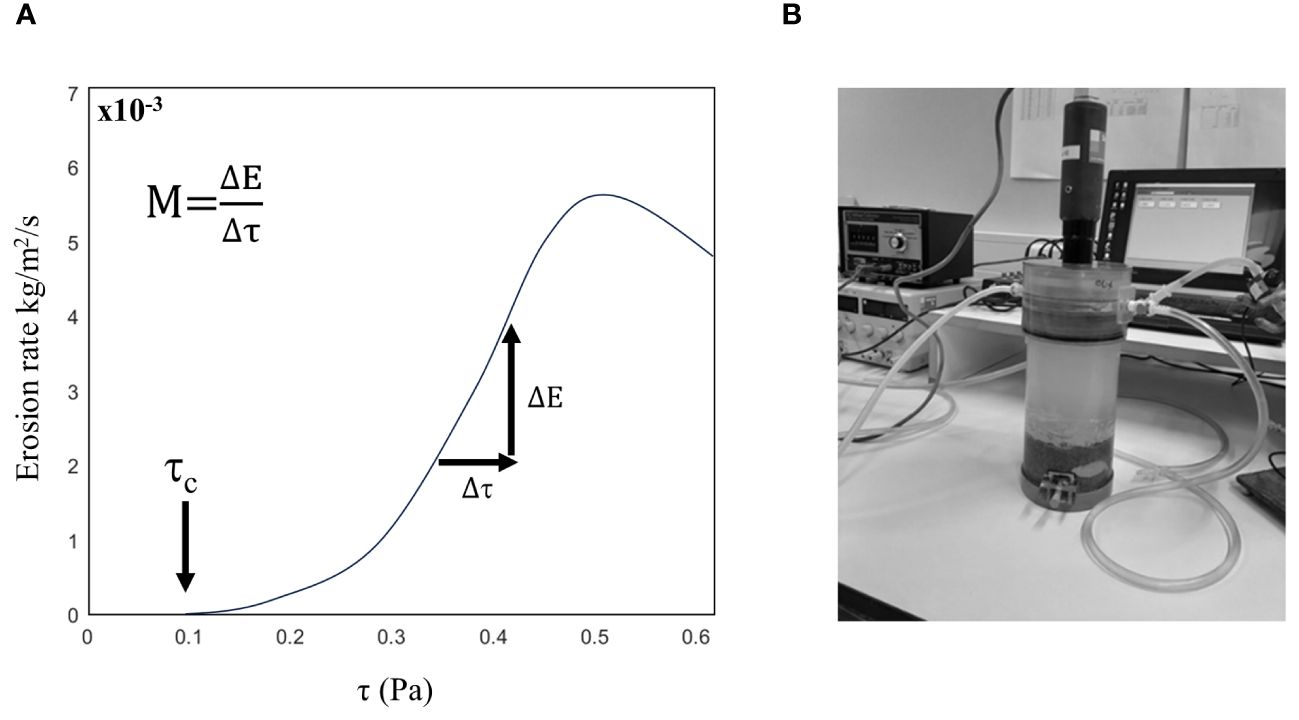
Figure 2 (A) Schematic representation of erosion rate (E) as function of bed shear stress (τ). The critical bed shear stress for erosion is indicated by τc. The erosion parameter (M) is the slope of this relationship. (B) Gust lab setup.
If the rotational disc solely propelled the flow within the cylinder, the maximum bottom shear stress would be localized at the cylinder’s periphery, with minimal shear stress at the central region. To achieve a uniform distribution of bed shear stress, a pump is affixed to the centre of the disc, actively transferring water from the outer to the inner regions of the cylinder. This process ensures a homogeneous bed shear stress distribution (Gust, 1990). The effluent water traverses three Oslims (optical sensors) that record sediment concentration through an electric signal. The range an accuracy can is made user specific by calibrating between measured voltage and sediment concentration.
The first series of experiments consisted of 7 tests on dredged material from the Caland Channel of the Port of Rotterdam. This material has been used to create insight into the consolidation behaviour of dredged material under evaporation. This understanding is needed to effectively restore salt marshes composed of dredged material, which is practise that has become more common recently (Baptist et al., 2019; Suedel et al., 2022). These 7 experiments were selected to test a range of dry matter contents for yield stress and critical bottom shear stress for erosion. These tests varied in the duration of three phases:
Phase 1) Settling of sediment after filling of the Gust chamber.
Phase 2) Consolidation and dewatering in the Gust chamber, where the supernatant is removed.
Phase 3) Rewetting in the Gust chamber.
For phase 1, a reference mixture was prepared first for each test. This mixture is a suspension of 140 g of dredged material diluted with 1000 ml of brackish water with a density of 1.007 g/cm3. The brackish water with a density of 1.007 g/cm3 (salinity of 11.6 ppt) was also used for rewetting. The sediment had a D50 of 11 µm, a D90 of 83 µm, and contains a volume fraction of 15% > 63 µm. For dilution, this sediment had a bulk density of 1.253 g/cm3, a water content of 66.6%, and a dry matter content of 33.4%. The diluted sediment mixture with which the Gust chamber is filled had a dry matter concentration of 42.3 g/L.
The Gust chamber contains a sealable drainage point at the bottom of the column. This drainage point is covered with a permeable sand layer with a particle size of 425–500 µm. The diluted sediment mixture is then carefully introduced into the Gust chamber without disturbing the sand layer. After the settling phase (phase 1), a sediment layer with an average thickness of 4.04 cm +/- 0.26 cm standard deviation is formed. After consolidation and dewatering (phase 2), the sediment layer is reduced to an average of 2.24 cm +/- 0.16 cm standard deviation. On average, the sediment layer is therefore at 11.26 cm from the rotating disk +/- 0.16 cm standard deviation.
The three different phases of settling, consolidation, and drying influence the rheological properties (i.e. BYS = Bingham Yield Stress and SYS = Static Yield Stress of the sediment). The stronger the bed, the less erodible the layer becomes. We measured SYS and BYS in the HAAKE MARS I rheometer by using a ramp-up controlled shear stress (CSS) and a ramp-down controlled shear rate (CSR), respectively. A FL22 Vane geometry was employed for these measurements. SYS was determined by taking the average shear stress value between 0.1 and 0.2 rad s−1. BYS is the slope of a linear regression of shear stress as a function of shear rate. This linear regression was performed between a shear rate of 20 and 60 rad s−1, as the curve for all measurements exhibited a linear profile in this range. For higher shear rates, a vane is less suitable due to the generation of turbulence between the blades.
2.2.2 The influence of layer thickness on the relationship between drying time and erodibility
The second set of Gust experiments was conducted using sediment from the tidal flats of Zuidgors and a kaolinite-based artificial clay mixture. For the kaolinite experiments, the subsoil grain sizes remained constant, always fine sand with a D50 of 150 µm (similar to fine sand found on tidal flats). In these experiments we varied both the duration of phase 2 (waiting time) and layer thickness. Similar to the first set of experiment the columns were prepared in duplicate, one for the Gust chamber test and another for taking subsamples to determine yield stress and water content. For natural mud from Zuidgors, the testing matrix was based on the same principles with some modifications. To maximize the drying effect, the exposure time for the 1 cm thick mud deposit was extended to 48 hours.
It is worth noting that in this second set of experiment, the default median grain size (150 µm) that we used as the drainage layer differed from that in the first set of experiments (425–500 µm). It is substantially smaller, resulting in less drainage. This adjustment aims to better represent field conditions. Consequently, besides drainage within the mud layer on top, drainage within the thicker sand layer below may become a limiting factor. As a result, larger exposure times may be necessary to achieve significant drying.
2.2.3 Undisturbed core from the field and towards an empirical model
The third set of experiments also used sediment from the tidal flats of Zuidgors, which were subjected to Gust experiments and rheological protocols. For the Gust experiment, the same set-up was used as for the second set of experiments. The sediment that was utilized for the preparation of beds was characterized by D50 values ranging between 17–29 μm, mud content values ranging between 69–85%, and an initial water content of 60%. In these series of tests, the beds were placed directly instead of being the result of a settling phase. So, phase 1 was skipped. This sediment mixture was deposited in the cylinders, establishing a surface layer 10 cm from the rotating disk. After a consolidation period of 1 hour, the surfaced supernatant water was removed to initiate the drying process, phase 2. This was done to make sure that the waiting time equalled the duration of dry fall. In total, six Gust experiments were conducted, comprising one undisturbed core extracted from the field at location X1 and five deposited beds with varying consolidation times and drying durations. In the lab the supernatant water was removed, and sediment bed was subjected to drying.
An empirical model was generated based on these experiments to find the relationship between the erosion parameter and drying time. All post processing was done in Matlab R2020a. Statistical analysis was performed in R using the lm function of the stats (version 3.6.2) package. The residuals were analysed using Q-Q plots and an Anderson-Darling test from the nortest (version 1.0–4) package. Residuals were plotted against fitted values and independent variables to elaborate on the goodness of the fit.
The erosion results were also compared with measurement of the strength of the sediment. The shear strength is measured in the lab with a HAAKE Viscometer iQ by thermo scientific. The rheological protocol consisted of controlled shear stress ramp-up of 0–8000 Pa in 600 s with a FL100 geometry. The FL100 was placed into the bed until the vane was submerged completely. The SYS was taken at a shear rate of 0.5 rad s−1. The protocol was performed two times on two undisturbed surfaces of the sediment bed to capture both variation and an average SYS. The surface of the core allowed for 4 rheological tests. Therefore, the SYS could only be measured on two moments in time.
Also, for the deposited beds the SYS was measured following the same protocol as described in the first series of experiments. However, because the material appeared to be less cohesive, a larger geometry was used for the rheological protocol to effectively register incremental changes in shear rate as a function of shear stress. We used a FL1000 geometry and increased the bed shear stress from 0 to 400 Pa in 300 s.
2.3 Numerical modelling
To put the lab and field results into context and translate these into recommended settings for erodibility in numerical models, the existing two-layer (2L) buffer model introduced by Van Kessel et al. (2011) was adapted to include the effect of consolidation and drying of on erodibility. Following the approach proposed by Jacobs et al. (2011), we made a distinction between undrained erosion of fresh, underconsolidated deposits and the drained erosion of mature, overconsolidated deposits. The transition between both states is determined by the critical state line (CSL). Pore pressure is used as a proxy for this transition, with positive excess pore pressure representing underconsolidation and negative excess pore pressure (i.e. suction) overconsolidation. See Figure 3 for a conceptual illustration of the model approach.
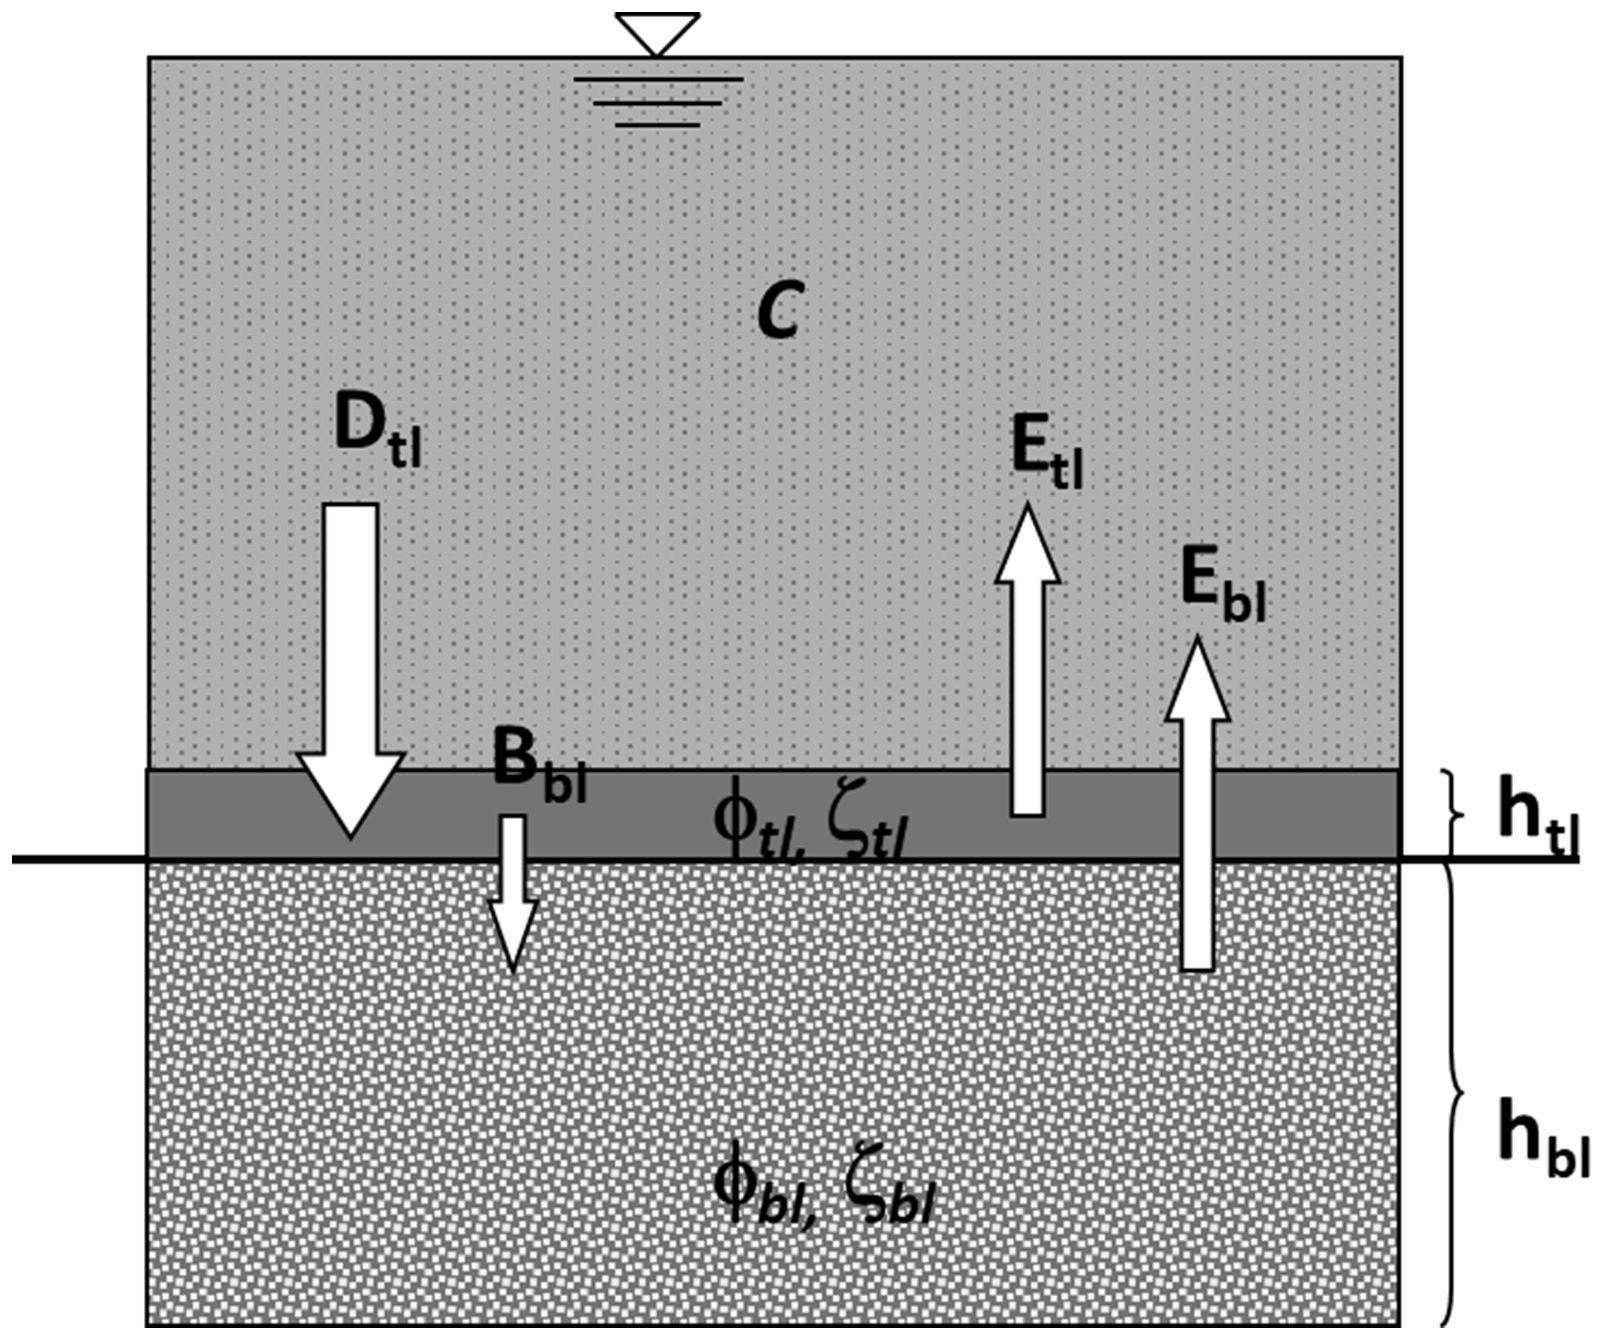
Figure 3 Conceptual picture of model approach with erosion (E), deposition (D) and burial (B) fluxes and top layer (tl) and base layer (bl) properties such as porosity ϕ, material height ζ, layer thickness h, suspended sediment concentration C and (not shown) erosion parameters τc and M.
2.3.1 Consolidation
The model doesn’t solve the full consolidation equations but does include a simple form of pore water outflow and densification. It is a simplification of Merckelbach and Kranenburg (2004) assuming vertically averaged properties in two layers, i.e. a top (fluff) layer and a base (buffer) layer. Compared to the existing 2L buffer model, erosion properties (i.e. τc and M) are not constant per layer, but depend on porosity, which may vary in time because of pore water flow induced by excess pore water pressure gradients dpe/dz (driven by either gravity or evaporation). Pore water flow is computed according to Darcy is expressed in Equation 2.
in which vw ϕw is the volume flux of water (m/s), k is permeability (m/s), ρw is water density (kg/m3) and pe is excess pore water pressure (Pa) defined as pe = pw – phyd; pw = ptot – peff (with subscripts e, w, hyd, tot and eff referring to the excess, water, hydrostatic and total pressure, respectively). The relationship between porosity and permeability is determined according to: k = kk ϕs−nf. The relationship between effective stress and porosity is determined according to: peff = ks ϕsnf. Herein ϕs is the volume fraction of solids (-) related to porosity e according to ϕs = e/(1+e), nf = 2/(3-D) with D the fractal dimension of the mud (-) and kk (m/s) and ks (Pa) are constitutive parameters for permeability and effective stress. Both constitutive relations are discussed in Merckelbach and Kranenburg (2004).
ptot is derived from thickness h1, h2 and bulk density ρ1, ρ2 in layers 1 and 2: ptot1 = h1 ρ1 g; ptot2 = ptot1 + h2 ρ2 g.
As more water flows out, bulk density (hence ϕs) increases, effective stress increases and pe decreases until equilibrium is reached. The final equilibrium height after self-weight consolidation of layers 1 and 2 combined is h = [ks nf/(nf-1)(ρs-ρw)g] [g ζ (ρs-ρw)g/ks]^[(nf-1)/nf], with ζ = material height (m), see Merckelbach and Kranenburg (2004).
2.3.2 Drying
Drying only occurs if the mud layer is exposed, i.e. if the water level is below the bed level. Evaporation applies to the top layer only, but resulting suction may enhance consolidation of the base layer because of a stronger excess pore pressure gradient dpe/dz.
A maximum evaporation flux Fmax (m/s) is specified (which depends on temperature, relative humidity, wind speed), which is reduced with reducing water content of the top layer of the exposed bed according to F = Fmax (ϕmax – ϕs)/(ϕmax – ϕgel).
With ϕmax the maximum volume fraction of solids (-), determined by the maximum packing of solids in dry soils. At ϕs = ϕgel F = Fmax, whereas at ϕs = ϕmax, F = 0.
2.3.3 Erosion
The erosion flux is computed according to E = M (τ/τc – 1). A distinction is made between undrained and drained erosion. Below the critical state line (ϕgel< ϕs< ϕcs) undrained erosion occurs as bed deformation incurs a positive pore pressure. Above the critical state line (ϕcs< ϕs< ϕmax) drained erosion occurs as bed deformation incurs a negative pore pressure. For both erosion regimes values for M(u,d) and τc(u,d) are computed differently. The value for ϕcs is estimated from the Liquid Limit (LL) of the sediment.
2.3.3.1 Drained erosion:
The critical shear stress for (drained) erosion above the critical state line τc,d (Pa) is an input parameter and may be computed from the Plasticity Index (PI) according to Jacobs et al., 2011: τc,d = 0.161 PI0.80, in which PI = LL – PL.
The (drained) erosion rate is computed according to: Md = cv ϕs τc,d/(10 D50f τy) (kg/m2/s) with D50f the median diameter of the mud flocs in the bed and τy the undrained yield stress that can be estimated from the effective stress function, see Jacobs et al. (2011). Herein consolidation coefficient cv (m2/s) is defined:
In the drained regime τc,d is a constant independent of ϕs, whereas Md varies strongly with permeability (hence ϕs).
2.3.3.2 Undrained erosion:
In the undrained regime, the undrained erosion parameter Mu varies with ϕs between Mu,gel at ϕgel and Md at ϕcs: Mu = Mu,gel + (Md – Mu,gel) [(ϕs – ϕgel)/(ϕcs – ϕgel)]nf.
The critical shear stress for (undrained) erosion τc,u varies with ϕs between τc,gel at ϕgel and τc,d at ϕcs: τc,u = τc,gel + (τc,d – τc,gel) [(ϕs – ϕgel)/(ϕcs – ϕgel)]nf.
2.3.4 Deposition
The volume fraction of solids immediately after deposition is defined as ϕgel. Deposition is only possible if the deposition flux exceeds the erosion flux for fresh deposits, otherwise these fresh deposits will be immediately re-eroded given Equation 3.
With ws settling velocity (m/s) and C suspended sediment concentration (kg/m3) Erosion is only possible if the erosion flux from the bed with properties (M, τc) exceeds the deposition flux given Equation 4.
If the product ws C is between these values, there is no net erosion or deposition. Note that if the bed consists of fresh deposits (i.e. with properties Mu and τc,gel) this transition zone doesn’t exists, but if the bed consists of well-consolidated mud this transition zone without net water-bed exchange is very wide.
2.3.5 Transfer between top and base layer
All sediment deposits towards the top layer, whereas erosion may occur both from the top layer and the base layer (if the top layer is completely eroded). The question is how mass transfer from the top to base layer should be arranged. If the top layer contains a large mass, fresh deposits (which become completely mixed through the top layer because of the assumption of uniformity) will hardly change the properties of this layer. So, a thick top layer dampens the temporal dynamics of properties, which would violate the model assumption that the top layer is thin and responds fast to changes in hydrodynamic forcing. Also, if the base layer may erode but never receives any new deposits it can only become thinner and not thicker. For both reasons some form of mass transfer from top to base layer is essential. An extreme case of mass transfer would be a fixed material height for the top layer. Any deposition then results into the instantaneous transfer of the same sediment mass to the base layer, and any erosion into the instantaneous transfer of mass from the base layer to the top layer. However, this approach is not adopted, as it results in excessive mixing of properties between top and base layer during successive sedimentation-erosion cycles. Instead, the mass in the top layer may ‘breathe’ during these cycles and may become zero during erosion events. But any long-term net deposition is transferred to the base layer using a burial term according to Equation 5.
with B the burial rate, Δt time step, ζtl (t) the actual top layer material height and ζtl,eq the equilibrium top layer material height.
2.3.6 Synthesis
Instead of prescribing fixed erosion properties per layer (τc1,2, M1,2), the erosion properties as a function of ϕs are prescribed and ϕs is allowed to vary freely between ϕgel and ϕmax, with different functions below and beyond ϕcs. This makes the erosion properties variable in space (both horizontally and vertically in 2 layers) and time, depending on the local bed shear stress history. Sheltered areas will tend towards soft deposits, whereas exposed areas will tend towards strong deposits.
This approach has two main advantages over the classical approach with fixed layer properties:
1. It is less empirical and more physics-based, including the effects of consolidation and drying;
2. Lab and field tests are used to derive material parameters for τc and M as a function of ϕs instead of direct application of constant τc and M, which reduces the need for model calibration.
If used directly, in-situ erosion tests have limited value for model calibration, as within short distance (only few meters, depending on local bed topography) or short time (few hours) observed values for τc and M may vary strongly.
2.3.6.1 Material parameters
To summarize, the required material parameters are:
− Cgel = ρsϕgel = gel concentration (kg/m3) (= solids concentration of fresh deposit) e.g. 100
− Ccsl = ρsϕcsl = critical state concentration (kg/m3) e.g. 800 (e.g. estimated from the Liquid Limit)
− Cmax = ρsϕmax = solids concentration of dry bed (kg/m3) e.g. 1600
− τc,gel = critical shear stress for (undrained) erosion of fresh deposit (Pa) e.g. 0.1
− τc,d = critical shear stress for (drained) erosion beyond critical state line (Pa) e.g. 1.5 (estimated from the PI)
− Mu,gel = undrained erosion parameter at gel concentration (kg/m2/s) e.g. 10-3
− ks = effective stress parameter (Pa) e.g. 103
− kk = permeability parameter (m/s) e.g. 10-9
− nf = 2/(3-D) with D = fractal dimension (-) e.g. 2.5 (nf = 4)
These parameters can be determined from standard lab tests on liquid and plastic limits (LL and PL), column tests on settling and consolidation behaviour, and erosion tests on fresh mud deposits. Actual erosion parameters τc (x, t) and M (x, t) for both layers are computed from these material parameters as indicated above and will depend on the specific bed shear stress history and erosion and deposition history of each cell.
Additional model parameters are:
− Fmax = max. evaporation flux (kg/m2/s) e.g. 10-4
− B = burial rate from top to base layer (1/s) e.g. 10-7
− ζtl,eq = top layer equilibrium material height (m) e.g. 10-3
The maximum evaporation rate is an external forcing derived from weather data. The last two parameters are numerical parameters determining the thickness of the top layer and its rate of mass transfer to the base layer.
It has been verified that the new numerical model reproduces the results of the original model for constant layer properties and with parameter settings equal to that of the original model. The adapted model formulations have been verified by checking the model behaviour for a wide range of parameter settings and by comparison with field data.
3 Results
3.1 Field work
3.1.1 Water content
The average water content values of locations X1 and X3 were similar in the measurement campaigns of 2022 and 2023. In 2022, location X2 had a significant lower water content compared to the other locations. This was also observed in 2023, see Figure 4. Also, the D50 of location X2 was higher compared to locations X1 and X3. The clay particles capture water whereas sand fosters drainage conditions for the surface water because of the difference in porosity. Therefore, the water content increases with the mud content, and the heterogeneity of the bed material is one of the factors that influences the spatial variability of the water content.
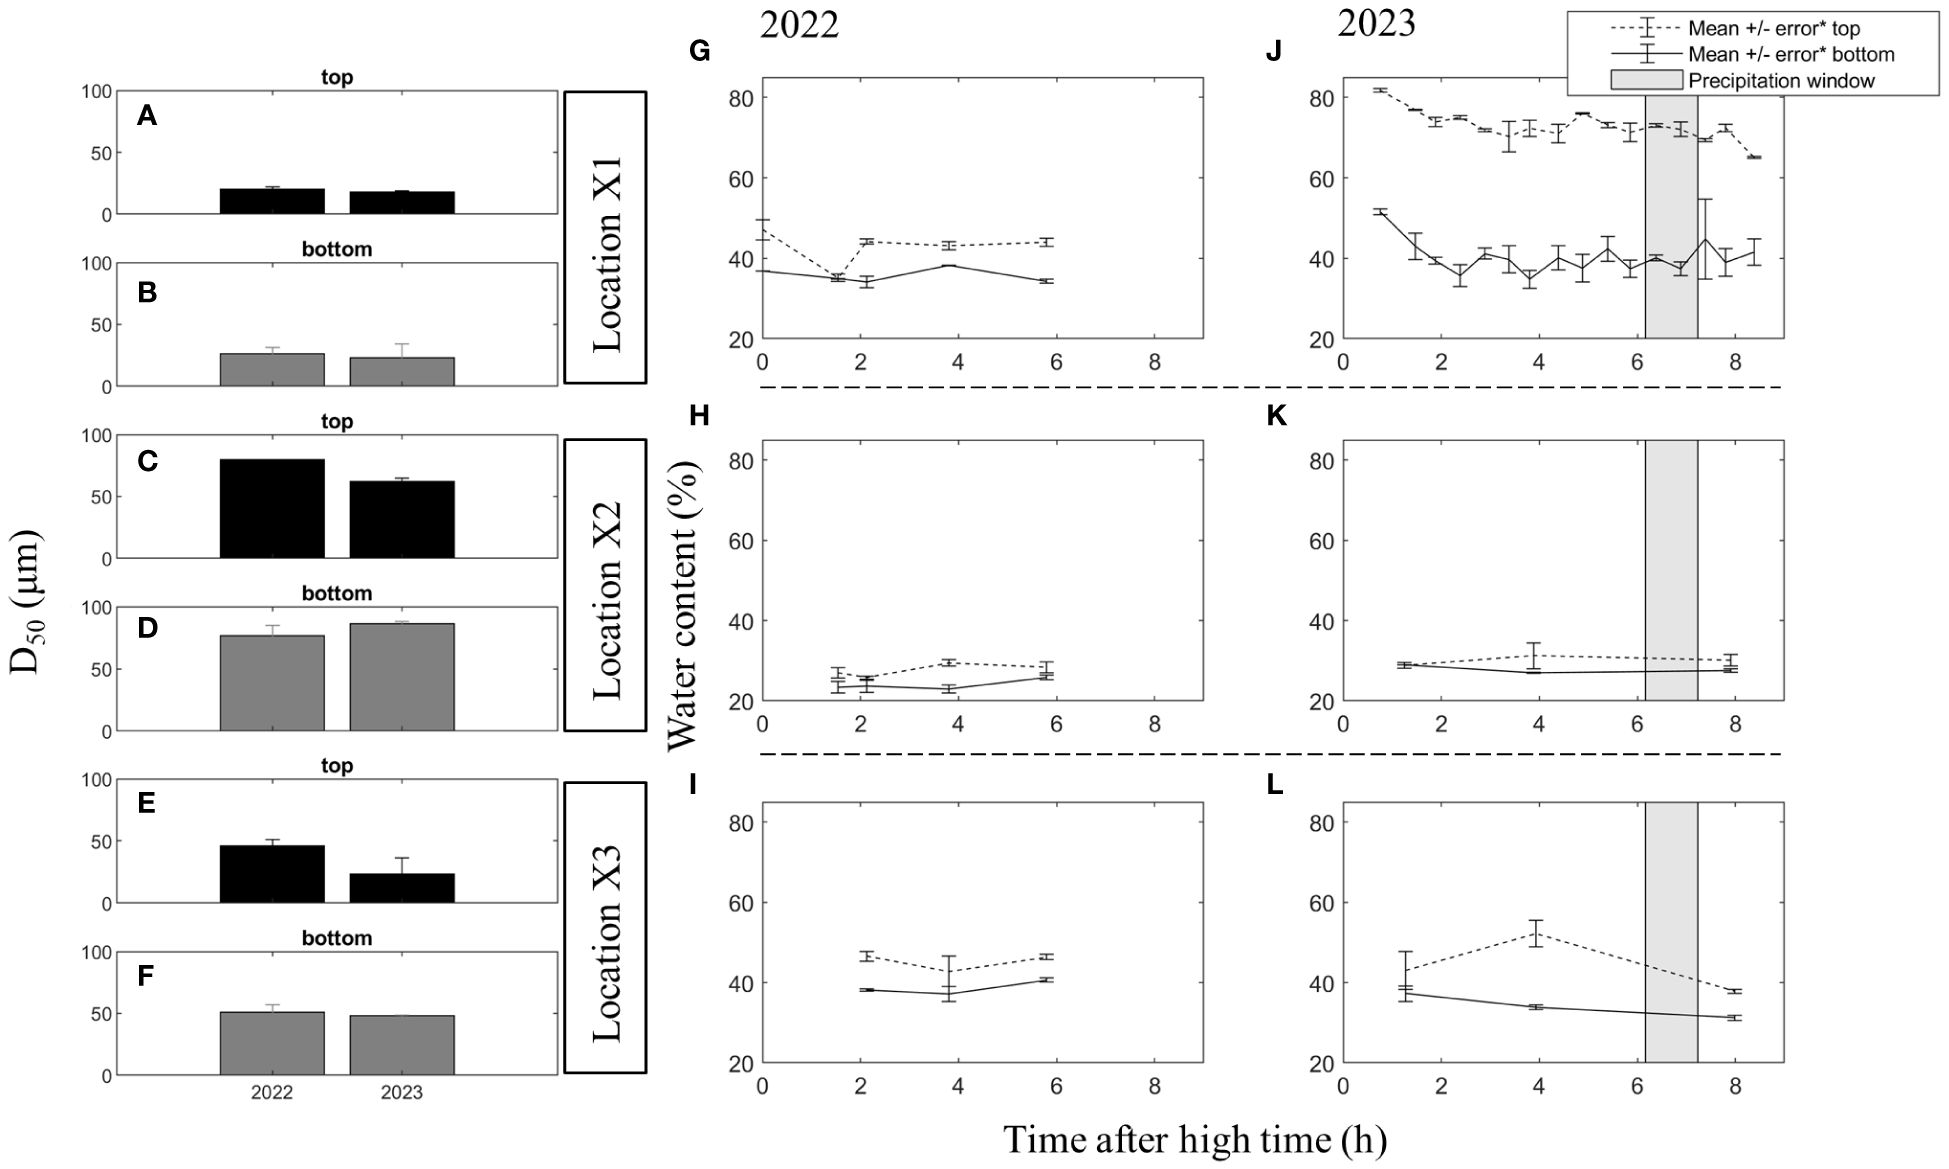
Figure 4 (A-F) illustrate the average D50 values, derived from two samples per location (X1-X3) for the years 2022 and 2023. The error bars represent the absolute difference between the two samples. In (G-L), the relationship between time after high water and average water content in the sediment is displayed. Here, the error bars express the standard deviation. (G-I) depict this relationship for locations X1-X3 in 2022, while (J-L) showcase the same relationship for these locations in 2023. The black bar graphs represent measurements taken at the top of the sediment (top 1cm for 2022, top 0.5cm for 2023), while the grey visualizes quantifications of the bottom (1–2cm for 2022, top 2cm for 2023). In 2023 the duration of precipitation is expressed as a grey polygon. However, the amount of rainfall observed during this in period within the study area was insufficient to counteract the effect of evaporation during the day and, therefore, it has not been considered in this study.
Overall, the top 5 mm of the surface has a higher water content compared to the top 2 cm of the bed in 2023, see Figure 4. In the results of 2022, the difference between the top 1 cm of the bed and 2 cm below this top sample is less pronounced. Hence, the water content of the top 5 mm of the tidal flat differs from the material 5 – 20 mm below the surface.
The exposure time affects the water content and is most pronounced in the top layer of the bed. During the campaign of 2023, the water content decreases at locations X1 and X3. At location X2, where the water content is significantly smaller, it remains constant. At location X3 the water content increases for the second measurement. This is caused by the delayed dewatering of the upper part of the tidal flat due to bottom friction. The delayed excess water of the upper flat passes location X3 at a later stage in the tidal window compared to the water line which increases the water content temporally. This phenomenon is most pronounced in the top 5 mm of the bed material. The detailed measurements at location X1 show that the water content decreases faster directly after HW. The water content of the top 2 cm becomes constant 2.5 h after HW. During the first campaign the variability in measured water content at one time step was as large as the variability in between the time steps. The temporal resolution was too low, and it was not possible to derive conclusions based on the campaign of 2022.
3.1.2 In-situ shear strength
The in-situ shear strength increases with increasing exposure time during both campaigns at locations X1 – X3, see Figure 5. There are also pronounced differences between the two campaigns for locations X1 – X3. The strength of Location X1 is 2.5 kPa 2.5 h after HW and increases to 6.5 kPa in 2022. During the measurements in 2023, the strength increases from 0 to 1.5 kPa. For location X2 the initial strength 2 h after HW is lower in 2022 compared to 2023. However, in 2022 the material gains strength rapidly and the measured strength is comparable in 2022 and 2023. At Location X3, the measured strength is significantly larger in 2023 compared to 2022 (factor 8), although during both campaigns the strength increased after 4.5 h.
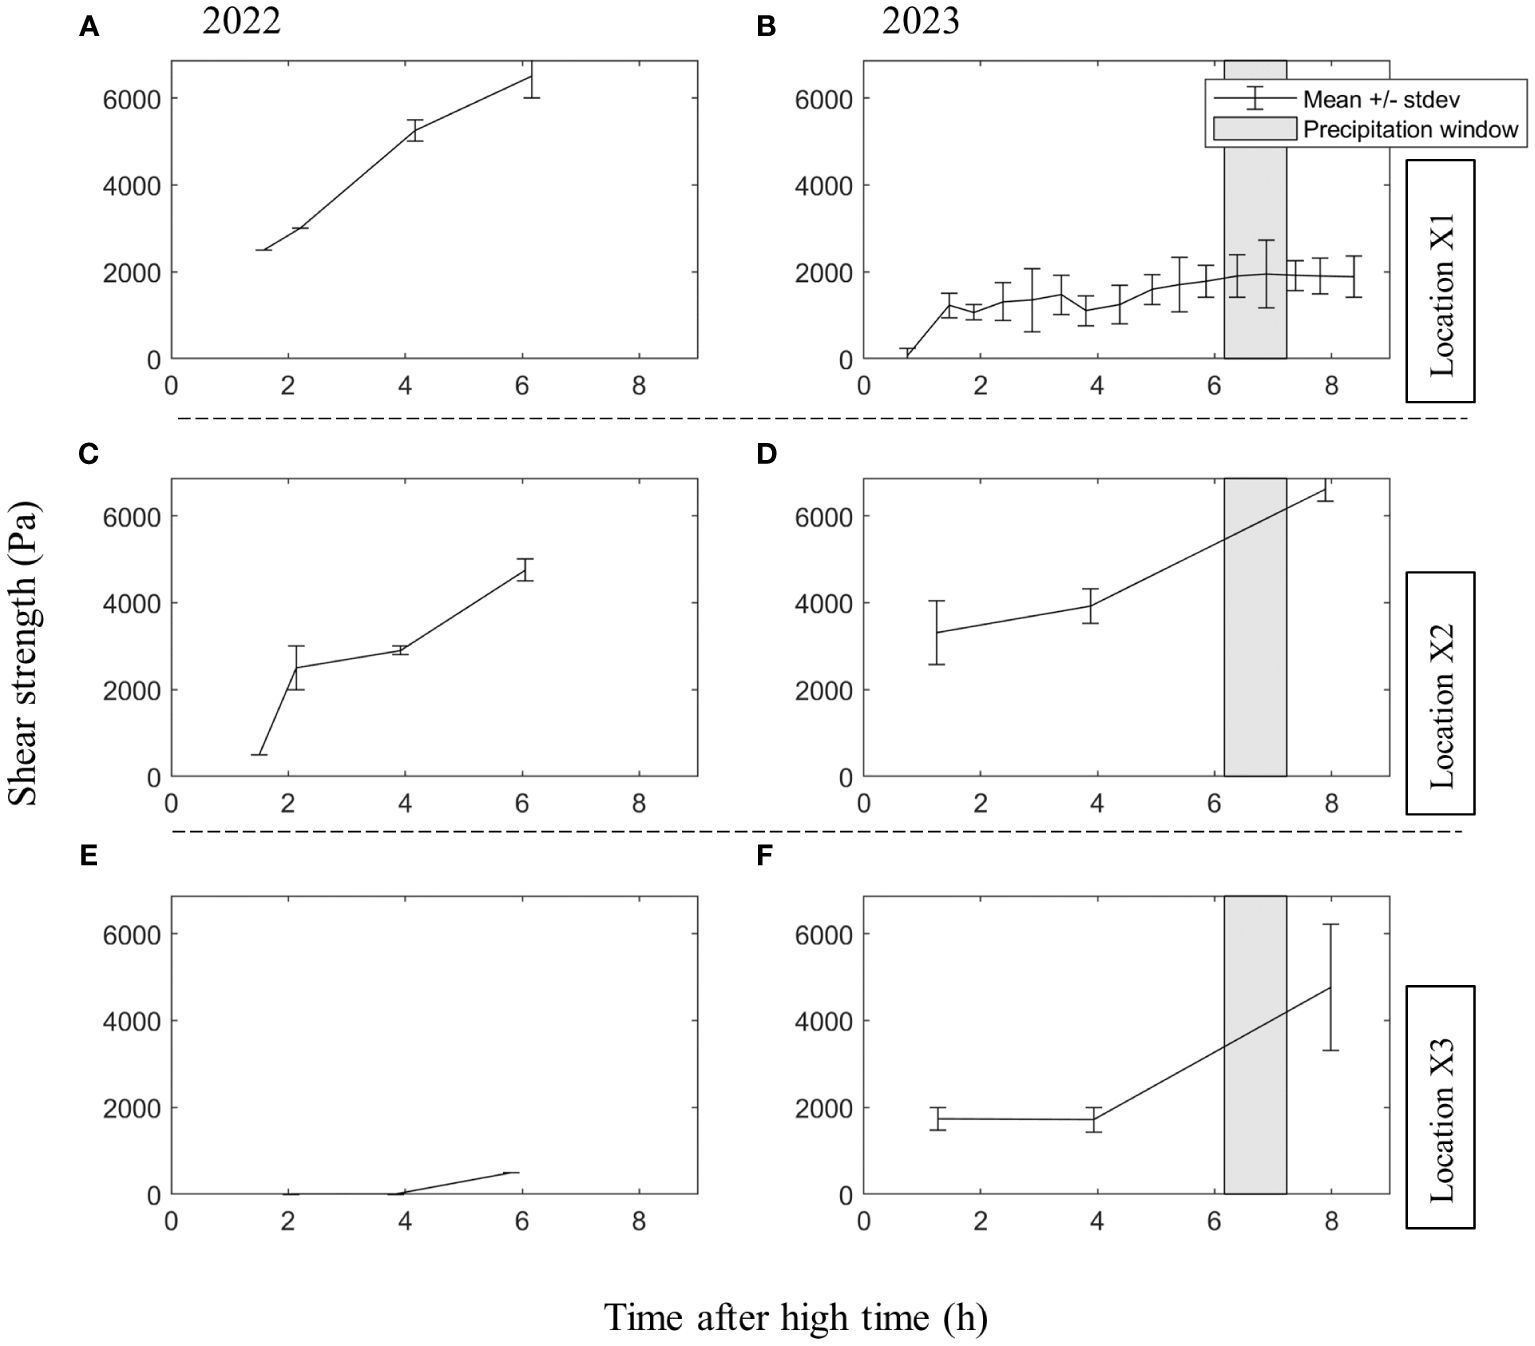
Figure 5 Averages +/- standard deviations of shear strength as a function of time after high water. The averages and standard deviations are computed based on 2 measurements in 2022, and 8 measurements in 2023. (A, C, E) show this relationship for the year 2022; (B, D, F) show this relationship for the year 2023. In 2023 the duration of precipitation is expressed as a grey polygon.
3.2 Lab work
3.2.1 The relationship between yield stress, water content and erodibility of dredged material
As portrayed by the field work results in the previous section, the water content of the sediment determines the resistance to shear stresses. To relate observations from the field to results obtained in a controlled lab environment, we also elaborate on the link between water content and rheological parameters derived in the lab. Yield strength is related to erodibility. In agreement with the trends observed on the tidal flats, there is a negative correlation between water content and SYS and BYS values, see panel a) of Figure 6. The decrease in water content is direct result of the sediments exposure to the atmosphere in the lab. These are linear relationships on the semi-log scale (R2 of 0.99 for both SYS and BYS). These results are based on dredged material from the port of Rotterdam. The dredged material that experienced longer drying time, developed higher BYS values, and require larger bed shear stresses to be eroded, see panel b) of Figure 6. In other words, the critical bed shear stress is a function of drying time.
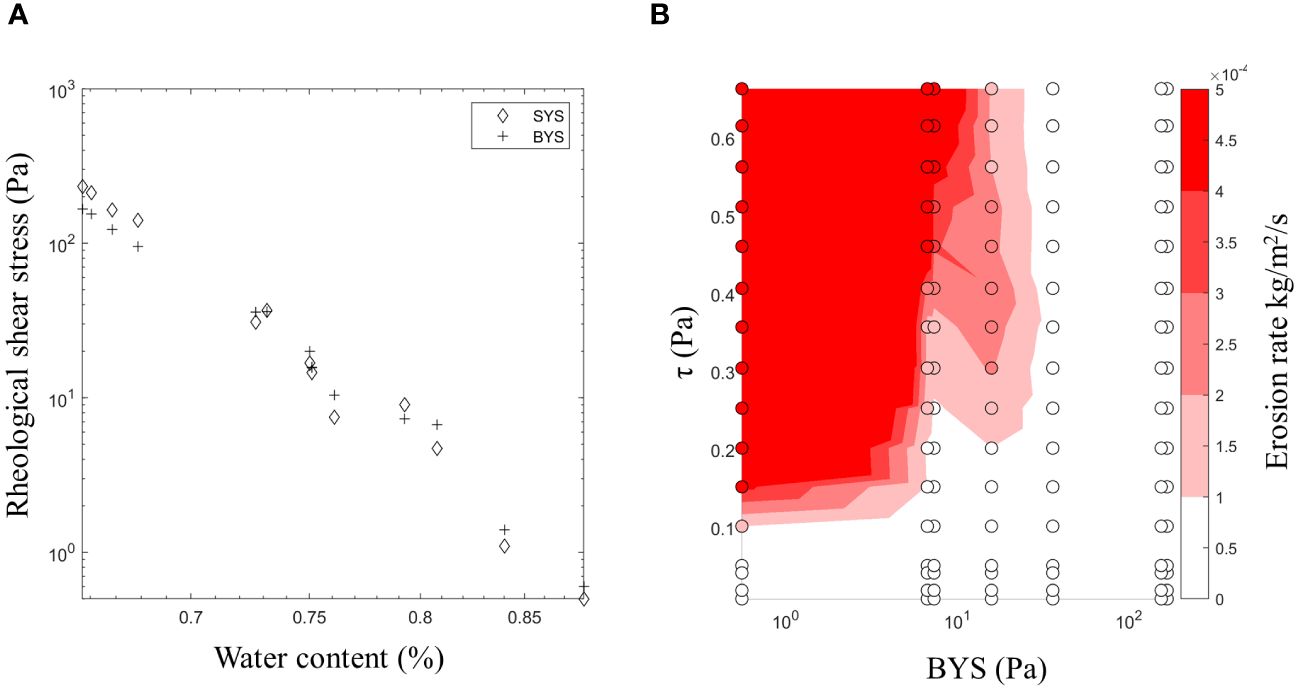
Figure 6 (A) shows the relation between water content (top 1 cm) and rheological shear stress on a semi-log scale; SYS and BYS for dredged material from the Caland Channel, Port of Rotterdam. (B) shows the relationship between BYS, bed shear stress and erosion rate of the same material expressed in (A). The BYS values of the round scatter points, as expressed on the x-axis, relate to the BYS values expressed as diamonds in (A). The colored surface is an interpolation between the scatter points.
3.2.2 The influence of layer thickness on the relationship between drying time and erodibility
Another key aspect that drives erodibility and strength of the sediment is the difference between waiting time and effective drying time, which can be a function of the layer thickness. If a water layer is still present on the mud (even a thin film), no suction pressure develops at the mud surface, which is the main driver for strength increase. This implies that the pore water flux induced by self-weight consolidation should be smaller than the evaporation flux, otherwise water evaporated at the surface will be completely replenished by pore water flow induced by consolidation. This is reflected in the comparison between different erosion rate-drying time relationships for varying layer thicknesses of kaolinite-based artificial clay mixtures, see panels a-c of Figure 7. Thicker layers of sediment require lower critical bed shear stress values for erosion when drying times are equal. Remarkable is that the Zuidgors sediment becomes completely unerodable after 48 hours of drying within the range of bed shear stresses that are operationally possible for the Gust probe, see panel d of Figure 7. Even with a larger-scale erosion chamber, which could exert a maximum bed shear stress of 1.2 Pa, no erosion of Zuidgors sediment dried for 48 hours occurred. This was before the sediment started to show signs of desiccation. This accentuates the significant effect drying can have on erodibility.
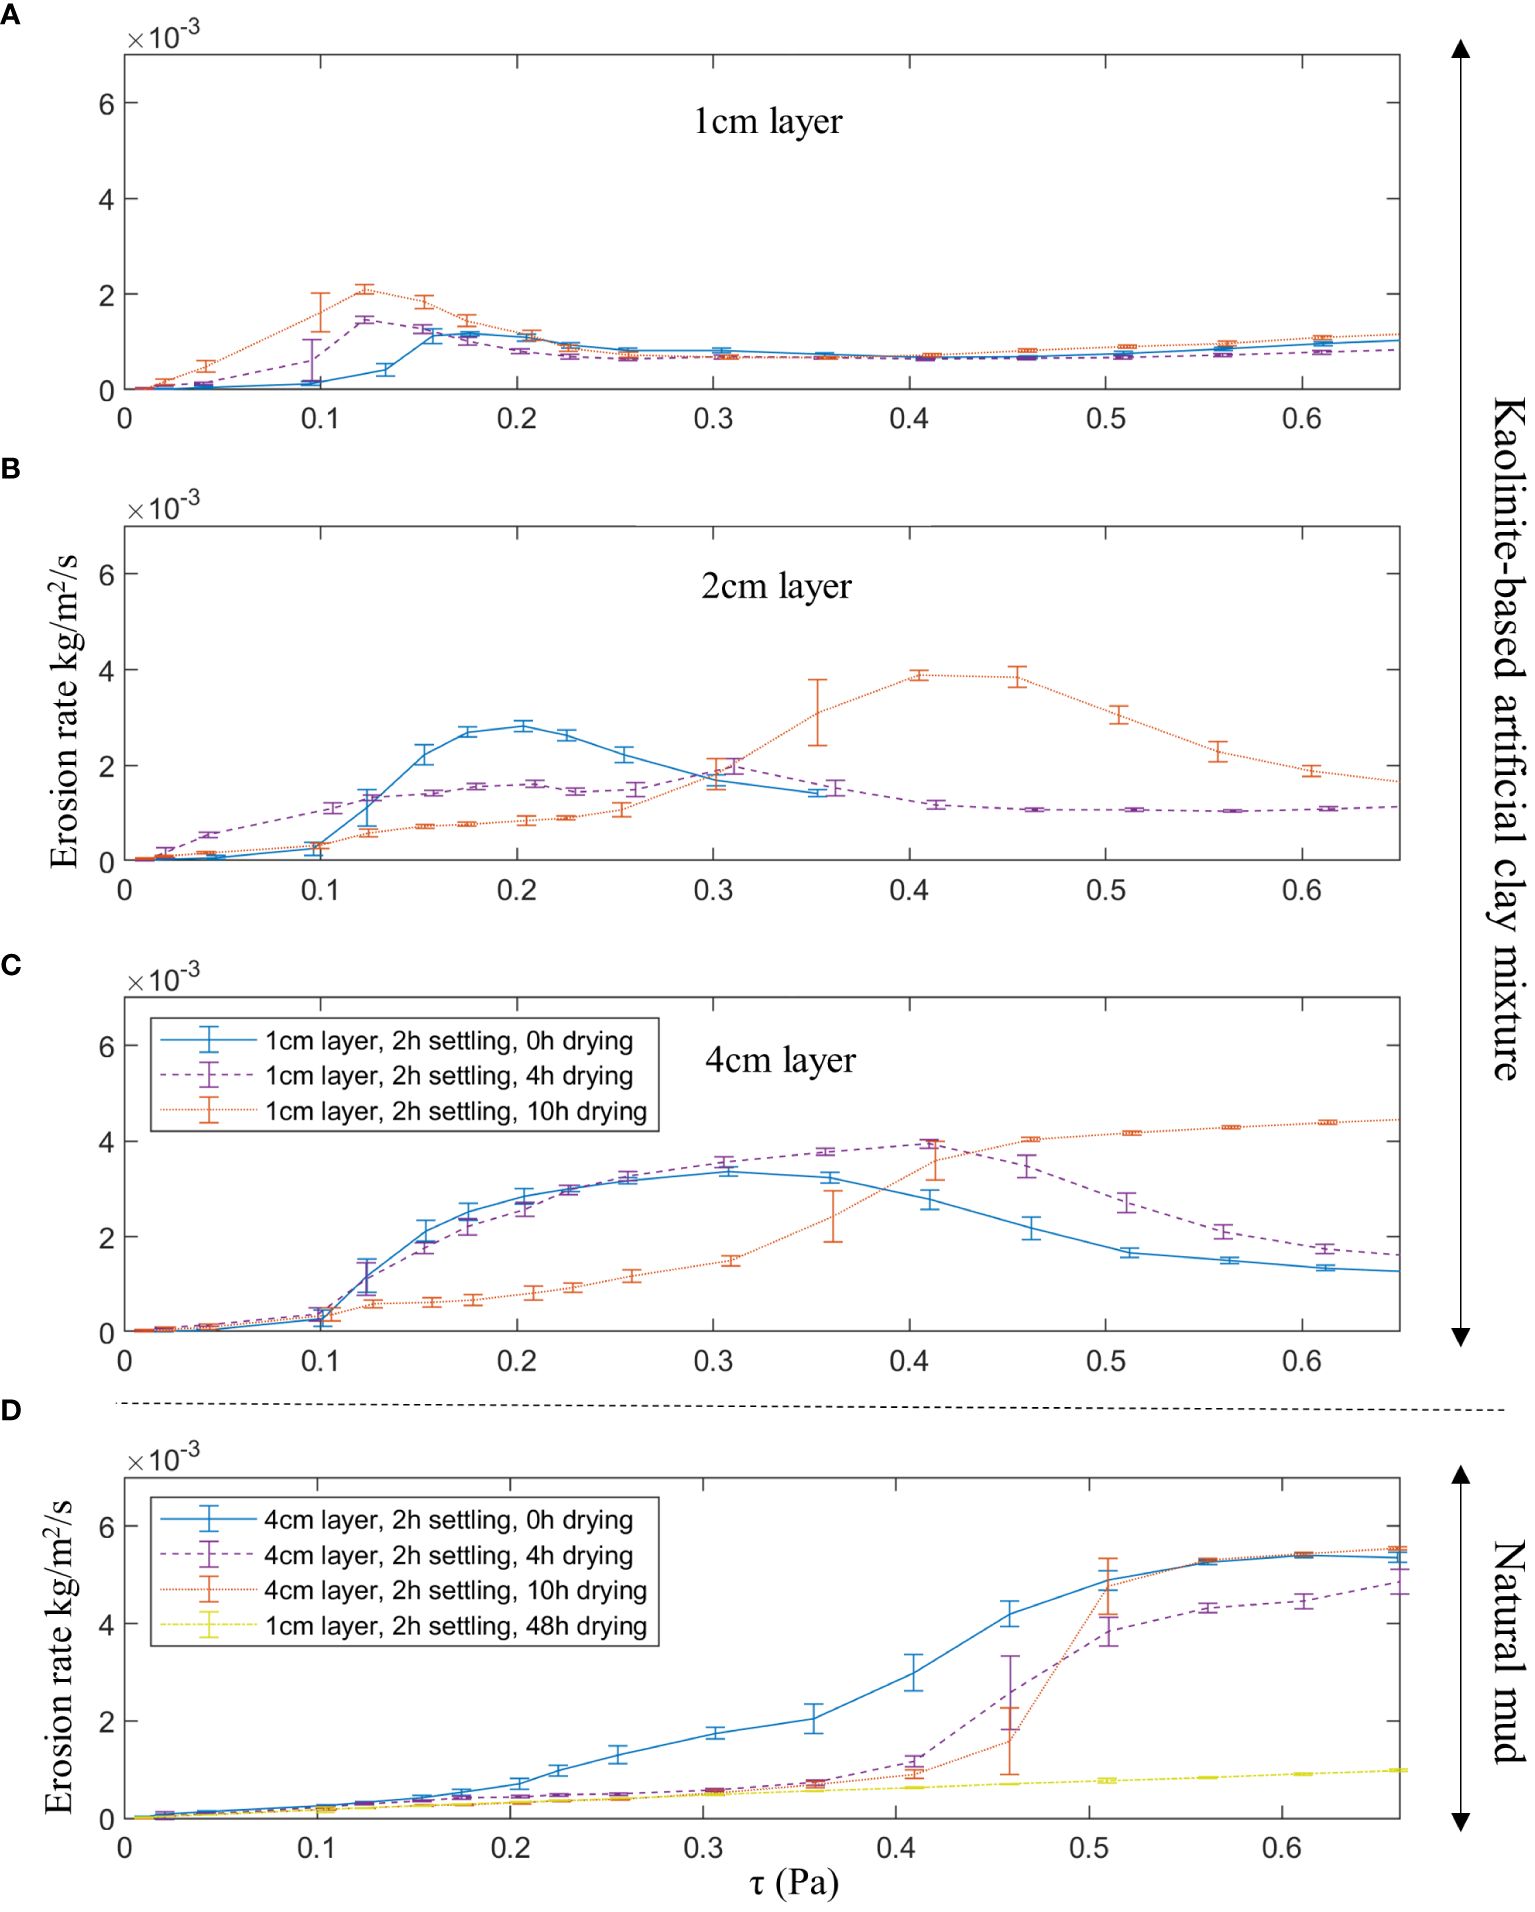
Figure 7 Relationship between bed shear stress (τ) and erosion rate mediated by drying time for kaolinite-based artificial clay mixtures which are depicted in (A-C). These panels show these relations for sediment layers with thicknesses of 1, 2 and 4 cm respectively. (D) shows this relationship for a three 4 cm thick layers and one 1 cm thick layer of natural mud from the tidal flats of Zuidgors.
3.2.3 Undisturbed core from the field and towards an empirical model
The later tests on deposited material from the tidal flats of Zuidgors were conducted in a controlled environment. To better compare field measurements with erosion measured in the lab, an undisturbed sediment core from the field at location X1 was placed into the Gust probe as well. This core did not experience any drying time; the sediment surface has been covered by a 2 cm layer of supernatant water since extraction from the field. As seen in Figure 8, no erosion occurred as a function of an incremental increase of the bed shear stress.
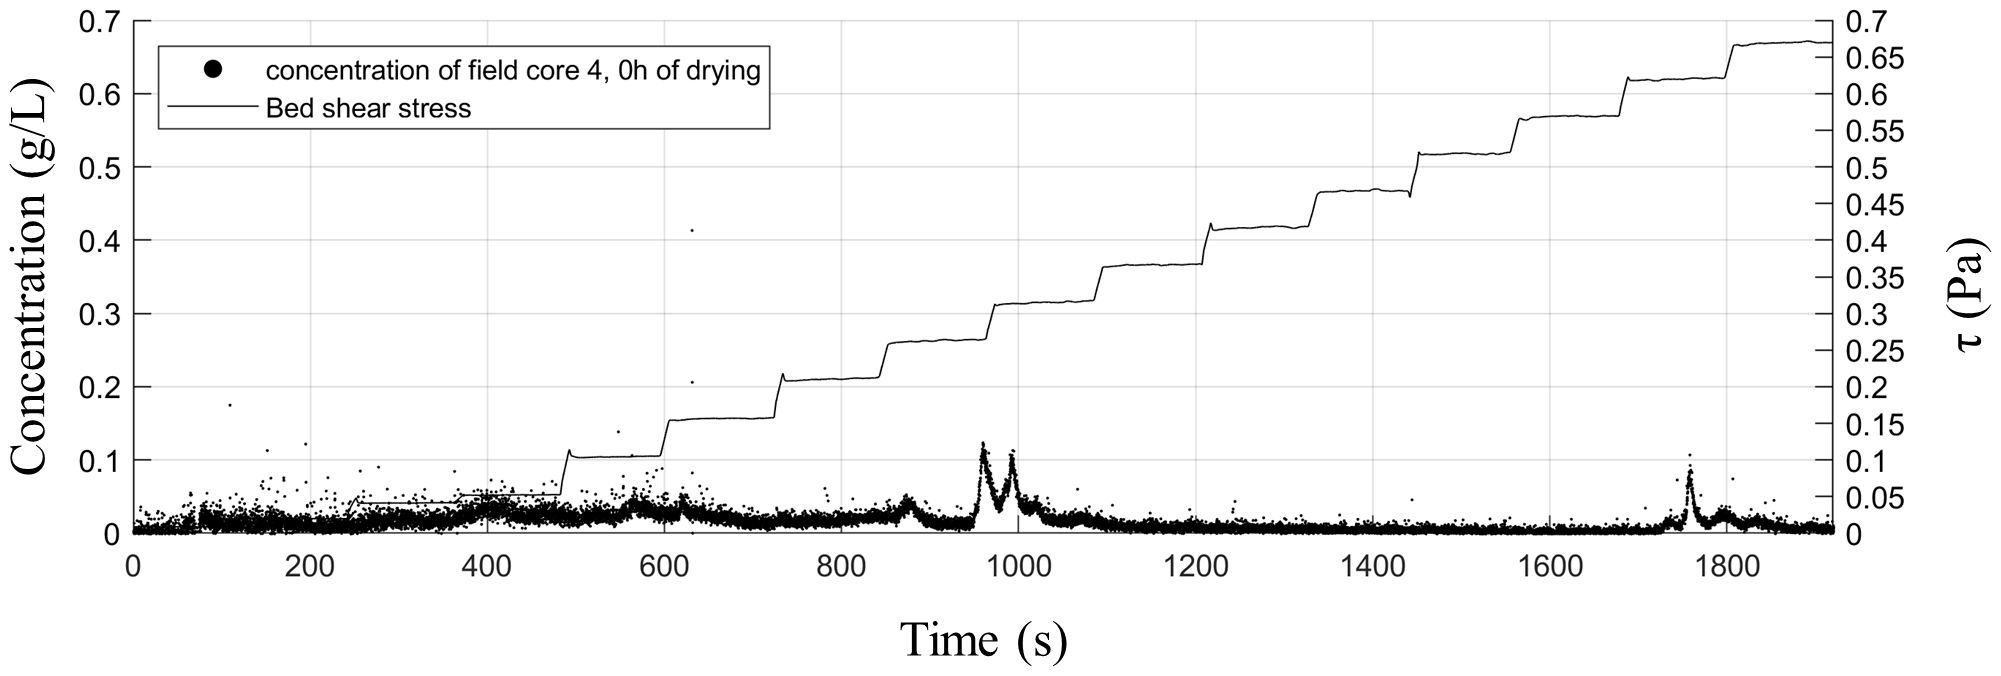
Figure 8 Concentration (dry sediment per liter) and bed shear stress versus elapsed time (s) of a core taken from location X1.
Apart from the onset of erosion, the amount of erosion can also be a function of drying time, specifically during drained conditions. To assess the amount of erosion as a function of drying time directly after deposition, sediment from location X1 was homogenized and placed in a Gust cell. The bed shear stress was incrementally increased to analyze the erosion response of the sediment for five different samples that were subjected to varying drying times. The SYS values and water content were measured after these erosion tests as well. Apart from the onset of erosion, the cumulative eroded mass seems to be a function of drying time as well, see Figure 9. Additionally, it can be observed that deposited sediment that was exposed to the atmosphere for 22h had lower water content values, higher SYS values and showed more cumulative erosion compared to the same material which experienced equal time between deposition and the start of the experiment but was submerged all the time.
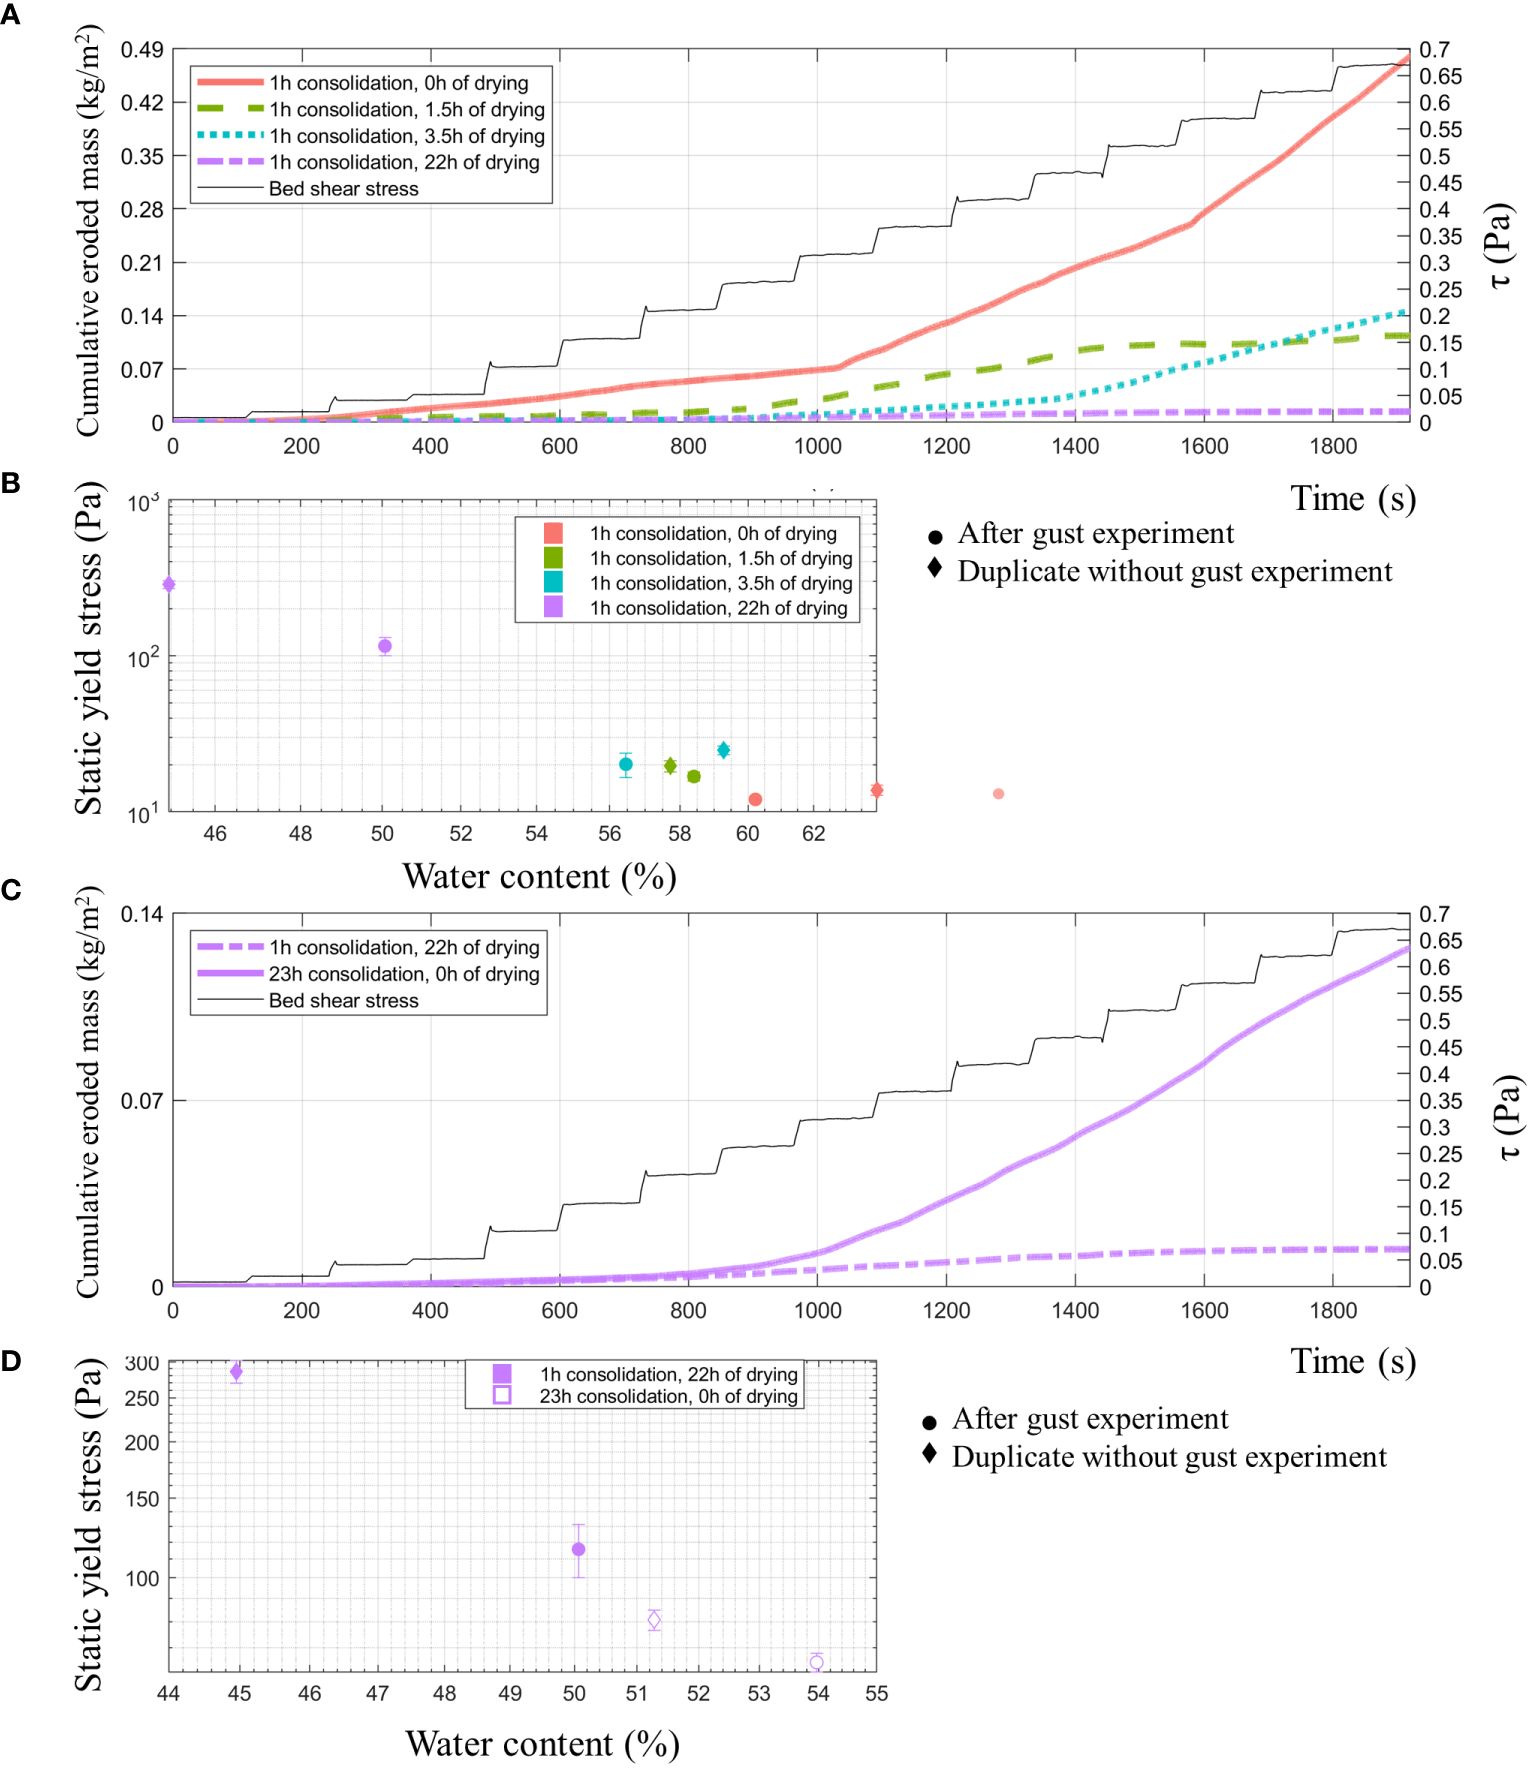
Figure 9 (A, C) show cumulative eroded mass and bed shear stress over time. (A) displays experiments with varying drying times after 1h consolidation. (A) compares two 23h experiments—one with 1h consolidation and 22h drying, the other with 23h consolidation and no drying. (B, D) illustrate the water content vs. SYS relationship. In (B), the diamonds represent eroded sediment, and the circles depict sediment with equal drying time but without erosion. All samples underwent 1h consolidation. Points are averages, and error bars show standard deviation; n=3 per point. (D) shows specifically the water content- SYS relationship for the experiments of (C). Black arrows indicate the static yield stress increase and water content decrease after 1h consolidation and subsequent drying.
The effect of drying on erosion rate is highly affected by the environmental conditions such as the local weather conditions and the properties of the sediment. Therefore, the observed dependency of erosion rate to consolidation and drying time is not used directly into the model (as conditions may be different from those during the field and lab tests), but via a simple but physics-based 2L consolidation and drying model. Notwithstanding, an empirical and case-specific relationship has been determined by the use of a linear regression model with two independent variables: 1) bed shear stress, and 2) drying time. Here, we exemplify the use of such a technique to compute a drying time-dependent erosion rate.
Four models were evaluated to explore the effects of drying time on bed shear stress, with two models incorporating an interaction effect and two excluding it. For the models without interaction, drying time was modeled using two different transformations: √drying time, and e-drying time. Similarly, these transformations were applied to the models that included an interaction effect with bed shear stress. This was done because the effect of drying on erosion is large at the beginning, while fading off for larger drying times. This was also visible in the relationship between water content and time after high tide for the samples from the field. For this analysis bed shear stresses up to 0.55Pa were only included in the analysis, because non-linear patterns in erosion rate related to mass erosion were visible beyond this value. The comparison of the Akaike Information Criterion for the four models suggests that the presence of bed shear stress and drying time together has a larger effect on erosion than the sum of each; interaction leads to a better fit.
We conducted diagnostic checks to assess the assumptions of the regression model. The normality of residuals was visually examined through a quantile-quantile (Q-Q) plot, and the Anderson-Darling test for normality yielded p-values above the conventional threshold of 0.05 for the model with the square-root transformation the drying time. This suggests that the residuals can be considered approximately normally distributed. However, the residuals of the model including the interaction effect, and the e-drying time transformation, did not display a normal distribution. This violated the assumption of linear regression. Therefore, we only adopted the model with the square-root transformation. Moreover, we inspected the residuals of this model plotted against covariates and fitted values to identify any non-linear patterns. No discernible non-linear patterns were observed, supporting the assumption of linearity in the relationship between the dependent and independent variables. These diagnostic assessments collectively indicate that the assumptions of normality of residuals and linearity in the relationship between predictors and the response variable are not violated, reinforcing the reliability of the regression analysis results.
The adopted relationship between erosion rate, bed shear stress and drying time is expressed in Equation 6. Here, E represents the erosion rate in kg/m2/s, M1, M2, and M3 are the coefficients, τ is the bed shear stress, τcr is the critical bed shear stress for erosion (set to a default value of 0.05 Pa), and tdry is the drying time in hours. The square root of drying time mediates the effect of bed shear stress on erosion by a factor −1.47×10⁻⁷ (p< 0.001). This interaction term explains 20% of the variation in erosion (corresponding to an increase in adjusted R-squared of the model without interaction from 60% to 80% for the model with interaction).
Standard in linear regression with an interaction component is that the M2 term is also added in the model results, however the second term is insignificant. Therefore, the M2 term is dropped, see Equation 7. Equation 7 implies that erosion becomes negative when becomes larger than 18:40h. So, for the sake of applicability, these equations only hold for (M1/M3)2 . The data and fits based on the statistical model are portrayed in Figure 10.
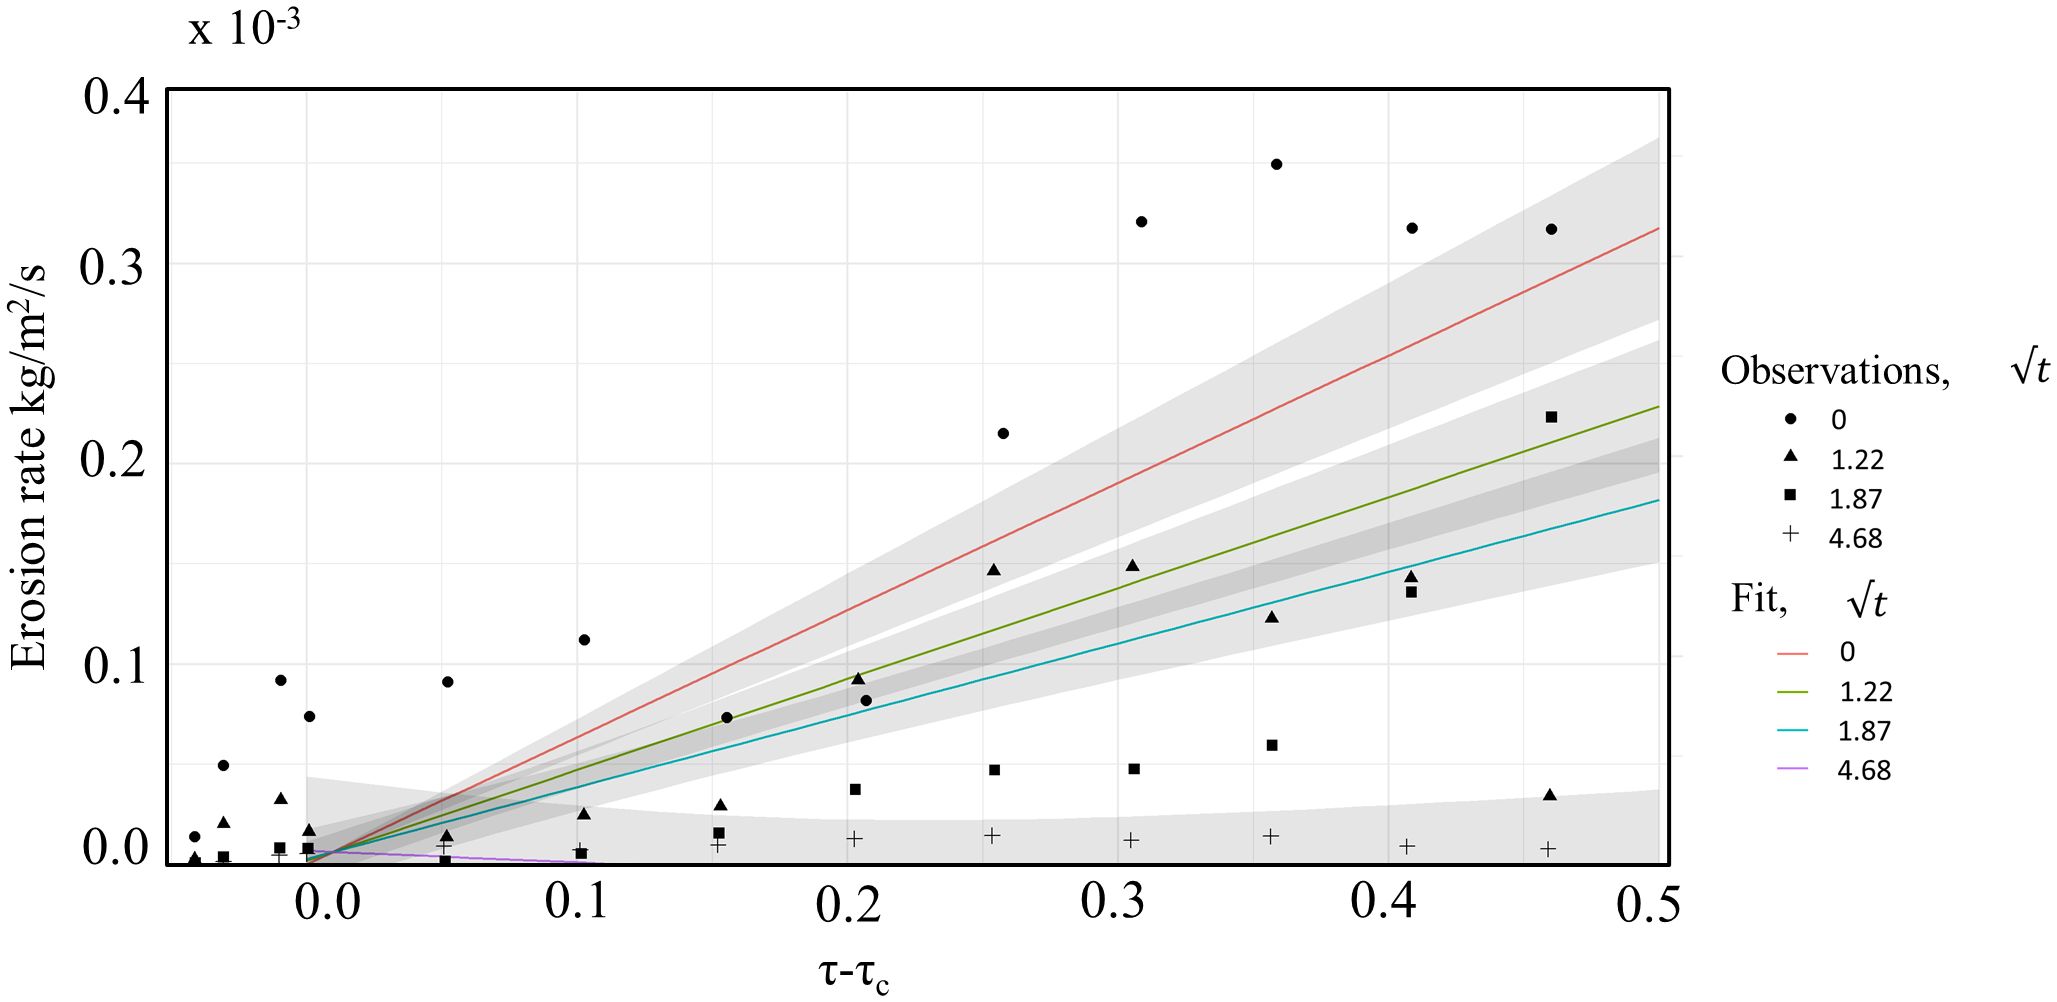
Figure 10 Erosion rate (kg/m2/s1) of freshly deposited mud as a function of bed shear stress (Pa) for four drying times. The measured values in the Gust chamber tests are plotted as points. The fit is based on the linear regression formula including interaction by square root of drying time is plotted by lines with 95% confidence bands. √t indicates the square root of the drying time: 0, 1.5, 3.5 and 22h for 0, 1.22, 1.87, and 4.68h0.5 respectively.
3.3 Numerical modelling
Empirical models that establish site-specific relationships between drying time and erosion rate prove valuable for evaluating the morphological evolution of a particular location. However, their applicability becomes limited in a more generalized context. Consequently, we opted to employ the 2L buffer model proposed by Van Kessel et al. (2011) to identify recommended parameters for numerical modelling on a broader scale. The 2L buffer model has been adapted as discussed in section 2.4 and applied to the Gust chamber tests and to the field site, both with and without exposure and drying. The model schematization is a simple 1D approach with synthetic bed shear stress according to Figure 11 for the Gust test and with variable current- and wave-induced bed shear stress exported from a 3D numerical model of the Scheldt (Van Kessel et al., 2011). The material properties as discussed in section 2.4 have been determined from settling, consolidation and erosion tests performed on mud samples from the Scheldt estuary.
In the Gust tests without exposure, the critical shear stress for erosion slightly increases because of self-weight consolidation, but this is a minor effect compared with the increase because of air exposure (Table 2). When exposed, erodibility becomes significantly less after 4 hr and after 24 hr no erosion at all occurs. This result is consistent with the Gust tests carried out in the lab. Thicker deposits respond more slowly. Self-weight consolidation is more pronounced whereas the effect of drying requires more time to become significant. The same hold for permeability: less permeable beds respond more slowly to consolidation and drying (not shown in Table 2).
The same 1D model is tested for bed shear stress and water level forcing representative for field location Zuidgors for a period of 1 year. Again, the model is run with and without the effect of air exposure, see Figure 12. For both cases, the gross accretion rate is similar, but the net accretion rate differs strongly as resuspension is limited by the strength increase after exposure. The cumulative effect over a year is a net erosion of 5 cm without the effect of air exposure and a net accretion of 5 cm including this effect. The largest difference is observed towards the end of the year, when the mudflat is exposed to storm waves. Without the effect of air exposure previous deposits have gained insufficient strength to withstand these rough conditions, whereas with this effect erosion remains minor. With air exposure, suction causes the top layer to remain beyond the critical state for a prolonged period, which explains the constant value for τc during this period. Without air exposure, self-weight consolidation of the top layer is insufficient to increase τc much above that of fresh deposits. The formulations therefore have a practical relevance for mud modelling, as accretion of intertidal flats is often underestimated in the present models.
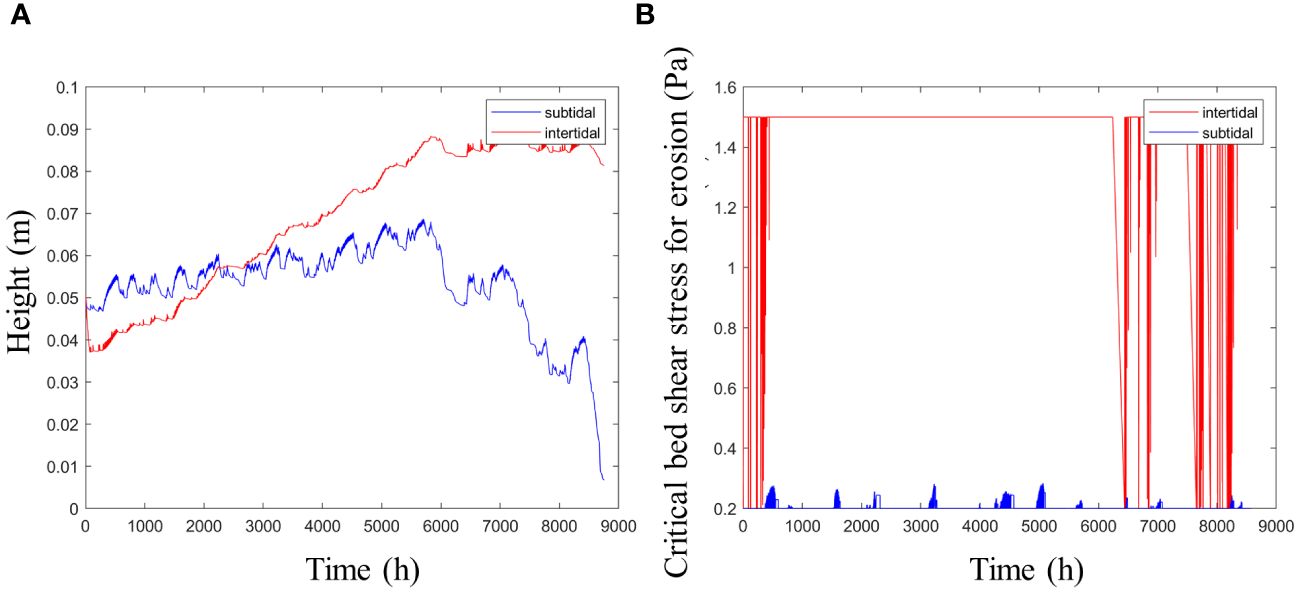
Figure 12 Effect of air exposure on mudflat accretion (A) and critical shear stress in the top layer (B).
If these results are compared with a simple 1L model with fixed values for τc and M, a striking difference is the very strongly reduced sensitivity of mudflat accretion to sediment concentration. Figure 13 shows results for boundary concentrations of 50, 100 and 200 mg/l. Although accretion does increase with sediment supply, this effect is relatively minor for the new model (resp. 0, 3 and 11 cm accretion over a year). However, for the 1L fixed properties mode, the balance between net accretion and net erosion (with starved bed) is very precarious. A twofold concentration increase results in extreme accretion, whereas a twofold decrease results in extreme erosion, to an extent that the present morphostatic approach is not acceptable anymore. This demonstrates the robustness of the new approach in 1D, although further testing and application in 2D/3D is still required to evaluate its full potential.
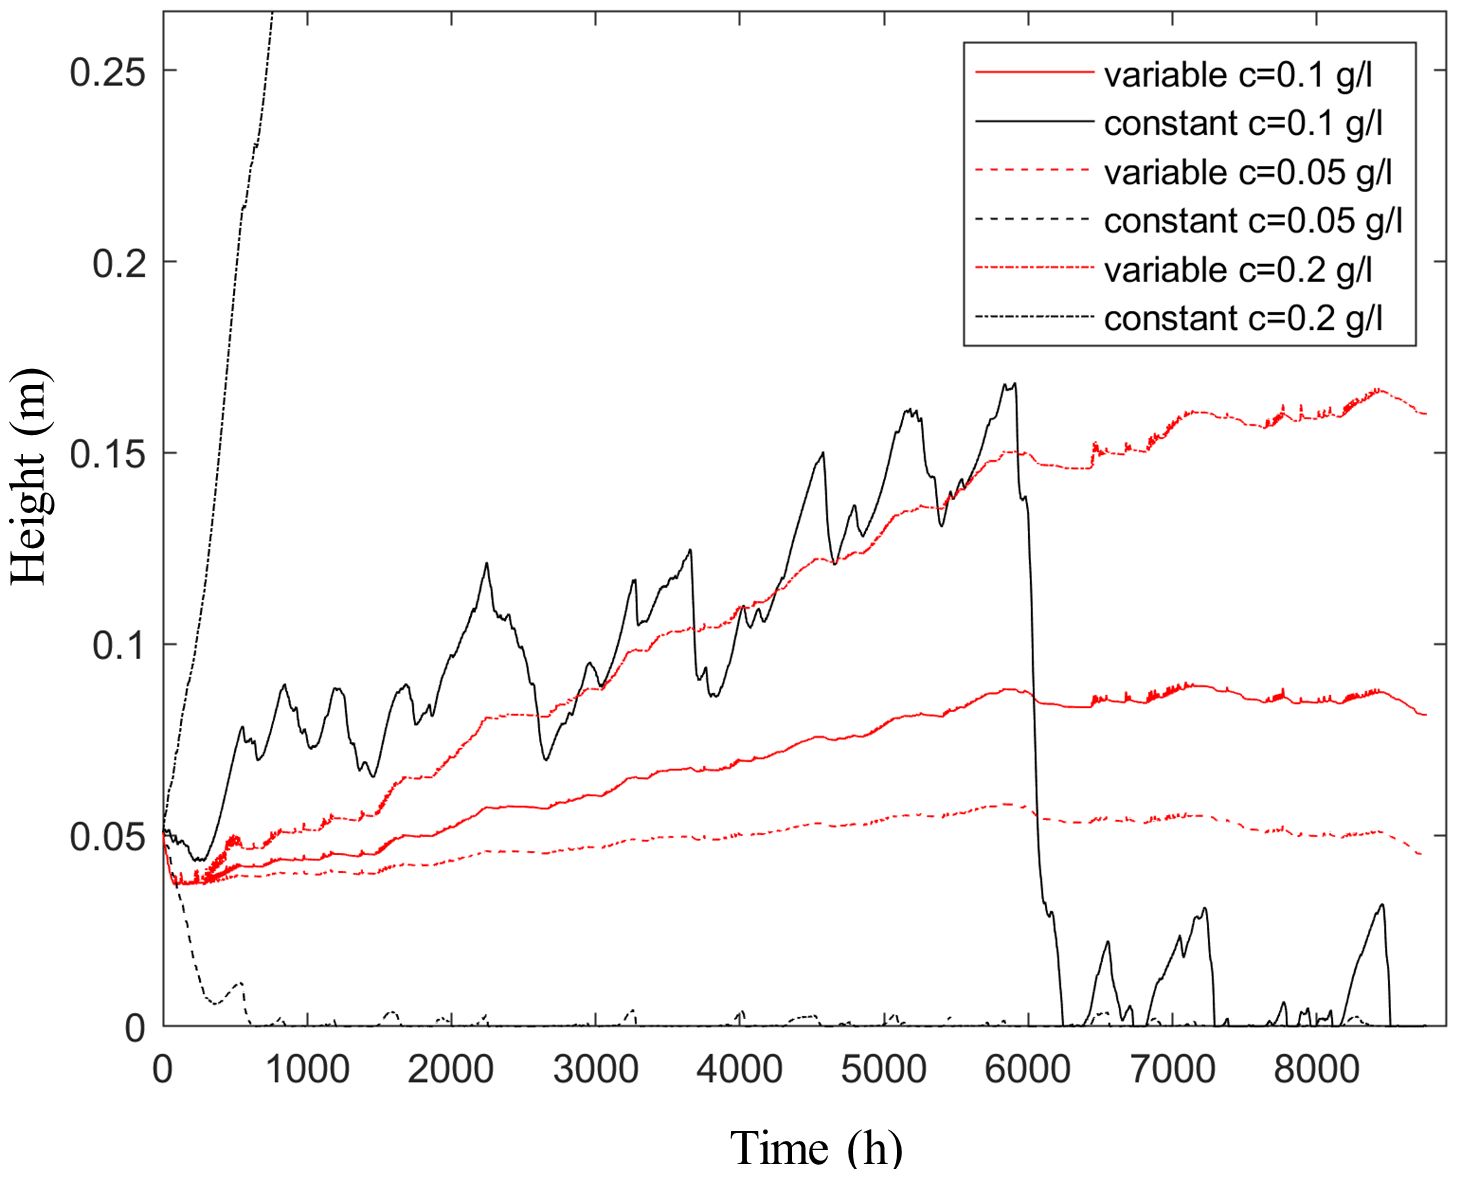
Figure 13 Sensitivity of mudflat accretion to ambient concentration (0.05, 0.1 and 0.2 g/l) for new approach with variable erosion properties and classical approach with constant erosion properties.
4 Discussion and conclusion
Evaporation and its impact on the consolidation of mud and material properties is an underemphasized process. The process is not included in most numerical models but does impact the erosion and evolution of tidal flats (Grabowski et al., 2011; Colosimo et al., 2023). Likewise earlier laboratory studies, we conclude that evaporation results in lower erosion rates of the mud (Nguyen et al., 2019).
We studied the impact of evaporation on the water content and the critical yield strength of mud samples in a multi-faceted approach. We measured the water content and yield strength as a function of drying time for artificial samples and field samples in the laboratory, we measured water content and yield strength in the field, and we used the outcome of these practical experiments as input for a new erosion formulation which was applied in a numerical model. By combining these three methods we can integrate the results of controlled experiments in the lab, results of actual mud behavior in the field and extend the results to larger time scales with numerical modelling.
The water content and erodibility decrease for longer drying times in the field and this was also observed in laboratory experiments. The impact of the drying time depends on local conditions of the bed material, location on the mudflat, topography and weather conditions. The material properties influence the water content, for example a higher mud content results in a higher water content and lower shear strength. Different sampling locations on the mud flat influence the water content as well. Delayed dewatering of the upper mud flat, increases the water content on the lower mud flat. A tidal flat is generally covered with bed forms (e.g. creeks, hummocks and hollows). Local ‘‘depressions’’ like creeks and hollows attract or retain water. Therefore, the consolidation and evaporation processes are delayed compared to neighboring elevated parts of the mud flat. The meteorological conditions affect the strength increase. We performed two field campaigns in successive years at the same mud flat. The first year, the measurements were during a drought period and the yield stress measured in the field was significantly higher than the measurements in the second year. In addition, the measurements in the second year were directly after a storm and a thin fluid mud layer was deposited on top of the tidal flat. Most probably the measured yield strength was lower due to this layer. Our field observations coincided with field measurements from Colosimo et al. (2023) who found that the consolidation of mud is delayed if the deposited mud layer is too thick. Besides, we also found that shear strength increased the most at the location which is closed to the coast, and which was the most elevated site. This agrees with Paterson et al. (1990) who reported the greatest increase in sediment stability at high-shore location. The increase in yield strength with temperature was also found in laboratory studies of Nguyen et al. (2019) and fieldwork of Fagherazzi et al. (2017) and Nguyen et al. (2020). The strength increase during the exposure period was hardly affected by a short rain spell (field campaign 2023). This corresponds with observations of Fagherazzi et al. (2017) and Nguyen et al. (2020) who found that the strength increase during an exposure period was not completely vanished by a succeeding high water. This study did not look into the effect of biota on the erodibility, which may have played a role in the field study. Generally, the presence of biofilms like microphytobenthos decrease the erodibility of tidal flats (Widdows et al., 2006). Variation in biofilm-forming species in dependent on its vertical position on the tidal flat (Cuadrado et al., 2014). An interesting continuation of this work would be to identify which processes drive erodibility in which zones on the tidal flat. The upper tidal flat may be dominated by biofilm stabilization, while the lower tidal flat may be dominated by stabilization by air exposure.
Our results underline the relevance of evaporation in the consolidation process and material strength. This has implications for other studies regarding the erodibility and evolution of tidal flats. Numerical models that incorporate the intertidal zone most probably overestimate the erosion of the tidal flats because the strength increase due to evaporation is not included. Also, studies that investigate the suitability of tidal flats for marsh development benefit from this work. The water content decrease is faster due to evaporation. Therefore, the window of opportunities for vegetation growth will shift due to evaporation and affected water content. The impact of evaporation is illustrated with 1D model results in which net mudflat accretion increases if the effect of evaporation is included. For mud properties and suspended sediment concentrations representative for the Scheldt estuary, and representative hydrodynamic and meteorological forcing, the difference between the model scenarios with and without exposure and drying effect on erodibility is substantial and practically relevant.
The main conclusion is that drying results in a very strong reduction in erodibility. In practice, effective drying time may be much shorter than exposure time depending on local conditions. A 1D model including these effects is available as open source for further scrutiny and application. More detailed conclusions are:
- The water content is a function of the drying time and the mud content of the material and samples with a high mud content have a high water content. The water content decreases and critical shear stress increases if the tidal flat is exposed.
- This effect is most pronounced during the first two hours after exposure of the tidal flat.
- On the lower part of the tidal flat, the decrease in water content and increase of shear strength is less pronounced. This is caused by the delayed dewatering of the upper part of the tidal flat that passes the lower locations.
- There is a significant difference in material strength between undrained consolidated samples and samples that were subjected to evaporation. For the latter, the strength increase is larger even if the evaporation time is shorter than the undrained consolidation time.
- The yield stress increases with drying time for artificial mud samples, undisturbed field samples and homogenized deposited beds created from field material.
- The laboratory and field experiments proof that the critical shear stress and erosion rates are a function of the drying time. Inclusion of the drying time in the erosion formulation applied in a 1D model show that mudflat stability and growth is significantly enhanced.
Data availability statement
The raw data supporting the conclusions of this article will be made available by the authors, without undue reservation.
Author contributions
FR: Conceptualization, Formal Analysis, Investigation, Methodology, Writing – review & editing. JH: Conceptualization, Investigation, Methodology, Writing – review & editing. SG: Investigation, Writing – review & editing. AT: Conceptualization, Writing – review & editing. TK: Conceptualization, Formal Analysis, Funding acquisition, Methodology, Project administration, Writing – review & editing.
Funding
The author(s) declare financial support was received for the research, authorship, and/or publication of this article. This paper was funded by the Deltares IN-SITO strategic research program ‘Kennisbasis experimentele faciliteiten’.
Acknowledgments
We acknowledge Gregory Fivash (NIOZ) and Claudia McLeod (HAN University of Applied Sciences) for their support during the 2022 field work.
Conflict of interest
The authors declare that the research was conducted in the absence of any commercial or financial relationships that could be construed as a potential conflict of interest.
Publisher’s note
All claims expressed in this article are solely those of the authors and do not necessarily represent those of their affiliated organizations, or those of the publisher, the editors and the reviewers. Any product that may be evaluated in this article, or claim that may be made by its manufacturer, is not guaranteed or endorsed by the publisher.
References
Amos C. L., Daborn G. R., Christian H. A., Atkinson A., Robertson A. (1992). In situ erosion measurements on fine-grained sediments from the Bay of Fundy. Mar. Geolo. 108, 175–196. doi: 10.1016/0025-3227(92)90171-D
Amos C. L., Feeney T., Sutherland T. F., Luternauer J. L. (1997). The stability of fine-grained sediments from the Fraser River delta. Estuarine Coast. Shelf Sci. 45, 507–524. doi: 10.1006/ecss.1996.0193
Baptist M. J., Gerkema T., van Prooijen B. C., van Maren D. S., van Regteren M., Schulz K., et al. (2019). Beneficial use of dredged sediment to enhance salt marsh development by applying a ‘Mud Motor.’. Ecol. Eng. 127, 312–323. doi: 10.1016/j.ecoleng.2018.11.019
Colosimo I., van Maren D. S., de Vet P. L. M., Winterwerp J. C., van Prooijen B. C. (2023). Winds of opportunity: The effects of wind on intertidal flat accretion. Geomorphology 439, 108840. doi: 10.1016/j.geomorph.2023.108840
Cuadrado D. G., Perillo G. M. E., Vitale A. J. (2014). Modern microbial mats in siliciclastic tidal flats: Evolution, structure and the role of hydrodynamics. Mar. Geolo. 352, 367–380. doi: 10.1016/j.margeo.2013.10.002
De Lucas Pardo M. A., Bakker M., Van Kessel T., Cozzoli F., Winterwerp J. C. (2013). Erodibility of soft freshwater sediments in Markermeer: The role of bioturbation by meiobenthic fauna Topical Collection on the 11th International Conference on Cohesive Sediment Transport. Ocean Dynam. 63, 1137–1150. doi: 10.1007/s10236-013-0650-0
de Vet P. L. M., van Prooijen B. C., Colosimo I., Steiner N., Ysebaert T., Herman P. M. J., et al. (2020). Variations in storm-induced bed level dynamics across intertidal flats. Sci. Rep. 10, 1–15. doi: 10.1038/s41598–020-69444–7
Fagherazzi S., Viggato T., Vieillard A. M., Mariotti G., Fulweiler R. W. (2017). The effect of evaporation on the erodibility of mudflats in a mesotidal estuary. Estuarine Coast. Shelf Sci. 194, 118–127. doi: 10.1016/j.ecss.2017.06.011
Fivash G. S., Temmerman S., Kleinhans M. G., Heuner M., van der Heide T., Bouma T. J. (2023). Early indicators of tidal ecosystem shifts in estuaries. Nat. Commun. 14, 1911. doi: 10.1038/s41467-023-37444-6
Grabowski R. C., Droppo I. G., Wharton G. (2011). Erodibility of cohesive sediment: The importance of sediment properties. Earth-Sci. Rev. 105, 101–120. doi: 10.1016/j.earscirev.2011.01.008
Gust G. (1990). Method of generating precisely defined wall shearing stresses. US Patent 4973165 A, 27 Nov 1990. (Hydro Data, Inc.).
Hu Z., Yao P., van der Wal D., Bouma T. J. (2017). Patterns and drivers of daily bed-level dynamics on two tidal flats with contrasting wave exposure. Sci. Rep. 7, 1–9. doi: 10.1038/s41598-017-07515-y
Jacobs W., Le Hir P., Van Kesteren W., Cann P. (2011). Erosion threshold of sand-mud mixtures. Continent. Shelf Res. 31, S14–S25. doi: 10.1016/j.csr.2010.05.012
Mehta A. J., Partheniades E. (1982). Resuspension of deposited cohesive sediment beds. Coastal Engineering, Cape Town, South Africa. ASCE, Reston, VA 1569–1588.
Merckelbach L. M., Kranenburg C. (2004). Determining effective stress and permeability equations for soft mud from simple laboratory experiments. Geotechnique 54, 581–591. doi: 10.1680/geot.2004.54.9.581
Nguyen H. M., Bryan K. R., Pilditch C. A. (2020). The effect of long-term aerial exposure on intertidal mudflat erodibility. Earth Surf. Process. Landforms 45, 3623–3638. doi: 10.1002/esp.4990
Nguyen H. M., Bryan K. R., Pilditch C. A., Moon V. G. (2019). Influence of ambient temperature on erosion properties of exposed cohesive sediment from an intertidal mudflat (Geo-Marine Letters, (2019), 39, 4, (337–347), 10.1007/s00367–019-00579-x). Geo-Marine Lett. 39, 521. doi: 10.1007/s00367–019-00618–7
Paterson D. M., Crawford R. M., Little C. (1990). Subaerial exposure and changes in the stability of intertidal estuarine sediments. Estuarine Coast. Shelf Sci. 30, 541–556. doi: 10.1016/0272-7714(90)90091-5
Suedel B. C., McQueen A. D., Wilkens J. L., Saltus C. L., Bourne S. G., Gailani J. Z., et al. (2022). Beneficial use of dredged sediment as a sustainable practice for restoring coastal marsh habitat. Integr. Environ. Assess. Manage. 18, 1162–1173. doi: 10.1002/ieam.4501
Tran D., Strom K. (2019). Floc sizes and resuspension rates from fresh deposits: Influences of suspended sediment concentration, turbulence, and deposition time. Estuarine Coast. Shelf Sci. 229, 106397. doi: 10.1016/j.ecss.2019.106397
Van Damme S., Struyf E., Maris T., Ysebaert T., Dehairs F., Tackx M., et al. (2005). Spatial and temporal patterns of water quality along the estuarine salinity gradient of the Scheldt estuary (Belgium and the Netherlands): Results of an integrated monitoring approach. Hydrobiologia 540, 29–45. doi: 10.1007/s10750-004-7102-2
Van Kessel T., Blom C. (1998). Rheology of cohesive sediments: Comparison between a natural and an artificial mud. J. Hydr. Res. 36, 591–612. doi: 10.1080/00221689809498611
Van Kessel T., Fontijn H. L. (2000). Miniature sounding tests on soft saturated cohesive soils. Géotechnique 50, 537–546. doi: 10.1680/geot.2000.50.5.537
Van Kessel T., Winterwerp H., Van Prooijen B., Van Ledden M., Borst W. (2011). Modelling the seasonal dynamics of SPM with a simple algorithm for the buffering of fines in a sandy seabed. Continent. Shelf Res. 31, S124–S134. doi: 10.1016/j.csr.2010.04.008
Wang Z. B., Vandenbruwaene W., Taal M., Winterwerp H. (2019). Amplification and deformation of tidal wave in the Upper Scheldt Estuary. Ocean Dynam. 69, 829–839. doi: 10.1007/s10236-019-01281-3
Widdows J., Brinsley M. D., Pope N. D., Staff F. J., Bolam S. G., Somerfield P. J. (2006). Changes in biota and sediment erodability following the placement of fine dredged material on upper intertidal shores of estuaries. Mar. Ecol. Prog. Ser. 319, 27–41. doi: 10.3354/meps319027
Willemsen P. W. J. M., Borsje B. W., Hulscher S. J. M. H., van der Wal D., Zhu Z., Oteman B., et al. (2018). Quantifying bed level change at the transition of tidal flat and salt marsh: can we understand the lateral location of the marsh edge? J. Geophys. Res.: Earth Surf. 123, 2509–2524. doi: 10.1029/2018JF004742
Keywords: erodibility, intertidal mud flat, sediment strength, evaporation, numerical modelling, sediment transport dynamics, water retention, erosion parameter
Citation: van Rees FF, Hanssen J, Gamberoni S, Talmon AM and van Kessel T (2024) Effect of air exposure time on erodibility of intertidal mud flats. Front. Mar. Sci. 11:1393262. doi: 10.3389/fmars.2024.1393262
Received: 28 February 2024; Accepted: 23 May 2024;
Published: 07 June 2024.
Edited by:
Guan-hong Lee, Inha University, Republic of KoreaReviewed by:
Jinfeng Zhang, Tianjin University, ChinaSteven Miguel Figueroa, Chungnam National University, Republic of Korea
Copyright © 2024 van Rees, Hanssen, Gamberoni, Talmon and van Kessel. This is an open-access article distributed under the terms of the Creative Commons Attribution License (CC BY). The use, distribution or reproduction in other forums is permitted, provided the original author(s) and the copyright owner(s) are credited and that the original publication in this journal is cited, in accordance with accepted academic practice. No use, distribution or reproduction is permitted which does not comply with these terms.
*Correspondence: Floris F. van Rees, ZmxvcmlzLnZhbnJlZXNAZGVsdGFyZXMubmw=
†These authors have contributed equally to this work
 Floris F. van Rees
 Jill Hanssen
 Stefano Gamberoni1
 Thijs van Kessel
