 Christina A. Frieder1*
 Fayçal Kessouri1,2
 Minna Ho1,2
 Martha Sutula1
 Daniele Bianchi2
 James C. McWilliams2Curtis Deutsch3,4
 Evan Howard5
- 1Southern California Coastal Water Research Project, Costa Mesa, CA, United States
- 2Department of Atmospheric and Oceanic Sciences, University of California, Los Angeles, Los Angeles, CA, United States
- 3Department of Geosciences, Princeton University, Princeton, NJ, United States
- 4High Meadows Environmental Institute, Princeton University, Princeton, NJ, United States
- 5Cooperative Institute for Climate, Ocean, and Ecosystem Studies, University of Washington, Seattle, WA, United States
Land-based nutrient inputs to the ocean have been linked to increased coastal productivity, subsurface acidification and O2 loss, even in upwelling systems like the Southern California Bight. However, whether eutrophication alters the [environment’s] capacity to support key taxa has yet to be evaluated for this region. Here, we assess the impact of land-based nutrient inputs on the availability of aerobic and calcifying habitat for key pelagic taxa using ocean model simulations. We find that acute, lethal conditions are not commonly induced in epipelagic surface waters, but that sublethal, ecologically relevant changes are pervasive. Land-based nutrient inputs reduce the potential aerobic and calcifier habitat during late summer, when viable habitat is at its seasonal minimum. A region of annually recurring habitat compression is predicted 30 – 90 km from the mainland, southeast of Santa Catalina Island. Here, both aerobic and calcifier habitat is vertically compressed by, on average, 25%, but can be as much as 60%. This effect can be traced to enhanced remineralization of organic matter that originates from the coast. These findings suggest that effects of land-based nutrients are not restricted to chemistry but extend to habitat capacity for multiple taxa of ecological and economic importance. Considerable uncertainty exists, however, in how this habitat compression translates to population-level effects.
1 Introduction
Global change is fundamentally restructuring marine ecosystems, shifting distributions, phenologies, and interactions among species. Temperature (T), oxygen (O2), and carbonate chemistry (e.g., pH, ) naturally constrain available habitat for marine calcifiers and aerobic animals, but as ocean waters warm, become less oxygenated, and more acidified, these changes are driving habitats beyond the envelope of natural variability, resulting in major changes to species distribution and abundance, and raising the potential for major ecosystem disruptions (Howard et al., 2020; Pinsky et al., 2020). While shifts in species abundance or geographic range can be detected in historical data, local human impacts from nitrogen pollution and coastal eutrophication confound the attribution of biological changes to long-term climate trends. Effective coastal ecosystem management in the face of global change requires the means to both: (1) quantify these fundamental changes to species habitats and (2) disentangle the relative roles of climate change, natural and climatic variability, and local anthropogenic pressures in shaping those habitats. Ocean numerical models are routinely used to project the effects of climate change on shifting habitats and species distributions (Penn and Deutsch, 2022), but few coastal numerical modeling studies have investigated the potential for local coastal eutrophication to constraint marine calcifier and aerobic habitat (Bednaršek et al., 2020). As 80% of global wastewater receives no treatment before discharging to coastal waters (Rangel-Buitrago et al., 2024), such studies can help to understand whether local management of coastal eutrophication could meaningfully increase resilience of ecosystems to climate change.
In semi-enclosed seas and estuaries, the effects of eutrophication on increased primary productivity, enhanced remineralization rates, subsurface O2 depletion, and acidification are commonly observed within the 100-m isobath (Rabalais, 2005; Rabalais et al., 2009). However, recent work has revealed that such changes can be meaningful even in upwelling-dominated coastal environments, countering the tenet that low O2 and that occur along eastern boundary upwelling systems are only naturally induced, without direct anthropogenic influence (Fennel and Testa, 2019). The Southern California Bight (SCB) is an open embayment situated within an eastern boundary upwelling system, located between the Baja California Peninsula and Point Conception. This region hosts a variety of marine communities and hotspots of biodiversity. The complex seabed topography and presence of islands contributes to complex circulation features. While large-scale circulation features are dominated by the California Current, submesoscale eddies accumulate and redistribute material from the coast (Dong et al., 2009). The SCB receives export from a human population of 22 million, which rivals natural upwelling in magnitude, roughly doubling available nitrogen (Howard et al., 2014). These inputs include point and non-point source discharges to the ocean from 19 ocean outfalls and 75 rivers, which release, on average, 8 million m3 d-1 of nutrient-enriched water to the ocean (Sutula et al., 2021). The ocean outfalls all have wastewater treatment, but the majority have no nitrogen removal (Sutula et al., 2021). The effects of these inputs are increasing primary production and subsurface remineralization rates along the coast, with corresponding subsurface reductions in O2 and aragonite saturation state () that rival or exceed that of global open-ocean O2 loss and acidification since the pre-industrial period (Kessouri et al., 2021b).
While Kessouri et al. (2021b) quantified the change in seawater chemistry from anthropogenic nutrient inputs in the Bight, they did not document the potential for biological effects, a fundamental science gap that motivates coastal water quality managers. In the SCB, these changes in seawater chemistry can extend more than 100 km from the coast (∼30% of the Bight) (Kessouri, 2024). The region of maximum change occurs in the epipelagic zone, localized between 50 and 200 m water depth. When these declines are superimposed on areas already naturally low in O2 and , even small changes could be of biogeochemical and ecological significance (Levin, 2018; Roman et al., 2019). The question is whether these subsurface O2 and acidification changes are occurring at ecologically relevant conditions, resulting in vertical compression of habitat. There are field-based demonstrated consequences of coastal acidification for shell-building zooplankton, in particular pteropods (Bednaršek et al., 2019; Feely et al., 2024). Similarly, O2 depletion in the ocean can reduce metabolic performance of aerobic taxa (Fry, 1971; Pörtner and Knust, 2007; Seibel, 2011). Most of the literature on hypoxia focuses on acute lethal levels, but sublethal effects, even subtle ones that pose constraints on feeding times, can combine to limit growth or reproduction (Gunderson and Leal, 2016; Pinsky et al., 2020). Studies in other ecosystems have documented how short-term, low-O2 events can give rise to immediate habitat compression of sensitive species, increasing susceptibility to overfishing [e.g. of brown shrimp and demersal fishes in the Gulf of Mexico (Craig, 2012) and of artisanal fisheries species in the Sea of Oman (Piontkovski and Al-Oufi, 2014)]. Even the behavior of smaller vertical-migrating taxa, like copepods, is shaped by seasonal O2 and temperature (Pierson et al., 2017). On the longer-term, interactions between temperature and O2 availability on aerobic metabolism have strong correspondence with faunal diversity, species distributions, predator-prey interactions, and changing biogeographic patterns (Deutsch et al., 2015, 2020; Seibel, 2016), and may even result in range shifts (Pinsky et al., 2020; Howard et al., 2020) and extinction (Penn and Deutsch, 2022).
In this study, we assess the degree to which modeled O2 losses and acidification due to land-based nutrient inputs translates to changes in habitat capacity. To accomplish this, we rely on two metrics that define the habitat available for aerobic metabolism and for calcification. Aerobic habitat is determined using the Metabolic Index , for which trait-based threshold varies across species. Aerobic habitat for northern anchovy, Engrualis mordax, is detailed but we also consider how aerobic habitat is modified for a range of species with metabolic traits that have differing oxygen and temperature sensitivities. Calcifying habitat is based on the saturation state of aragonite , for which thresholds also vary among species. We evaluate calcifier habitat capacity as the thickness of the water column where ≥ 1.4, but we also consider the sensitivity of our results to other values of .
Our study objectives are threefold. First, we evaluate temporal and spatial patterns in aerobic and calcifier habitat capacity metrics in the SCB with output from a 20-year numerical ocean model hindcast. Second, we test how anthropogenic nutrient inputs from land-based sources alter the vertical thickness of the habitat capacity metrics. We rely on two model scenarios, the first includes natural oceanic cycles of nutrients, O2 and carbon, to which rising global CO2 emissions have been imposed (referred to hereafter as ‘CTRL’), and the second includes both natural oceanic cycles of nutrients and inputs from terrestrial sources, 98% of which are anthropogenic and 95% of which are point source in origin (referred to hereafter as ‘ANTH’) (Sutula et al., 2021). Third, we confirm the mechanisms by which anthropogenic nutrients contribute to the observed changes in vertical habitat capacity by analyzing changes in the biogeochemical rate processes that contribute to the O2 and carbon cycles.
2 Materials and methods
To assess whether modeled effects of land-based nutrient inputs on Bight-wide subsurface O2 loss and acidification are biologically relevant, we employed two metrics for habitat capacity, which we adapted for this purpose. One incorporates temperature-dependent environmental O2 as a predictor of habitat capacity for aerobic metabolism and the other incorporates carbonate chemistry as a predictor of habitat capacity for aragonite production by calcifiers. The premise of our approach is that these metrics provide information on the capacity of a specified location to provide habitat conditions that are sufficient for key processes for a species, or group of species, based on either empirical or mechanistic relationships of organismal performance with the environmental condition(s) of interest. The habitat capacity metrics are applied to model outputs from scenarios with and without land-based nutrient inputs in order to perform a difference assessment. Each metric is presented as the volume (or thickness of water-column) above a relevant threshold.
Since modeled effects of subsurface O2 loss and acidification due to anthropogenic nutrient inputs are shown to be localized between 50 and 200 m (Kessouri, 2024), we focus our analysis on pelagic taxa. Because literature is limited on the interactive effects of O2 and carbonate chemistry in these environments, we adapt two separate metrics to evaluate the changes in O2 versus the changes in carbonate chemistry with an emphasis on aerobic taxa and calcifiers, accordingly.
For the effects of subsurface acidification on calcifier habitat capacity, we calculate the vertical thickness of optimal aragonite saturation state conditions. A value of of 1.4 is used to define the condition below which sublethal organismal responses have been documented to commonly occur (Bednaršek et al., 2019, 2021a, 2021b). One of the primary lines of evidence for this choice is derived from a synthesis of documented effects on pteropods (Bednaršek et al., 2019), in which thresholds for a range of sublethal to lethal responses were identified and confidence in thresholds were judged with expert consensus. Pteropods are ubiquitous, holoplanktonic calcifiers that have a well-documented, specific sensitivity to ocean acidification. These calcifiers efficiently transfer energy from phytoplankton to higher trophic levels (Lalli and Gilmer, 1989; Hunt et al., 2008), and as such serve as an important prey group for ecologically and economically important fishes, bird, and whale diets (Armstrong et al., 2005; Aydin et al., 2005; Karpenko et al., 2007). Bednaršek et al. (2019) identified that from 1.5 – 0.9 provides a risk range from mild dissolution to lethal impacts. Our selected value of of 1.4 represents a value within recommended measurement precision for observational programs (± 0.2 (McLaughlin et al., 2015)) of thresholds where sublethal effects on calcification, growth, and severe dissolution are documented to occur, while a value of 1.0 roughly equates to lethal effects [0.9 to 0.95 (Bednaršek et al., 2019)]. In the epipelagic (0-200 m) in the Southern California Bight, conditions below saturation have not been common in the modern ocean (McClatchie et al., 2016), but are predicted to emerge as soon as the 2030’s and 2040’s (Hauri et al., 2013). However, undersaturation can occur over the benthos on the shelf (Kekuewa et al., 2022). Importantly, we perform an analysis of the sensitivity of our findings to the choice of along this range of 1.0 to 1.4 and find the results to be largely in sensitive within this range (see Supplementary material for further details).
For the effects of subsurface O2 loss on aerobic habitat capacity, we calculate the vertical thickness of the water column that has sufficient O2 to provide ecological support for northern anchovy (Engraulis mordax). Northern anchovy is also holoplanktonic with greatest abundance observed in the upper 100 m (Mais, 1974). Defining sufficient O2 for ecological support relies on the mechanistic framework of the Metabolic Index [ (Deutsch et al., 2015, 2020)]. is defined as the ratio of O2 supply to resting demand. We calculate the habitat thickness for which Phi/PhiCRIT ≥ 1; this value demarcates environment's in which anchovy can sustain active energetic demands. In contrast, values below one can sustain resting but not active energetic demands, limiting population persistence. For northern anchovy, metabolic traits have been inferred from observational datasets associated with climatological O2 and temperature conditions (Howard et al., 2020). Similarly, we evaluate a lethal threshold for northern anchovy, where and O2 supply is insufficient to meet O2 demand. This latter analysis converts the reported active hypoxia threshold to the value at rest using , the mean value across marine organisms (Deutsch et al., 2020); some species have as low as 1.5, in which case the lethal thresholds could occur at proportionately higher values of O2 and thus at shallower depths.
We utilize biogeochemical output from the Regional Ocean Modeling System, ROMS (Shchepetkin and McWilliams, 2005), coupled to the Biogeochemical Elemental Cycling model, BEC (Moore et al., 2004), which has been adapted for the CCS (Deutsch et al., 2021; Renault et al., 2021). BEC is a multi-element (C, N, P, O, Fe, and Si) and multi-plankton model that includes three explicit phytoplankton functional groups (picoplankton, silicifying diatoms, and N-fixing diazotrophs), one zooplankton group, and dissolved and sinking organic detritus. Remineralization of sinking organic material follows the multi-phase mineral ballast parameterization of Armstrong et al. (2001), and sedimentary processes have also been expanded. Particulate organic matter reaching the sediment is accumulated and remineralized with a time scale of 330 days, to provide a buffer between particle deposition and nutrient release. The ecosystem is linked to a carbon system module that tracks dissolved inorganic carbon and alkalinity, and an air–sea gas exchange module based on the formulation of Wanninkhof (1992).
The SCB model domain, which extends from Tijuana Mexico to Pismo Beach (U.S. Central California coast) and about 200-km offshore, is part of a nested configuration. Model nests scale from a 4-km horizontal resolution configuration spanning the entire CCS, to a 1-km resolution grid covering much of the California coast, to a 0.3-km grid in the SCB, where our investigations of local anthropogenic inputs were focused (Kessouri et al., 2021a, b). This grid, shown in Figure 1A, is composed of 1,400 × 600 grid points, with 60 σ-coordinate vertical levels using the stretching function described in Shchepetkin and McWilliams (Shchepetkin and McWilliams, 2005). The model is run with a time step of 30 s, and outputs are saved as 1-day averages. More information on the model setup and forcing is provided in other works (Deutsch et al., 2021; Renault et al., 2021; Kessouri et al., 2021a).
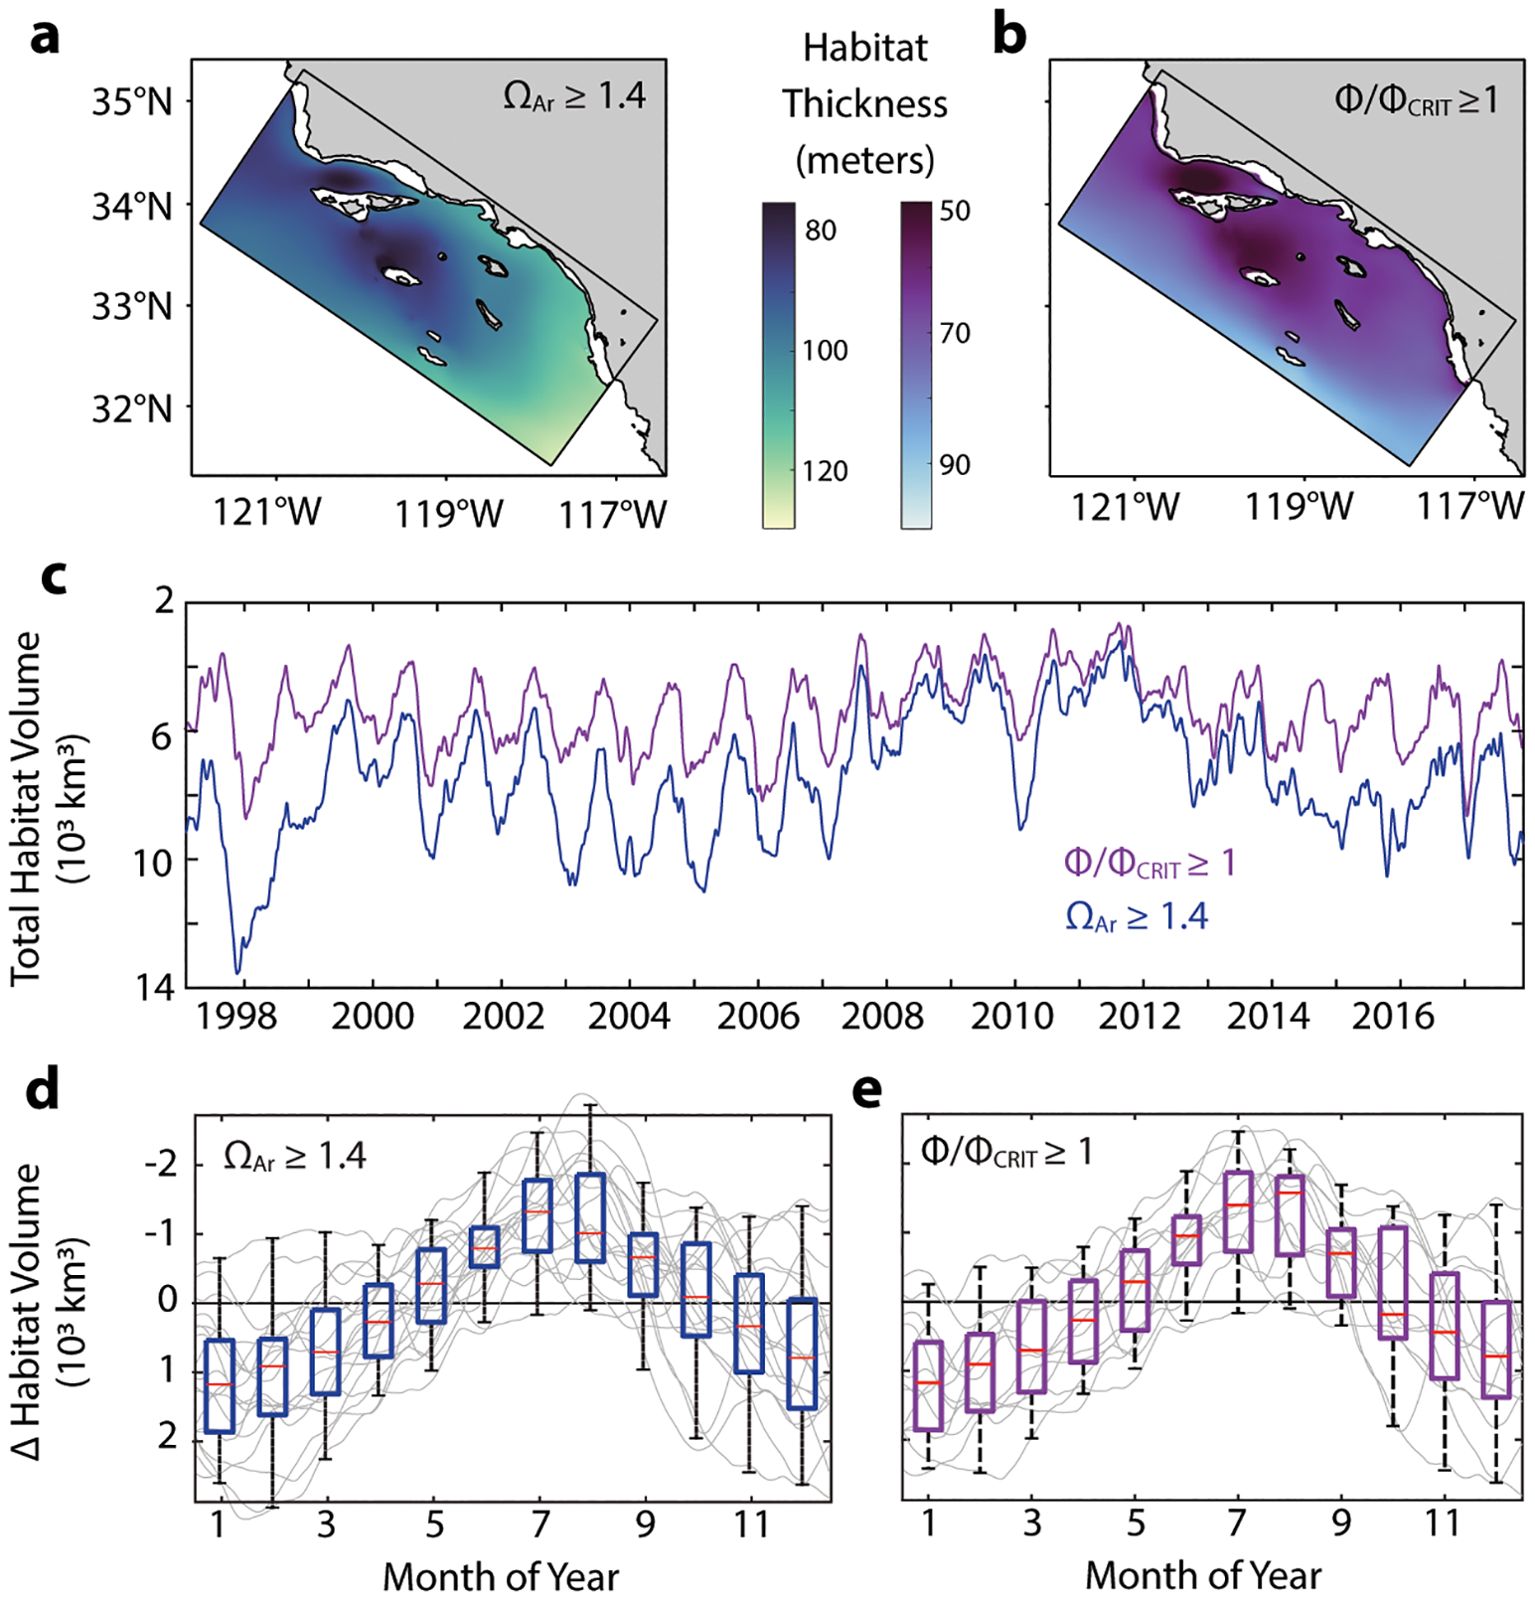
Figure 1. Spatial and temporal patterns in habitat thickness for aerobic and calcifier habitat metrics as assessed from model output from the ANTH scenario. (A, B) Spatial distribution of mean habitat thickness (m) for each biological metric. Coastline and 200-m bathymetric contours (black) shown. Locations within the domain where habitat thickness interacts with seafloor not included. (C) Time-series of total habitat volume (103 km3) summed across the model domain for (blue) and Φ/Φ (purple). Model output is daily with a two-week running mean applied. (D, E) Seasonal trend in habitat volume for each biological metric. Each annual time-series is detrended with the annual mean (light grey). Box plots (median in red, 25th and 75th percentiles indicated by the bounded box, minimum and maximum as whiskers) for the average monthly values from the annually detrended time series shown (n = 18 years). Y-axes are oriented so that a decrease in habitat volume is upwards and an increase in habitat volume is downwards.
ROMS-BEC has been validated for atmospheric forcing, physics, and biogeochemistry including O2, carbonate saturation state, primary productivity, and hydrographic parameters at a West Coast-wide scale (Deutsch et al., 2021) and, within the SCB, at scales at which anthropogenic nutrient inputs influence coastal eutrophication (Kessouri et al., 2021a).
We rely on two model scenarios. The first includes natural oceanic cycles of nutrients, carbon and oxygen cycles without terrestrial inputs (CTRL). The ocean carbon cycle includes the rising CO2 signature from global observations. The second represents these same CTRL base conditions, to which inputs from terrestrial sources are added, 98% of which are anthropogenic and 95% of which are point source in origin (ANTH) (Sutula et al., 2021). Model simulations that include terrestrial inputs were forced with a monthly time series of spatially explicit inputs, including freshwater flow, nitrogen, phosphorus, silica, iron, and organic carbon representing natural and anthropogenic sources (Sutula et al., 2021). These data include ocean outfalls originating from Publicly Owned Treatment Works (POTW) and riverine discharges (1997–2017) and spatially explicit modeled estimates of atmospheric deposition. POTW effluent data were compiled from permit monitoring databases and communication with sanitary agencies. Monthly time series of surface water runoff from 75 rivers are derived from model simulations and monitoring data (Sutula et al., 2021). The model domain includes the U.S.-Mexico border and the simulations include not only U.S. land-based nutrient inputs but also Mexico transboundary flows from the Tijuana River watershed. The CTRL simulation covers the time periods of 02/1997 – 01/2001 and 08/2012 – 11/2017. The ANTH simulation covers the time period of 02/1997 – 11/2017. The overlapping time periods available for comparison between CTRL and ANTH represent a broad range of multi-year oceanographic conditions and climatic states.
Aragonite saturation state was computed with the CO2SYS algorithms (Lewis et al., 1998; Sharp et al., 2020) using daily averages of model output fields of dissolved inorganic carbon (DIC), total alkalinity (TA), temperature, salinity, and pressure. Calcifier habitat thickness was calculated as the thickness of the water column for each grid cell that was ≥ optimal (1.4) for pteropods.
The ecological Metabolic Index was computed from daily averages of model output fields of O2 and temperature.
The metabolic traits of northern anchovy are esimated as atm-1 (equivalent to an active hypoxia threshold of atm at 15°C) and eV (the net temperature sensitivity of O2 supply and demand) (Howard et al., 2020). is the environmental partial pressure of O2 and T is temperature (in K). is the Boltzmann constant and is the reference temperature (here, 288.15 K). Aerobic habitat thickness was calculated as the thickness of the water column where . An active hypoxia threshold of 0.185 atm O2 at 15°C is equivalent to a saturation state of 88.5% and a concentration of 219 µmol kg-1 (calculated at 15°C, S=35 [pss-78], and 0 dB gauge pressure). However, we note that organismal physiology is thought to be insensitive to the concentration of oxygen. Converting the above reference value to an in-situ concentration requires correction for local temperature and salinity, which vary over space and time. Thus, two different concentrations could refer to the same , with no expected impact on physiological hypoxia, and vice versa.
Spatial and temporal patterns in calcifier and aerobic habitat thickness were evaluated with the ANTH simulation to identify the dominant spatial and temporal scales of variability in each. Total calcifier and aerobic habitat for the model domain was summed across all grid cells as the habitat thickness within a grid cell multiplied by the area of that grid cell.
To then evaluate how anthropogenic nutrient inputs alter calcifier and aerobic habitat thickness, we perform a difference assessment (ANTH-CTRL) where positive (negative) values represent an expansion (contraction) of habitat thickness attributable to anthropogenic nutrient inputs included in the ANTH scenario only. We focus further analyses in regions where differences in habitat thickness exceed ± 20%. We include a few sensitivity tests to some of the analytical choices. (1) To test the sensitivity of calcifier habitat capacity to the value of , we evaluate habitat thickness for . (2) We also calculate the change in water-column thickness for a range of [O2] from 60 – 200+ mmol m-3. (3) Since northern anchovy, our species of focus for aerobic habitat, has its own temperature and oxygen sensitivity, we also explore how modeled aerobic habitat is changing for a range of temperature and oxygen sensitivities. We do this by estimating the aerobic habitat for both the ANTH and CTRL scenarios for the full combination of metabolic trait possibilities ( and ). The full range of traits and their probability distribution among species have been previously compiled (Penn and Deutsch, 2022). For each metabolic trait combination, available aerobic habitat is calculated as the volume of seawater where temperature and oxygen conditions translate to an ecological Metabolic Index between 1 and 1.6 (Penn and Deutsch, 2024). The change in aerobic habitat between the scenarios is derived as the difference between ANTH and CTRL. This change is then multiplied by the probability distribution of metabolic traits across species (Supplementary Figure S1). The result is a distribution of aerobic habitat change across species. This approach assumes that the distribution of metabolic traits from the global-scale database corresponds with those in the California Current Ecosystem. We check this assumption by comparing the biogeographically inferred distribution of metabolic traits with that of respirometry-derived traits of those species found in the Southern California Bight and find that the two are indistinguishable (Supplementary Figure S1).
For regions undergoing more than a ± 20% change in habitat thickness, we evaluate the difference in the biogeochemical rate processes from each scenario [detailed methods provided in Deutsch et al. (2021) and Kessouri (2024)]. Biogeochemical rate processes that influence the O2 cycle include surface air-sea flux, photosynthesis, non-grazing mortality, grazing mortality, water-column remineralization, sediment-water flux, NH4 oxidation, and nitrification [Equation A9 in Deutsch et al. (2021)]. Biogeochemical rate processes that influence dissolved inorganic carbon include air-sea flux, photosynthesis, CaCO3 production, non-grazing mortality, grazing mortality, and water-column and sediment remineralization [Equation A11 in Deutsch et al. (2021)]. We perform a difference assessment from the monthly averages for the sum of the biogeochemical process terms. This analysis is focused between 70 and 140-m water depth to align with the depth range where habitat thickness is affected.
3 Results
For both habitat metrics, there are consistent Bight-wide spatial and temporal patterns (Figures 1A–E), with calcifier habitat thickness greater than anchovy aerobic habitat thickness. Calcifier habitat thickness ranges from, on average, 80 to 130 m. Anchovy aerobic habitat thickness ranges, on average, from 50 to 100 m. Both habitat thickness metrics are most restricted within the Santa Barbara Channel and around San Nicolas Island. Increases generally occur along north-to-south and onshore-to-offshore gradients.
The dominant temporal scale of calcifier and anchovy aerobic habitat capacity are inter-annual and seasonal (Figures 1C–E). The temporal mean (across all years and seasons) of total calcifier and anchovy aerobic habitat volumes are 8.2 and 5.4 x 10³ km3, respectively, summed across the model domain. Among years, total volume for each metric can vary approximately 2-fold. In 2011, calcifier and anchovy aerobic habitat volumes were most restricted at 4.2 and 3.6 x 10³ km3; in 1998, habitat volumes were most expansive at 10.2 and 6.2 x 10³ km3, respectively. Seasonal variability also drives approximately 2-fold changes in habitat volumes. An evaluation of the annually detrended time series for both metrics shows that total habitat volumes are greatest during winter months and contract during summer, with the least amount of total habitat available during July and August (Figures 1D, E). Since anchovy aerobic habitat is constrained by both temperature and O2, attribution analysis reveals that O2 is the primary contributor to seasonal trends in total habitat volume, and that seasonal changes in aerobic habitat due to temperature counteract those changes due to that of O2 (Supplementary Figure S2).
There is not a consistent tendency for land-based nutrient inputs to result in consistent or persistent Bight-wide calcifier and aerobic habitat capacity gains or losses (Supplementary Figure S3). The relative, Bight-wide differences in total habitat volume vary by ± 5% for most of the period simulated. However, at any grid cell location, the difference in calcifier habitat thickness between ANTH and CTRL can range from −34 to + 45%, and that for anchovy aerobic habitat ranges from −43 to + 80% (1st and 99th percentiles, respectively).
A spatial perspective of the change in calcifier and anchovy aerobic habitat thickness reveals a region of habitat loss that is expressed southeast of Santa Catalina Island (Supplementary Figure S3). This region of habitat loss is a seasonal phenomenon. In seven of the nine years simulated, there is a compression event lasting approximately 2.5 months that occurs in the late summer to early fall (Figures 2C, D), a time period when calcifier and anchovy aerobic habitat thickness are already seasonally compressed (Figures 1D, E). Averaging across these seven compression events, the total spatial area experiencing recurrent calcifier habitat change is 2,364 km2 (assessed as the total spatial area where the compression in calcifier habitat thickness > 20%; Figure 2A) The equivalent total spatial area experiencing recurrent anchovy aerobic habitat change is 1,909 km2 (Figure 2B). Despite the temporal overlap in natural seasonal and eutrophication-driven compression, there is spatial mismatch between the regions undergoing maximum habitat compression due to eutrophication with those that are naturally most restricted from broad-scale oceanographic patterns (e.g., Santa Barbara Channel; Figures 1A, B).
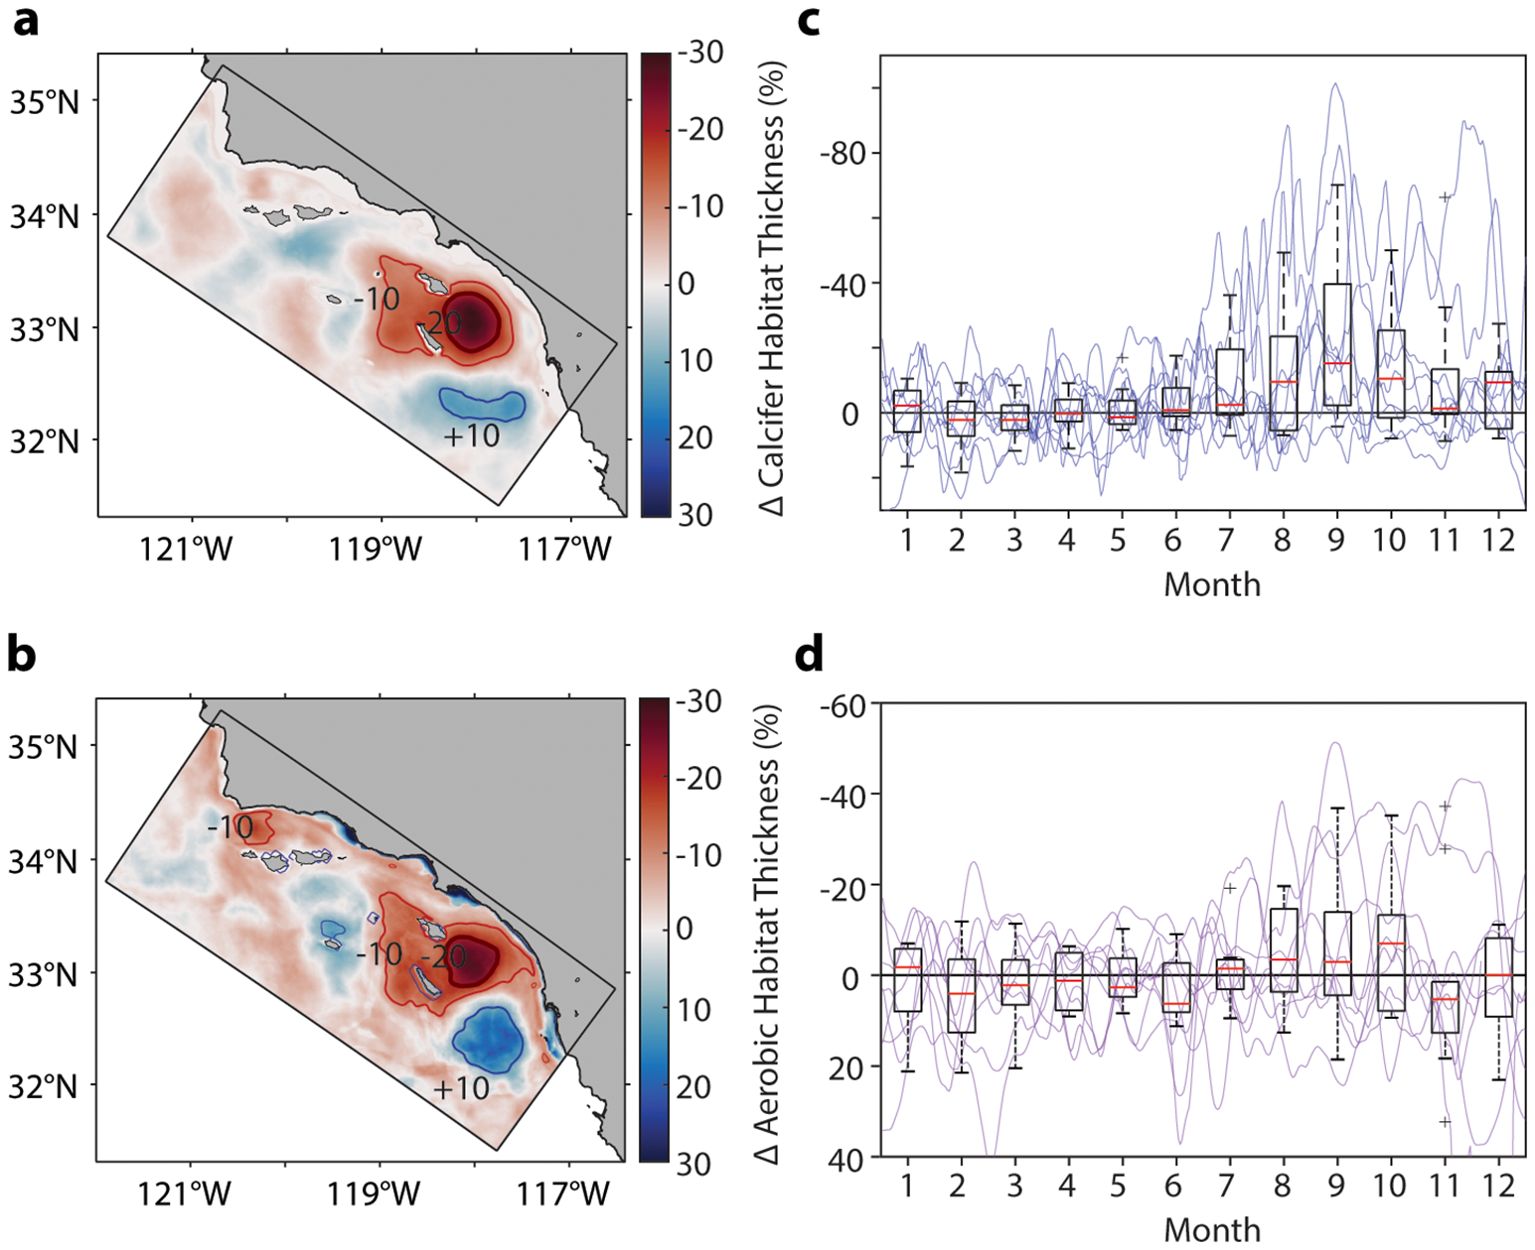
Figure 2. (A, B) Spatial distribution of the percent change in habitat thickness for Ω and Φ/Φ between ANTH and CTRL (from average monthly output during time periods of maximum habitat loss, n = 7 events). Thin contours show regions undergoing -10 and +10% change in habitat thickness (red and blue, respectively). Thick red contour shows region experiencing more than -20% change in habitat thickness. (C, D) Seasonal trend of habitat compression within the region undergoing 20% loss in habitat thickness per metric [as contoured in (A, B)]. Individual years (thin lines; n = 9) and box plots of mean monthly percent change in habitat thickness. Y-axes are oriented so that a compression in habitat thickness is upwards and an expansion in habitat thickness is downwards relative to zero.
Anchovy represent one ecophysiotype in a range of metabolic trait possibilities. The region of > 20% habitat compression for anchovy does not translate equally across all species (Figure 3A). In this region, ecophysiotypes with higher hypoxia tolerance gain aerobic habitat volume; while those with lower hypoxia tolerance, including anchovy, lose aerobic habitat volume. Taking a species-weighted distribution of metabolic trait possibilities, approximately two-thirds of species are losing aerobic habitat volume, and the modeled losses can be up to three times greater than the gains (Figure 3B). Of those subjected to aerobic habitat loss, 70% of species are subject to more habitat loss than northern anchovy. Species that are gaining aerobic habitat volume have higher hypoxia tolerance at any given temperature sensitivity (; Figure 3A).
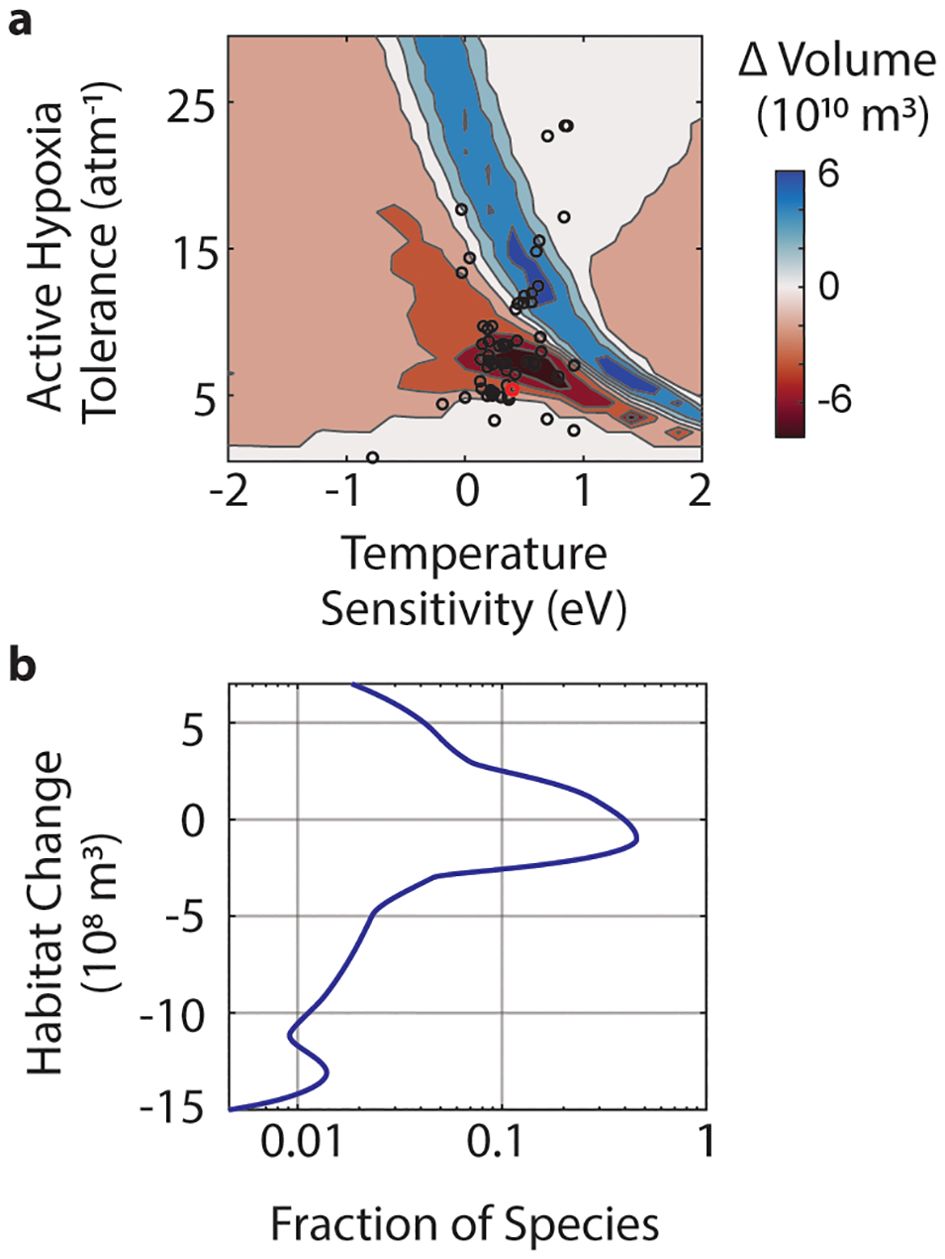
Figure 3. (A) Change in aerobic habitat from land-based nutrient inputs for varied marine ecophysiotypes. The range of Active Hypoxia Tolerance, , and temperature sensitivity, , evaluated are based on a global species trait compilation; empirically derived species traits are marked with black circles, northern anchovy is marked with a red circle. Change in aerobic habitat volume assessed for the upper 200 m in the region undergoing 20% habitat compression (see Figure 2 for region of focus) from months exhibiting maximum compression in the fall (n = 7) due to land-based nutrient inputs. (B) Fitted distribution of the fraction of species (log scale) undergoing trait-weighted volume changes in aerobic habitat. The change in habitat volume weighted by the probability distribution of the empirical traits (Penn and Deutsch, 2022).
The spatial and vertical distribution of greatest O2 change is occurring between approximately 40 and 100 km from the coast and between 50 and 150 meters or more below the surface (Figures 4A, C). The same pattern is observed for acidification, assessed as the difference in between the two scenarios (Figure 4B). The lower limit of anchovy aerobic habitat coincides in space with the region of maximum O2 loss. In the CTRL scenario, the anchovy aerobic habitat limit is at 80 m in the offshore region of maximum O2 loss (60 km from the coast), and shoals to 60 m in the ANTH scenario. In contrast, the lower limit for calcifier habitat is deeper than the vertical region undergoing maximum acidification. Still, calcifier habitat shoals from approximately 115 m in the CTRL scenario to 87 m in the ANTH scenario. Because both subsurface acidification and O2 loss occur across a broad depth range, our results are largely insensitive to which value of is used to define optimal calcifier habitat (Supplementary Figure S4). Similarly, loss of O2 is occurring across a broad depth range (Supplementary Figure S5). Notably, these changes to habitat capacity in the epipelagic are largely limited to sublethal effects as conditions that trigger acute lethal effects occur deeper in the water column. Conditions where are less than 1 occur, on average, deeper than 200 m water depth (Supplementary Figure S4). Similarly, acute lethal O2 conditions for northern anchovy occurs, on average, much deeper than 300 m water depth, well below the typically observed vertical distributions of anchovy and other pelagic fishes.
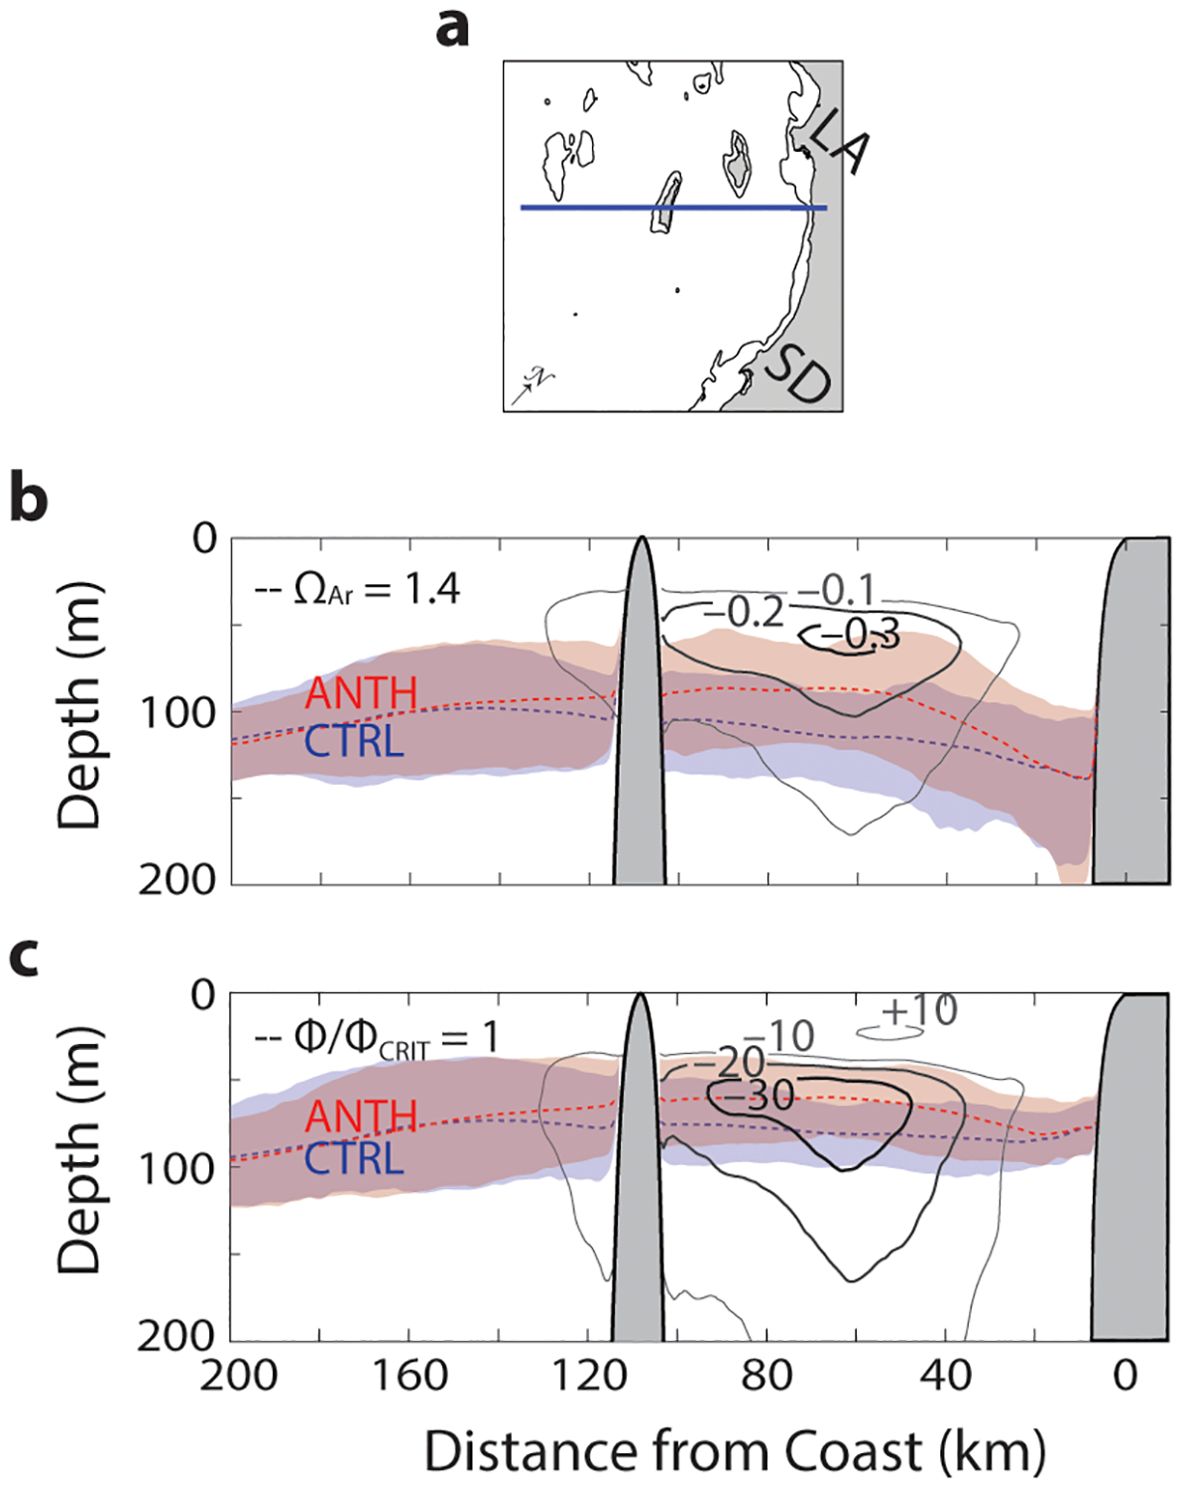
Figure 4. (A) Map of cross-section extending from the coast to 200 km offshore and intersected by San Nicolas Island. Coastline, Los Angeles (LA), San Diego (SD), and 200-m bathymetric contour shown. (B) Cross-section of mean absolute difference (contours) in Ω between the two simulations (ANTH-CTRL) from months exhibiting maximum compression in the fall (n = 7). The mean depth of Ω in the CTRL (blue dashed line) and ANTH (red dashed line) scenario along with 10th and 90th percentiles (shaded blue and red regions, respectively) shown. (C) Same as in (B) but contours are the absolute difference in O2 (mmol m-3) between ANTH and CTRL overlayed with the mean lower depth limit of Φ/Φ.
Of the biogeochemical rate processes contributing to habitat change within the region of 20% habitat compression, remineralization rates are exhibiting the greatest absolute change due to land-based nutrient inputs (Figure 5). For the carbon cycle, remineralization rates increase from 4.26 ± 0.12 to 4.50 ± 0.12 mmol DIC m-3 d-1 from the CTRL to the ANTH scenario (mean ± 1 SE; N = 104 months). The increase in DIC from land-based nutrient inputs at the core of habitat compression drives the modeled decrease in . Small changes in alkalinity (< 5 mmol m-3) counteract the effects due to DIC (Supplementary Figure S5). For the O2 cycle, remineralization rates are also exhibiting the greatest change due to land-based nutrient inputs, changing from −5.44 ± 0.15 to −5.75 ± 0.15 mmol O2 m-3 d-1 from CTRL to ANTH (mean ± 1 SE; N = 104 months).
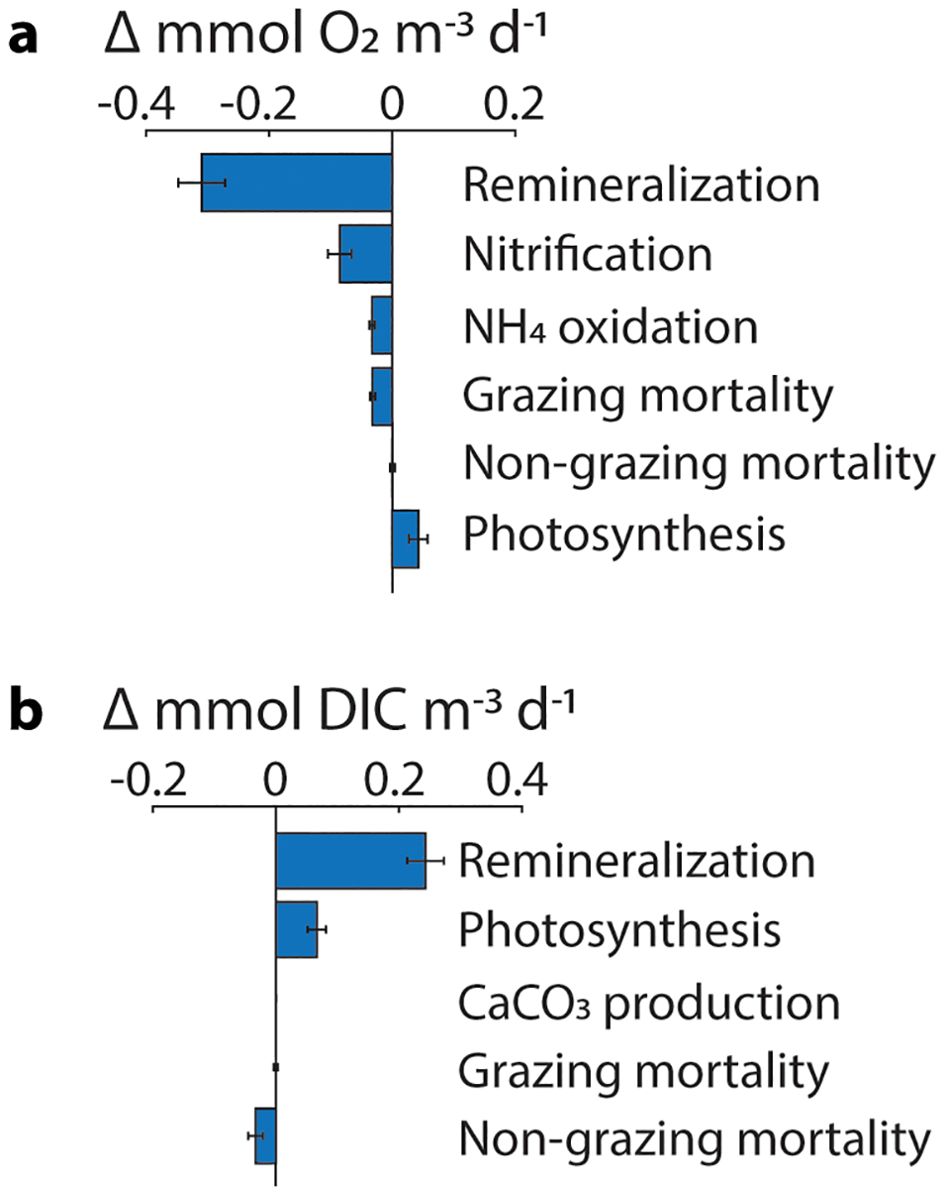
Figure 5. Absolute difference in the biogeochemical rate processes that contribute to the (A) O2 and (B) dissolved inorganic C (DIC) cycles between the ANTH and CTRL scenarios. Rates are monthly averages from within the region of 20% habitat compression (Figure 2A) averaged from 70 to 140-m water depth (n = 104 months; mean ± 1 SE).
4 Discussion
Here, we demonstrate that eutrophication effects of land-based nutrient export to the Southern California Bight are not restricted to chemical changes in seawater acidification and O2 loss (Kessouri, 2024), but also extend to the potential for widespread (biotic and ecological) effects on calcifier and aerobic habitat capacity. The seawater chemistry changes that occur in the epipelagic are not at levels that elicit acute, lethal effects. Rather, the sublethal habitat capacity metrics used here exhibit annually recurring compression despite large, natural seasonal and interannual cycles (Figure 1). During the late summer, subsurface acidification and O2 loss (from land-based nutrient export) routinely compress aerobic and calcifier habitat capacity (Figure 2), at a time period when habitat capacity is already seasonally compressed (Figure 1). Modeled habitat compression is most pronounced where excess nutrients and organic matter, which originate at the coast, are received and entrained within offshore eddies (Kessouri, 2024). These locations occur in both state and federal waters and overlap with many marine protected areas, including those around Santa Barbara Island, Santa Catalina Island, and San Clemente Island. Since seawater chemistry changes due to enhanced remineralization are occurring across a large depth range, patterns in habitat compression are largely insensitive to the value of used to define the calcifier habitat capacity metric (Supplementary Figure S4). Similarly, while we evaluate aerobic habitat capacity for northern anchovy, we confirm that this pattern is consistent among two thirds of ecophysiotypes (although at differing magnitudes of habitat loss), and that those species gaining aerobic habitat volume have higher tolerances to low O2 (Figure 3).
There is field-based evidence that the vertical structure of both and O2 have implications for a variety of pelagic taxa. For example, across frontal gradients in the California Current System where between 1.0 and 1.4 can shoal by 100+ m on the scale of tens of kms, there are concurrent reductions in pteropod abundance accompanied by elevated shell dissolution (Bednaršek and Ohman, 2015). From onshore-to-offshore gradients, more severe pteropod shell dissolution and thinner shells occur close to the coast, particularly where upwelling is more intense (Feely et al., 2016; Mekkes et al., 2021). The predicted habitat compression described here coincides with the natural seasonal cycle of limited habitat availability. Multiple species of pteropods, including Limacina helicina, are present year-round in the SCB (K. McLaughlin, pers. comm.). While limited baseline information on pteropod life history characteristics exist for the Southern California Bight (Manno et al., 2017), studies suggested that spring (April-May) and fall (September-October) are periods when early life stage cohorts are most vulnerable to changing ocean conditions (Gannefors et al., 2005; Wang, 2014; Wang et al., 2017).
Ocean O2 depletion adversely impacts marine species, assemblages, and even fisheries (Laffoley and Baxter, 2019). Long-term deoxygenation trends play a role in, for example, declines in abundance of mesopelagic fishes (Koslow et al., 2011) and shifts in zooplankton and small nekton diel migration depth (Bianchi et al., 2013). Interactive effects of sub-optimal O2 and temperature are becoming increasingly considered (Roman et al., 2019). Sub-optimal O2 stress depends on the O2 supply relative to metabolic demand, and water temperature controls both chemical (O2 solubility, diffusivity) and physiological processes (metabolic demand, ventilations rates) affecting this balance for marine ectotherms. We use the mechanistic framework of the Metabolic Index (Deutsch et al., 2015) to incorporate these dependencies into the index of aerobic habitat capacity. Specific to our focal taxa, northern anchovy have seasonal to interdecadal redistributions that correlate with aerobic habitat capacity. For example, anchovy migrate offshore during peak upwelling seasons (Mais, 1974; Laroche and Richardson, 1980), when nearshore aerobic habitat availability is lowest, even though their food supply is generally higher closer to the coast (Howard et al., 2020). Further, the southern biogeographic limit of this species is coincident with the aerobic habitat capacity threshold implied by their oscillations in time within the SCB, and vice versa (Howard et al., 2020). While reductions in this index are associated with species-specific consequences of deoxygenation at the regional scale, it remains unclear how the spatial and seasonal extent of the O2 reduction identified here might translate to disruptions across species of varying phenologies, mobility, and ecological niches. The same can be said for the population-level consequences of subsurface acidification.
We evaluate O2 loss and acidification effects on habitat capacity separately, as the combined effects of these stressors on biological responses are insufficiently understood (Bednaršek et al., 2020). However, studies suggest that exposure to suboptimal ranges of acidification, O2, and temperature can make marine organisms more sensitive to O2 loss (Breitburg et al., 2019) or less resilient to acidification (Stevens and Gobler, 2018). In this model domain, there is strong covariance between calcifier and aerobic habitat thickness (Pearson correlation coefficient = 0.79), linked to eutrophication effects on water-column remineralization, such that aerobic and calcifier habitat compress at the same time. Thus, predicted effects on habitat capacity for marine species may be underestimated (Bednaršek et al., 2020). The Metabolic Index framework does incorporate the combined effects of temperature and O2. Biological sensitivities to all three variables – temperature, O2, and carbonate system state – could potentially be merged through a fundamental physiological trait such as aerobic scope [i.e., a proxy for the surplus energy available for growth, reproduction, predator avoidance, etc.; en sensu Sokolova (2021)].
While we emphasize subsurface losses in pelagic habitat capacity, changes to subsurface biogeochemistry will also intersect with the complex seafloor topography of the Southern California Bight. We have yet to evaluate how anthropogenic nutrient loads are altering habitat availability for demersal organisms, particularly those that have limited mobility. Another consideration to be further explored is the enhanced productivity and food supply from anthropogenic nutrient loads. Increased food supply could potentially reduce the negative consequences of suboptimal O2 and acidification (Breitburg et al., 2009; de Mutsert et al., 2016). As an example, total fisheries landings can remain high even if demersal species in depleted areas decline, because nutrients can stimulate prey production in other well-mixed parts of a system (Breitburg et al., 2009; Nixon and Buckley, 2002). Abundant prey can improve stress tolerance of organisms (Marigomez et al., 2017). However, system-wide compensation through enhanced productivity will have limits as the volume of O2- depleted waters expand (Breitburg, 2002). The catch per unit effort for selected demersal fish species along the U.S. West Coast is positively related to near-bottom O2 concentrations, with the catch per unit effort decreasing more significantly as O2 concentrations decrease (Keller et al., 2015). In the Humboldt Current, it is suggested that low O2 near the coast results in a highly efficient trophic transfer and a dense anchovy population (Bertrand et al., 2011), which is beneficial for fishing activities. During these conditions, species that are less tolerant to low O2, like sardine and jack mackerel, are restricted to offshore, well-oxygenated waters (Alegre et al., 2015; Bertrand et al., 2016).
Global climate change will further exacerbate habitat loss resulting from land-based nutrient inputs (Kessouri et al., 2021b). Strengthened stratification, from increased surface water temperatures as the global climate warms, is sufficient to worsen subsurface O2 and acidification where it currently exists and may instigate habitat loss elsewhere (Long et al., 2019). Warming and O2 loss by 2100 are projected to result in complete loss of aerobic habitat for northern anchovy – and thus likely extirpation – from the southern California Current System (CCS) (Howard et al., 2020). Further, the interplay of anthropogenic nutrient export and stratification where they occur could accelerate the timeline of habitat compression and potential extirpation. In this study, O2 loss in the core of habitat compression exceeds 30 µmol kg-1 (Figure 4C). This loss due to eutrophication is 1.5 times the scale of decadal O2 loss in the southern CCS which may be occurring at around 20 µmol kg-1 decade-1 (Bograd et al., 2008). Acidification in the same eutrophication-induced core exceeds −0.3 units for , and this decrease due to eutrophication is three times the decadal trend of approximately −0.1 decade-1 (Leinweber and Gruber, 2013; Turi et al., 2016).
To conclude, we assess change in habitat capacity for pelagic calcifying and aerobic taxa due to eutrophication effects on subsurface acidification and O2 loss from land-based nutrients. Our findings suggest that effects of land-based nutrients are not restricted to chemistry. Changes to habitat capacity defined by sublethal, ecologically relevant thresholds were pervasive during late summer, when habitat capacity is at its seasonal minimum. Despite the theoretical, experimental, and field evidence that identify the importance of the vertical structure of both carbonate chemistry and O2 for marine pelagic communities, whether the modeled habitat compression shown here translate to population-level effects is uncertain. Species abundance and distributional data from existing monitoring programs, like the California Cooperative Oceanic Fisheries Investigations and the Southern California Bight Regional Monitoring Program, could be assessed through the lens of eutrophication-driven habitat compression predicted here. These same monitoring programs are developing and implementing biological metrics for acidification. Coupling region-wide modeling with experimental and field programs will be a robust foundation for study of highly urbanized coastlines.
Data availability statement
Due to size of outputs, model outputs are available from the authors upon request. Requests to access these datasets should be directed to FK, ZmF5Y2Fsa0BzY2N3cnAub3Jn; CF, Y2hyaXN0aW5hZkBzY2N3cnAub3Jn.
Author contributions
CF: Conceptualization, Formal analysis, Methodology, Visualization, Writing – original draft, Writing – review & editing. FK: Conceptualization, Formal analysis, Methodology, Writing – original draft, Writing – review & editing. MH: Methodology, Writing – review & editing. MS: Conceptualization, Funding acquisition, Project administration, Writing – original draft, Writing – review & editing. DB: Conceptualization, Project administration, Writing – review & editing. JM: Conceptualization, Funding acquisition, Writing – review & editing. CD: Conceptualization, Funding acquisition, Writing – review & editing. EH: Conceptualization, Formal analysis, Visualization, Writing – review & editing.
Funding
The author(s) declare financial support was received for the research, authorship, and/or publication of this article. This research was supported by NOAA grants NA15NOS4780186, NA18NOS4780174, and NA18NOS4780167 (Coastal Hypoxia Research Program), the California Ocean Protection Council grant C0100400NSF, C0831014, and C0303000 (administered by California SeaGrant as R/OPCOAH-1), the NSF grants OCE-1419323 and OCE-1419450, and the Cooperative Institute for Climate, Ocean, & Ecosystem Studies (CICOES) under NOAA Cooperative Agreement NA20OAR4320271, Contribution No. 2024-1406. This work used the Expanse system at the San Diego Supercomputer Center through allocation TG-OCE170017 from the Advanced Cyber Infrastructure Coordination Ecosystem: Serves and Support (ACCESS) program, which is supported by National Science Foundation grants 2138259, 2138286, 2138307, 2137603, and 2138296. Additional computational resources were provided by the Hoffman2 computer cluster at the University of California Los Angeles, Institute for Digital Research and Education (IDRE). Data and code needed to run the ROMS-BEC simulations are available following the link: https://github.com/UCLA-ROMS/Code.
Conflict of interest
The authors declare that the research was conducted in the absence of any commercial or financial relationships that could be construed as a potential conflict of interest.
Publisher’s note
All claims expressed in this article are solely those of the authors and do not necessarily represent those of their affiliated organizations, or those of the publisher, the editors and the reviewers. Any product that may be evaluated in this article, or claim that may be made by its manufacturer, is not guaranteed or endorsed by the publisher.
Supplementary material
The Supplementary Material for this article can be found online at: https://www.frontiersin.org/articles/10.3389/fmars.2024.1392671/full#supplementary-material
References
Alegre A., Bertrand A., Espino M., Espinoza P., Dioses T., Niquen M., et al. (2015). Diet diversity of jack and chub mackerels and ecosystem changes in the northern Humboldt Current system: A long-term study. Prog. Oceanography 137, 299–313. doi: 10.1016/j.pocean.2015.07.010
Armstrong J. L., Boldt J. L., Cross A. D., Moss J. H., Davis N. D., Myers K. W., et al. (2005). Distribution, size, and interannual, seasonal and diel food habits of northern Gulf of Alaska juvenile pink salmon, Oncorhynchus gorbuscha. Deep Sea Res. Part II: Topical Stud. Oceanography 52, 247–265. doi: 10.1016/j.dsr2.2004.09.019
Armstrong R. A., Lee C., Hedges J. I., Honjo S., Wakeham S. G. (2001). A new, mechanistic model for organic carbon fluxes in the ocean based on the quantitative association of POC with ballast minerals. Deep Sea Res. Part II: Topical Stud. Oceanography 49, 219–236. doi: 10.1016/S0967-0645(01)00101-1
Aydin K. Y., McFarlane G. A., King J. R., Megrey B. A., Myers K. W. (2005). Linking oceanic food webs to coastal production and growth rates of Pacific salmon (Oncorhynchus spp.), using models on three scales. Deep Sea Res. Part II: Topical Stud. Oceanography 52, 757–780. doi: 10.1016/j.dsr2.2004.12.017
Bednaršek N., Ambrose R., Calosi P., Childers R. K., Feely R. A., Litvin S. Y., et al. (2021a). Synthesis of thresholds of ocean acidification impacts on decapods. Front. Mar. Sci. 8, 651102. doi: 10.3389/fmars.2021.651102
Bednaršek N., Calosi P., Feely R. A., Ambrose R., Byrne M., Chan K. Y. K., et al. (2021b). Synthesis of thresholds of ocean acidification impacts on echinoderms. Front. Mar. Sci. 8, 602601. doi: 10.3389/fmars.2021.602601
Bednaršek N., Feely R. A., Howes E. L., Hunt B. P., Kessouri F., León P., et al. (2019). Systematic review and meta-analysis toward synthesis of thresholds of ocean acidification impacts on calcifying pteropods and interactions with warming. Front. Mar. Sci. 6, 227. doi: 10.3389/fmars.2019.00227
Bednaršek N., Ohman M. (2015). Changes in pteropod distributions and shell dissolution across a frontal system in the California Current System. Mar. Ecol. Prog. Ser. 523, 93–103. doi: 10.3354/meps11199
Bednaršek N., Pelletier G., Ahmed A., Feely R. A. (2020). Chemical exposure due to anthropogenic ocean acidification increases risks for estuarine calcifiers in the Salish Sea: Biogeochemical model scenarios. Front. Mar. Sci. 7, 580. doi: 10.3389/fmars.2020.00580
Bertrand A., Chaigneau A., Peraltilla S., Ledesma J., Graco M., Monetti F., et al. (2011). Oxygen: a fundamental property regulating pelagic ecosystem structure in the coastal southeastern tropical Pacific. PLoS One 6, e29558. doi: 10.1371/journal.pone.0029558
Bertrand A., Habasque J., Hattab T., Hintzen N. T., Oliveros-Ramos R., Gutiérrez M., et al. (2016). 3-d habitat suitability of jack mackerel Trachurus murphyi in the Southeastern Pacific, a comprehensive study. Prog. Oceanography 146, 199–211. doi: 10.1016/j.pocean.2016.07.002
Bianchi D., Galbraith E. D., Carozza D. A., Mislan K., Stock C. A. (2013). Intensification of open-ocean oxygen depletion by vertically migrating animals. Nat. Geosci. 6, 545–548. doi: 10.1038/ngeo1837
Bograd S. J., Castro C. G., Di Lorenzo E., Palacios D. M., Bailey H., Gilly W., et al. (2008). Oxygen declines and the shoaling of the hypoxic boundary in the California Current. Geophysical Res. Lett. 35, L12607. doi: 10.1029/2008GL034185
Breitburg D. (2002). Effects of hypoxia, and the balance between hypoxia and enrichment, on coastal fishes and fisheries. Estuaries 25, 767–781. doi: 10.1007/BF02804904
Breitburg D. L., Baumann H., Sokolova I. M., Frieder C. A. (2019). “Multiple stressors–forces that combine to worsen deoxygenation and its effects,” in Ocean deoxygenation: everyone’s problem. Causes, impacts, consequences and solutions. Eds. Laffoley D., Baxter J. M. (Gland, Switzerland: International Union for Conservation of Nature and Natural Resources).
Breitburg D. L., Hondorp D. W., Davias L. A., Diaz R. J. (2009). Hypoxia, nitrogen, and fisheries: integrating effects across local and global landscapes. Annu. Rev. Mar. Sci. 1, 329–349. doi: 10.1146/annurev.marine.010908.163754
Craig J. K. (2012). Aggregation on the edge: effects of hypoxia avoidance on the spatial distribution of brown shrimp and demersal fishes in the northern Gulf of Mexico. Mar. Ecol. Prog. Ser. 445, 75–95. doi: 10.3354/meps09437
de Mutsert K., Steenbeek J., Lewis K., Buszowski J., Cowan J. H. Jr., Christensen V. (2016). Exploring effects of hypoxia on fish and fisheries in the northern Gulf of Mexico using a dynamic spatially explicit ecosystem model. Ecol. Model. 331, 142–150. doi: 10.1016/j.ecolmodel.2015.10.013
Deutsch C., Ferrel A., Seibel B., Pörtner H.-O., Huey R. B. (2015). Climate change tightens a metabolic constraint on marine habitats. Science 348, 1132–1135. doi: 10.1126/science.aaa1605
Deutsch C., Frenzel H., McWilliams J. C., Renault L., Kessouri F., Howard E., et al. (2021). Biogeochemical variability in the California Current System. Prog. Oceanography 196, 102565. doi: 10.1016/j.pocean.2021.102565
Deutsch C., Penn J. L., Seibel B. (2020). Metabolic trait diversity shapes marine biogeography. Nature 585, 557–562. doi: 10.1038/s41586-020-2721-y
Dong C., Idica E. Y., McWilliams J. C. (2009). Circulation and multiple-scale variability in the Southern California Bight. Prog. Oceanography 82, 168–190. doi: 10.1016/j.pocean.2009.07.005
Feely R. A., Alin S. R., Carter B., Bednaršek N., Hales B., Chan F., et al. (2016). Chemical and biological impacts of ocean acidification along the west coast of North America. Estuarine Coast. Shelf Sci. 183, 260–270. doi: 10.1016/j.ecss.2016.08.043
Feely R. A., Carter B. R., Alin S. R., Greeley D., Bednaršek N. (2024). The combined effects of ocean acidification and respiration on habitat suitability for marine calcifiers along the west coast of North America. J. Geophysical Research: Oceans 129, e2023JC019892. doi: 10.1029/2023JC019892
Fennel K., Testa J. M. (2019). Biogeochemical controls on coastal hypoxia. Annu. Rev. Mar. Sci. 11, 105–130. doi: 10.1146/annurev-marine-010318-095138
Fry F. (1971). The effect of environmental factors on the physiology of fish. In Environmental Relations and Behavior Vol. 6. Eds. Hoar W., Randall D. (New York: Academic Press), 1–98. doi: 10.1016/S1546-5098(08)60146-6
Gannefors C., Böer M., Kattner G., Graeve M., Eiane K., Gulliksen B., et al. (2005). The arctic sea butterfly Limacina helicina: lipids and life strategy. Mar. Biol. 147, 169–177. doi: 10.1007/s00227-004-1544-y
Gunderson A. R., Leal M. (2016). A conceptual framework for understanding thermal constraints on ectotherm activity with implications for predicting responses to global change. Ecol. Lett. 19, 111–120. doi: 10.1111/ele.12552
Hauri C., Gruber N., Vogt M., Doney S. C., Feely R. A., Lachkar Z., et al. (2013). Spatiotemporal variability and long-term trends of ocean acidification in the California Current System. Biogeosciences 10, 193–216. doi: 10.5194/bg-10-193-2013
Howard E. M., Penn J. L., Frenzel H., Seibel B. A., Bianchi D., Renault L., et al. (2020). Climate-driven aerobic habitat loss in the California Current System. Sci. Adv. 6, eaay3188. doi: 10.1126/sciadv.aay3188
Howard M. D., Sutula M., Caron D. A., Chao Y., Farrara J. D., Frenzel H., et al. (2014). Anthropogenic nutrient sources rival natural sources on small scales in the coastal waters of the Southern California Bight. Limnology Oceanography 59, 285–297. doi: 10.4319/lo.2014.59.1.0285
Hunt B., Pakhomov E., Hosie G., Siegel V., Ward P., Bernard K. (2008). Pteropods in southern ocean ecosystems. Prog. Oceanography 78, 193–221. doi: 10.1016/j.pocean.2008.06.001
Karpenko V. I., Volkov A., Koval M. V. (2007). Diets of pacific salmon in the Sea of Okhotsk, Bering Sea, and northwest Pacific Ocean. N. Pac. Anadr. Fish Commun. Bull. 4, 105–116.
Kekuewa S. A., Courtney T. A., Cyronak T., Andersson A. J. (2022). Seasonal nearshore ocean acidification and deoxygenation in the Southern California Bight. Sci. Rep. 12, 17969. doi: 10.1038/s41598-022-21831-y
Keller A. A., Ciannelli L., Wakefield W. W., Simon V., Barth J. A., Pierce S. D. (2015). Occurrence of demersal fishes in relation to near-bottom oxygen levels within the California Current Large Marine Ecosystem. Fisheries Oceanography 24, 162–176. doi: 10.1111/fog.12100
Kessouri F. (2024). Large-scale response to urban eutrophication in the southern California Current System. Sci. Rep. 14 (1), 7240. doi: 10.1038/s41598-024-57626-6
Kessouri F., McLaughlin K., Sutula M., Bianchi D., Ho M., McWilliams J. C., et al. (2021a). Configuration and validation of an oceanic physical and biogeochemical model to investigate coastal eutrophication in the Southern California Bight. J. Adv. Modeling Earth Syst. 13, e2020MS002296. doi: 10.1029/2020MS002296
Kessouri F., McWilliams J. C., Bianchi D., Sutula M., Renault L., Deutsch C., et al. (2021b). Coastal eutrophication drives acidification, oxygen loss, and ecosystem change in a major oceanic upwelling system. Proc. Natl. Acad. Sci. 118, e2018856118. doi: 10.1073/pnas.2018856118
Koslow J. A., Goericke R., Lara-Lopez A., Watson W. (2011). Impact of declining intermediate-water oxygen on deepwater fishes in the California Current. Mar. Ecol. Prog. Ser. 436, 207–218. doi: 10.3354/meps09270
Laffoley D., Baxter J. M. (2019). Ocean deoxygenation: Everyone’s problem-Causes, impacts, consequences and solutions (Switzerland: IUCN Gland).
Lalli C. M., Gilmer R. W. (1989). Pelagic snails: The biology of holoplanktonic gastropod mollusks (Stanford, California: Stanford University Press).
Laroche J. L., Richardson S. (1980). Reproduction of northern anchovy, Engraulis mordax, off Oregon and Washington. Fish. Bull. 78, 603–618.
Leinweber A., Gruber N. (2013). Variability and trends of ocean acidification in the southern California Current System: A time series from Santa Monica Bay. J. Geophysical Research: Oceans 118, 3622–3633. doi: 10.1002/jgrc.20259
Levin L. A. (2018). Manifestation, drivers, and emergence of open ocean deoxygenation. Annu. Rev. Mar. Sci. 10, 229–260. doi: 10.1146/annurev-marine-121916-063359
Lewis E., Wallace D., Allison L. (1998). Program developed for CO2 system calculations. (Upton, NY: Tech. rep., Brookhaven National Lab., Dept. of Applied Science).
Long M., Ito T., Deutsch C. (2019). “Oxygen projections for the future,” in Ocean deoxygenation: everyone’s problem. Causes, impacts, consequences and solutions. Eds. Laffoley D., Baxter J. M. (International Union for Conservation of Nature and Natural Resources).
Mais K. F. (1974). Pelagic fish surveys in the California Current. Cal. Fish Game Fish. Bull. 162, 1–79.
Manno C., Bednaršek N., Tarling G. A., Peck V. L., Comeau S., Adhikari D., et al. (2017). Shelled pteropods in peril: assessing vulnerability in a high CO2 ocean. Earth-Science Rev. 169, 132–145. doi: 10.1016/j.earscirev.2017.04.005
Marigomez I., Múgica M., Izagirre U., Sokolova I. M. (2017). Chronic environmental stress enhances tolerance to seasonal gradual warming in marine mussels. PLoS One 12, e0174359. doi: 10.1371/journal.pone.0174359
McClatchie S., Thompson A. R., Alin S. R., Siedlecki S., Watson W., Bograd S. J. (2016). The influence of Pacific Equatorial Water on fish diversity in the Southern California Current System. J. Geophysical Research: Oceans 121, 6121–6136. doi: 10.1002/2016JC011672
McLaughlin K., Weisberg S. B., Dickson A. G., Hofmann G. E., Newton J. A., Aseltine-Neilson D., et al. (2015). Core principles of the California Current Acidification Network: Linking chemistry, physics, and ecological effects. Oceanography 28, 160–169. doi: 10.5670/oceanog
Mekkes L., Renema W., Bednaršek N., Alin S. R., Feely R. A., Huisman J., et al. (2021). Pteropods make thinner shells in the upwelling region of the California Current Ecosystem. Sci. Rep. 11, 1731. doi: 10.1038/s41598-021-81131-9
Moore J. K., Doney S. C., Lindsay K. (2004). Upper ocean ecosystem dynamics and iron cycling in a global three-dimensional model. Global Biogeochemical Cycles 18, GB4028. doi: 10.1029/2004GB002220
Nixon S. W., Buckley B. A. (2002). “A strikingly rich zone”—nutrient enrichment and secondary production in coastal marine ecosystems. Estuaries 25, 782–796. doi: 10.1007/BF02804905
Penn J. L., Deutsch C. (2022). Avoiding ocean mass extinction from climate warming. Science 376, 524–526. doi: 10.1126/science.abe9039
Penn J. L., Deutsch C. (2024). Geographical and taxonomic patterns in aerobic traits of marine ectotherms. Philos. Trans. R. Soc. B 379, 20220487. doi: 10.1098/rstb.2022.0487
Pierson J. J., Slater W.-C. L., Elliott D., Roman M. R. (2017). Synergistic effects of seasonal deoxygenation and temperature truncate copepod vertical migration and distribution. Mar. Ecol. Prog. Ser. 575, 57–68. doi: 10.3354/meps12205
Pinsky M. L., Selden R. L., Kitchel Z. J. (2020). Climate-driven shifts in marine species ranges: Scaling from organisms to communities. Annu. Rev. Mar. Sci. 12, 153–179. doi: 10.1146/annurev-marine-010419-010916
Piontkovski S. A., Al-Oufi H. S. (2014). Oxygen minimum zone and fish landings along the Omani shelf. J. Fisheries Aquat. Sci. 9, 294. doi: 10.3923/jfas.2014.294.310
Pörtner H. O., Knust R. (2007). Climate change affects marine fishes through the oxygen limitation of thermal tolerance. Science 315, 95–97. doi: 10.1126/science.1135471
Rabalais N. (2005). “Eutrophication,” in The Global Coastal Ocean: Multiscale Interdisciplinary Processes, vol. 13 . Eds. Robinson A. R., Brink K. H. (Harvard University Press, Cambridge, Massachusetts and London), 821–866.
Rabalais N. N., Turner R. E., Díaz R. J., Justić D. (2009). Global change and eutrophication of coastal waters. ICES J. Mar. Sci. 66, 1528–1537. doi: 10.1093/icesjms/fsp047
Rangel-Buitrago N., Galgani F., Neal W. J. (2024). Addressing the global challenge of coastal sewage pollution. Mar. pollut. Bull. 201, 116232. doi: 10.1016/j.marpolbul.2024.116232
Renault L., McWilliams J. C., Kessouri F., Jousse A., Frenzel H., Chen R., et al. (2021). Evaluation of high-resolution atmospheric and oceanic simulations of the California Current System. Prog. Oceanography 195, 102564. doi: 10.1016/j.pocean.2021.102564
Roman M. R., Brandt S. B., Houde E. D., Pierson J. J. (2019). Interactive effects of hypoxia and temperature on coastal pelagic zooplankton and fish. Front. Mar. Sci. 6, 139. doi: 10.3389/fmars.2019.00139
Seibel B. A. (2011). Critical oxygen levels and metabolic suppression in oceanic oxygen minimum zones. J. Exp. Biol. 214, 326–336. doi: 10.1242/jeb.049171
Seibel B. A. (2016). Cephalopod susceptibility to asphyxiation via ocean incalescence, deoxygenation, and acidification. Physiology 31, 418–429. doi: 10.1152/physiol.00061.2015
Sharp J. D., Pierrot D., Humphreys M. P., Epitalon J.-M., Orr J. C., Lewis E. R., et al. (2020). CO2SYSv3 for MATLAB, Dataset. Zenodo. doi: 10.5281/ZENODO.3950563
Shchepetkin A. F., McWilliams J. C. (2005). The regional oceanic modeling system (ROMS): a split-explicit, free-surface, topography-following-coordinate oceanic model. Ocean Model. 9, 347–404. doi: 10.1016/j.ocemod.2004.08.002
Sokolova I. (2021). Bioenergetics in environmental adaptation and stress tolerance of aquatic ectotherms: linking physiology and ecology in a multi-stressor landscape. J. Exp. Biol. 224, jeb236802. doi: 10.1242/jeb.236802
Stevens A. M., Gobler C. J. (2018). Interactive effects of acidification, hypoxia, and thermal stress on growth, respiration, and survival of four North Atlantic bivalves. Mar. Ecol. Prog. Ser. 604, 143–161. doi: 10.3354/meps12725
Sutula M., Ho M., Sengupta A., Kessouri F., McLaughlin K., McCune K., et al. (2021). A baseline of terrestrial freshwater and nitrogen fluxes to the Southern California Bight, USA. Mar. pollut. Bull. 170, 112669. doi: 10.1016/j.marpolbul.2021.112669
Turi G., Lachkar Z., Gruber N., Münnich M. (2016). Climatic modulation of recent trends in ocean acidification in the California Current System. Environ. Res. Lett. 11, 014007. doi: 10.1088/1748-9326/11/1/014007
Wang K. (2014). The life cycle of the pteropod Limacina helicina in Rivers Inlet (British Columbia, Canada). Vancouver, British Columbia, Canada: University of British Columbia.
Wang K., Hunt B. P., Liang C., Pauly D., Pakhomov E. A. (2017). Reassessment of the life cycle of the pteropod Limacina helicina from a high resolution interannual time series in the temperate North Pacific. ICES J. Mar. Sci. 74, 1906–1920. doi: 10.1093/icesjms/fsx014
Keywords: metabolic index, aerobic habitat, pteropod, anchovy, oxygen loss, ocean acidification, nutrient inputs, epipelagic
Citation: Frieder CA, Kessouri F, Ho M, Sutula M, Bianchi D, McWilliams JC, Deutsch C and Howard E (2024) Effects of urban eutrophication on pelagic habitat capacity in the Southern California Bight. Front. Mar. Sci. 11:1392671. doi: 10.3389/fmars.2024.1392671
Received: 28 February 2024; Accepted: 22 August 2024;
Published: 01 October 2024.
Edited by:
Michelle Jillian Devlin, Centre for Environment, Fisheries and Aquaculture Science (CEFAS), United KingdomReviewed by:
Natalya D. Gallo, University of Bergen, NorwaySimone R. Alin, National Oceanic and Atmospheric Administration (NOAA), United States
Copyright © 2024 Frieder, Kessouri, Ho, Sutula, Bianchi, McWilliams, Deutsch and Howard. This is an open-access article distributed under the terms of the Creative Commons Attribution License (CC BY). The use, distribution or reproduction in other forums is permitted, provided the original author(s) and the copyright owner(s) are credited and that the original publication in this journal is cited, in accordance with accepted academic practice. No use, distribution or reproduction is permitted which does not comply with these terms.
*Correspondence: Christina A. Frieder, Y2hyaXN0aW5hZkBzY2N3cnAub3Jn