 Jun Young Seo
 Byoung-Ju Choi
 Sun Min Choi
 Jongseong Ryu
 Ho Kyung Ha
- 1Department of Oceanography, Chonnam National University, Gwangju, Republic of Korea
- 2Department of Ocean Sciences, Inha University, Incheon, Republic of Korea
- 3Department of Marine Biotechnology, Anyang University, Incheon, Republic of Korea
Moorings and axial surveys using acoustic Doppler current profilers in microtidal Masan Bay were conducted to reveal impacts of coastal seiches on sediment behaviors. The hydrodynamic circulation in the bay was dominated by sluggish tidal and residual currents, with which the coastal seiches with a 1-h period were detected. The coastal seiches velocity (useiche) accounted for approximately 30% of the total velocities, causing back-and-forth water motions along the channel. This was insufficient to resuspend bed sediments without external forcings. Nevertheless, it influenced the suspended sediment concentration (SSC) of turbidity maximum (~40 mg l−1) at the central part of bay, showing SSC anomaly of 8 mg l−1. Although the seiche-induced sediment fluxes were only 1% of the total fluxes due to offsetting effect of bidirectional flows, they reached up to 0.040×10⁻³ kg m−2 s−1 at each pulse of coastal seiches. Repetitive coastal seiches lifted the sediment particles to the upper layer where they would not have risen if not for seiche vertical motion. However, the distance that the coastal seiches can transport the suspended sediments was too short compared to their transportable amounts. Even if sediment particles within turbidity maximum were advected by coastal seiches, they could not leave the region. This process was intensified toward the land because the useiche slowed down the further as it moved away from the node. As long as the bed sediments were resuspended, the coastal seiches were expected to enhance the potential for water pollution by causing repetitive sediment redistribution.
Introduction
Sediment transport processes, including sedimentation, resuspension, and advection, occur iteratively in coastal regions. Sediment resuspension is a natural process occurring when the bed shear stress exceeds an erosion threshold (Choi et al., 2023). The resuspension has been recognized as an important sediment transport process because it plays a role in the functionality and health of coastal ecosystems. For example, a high concentration of suspended sediments produced by resuspension strongly hinders light penetration through the surface layer and reduces the pre-existing subsurface biological habitats (Mehta, 1989; Schallenberg and Burns, 2004). The sediments resuspended from the bed can also release contaminants and toxic materials into the water column, deteriorating the water quality (Eggleton and Thomas, 2004). These problems are particularly intensified in semi-enclosed or enclosed systems (e.g., bays, estuaries, and harbors) where the water circulation is somewhat restricted (Jordi et al., 2008).
In coastal regions, sediment transport is subjected to various hydrodynamic forcings. Tidal currents and estuarine circulation are the predominant forcings for sedimentation in tide- and river-dominant regions, respectively (Ribbe and Holloway, 2001). They horizontally advect the suspended sediments from input sources such as a river (Wang and Pinardi, 2002). The waves generated by high-energy events, such as storms, are also a major forcing for initiation of sediment motion in shallow coastal regions (Ogston et al., 2000; Jordi et al., 2008). The wave-orbital motions are able to penetrate down to the bed and resuspend the sediment particles from the bed into the water column (Green and Coco, 2014). In the case of a semi-enclosed bay, oscillatory motions with periods longer than those of wind waves and shorter than those of tidal variations have been proposed as an additional forcing for sediment transport (Gomis et al., 1993; Prichard and Hogg, 2003; Anglès et al., 2010).
The oscillatory motions, also known as coastal seiches or harbor oscillation, usually occur in semi-enclosed bays (Rabinovich, 2009). In contrast to seiches generated by direct external forcings, such as atmospheric pressure (De Jong and Battjes, 2004), wind (Niedda and Greppi, 2007), and tsunamis (Van Dorn, 1984), coastal seiches are common phenomenon generated mainly by long-period waves entering through the open boundary from the sea (Rabinovich, 2009; Magdalena et al., 2020). These long-period waves can coincide with the period of other natural wave oscillations (e.g., tides and wind waves) in bays or harbors and eventually produce standing waves (coastal seiches) that can be intensified by resonance (Giese and Chapman, 1993; André et al., 2021). The typical characteristics of coastal seiches are that even a small vertical motions of water column can be accompanied by large horizontal water motions (Rabinovich, 2009; Magdalena et al., 2020). In stormy conditions, further resonance occur, which can make considerable motions reaching a few meters (De Jong and Battjes, 2004; Rabinovich, 2009; Kumar et al., 2016).
The coastal seiches can affect the sediment transport processes by generating currents at intervals of several ten minutes. In previous studies, Prichard and Hogg (2003) demonstrated that the seiches might be an important mechanism for fine-sand sediments, for which bed level changes can reach several centimeters per hour. Jordi et al. (2008) reported that the seiches in semi-enclosed harbors play a role in the driving process to control sediment resuspension from the bed. Yuan et al. (2008) emphasized that the interactions between seiches and tidal currents provide a source of turbulence production, which stripped up the benthic sediment fluff layers. As such, it is known that the coastal seiches can be a driving factor affecting sediment transport. On the other hand, as the period and intensity of the coastal seiches depend on site-specific conditions (e.g., local external forcing, water depth, topography, and area), they are variable, inducing complexity in the sediment transport processes. Thus, the principal mechanisms of coastal seiches controlling the behavior of suspended sediments and the degree to which their impact on sediment resuspension are largely unknown. Therefore, it is essential to understand the interactions between coastal seiches and suspended sediments in a water column. The principal aims of this study are twofold: (1) to understand the contribution of coastal seiches to the sediment resuspension in the microtidal semi-enclosed bay and (2) to quantitatively reveal the impact of coastal seiches on sediment advection.
Study area
Masan Bay, on the south coast of Korea, is a typical semi-enclosed bay system with a vertically well-mixed water column (Jeong et al., 2013; Seo et al., 2022). The Bay has a funnel-shaped morphology, 2.5 km in width and 8 km in length (Figure 1). The mean water depth in the inner part is less than 5 m, which increases gradually up to approximately 20 m at the entrance of the Bay (Yim et al., 2005). It has a mesotidal regime with tidal level reaching up to 2.4 m (spring tide) (Jeong et al., 2006; Jang et al., 2015). Tide is composed of 84%, 11%, and 4% of semi-diurnal (12.4 hours), diurnal, and shallow water tide, respectively (Choo, 2021). The M2 (12.42 hours) in the bay is the most dominant tidal constituent. The Bay receives the freshwater of 2.4×10⁸ m3 yr−1 from three adjacent streams (Changwon, Samho, and Nam Streams) (Lee et al., 2009). The freshwater freely exchanges with seawater through Jinhae Bay, which opens toward the Korea Strait (Kim et al., 2013; Seo et al., 2022) (Figure 1). From the entrance of Jinhae Bay to Masan Bay, the length of a channel passing through them is approximately 40 km (Lee et al., 2000, 2021). This channel is characterized by a narrower width and shallower depth toward the inner part of Masan Bay (Park et al., 2020). The waves propagating from Korea Strait to Masan Bay due to atmospheric pressure disturbance are intensified by shoaling and harbor resonance as they pass through the long narrow channel (Kwon et al., 2021). The theoretical resonance periods for sea level oscillations in Jinhae-Masan Bay are within the observed periods of 35−90 min at Masan tide station (Kwon et al., 2021).
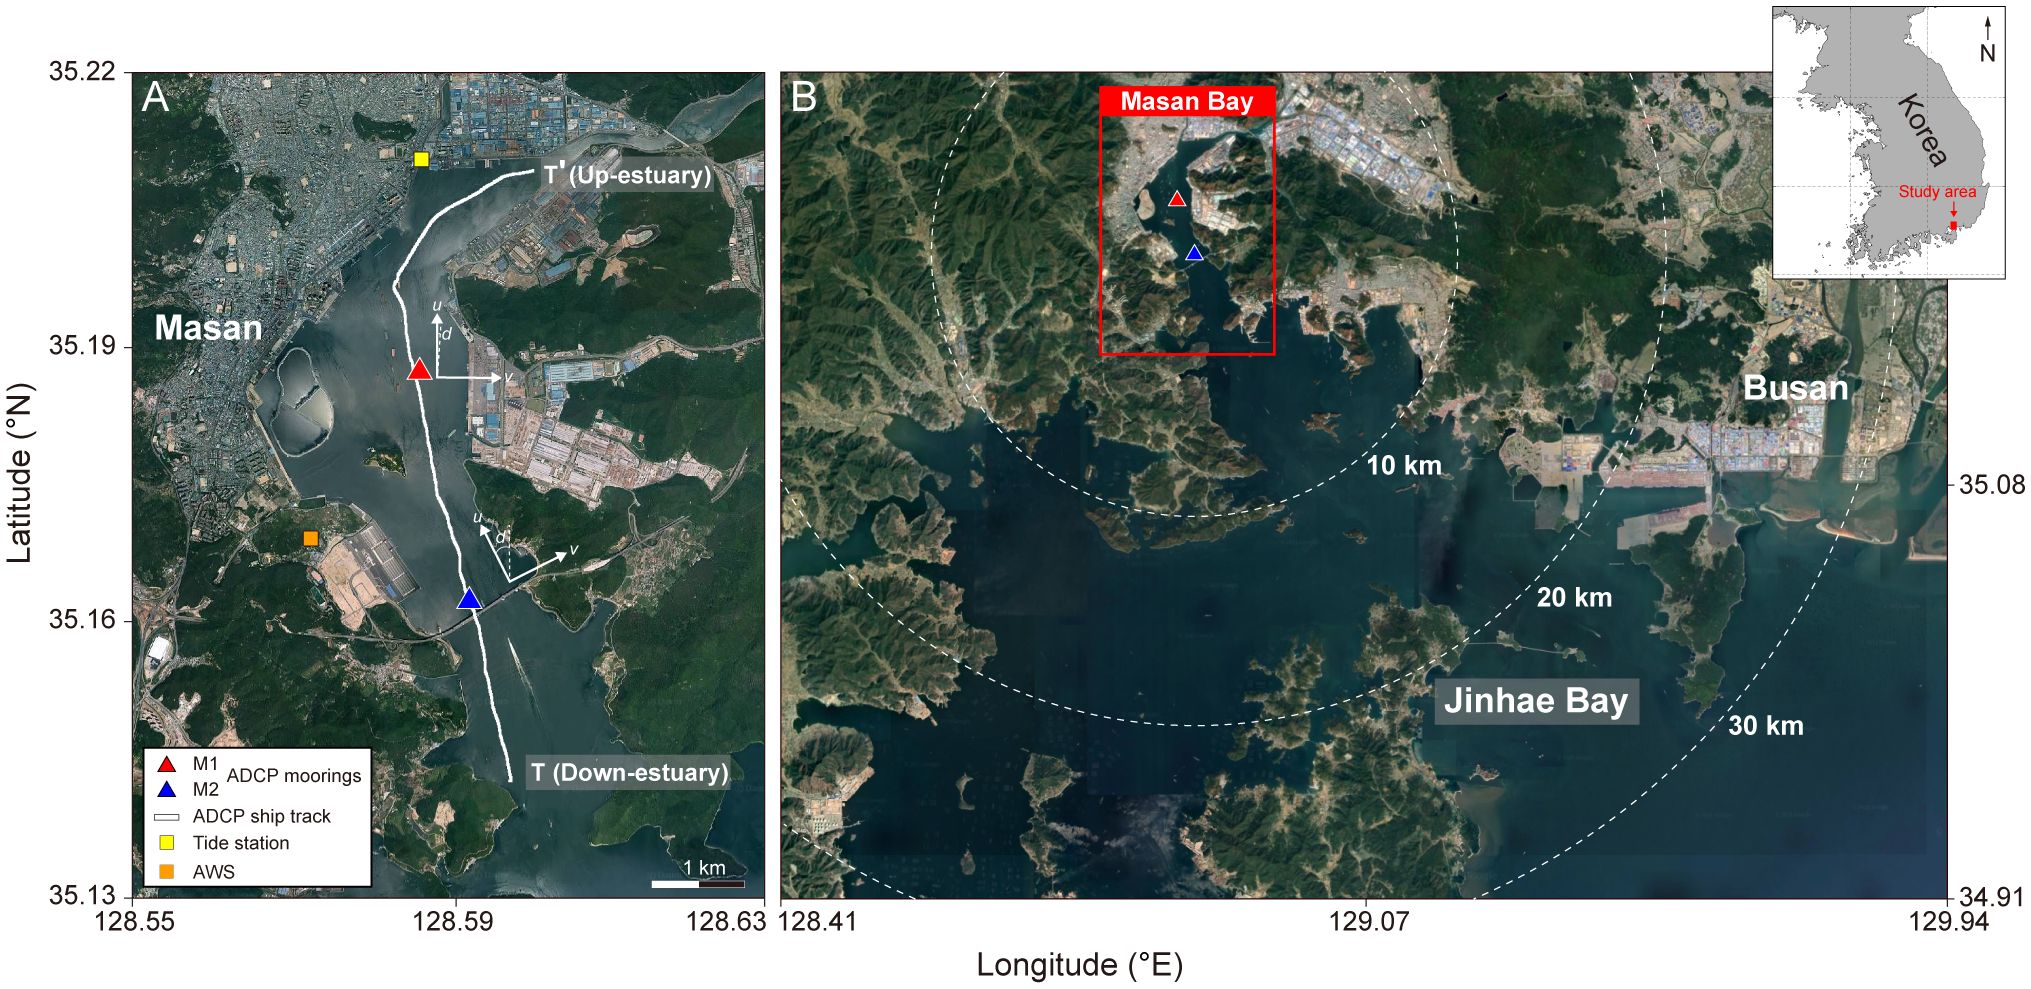
Figure 1 (A) Large and (B) small scale maps of Masan Bay (red square in the inset). Red and blue triangles are the ADCP mooring stations (M1: 35.1881°N, 128.5861°E; M2: 35.1657°N, 128.5947°E). Yellow and orange squares are a tide station in Masan and an automatic weather station (AWS) in Changwon, respectively. The white solid line in (A) is the axial transect for the ADCP ship track. The u and v represent the transformed coordinates of along- and across-channel velocities, respectively, while d is the angle relative to North (M1: +1°C; M2: −31°). White dashed circles in (B) represent the radii (10, 20, and 30 km) from the M2. The satellite images were downloaded from http://map.daum.net and http://map.naver.com.
The bay has a microtidal regime with a mean tidal range of 1.2 m (neap tide) to 2.4 m (spring tide) and has a slight ebb dominance (Kang and Jun, 2003; Jang et al., 2015; Seo et al., 2022). The water circulation is sluggish (current velocity < 0.1 m s-1) even under tidal forcing (Seo et al., 2022). With the tidal cycle, the relative dominance between the tidal and residual currents varies: tidal currents are prevailing during the spring tide while residual currents are stronger during the neap tide. Under competition between them, the suspended sediments are trapped in the central part of Masan Bay, forming a mobile sediment pool composed mainly of very fine silt and clay (6.2 to 9.5 ϕ) (> 95%) with a small portion of sand (< 5%) (Park and Lee, 1996; Woo et al., 2003; Hyun et al., 2007). The mobile sediment pool responds to the northerly winds and readily resuspends into the water column. The suspended sediments supplied from that pool generate extremely high concentrations, such as primary and secondary estuarine turbidity maxima (ETM and STM, respectively) along the main channel (Seo et al., 2022).
Materials and methods
Mooring and hydrographic data collection
Two acoustic Doppler current profilers (ADCPs) were moored in the inner (M1: 35.1881°N, 128.5861°E) and outer (M2: 35.1657°N, 128.5947°E) parts of the main channel of Masan Bay (Figure 1A). The mean water depths at M1 and M2 were 13.7 and 17.1 m, respectively, and the distance between them was 2.9 km. Up-looking broadband ADCPs at M1 (1200 kHz RDI Workhorse Sentinel) and M2 (1000 kHz RDI Sentinel V20) installed in a trawl-resistant bottom mount were configured to measure the profiles of the three-dimensional current velocities, water level, temperature, and echo intensity every minute and 10 minutes, respectively, from September 22 to October 13, 2017. The data for M1 was adjusted to the same time resolution as M2 in post processing. The ADCP transducers were positioned 0.4 m above the bed (mab), and the vertical bin size was set to 0.2 m (M1) and 0.25 m (M2). In post-processing, the coordinates of the current velocity at M1 and M2 were rotated +1°C and −31°C, respectively, to obtain the along- and across-channel components (u and v in Figure 1).
An along-channel axial survey was conducted with a research vessel on October 12, 2017. The castings of a CTD (SBE-19plus V2, SeaBird) equipped with an optical backscatter sensor (OBS, Campbell) were conducted to measure the turbidity profile (in NTU). Water samples were taken using a Niskin water sampler at each CTD station to convert the turbidity to the suspended sediment concentration (SSC, mg l−1). All water samples were vacuum filtered through pre-weighed glass fiber filters (GF/F, pore size: 0.7 μm; Whatman). The residues on filters were oven-dried at 105°CC for 24 h. The masses of the filtered sediments were determined by the difference in the re-weight of the filters divided by the filtered water volume. The OBS calibration showed good linear regression between turbidity and SSC (r2 = 0.80).
The echo intensities (E, counts) recorded from the ADCPs were calibrated to the SSCADCP (mg l−1) through a comparison with simultaneous field-collected SSC. Calibration was performed using the following sonar Equations 1, 2, and 3 suggested by Deines (1999):
where Sv is the volume scattering strength (dB), SSCADCP (hereafter referred to as SSC) and SSCOBS are ADCP- and OBS-derived SSC (mg l−1), respectively. R is the range to scatterers along the beam (m), α is the sound attenuation coefficient by the water parcel. LDBM is the 10·log10 of the transmit pulse length (0.02), and PDBW is the 10·log10 of the transmit power (23.8). Er is the reference echo intensity (40 counts). Kc (0.55) and C (−64.78), the signal calibration coefficient, were determined by linear regression between the echo intensity (E−Er) and SSCOBS (Deines, 1999; Kim et al., 2004; Ha et al., 2011; Seo et al., 2022).
Wind data were obtained at the Masan Tide Station (35.2100°N, 128.5889°E) maintained by the Korea Hydrographic and Oceanographic Agency (Figure 1).
Sediment flux and characteristics of coastal seiches
The instantaneous flux (F, kg m−2 s−1) of suspended sediments at the ADCP mooring stations were calculated as follows (Equation 4):
where u is the along-channel current velocity, and z is the vertical coordinate for each bin measured by ADCPs. F was decomposed into = ures + utide and SSC = SSCres+ SSCtide. A subscripts res and tide denote a tidal average and fluctuation of a variable, respectively, resulting from the application of 36-h low- and high-pass Butter-worth filters (Geyer et al., 2001; Sommerfield and Wong, 2011; Morgan-King and Schoellhamer, 2013; Gong et al., 2023; Seo et al., 2023). The coastal seiches velocity (useiche) and seiche-induced SSC (SSCseiche) were calculated by band-pass filtering the u and SSC with a frequency of 1 h (±30 min).
The tidal and residual mechanisms of sediment flux were identified by decomposing the tidally averaged F () as follows (Equation 5):
where is the component of mean-flow flux (Fmean) that is longer than the tidal cycle, and is the component of correlation flux (Fcorr) that is shorter than the tidal cycle (Geyer et al., 2001; Scully and Friedrichs, 2007; Sommerfield and Wong, 2011; Kim et al., 2024). The Fmean is composed of several processes, such as river discharge, gravitational circulation, tidal straining, and Stokes drift, while Fcorr comprises tidal pumping, tidal straining, and coastal seiches (Fseiche = ) processes (Schulz et al., 2018; Figueroa et al., 2020).
The total along-channel sediment flux was calculated by depth-integrated , as follows (Equation 6):
where qtotal is the depth-integrated sediment flux (kg m−1 s−1) from the bottom to the water surface of the water column, indicating total sediment transport per unit width. The depth-integrated Fmean and Fcorr are referred to as qmean and qcorr, respectively. Here, qcorr includes qseiche (depth-integrated Fseiche).
The periods of natural harbor resonance within a semi-enclosed bay were calculated using Equation 7 to understand the fluctuation of coastal seiches (Park et al., 2020; Kwon et al., 2021):
where Tn is the resonant harbor oscillation period of the nth mode for a semi-enclosed bay, h is the averaged depth (ca. 15 m) from head to mouth, l is the length (17 km) of the bay, and g is the gravitational acceleration.
The SSC anomalies caused by coastal seiches were calculated by subtracting 30 min (three samples) moving-averaged SSC from the SSC over the entire measurement period.
Results
Power spectral density of current velocity
The PSD of depth-averaged current velocity for each mooring station was calculated through a Hamming window of four-day segments with half the window overlapping (Figure 2). The estimated PSDs were classified into two main frequency bands: (1) the low frequencies (residual current) in the range of 0−0.027 cph (period T > 36 h) and (2) the tidal frequencies (tidal current) in the range of 0.027−3 cph (T< 36 h). Generally, the PSD at M2 was higher than that at M1 over the entire frequencies. In the tidal frequency band, the semi-diurnal (12 h and 25 min) frequency dominated the diurnal (24 h and 50 min) frequency (Figure 2A). In particular, the power spectra were unstable in the range of 0.5−1.5 cph and had selective enhancement. Such broad-banded spectra, presumably defined by the topographic characteristics (i.e., width, depth, and curvature) of the whole area and free long waves propagating, were indicative of the form of coastal seiches. The signal of coastal seiches with a high correlation (~0.8) continued to be detected at M1 and M2 throughout the measurement period (Figure 2B). For the total time span, the coastal seiches were dependent on each other in terms of the major oscillation frequencies. Their energies at M1 and M2 were 19.32% and 19.99% of the total (0.01−3 cph), which is not negligible in the microtidal bay. A comparison of the coastal seiches between two mooring stations showed that the PSD at M2 (3.71×10⁻⁴ cm2 s−2 cph−1) was three times higher than that at M1 (1.14×10⁻⁴ cm2 s−2 cph−1) on average (Figure 2A).
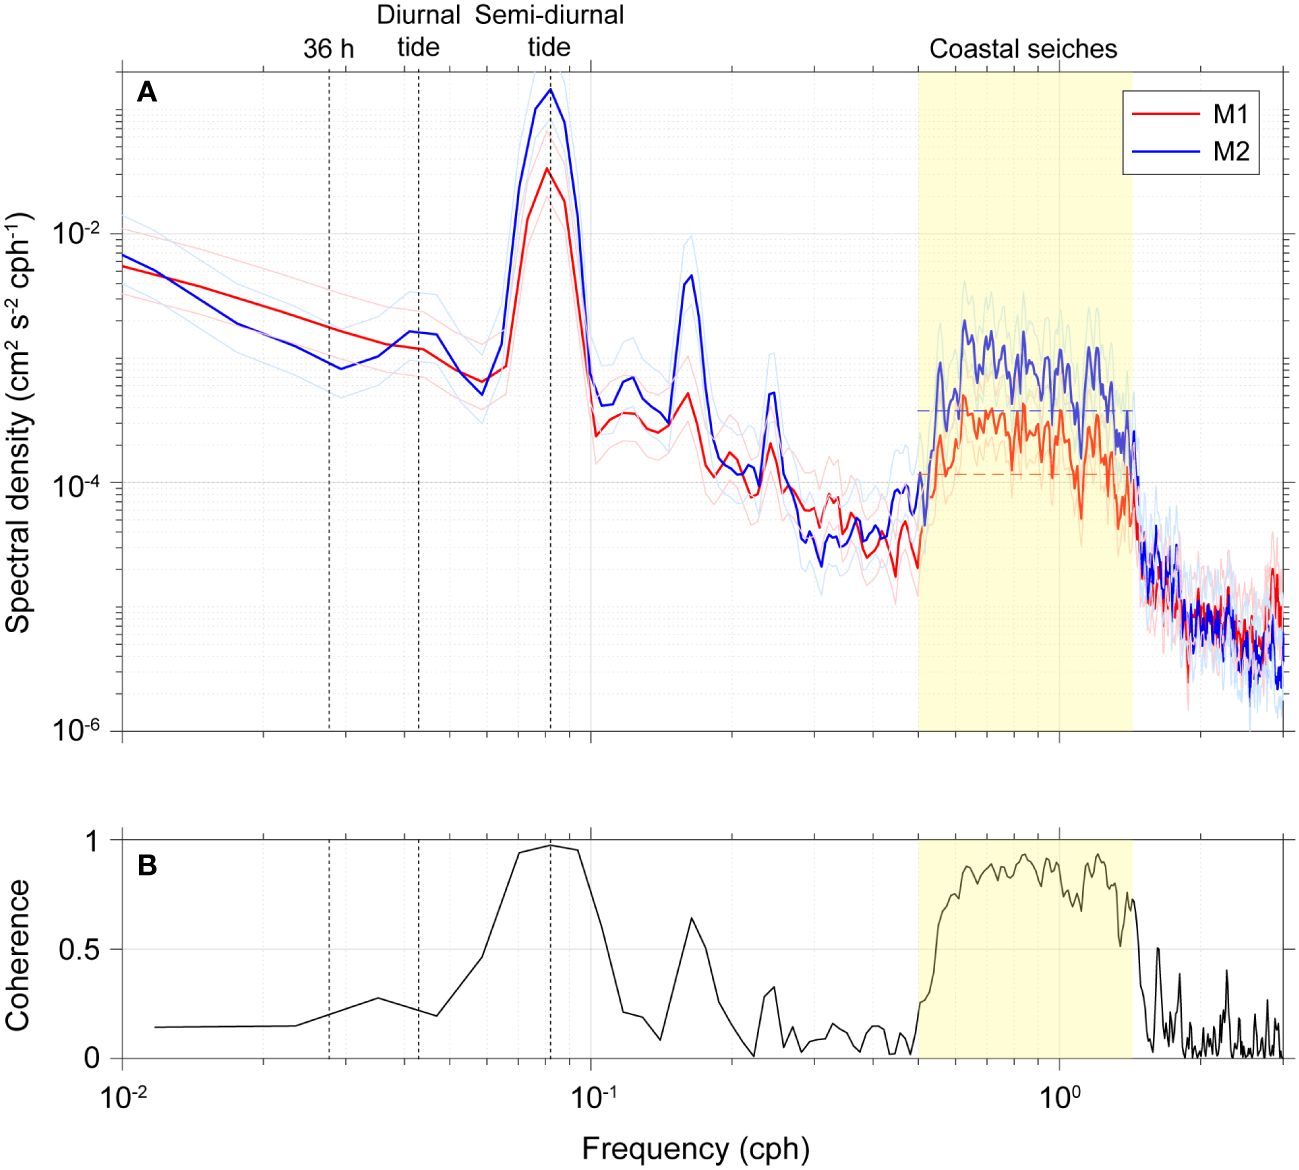
Figure 2 (A) Power spectrum density of along-channel current velocity at M1 (red) and M2 (blue). (B) Coherence for along-channel current velocity between M1 and M2. The light blue and red lines in (A) indicate confidence intervals of 95%. The horizontal dashed lines in (A) are the mean spectral densities of coastal seiches (yellowish areas) in the range of 0.5−1.5 cph.
The longitudinal wave speed where the phase of a wave propagated could be estimated using the 1-h (±30 min) band-pass filtered current data at M1 and M2 (Figure 3). The time lag of the waves propagating between the two stations, approximately 2.9 km apart, was 304.7 s on average. At a given separation distance and time lag, the wave propagated toward the land at a speed of 9.52 m s−1. This is slower than the theoretical shallow water wave speed, 11.59–12.95 m s−1, in this region. It was reasonable to believe that the wavelength of the coastal seiches was 34.27 km (half-wavelength: 17.14 km) (Figure 1). These properties of coastal seiches were also similar to those calculated using Equation 7. The resonance periods for open-end bay in this geometric condition were 94, 31, and 19 min for the first three modes. The resonance period of the first mode (n = 1) was close to the wave periods of the incoming long waves from the open sea. This suggests that the wave oscillations (0.5−1.5 cph) measured at the two mooring stations originated from amplitude perturbations of waves with a node near the mouth of Jinhae Bay.
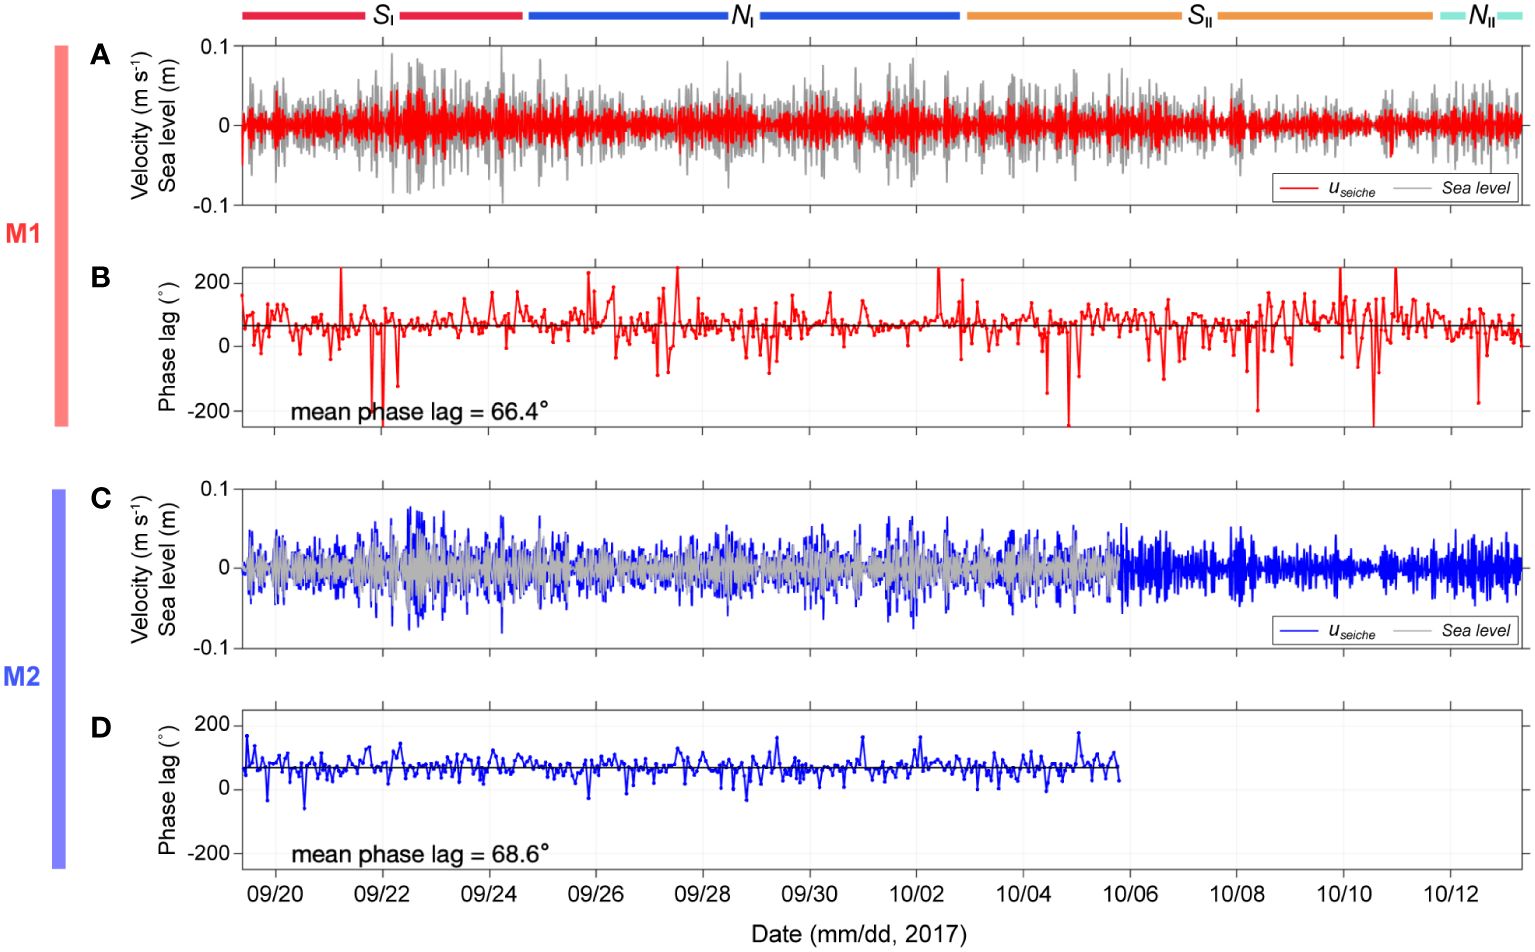
Figure 3 (A, C) Time series of 1-h (± 30 min) band-pass filtered current velocities and depth variations (gray lines). (B, D) Phase lags between 1-h (± 30 min) band-pass filtered current velocities and sea level variations. The red and blue lines in all subplots indicate M1 and M2, respectively. The horizontal black lines in (B, D) are time-averaged phase lags over the entire period. There was no available data on sea level variation at M2 from late October 5, 2017, because of a malfunction of the ADCP pressure sensor. The stripped colorbars at the top of the figure indicate the spring (SI and SII) and neap (NI and NII) tides. The unit of height is meter above bed (mab).
Characteristics of coastal seiches
The current patterns in the total velocity fields had two different vertical structures depending on the relative importance between the tidal (utide) and residual (ures) currents (Figure 4). The u in the spring tides (SI and SII) with a tidal range of 1.5–2 m were vertically uniform as a barotropic structure, showing landward or seaward flow with the tidal phase (Figures 4A, D). The utide fluctuated in the range of −0.025–0.022 m s−1 (−0.053–0.047 m s−1) at M1 (M2) on average and dominated the ures of 0.012 m s−1 (0.018 m s−1) in the bottom layer. In neap tides (NI and NII) with a tidal range of 0.4–1 m, u had two-layered current flows as a baroclinic structure, showing seaward flow in the surface layer and landward flow in the bottom layer (Figures 4A, D). The utide at M1 and M2 stagnated in the range of −0.012–0.012 m s−1 and −0.026–0.023 m s−1, respectively, while their ures reached 0.022 m s−1 and 0.044 m s−1 in the bottom layer, on average. As the tidal forcing weakened, two-layered residual circulations (also known as exchange flow) were developed (Figures 4C, F), intensifying the vertical shear (s2, du/dz) at approximately 8 mab of M1 and 5 mab of M2 (Figures 5C, E).
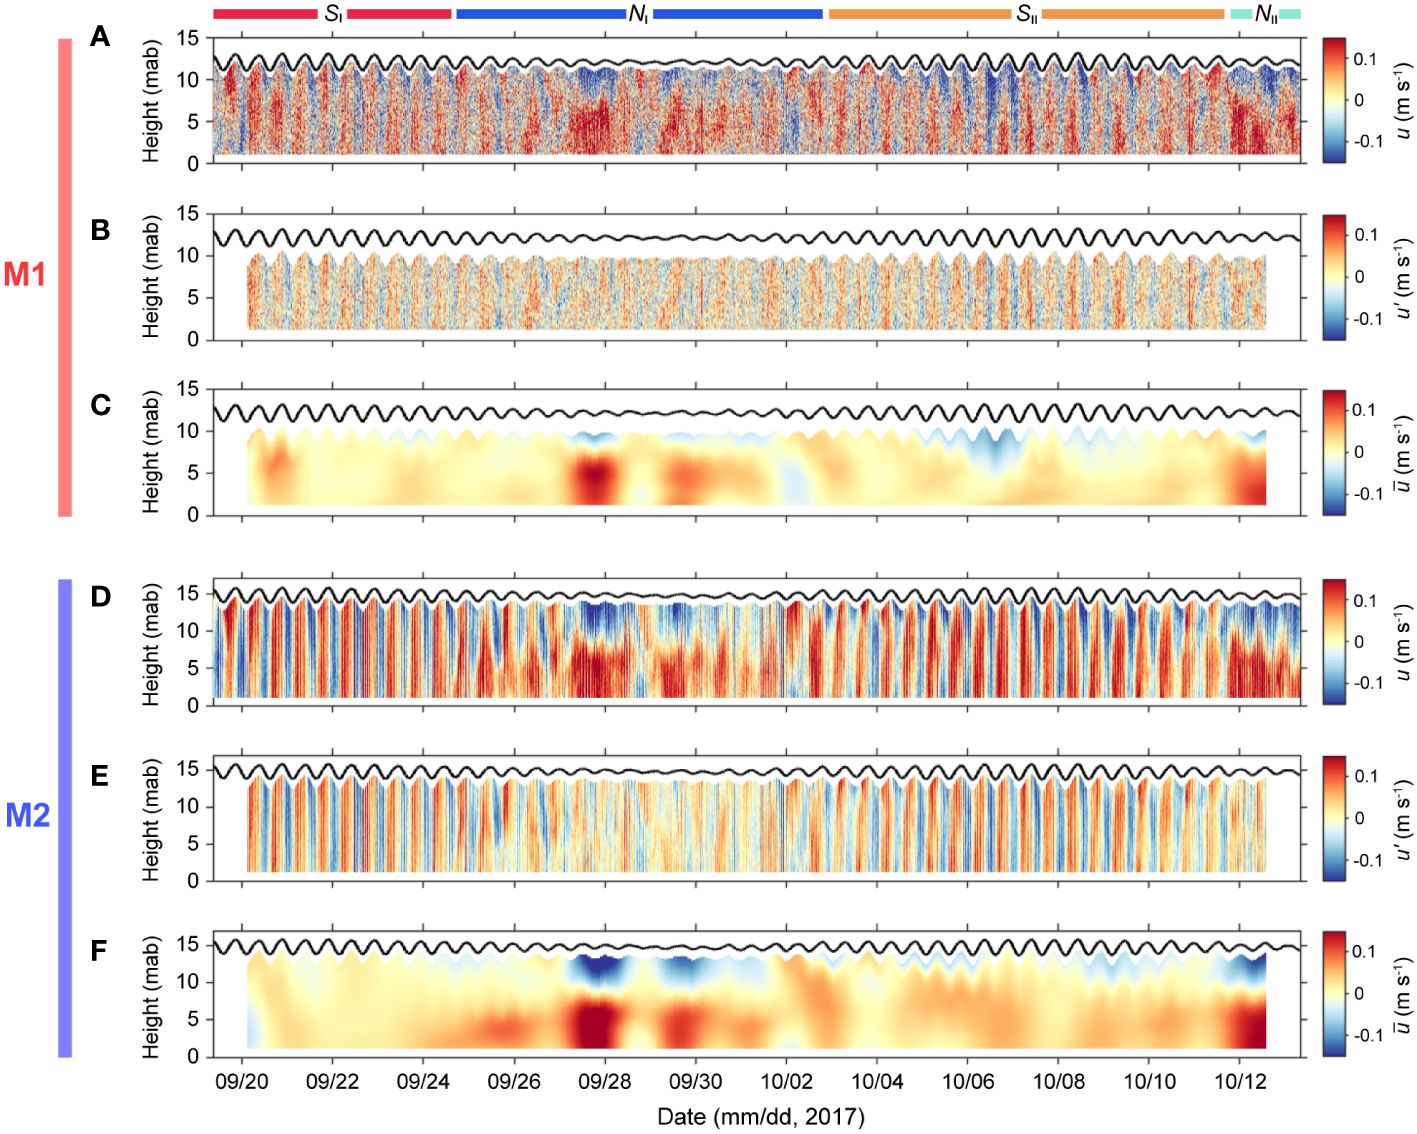
Figure 4 Time series for the data of ADCP moorings: (A, D) total current velocities (u), (B, E) tidal current velocities (utide), and (C, F) residual current velocities (ures) at M1 and M2, respectively. Black lines at each subplot are water elevation. Positive (red) and negative (blue) values indicate landward and seaward current flows, respectively. The vertical dashed lines at each subplot represent the axial survey date (October 12, 2017). The stripped colorbars at the top of the figure indicate the spring (SI and SII) and neap (NI and NII) tides. The unit of height is meter above bed (mab).
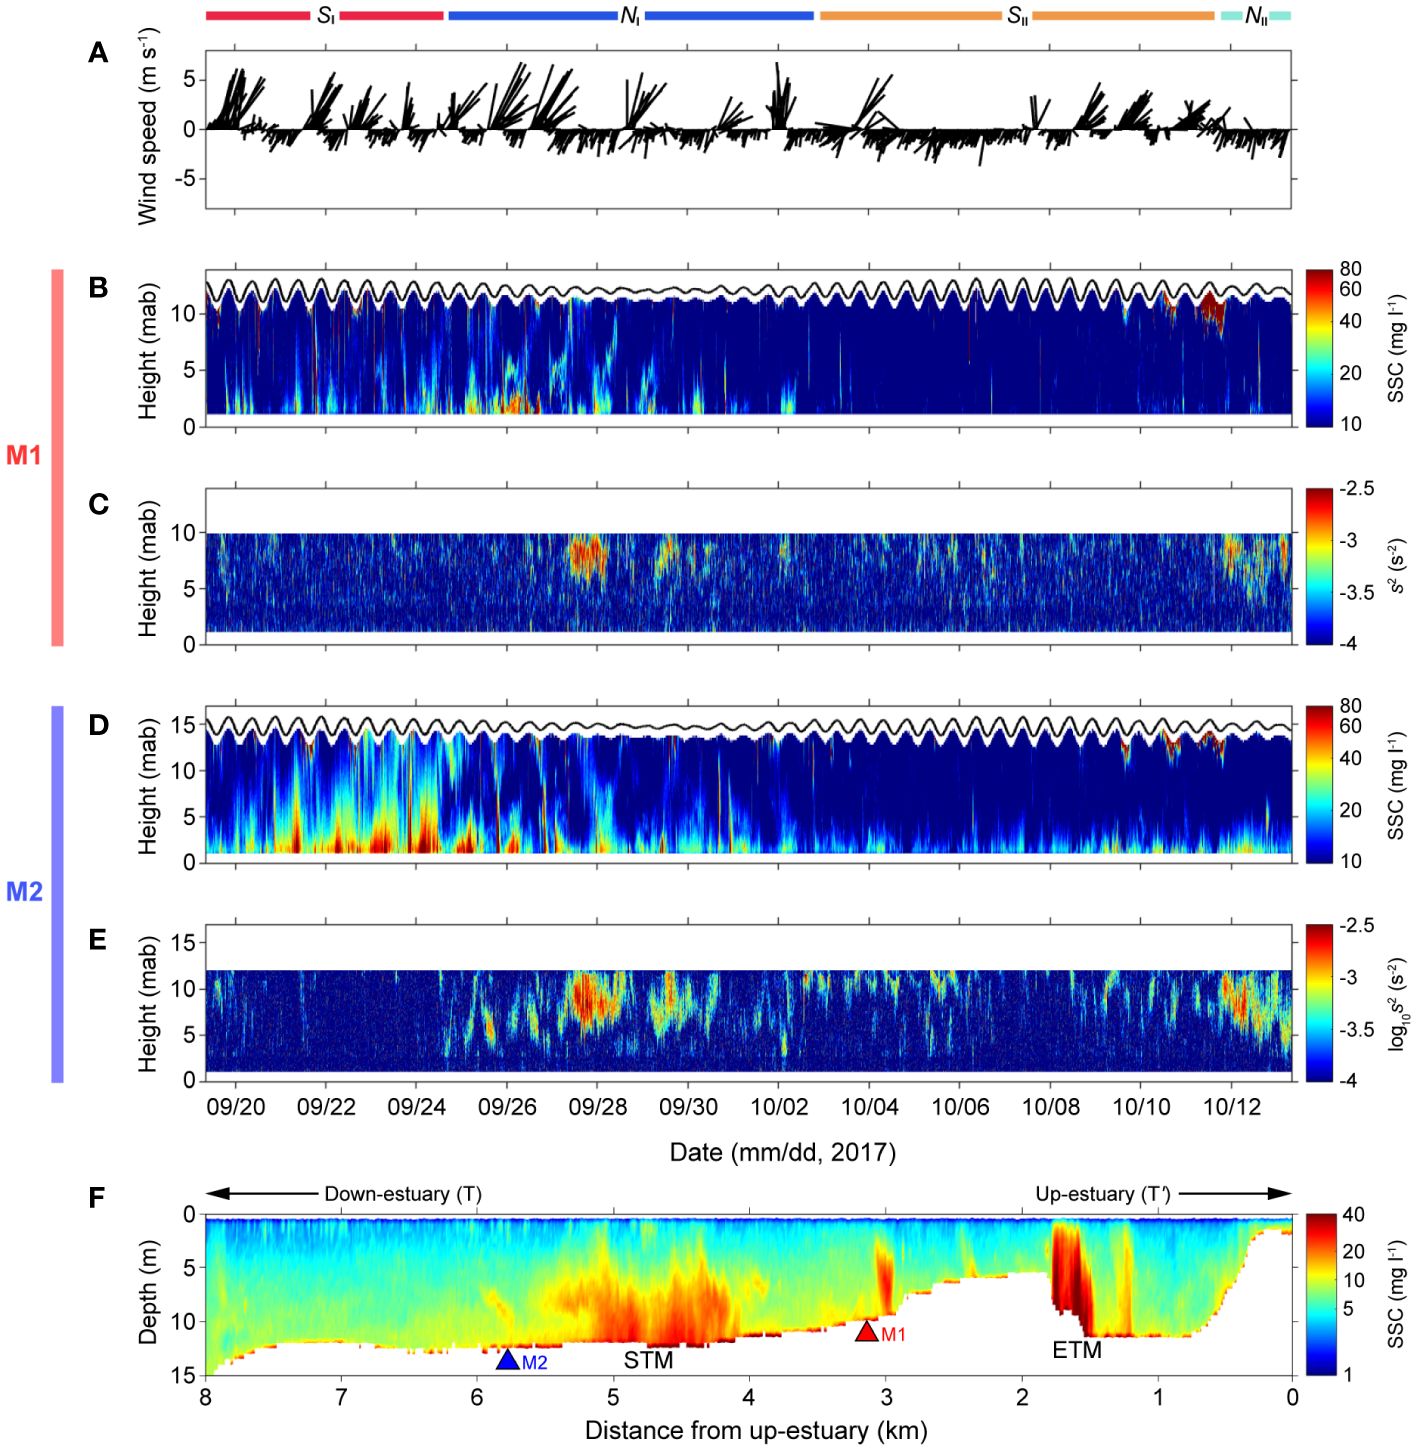
Figure 5 Time series of (A) wind speed, SSCs, and s2 measured by moored ADCP at (B, C) M1 and (D, E) M2, and (F) SSC measured by an axial survey on October 12, 2017. The stripped colorbars at the top of the figure indicate the spring (SI and SII) and neap (NI and NII) tides. The unit of height is meter above bed (mab). Note that the SSCs may be slightly exaggerated by inclusion of air from white-capping, estuarine fronts, vessels, and schooling fish or zooplankton.
Unlike utide, the signal of coastal seiches with 1-h period appeared persistently over the entire measurement periods (Figures 3, 4A, D). Coastal seiches affected the water column through repetitive back-and-forth horizontal motions along the main channel but had different characteristics depending on the distance from the node. Coastal seiches measured at M1 and M2 had a motion close to the standing wave with phase lags of 66.44°C and 68.56°C between current velocity and water elevation, respectively (Figures 3B, D). As they propagated toward shallow onshore from M2 to M1, their velocity weakened while the amplitude of the sea level variation was amplified (Figures 3A, C). In practice, the coastal seiches at M2 close to the entrance of the bay had a high velocity (useiche) fluctuations in the range of −0.08–0.08 m s−1 with relatively small fluctuations of sea level (−0.06–0.06 m) (Figure 6). At M1 near the head of the estuary, the useiche decreased by 38% compared to M2 and was only in the range of −0.05–0.05 m s−1, while the range of sea level variation increased by 160% to −0.1–0.1 m. Over the entire measurement period, the mean magnitudes of useiche were 0.010 m s−1 at M1 and 0.017 m s−1 at M2. The useiche were relatively small in magnitude but contributed 20.75% and 31.62% to the total u at M1 and M2, respectively, and 40.72% and 39.42% to the u′ on average (Supplementary Figure S1).
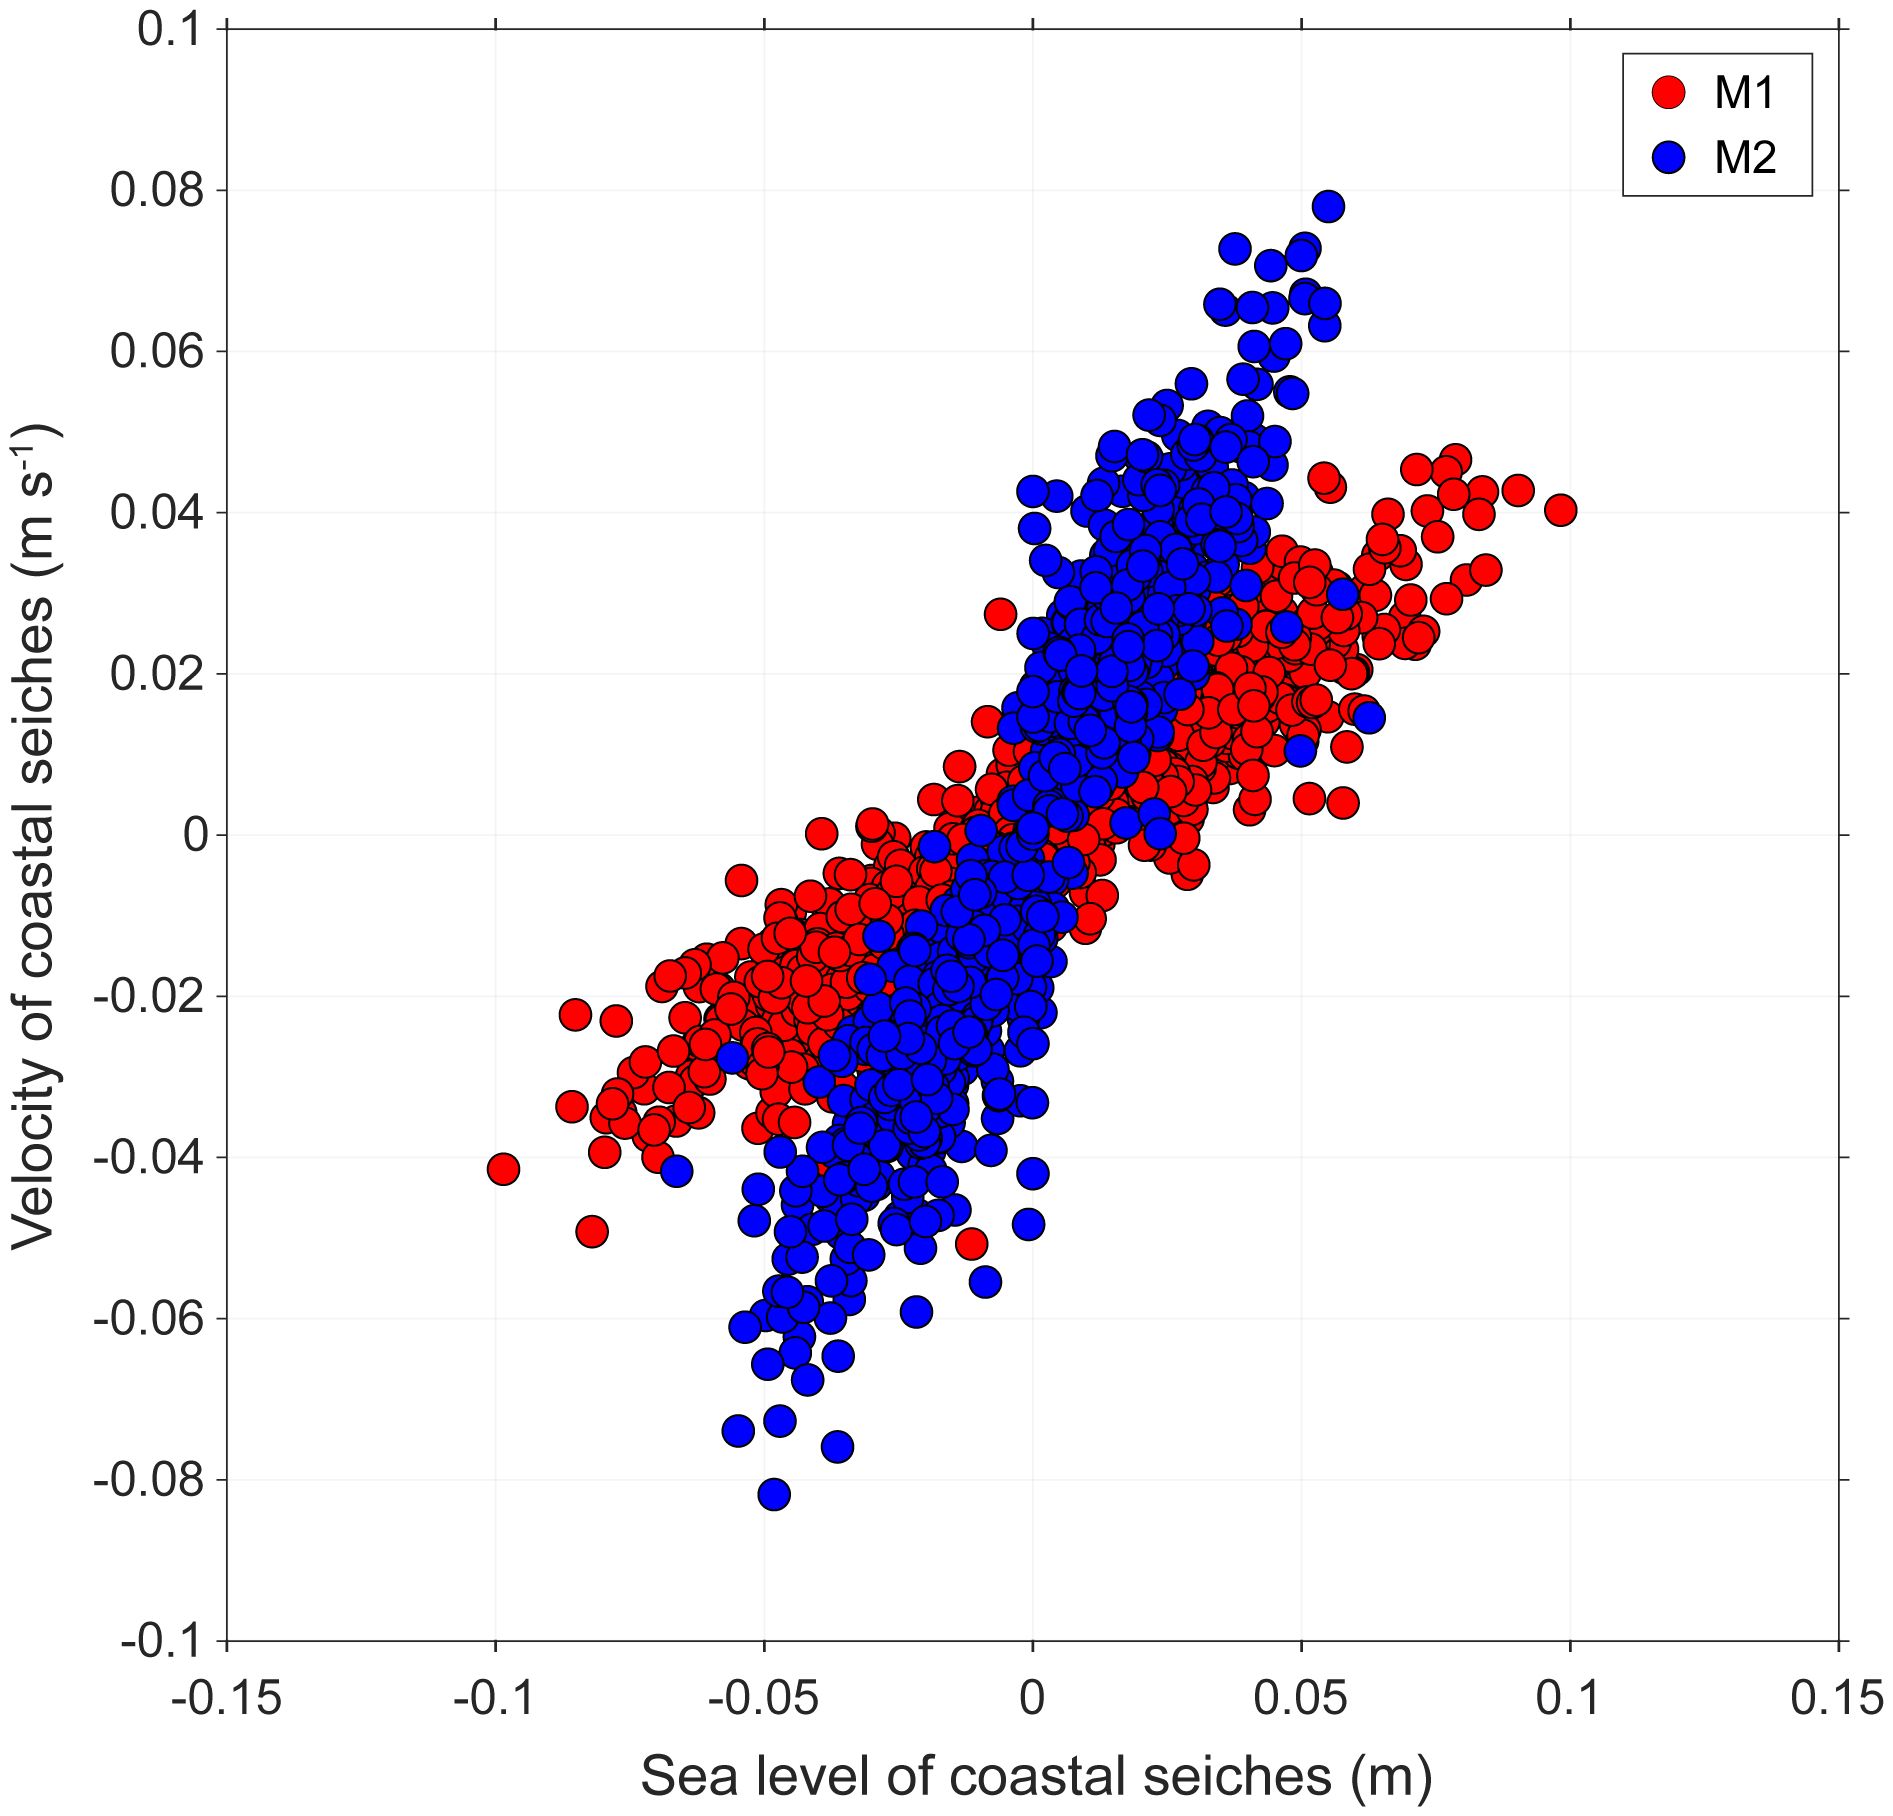
Figure 6 Relationship between 1-h band-pass filtered current (coastal seiches) velocities and sea levels at M1 (red) and M2 (blue). Positive and negative values indicate the landward and seaward flows.
Sediment resuspension and flux
The mobile sediment pool distributed along the main channel was disturbed by near-bed currents, forming the turbidity maxima (Figure 5F). In view of variability in SSC, the sediment behaviors at M2 were more dynamic than at M1. For the M1 between ETM and STM, the sediment resuspension occurred mainly in SI and NI, with near-bed SSC of 7–51 mg l−1 (Figure 5B). However, these resuspension events occurred episodically, and a high SSC (> 51 mg l−1) was frequently detected in the surface rather than the bottom because of the surface dispersion of the turbid plume. The near-bed SSC at M2 was influenced by the STM that developed approximately 1.5 km wide in the central part of the main channel, which was 7–80 mg l−1 with the instantaneous SSC > 100 mg l−1 (Figures 5D, F). The SSC had a diurnal pattern in SI and NI depending on the sea breeze (Figures 5A, D). The bed sediments resuspended during northerly winds generated the STM, and the suspended sediments then temporarily settled down during southerly winds. The near-bed SSC increased gradually to 80 mg l−1 as the sea breeze was repeated in SI (September 20–24, 2017). The height, where sediments were resuspended in the water column, also increased to reach the water surface. This height was suppressed to < 5 mab by increased s2 when two-layered residual circulation was intensified in NI (Figures 5D, E). The position of STM was moved gradually toward the land because the residual circulation strengthened in NI and SII. Sediment resuspension barely occurred, even though the current velocity applied to the bed in SII was similar to that in SI. Thus, the SSC in the water column returned to the background SSC (~7 mg l−1) (Figure 5D).
A series of resuspension at both M1 and M2 had a marked effect on an increase in the instantaneous flux F (Figures 7A, D). During the spring tides (SI and SII), F at both stations exhibited landward and seaward periodicity during the flood and ebb tides, respectively. Compared to F (flood: 1.12×10⁻³ kg m−2 s−1; ebb: −0.59×10⁻³ kg m−2 s−1) at M1 with low sediment supply, the F at M2 influenced by STM reached up to 6.74×10⁻³ kg m−2 s−1 in the bottom layer during the flood tide and −2.52×10⁻³ kg m−2 s−1 during the ebb tide. When the STM moved toward the land in SII, the F at M2 decreased sharply regardless of the tidal cycle and had a low F of 0.30×10⁻³ kg m−2 s−1 for the wash load. In addition, during the neap tides (NI and NII), regardless of the tidal cycle, the F at M1 and M2 were 0.41×10⁻³ kg m−2 s−1 and 1.23×10⁻³ kg m−2 s−1 in the bottom layer, respectively, on average. Over the measurement period, the suspended sediments at M1 and M2 were generally transported toward the land with positive qtotal under the balance between tidal and residual currents (Figures 7B, E). The suspended sediments were controlled mainly by the residual currents owing to the high buoyancy of STM (or ETM), resulting in a qmean at M1 and M2 of 92% and 94% of qtotal, respectively. The cumulative qcorr at M1 and M2 reached up to 150 kg m−1 and 429 kg m−1, respectively, and tended to be slightly transported toward the land when the events of sediment resuspension occurred (Figures 7C, F).
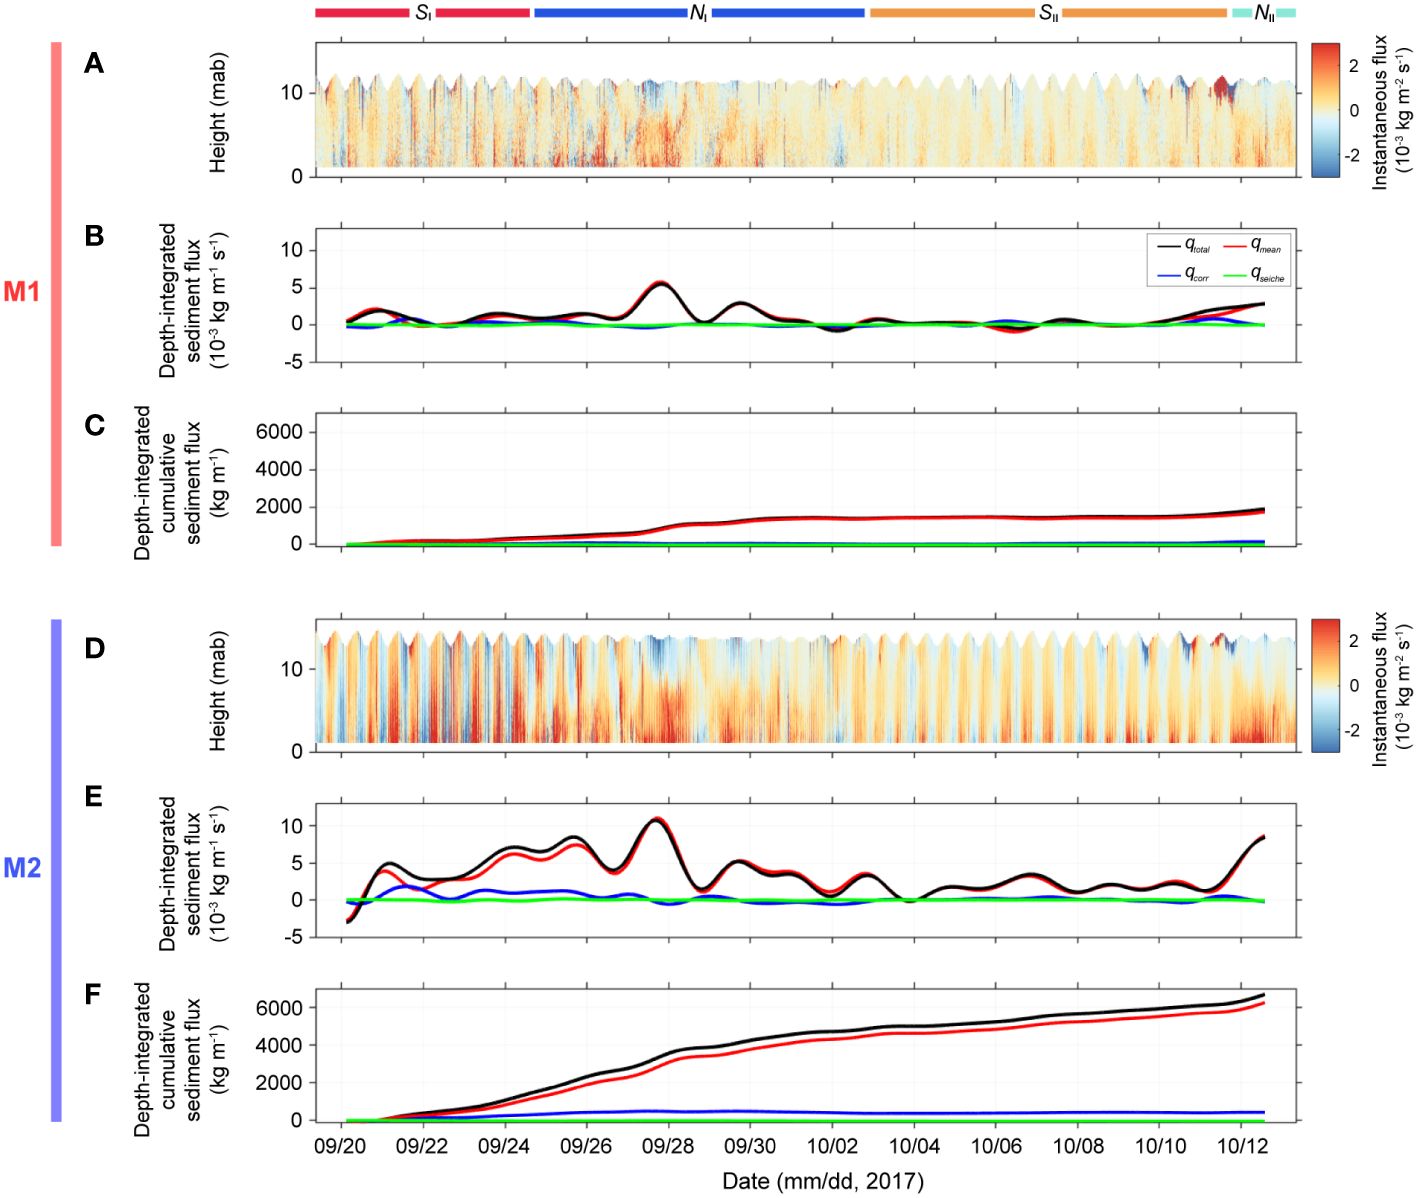
Figure 7 Time series of (A, D) instantaneous flux, (B, E) depth-integrated sediment flux, (C, F) depth-integrated cumulative sediment flux at M1 and M2. Positive and negative values in (B, E) indicate the landward and seaward transports, respectively. The stripped colorbars at the top of the figure indicate the spring (SI and SII) and neap (NI and NII) tides. The unit of height is meter above bed (mab).
Relationship between coastal seiches and suspended sediments
The coastal seiches occurred consistently with 1-h (±30 min) interval as a barotropic structure (Figures 8A, B, G, H). In accordance with the period of coastal seiches, the sediments concentrated near the bed, and turbid plumes in the bay fluctuated (Figures 8E, F, K, L). As shown in Figure 9, the SSC anomalies were symmetrical in the range of −35–50 mg l−1 (skewness: 7.37) at M1 and −43–46 mg l−1 (skewness: 10.72) at M2, along with a symmetrical coastal seiches velocity. The results suggest a strong correlation between useiche and SSC anomaly because of similar histogram features (Supplementary Figure S2), but this did not mean that a larger useiche indicated a larger SSC anomaly. For example, when the sediment resuspension (SSC > 40 mg l−1) occurred at M2 on September 22, 2017, the SSC anomaly fluctuated consistently in the range of −30–37 mg l−1 from 04:00 AM to 7:00 PM along with two peaks of resuspension on 06:00 AM and 6:00 PM (Figure 8F). In contrast, useiche, which was minimal (< 0.01 m s−1) at 07:00 AM, increased rapidly to 0.07 m s−1 at 12:00 AM and remained almost constant without an apparent decrease for 10 h. This result shows that the magnitudes between useiche and SSC anomaly were not highly correlated despite varying the same frequency. To clarify the relationship between them, the SSC anomaly did not increase proportionally to the useiche when useiche over the entire period was rearranged in ascending order (Figures 9E, F). At M1 and M2, even weak useiche of less than 0.01 m s−1 caused the SSC anomaly of up to 50 mg l−1, whereas even strong useiche of 0.08 m s−1 caused an SSC anomaly of only 5 mg l−1. Although the coastal seiches influenced the fluctuations of suspended sediments, they did not contribute predominantly to enhancing the SSC anomaly. The SSC anomaly in the water column depended on whether the bed sediments are eroded or the turbid plumes is spread, by other forcings such as winds and tides.
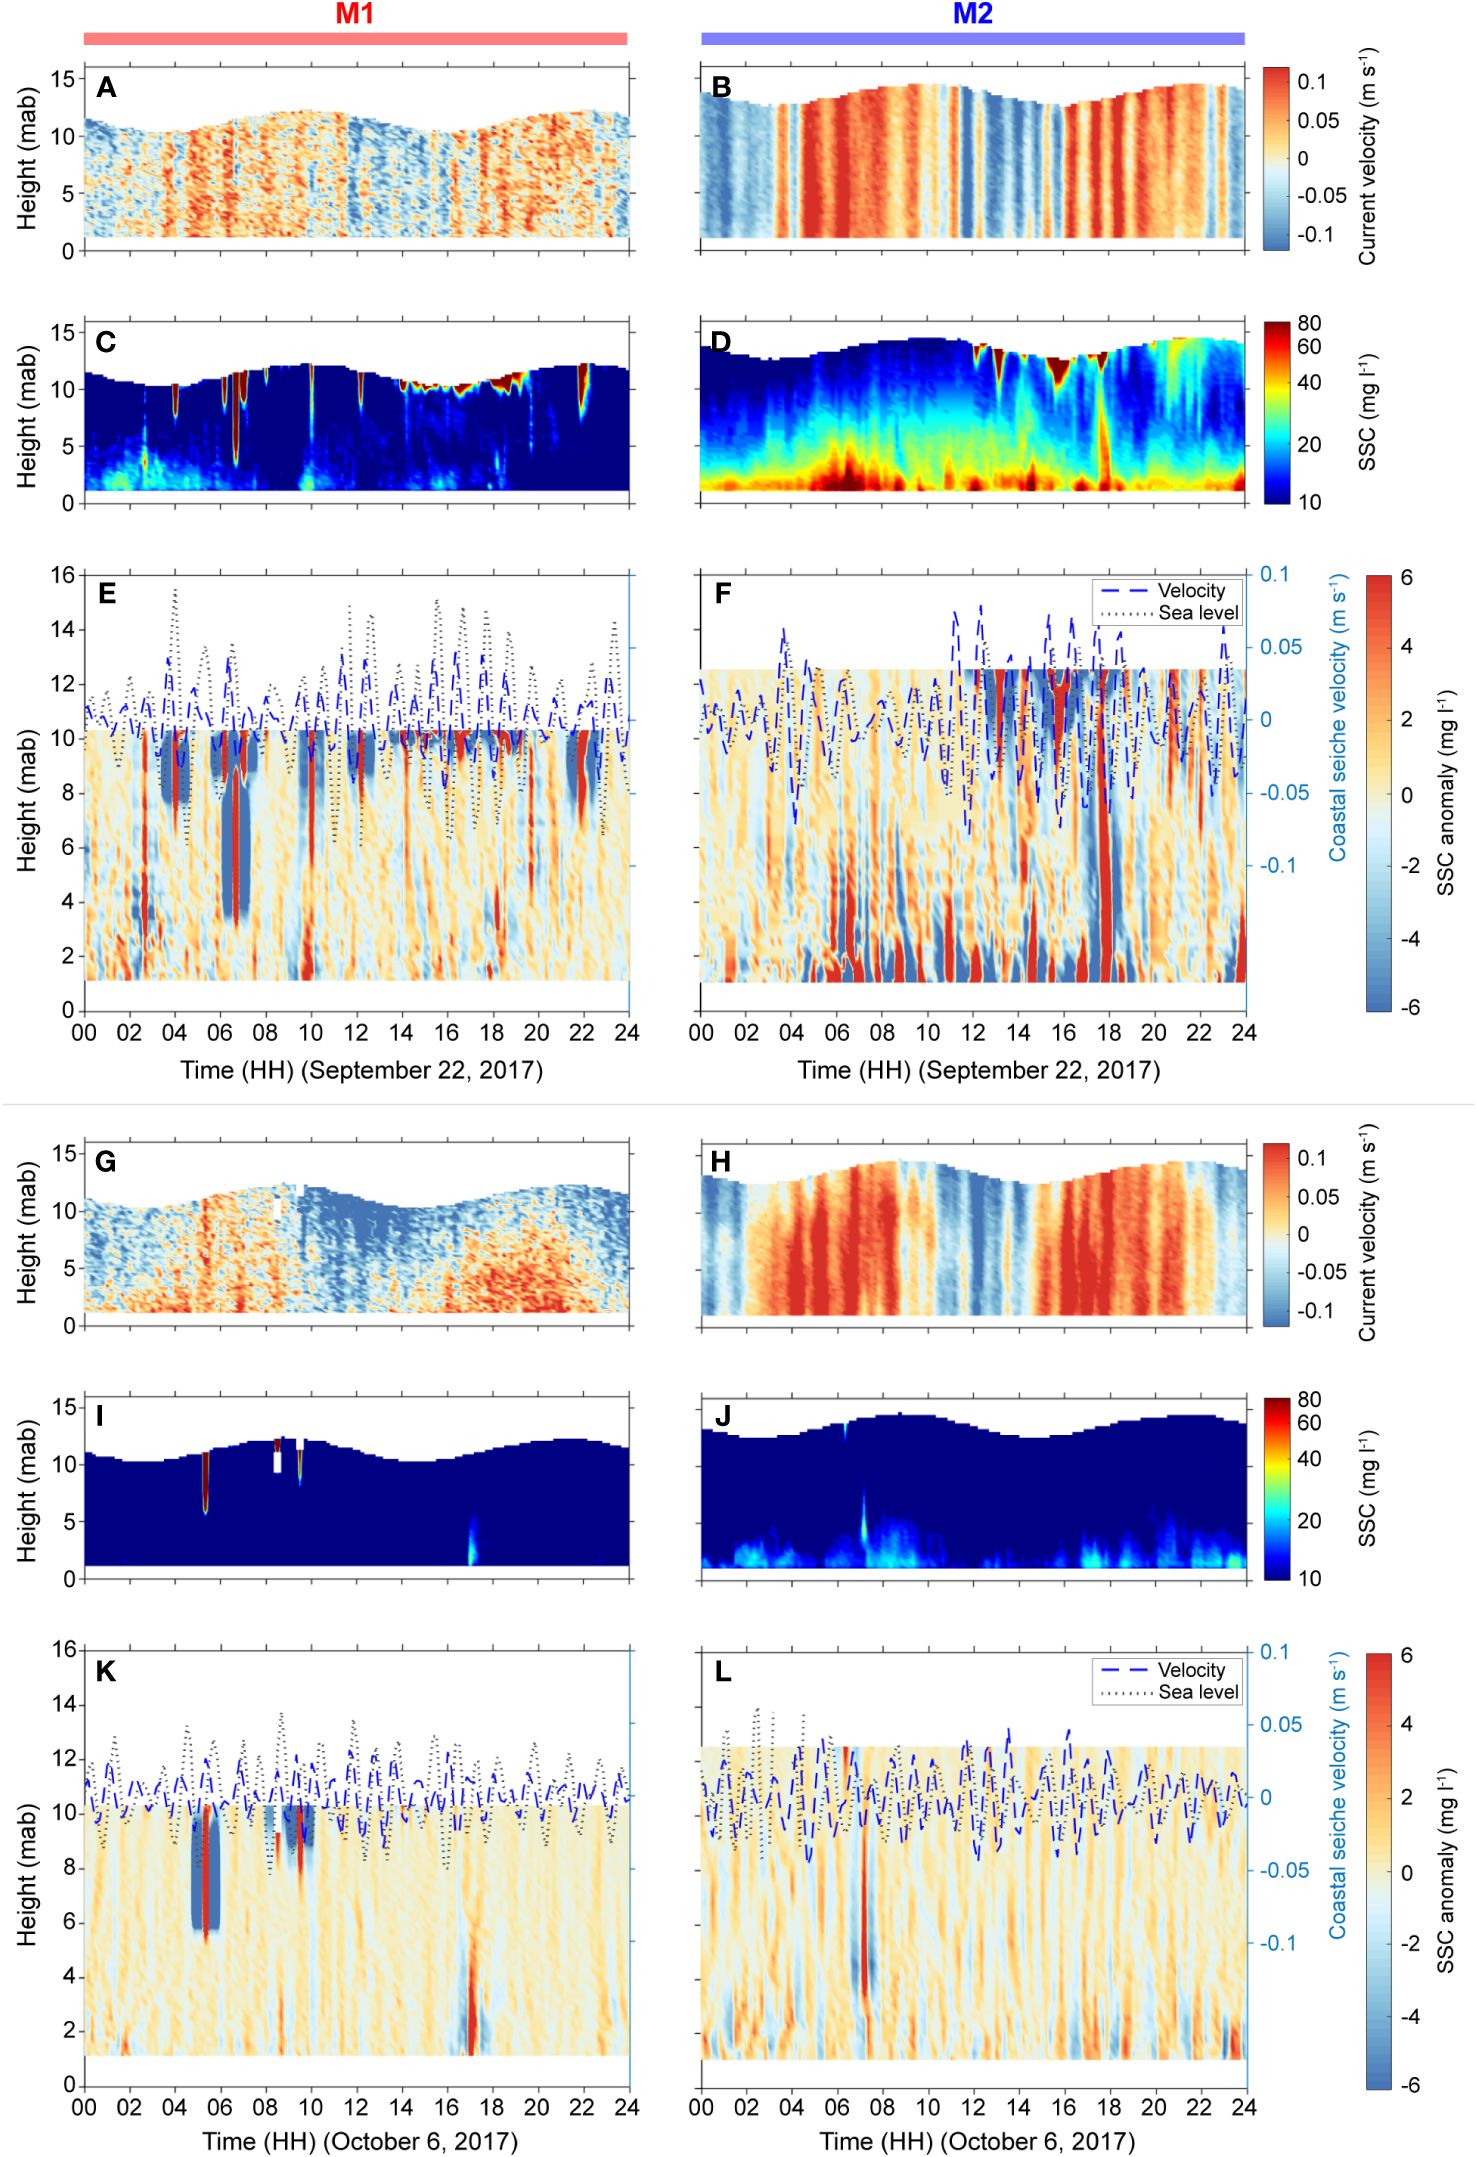
Figure 8 Fluctuations of SSC by coastal seiches at M1 and M2 on September 22 and October 6, 2017: (A, B, G, H) total current velocity, (C, D, I, J) SSC, and (E, F, K, L) SSC anomaly. Blue dashed and black dotted lines in (E, F, K, L) represent the velocity and sea level variations of coastal seiches, respectively. The unit of height is meter above bed (mab). Note that the SSCs may be slightly exaggerated by inclusion of air from white-capping, estuarine fronts, vessels, and schooling fish or zooplankton.
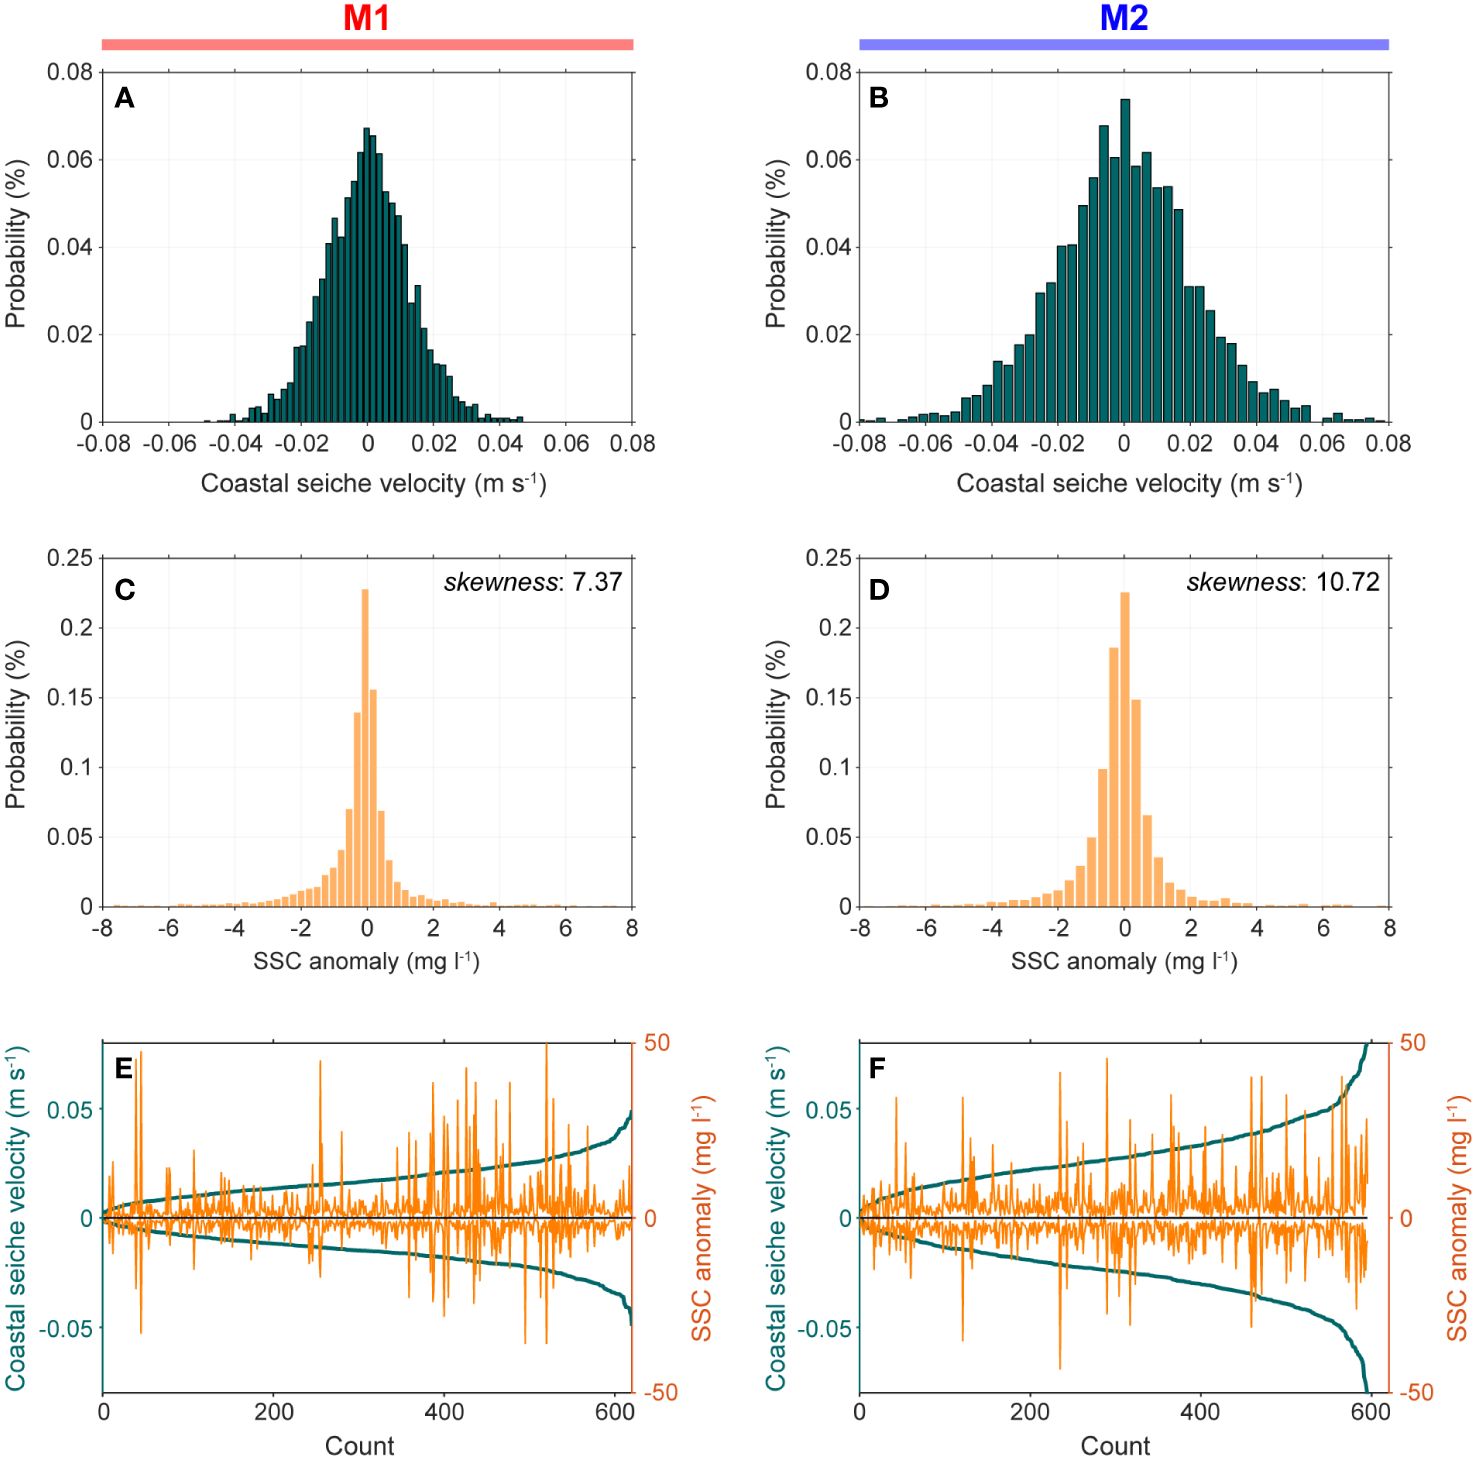
Figure 9 Probability of (A, B) coastal seiches velocity and (C, D) SSC anomaly in M1 and M2. (E, F) SSC anomaly (yellowish lines) and coastal seiches velocity (green lines) rearranged in ascending order.
The sediments resuspended from the bed were influenced repeatedly by the horizontal motions of coastal seiches. At each pulse of coastal seiches at M2 (M1), they were transported toward the land or sea, with Fseiche of 0.040×10⁻³ kg m−2 s−1 (0.027×10⁻³ kg m−2 s−1) near the bed, on average. When the STM was developed, Fseiche increased to > 0.3×10⁻³ kg m−2 s−1 at M1 and to > 0.4×10⁻³ kg m−2 s−1 at M2. However, the bidirectional Fseiche canceled each other out owing to the characteristics of back-and-forth horizontal motions of coastal seiches, so thus the qseiche was not heavily biased to either side. Although the cumulative qseiche at M2 (M1) remained only −36.21 kg m−1 (−17.04 kg m−1), the qseiche was equivalent to qmean and qcorr when the resuspension rarely occurred (i.e., SII). Over the entire period, these qseiche at both stations accounted for 10% and 1% of the cumulative qcorr and qtotal (Figures 7C, F).
Discussion
The coastal seiches with 1-h period could not be negligible for the total current fields in Masan Bay. The suspended sediments responded consistently to the coastal seiches, showing high SSC fluctuations with STM developed under tidal and residual currents. Owing to the bidirectional characteristics of coastal seiches, the qseiche accounted for only 1% of the qtotal. Tidal and residual currents often masked the impacts of coastal seiches on the suspended sediments. Hence, three perspectives on their role in sediment behaviors were discussed as follows.
Resuspension of bed sediments by coastal seiches
The coastal seiches in shallow regions are usually accompanied by horizontal currents in the bottom layer and enhance near-bed current velocity (Rabinovich, 2009). The bed sediment particles can be resuspended if the seiche-enhanced current velocity exceeds an erosion threshold (Gloor et al., 1994; Basterretxea et al., 2011). Depending on the local properties, coastal seiches may be one of the causes of sediment resuspension when they are enhanced comparable to tidal and residual currents. As listed in Table 1, the characteristics of coastal seiches in Jiaozhou Bay (China), Port Kembla Harbor (Australia), and Mediterranean Harbor (Italy), which have a period of several tens of minutes and current velocity of around 0.1 m s−1, were similar to those in Masan Bay except for the energy source (Jordi et al., 2008; Luick and Hinwood, 2008; Yuan et al., 2008). Most played as much of a significant role in sediment resuspension as tide and wind forcing. They kept the bed sediment unconsolidated and made it readily resuspendable in subsequent events, forming a high SSC of several tens of mg l−1 despite the coarser silt and sand composition (Table 1) (Yuan et al., 2008; Grifoll et al., 2019). The coastal seiches in Masan Bay also contributed to enhancing the near-bed current velocity through back-and-forth horizontal motions (M1: −0.05−0.05 m s−1; M2: −0.08−0.08 m s−1), but it was considered not to cause sufficient bed disturbances to resuspend the bed sediments.
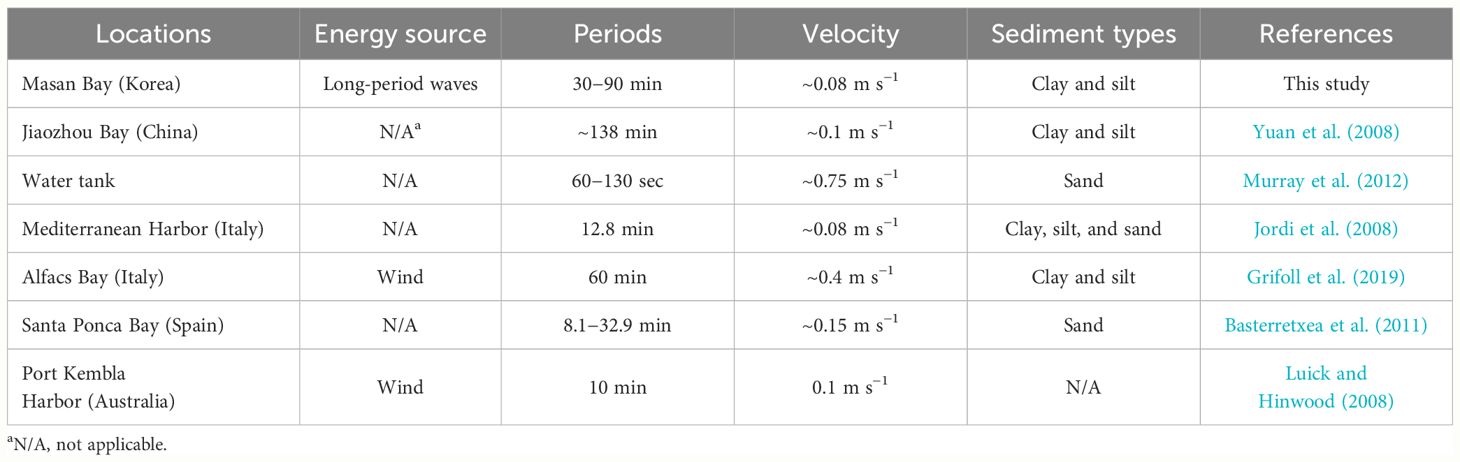
Table 1 Characteristics of coastal seiches observed in previous studies.
The mobile sediment pool with a thick layer of loosely aggregated cohesive sediments was distributed along the main channel of Masan Bay (Geyer, 1993; Lin and Kuo, 2001; Seo et al., 2022). In SI, it was easily disturbed and resuspended, even under the slow currents (< 0.1 m s−1). Fine-grained sediments on the mobile sediment pool could be supplied to the upper water column by even northerly winds of < 2.8 m s−1 during slack tides, resulting in STM with > 40 mg l−1. In SII, the consolidated bed exposed by the STM being moved toward the land required a current velocity of at least > 0.18 m s−1 to be resuspended (Seo et al., 2022). Therefore, the sediment bed with different erosion thresholds was distributed depending on the STM position, even though the coastal seiches consistently caused a disturbance of the sediment bed over the entire period. If the coastal seiches caused a sufficient disturbance of the bed, the erodible sediments with erosion threshold less than 0.1 m s−1, such as the mobile sediment pool (Seo et al., 2022), would have been thickly distributed regardless of the STM position. Even if the coastal seiches could not cause sediment resuspension directly, the SSC anomaly by coastal seiches would also have been detected without significant differences between spring tides (SI and SII). Considering these conditions, the contribution of coastal seiches to the sediment behavior depended on the position of the STM and was premised on resuspension by external forcings.
Uplift of suspended sediments by coastal seiches
The effects of coastal seiches on the resuspension of bed sediments were insignificant in Masan Bay without external forcings, such as tides and winds. As long as the bed sediments were resuspended by them, however, the coastal seiches had a marked effects on SSC anomaly. Once the bed sediments were entrained by the external forcings, they could be immediately diffused toward the direction of decreasing concentrations and maintained in suspension (Yuan et al., 2008) (Supplementary Figure S3). As the diffusion occurred, the spatial distributions of SSCs were expanded from the bed to the surface layers (Figure 10B). Consequently, in Masan Bay, the vertical motion of coastal seiches helped enhance the sediment horizontal flux in the surface layer. A weak vertical motion in the range of −0.01–0.01 m s−1 coincided with the back-and-forth horizontal motions at the anti-node at each pulse of coastal seiches. They would have reacted with the tidal currents to partially produce a flow reversal and provide a vertical mixing (Talke and Stacey, 2008; Yuan et al., 2008). Despite relatively low contribution of useiche on the vertical mixing compared to utide (Supplementary Figure S4), the suspended sediments were lifted to the upper layer where they would not have risen if not for the vertical motion of coastal seiches. As shown in Figures 8 and 10, in practice, the suspended particles within the STM at M2 fluctuated in accordance with the period of coastal seiches. Repetitive coastal seiches vertically pumped the position of diffusing suspended sediment particles, generating the SSC fluctuations in the sawtooth form at 1-h period. At high SSC of 40 mg l-1, the amplitudes of its isoline were only within a few tens of centimeter (Figure 8B). The lower the SSC, the higher amplitudes of its isoline due to vertical mixing, which had a sufficient diffusion range to cover the entire water column (Figure 10B). This lifting effect applied equally to the turbid plume (M1) and near-bed load regardless of the behavior types of suspended sediments (Figure 10A). For all behaviors of the suspended sediments over the entire period, the horizontal fluxes for those uplifted above the position of suspended sediments assumed to be free of fluctuations by coastal seiches reached 51×10−3 kg m−1 s−1 (standard SSC: 20 mg l−1) at M1 and 83×10−3 kg m−1 s−1 (standard SSC: 20 mg l−1) at M2 (Figure 10). Although the sediment diffusion was suppressed by enhanced s2 in the neap tides (NI and NII) (Teng et al., 2022; Zhang et al., 2022), the cumulative uplifted fluxes at M1 and M2 over the entire periods were up to 3.05 kg m−1 and 2.77 kg m−1, respectively, regardless of the direction. The upper layer of the water column could be supplied continuously with other sediment particles from the lower layer by the coastal seiches, equivalent to approximately 1% of the cumulative qseiche at both M1 and M2.
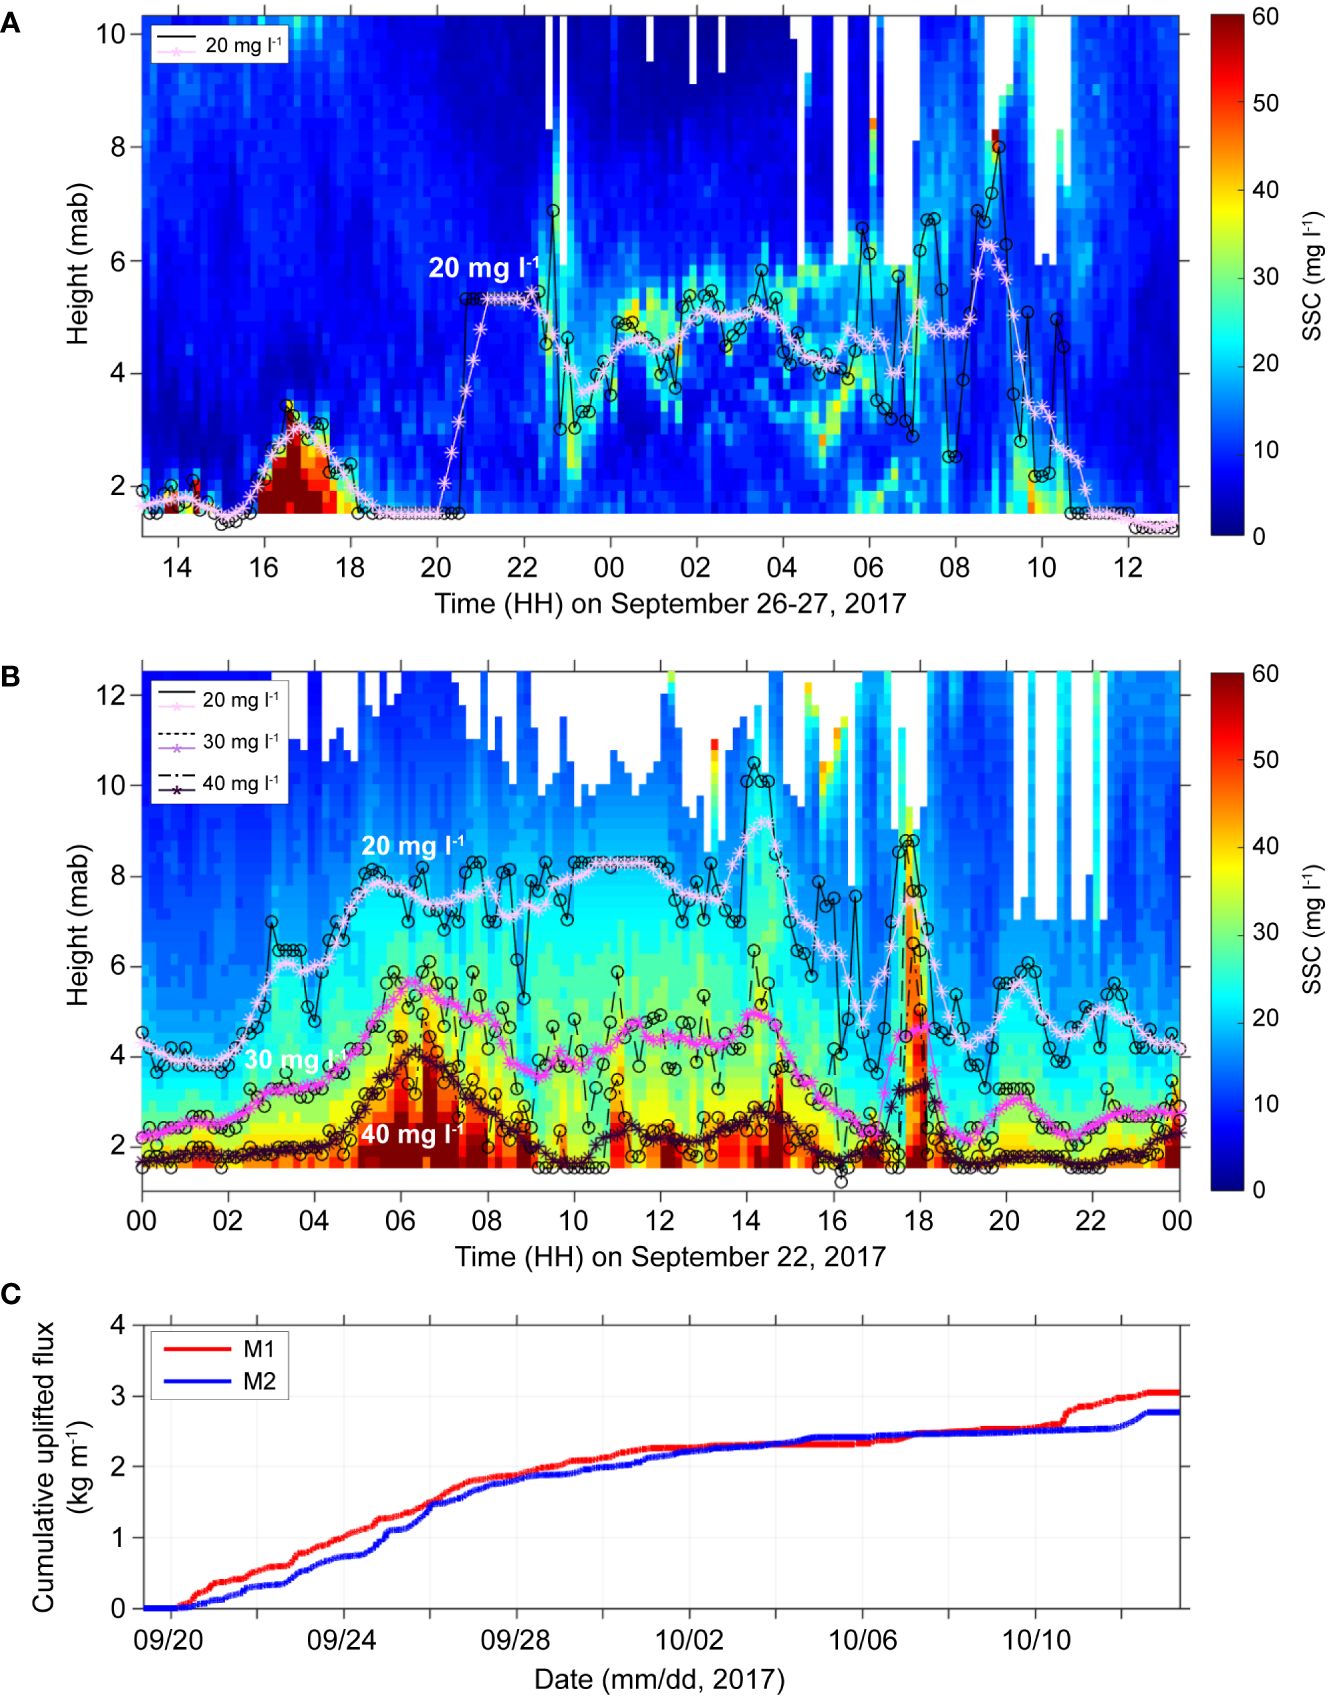
Figure 10 Fluctuation of SSC by coastal seiches on (A) September 26−27, 2017, at M1 and (B) September 22, 2017, at M2. Contours of 20, 30, and 40 mg l−1 for standard SSC and moving-averaged SSC are given as black and purple lines, respectively. (C) Cumulative uplifted flux caused by coastal seiches at M1 (red line) and M2 (blue line). White shaded areas in (A, B) are where the plumes were removed to detect the SSC by resuspension. The uplifted flux indicates the area of standard SSC above the moving-averaged SSC. The unit of height is meter above bed (mab).
Redistribution of suspended sediments by coastal seiches
As a feature of the back-and-forth coastal seiches, the cumulative qseiche accounted for only 1% of the total, which does not appear to contribute much to sediment transport. On the other hand, the tendency, in which suspended sediments were lifted and advected as much as 0.4×10⁻³ kg m−2 s−1 by a pulse of coastal seiches, suggested that they significantly affected the sediment behaviors. The contribution of coastal seiches to sediment transports in the bay can be evaluated differently for each sedimentary condition because this effect could be enhanced or reduced drastically depending on whether the STM was developed or not. To determine the distance traveled by a water parcel (or sediment particle) during a half period of coastal seiches, regardless of the STM, the excursion length (Elseiche in m) was calculated using following Equation 8:
where and T are the velocity amplitude (m s−1) and periods (s) of coastal seiches, respectively (Johansson, 2010; Cerralbo et al., 2015; Björk et al., 2017; Lafta, 2021). The sediment particles at M2 could travel toward the land or sea as much as Elseiche (< 57 m) for every pulse of coastal seiches unless the useiche does not strengthen (Figure 11). In particular, the Elseiche at M1 decreased to < 32 m because the useiche gradually slowed down as it moved away from the node, further shortening the sediment transport trajectory. Unlike the tidal (Eltide ~420 m) or residual current that caused even STM movements (Seo et al., 2022), the Elseiche was too short compared to their transportable amounts of suspended sediments, indicating a redistribution process at the immediate vicinity (Figure 11). Given the long wavelength (~35 km) of coastal seiches and the shallow water depth (~15 m), this process was driven primarily by the seiche-induced lifting effects on the suspended sediments than the advection. As more coastal seiches were repeated, the bidirectional coastal seiches could partially offset more current flows, which induced sediment stagnation rather than circulation in the bay. Applying the redistribution processes to the STM, the Elseiche was only approximately 3% of the width (1.5 km) of the STM located in the central part of Masan Bay. Even if the sediment particles within the STM were advected (0.4×10⁻³ kg m−2 s−1 at M2) by coastal seiches, they could not leave its region. Under the dominant tidal and residual currents, the coastal seiches continued to trap the suspended sediments partially and pump vertically. Considering the sluggish water circulation in Masan Bay (Park et al., 2011; Seo et al., 2022) and the short Elseiche at M1, coastal seiches would cause a redistribution in a narrower range as the STM moves toward the land in NI and SII. Unless the coastal seiches lift the suspended sediments to sea level and discharge them out to sea by estuarine circulation, more sediment stagnation will occur in the inner part of the bay.
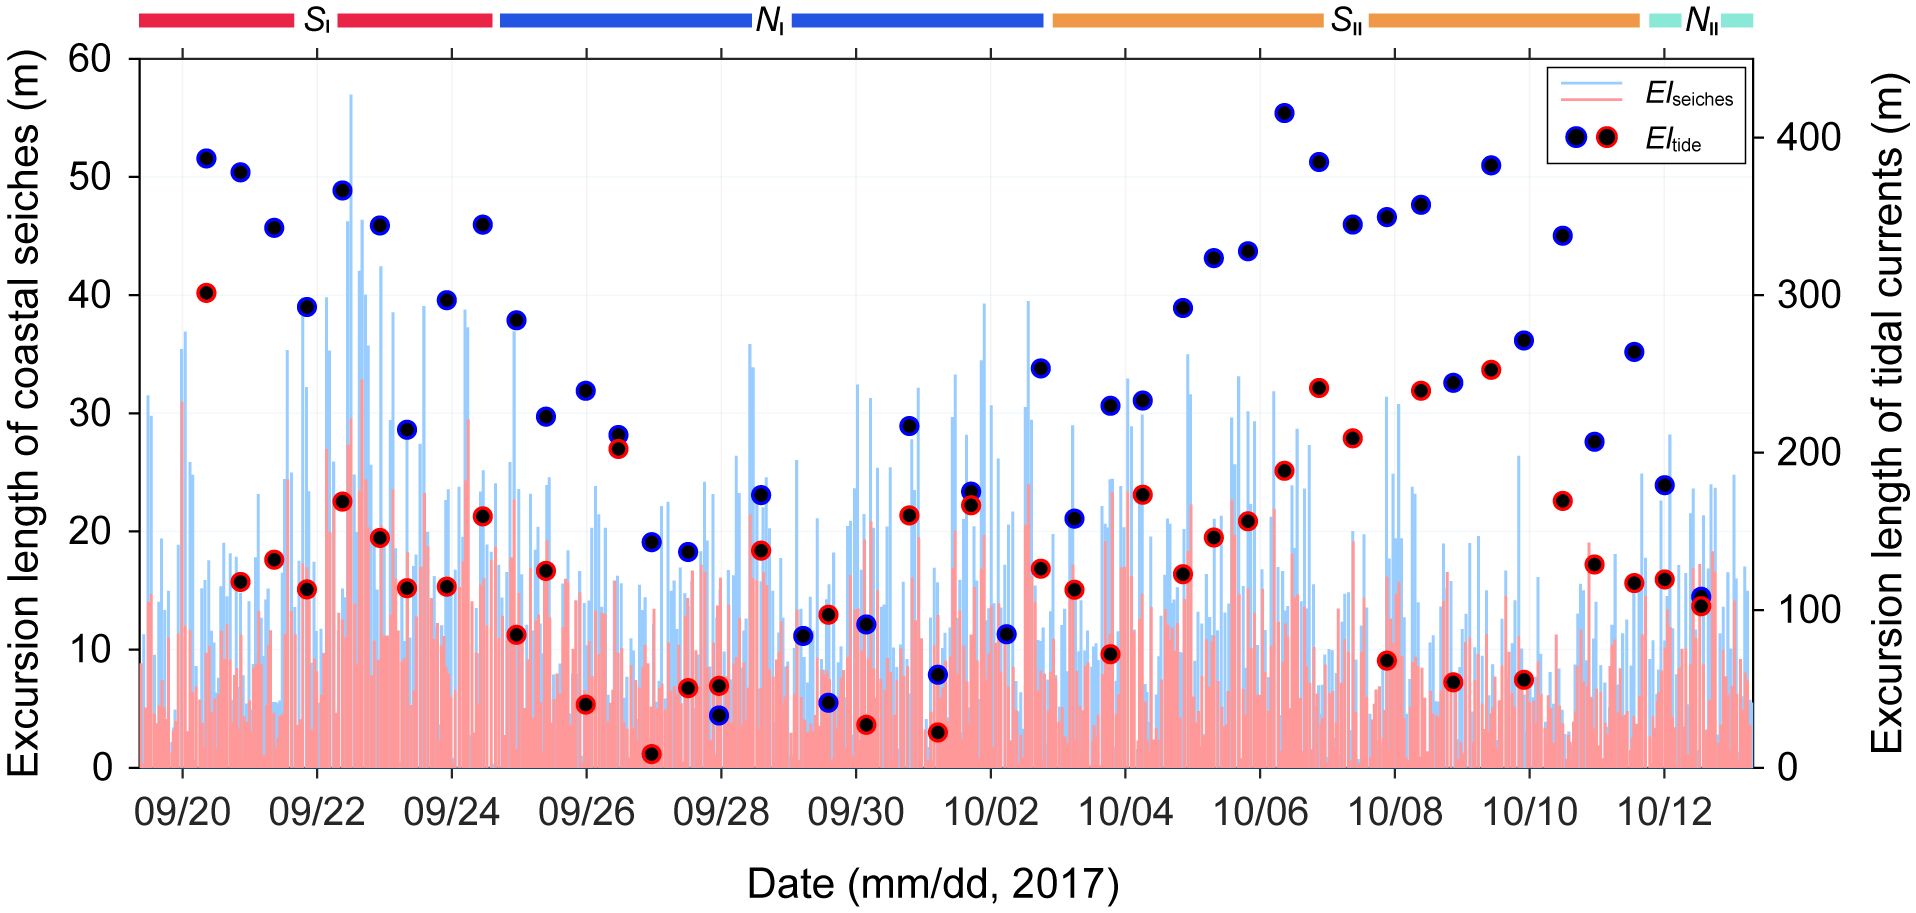
Figure 11 Time series of Elseiche (vertical bars) and Eltide (circles). Red and blue colors indicate M1 and M2, respectively. The stripped colorbars at the top of the figure indicate the spring (SI and SII) and neap (NI and NII) tides.
The effect of persistent coastal seiches on the vertical redistribution of sediments can be maximized when sediment resuspension events occur or turbidity maxima develop. Eventually, this can promote the potential to cause secondary problems, such as pollutant release, an increase in residence time, and a change in inorganic nutrients (Heyes et al., 2004; Basterretxea et al., 2011; Spieckermann et al., 2022). The water exchange with the open sea by the coastal seiches that can induce circulation in the bay must be accompanied to prevent these problems. However, as above, the short Elseiche was only approximately 3% of an almost 2 km long entrance. This allowed a part of the water only to be pumped back and forth within the channel instead of renewing the bay water volume. In other words, the impact of coastal seiches on the water column is limited only within the bay. They would not be sufficient to address the possible problems caused by redistribution despite repetitive fluctuation and be dependent on the tidal and residual currents.
Conclusions
In situ moorings and axial surveys using ADCPs were conducted to reveal the effects of coastal seiches on sediment transport behaviors in a microtidal Masan Bay. The following conclusions were drawn:
(1) Coastal seiches, close to standing waves originating from the mouth of Jinhae Bay, fluctuated with a 1-h period within the bay. With velocities up to 0.05 m s−1 at M1 and 0.08 m s−1 at M2, they accounted for approximately 30% of the total current fields. At each pulse, the coastal seiches caused the back-and-forth motions of current flows along the main channel as a barotropic structure.
(2) Even if the coastal seiches enhanced the near-bed current velocity, they could not resuspend the sediments from the bed (i.e., consolidated bed and mobile sediment pool). On the other hand, the suspended sediments fluctuated with an SSC anomaly of 8 mg l−1 in response to the coastal seiches without appreciable bias toward the land or sea. The SSC anomaly depended on the sediment resuspension by external forcings (e.g., tides and winds) rather than coastal seiches.
(3) As long as the bed sediments were resuspended, the coastal seiches lifted the sediment particles by > 4 m to the upper layer where they would not have risen if not for the vertical motion of coastal seiches. The cumulative uplifted fluxes (standard SSC: 20 mg l−1), regardless of the direction at M1 and M2, were up to 5.09×10⁻³ kg m−1 s−1 and 4.62×10⁻³ kg m−1 s−1, respectively. They were equivalent to approximately 1% of the cumulative qseiche.
(4) A pulse of coastal seiches could advect the suspended sediments as much as 0.4×10⁻³ kg m−2 s−1 depending on the position of STM. However, the Elseiche was too short (< 57 m at M2), which was only 3% of STM width (1.5 km). Even if the coastal seiches repetitively fluctuated water column, the suspended sediments could not leave the STM, showing a redistribution process within the immediate vicinity. This process intensified in a narrower range as the Elseiche (< 32 m at M1) decreased further in the inner parts of the bay, causing stagnation.
(5) The coastal seiches were expected to enhance the potential for water pollution by causing repetitive sediment redistribution. However, this study has been mainly focused on fluctuations of suspended sediment by coastal seiches at only two mooring stations. In future work, to broadly understand the impact of coastal seiches on the water pollution, the numerical model considering the shape of bay, occurrence of long-period waves, and plume dispersion should be performed.
Data availability statement
The raw data supporting the conclusions of this article will be made available by the authors, without undue reservation.
Author contributions
JS: Conceptualization, Data curation, Formal analysis, Investigation, Methodology, Validation, Visualization, Writing – original draft, Writing – review & editing. B-JC: Conceptualization, Methodology, Validation, Writing – review & editing. SC: Data curation, Methodology, Validation, Visualization, Writing – review & editing. JR: Conceptualization, Methodology, Validation, Writing – review & editing. HH: Conceptualization, Methodology, Supervision, Validation, Writing – review & editing.
Funding
The author(s) declare financial support was received for the research, authorship, and/or publication of this article. This research was supported by “Development of risk managing technology tackling ocean and fisheries crisis around Korean Peninsula by Kuroshio Current” (RS-2023-00256330) and “Development of 3-D ocean current observation technology for efficient response to maritime distress” (20210642) of Korea Institute of Marine Science and Technology Promotion (KIMST) funded by the Ministry of Oceans and Fisheries, Korea. This work was also supported by the National Research Foundation of Korea (NRF) grants funded by the Korea government (MSIT) (NRF-2022R1A2C1003886; RS-2024-00340658).
Conflict of interest
The authors declare that the research was conducted in the absence of any commercial or financial relationships that could be construed as a potential conflict of interest.
Publisher’s note
All claims expressed in this article are solely those of the authors and do not necessarily represent those of their affiliated organizations, or those of the publisher, the editors and the reviewers. Any product that may be evaluated in this article, or claim that may be made by its manufacturer, is not guaranteed or endorsed by the publisher.
Supplementary material
The Supplementary Material for this article can be found online at: https://www.frontiersin.org/articles/10.3389/fmars.2024.1392435/full#supplementary-material
Supplementary Figure 1 | Percentage of magnitudes of coastal seiche velocity to tidal currents (blue areas) and total currents (red areas) in (A) M1 and (B) M2 at each tidal cycle.
Supplementary Figure 2 | Wavelet power spectrum for SSC anomaly at (A) M1 and (B) M2.
Supplementary Figure 3 | Suspended sediment concentration profile for different times at M2 on September 22, 2017.
Supplementary Figure 4 | (A) Profiles of log10 (s2) of utide (blue circled line) and useiche (red circled line) at September 22, 2017, 6:00 AM. (B) Relative contributions by utide (light blue area) and useiche (light red area) on vertical shear. Vertical dashed line in (B) indicates 50% contribution of utide and/or useiche to vertical shear.
References
André G., Bellafont F., Leckler F., Morichon D. (2021). Predicting seiche hazard for coastal harbours along the northern and western coasts of France. Natural Hazards 106, 10651086. doi: 10.1007/s11069-021-04509-y
Anglès S., Jordi A., Garcés E., Basterretxea G., Palanques A. (2010). Alexandrium minutum resting cyst distribution dynamics in a confined site. Deep Sea Res. Part II: Topical Stud. Oceanogr. 57, 210221. doi: 10.1016/j.dsr2.2009.09.002
Basterretxea G., Jordi A., Garcés E., Anglè S., Reñé A. (2011). Seiches stimulate transient biogeochemical changes in a microtidal coastal ecosystem. Mar. Ecol. Prog. Ser. 423, 1528. doi: 10.3354/meps08949
Björk G., Nordberg K., Arneborg L., Bornmalm L., Harland R., Robijn A., et al. (2017). Seasonal oxygen depletion in a shallow sill fjord on the Swedish west coast. J. Mar. Syst. 175, 114. doi: 10.1016/j.jmarsys.2017.06.004
Cerralbo P., Grifoll M., Espino M. (2015). Hydrodynamic response in a microtidal and shallow bay under energetic wind and seiche episodes. J. Mar. Syst. 149, 113. doi: 10.1016/j.jmarsys.2015.04.003
Choi S. M., Seo J. Y., Ha H. K. (2023). Contribution of local erosion enhanced by winds to sediment transport in intertidal flat. Mar. Geol. 465, 107171. doi: 10.1016/j.margeo.2023.107171
Choo H. S. (2021). Tide and tidal current around the sea route of Jinhae and Masan passages. J. Korean Soc. Fish. Ocean Technol. 57 (1), 45-56.
Deines K. L. (1999). “Backscatter estimation using broadband acoustic Doppler current profilers,” in Proceedings of the IEEE Sixth Working Conference on Current Measurement (Cat. No.99CH36331), San Diego, CA, IEEE. 249253. doi: 10.1109/CCM.1999.755249
De Jong M. P. C., Battjes J. A. (2004). Seiche characteristics of Rotterdam harbour. Coast. Eng. 51, 373386. doi: 10.1016/j.coastaleng.2004.04.002
Eggleton J., Thomas K. V. (2004). A review of factors affecting the release and bioavailability of contaminants during sediment disturbance events. Environ. Int. 30, 973980. doi: 10.1016/j.envint.2004.03.001
Figueroa S. M., Lee G. H., Chang J., Schieder N. W., Kim K., Kim S. Y. (2020). Evaluation of along-channel sediment flux gradients in an Anthropocene estuary with an estuarine dam. Mar. Geol. 429, 106318. doi: 10.1016/j.margeo.2020.106318
Geyer W. R. (1993). The importance of suppression of turbulence by stratification on the estuarine turbidity maximum. Estuaries 16, 113125. doi: 10.2307/1352769
Geyer W. R., Woodruff J. D., Traykovski P. (2001). Sediment transport and trapping in the Hudson River estuary. Estuaries 24, 670679. doi: 10.2307/1352875
Gloor M., Wüest A., Münnich M. (1994). Benthic boundary mixing and resuspension induced by internal seiches. Hydrobiologia 284, 5968. doi: 10.1007/BF00005731
Gomis D., Monserrat S., Tintoré J. (1993). Pressure-forced seiches of large amplitude in inlets of the Balearic Islands. J. Geophys. Res.: Oceans 98, 1443714445. doi: 10.1029/93JC00623
Gong W., Wang J., Zhao J., Chen L., Zhang H. (2023). Contrast of fine sediment dynamics between shoals and channels in a microtidal estuary with mixed semi-diurnal tides. Anthropocene Coasts 6, 4. doi: 10.1007/s44218-023-00018-6
Green M. O., Coco G. (2014). Review of wave-driven sediment resuspension and transport in estuaries. Rev. Geophys. 53, 77117. doi: 10.1002/rog.v52.1
Grifoll C. M., Cerralbo Peñarroya P., Guillén Aranda J., Espino lnfantes M., Boye Hansen L., Sánchez-Arcilla Conejo A. (2019). Characterization of bottom sediment resuspension events observed in a micro-tidal bay. Ocean Sci. 15, 307319. doi: 10.5194/os-15-307-2019
Ha H. K., Maa J. Y., Park K., Kim Y. H. (2011). Estimation of high-resolution sediment concentration profiles in bottom boundary layer using pulse-coherent acoustic Doppler current profilers. Mar. Geol. 279, 199209. doi: 10.1016/j.margeo.2010.11.002
Heyes A., Miller C., Mason R. P. (2004). Mercury and methylmercury in Hudson River sediment: impact of tidal resuspension on partitioning and methylation. Mar. Chem. 90, 7589. doi: 10.1016/j.marchem.2004.03.011
Hyun S., Lee C. H., Lee T., Choi J. W. (2007). Anthropogenic contributions to heavy metal distributions in the surface sediments of Masan Bay, Korea. Mar. pollut. Bull. 54, 1059. doi: 10.1016/j.marpolbul.2007.02.013
Jang M. C., Shin K., Jang P. G., Lee W. J., Choi K. H. (2015). Mesozooplankton community in a seasonally hypoxic and highly eutrophic bay. Mar. Freshw. Res. 66, 719729. doi: 10.1071/MF14036
Jeong K. S., Cho J. H., Lee J. H., Kim K. H. (2006). Accumulation history of anthropogenic heavy metals (Cu, Zn, and Pb) in Masan Bay sediments, southeastern Korea: A role of chemical front in the water column. Geosci. J. 10, 445455. doi: 10.1007/BF02910438
Jeong H. J., Du Yoo Y., Lee K. H., Kim T. H., Seong K. A., Kang N. S., et al. (2013). Red tides in Masan Bay, Korea in 2004−2005: I. Daily variations in the abundance of red-tide organisms and environmental factors. Harmful Algae 30, S75S88. doi: 10.1016/j.hal.2013.10.008
Johansson P. (2010). Water exchange above sill level in the Sannäsfjord, west coast of Sweden Vol. 591 (Sweden: Department of Earth Science, Göteborg, University of Gothenburg B), 37.
Jordi A., Basterretxea G., Casas B., Anglès S., Garcés E. (2008). Seiche-forced resuspension events in a Mediterranean harbor. Continental Shelf Res. 28, 505515. doi: 10.1016/j.csr.2007.10.009
Kang J. W., Jun K. S. (2003). Flood and ebb dominance in estuaries in Korea. Estuarine Coast. Shelf Sci. 56, 187196. doi: 10.1016/S0272-7714(02)00156-7
Kim D., Choi H. W., Choi S. H., Baek S. H., Kim K. H., Jeong J. H., et al. (2013). Spatial and seasonal variations in the water quality of Jinhae Bay, Korea. New Z. J. Mar. Freshw. Res. 47, 192207. doi: 10.1080/00288330.2013.772066
Kim Y. H., Gutierrez B., Nelson T., Dumars A., Maza M., Perales H., et al. (2004). Using the acoustic Doppler current profiler (ADCP) to estimate suspended sediment concentration. Technical Report, CPSD (South Carolina, Columbia: Coastal Processes and Sediment Dynamics Laboratory, Department of Geological Sciences, University of South Carolina), Vol. 4. doi: 10.5281/zenodo.1419625
Kim S. I., Seo J. Y., Park J. H., Kim P. J., Kim I. G., Kim K. M. (2024). Imbalance of sediment transport in a meso-tidal bay: effect of tidal pumping and residual circulation. Front. Mar. Sci. 11. doi: 10.3389/fmars.2024.1362583
Kumar P., Zhang H., Kim K. I., Yuen D. A. (2016). Modeling wave and spectral characteristics of moored ship motion in Pohang New Harbor under the resonance conditions. Ocean Eng. 119, 101113. doi: 10.1016/j.oceaneng.2016.04.027
Kwon K., Choi B. J., Myoung S. G., Sim H. S. (2021). Propagation of a meteotsunami from the yellow sea to the korea strait in april 2019. Atmosphere 12, 1083. doi: 10.3390/atmos12081083
Lafta A. A. (2021). Estimation of tidal excursion length along the Shatt Al-Arab estuary, southern Iraq. Vietnam J. Sci. Technol. 59, 7989. doi: 10.15625/2525-2518/59/1/15433
Lee J. L., Chu J. K., Hwang R. G. (2000). Mathematical and numerical modelling of eutrophication process in Masan Bay, Korea. WIT Trans. Ecol. Environ. 43, 313–322. doi: 10.2495/CENV000291
Lee Y. W., Hwang D. W., Kim G., Lee W. C., Oh H. T. (2009). Nutrient inputs from submarine groundwater discharge (SGD) in Masan Bay, an embayment surrounded by heavily industrialized cities, Korea. Sci. Total Environ. 407, 31813188. doi: 10.1016/j.scitotenv.2008.04.013
Lee Y. W., Park M. O., Kim S. G., Kim S. S., Khang B., Choi J., et al. (2021). Major controlling factors affecting spatiotemporal variation in the dissolved oxygen concentration in the eutrophic Masan Bay of Korea. Regional Stud. Mar. Sci. 46, 101908. doi: 10.1016/j.rsma.2021.101908
Lin J., Kuo A. Y. (2001). Secondary turbidity maximum in a partially mixed microtidal estuary. Estuaries 24, 707720. doi: 10.2307/1352879
Luick J. L., Hinwood J. B. (2008). Water levels in a dual-basin harbour in response to infragravity and edge waves. Prog. Oceanogr. 77, 367375. doi: 10.1016/j.pocean.2006.04.002
Magdalena I., Rif’atin H. Q., Reeve D. E. (2020). Seiches and harbour oscillations in a porous semi-closed basin. Appl. Mathematics Comput. 369, 124835. doi: 10.1016/j.amc.2019.124835
Mehta A. J. (1989). On estuarine cohesive sediment suspension behavior. J. Geophys. Res.: Oceans 94, 1430314314. doi: 10.1029/JC094iC10p14303
Morgan-King T. L., Schoellhamer D. H. (2013). Suspended-sediment flux and retention in a backwater tidal slough complex near the landward boundary of an estuary. Estuaries Coasts 36, 300318. doi: 10.1007/s12237-012-9574-z
Murray R. B. H., Hodgson D. M., Thorne P. D. (2012). Wave groups and sediment resuspension processes over evolving sandy bedforms. Continental Shelf Res. 46, 1630. doi: 10.1016/j.csr.2012.02.011
Niedda M., Greppi M. (2007). Tidal, seiche and wind dynamics in a small lagoon in the Mediterranean Sea. Estuarine Coast. Shelf Sci. 74, 2130. doi: 10.1016/j.ecss.2007.03.022
Ogston A. S., Cacchione D. A., Sternberg R. W., Kineke G. C. (2000). Observations of storm and river flood-driven sediment transport on the northern California continental shelf. Continental Shelf Res. 20, 21412162. doi: 10.1016/S0278-4343(00)00065-0
Park S. J., Choi B. J., Sim H. S., Byun D. S. (2020). Arrival of long ocean waves and hourly sea level oscillations in Masan Bay, Korea on 19–22 March 2014. J. Coast. Res. 95, 1510–1514. doi: 10.2112/SI95-291.1
Park S. C., Lee K. W. (1996). Modern sedimentary environment of Jinhae Bay, SE Korea. J. Korean Soc. Oceanogr. 32, 43–54.
Park S. E., Lee W. C., Hong S. J., Kim H. C., Kim J. H. (2011). Variation in residence time and water exchange rate by release time of pollutants over a tidal cycle in Masan Bay. J. Korean Soc. Mar. Environ. Energy 14, 249–256. doi: 10.7846/JKOSMEE.2011.14.4.249
Prichard D., Hogg A. J. (2003). Suspended sediment transport under seiches in circular and elliptical basins. Coast. Eng. 49, 4370. doi: 10.1016/S0378-3839(03)00046-2
Rabinovich A. B. (2009). “Seiches and harbor oscillation0073,” in Handbook of coastal and ocean engineering. Ed. Kim Y. (World Scientific Publishing, Singapore), 193236. doi: 10.1142/9789812819307_0009
Ribbe J., Holloway P. E. (2001). A model of suspended sediment transport by internal tides. Continental Shelf Res. 21, 395422. doi: 10.1016/S0278-4343(00)00081-9
Schallenberg M., Burns C. W. (2004). Effects of sediment resuspension on phytoplankton production: testing apart the influences of light, nutrients and algal entrainment. Freshw. Biol. 49, 143159. doi: 10.1046/j.1365-2426.2003.01172.x
Schulz E., Grasso F., Le Hir P., Verney R., Thouvenin B. (2018). Suspended sediment dynamics in the macrotidal Seine Estuary (France): 2. Numerical modeling of sediment fluxes and budgets under typical hydrological and meteorological conditions. J. Geophys. Res.: Oceans 123, 578600. doi: 10.1002/2017JC013185
Scully M. E., Friedrichs C. T. (2007). Sediment pumping by tidal asymmetry in a partially mixed estuary. J. Geophys. Res.: Oceans 112, C07028. doi: 10.1029/2006JC003784
Seo J. Y., Choi B. J., Ryu J., Ha H. K. (2022). Dynamic evolution of a secondary turbidity maximum under various forcing conditions in a microtidal estuary. Mar. Geol. 446, 106760. doi: 10.1016/j.margeo.2022.106760
Seo J. Y., Kim Y. H., Ryu J., Ha H. K. (2023). Wind-induced switch of estuarine residual circulations and sediment transport in microtidal bay. Estuarine Coast. Shelf Sci. 288, 108371. doi: 10.1016/j.ecss.2023.108371
Sommerfield C. K., Wong K. C. (2011). Mechanisms of sediment flux and turbidity maintenance in the Delaware Estuary. J. Geophys. Res.: Oceans 116, C01005. doi: 10.1029/2010JC006462
Spieckermann M., Gröngröft A., Karrasch M., Neumann A., Eschenbach A. (2022). Oxygen consumption of resuspended sediments of the upper Elbe estuary: process identification and prognosis. Aquat. Geochem. 28, 125. doi: 10.1007/s10498-021-09401-6
Talke S. A., Stacey M. T. (2008). Suspended sediment fluxes at an intertidal flat: the shifting influence of wave, wind, tidal, and freshwater forcing. Continental Shelf Res. 28, 710725. doi: 10.1016/j.csr.2007.12.003
Teng L., Cheng H., Zhang E., Wang Y. (2022). Lateral variation of tidal mixing asymmetry and its impact on the longitudinal sediment transport in turbidity maximum zone of salt wedge estuary. J. Mar. Sci. Eng. 10, 907. doi: 10.3390/jmse10070907
Van Dorn W. G. (1984). Some tsunami characteristics deducible from tide records. J. Phys. Oceanogr. 14, 353363. doi: 10.1175/1520-0485(1984)014<0353:STCDFT>2.0.CO;2
Wang X. H., Pinardi N. (2002). Modeling the dynamics of sediment transport and resuspension in the northern Adriatic Sea. J. Geophys. Res.: Oceans 107, 3225. doi: 10.1029/2001JC001303
Woo H. J., Cho J. H., Jeong K. S., Chung C. S., Kwon S. J., Park S. M. (2003). Pollution history of the Masan Bay, southeast Korea, from heavy metals and foraminifera in the subsurface sediments. J. Korean Earth Sci. Soc. 24, 635–649.
Yim U. H., Hong S. H., Shim W. J., Oh J. R., Chang M. (2005). Spatio-temporal distribution and characteristics of PAHs in sediments from Masan Bay, Korea. Mar. pollut. Bull. 50, 319326. doi: 10.1016/j.marpolbul.2004.11.003
Yuan Y., Wei H., Zhao L., Jiang W. (2008). Observations of sediment resuspension and settling off the mouth of Jiaozhou Bay, Yellow Sea. Continental Shelf Res. 28, 26302643. doi: 10.1016/j.csr.2008.08.005
Keywords: coastal seiches, suspended sediments, resuspension, turbidity maximum, semi-enclosed bay
Citation: Seo JY, Choi B-J, Choi SM, Ryu J and Ha HK (2024) Contribution of coastal seiches to sediment transport in a microtidal semi-enclosed bay. Front. Mar. Sci. 11:1392435. doi: 10.3389/fmars.2024.1392435
Received: 27 February 2024; Accepted: 06 June 2024;
Published: 21 June 2024.
Edited by:
Jordi Colomer, University of Girona, SpainReviewed by:
Nabi Allahdadi, North Carolina State University, United StatesJarrell Smith, Engineer Research and Development Center (ERDC), United States
Copyright © 2024 Seo, Choi, Choi, Ryu and Ha. This is an open-access article distributed under the terms of the Creative Commons Attribution License (CC BY). The use, distribution or reproduction in other forums is permitted, provided the original author(s) and the copyright owner(s) are credited and that the original publication in this journal is cited, in accordance with accepted academic practice. No use, distribution or reproduction is permitted which does not comply with these terms.
*Correspondence: Ho Kyung Ha, hahk@inha.ac.kr; hokyung.ha@gmail.com