 Yong Li1
 Xiaotong Liu
 Qiang Mei
 Wenxin Xie
- 1School of Software Engineering, Beijing University of Technology, Beijing, China
- 2Merchant Marine College, Shanghai Maritime University, Shanghai, China
- 3Navigation College, Jimei University, Xiamen, China
- 4School of Geographic Science, East China Normal University, Shanghai, China
- 5Institute of Computing Technology, Chinese Academy of Sciences, Beijing, China
In maritime logistics optimization, considerable research efforts are focused on the extraction of deep behavioral characteristics from comprehensive shipping data to discern patterns in maritime vessel behavior. The effective linkage of these characteristics with maritime infrastructure, such as berths, is critical for the enhancement of ship navigation systems. This endeavor is paramount not only as a research focus within maritime information science but also for the progression of intelligent maritime systems. Traditional methodologies have primarily emphasized the analysis of navigational paths of vessels without an extensive consideration of the geographical dynamics between ships and port infrastructure. However, the introduction of knowledge graphs has enabled the integration of disparate data sources, facilitating new insights that propel the development of intelligent maritime systems. This manuscript presents a novel framework using knowledge graph technology for profound analysis of maritime data. Utilizing automatic identification system (AIS) data alongside spatial information from port facilities, the framework forms semantic triplet connections among ships, anchorages, berths, and waterways. This enables the semantic modeling of maritime behaviors, offering precise identification of ships through their diverse semantic information. Moreover, by exploiting the semantic relations between ships and berths, a reverse semantic knowledge graph for berths is constructed, which is specifically tailored to ship type, size, and category. The manuscript critically evaluates a range of graph embedding techniques, dimensionality reduction methods, and classification strategies through experimental frameworks to determine the most efficacious methodologies. The findings reveal that the maritime knowledge graph significantly enhances the semantic understanding of unmanned maritime equipment, thereby improving decision-making capabilities. Additionally, it establishes a semantic foundation for the development of expansive maritime models, illustrating the potential of knowledge graph technology in advancing intelligent maritime systems.
1 Introduction
The advent of smart maritime systems was marked by the integration of distributed devices and the application of artificial intelligence (AI) and machine learning (ML) technologies. These systems extensively utilize sensors, including GPS, radar, and meteorological sensors, to capture real-time positioning and vital status information of vessels. However, the maritime domain is characterized by intricate spatiotemporal relationships, influenced by factors such as ship trajectories, weather variations, and port activities. Traditional AI and ML techniques face challenges in accurately modeling these relationships due to their limited knowledge representation capabilities, which fail to generalize the dynamic and multidimensional nature of the maritime environment. Additionally, the heterogeneity of maritime data, arising from disparate sources and formats, poses significant challenges in data standardization and interoperability in initial smart maritime systems.
To address these limitations, this study introduces knowledge graphs as a sophisticated method for exploring complex spatiotemporal relationships within the maritime domain. By defining entities and their interconnections, knowledge graphs offer a robust mechanism for semantic consistency, facilitating the resolution of semantic discrepancies during the information fusion process and ensuring data standardization and consistency. This knowledge graph-based approach, which transcends traditional distributed device and ML methods, enables advanced intelligent queries and reasoning with its graph data representation. Moreover, it exhibits remarkable scalability, allowing for the seamless integration of new entities and relationships (Fensel et al., 2020). Within the maritime sector, this methodology enables comprehensive analyses through the rules and relationships defined in the knowledge graph, thereby offering flexible adaptation to the evolving informational landscape and supporting a wider array of application scenarios.
A knowledge graph constitutes a network of interconnected entities and their relationships, where each entity and its attributes represent distinct knowledge points, and the relationships describe the associations among these points. Formally, a knowledge graph G is represented as , where denotes the entity set in the knowledge base, encompassing distinct entities; signifies the relationship set, comprising different relationships; and encapsulates the triple set within the knowledge base. A triplet, the fundamental unit of this representation, is denoted as , where represent the head and tail entities in the triplet, and denotes the relationship connecting these two entities. For instance, in the triplet (Paris, the Capital of, France), the head “Paris“ and the tail “France“ are real-world entities connected through the relationship “the Capital of”. Graph data in knowledge graphs, characterized by numerous nodes and edges, represent a high-dimensional data structure. However, processing such data can introduce computational complexity, the curse of dimensionality, and challenges in interpretability and visualization. Graph embedding techniques, therefore, are crucial for transforming high-dimensional graph data into manageable, lower-dimensional vector representations, capturing the intrinsic relationships, similarities, and structural characteristics among graph nodes (Wang et al., 2017). Prominent embedding methodologies like TransE (Bordes et al., 2013), TransD (Wang et al., 2014), and RESCAL (Nickel et al., 2011), among others, facilitate dimensionality reduction and vectorization of graphs through diverse principles. Knowledge graphs and graph embedding techniques have found application across intelligent transportation and maritime sectors (Ahmed et al., 2022; Liu et al., 2023a; Wang et al., 2023a; Liu et al., 2023b; Li et al., 2024) for functions such as traffic anomaly detection, marine environmental monitoring, and maritime geographic analysis, presenting their versatility and utility in addressing industry-specific challenges.
In shipping, ships form similar geographical relationships with geographic elements such as waterways, anchorages, and berths. Meanwhile, berths also consider the size and cargo type of ships in order to accommodate them, forming a relationship with the attributes of the ships. However, traditional recommendation methods are manual and cannot empower decision-making machines to meet the requirements of shipping. Therefore, the following two problems need to be addressed in research: (1) How to characterize the behavior of ships and the profile of berths using an understandable semantic pattern; (2) How to assist unmanned devices in making accurate decisions based on this pattern, thereby ensuring the safety of jurisdictional waters and efficiency of the port.
This study introduces the “Maritime Heterogeneous Knowledge Graph Brain”, a concept based on the heterogeneous knowledge graph’s construction. This system capitalizes on the heterogeneous knowledge graph data to autonomously perform tasks such as node classification, clustering, link prediction, and multimodal fusion, which integrates node and edge features, graph structure, and contextual characteristics. The “Maritime Heterogeneous Knowledge Graph Brain” employs diverse maritime graph data to enhance ship dispatch efficiency, optimize maritime decision-making, and improve the utilization of shore-based facilities, thereby boosting emergency response capabilities in ports and maritime environments. As depicted in Figure 1, the maritime heterogeneous knowledge graph is stored across multiple distributed databases. Information is then transmitted to various task-specific terminals, such as ships and shore-based facilities, via servers dedicated to different tasks. This arrangement facilitates real-time processing and response, advancing the development of maritime intelligence. The study conducts experiments and analyzes the effects based on the previously constructed maritime heterogeneous knowledge graph, focusing on typical applications such as ship classification and similar berth recommendation.
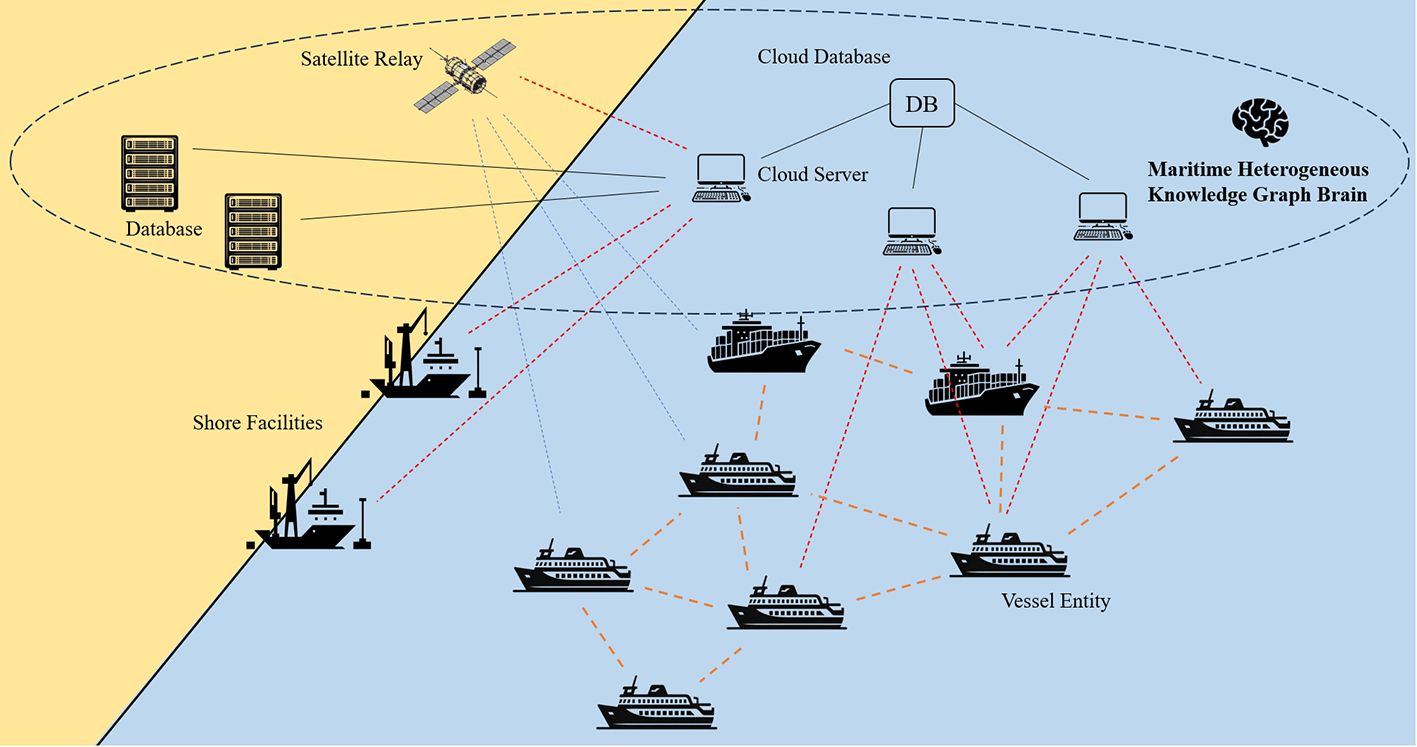
Figure 1 Illustration of the “Maritime Heterogeneous Knowledge Graph Brain” concept.
This manuscript combines knowledge graphs with maritime domain expertise to introduce a pioneering intelligent maritime application framework predicated on knowledge graph technology. The principal contributions of this manuscript are shown below:
1. The manuscript proposes pragmatic solutions to real-world challenges within the maritime industry. By using knowledge graph embedding technology, it addresses the uncertainties inherent in ship type prediction and the complexities surrounding similar berth recommendations for these two pivotal business scenarios. These solutions significantly contribute to enhancing the operational efficiency of shipping companies, optimizing berth allocations, and minimizing waiting times.
2. An innovative intelligent maritime application framework, grounded in knowledge graphs and graph embedding technology, is proposed. This framework not only integrates complex data pertaining to ships and infrastructure but also elucidates deep semantic relationships between entities via graph embedding algorithms. Designed with the maritime industry’s specific requisites in mind, its modular architecture ensures both scalability and adaptability for prospective applications.
3. The paper investigates the utilization of this framework in facilitating specific downstream tasks, specifically ship type prediction and similar berth recommendation. Through the optimization of embedding models, classification models, and other components, significant enhancements in task accuracy were achieved. Moreover, experimental validation of the influence of varied weight distributions within the combined model on the performance of the berth recommendation system provides novel insights for the intelligent recommendation system design.
The structure of this manuscript is methodically organized as follows: Section 1 introduces the prevailing challenges in the intelligent maritime domain and advocates for the integration of knowledge graph methodologies. Section 2 delves into related works concerning knowledge graphs and the analysis of ship behaviors. Section 3 introduces the proposed intelligent maritime application framework that leverages knowledge graphs and graph embedding techniques. Section 4 validates the framework’s efficacy and optimal performance for various downstream tasks through comparative experiments. Section 5 discusses the framework’s applicability scope, alongside its algorithmic constraints. Section 6 concludes the manuscript, outlining future research trajectories.
2 Related work
2.1 Overview of related work on knowledge graphs
Knowledge graphs have become instrumental in the realm of knowledge storage and representation, exerting a significant influence across diverse domains. The emergence of big data coupled with advancements in AI technologies has propelled the exploration and application of knowledge graphs into a prominent position within various disciplines. These fields include computer science, natural language processing, information retrieval, ML, and human-computer interaction (Fensel op. cit.; Wang op. cit.).
In exploring algorithms related to knowledge graphs, current research trends focus primarily on enhancing the performance of downstream tasks and refining the accuracy of knowledge graph embeddings. While traditional embedding models have shown commendable results in tasks like knowledge graph completion, they often overlook temporal dynamics and the integration of background knowledge. Li et al. (2023a) put forward an innovative rule-based embedding technique that extracts attributes from entities, employing logical rules to augment datasets, which in turn enhances the precision of knowledge graph completion endeavors. Jiang et al. (2024) unveiled a cutting-edge link prediction framework that leverages a multi-source hierarchical neural network based on knowledge graph embeddings, aimed at overcoming challenges in extracting intricate graph information and fostering the fusion of multiple feature knowledge semantics.
Owing to their robust knowledge representation capabilities, knowledge graphs have found applications in diverse fields, including recommendation systems (Bertram et al., 2023), intelligent healthcare (Yang et al., 2024), and industrial production (Zhengyu et al., 2022). For instance, Chen et al. (2022) utilized migration data from official provincial and city websites to craft a knowledge graph that maps the activities of COVID-19 patients, facilitating tracking, visualization, and reporting efforts in managing the pandemic. In the maritime sphere, Liu et al. (2023c) developed a Transformer-based model employing multi-convolution bidirectional encoders for extracting essential information from maritime pollution prevention regulations and laws, aiding in port state control inspections to minimize ship pollution. Furthermore, Gan et al. (2023) analyzed ship collision investigation reports issued by the China Maritime Safety Administration, proposing a novel approach for constructing knowledge graphs to elucidate the underlying factors of maritime accidents, thereby aiming to improve maritime traffic safety.
Despite the extensive utility of knowledge graphs across various sectors, challenges remain in the domain of geographical information, especially concerning maritime transportation. One primary issue is the need for real-time updates; maritime data, such as ship positions and weather conditions, are subject to rapid changes, necessitating knowledge graphs that can accommodate immediate updates to mirror the current realities. Additionally, the integration of disparate data sources to achieve data consistency and connectivity for a comprehensive knowledge graph poses significant hurdles. The diversity in data standards and formats across sources calls for the development of robust data integration and cleansing methodologies to ensure seamless knowledge graph construction.
2.2 Overview of related work on ship behavior mining
The advent of deep neural networks, computer vision, and natural language processing has spotlighted ship behavior mining as a key area within the intelligent maritime domain. Focused research endeavors in this area include ship trajectory detection (Deng et al., 2023; Zhang et al., 2023), intention prediction (Gao and Shi, 2020; Murray and Perera, 2021), and classification (Zhou et al., 2019), employing advanced computational models like convolutional neural networks (CNNs) (Chen et al., 2020, 2024) and generative adversarial networks (GANs) (Jia et al., 2023). Wang et al. (2023b) proposed a ship trajectory prediction model based on a sparse multi-graph convolutional hybrid network. This model simulates the dynamics and movement patterns of ships across spatial and temporal dimensions, incorporating features of ship trajectories that are sensitive to time into the prediction framework. Ma et al. (2021), by conducting statistical analysis on recorded ship movement trajectories, discovered that ship movements frequently show a strong correlation with their long-term historical trajectories. Consequently, they proposed an augmented long short-term memory network (ALSTM), which incorporates skip connections and adaptive memory modules into the traditional LSTM structure. This enhancement enables current memory units to engage with past data, facilitating a more sophisticated representation of the uncertainty and varied movements of individual ships. Zheng et al. (2022) introduced a proximal policy optimization and route guidance (PPORG) algorithm for autonomous ship navigation, focusing on collision avoidance and route optimization.
Ship classification research has also seen significant advancements. Escorcia-Gutierrez et al. (2022) employed masked convolutional neural networks for the detection of small ships and used a collision body optimization algorithm alongside a weighted regularized extreme learning machine method for the efficient classification of the detected ships. Similarly, Liang et al. (2021) introduced a multi-view feature fusion network (MVFFNet) for ship classification in the context of imbalanced data. This approach begins by extracting various multi-view features from automatic identification system (AIS)-based ship trajectories, followed by the application of a bidirectional gated recurrent unit network to amalgamate these multi-view features, thereby producing the ship classification results.
Multimodal approaches represent a prominent method for mining ship behavior by extracting features from various sensing modes and integrating these features to gain a more thorough understanding and enhanced data mining capabilities. Guo et al. (2023) developed a multimodal ship trajectory prediction approach through pattern distribution modeling. This approach utilizes a vector, randomly sampled from a multivariate Gaussian distribution, as the representation of trajectory patterns to generate multiple predicted trajectories. It employs adversarial learning to allow this Gaussian distribution to effectively capture ship trajectory patterns. Xiao et al. (2023) introduced an adaptive data fusion model that leverages multi-source AIS data for ship trajectory prediction. This model merges maritime mobile service identifiers and timestamps with multi-source AIS data, utilizing deep learning techniques for feature extraction and to enhance adaptability. Wang et al. (2023c) introduced a ship trajectory prediction model utilizing a sparse multi-graph convolutional hybrid network (SMCHN), which simulates interactions and movement trends among ships across temporal and spatial dimensions. This model enhances its predictive capability by integrating multi-source information and adjusting weights, and incorporates a temporal convolutional network with a gating mechanism for future trajectory predictions. Concurrently, Wang et al. (2023d) proposed a propagation trajectory interval prediction framework that employs upper and lower bound estimation and attention-modified long short-term memory (LSTM) networks optimized through Bayesian techniques. This framework adopts dual optimization strategies tailored to interval prediction of ship trajectories, focusing on differentiated interval widths for longitude and latitude and a hyperparameter optimization to minimize coverage width criterion. Wang et al. (2024) presented an approach that merges spatial and temporal models to extract high-level features of ships from historical trajectory data. Employing a spatio-temporal graph convolutional network (ST-GCN) followed by RT-CNN, this method captures temporal dependencies of spatial interaction features, yielding refined spatio-temporal trajectory predictions. Shin et al. (2024) developed the AIS-ACNet, a deep learning framework for predicting AIS data that utilizes auxiliary tasks and a convolutional encoder. This model leverages diverse AIS data features and effectively integrates ship dynamics to enhance trajectory prediction accuracy. Zhang et al. (2024) introduced TrajBERT-DSSM, a novel method for ship destination prediction that analyzes AIS records to compare navigational trajectories of vessels with historical data, focusing on spatio-temporal correlations, geometric properties, and motion patterns. This method integrates a hierarchical geospatial coding system, geohash, with TrajBERT and the deep structured semantic model (DSSM) to assess trajectory similarity and predict destinations. Liu H et al. (2023) proposed a mechanism for monitoring and detecting abnormal ship behavior using a graph attention predictive and reconstructive network. This mechanism employs a sliding window technique for consistent data input and utilizes the peak over threshold (POT) method to dynamically adjust anomaly detection thresholds based on environmental changes in marine settings. Similarly, Li et al. (2022) presented a method for the semantic recognition of ship entry and exit movements based on a probabilistic topic model. This method is capable of uncovering ship movement patterns from vast amounts of trajectory data in an unsupervised way, thereby rendering the results more interpretable.
Furthermore, some studies have extended intelligent systems to other aspects of the maritime domain. Li X et al. (2023) introduced the temporal fusion transformer (TFT), a forecasting model based on attention mechanisms, taking the Tianjin Port maritime area as a case study to achieve multi-period, multi-feature forecasts of pollutant emissions, providing data references for management decisions of relevant departments. Xie et al. (2023) utilized the TFT, a deep learning model for time series forecasting based on attention mechanisms, to predict the spatiotemporal characteristics of ship emissions over multiple periods, achieving fine-grained traceability of ship emissions.
Our maritime prediction framework distinguishes itself from existing research by its foundation on a heterogeneous knowledge graph, which incorporates various data processing methods tailored to different downstream tasks. This design not only enhances the framework’s scalability but also improves its reusability across diverse tasks.
3 Technical framework and dataset
3.1 Technical framework
This paper introduces an application framework leveraging the versatility of knowledge graphs within the maritime domain. The framework is designed around two key application scenarios: ship classification and similar berth recommendations. It integrates knowledge graph embeddings using comprehensive AIS data from ports and ships, utilizing the resulting vectors for specific downstream tasks. Additionally, the framework includes a visualization component, facilitating the graphical representation of maritime knowledge graphs derived from the dataset.
3.1.1 Process flowchart
The operational flow of this framework is illustrated in Figure 2. The initial phase involves constructing ship and berth knowledge graphs from triplet data. Following this, a knowledge graph embedding model trains on this data to learn the representative vectors for ships and berths. To improve computational efficiency, these learned vectors undergo dimensionality reduction. The dimensionally reduced vectors are then employed in data analysis for downstream tasks, specifically focusing on ship classification models and similar berth recommendation strategies.
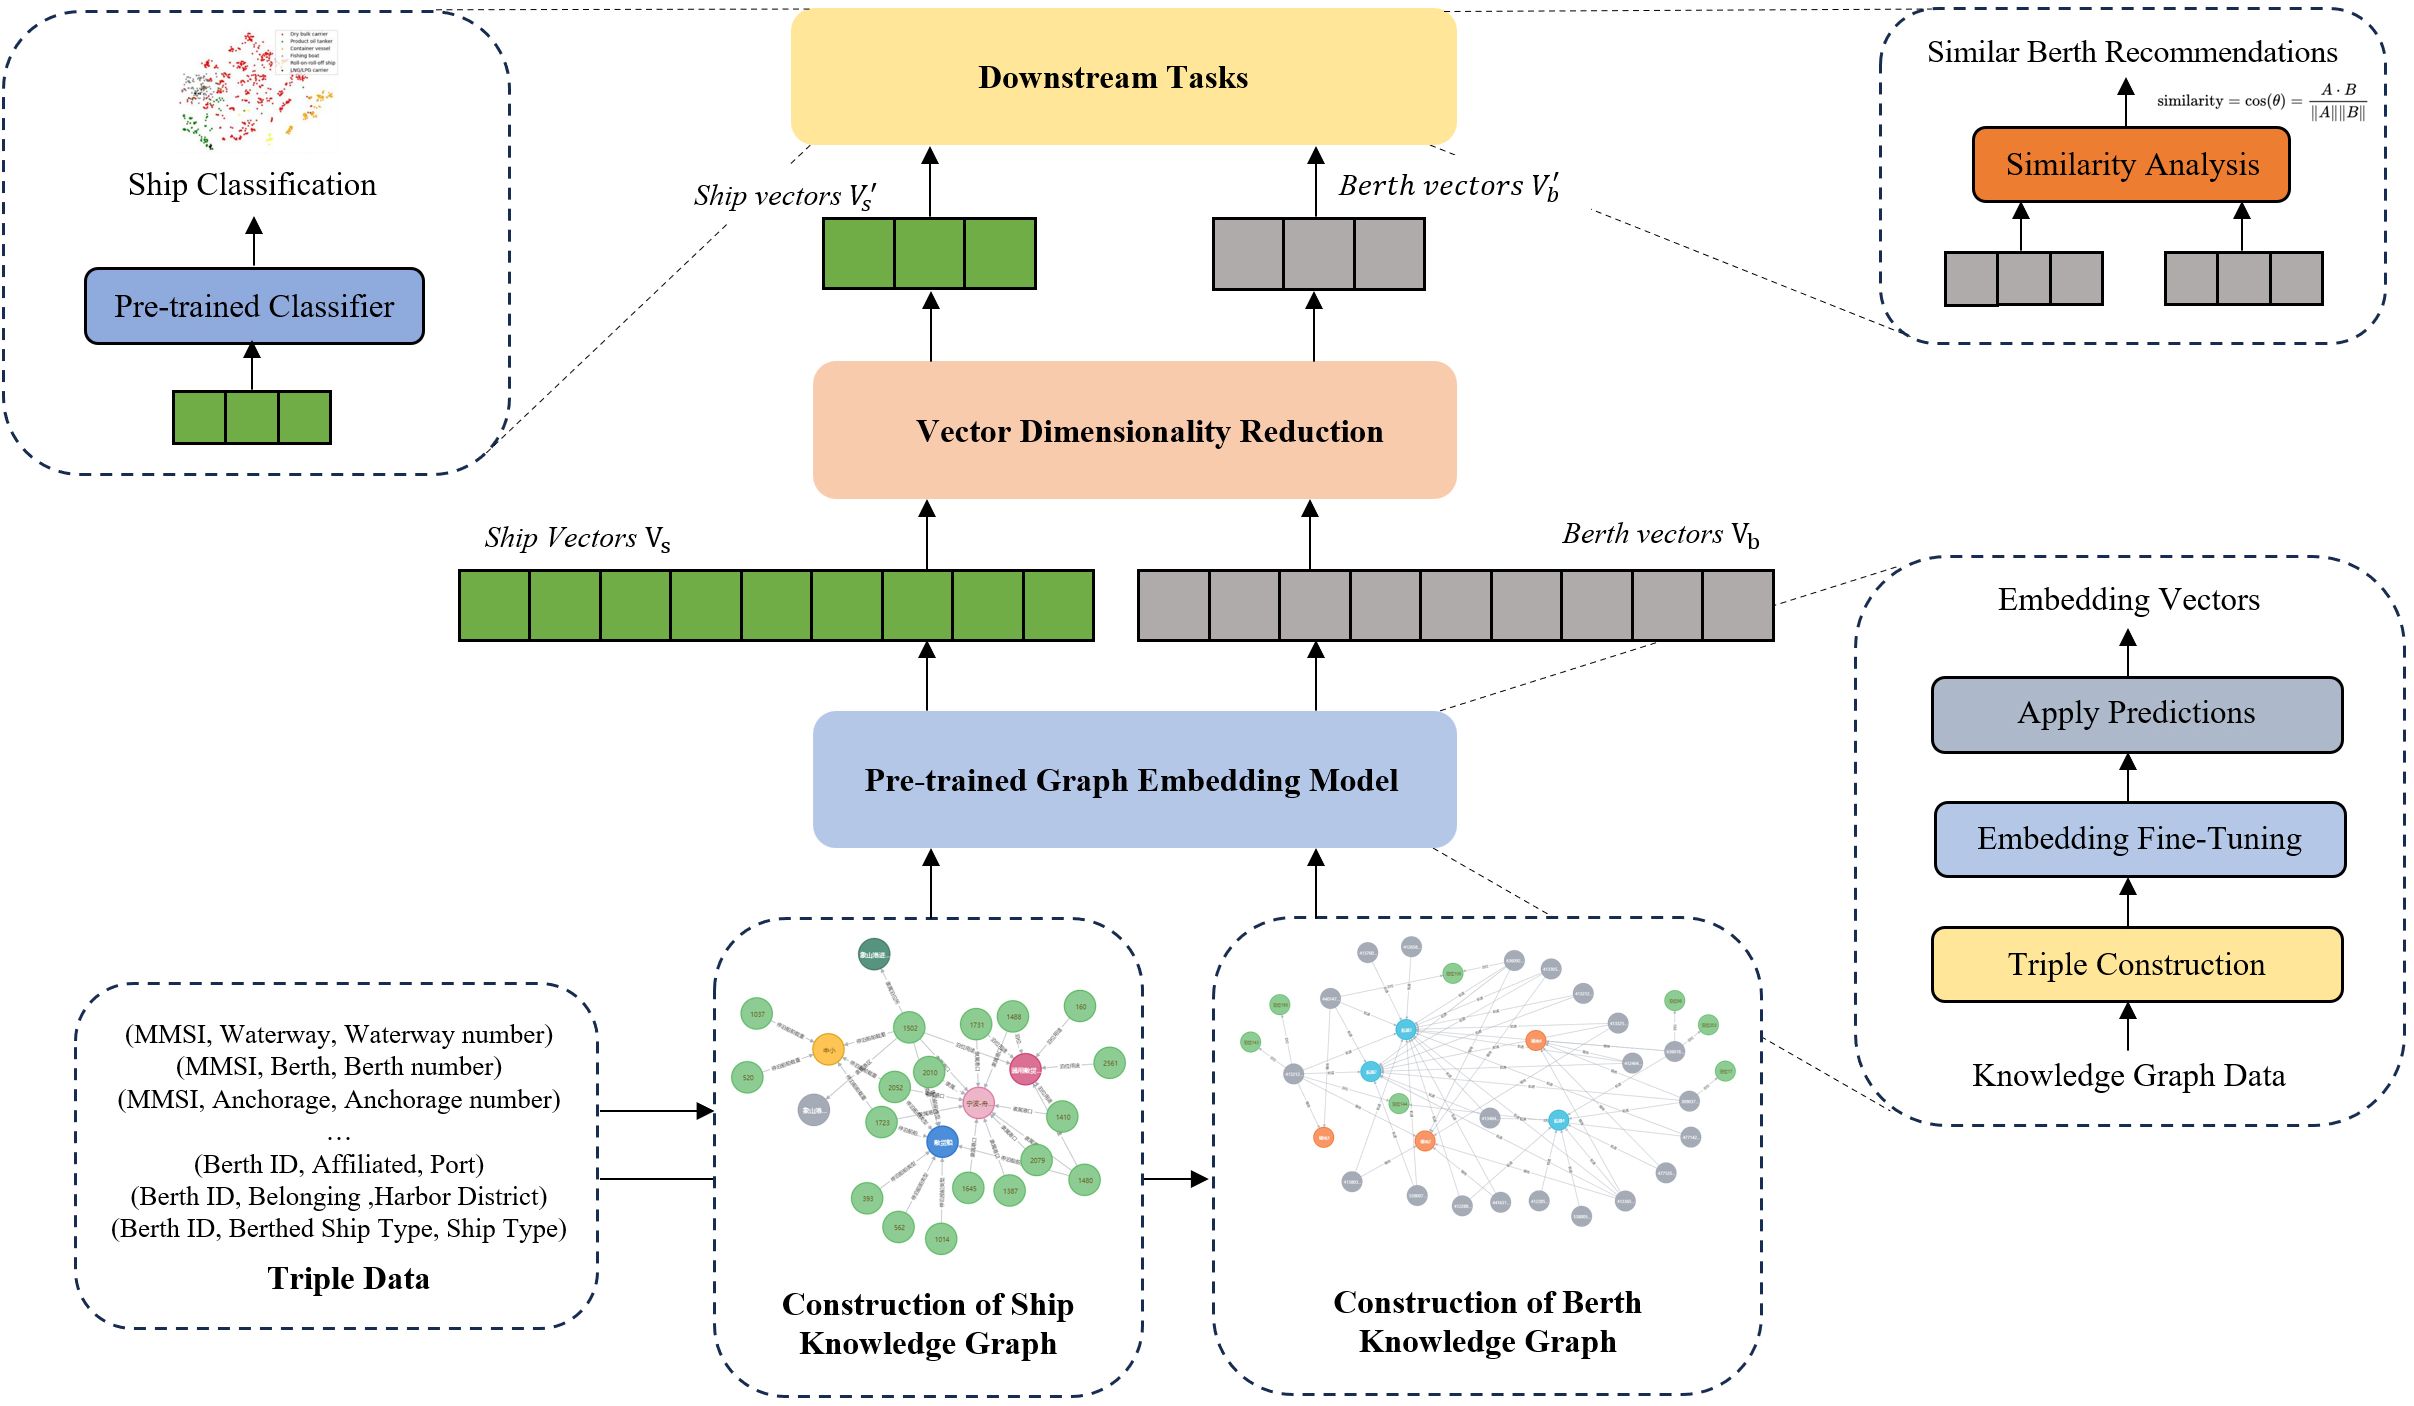
Figure 2 Framework flowchart.
3.1.2 Graph embedding model
The data within knowledge graphs consist of an extensive array of nodes and edges, embodying a form of high-dimensional data. While processing such data is plausible, it often incurs challenges including computational complexity, the curse of dimensionality, and impediments in interpretability and visualization. To address these challenges, graph embedding methods are employed to transform high-dimensional graph data into more manageable, lower-dimensional vector representations. This process entails converting nodes and edges within knowledge graphs into vectors within a vector space, enabling these vectors to encapsulate the relationships, similarities, and structural characteristics among nodes. Such transformation facilitates the application of knowledge graphs across diverse data analysis and ML endeavors. In our framework, we adopt various graph embedding models including TransE (Bordes op. cit.), TransD (Wang op. cit.), TransH (Lin et al., 2015), TransR (Ji et al., 2017), Analogy (Liu et al., 2017), ComplEx (Trouillon et al., 2016), and DistMult (Yang et al., 2014) to capture and elucidate the latent features inherent in the relationships and entities associated with berths. This methodology allows for encoding each berth into vectors of uniform dimensionality, thereby furnishing a quantifiable and analyzable feature representation for berths. Here is a brief overview of the graph embedding model implemented in this study.
TransE is a seminal approach to knowledge graph embedding. Central to TransE is the notion of transforming entities and their interrelations into vectors within a unified, low-dimensional vector space, effectively capturing the relational semantics between them. For each fact triple (h, r, t) in the knowledge graph, TransE treats this as a translational operation where the vector of the head entity h, through the action of the relation vector r, aligns with the vector of the tail entity t. Figure 3A illustrates the TransE model schematic. The model is trained to minimize the translational distance for positive sample embeddings while maximizing it for negative ones. This approach not only enhances the model’s efficacy in tasks like link prediction but also enhances computational efficiency. However, TransE has limitations in addressing complex relationships, such as one-to-many, many-to-one, and many-to-many scenarios.
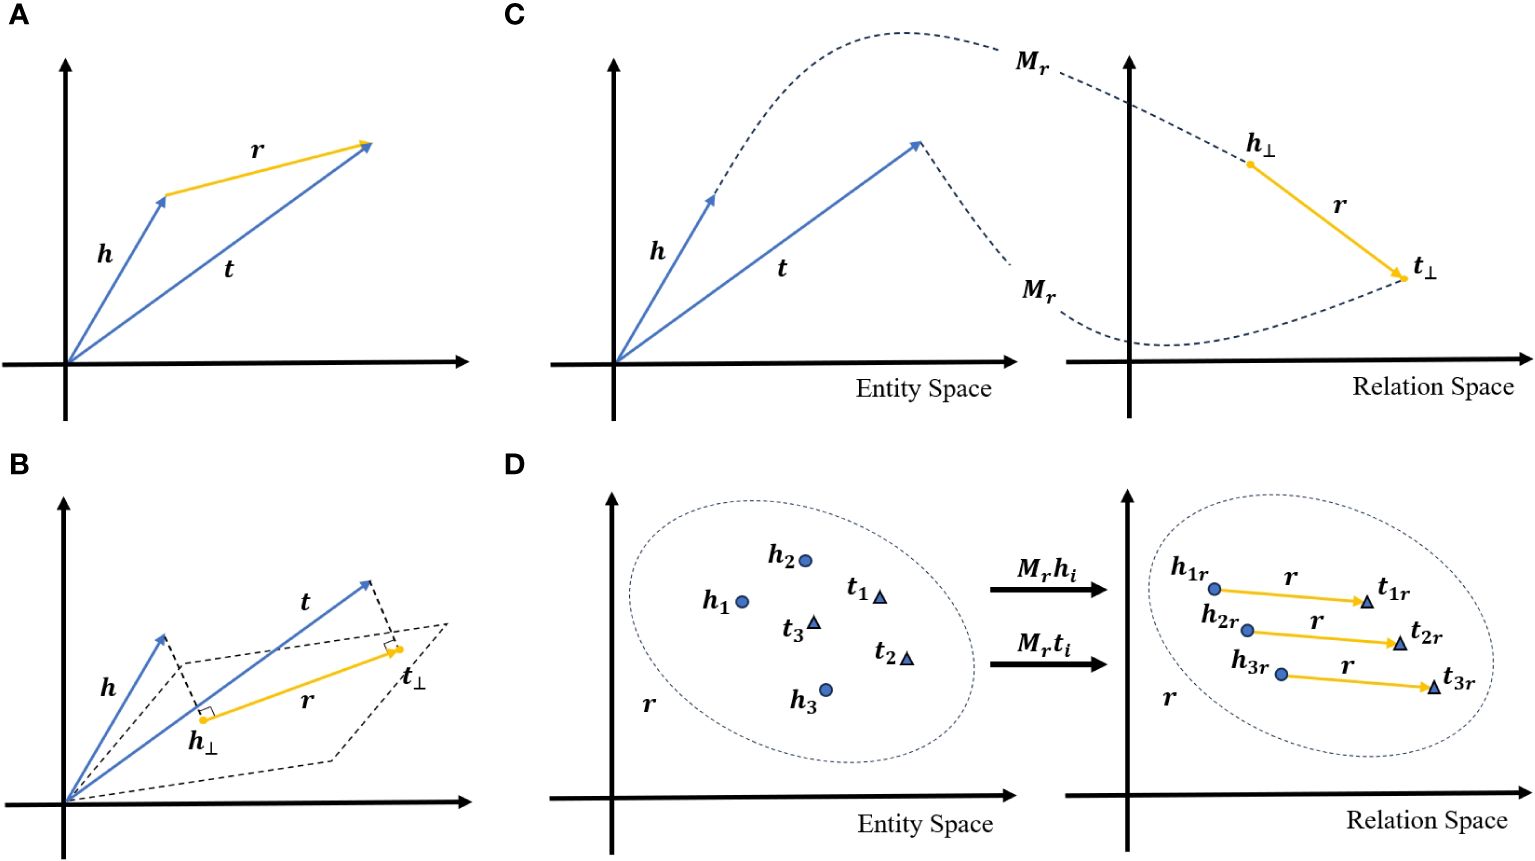
Figure 3 (A–D) Schematic diagram of the graph embedding model based on vector decomposition.
To overcome these limitations, the TransD model extends the capabilities of TransE. Illustrated in Figure 3B, TransD introduces a dynamic mapping matrix for each entity-relation pair, which facilitates the generation of new embeddings for head and tail entities. This matrix, derived from the original embedding vectors of the entities and relations, allows TransD to flexibly model a variety of relationship types. Given a fact triple (h, r, t), In TransD, the mapped head and tail entity vectors are denoted as and , respectively, with Mr being the mapping matrix calculated based on relation r. Like TransE, TransD employs translational operations to link the head and tail entities, but its introduction of a dynamic mapping matrix significantly augments the model’s ability to handle complex relational structures, building upon the foundational principles established by TransE.
The TransH model builds upon the foundations of the TransE model by introducing a novel approach that models each relation as a hyperplane. In this setup, entities are projected onto this hyperplane using relation-specific projection vectors, followed by a translational operation similar to TransE. Figure 3C illustrates the schematic diagram of the TransH model. For a given fact triplet (h, r, t), TransH first computes the projection vectors and of the head and tail entities onto the hyperplane corresponding to relation r. Then, on this hyperplane, it ensures that is brought close to through the translation of relation r, i.e., . TransH utilizes two principal mapping functions: the projection function that maps entities from the original space onto the hyperplane, and a translation function that carries out the translational operation within the hyperplane. This dual-function approach allows TransH to model various types of relations with enhanced flexibility.
Similarly, the TransR model evolves from TransE to address more complex relational structures within knowledge graphs. TransR segregates entity and relation embeddings into separate vector spaces, transforming entity vectors from their native entity space to the relation-specific space using a dedicated transformation matrix. The model’s schematic diagram is shown in Figure 3D. For a fact triplet (h, r, t), TransR first transforms the entities h and r into the relation space using the corresponding transformation matrix Mr, yielding transformed head entity hr and tail entity tr. In this relation space, TransR’s goal is to align the transformed head entity hr closely with the transformed tail entity tr through the translation of relation r, i.e., . While TransR substantially enhances the handling of complex relationships by utilizing separate spaces, the requisite transformation matrices add computational and relational complexity, resulting in increased parameterization and certain operational constraints.
Analogy is a graph embedding model that emphasizes linear structures to enhance the representation of semantic information in knowledge graphs. This model strives to maintain the linear structure of entity and relation embeddings. For a fact triplet (h, r, t), Analogy approximates the tail entity t by computing the Hadamard product of the head entity h with the relation r, denoted as , where represents the Hadamard product between vectors. One of the notable advantages of Analogy is its simplicity and computational efficiency. With its streamlined architecture, Analogy can be trained at a lower computational cost, yet it still manages to learn high-quality embedding vectors. Additionally, by preserving the linear structure of embeddings, Analogy effectively captures the complex semantic relationships inherent in knowledge graphs, making it a robust model for understanding and processing graph-based data.
The ComplEx model leverages the properties of complex numbers to enhance the representation of entities and relations in knowledge graphs, particularly focusing on symmetric and anti-symmetric relationships. In this model, each entity and relation is depicted as a vector in the complex space. For a triplet (h, r, t) in the knowledge graph, ComplEx represents the entities h and t, and the relation r, as complex vectors . A distinctive scoring function is employed by ComplEx to assess the validity of a triplet, defined as , where denotes taking the real part of the complex number and represents the conjugate of ti. One of the primary strengths of ComplEx is its adeptness at articulating symmetrical and anti-symmetrical relationships via the utilization of complex spaces. For example, within an anti-symmetrical relation r, if (h, r, t) is valid, then (t, r, h) is typically not valid, highlighting the model’s capacity to discern and represent such relational nuances effectively. Additionally, the ComplEx model is noted for its simplicity and streamlined parameter set, which contributes to greater efficiency during training, especially advantageous when handling large-scale knowledge graphs.
The DistMult graph embedding model utilizes a simplified matrix factorization approach to learn representations of entities and relations. In this model, relations are modeled as diagonal matrices, which significantly reduces the number of parameters and boosts computational efficiency compared to other matrix factorization-based graph embedding models. DistMult employs a direct scoring function to evaluate the validity of a triplet. For a given triplet (h, r, t), the score is computed by , where diag(r) transforms the relation vector r into a diagonal matrix, and denotes the vector transpose. The primary advantage of the DistMult model is its simplicity and operational efficiency. By modeling relations as diagonal matrices, DistMult reduces its parameter load, thereby enhancing its efficiency for training on large-scale knowledge graphs. However, this simplicity comes with certain drawbacks. The reliance on diagonal matrices to represent relations limits DistMult’s ability to capture complex relational patterns, particularly asymmetric relations. Consequently, DistMult may underperform in tasks that require modeling of intricate relationship dynamics compared to more complex models.
3.1.3 Dimensionality reduction model
Despite the initial transformation of graph data into vector representations via the aforementioned graph embedding models, further refinement is crucial to enhance computational efficiency and focus on the pivotal features of each berth representation vector. This refinement process aims to filter out noise and redundant information, thereby sharpening the subsequent analyses. To achieve this, our framework incorporates established dimensionality reduction techniques, namely principal component analysis (PCA) and t-distributed stochastic neighbor embedding (t-SNE). These methods are adept at condensing the representation vectors while preserving essential information, thus facilitating more precise analyses. Here is a brief acknowledgment of the dimensionality reduction techniques applied in this study.
PCA reduces the dimensionality of data by identifying the directions that maximize variance within the data. The process begins with standardizing the data features, followed by calculating the covariance matrix to analyze correlations between these features. This analysis helps identify the principal directions of variance, known as principal components. The original data are then projected onto the new space defined by these principal components, effectively reducing its dimensionality.
t-SNE is an ML-based dimensionality reduction algorithm that maps high-dimensional data points into a two-dimensional or three-dimensional space. It simulates the distribution of similarities among high-dimensional data points in the low-dimensional space. t-SNE maintains proximity between similar points and ensures distances between dissimilar ones through an optimization process, thus preserving both the local and global structures of the data in the low-dimensional space.
3.1.4 Classification model
Leveraging the dimensionally reduced ship representation vectors, the framework employs multiple classification models to categorize ships effectively. This array includes K-nearest neighbor (KNN), decision tree, random forest, support vector machine (SVM), and Gaussian naive Bayes, among others. The diversity of ML classification models enriches the analysis by providing multiple analytical perspectives and employing varied classification strategies. This approach ensures the identification of the most effective model for the intended downstream tasks, optimizing the classification process.
3.1.5 Similarity calculation
For the purpose of similarity analysis, particularly in discerning the similarity between berths, the framework adopts the cosine similarity metric. The calculation method of cosine similarity is shown in Equation (1):
where A and B denote the vectors under comparison, with the denominator representing the product of their magnitudes and the numerator being the dot product of the vectors. This metric’s independence from vector dimensionality and insensitivity to vector scale render the similarity results straightforward and interpretable.
3.2 Dataset
The dataset used in this study consists of two primary components: the vessel entry and departure dataset and the berth statistics dataset. The vessel entry and departure data were gathered from the AIS records of ships entering and exiting Tianjin Port, China, from January to May 2022, as depicted in Figure 4. Tianjin Port was selected as the focus of this research due to its extensive navigational channels, anchorages, and berth resources, which offer a wealth of data and a variety of scenarios for analysis. This selection enables a thorough examination of vessel behavior and berth utilization across diverse conditions.
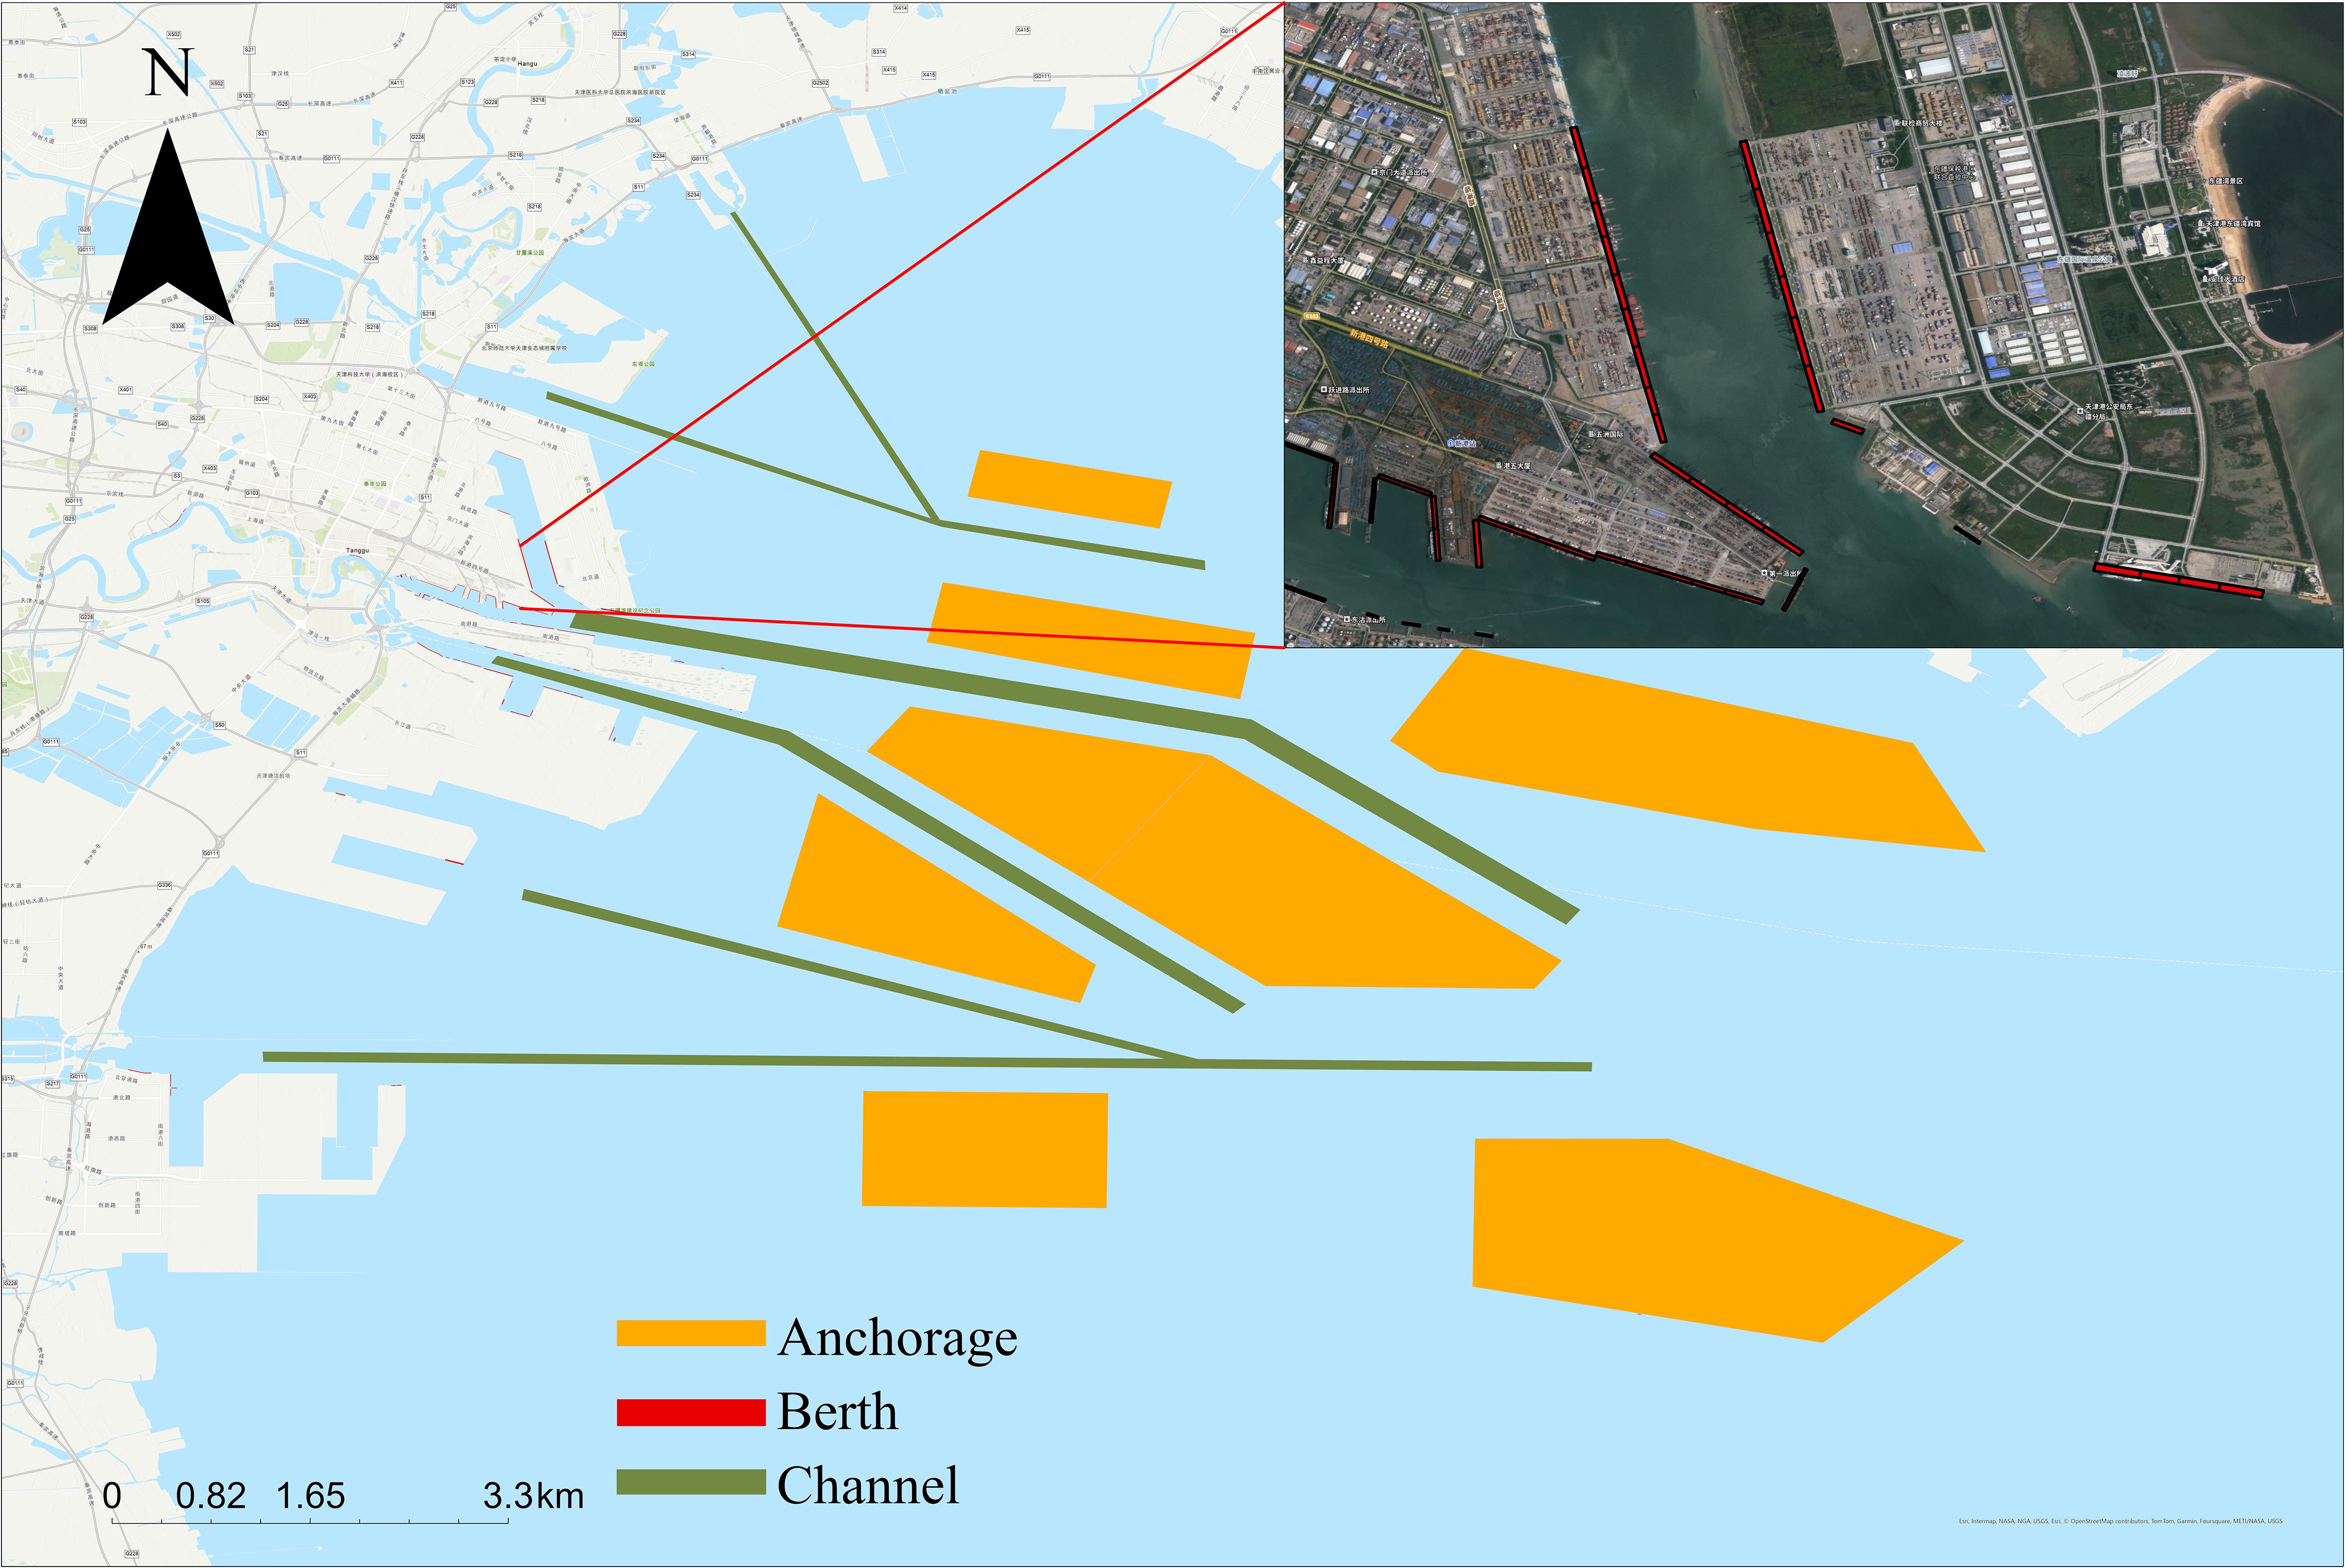
Figure 4 The scope of the Tianjin Port vessel entry and departure dataset is shown in the figure, where the orange represents the anchorage area. The green indicates the entry and departure channels, and the red represents the berthing areas.
To determine whether the AIS data collected encompassed ship berthing activities and to eliminate noise data, this study performed a behavioral analysis on the gathered AIS data. Within this dataset, each docked ship was identified and cataloged by its Maritime Mobile Service Identity (MMSI), which facilitated the construction of a behavioral sequence for the ships based on their MMSI. Notably, berthing events displayed unique behavioral patterns, such as a reduction in the ship’s speed to nearly zero during docking and adherence to the International Maritime Organization (IMO) standards regarding the ship’s minimum queue length. Utilizing a sliding window algorithm, as illustrated in Figure 5, this study grouped points that exhibited latitude and longitude differences below a specified threshold within a certain timeframe into single trajectory points. By linking these trajectory points, the ship’s AIS trajectory was accurately reconstructed to reflect its behavioral patterns. From the extensive AIS dataset, a total of 45,648 entries of vessel entry and departure data that conformed to the study’s criteria were successfully filtered.
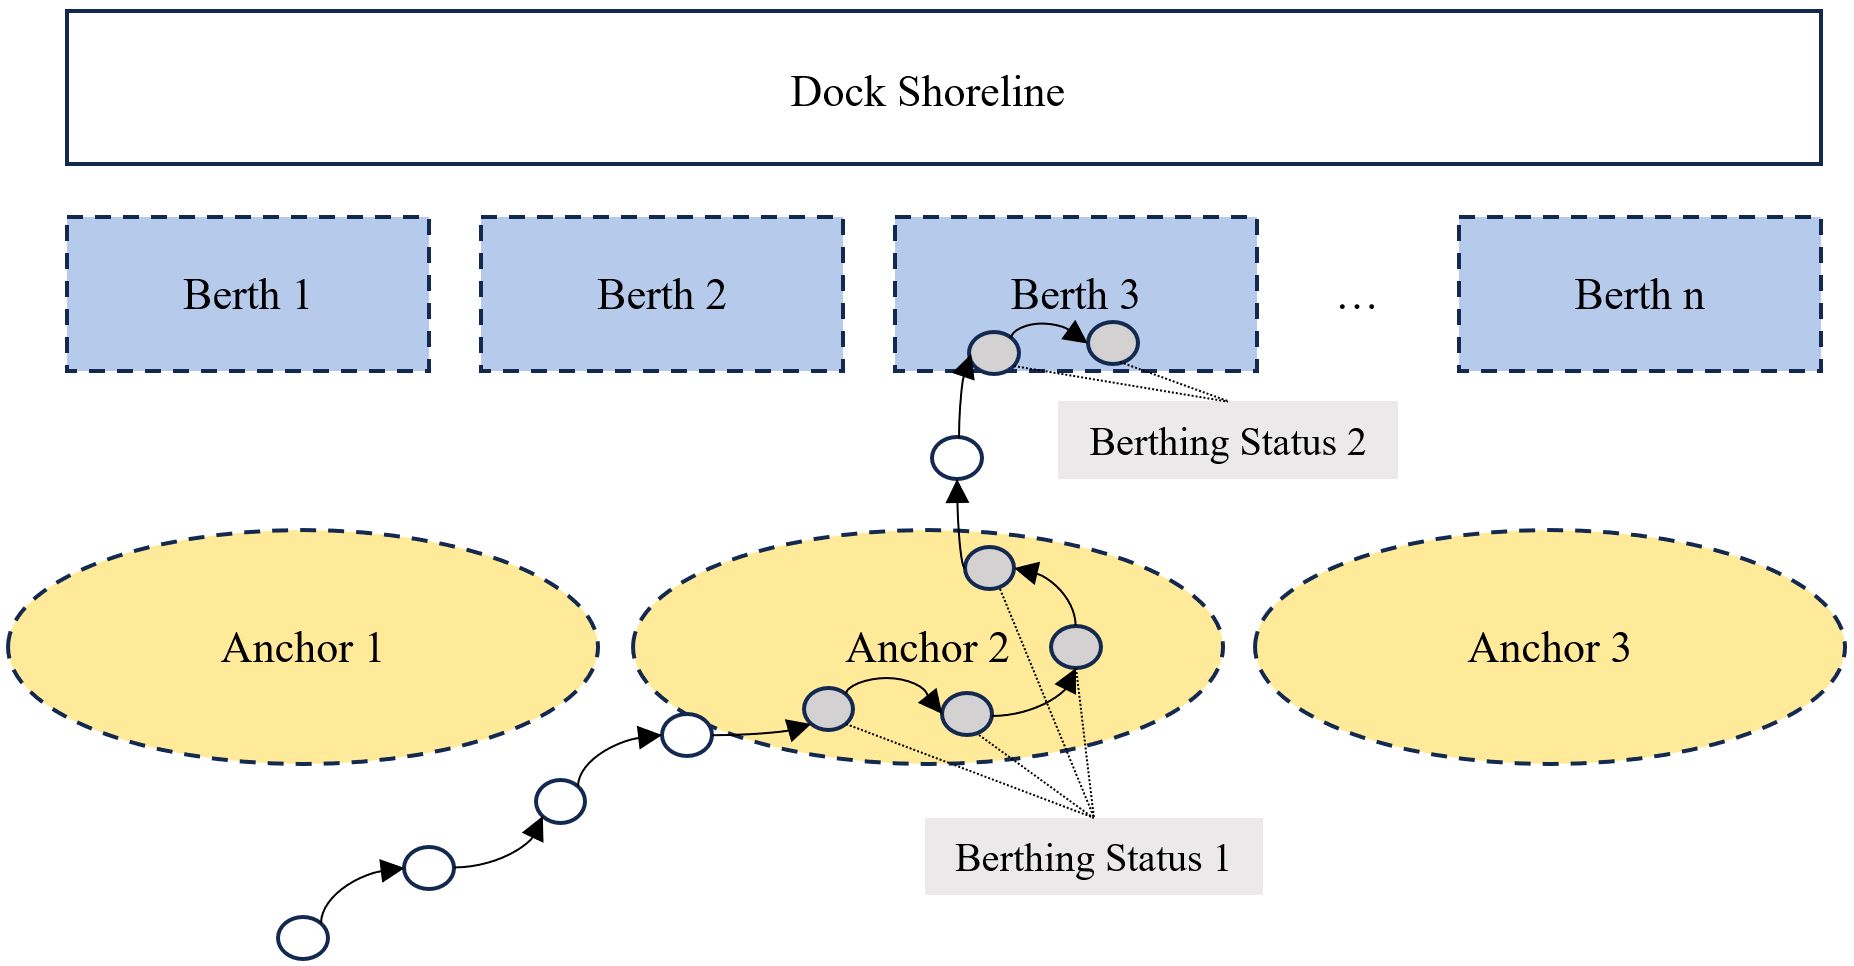
Figure 5 Methods for mining berthing statuses through AIS trajectory analysis.
The berth statistics dataset was collected based on the utilization of berths at Shanghai Port and the surrounding port areas throughout 2021, with the detailed scope of berth data collection depicted in Figure 6. The Yangtze River Delta region, recognized as one of China’s most critical economic zones, features an extensive array of berths within a dynamic maritime transportation environment. Selecting this region for the study offers a more comprehensive insight into the complexities and distinctive challenges of berth management and vessel transportation within major port clusters.
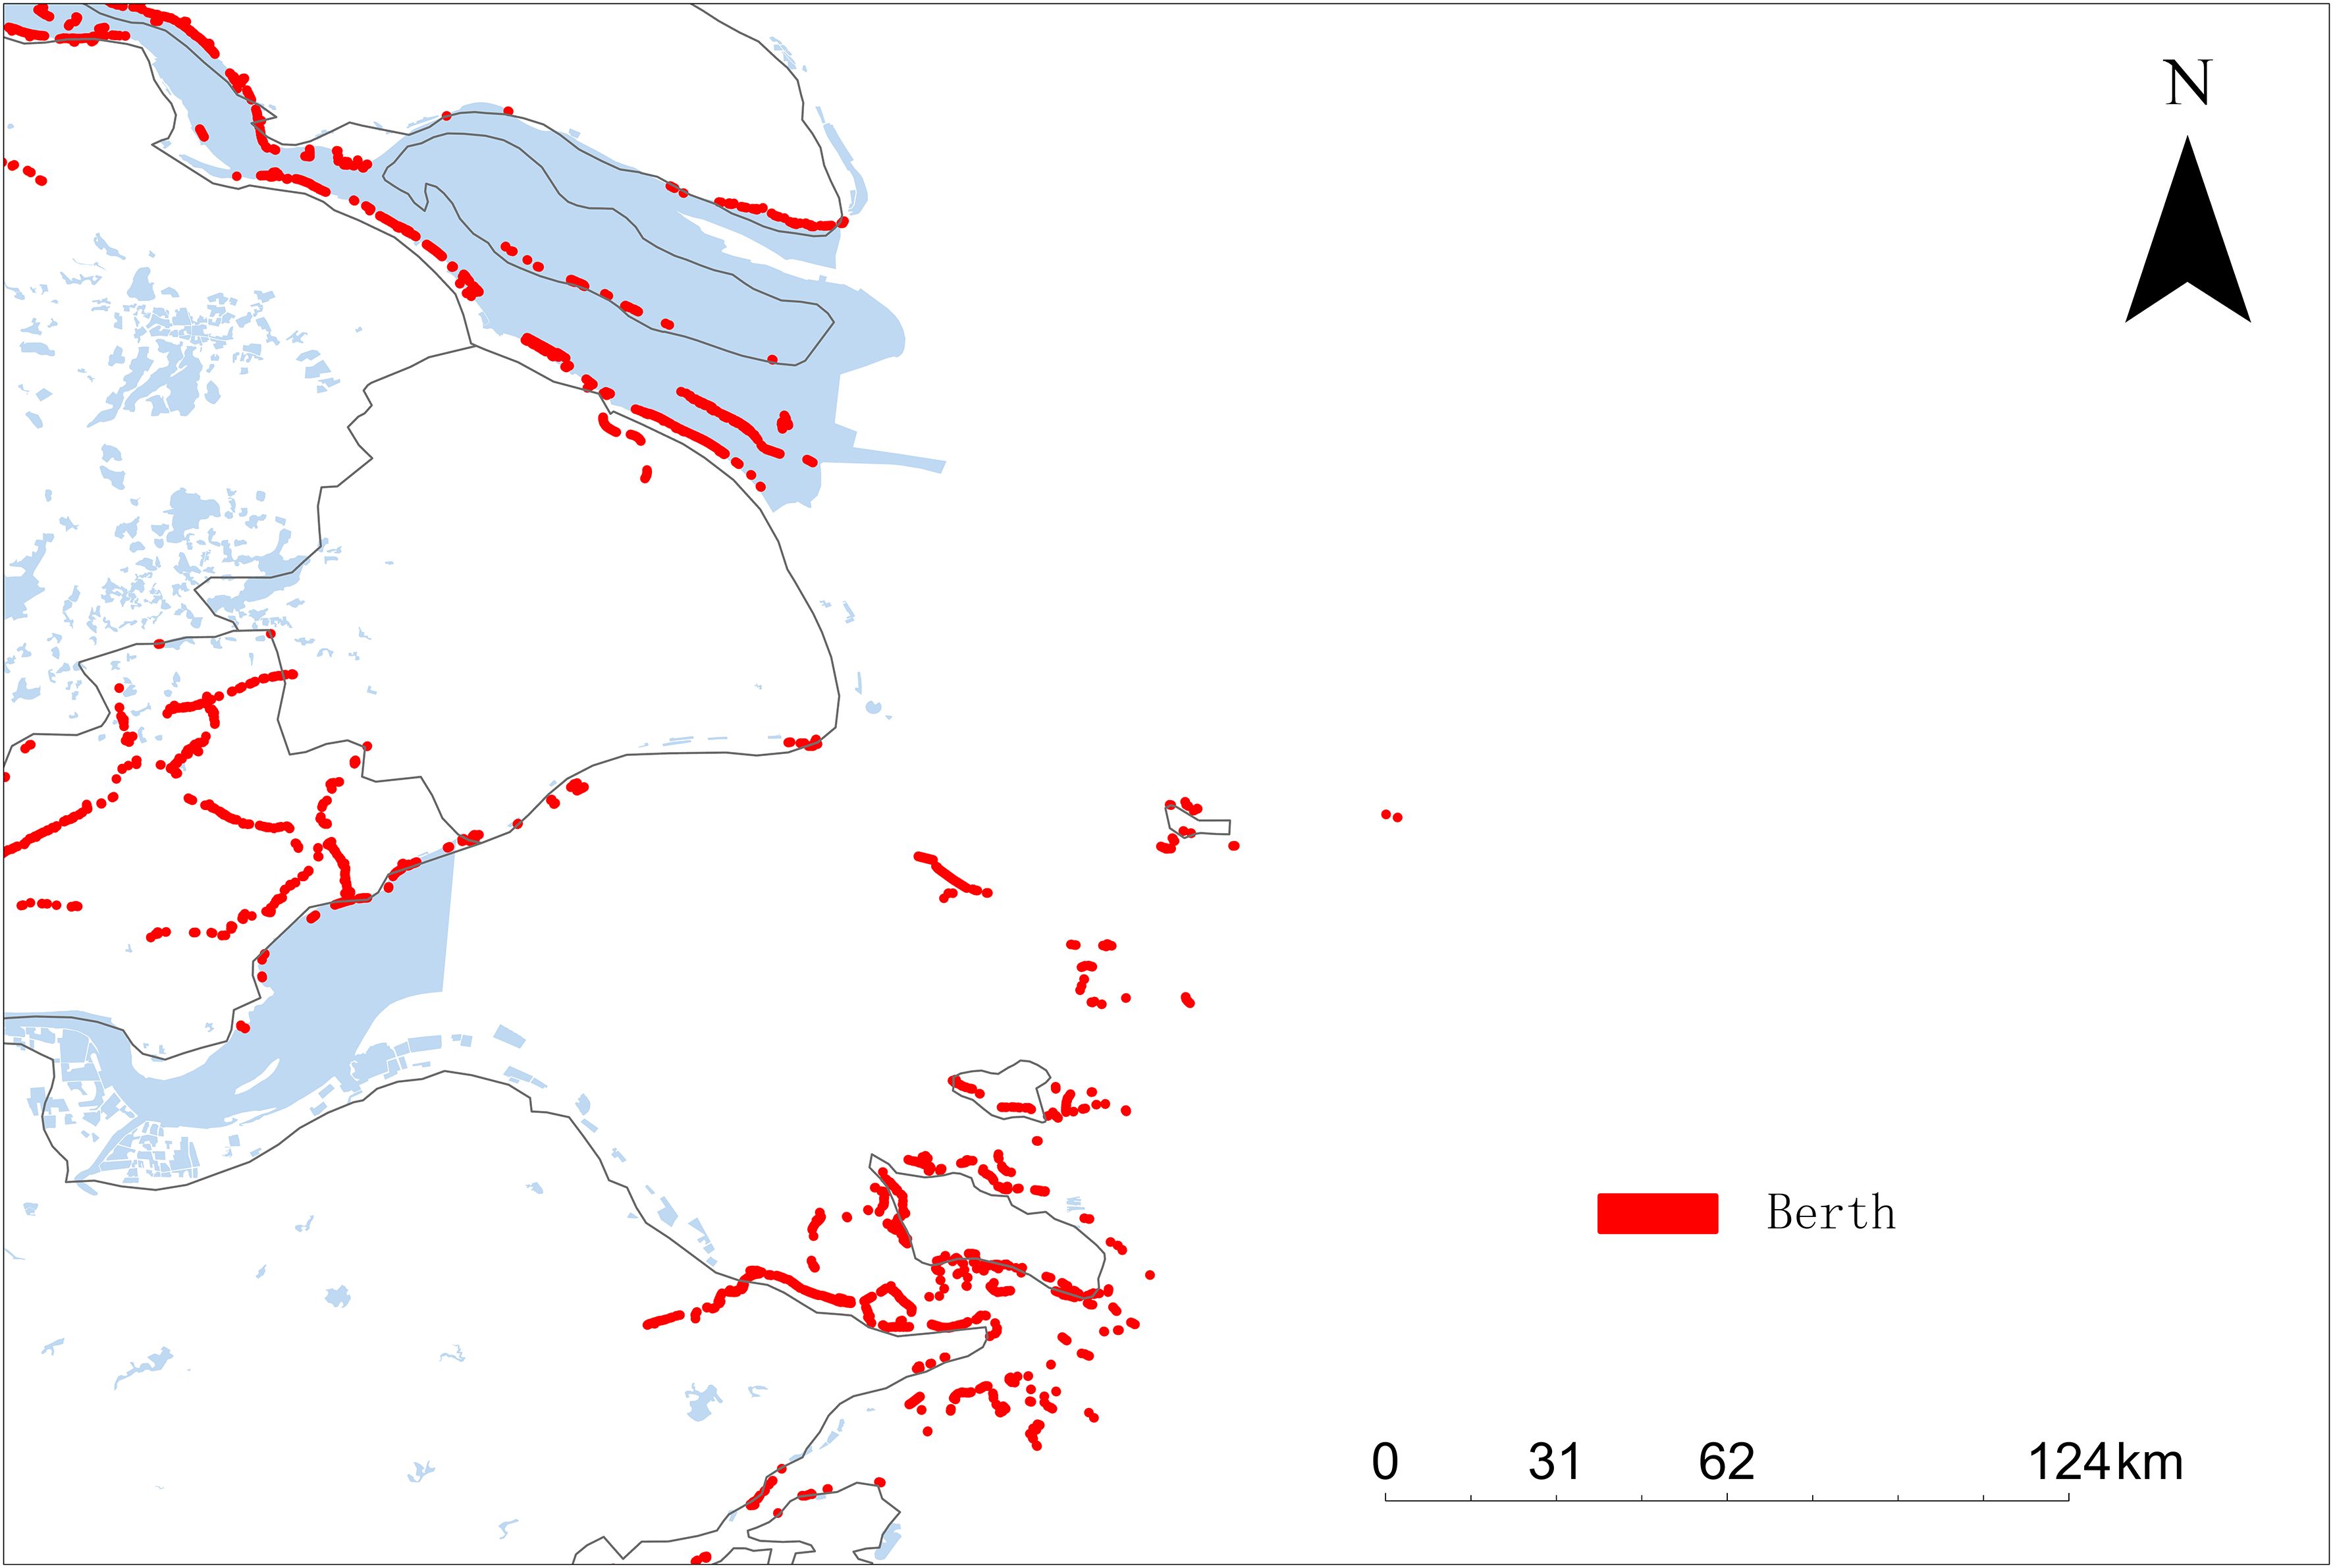
Figure 6 The scope of the berth statistics dataset, with red marked points indicating the locations of the berths being analyzed.
The statistics compiled include the service duration and the vessels served at each berth. However, during the data collection process, instances were noted where multiple ships were docked at the same berth simultaneously. This could occur either because the berth is sufficiently large to accommodate several smaller ships at once, or due to larger vessels at adjacent berths overlapping into the berth under study, thus influencing the recorded docking data. To accurately assess berth usage while preserving the diversity of data across different ship types, this study implemented a specialized statistical method for berth data. Initially, each berth was treated as an individual research unit, with its operational duration calculated based on the arrival and departure times of all ships that docked there. During this period, the docking of each type of ship was recorded separately to explore the docking characteristics specific to the berth. This approach resulted in a comprehensive dataset comprising 151,682 ship berthing records.
In the process of forming triplets, the connections between vessels and infrastructure are precisely articulated utilizing two entities (for instance, a vessel and a berth) and a relation (such as “docks at”). For the Tianjin Port vessel entry and departure statistics dataset, a triadic relationship among the ship’s MMSI, navigation channel, anchorage, and berth was established based on the vessel’s entry and departure data. A total of 21,374 triadic data entries were compiled, including relationships such as (MMSI, channel, channel number), (MMSI, berth, berth number), and (MMSI, anchorage, anchorage number). For the Shanghai Port berth statistics dataset, a triadic relationship was also delineated between different berths and their territorial belonging, as well as the characteristics of the vessels serviced by these berths. A total of 12,885 triadic data entries were constructed, covering relationship types such as (berth ID, affiliation, port), (berth ID, affiliation, port area), (berth ID, type of docked ship, ship type), (berth ID, affiliated, berth office), (berth ID, purpose of berth, purpose), and (berth ID, tonnage of berth ship, tonnage type). The dataset categorizes ship’s tonnage into four types: small-medium (0–5,000 t), medium (5,000–20,000 t), large (20,000–50,000 t), and extra-large (over 50,000 t).
Tables 1 and 2 provide a comprehensive enumeration of different types of vessels included in the port-related dataset and the specific data types utilized in this study, respectively.
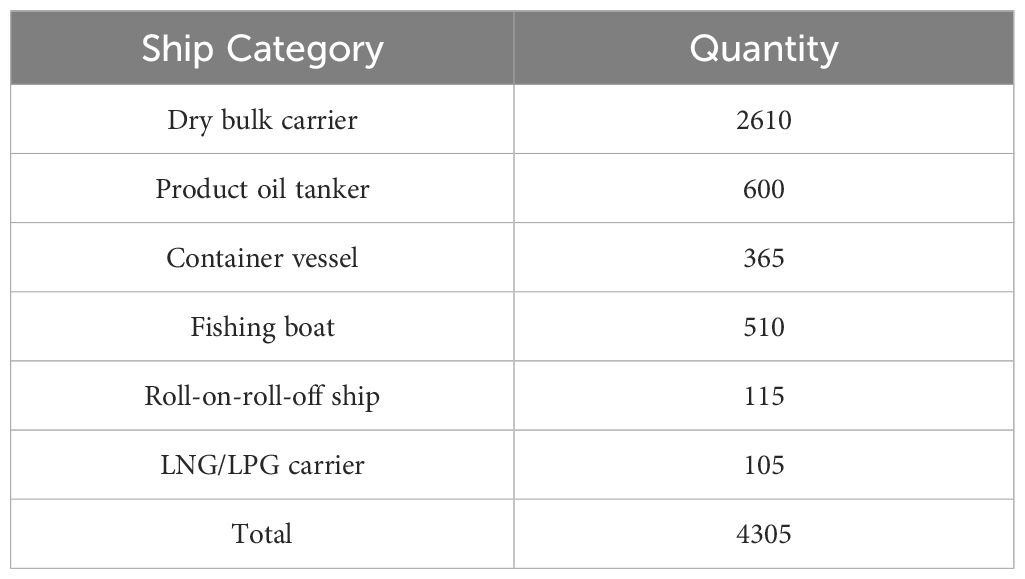
Table 1 Number of ships in each category in the port-related dataset.
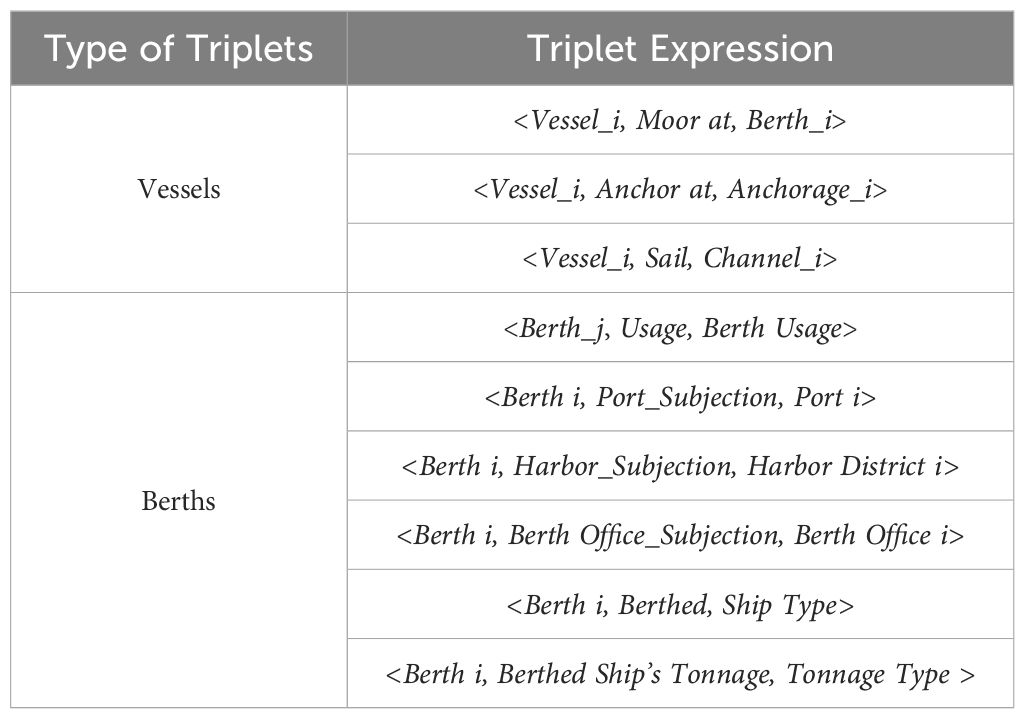
Table 2 Data types included in this study’s dataset.
The triplets, including those associated with vessels and berths, are identified and listed in Table 3. A knowledge graph was constructed utilizing these identified triplets.
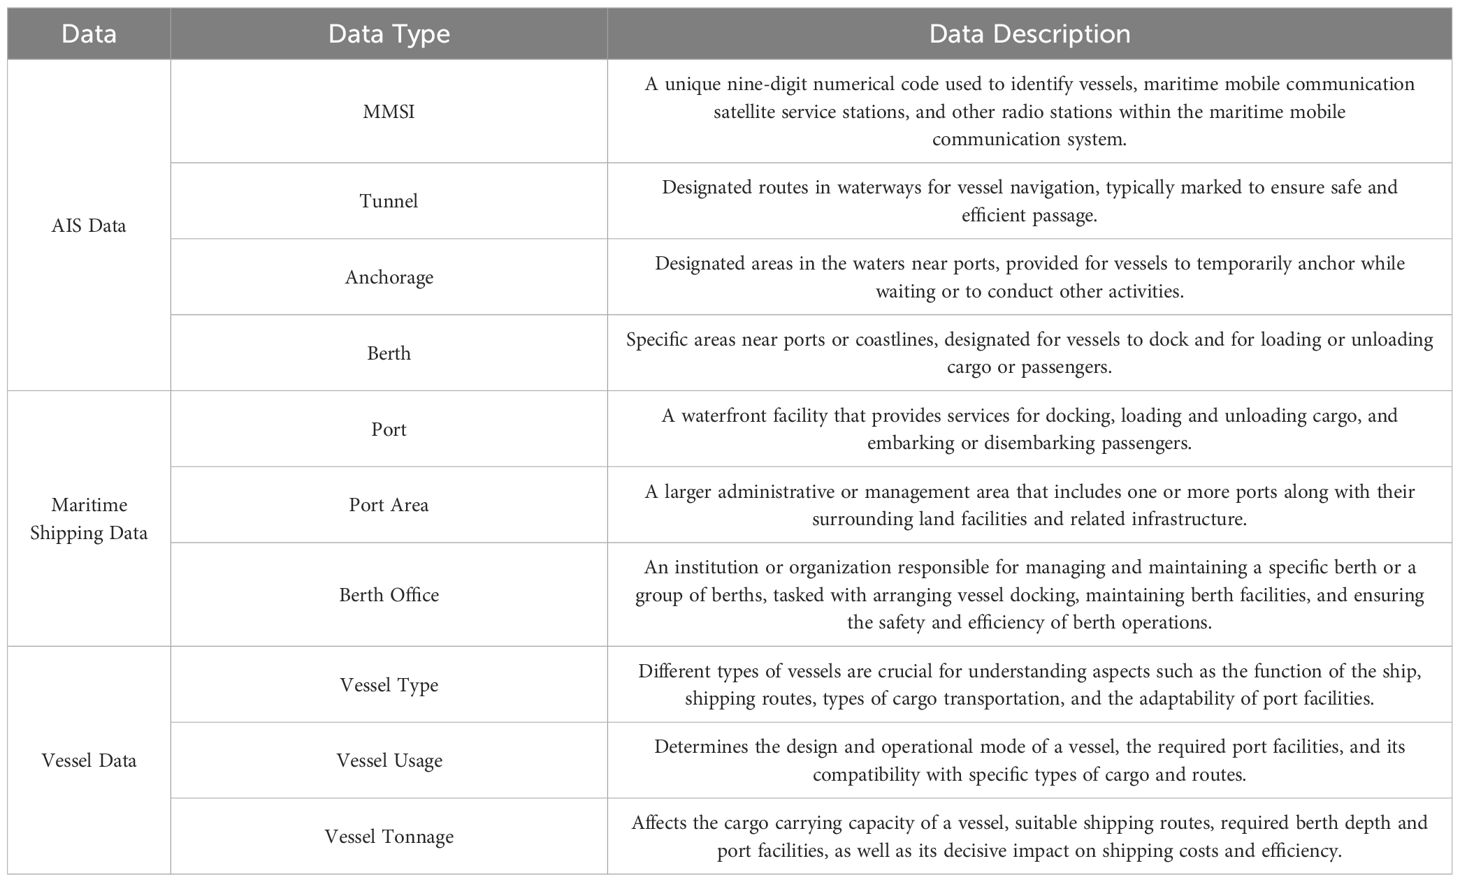
Table 3 Triplet extraction in this paper.
Figure 7 illustrates a schematic of the maritime knowledge graph, constructed using triadic relationships derived from the Tianjin Port entry and exit data, along with the Shanghai Port berth statistics data. This knowledge graph’s triadic construction method effectively captures the relational features between ships and port maritime facilities. By extracting analyzable relational semantics, it lays a solid foundation for subsequent tasks, such as maritime shipping feature analysis, enabling a deeper understanding of the dynamics and interactions within port operations.
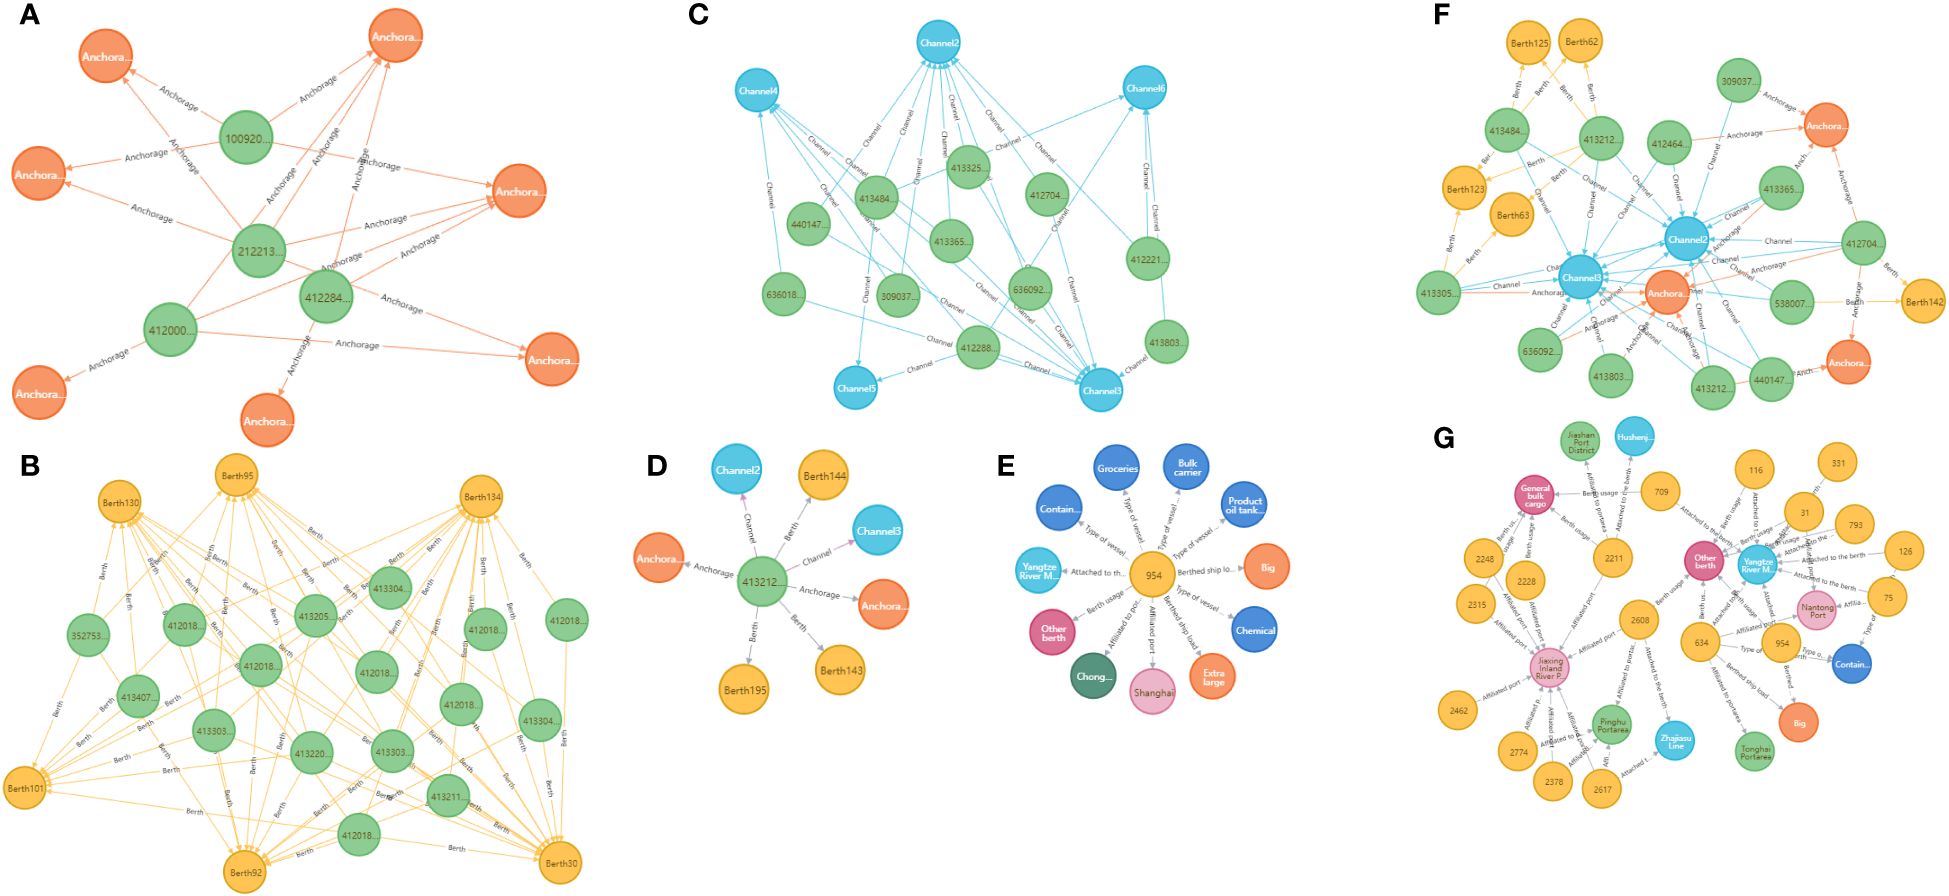
Figure 7 (A–G) Examples of graph visualization results.
In this study, Figures 7A–C, depict homogeneous relationship graphs representing ships at anchorages, berths, and in navigation channels, respectively. These figures highlight the relationship characteristics between ships and specific categories of maritime facilities. By analyzing these relational and connective patterns among the maritime entities, the extracted features can be leveraged for various downstream analytical tasks. Figures 7D, E illustrate the relationship graphs of individual ships and berths with associated maritime entities, respectively. Through these focused entity relationship graphs, features of particular entities are more effectively extracted and modeled, enhancing the precision of the analysis. Figures 7F, G are heterogeneous maritime information knowledge graphs, constructed using the datasets from ship entries and exits at Tianjin Port and berth statistics from Shanghai Port, respectively. These graphs vividly display the connections and interactions among a range of maritime entities. In these heterogeneous graphs, not only are relationships between entities described, but concepts such as meta-paths are also employed. These meta-paths facilitate the consideration of structural and semantic connections between entities, thus enabling a more profound understanding of the complex relationships inherent in the data. This comprehensive approach supports enhanced data mining and analytical tasks by providing a deeper insight into the multifaceted features of maritime data.
3.3 Introduction to application scenarios of the framework
Scenario 1 - Ship Type Prediction: Ship type prediction stands as a pivotal technology within the intelligent maritime domain, essential for enhancing ship traffic monitoring, port management, cargo tracking, and coastal patrol and border security measures. This study leverages knowledge graph embedding models to distill features from multiple dimensions, generating comprehensive feature vectors. Through subsequent dimensionality reduction and classification processes, ships under test are accurately classified into their respective predefined types, showcasing the application’s potential in operational optimization. As illustrated in Figure 8, from a micro-perspective, ships routinely exhibit behaviors such as anchoring, sailing, and berthing while navigating within harbors. Their trajectories intersect with specific geographic spaces like fairways, anchorages, and berths. Rather than relying solely on numerical data represented by latitude and longitude, ship captains focus more on the semantic information concerning “where the ship is navigating”, “where it is anchoring”, and “where it is berthing” during their voyage. Upon receiving lookout information (such as passing a lighthouse or traversing a waterway) and multisource perception data, captains also abstract these ship behaviors into semantic networks and engage in contemplation. This process results in the formation of a “small network” that has the characteristic features of ship navigation.
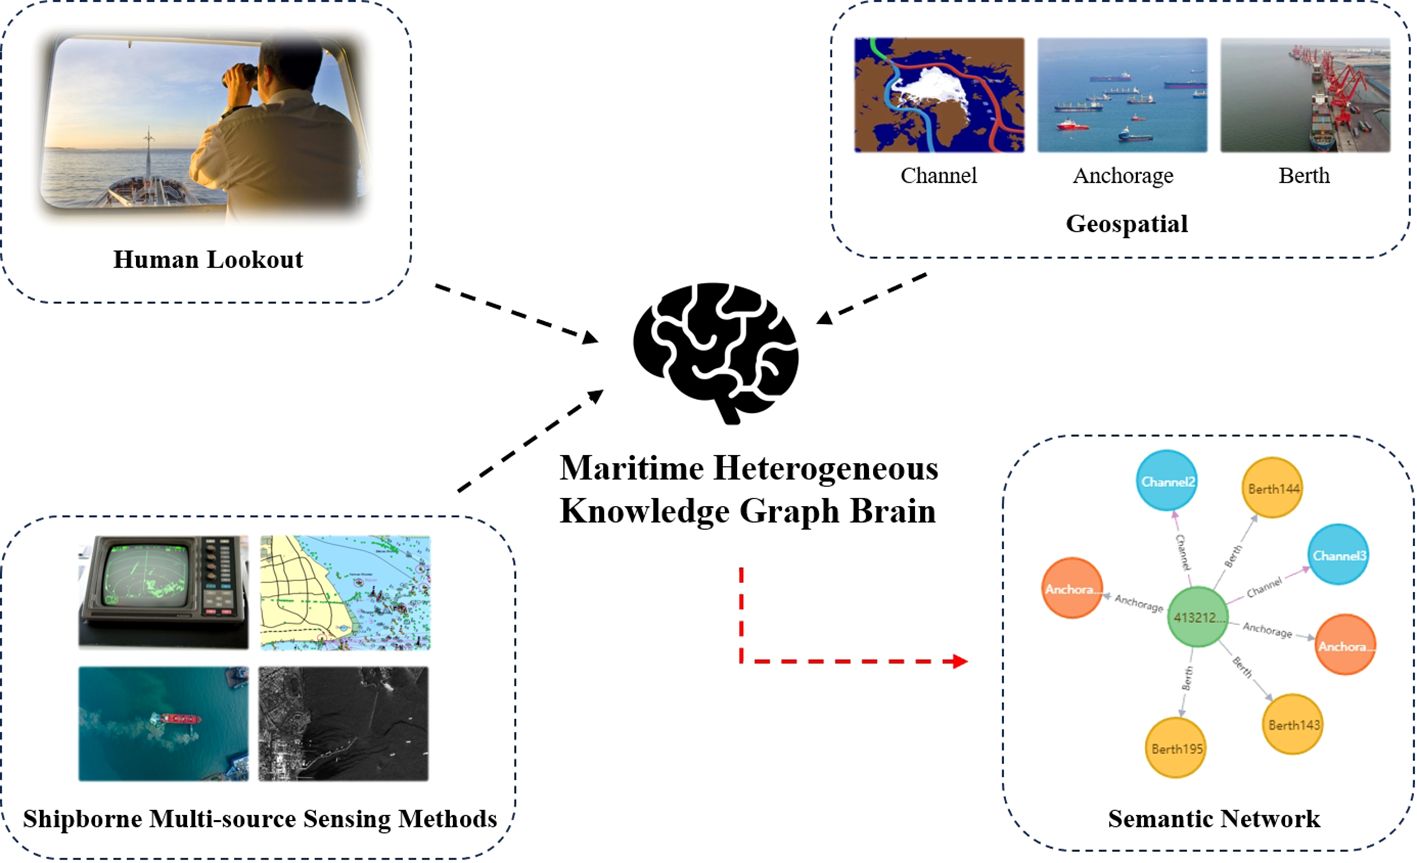
Figure 8 The scenario of ship type prediction.
Scenario 2 - Similar Berth Recommendation: Similar berth recommendation represents a practical application within the intelligent maritime domain, utilizing advanced information technology to recommend optimal docking locations for ships. This scenario facilitates port resource optimization, shipping company route planning, and the efficiency of cargo handling processes. By establishing a berth knowledge graph and applying similarity calculations and recommendations, the study identifies and suggests berths with similar characteristics, enhancing operational efficiency and decision-making processes. As shown in Figure 9, berths demonstrate specific berthing preferences for different vessels, influenced by their infrastructure attributes, such as ship size and capacity, as well as commercial attributes like port ownership and port area. These factors necessitate their integration into the autonomous berthing decision-making process. To accommodate this, a multidimensional berth similarity model has been developed, which effectively recommends berths by comprehensively considering these diverse factors.
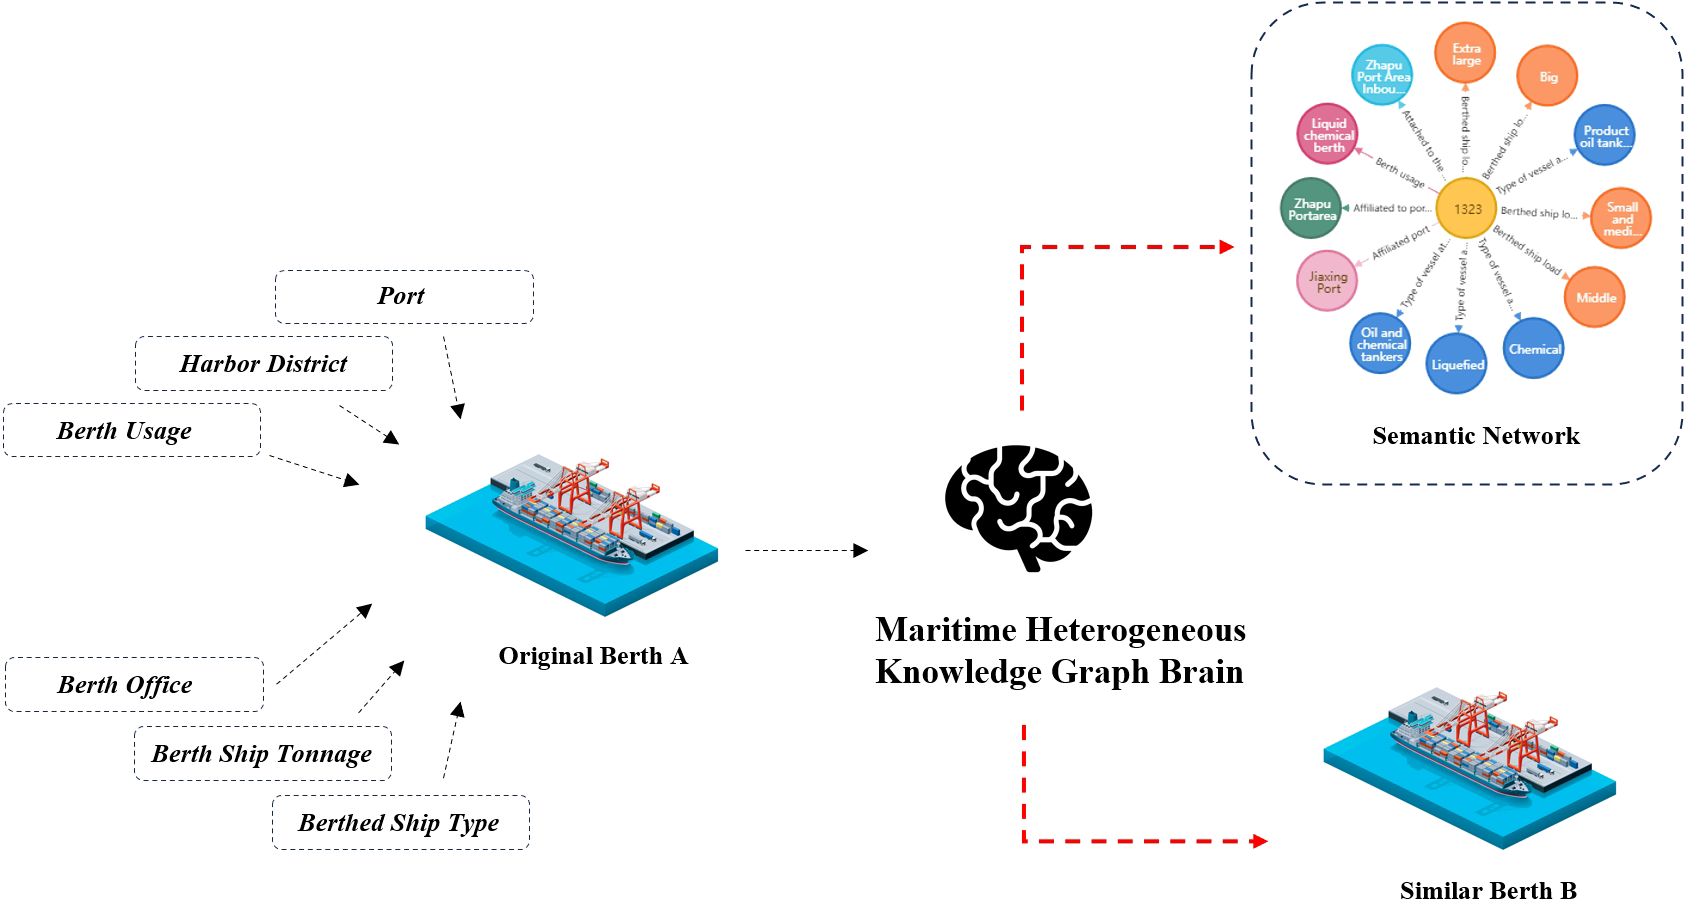
Figure 9 Schematic diagram of the similar berth recommendation scenario.
4 Experimental results and analysis
This section presents a comprehensive evaluation of the proposed model across various datasets and application scenarios, focusing on downstream tasks including similar berth recommendation and ship type prediction. Utilizing a custom-built port-related dataset, the study embarks on a multi-faceted examination: Initially, the semantic construction of ships and port infrastructure through the knowledge graph is outlined, setting the stage for in-depth analysis. Evaluation metrics specific to each dataset are introduced, providing a benchmark for assessing model performance. The efficacy of individual graph embedding models is scrutinized across different datasets, highlighting their capabilities and limitations. The performance of combined models on the datasets is evaluated, with ablation experiments and internal analyses conducted to ascertain the contribution of each framework module.
4.1 Ship type prediction
4.1.1 Evaluation metrics
For ship type prediction, a supervised classification approach was employed, necessitating the use of conventional evaluation metrics to determine the effectiveness of the classification models. These metrics include:
Accuracy: Measures the ratio of correctly classified ship samples within the test set.
Precision: Indicates the ratio of correctly identified ship samples to all samples classified by the model.
Recall: Represents the ratio of correctly identified samples within each ship type category of the test set.
F1 Score: Calculates the harmonic mean between Precision and Recall, providing a balance between the two metrics.
Macro Average: Computes the arithmetic mean of the metrics for each ship type category, treating each category with equal importance. This metric, however, may be affected by categories with fewer samples.
Weighted Average: Determines the weighted mean of each ship type category’s metrics, according to the proportion of samples in each category relative to the total sample set. This approach accounts for sample imbalances across categories.
4.1.2 Experimental setup
The experiment utilized a series of relational triplets from the port-related dataset, derived from ships’ entry and exit records. Introduce the OpenKE graph embedding model framework (Han et al., 2018) using PyTorch and Sci-kit Learn libraries. Configure embedding vectors for entities within the graph to dimensions of 50, 100, and 200 using graph embedding and supervised ML classification models. Comparative analysis across several classification models, including KNN, decision tree, random forest, SVM, and Gaussian naive Bayes, aimed to categorize ships into six distinct classes: dry bulk carriers, product oil tankers, container vessels, fishing boats, roll-on-roll-off ships, and LNG/LPG carriers. The dataset underwent a random split, allocating 80% for training and 20% for testing, with this division repeated five times to compute the average metric scores.
4.1.3 Experimental results
To evaluate the experimental effectiveness of the framework proposed in this study for ship classification tasks using port-related datasets, and to determine the optimal model combination, various graph embedding models and embedding dimensions were explored in the classification experiments. Figures 10A–C display the Precision, Recall, and F1 Scores for various graph embedding models and dimensions within the dataset, incorporating all dimensionality reduction techniques and classification methods in the analysis. Significantly, the TransR model demonstrated superior average performance across all evaluated metrics with an embedding dimension of 50. It achieved precision, recall, and F1 scores of 0.744, 0.749, and 0.737, respectively. Meanwhile, the ComplEx and DistMult models also showed commendable performance across various metrics and dimensions, highlighting the effectiveness of these embedding models in classifying ship types.
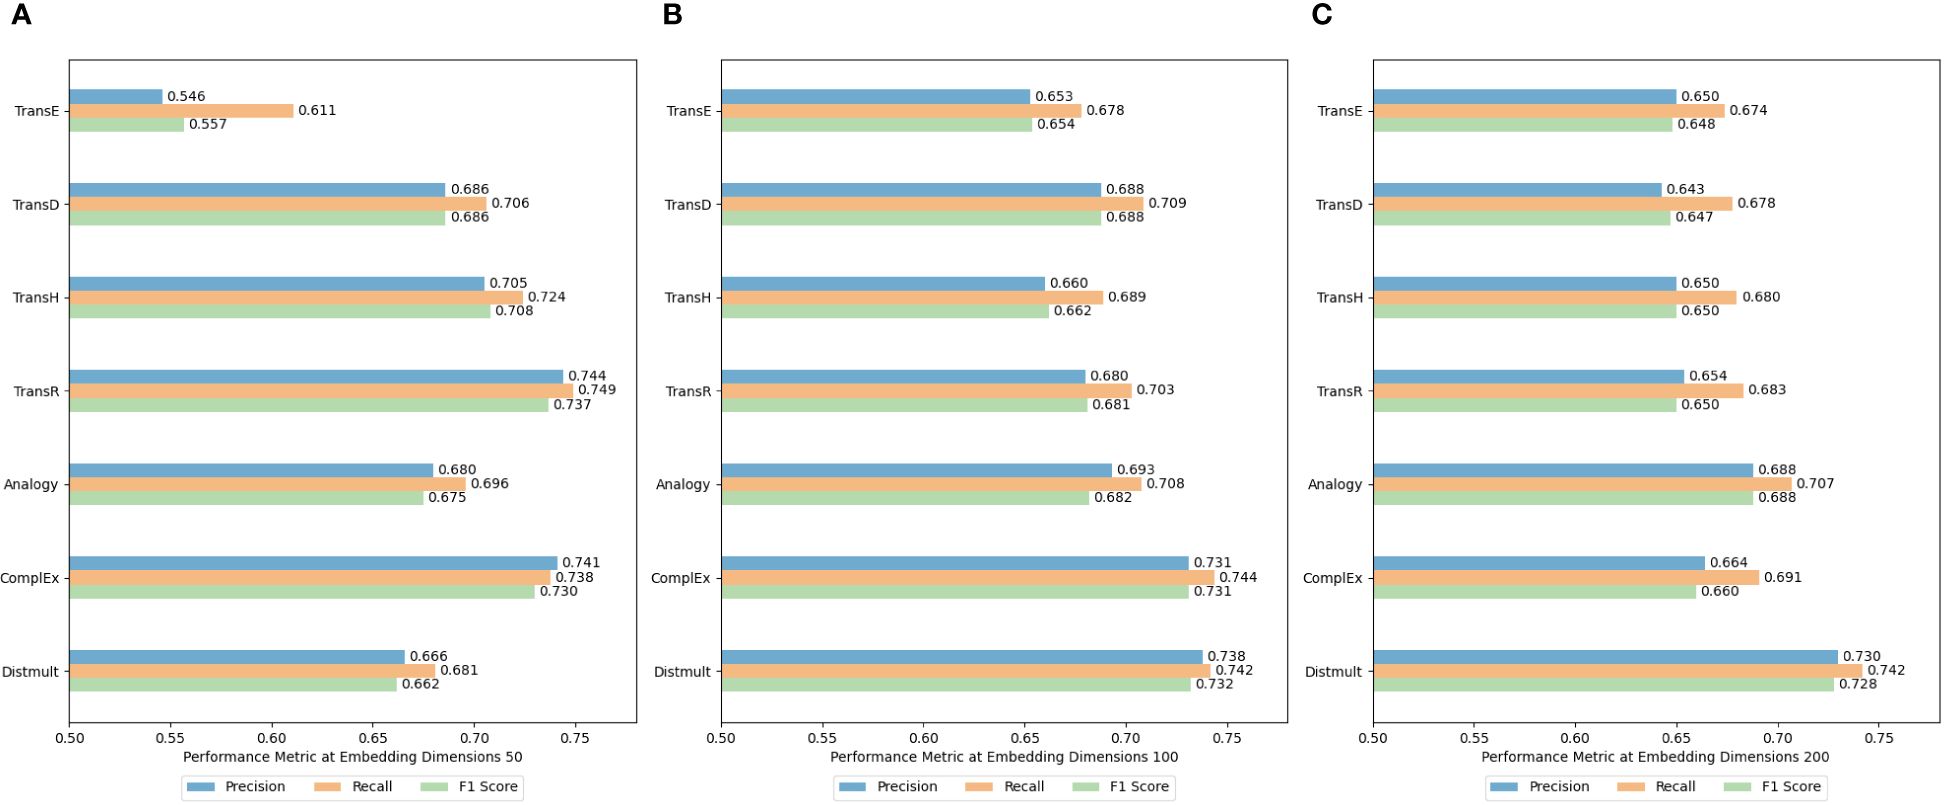
Figure 10 (A–C) Average classification results for the port-related dataset classification task using different embedding models.
To ascertain the most effective dimensionality reduction technique and optimal embedding dimensions, we focused on the TransR, ComplEx, and DistMult models due to their superior average performance in preliminary experiments. Figures 11–13 illustrate the average Precision (Figures 11A, 12A, and 13A), Recall (Figures 11B, 12B, and 13B), and F1 Scores (Figures 11C, 12C, and 13C) for the ship classification tasks within the port-related dataset across different embedding dimensions. They highlight results across various dimensionality reduction methods and embedding dimensions, utilizing all classification approaches within our framework. The TransR model, with an embedding dimension of 50 and utilizing t-SNE for dimensionality reduction, emerged as the most effective configuration for ship classification. Notably, its performance remained superior when reduced to either 2 or 3 dimensions, outperforming other model combinations. Specifically, when reduced to 2 dimensions, the model achieved an accuracy of 0.811, a recall of 0.812, and an F1 score of 0.808. Similarly, when the classification was reduced to 3 dimensions, it recorded an accuracy of 0.800, a recall of 0.802, and an F1 score of 0.798.
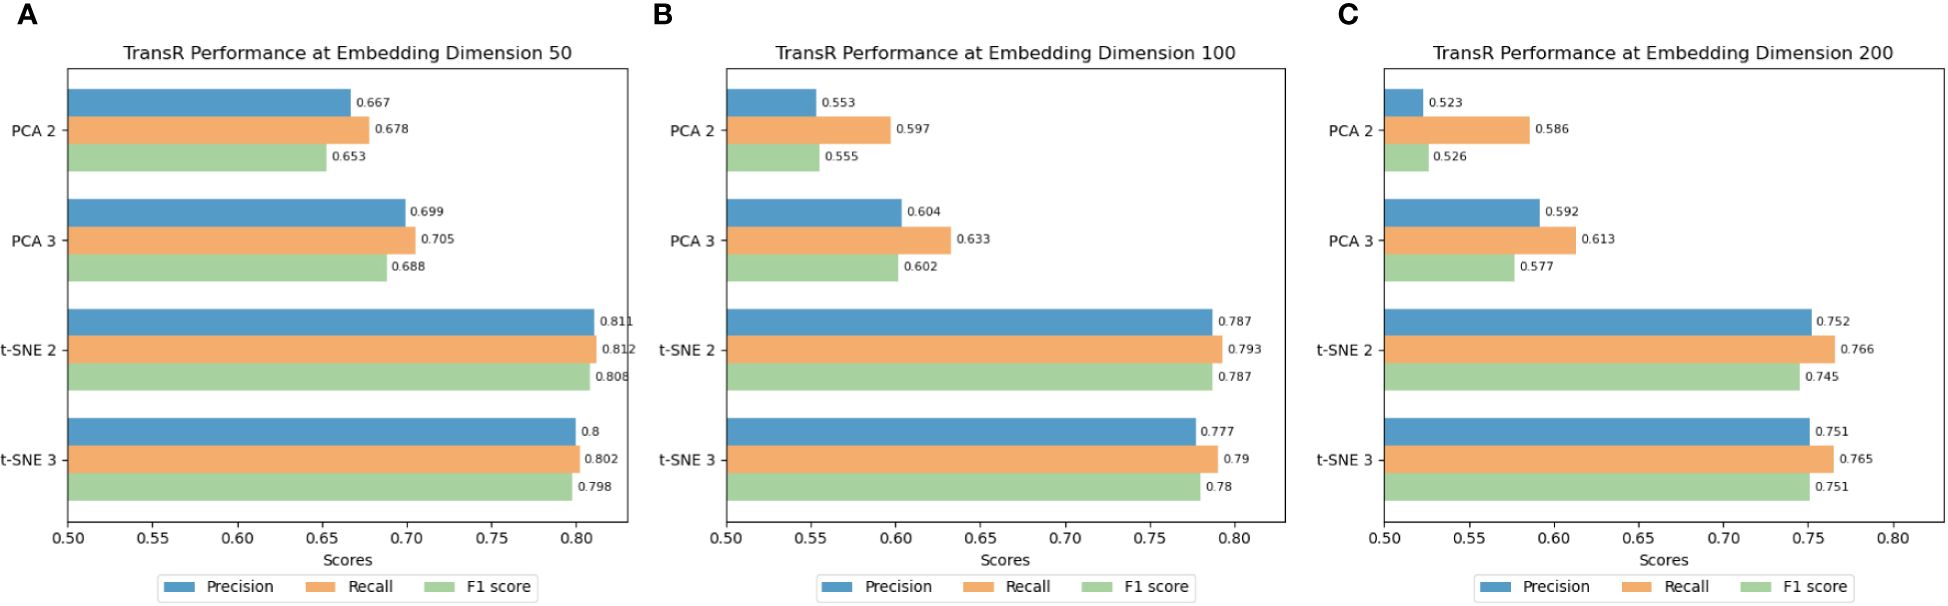
Figure 11 (A–C) Classification results of TransR using different dimensionality reduction methods and dimensions.
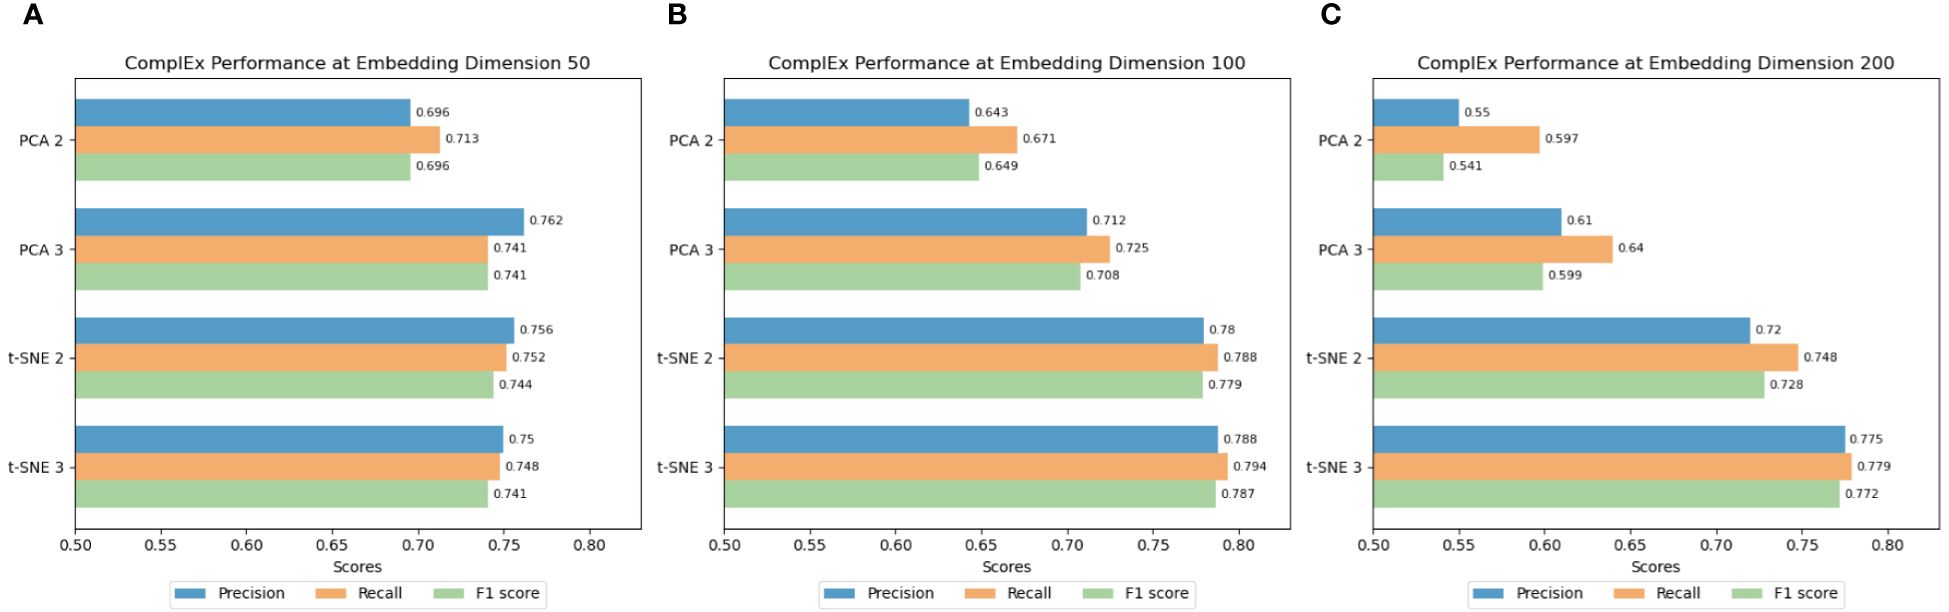
Figure 12 (A–C) Classification results of ComplEx using different dimensionality reduction methods and dimensions.
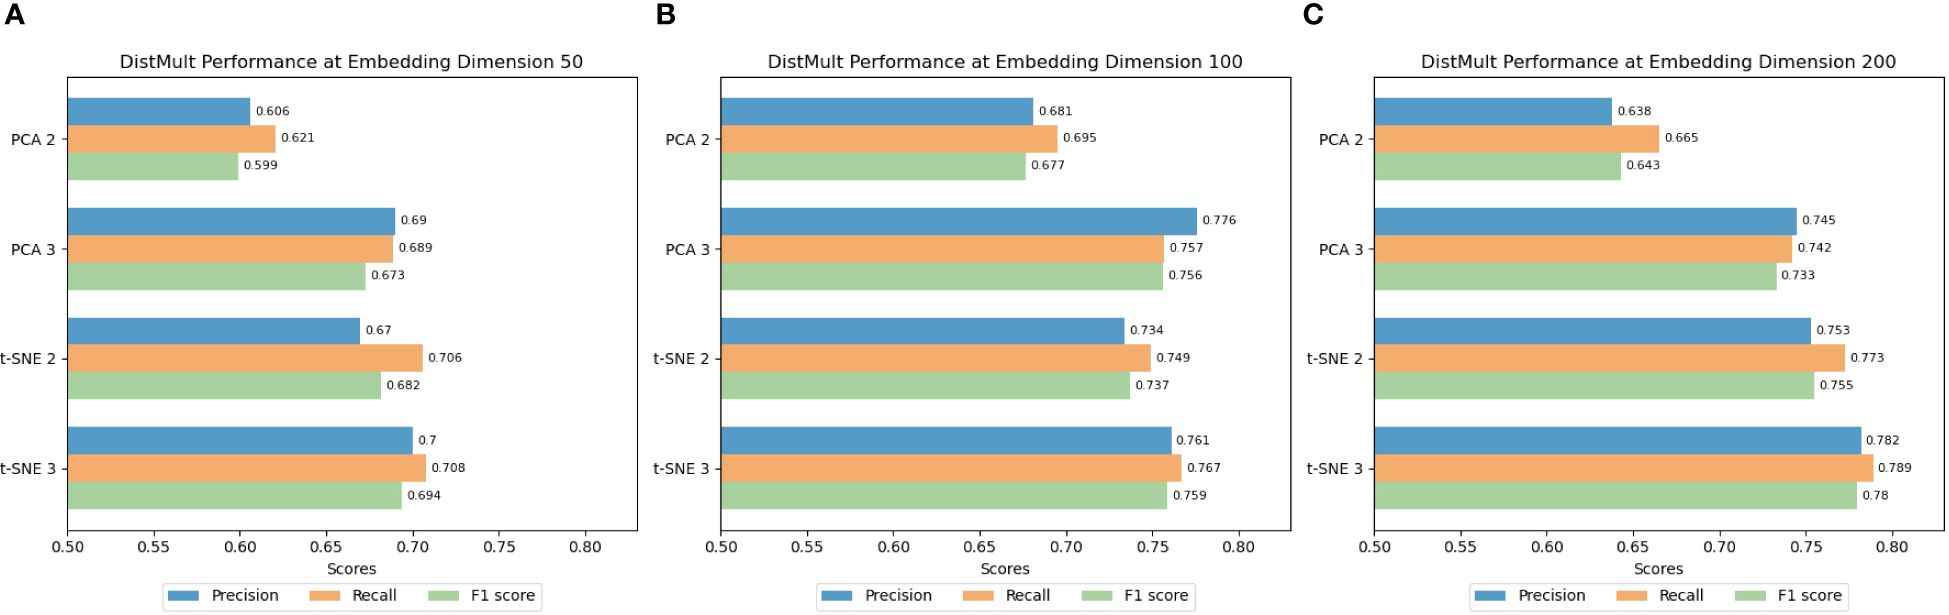
Figure 13 (A–C) Classification results of DistMult using different dimensionality reduction methods and dimensions.
Building upon the identified optimal combination of the embedding model and dimensionality reduction method—specifically, the TransR model at an embedding dimension of 50 with t-SNE—further investigations were conducted to explore the effects of different ML classification methods on ship classification results. Figures 14 and 15 visualize the classification results for each ship in the test set, employing the TransR model reduced to either two or three dimensions via t-SNE, across various classification methods. Figures 14A–E and 15A–E present the classification results when using KNN, decision tree, random forest, SVM, and Gaussian naive Bayes methods, respectively, with reductions to two and three dimensions.
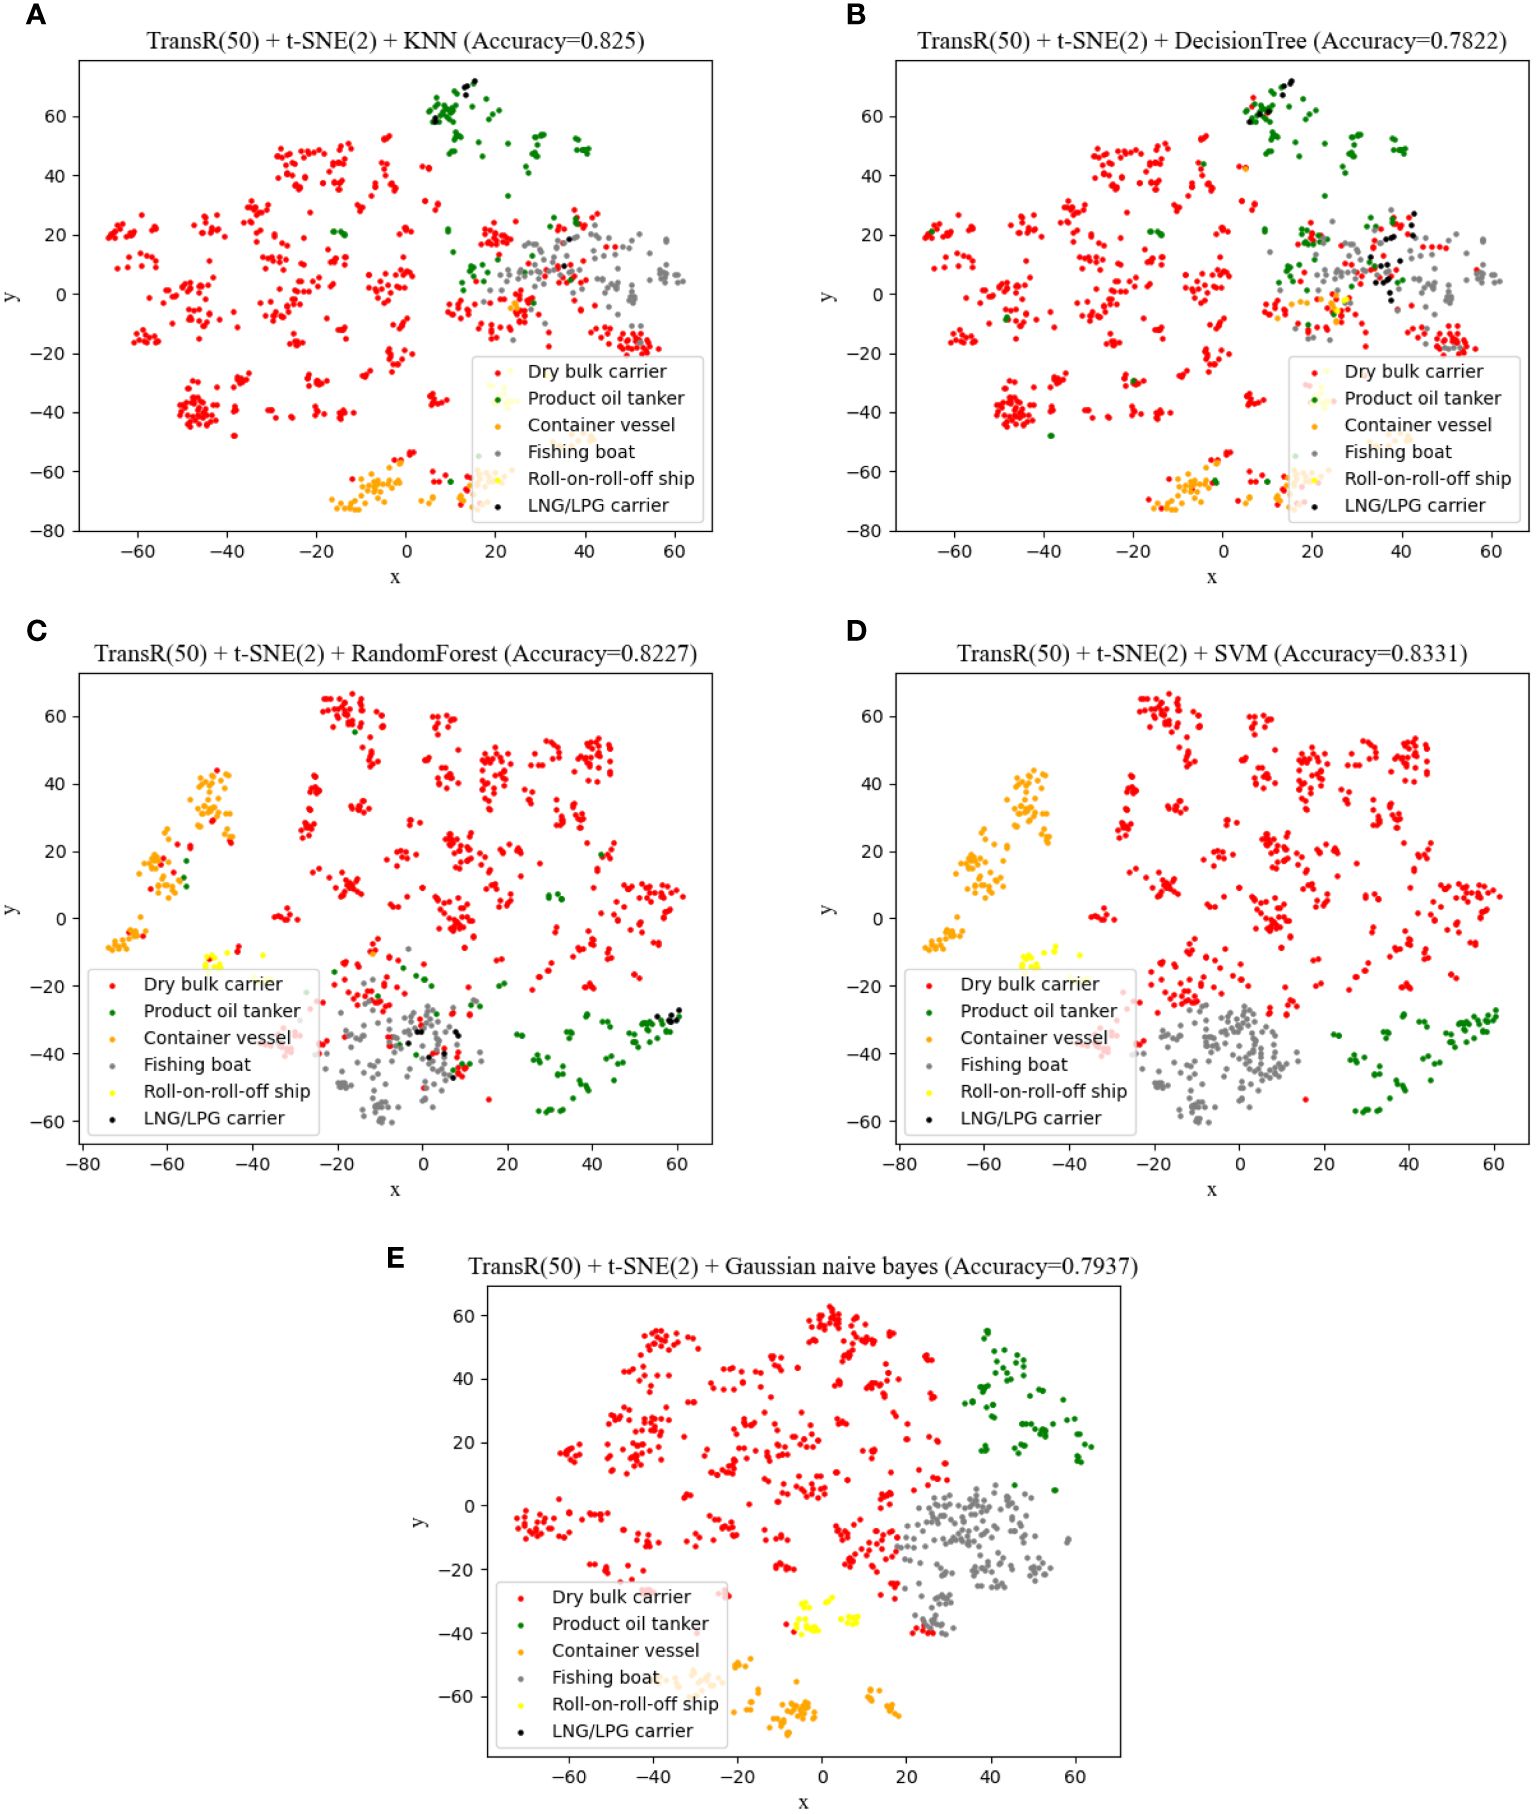
Figure 14 (A–E) Classification results using different methods with 50-dimensional TransR model embedded and t-SNE reduced to two dimensions.
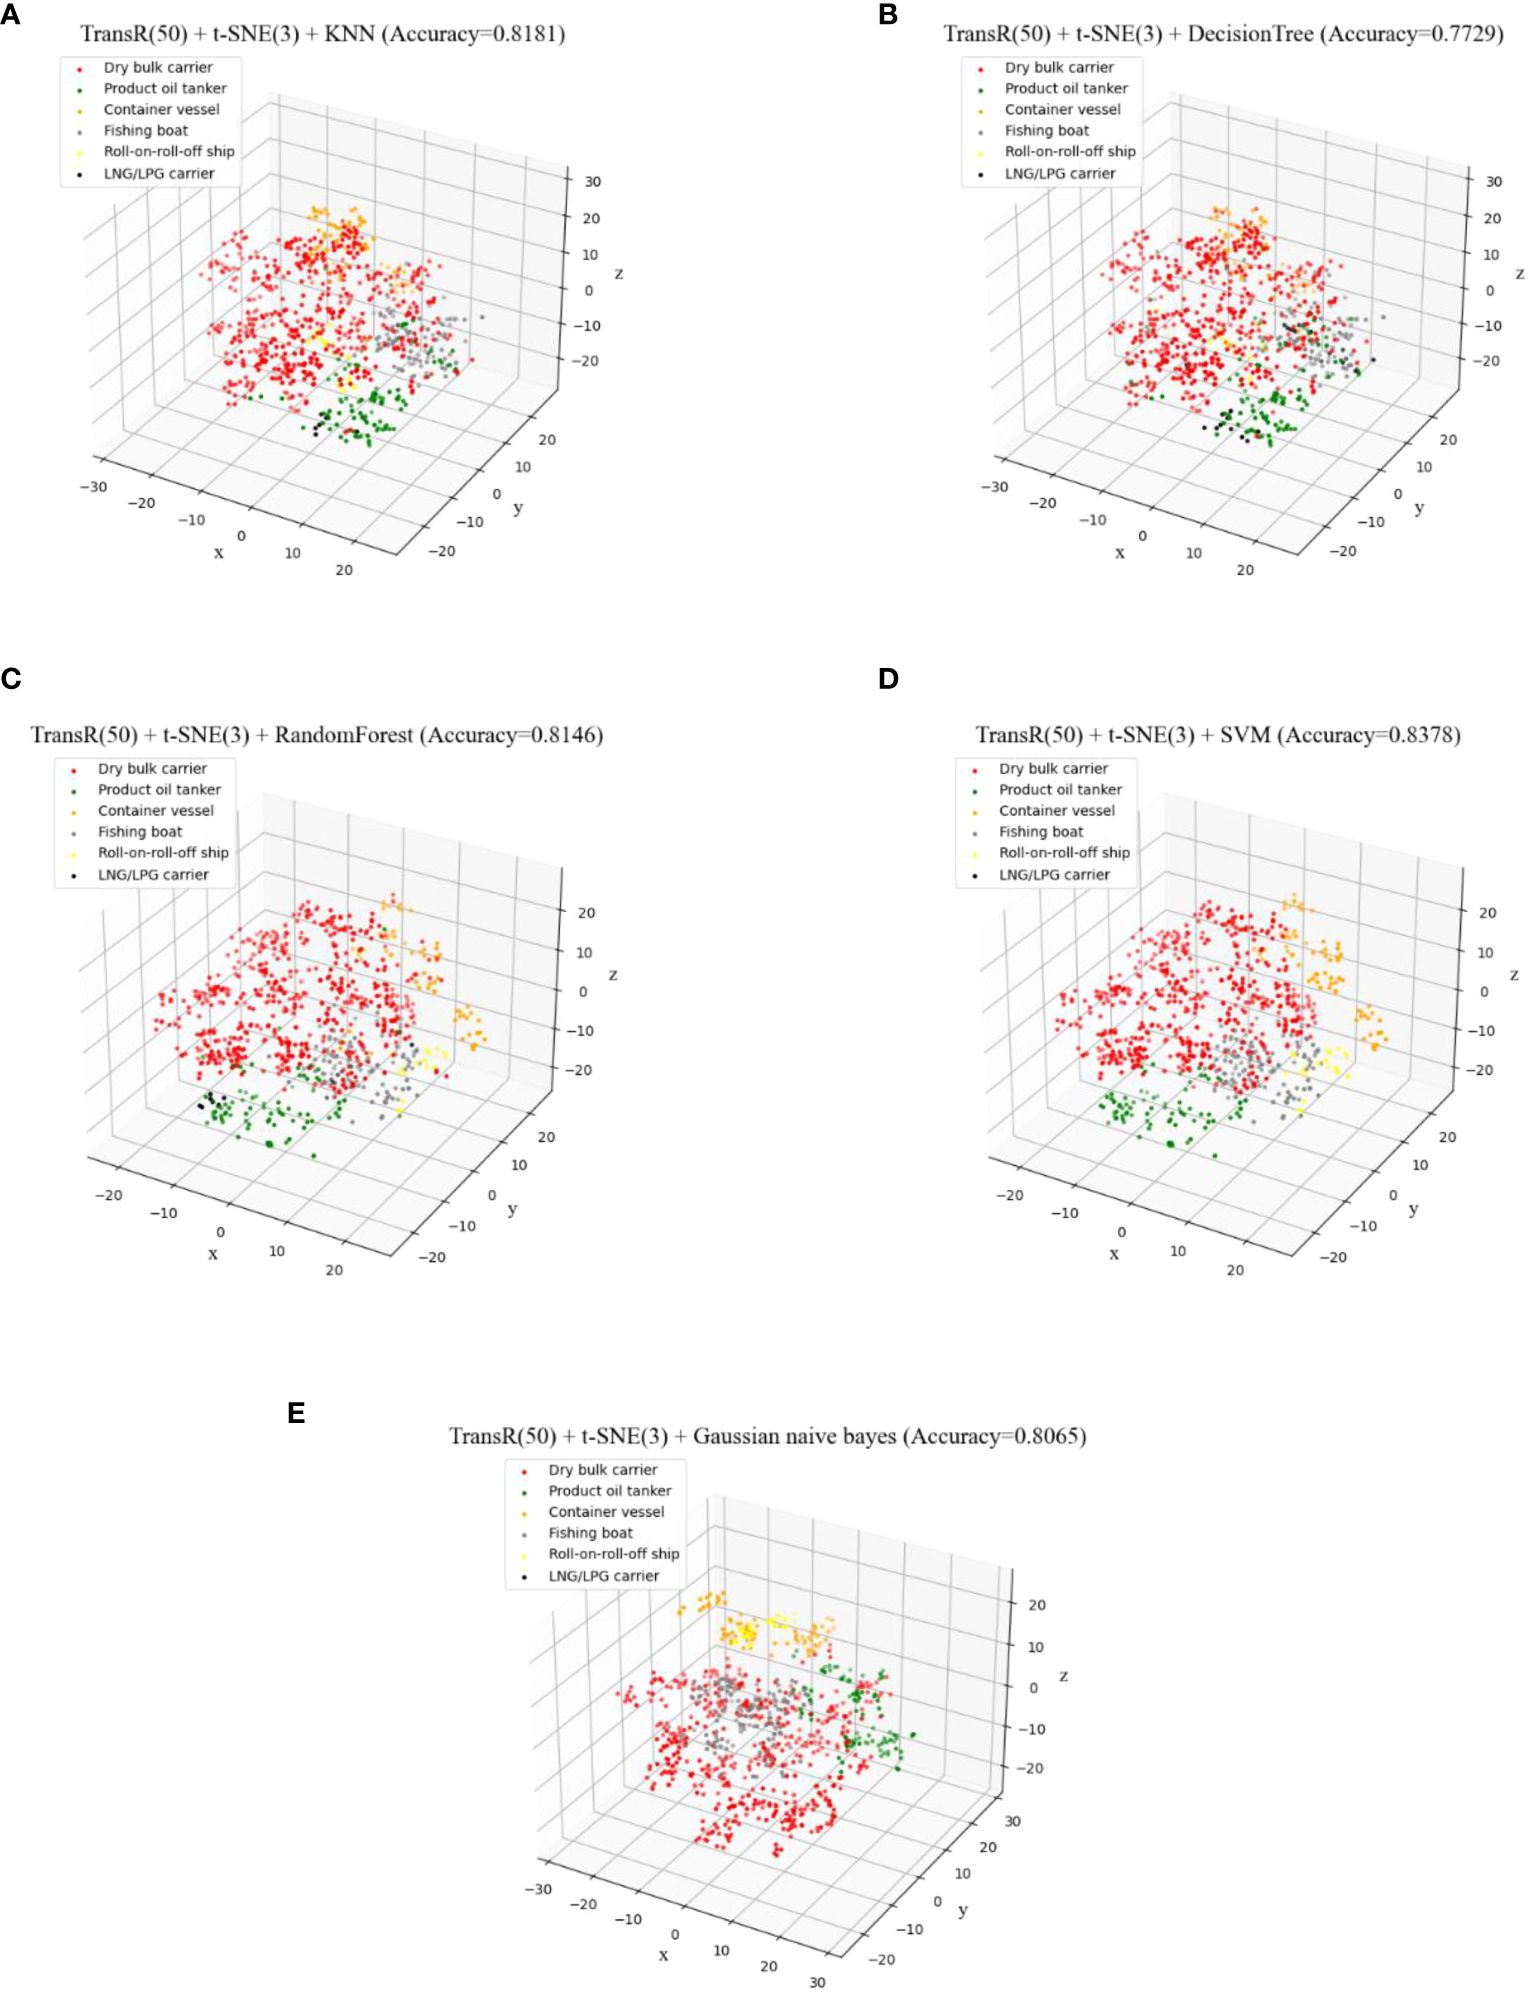
Figure 15 (A–E) Classification results using different methods with 50-dimensional TransR model embedded and t-SNE reduced to three dimensions.
The visualization results highlight that various classification models are effective at distinguishing different categories of ships when all ship vectors are projected onto the same coordinate system. Particularly in regions where features are prominent and distinguishable, most models excel in this differentiation. Notably, the TransR model, at an embedding dimension of 50 and using t-SNE for reducing dimensionality to 2D, demonstrated relatively optimal classification results when paired with classification methods such as KNN or Random Forest. These combinations achieved accuracies of 0.825 and 0.823, respectively, underscoring their effectiveness in accurately classifying ship types.
To enhance the accuracy of experimental results, the dataset was partitioned randomly into the same ratio five times, with each division undergoing t-SNE dimensionality reduction to 2D and 3D for classification experiments. Figures 16A–C illustrate the average Precision, Recall, and F1 Scores for various ship categories under 2D dimensionality reduction. Conversely, Figures 16D–F display these metrics under 3D dimensionality reduction. Figures 17A, B provide a comparison of Macro Average results for overall test data Precision, Recall, and F1 Scores across different levels of dimensionality reduction, while Figures 17C, D contrast the weighted average results for these metrics. The experimental findings reveal that classification outcomes with 2D dimensionality reduction generally surpass those with 3D reduction. Notably, bulk cargo ships exhibit the best classification results, achieving an accuracy of 0.890, a recall of 0.905, and an F1 score of 0.891. The substantial variation in classification results across different ship categories can primarily be attributed to the differing volumes of data in the dataset. The dataset contains the smallest amount of data for LNG/LPG ships, which significantly impacts the extraction of semantic information from their embedding vectors, leading to lower classification accuracy. In contrast, bulk cargo ships, which are represented with a larger volume of data, show higher classification accuracy.
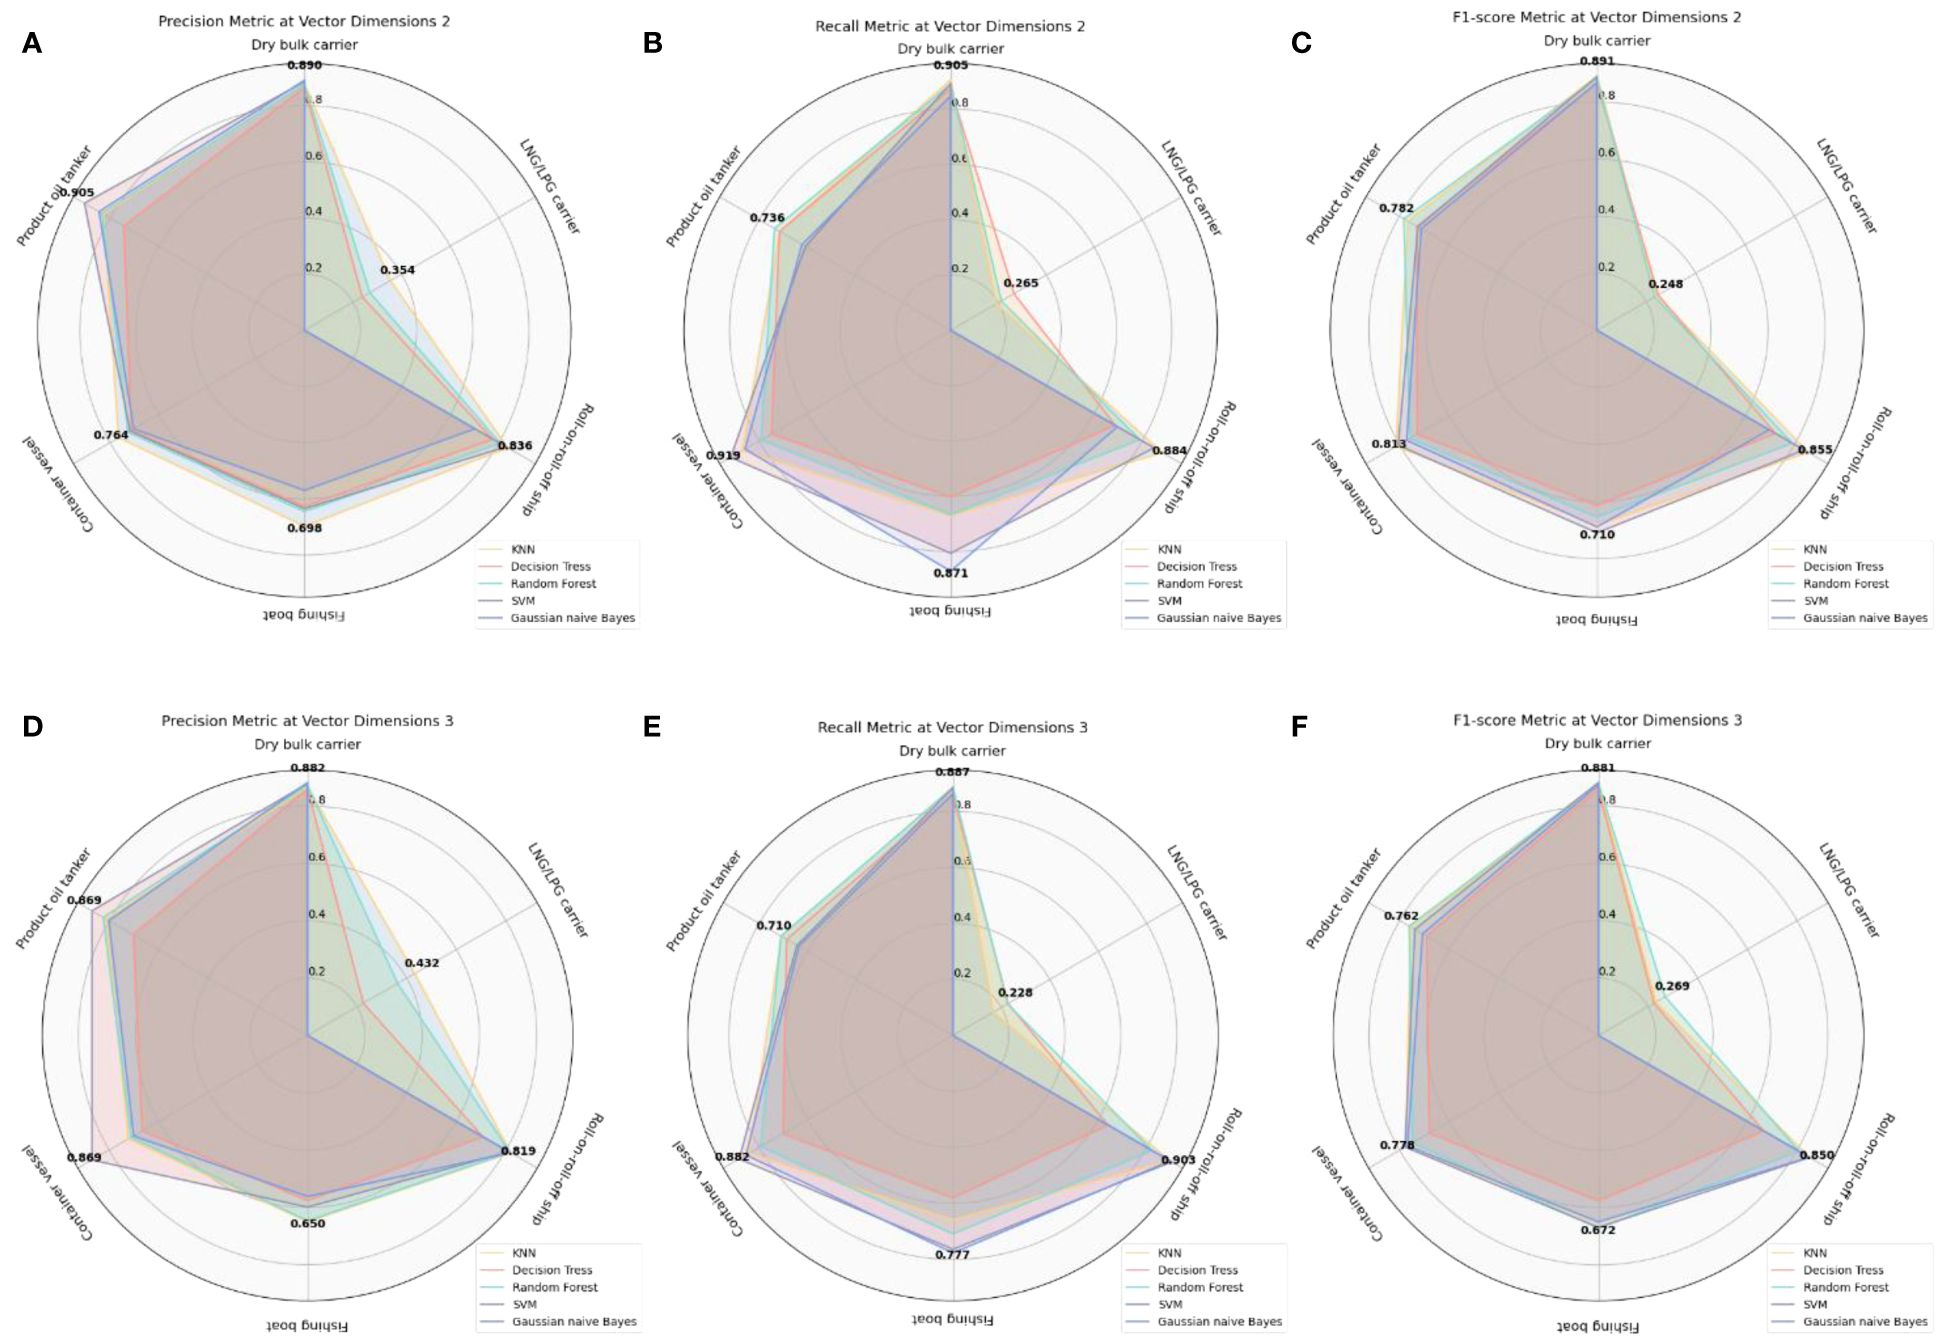
Figure 16 (A–F) Classification results for each ship category using different dimensionality reduction dimensions and classification methods with 50-dimensional TransR model combined with t-SNE reduction.
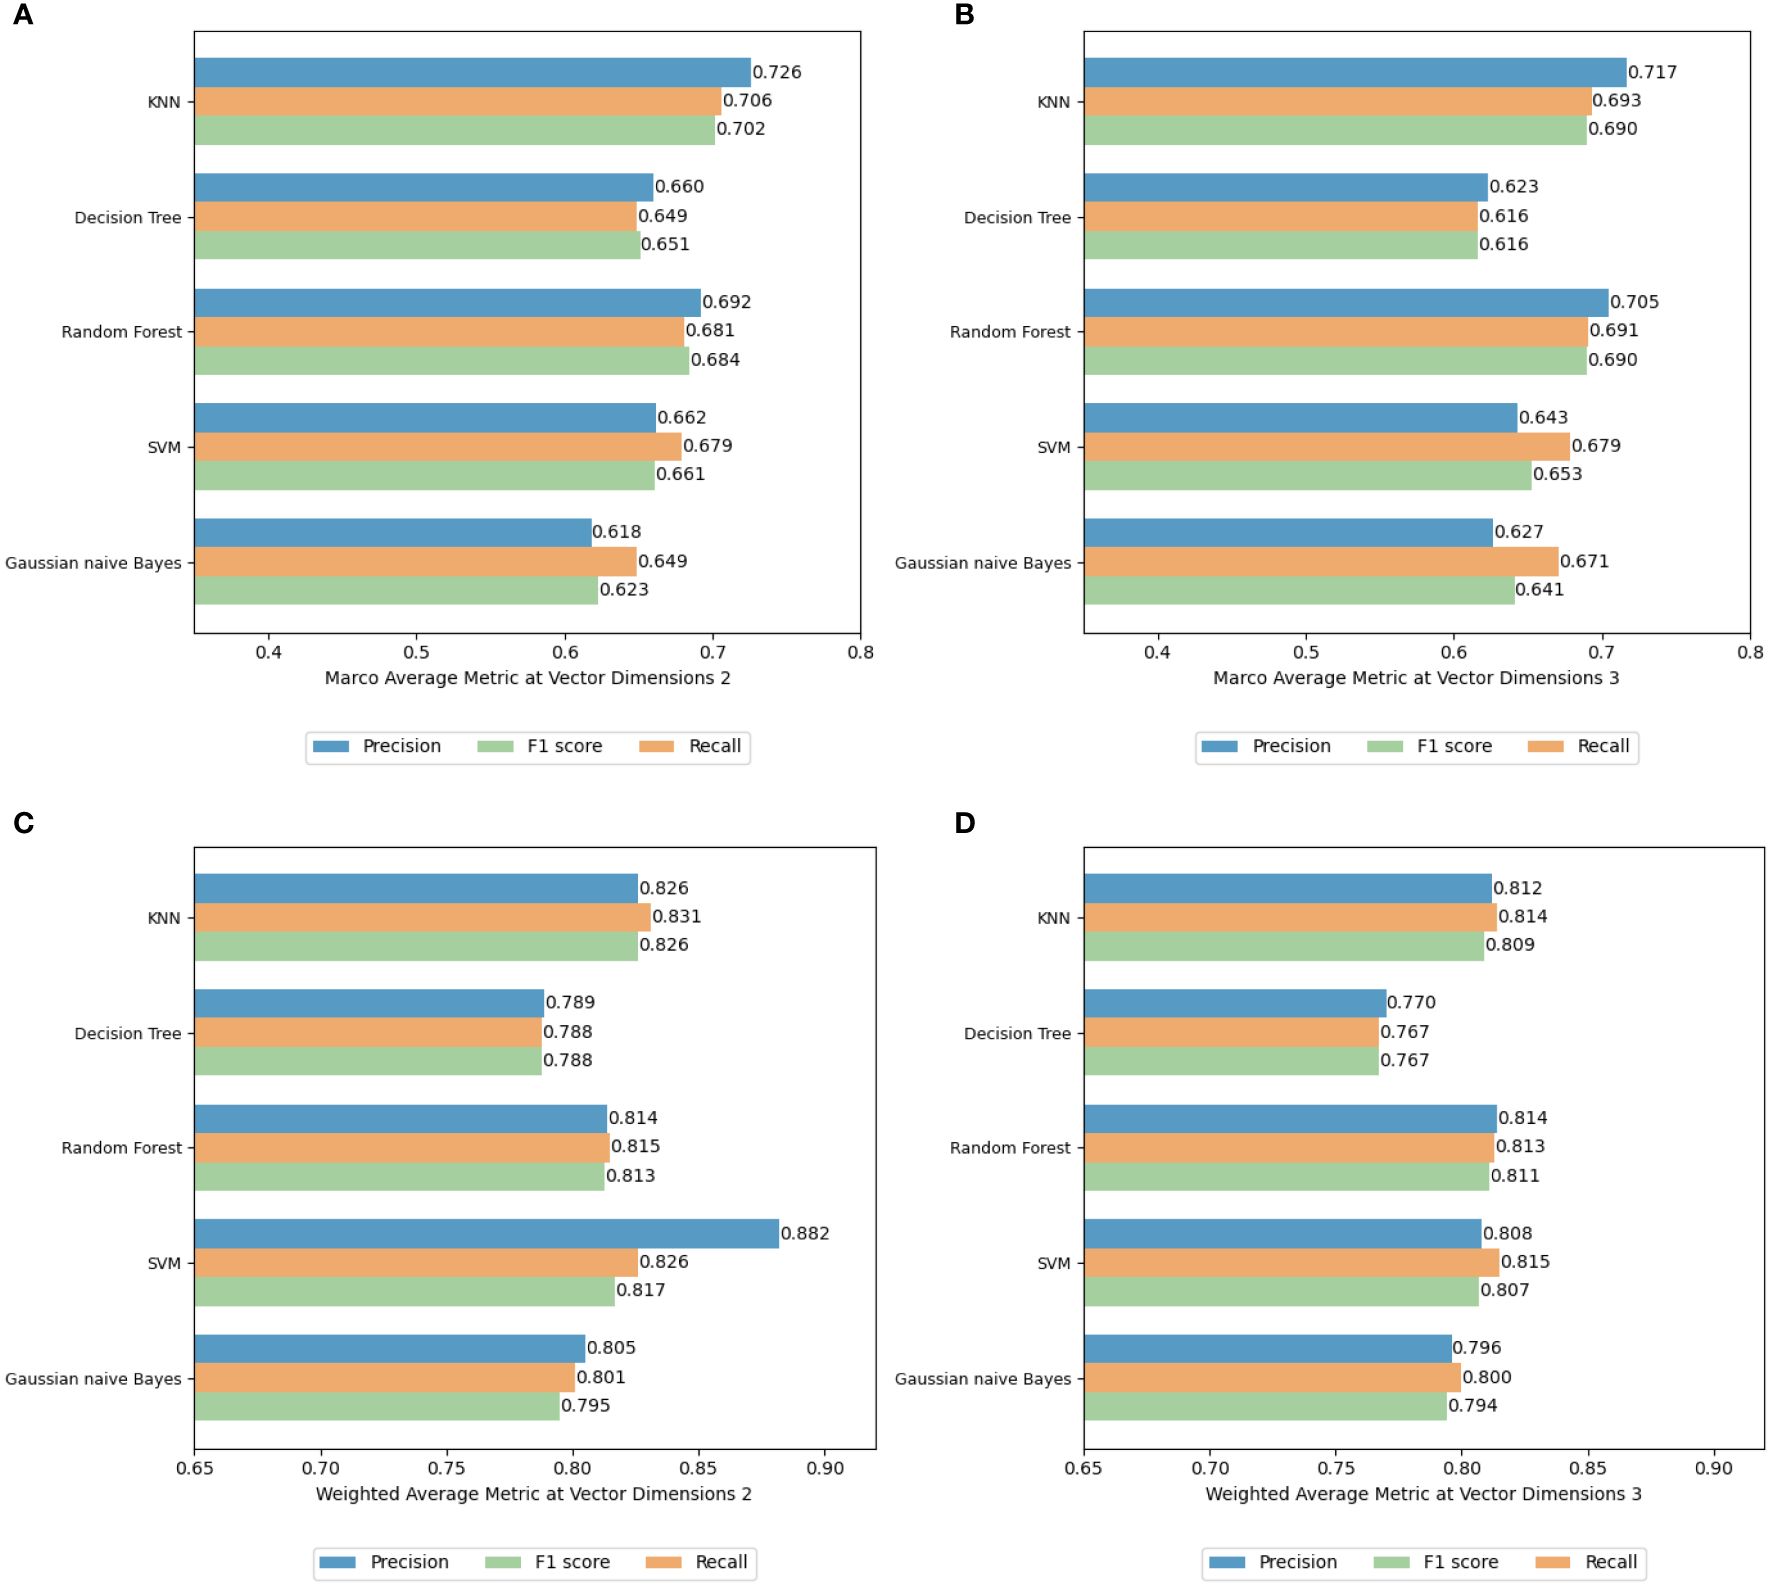
Figure 17 (A–D) Macro average and weighted average results using different dimensionality reduction dimensions and classification methods with 50-dimensional TransR model combined with t-SNE reduction.
Figure 18 examines classification accuracy across varying dimensionality reductions. The findings suggest that employing the TransR model with a 50-dimensional embedding and reducing it to 2D using t-SNE, in conjunction with the KNN model, yields a more accurate classification performance for most ship categories in the task of ship classification on a port-related dataset. The superior performance of this experimental combination could be attributed to the dataset’s particular compatibility with the TransR model’s ability to capture relationships and hierarchies, where the 50-dimensional embeddings retain adequate semantic information without leading to overfitting. The integration of 2D t-SNE reduction with the KNN classification model capitalizes on t-SNE’s strength in preserving local data features, with the 2D space enhancing KNN’s effectiveness in applying its distance-based classification principle.
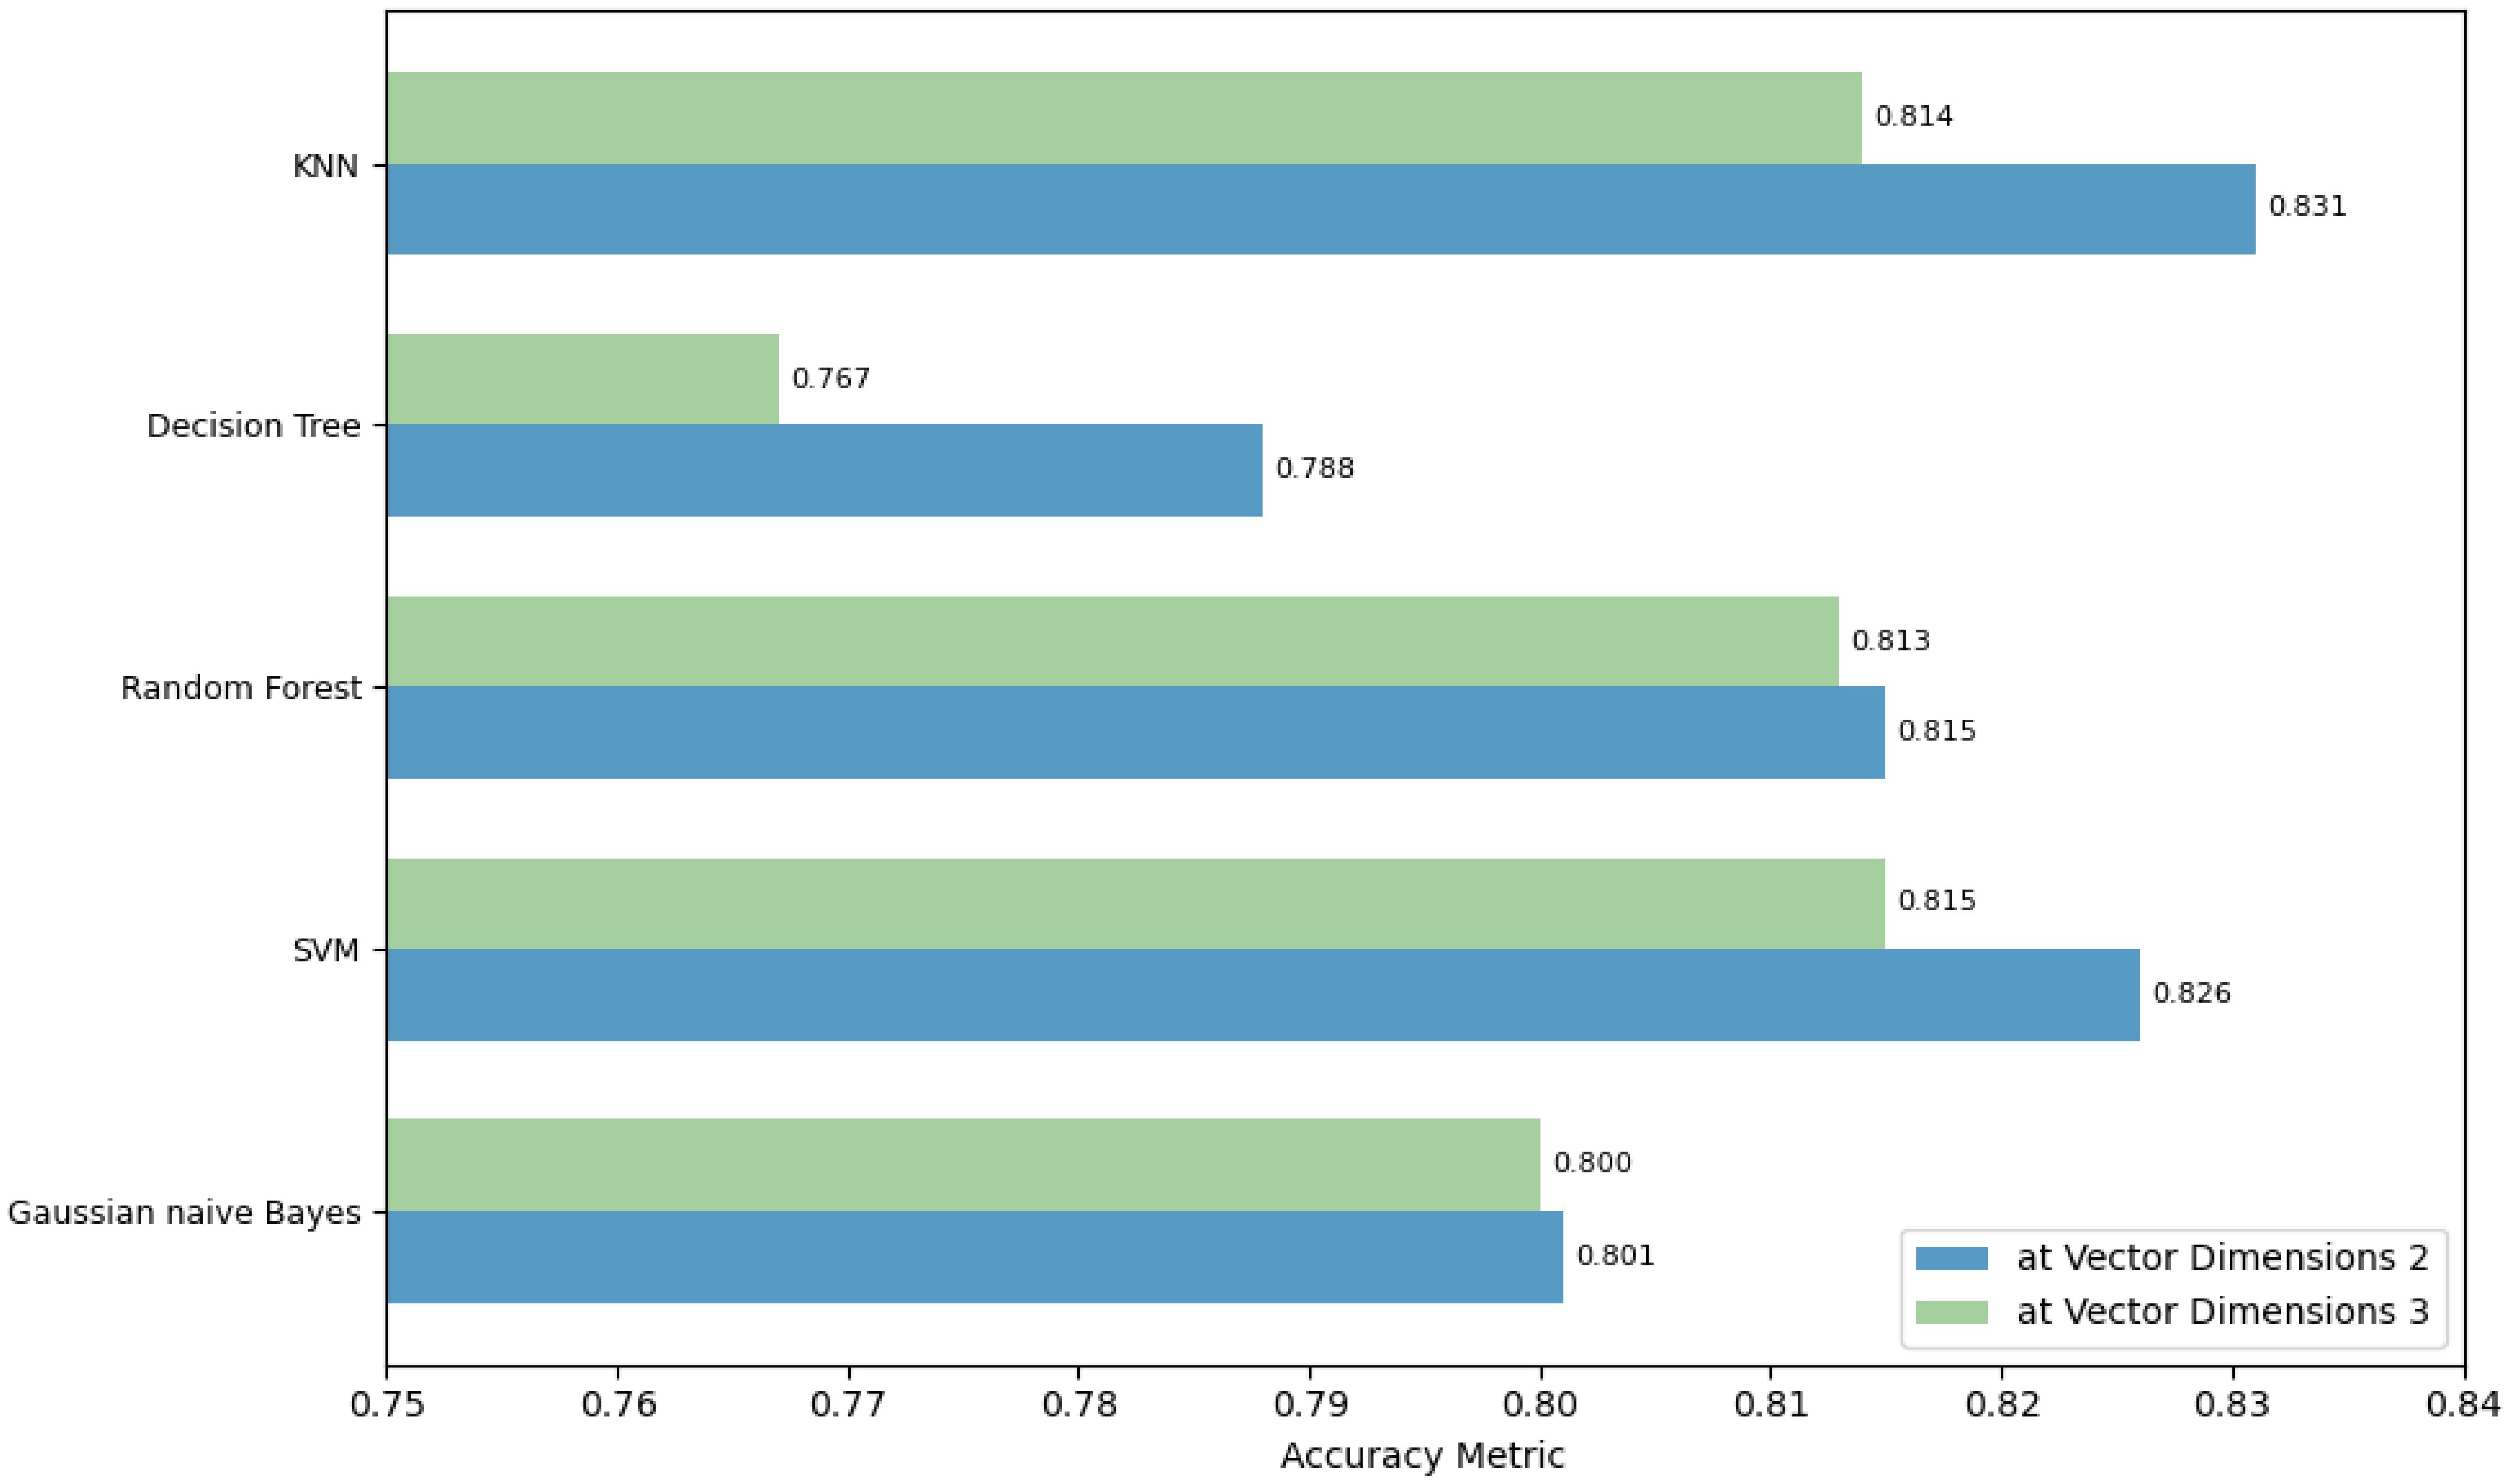
Figure 18 Accuracy using different dimensionality reduction dimensions and classification methods with 50-dimensional TransR model combined with t-SNE reduction.
4.1.4 Ablation study
An ablation study was conducted to discern the impact of each component within our framework on the classification task, specifically examining the effect of omitting the dimensionality reduction module (DRM). Model variants tested included configurations with and without DRM, focusing on the classification of ships using 50-dimensional embeddings from the TransR model paired with the KNN method.
Figures 19A–C present the Precision, Recall, and F1 Scores for ship classification within the port-related dataset, comparing performances with and without t-SNE reduction to 2D. Compared to the classification results prior to dimensionality reduction, the performance in categories with a larger sample size improved following the application of t-SNE reduction. The Precision, Recall, and F1 Scores across the board also enhanced post t-SNE reduction, underscoring the effectiveness of the dimensionality reduction module in ship classification endeavors. For instance, the classification accuracy for bulk carriers improved from 0.856 to 0.877. The application of dimensionality reduction techniques plays a crucial role in eliminating noise and primarily preserving key semantic features, which aids the classification model in focusing on distinctive attributes, thus enhancing classification accuracy. Additionally, dimensionality reduction often results in a more uniform distribution of vectors in the space, with similar vectors becoming more clustered. This clustering is advantageous for distance-based classifiers such as KNN, as it supports more precise classification results.
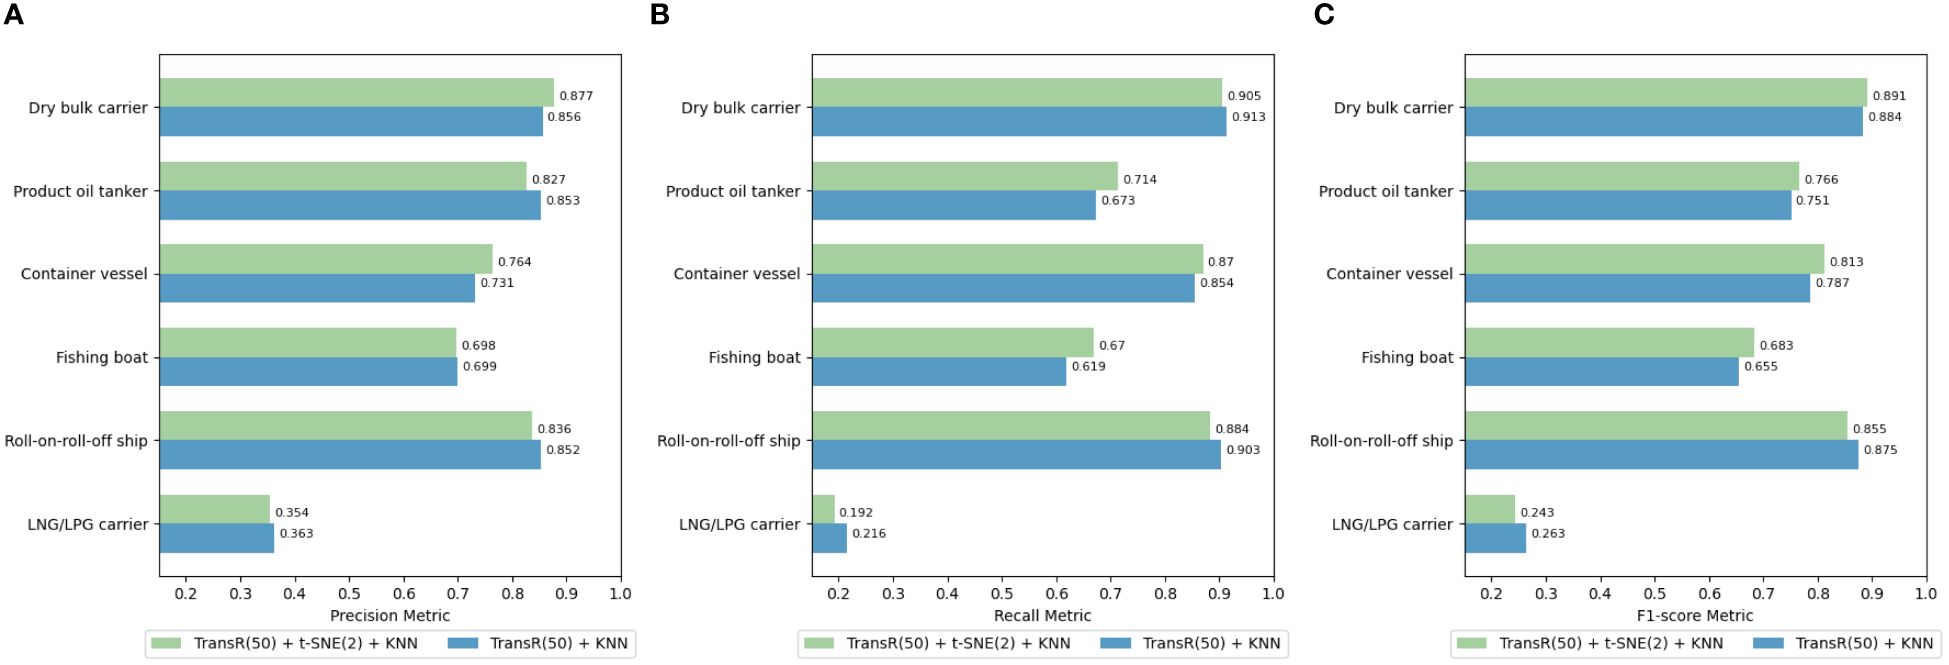
Figure 19 (A–C) Classification results before and after using t-SNE reduction with 50-dimensional TransR model combined with KNN classification method.
4.2 Similar berth recommendation
4.2.1 Evaluation metrics
For the development of a similar berth recommendation system, six key dimensions were identified for analysis: affiliated port, belonging harbor district, affiliated berth office, berth usage, type of ships berthed at the berth, and tonnage of ships berthed at the berth. These dimensions serve as the basis for evaluating and determining the similarity between two berths. The evaluation accuracy pa for a given berth a within this system can be mathematically defined as Equation (2):
where t denotes the total number of similar berths identified for a given berth under comparison, ra represents the count of identical relationships between each suggested similar berth and the berth being compared a. When extending this calculation across the entire dataset, the model’s overall evaluation accuracy, or the total count of identical relationships PFull, can be expressed as Equation (3):
where n is the total number of berths within the dataset. The model’s performance is better indicated by the higher number of identical relationships found between similar berths across the entire dataset and the corresponding berths they are compared with.
Moreover, to further assess the model’s recommendation capabilities, we introduced two additional metrics: the average count of identical relationships for top t recommended berths PTopt and the average count of identical relationships per recommended berth Psingle. The calculation methods are shown in Equation (5) and Equation (6) respectively. These metrics aim to capture the model’s general recommendation effectiveness for a single compared berth and the precision of the model’s recommendations for each similar berth, respectively:
4.2.2 Experimental setup
This experiment employed the port-related dataset, where relational triplets were pre-constructed for each berth comparison. The top 20 berths with the highest similarity were recommended for analysis. Utilizing the PyTorch framework, graph embedding and berth similarity analysis models were implemented, with embedding vector dimensions set at 50, 100, and 200.
4.2.3 Experimental results
The proposed framework’s efficacy was evaluated on the port-related dataset, particularly examining the influence of dimensionality reduction on similar berth recommendations. Figures 20A–C display the total count of identical relationships, the average count of identical relationships for the top 20 recommended berths, and the average count of identical relationships per recommended berth using different dimensions of the TransE model after various dimensionality reduction methods. The findings suggest that omitting dimensionality reduction results in the most accurate berth recommendations. The average count of identical relationships per recommended berth for embedding vectors with dimensions of 50, 100, and 200 reached 2.420, 3.157, and 3.324, respectively, all surpassing performances in scenarios where dimensionality reduction was applied. This indicates that the complex relationship dimensions within the similar berth knowledge graph, which are more numerous than those in ship classification, contribute to a richer set of embedding vector features. Reducing these dimensions could potentially remove critical features, thereby decreasing the accuracy of the recommendations.
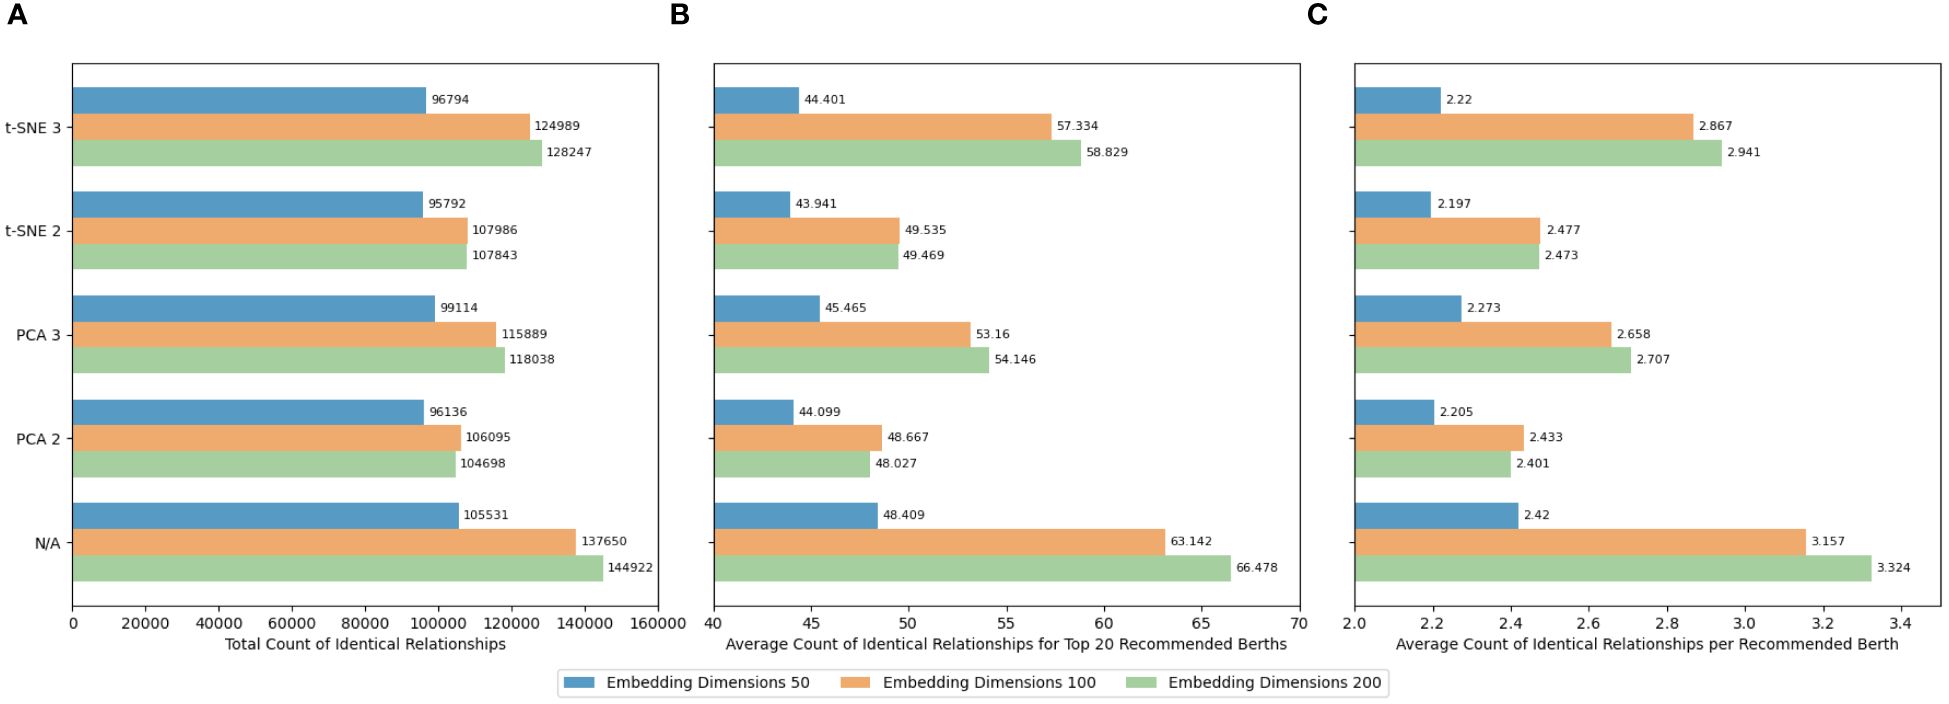
Figure 20 (A–C) Recommendation accuracy of different dimensionality reduction methods in the port-related dataset.
Figures 21A–C present the total count of identical relationships, the average count of identical relationships for the top 20 recommended berths, and the average count of identical relationships per recommended berth, respectively, for tasks involving similar berth recommendations within the port-related dataset, utilizing various embedding techniques in our framework. The findings indicate that the Analogy method outperforms others in terms of recommendation precision with an embedding dimension of 50. Given that the port-related dataset encompasses six types of triplets, this result implies that the berth knowledge graph encompasses a wide array of relationship types. The Analogy method’s superior performance, particularly at lower dimensions, suggests its proficiency in capturing this diversity and effectively representing these relationships without leading to overfitting. The Analogy model’s distinct advantage lies in its ability to handle analogical relationships, which, within the context of the port-related dataset, could be interpreted as the resemblance in characteristics or functions among different berths.
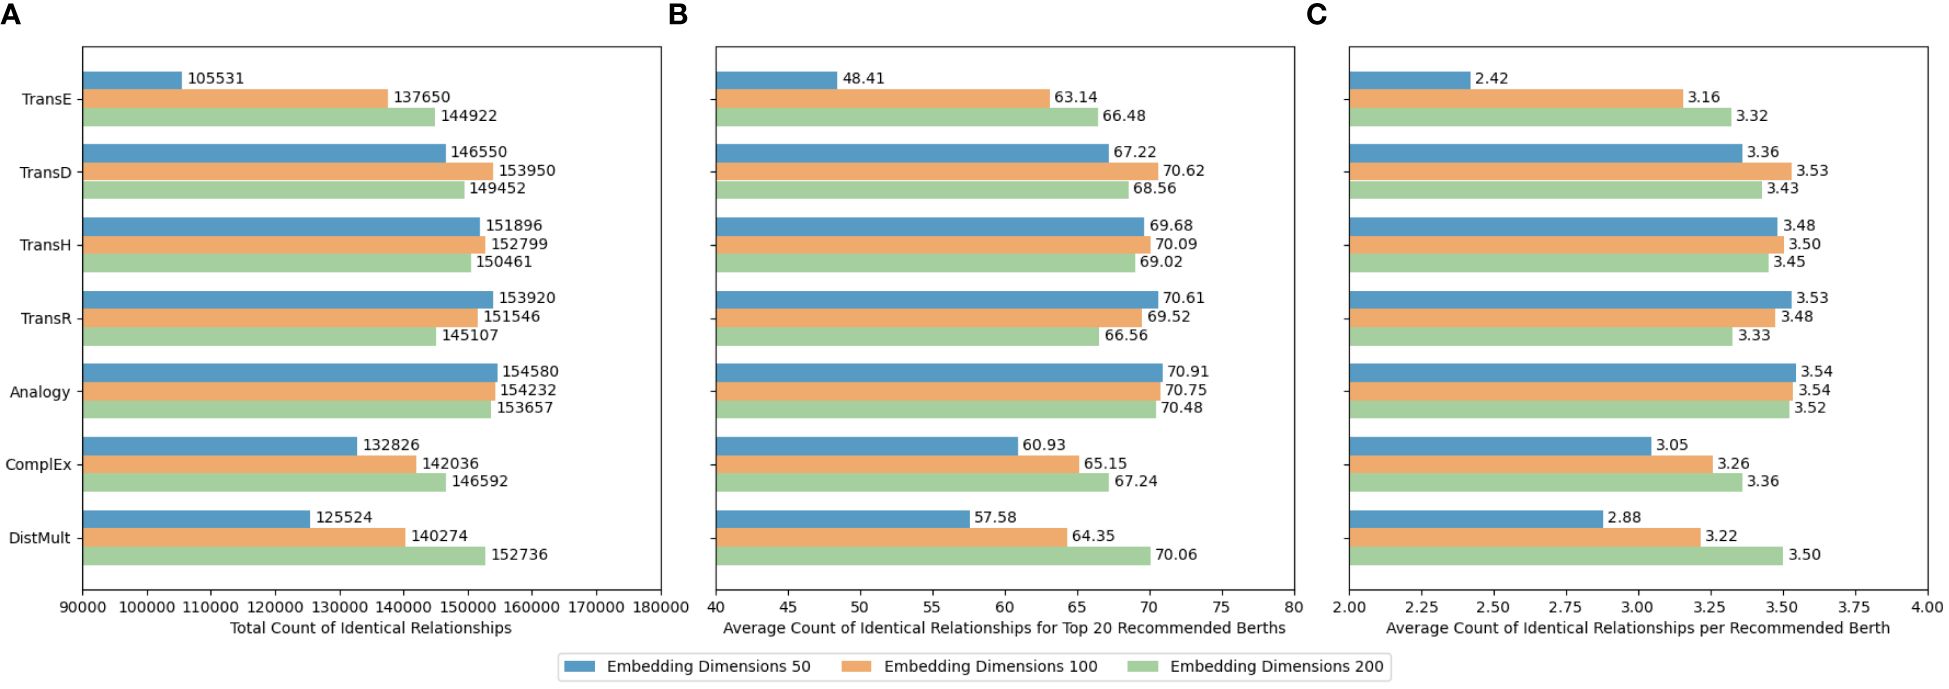
Figure 21 (A–C) Recommendation accuracy of different embedding models in the port-related dataset.
Based on the foundation of single base embedding models, this study further explored a combined model strategy for enhancing the accuracy of similar berth recommendations. Figures 22A–C present the comparative results of the total count of identical relationships, the average count of identical relationships for the top 20 recommended berths, and the average count of identical relationships per recommended berth in the port-related dataset for the task of recommending similar berths when the similarity score weights of the two sub-models in the combined model are set at a 1:1 ratio. Based on the integrated model approach, the combination of any two models exhibits superior recommendation accuracy compared to the performance of either model independently. This indicates that the combined model possesses enhanced adaptability and efficacy in the task of recommending similar berths.
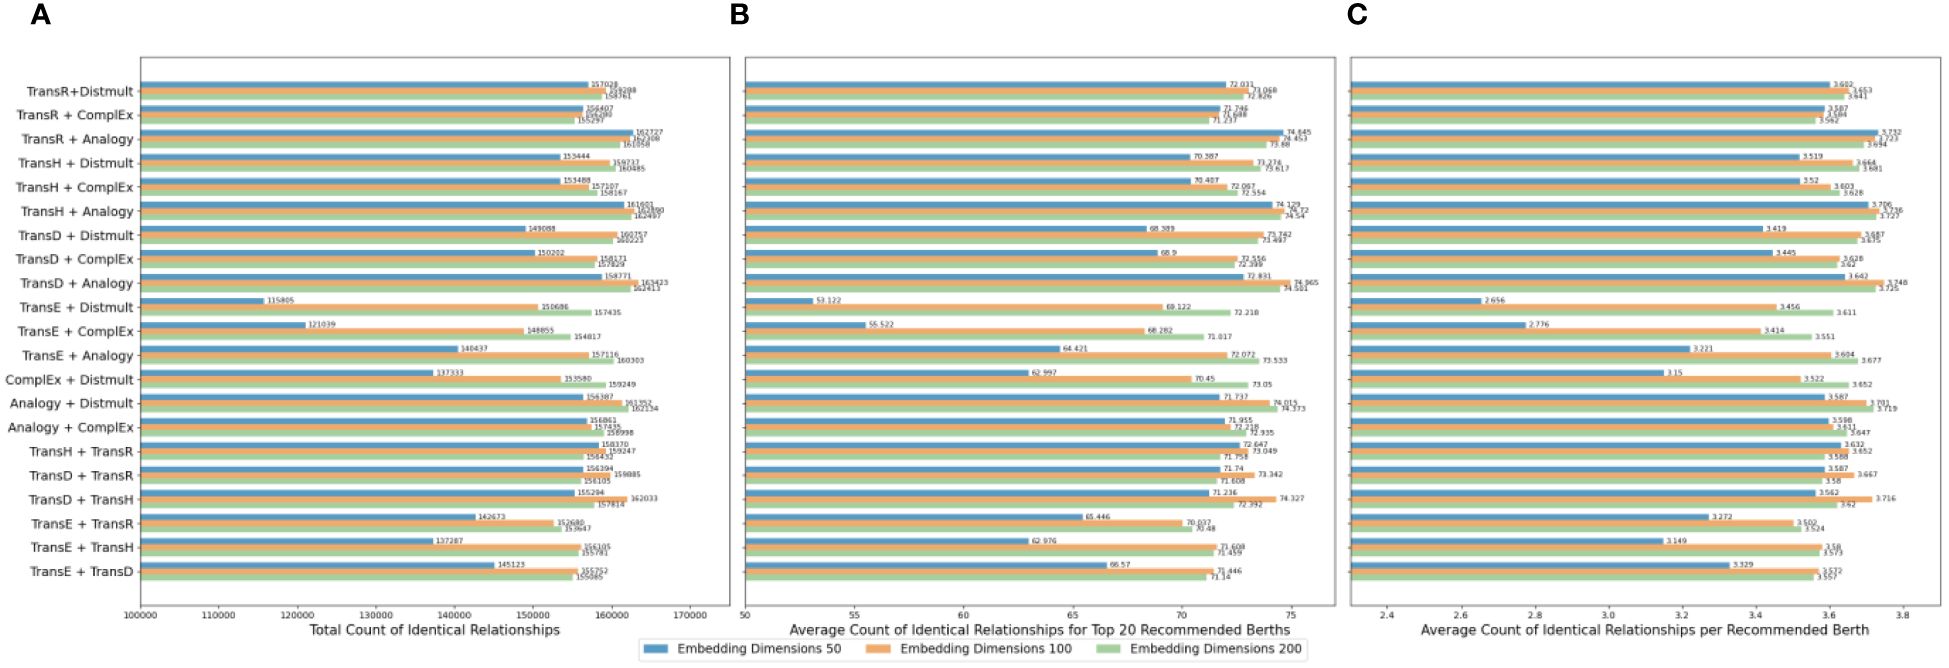
Figure 22 (A–C) Recommendation accuracy of various combined models in the port-related dataset.
Particularly, the synergistic combination of TransD, Analogy, and DistMult models outperforms other model pairings in the task of similar berth recommendation. The TransD and Analogy models, when combined at an embedding dimension of 100, showcase the highest efficacy, achieving an average count of identical relationships per recommended berth of 3.748. This enhancement can be attributed to TransD’s capability to encapsulate complex semantic relationship features through distinct mapping matrices for each entity-relation, coupled with the Analogy model’s proficiency in handling symmetry and anti-symmetry in entity relationships. When TransD, known for its dynamic mapping capabilities, is integrated with Analogy, which excels in capturing symmetry, the combined model potentially enhances its ability to understand and represent berth similarities more comprehensively. The synergy between TransD’s flexibility in handling complex relationships and Analogy’s efficiency in recognizing symmetric patterns could offer a more nuanced representation of berth similarities.
To delve deeper into how weight distribution affects the similarity results, this study introduces a weight parameter n to the combined model consisting of TransD, Analogy, and DistMult. This exploration aims to discern the relative influence of each model within the trio on the combined model’s results. The Equation (6) to assess the impact of merging models A and B with a specific weight value n is conceptualized to quantify their combined effect on similarity assessments:
Merging the similarity calculation values from two models allows the combined model to adopt the recommendation tendencies and strengths of both constituent models. Figures 23–25 illustrate the variations in the average count of identical relationships per recommended berth for the TransD, Analogy, and DistMult models across different embedding dimensions, utilizing the port-related dataset for the recommendation of similar berths. Specifically, Figures 23A–C detail the trends for the TransD model at embedding dimensions of 50, 100, and 200, respectively. Figures 24A–C present the trends for the Analogy model at these same dimensions, while Figures 25A–C depict the trends for the DistMult model.
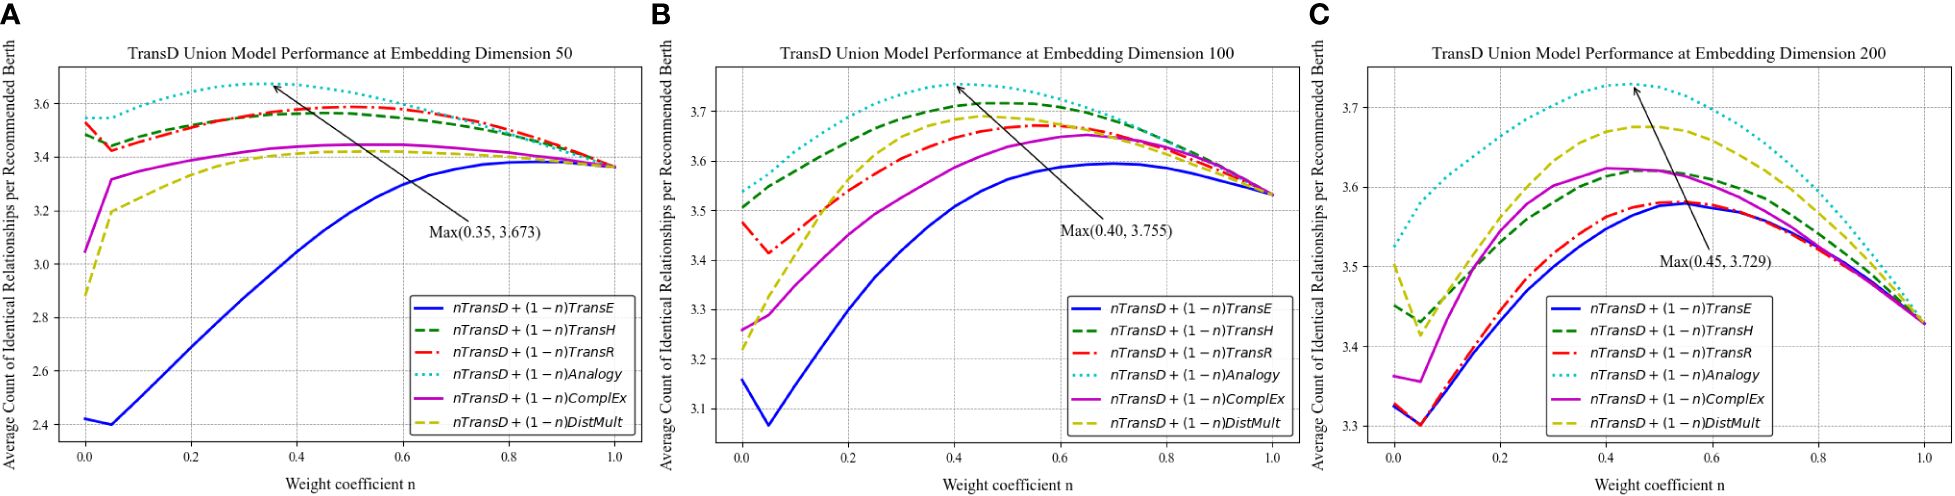
Figure 23 (A–C) Trend of similar berth recommendation results by the TransD model at different dimensions with changes in weight value n.
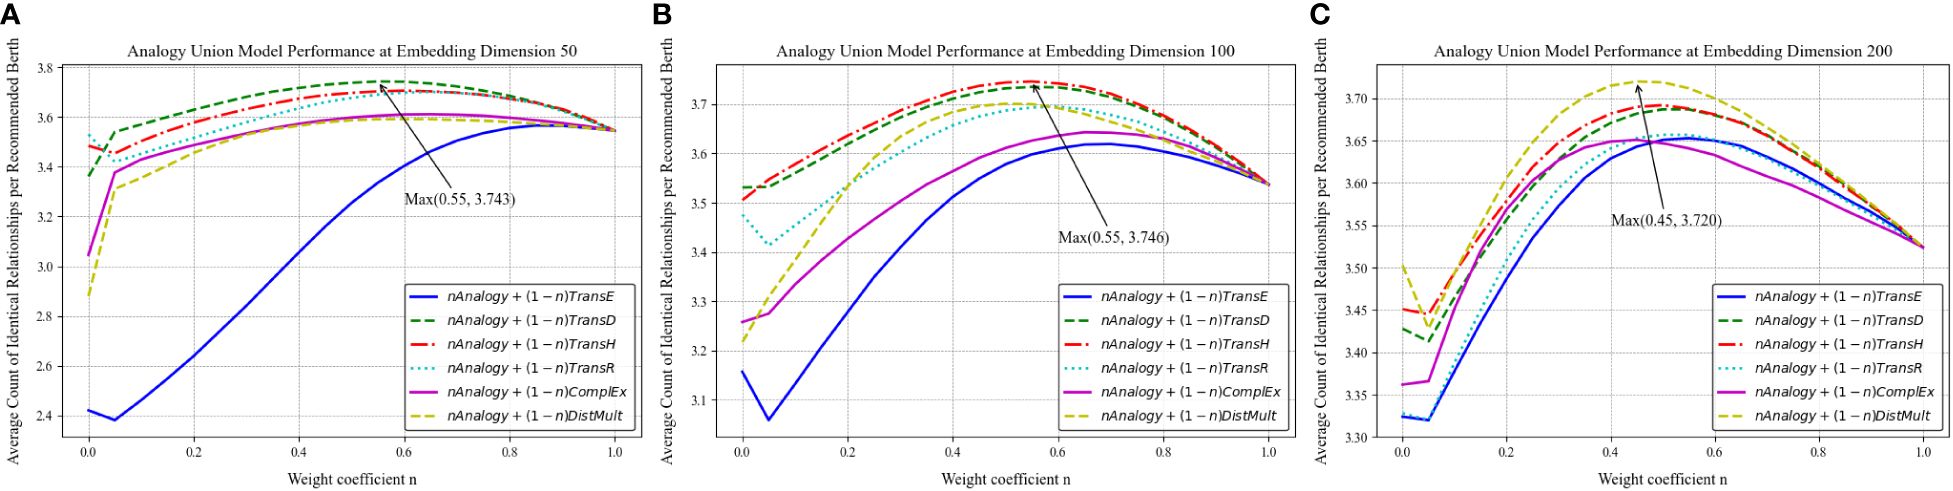
Figure 24 (A–C) Trend of similar berth recommendation results by the Analogy model at different dimensions with changes in weight value n.
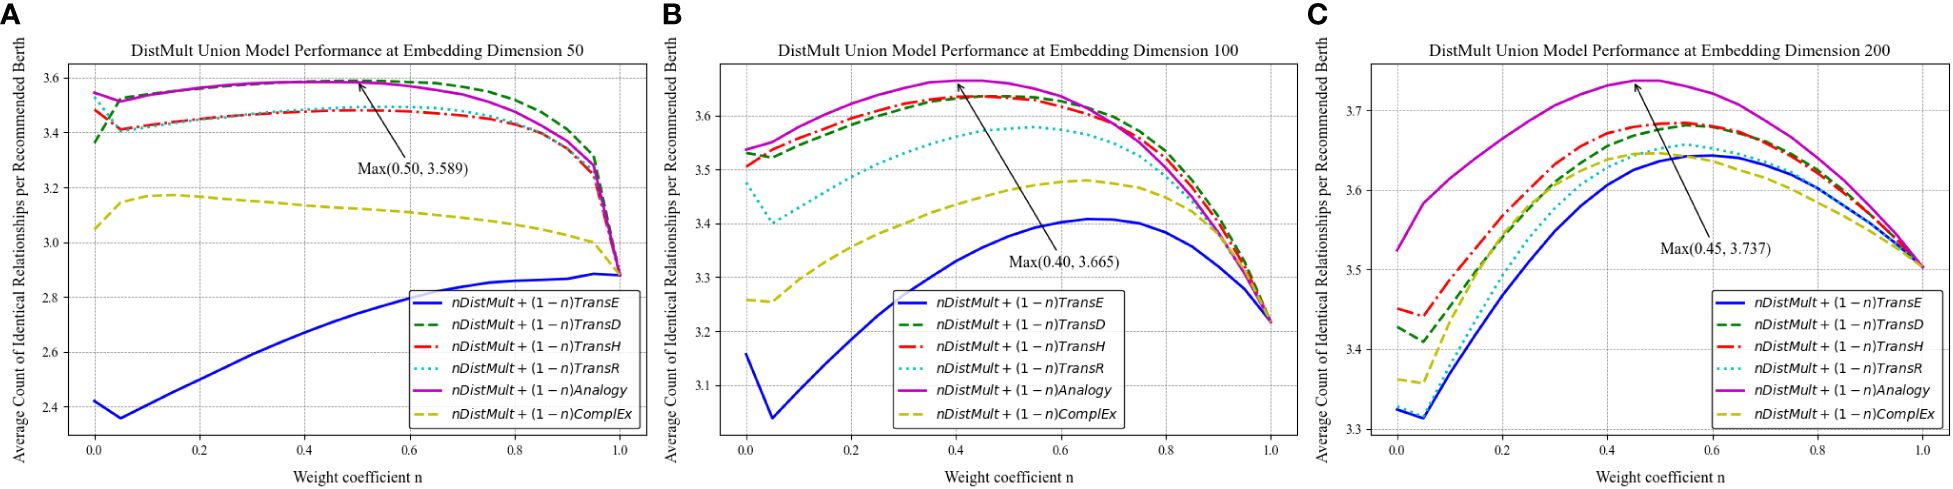
Figure 25 (A–C) Trend of similar berth recommendation results by the DistMult model at different dimensions with changes in weight value n.
The data reveal that the introduction of the combined model markedly improves the performance in recommending similar berths, with the optimal effects varying at different dimensions according to the weight value n. The synergy between the TransD and Analogy models is most effective at n = 0.4, where it achieves an average count of identical relationships per recommended berth of 3.755. The Analogy model exhibits a high level of proficiency in identifying similarities between berths for the recommendation task within the dataset used in this study. Although the weight assigned to TransD is marginally lower, its contribution to the overall similarity calculation remains substantial. The structured relationship recognition facilitated by TransD’s dynamic mapping mechanism may complement the Analogy model’s capabilities, addressing aspects of similarity that the Analogy model alone might overlook.
Using the optimal combination obtained from this experiment, the actual effect of recommending similar berths was tested, taking three berths in the Yangshan Port area of Shanghai Port as an example. The selected comparable berths and the recommended berths with high similarity are shown in Figure 26, where the red indicates the selected comparable berths, and the blue indicates the recommended candidate berths with high similarity.
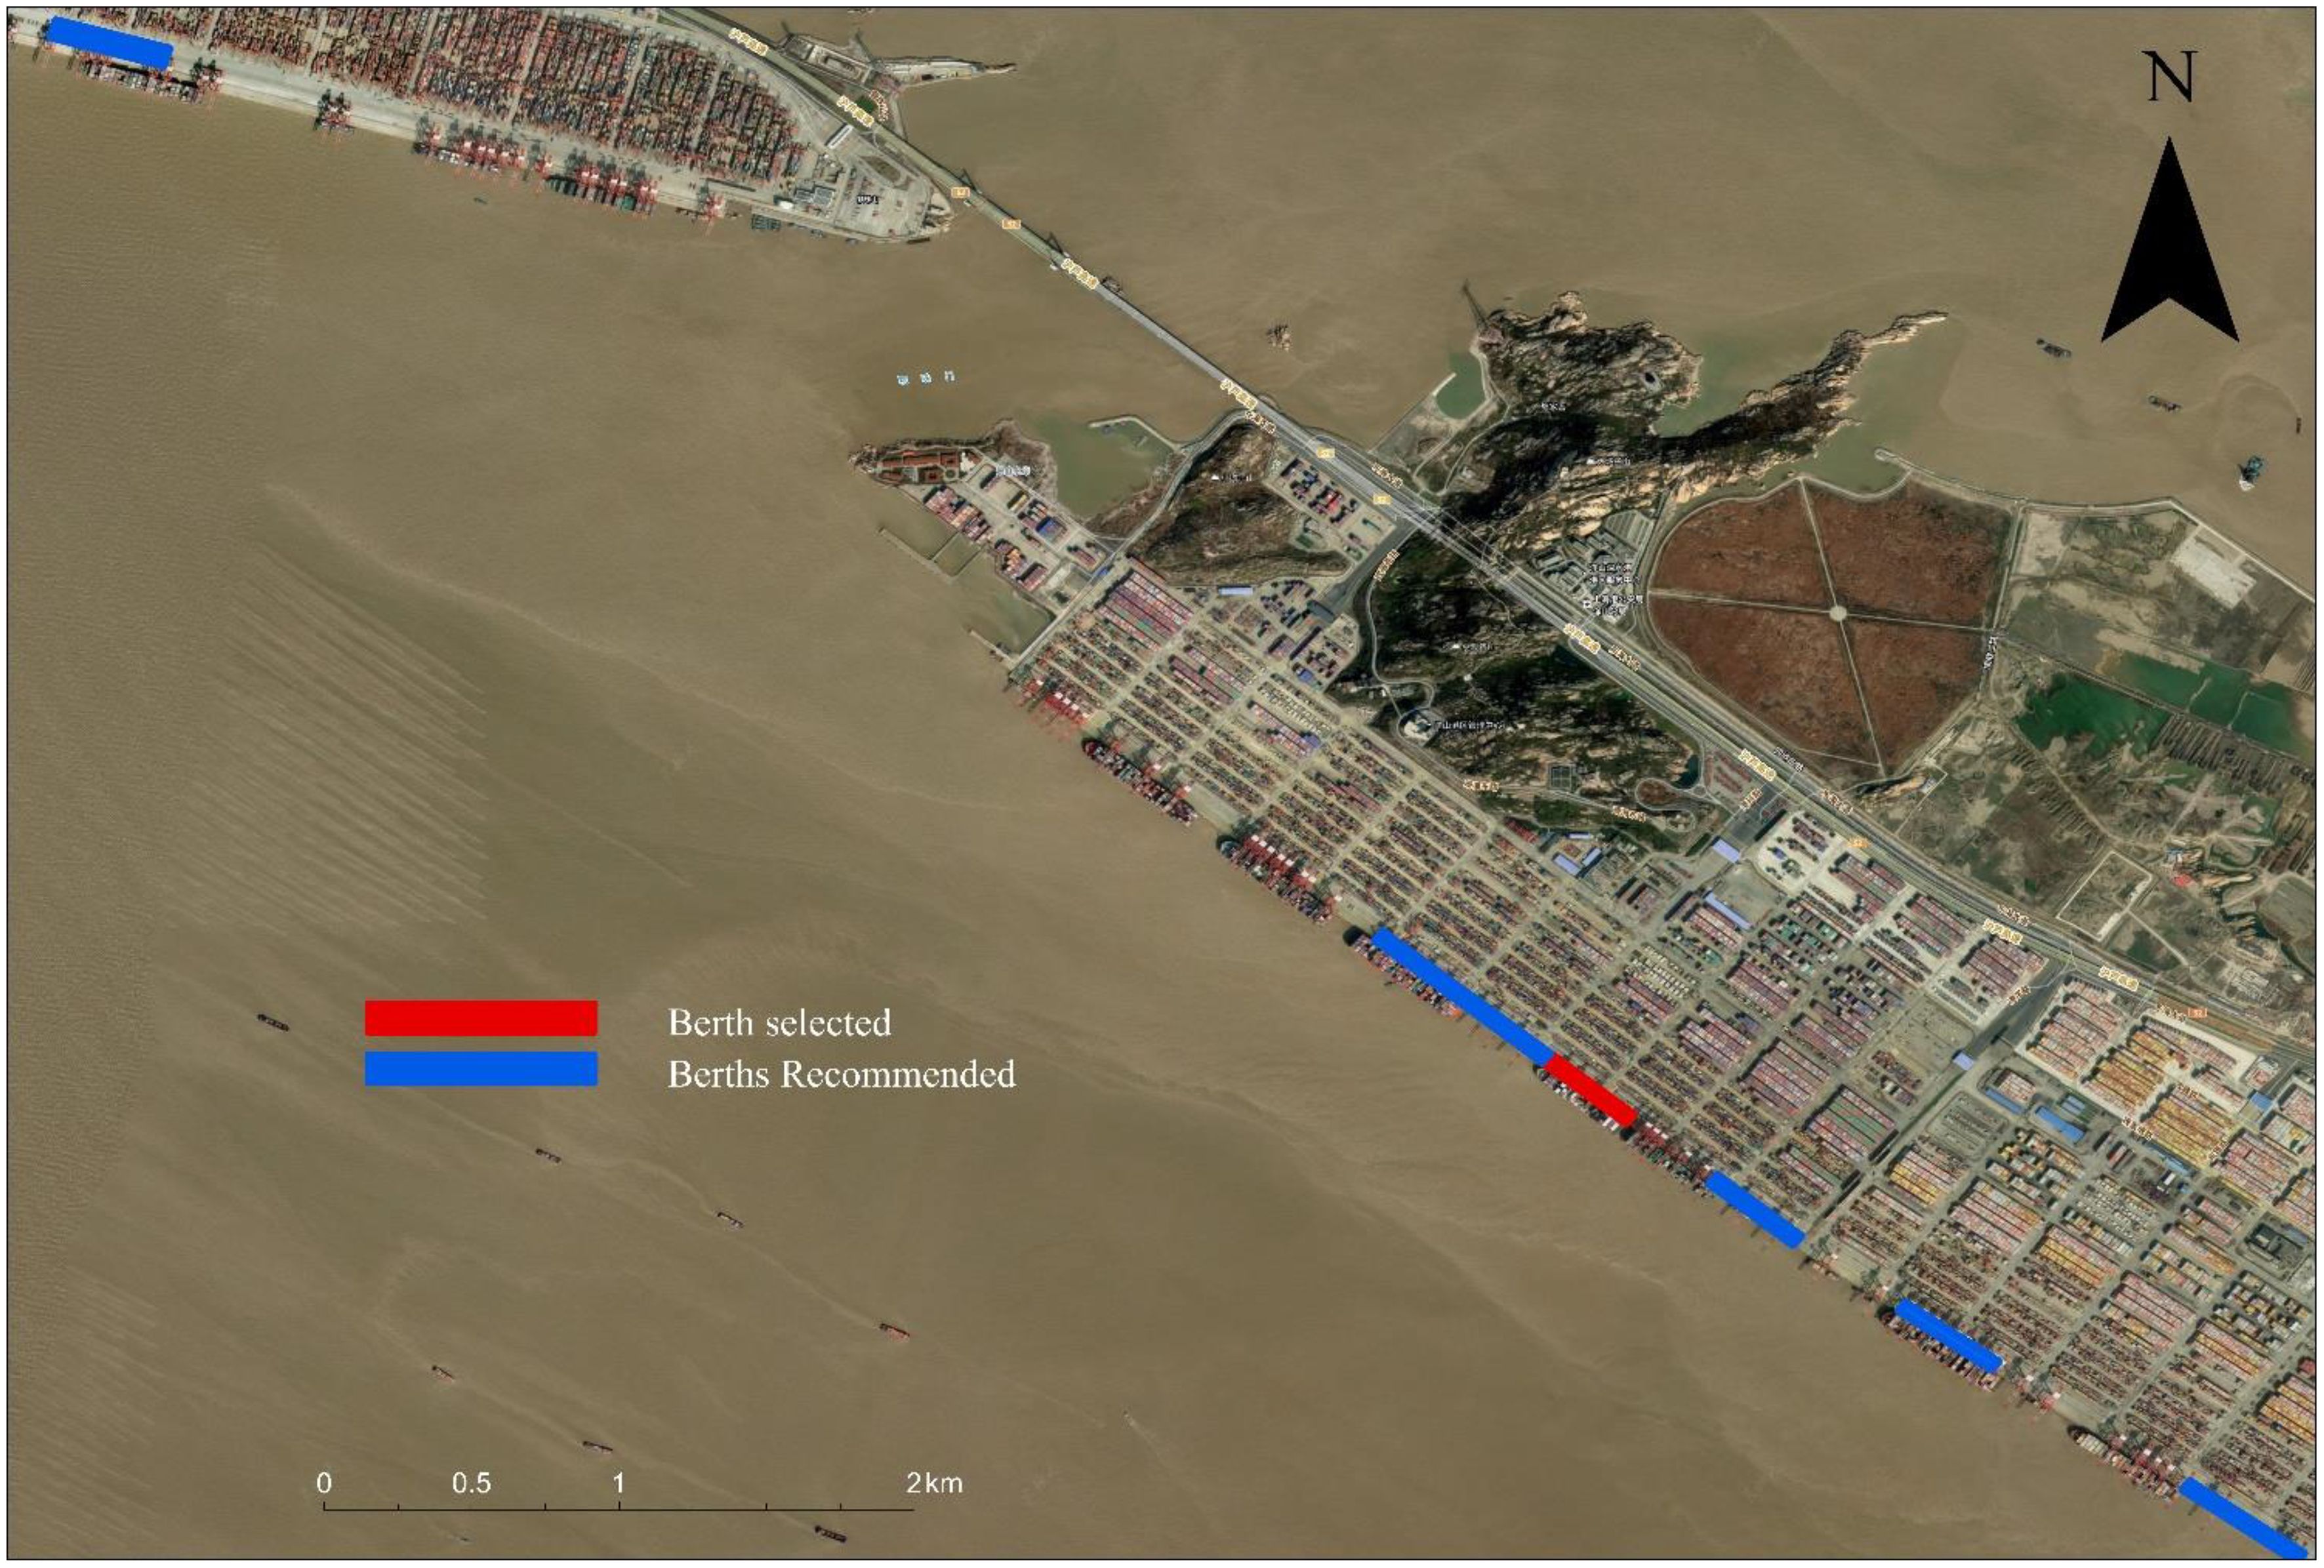
Figure 26 Example of similar berth recommendation effectiveness using the optimal model combination of this framework.
5 Discussion
The framework introduced in this study utilizes knowledge graphs and graph embedding technologies to adeptly navigate the complexities of multi-source data fusion and its applications within the maritime sector. Through empirical validation in two distinct application scenarios—ship type prediction and similar berth recommendation—this research underscores the framework’s capacity to amalgamate AIS data with static maritime information, thereby offering sophisticated intelligent recommendation and prediction capabilities in the maritime domain. Nonetheless, the research framework encounters limitations, notably the static nature of the knowledge graphs and graph embedding models used. This limitation constrains the models’ ability to comprehend and incorporate temporal dynamics, which are critical for capturing more nuanced semantic relationships. Integrating temporal dimensions into the framework could significantly enrich its semantic capacity, thereby enhancing the precision of its recommendations and predictions. By constructing maritime semantic networks through knowledge graphs, we can effectively profile various entities in the maritime domain, such as vessels and shore-based facilities. This approach enables a more intuitive representation of the relationships and structures among these entities and allows for detailed descriptions and classifications, presenting the complex systems and multidimensional characteristics of the maritime domain from various perspectives and levels. For example, at the application level, taking vessel traffic services (VTS) as a case study, integrating this framework can equip vessels with more intelligent and efficient navigation, traffic monitoring, and decision-making services.
Looking forward to future research based on this study, a key challenge is how to achieve deeper integration with other multi-source data, such as remote sensing. Furthermore, with the continuous emergence and development of large language models like GPT (Brown et al., 2020) and Gemini (Team G, 2023), there is an opportunity to gain a deeper understanding of the contextual and semantic information within maritime knowledge graphs. Leveraging the maritime and shipping expertise contained in these graphs can significantly enhance the logical reasoning and problem-solving capabilities of large language models in the maritime domain. This advancement can lead to the development of more specialized maritime large language models, offering highly specialized intelligent analysis and decision-support. Such tools are applicable to improving navigation management, vessel monitoring, environmental monitoring, and enhancing maritime safety.
6 Conclusions and future work
To conclude and propose directions for future research, this study has established a semantically comprehensible framework utilizing knowledge graph technology to elucidate ship behaviors and berth profiles, presenting a pioneering intelligent maritime application framework. This framework capitalizes on knowledge graphs and graph embedding techniques to address key challenges in the maritime industry, such as ship type prediction and berth recommendation. By constructing an intricate knowledge graph that encompasses extensive information on ships and infrastructure, and by exploring various entity relationships through triplets, this research lays a robust foundation for translating complex relational data into actionable vector representations. Through exhaustive comparative analyses, the efficacy of different graph embedding models within maritime contexts was evaluated, investigating how variations in embedding dimensions and model weight distribution influence overall performance. The results of this investigation not only validate the utility of knowledge graphs and graph embedding technologies in maritime applications but also contribute significant empirical evidence and insights for future research endeavors. The developed intelligent transportation systems can aid unmanned devices in making precise decisions based on this model, thereby ensuring the safety of jurisdictional waters and dock efficiency.
While this study has made significant contributions, there are several areas that warrant further exploration. Future research could focus on advancing model fusion techniques to better integrate diverse data sources and improve predictive accuracy. Optimizing real-time data integration and dynamic updates is another critical area that could enhance the responsiveness and accuracy of the system in live environments. Additionally, developing and applying cross-domain knowledge graphs could provide deeper insights by linking data across different sectors, enhancing the comprehensiveness of analyses. Enhancing the scalability and generalization capabilities of the framework is also crucial, as it would allow the system to handle larger datasets and apply learned insights across various maritime contexts. Furthermore, exploring the integration of this framework with large model domains, such as advanced machine learning and artificial intelligence platforms, could open up new avenues for more sophisticated analytical tools and decision-support systems.
Data availability statement
The raw data supporting the conclusions of this article will be made available by the authors, without undue reservation.
Author contributions
YL: Conceptualization, Data curation, Formal analysis, Investigation, Methodology, Software, Writing – original draft. XL: Writing – review & editing. ZW: Software, Writing – review & editing. QM: Funding acquisition, Project administration, Resources, Supervision, Writing – review & editing. WX: Software, Writing – review & editing. YY: Writing – review & editing. PW: Investigation, Supervision, Writing – review & editing.
Funding
The author(s) declare financial support was received for the research, authorship, and/or publication of this article. This research was funded by the National Natural Science Foundation of China: [Grant Number 52372316]; the Natural Science Foundation of Fujian Province: [Grant Number 2021J01821; 2023J01804].
Conflict of interest
The authors declare that the research was conducted in the absence of any commercial or financial relationships that could be construed as a potential conflict of interest.
Publisher’s note
All claims expressed in this article are solely those of the authors and do not necessarily represent those of their affiliated organizations, or those of the publisher, the editors and the reviewers. Any product that may be evaluated in this article, or claim that may be made by its manufacturer, is not guaranteed or endorsed by the publisher.
References
Ahmed U., Srivastava G., Djenouri Y., Lin J. C. W. (2022). Knowledge graph-based trajectory outlier detection in sustainable smart cities. Sustain. Cities. Soc. 78, 103580. doi: 10.1016/j.scs.2021.103580
Bertram N., Dunkel J., Hermoso R. (2023). I am all EARS: Using open data and knowledge graph embeddings for music recommendations. Expert Syst. Appl. 229, 120347. doi: 10.1016/j.eswa.2023.120347
Bordes A., Usunier N., Garcia-Duran A., Weston J., Yakhnenko O. (2013). Translating embeddings for modeling multi-relational data. Adv. Neural Inf. Process. Syst. 26. doi: 10.5555/2999792.2999923
Brown T., Mann B., Ryder N., Subbiah M., Kaplan J. D., Dhariwal P., et al. (2020). Language models are few-shot learners. Adv. Neural Inf. Process. Syst. 33, 1877–1901. doi: 10.18653/v1/2021.mrl-1.1
Chen X., Liu Y., Achuthan K., Zhang X. (2020). A ship movement classification based on Automatic Identification System (AIS) data using Convolutional Neural Network. Ocean. Eng. 218, 108182. doi: 10.1016/j.oceaneng.2020.108182
Chen L., Liu D., Yang J., Jiang M., Liu S., Wang Y. (2022). Construction and application of COVID-19 infectors activity information knowledge graph. Comput. Biol. Med. 148, 105908. doi: 10.1016/j.compbiomed.2022.105908
Chen X., Wang M., Ling J., Wu H., Wu B., Li C., et al. (2024). Ship imaging trajectory extraction via an aggregated you only look once (YOLO) model. Eng. Appl. Artif. Intell. 130, 107742. doi: 10.1016/j.engappai.2023.107742
Deng C., Wang S., Liu J., Li H., Chu B., Zhu J., et al. (2023). Graph Signal Variation Detection: A novel approach for identifying and reconstructing ship AIS tangled trajectories. Ocean. Eng. 286, 115452. doi: 10.1016/j.oceaneng.2023.115452
Escorcia-Gutierrez J., Gamarra M., Beleño K., Soto C., Mansour R. F. (2022). Intelligent deep learning-enabled autonomous small ship detection and classification model. Comput. Electrical. Eng. 100, 107871. doi: 10.1016/j.compeleceng.2022.107871
Fensel D., Şimşek U., Angele K., Huaman E., Kärle E., Panasiuk O., et al. (2020). “Introduction: what is a knowledge graph?,” In: Knowledge Graphs (Cham: Springer), 1–10. doi: 10.1007/978-3-030-37439-6_1
Gan L., Ye B., Huang Z., Xu Y., Chen Q., Shu Y. (2023). Knowledge graph construction based on ship collision accident reports to improve maritime traffic safety. Ocean. Coast. Manage. 240, 106660. doi: 10.1016/j.ocecoaman.2023.106660
Gao M., Shi G. Y. (2020). Ship-handling behavior pattern recognition using AIS sub-trajectory clustering analysis based on the T-SNE and spectral clustering algorithms. Ocean. Eng. 205, 106919. doi: 10.1016/j.oceaneng.2020.106919
Guo S., Zhang H., Guo Y. (2023). Toward multimodal vessel trajectory prediction by modeling the distribution of modes. Ocean. Eng. 282, 115020. doi: 10.1016/j.oceaneng.2023.115020
Han X., Cao S., Lv X., Lin T., Liu Z., Sun M., et al. (2018). “Openke: An open toolkit for knowledge embedding,” in Proceedings of the 2018 conference on empirical methods in natural language processing: system demonstrations (Brussels, Belgium: Association for Computational Linguistics), 139–144. doi: 10.18653/v1/D18-2
Ji G., He S., Xu L., Liu K., Zhao J. (2015). “Knowledge graph embedding via dynamic mapping matrix,” in Proceedings of the 53rd Annual Meeting of the Association for Computational Linguistics and the 7th International Joint Conference on Natural Language Processing (Beijing, China: Long Papers), Vol. Volume 1, 687–696.
Jia C., Ma J., Yang X., Lv X. (2023). RAGAN: A Generative Adversarial Network for risk-aware trajectory prediction in multi-ship encounter situations. Ocean. Eng. 289, 116188. doi: 10.1016/j.oceaneng.2023.116188
Jiang D., Wang R., Xue L., Yang J. (2024). Multisource hierarchical neural network for knowledge graph embedding. Expert Syst. Appl. 237, 121446. doi: 10.1016/j.eswa.2023.121446
Li W., Liu X., Tao W., Zhang L., Zou J., Pan Y., et al. (2024). Location and time embedded feature representation for spatiotemporal traffic prediction. Expert Syst. Appl. 239, 122449. doi: 10.1016/j.eswa.2023.122449
Li G., Liu M., Zhang X., Wang C., Lai K.-H., Qian W., et al. (2022). Semantic recognition of ship motion patterns entering and leaving port based on topic model. J. Mar. Sci. Eng. 10, 2012. doi: 10.3390/jmse10122012
Li J., Xiang J., Cheng J. (2023a). EARR: using rules to enhance the embedding of knowledge graph. Expert Syst. Appl. 10, 120831. doi: 10.1016/j.eswa.2023.120831
Li Y., Xie W., Yang Y., Mei Q., Wang Z., Li Z., et al. (2023b). Research on the carbon emissions traceability inventory and multi-horizon prediction of ship carbon emissions: a case study of Tianjin Port. Front. Mar. Sci. 10, 1174411. doi: 10.3389/fmars.2023.1174411
Liang M., Zhan Y., Liu R. W. (2021). MVFFNet: multi-view feature fusion network for imbalanced ship classification. Pattern Recognit. Lett. 151, 26–32. doi: 10.1016/j.patrec.2021.07.024
Lin Y., Liu Z., Sun M., Liu Y., Zhu X. (2015). Learning entity and relation embeddings for knowledge graph completion. Proc. AAAI. Conf. Artif. Intell. 29, p2181–2187. doi: 10.1609/aaai.v29i1.9491
Liu H., Jia Z., Li B., et al. The model of vessel trajectory abnormal behavior detection based on graph attention prediction and reconstruction network[J].. Ocean Engineering, 2023, 290, 116316 .
Liu H., Jia Z., Li B., Liu Y., Qi Z. (2023b). The model of vessel trajectory abnormal behavior detection based on graph attention prediction and reconstruction network. Ocean. Eng. 290, 116316. doi: 10.1016/j.oceaneng.2023.116316
Liu H., Wu Y., Yang Y. (2017). “Analogical inference for multi-relational embeddings,” in International Conference on Machine Learning. Sydney NSW Australia, 2168–2178 (PMLR).
Liu C., Zhang X., Xu Y., Xiang B., Gan L., Shu Y. (2023a). Knowledge graph for maritime pollution regulations based on deep learning methods. Ocean. Coast. Manage. 242, 106679. doi: 10.1016/j.ocecoaman.2023.106679
Liu X., Zhang Y., Zou H., Wang F., Cheng X., Wu W. (2023c). Multi-source knowledge graph reasoning for ocean oil spill detection from satellite SAR images. Int. J. Appl. Earth Observation. Geoinformation. 116, 103153. doi: 10.1016/j.jag.2022.103153
Ma J., Jia C., Shu Y., Liu K., Zhang Y., Hu Y. (2021). Intent prediction of vessels in intersection waterway based on learning vessel motion patterns with early observations. Ocean. Eng. 232, 109154. doi: 10.1016/j.oceaneng.2021.109154
Murray B., Perera L. P. (2021). Proactive collision avoidance for autonomous ships: Leveraging machine learning to emulate situation awareness. IFAC-PapersOnLine 54, 16–23. doi: 10.1016/j.ifacol.2021.10.067
Nickel M., Tresp V., Kriegel H. P. (2011). A three-way model for collective learning on multi-relational data. Proc. ICML. (International. Conf. Mach. Learning). 11, 3104482–3104584. doi: 10.5555/3104482.3104584
Shin Y., Kim N., Lee H., Young S., Hansen M., Yoon Y., et al. (2024). Deep learning framework for vessel trajectory prediction using auxiliary tasks and convolutional networks. Eng. Appl. Artif. Intell. 132, 107936. doi: 10.1016/j.engappai.2024.107936
Team G, Anil R., Borgeaud S., Alayrac J.-B., Yu J., Soricut R., Schalkwyk J. (2023). Gemini: a family of highly capable multimodal models. arXiv. preprint. arXiv:2312.11805. doi: 10.48550/arXiv.2312.11805
Trouillon T., Welbl J., Riedel S., Gaussier É., Bouchard G. (2016). “Complex embeddings for simple link prediction,” in International Conference on Machine Learning. New York NY USA, 2071–2080 (PMLR).
Wang S., Li Y., Xing H., Zhang Z. (2024). Vessel trajectory prediction based on spatio-temporal graph convolutional network for complex and crowded sea areas. Ocean. Eng. 298, 117232. doi: 10.1016/j.oceaneng.2024.117232
Wang S., Li Y., Zhang Z., Xing H. (2023a). Big data driven vessel trajectory prediction based on sparse multi-graph convolutional hybrid network with spatio-temporal awareness. Ocean. Eng. 287, 115695. doi: 10.1016/j.oceaneng.2023.115695
Wang Y., Liu J., Liu R. W., Wu W., Liu Y. (2023b). Interval prediction of vessel trajectory based on lower and upper bound estimation and attention-modified LSTM with bayesian optimization. Physica. A.: Stat. Mechanics. Its. Appl. 630, 129275. doi: 10.1016/j.physa.2023.129275
Wang Q., Mao Z., Wang B., Guo L. (2017). Knowledge graph embedding: A survey of approaches and applications. IEEE Trans. Knowledge. Data Eng. 29, 2724–2743. doi: 10.1109/TKDE.2017.2754499
Wang Z., Zhang J., Feng J., Chen Z. (2014). Knowledge graph embedding by translating on hyperplanes. Proc. AAAI. Conf. Artif. Intell. 28, 1112–1119. doi: 10.1609/aaai.v28i1.8870
Wang H., Zhong H., Chen A., Li K., He H., Qi Z. (2023c). A knowledge graph for standard carbonate microfacies and its application in the automatical reconstruction of the relative sea-level curve. Geosci. Front. 14, 101535. doi: 10.1016/j.gsf.2023.101535
Xiao Y., Li X., Yin J., Liang W., Hu Y. (2023). Adaptive multi-source data fusion vessel trajectory prediction model for intelligent maritime traffic. Knowledge-Based. Syst. 277, 110799. doi: 10.1016/j.knosys.2023.110799
Xie W., Li Y., Yang Y., Peng W., Zhishan W., Zhaoxuan L., et al. (2023). Maritime greenhouse gas emission estimation and forecasting through AIS data analytics: a case study of Tianjin port in the context of sustainable development. Front. Mar. Sci. 10. doi: 10.3389/fmars.2023.1308981
Yang P., Wang H., Huang Y., Yang S., Zhang Y., Huang L., et al. (2024). LMKG: A large-scale and multi-source medical knowledge graph for intelligent medicine applications. Knowledge-Based. Syst. 284, 111323. doi: 10.1016/j.knosys.2023.111323
Yang B., Yih W. T., He X., Gao J., Deng L. (2014). Embedding entities and relations for learning and inference in knowledge bases. arXiv. preprint. arXiv:1412.6575. doi: 10.48550/arXiv.1412.6575
Zhang C., Bin J., Liu Z. (2024). TrajBERT-DSSM: Deep bidirectional transformers for vessel trajectory understanding and destination prediction. Ocean. Eng. 297, 117147. doi: 10.1016/j.oceaneng.2024.117147
Zhang C., Liu S., Guo M., Liu Y. (2023). A novel ship trajectory clustering analysis and anomaly detection method based on AIS data. Ocean. Eng. 288, 116082. doi: 10.1016/j.oceaneng.2023.116082
Zheng K., Zhang X., Wang C., Cui H., Wang L. (2022). “Adaptive Path Planning for Autonomous Ships Based on Deep Reinforcement Learning Combined with Images,” in International Conference on Autonomous Unmanned Systems (Springer Nature Singapore, Singapore), 1706–1715.
Zhengyu Z., Qinhao W., Zhiqiang Z. (2022). Knowledge graph construction and intelligent application based on enterprise-level big data of nuclear power industry. Proc. Comput. Sci. 214, 1334–1338. doi: 10.1016/j.procs.2022.11.313
Keywords: knowledge graph, graph embedding, intelligent maritime, ship classification, similar berth recommendation
Citation: Li Y, Liu X, Wang Z, Mei Q, Xie W, Yang Y and Wang P (2024) Construction of a large-scale maritime element semantic schema based on knowledge graph models for unmanned automated decision-making. Front. Mar. Sci. 11:1390931. doi: 10.3389/fmars.2024.1390931
Received: 24 February 2024; Accepted: 13 May 2024;
Published: 05 June 2024.
Edited by:
Xinyu Zhang, Dalian Maritime University, ChinaReviewed by:
Maohan Liang, National University of Singapore, SingaporeHongchu Yu, Wuhan University of Technology, China
Copyright © 2024 Li, Liu, Wang, Mei, Xie, Yang and Wang. This is an open-access article distributed under the terms of the Creative Commons Attribution License (CC BY). The use, distribution or reproduction in other forums is permitted, provided the original author(s) and the copyright owner(s) are credited and that the original publication in this journal is cited, in accordance with accepted academic practice. No use, distribution or reproduction is permitted which does not comply with these terms.
*Correspondence: Qiang Mei, bWVpcWlhbmdAam11LmVkdS5jbg==; Peng Wang, d2FuZ3BAaWN0LmFjLmNu