 Wendel W. Raymond1,2*
 Elizabeth D. Tobin3
 Julie S. Barber4
 Hilary A. Hayford5
 Ann E. T. Raymond3Camille A. Speck6
 Doug Rogers6
 Rana Brown7
- 1Washington Department of Fish and Wildlife, Habitat Program, Olympia, WA, United States
- 2Friday Harbor Laboratories, University of Washington, Friday Harbor, WA, United States
- 3Jamestown S’Klallam Tribe, Natural Resources Department, Sequim, WA, United States
- 4Fisheries Department, Swinomish Indian Tribal Community, La Conner, WA, United States
- 5Puget Sound Restoration Fund, Bainbridge Island, WA, United States
- 6Washington Department of Fish and Wildlife, Intertidal Bivalve Program, Port Townsend, WA, United States
- 7Natural Resources Department, Squaxin Island Tribe, Shelton, WA, United States
Introduction: Coastal marine ecosystems, are particularly susceptible to climate change. One such threat is atmospheric heatwaves, which are predicted to increase in frequency, duration, and intensity. Many intertidal organisms already live at the edge of their thermal tolerance limits and heatwaves can outstretch an organism’s ability to compensate in the short term. In June 2021 the Pacific Northwest region of North America, including the Salish Sea, experienced a significant atmospheric heatwave during some of the lowest tides of the year. This was followed by numerous reports of dead and dying intertidal marine organisms region-wide. A semi-quantitative rapid assessment found a range of both species- and location-specific effects but generally recorded widespread negative impacts to intertidal shellfish species across the Salish Sea.
Methods: Following these results, we opportunistically analyzed data collected by intertidal bivalve resource managers from the region. These datasets allowed us to examine regional density and size data for clam and oyster populations before and after the heatwave to increase our quantitative understanding of heatwave effects.
Results: We found a range of responses including positive and negative effects of the heatwave on clam and oyster density. While we generally found small changes in bivalve size, some site-species combinations displayed large shifts in size frequency. Many of our analyses did not indicate even moderate statistical support, even with large changes in the mean, driven in part by high variability in the data. Time intervals between surveys, ranging from 2 to over 25 months, had little effect on observed variability indicating that any heatwave-induced effects may be masked by variability inherent to the population ecology and/or survey methodology.
Discussion: This analysis has highlighted the need for intertidal resource managers, and the greater research community, to consider alternative survey approaches designed to constrain variability in order to detect the effects of acute or extreme events. With the effects of climate change predicted to become more intense, targeted survey approaches may be needed to detect the effects and implications of such events and to continue effective management of intertidal bivalves in the Salish Sea and worldwide.
1 Introduction
Coastal marine ecosystems are particularly vulnerable to the impacts of climate change due to their exposure to both terrestrial and marine environments (Harley et al., 2006; Doney et al., 2012). Rising sea levels, ocean acidification, increased severity of extreme weather events, and elevated temperatures are all predicted to impact coastal ecosystems and human communities, challenging current research and management paradigms (IPCC, 2021). Atmospheric heatwaves, defined as periods of anomalously high air temperatures, are one such extreme weather event that can have devastating effects on these ecosystems and their associated biota (Vázquez, 2021; He et al., 2022a; White et al., 2023). Unfortunately, the frequency, intensity, and duration of atmospheric heatwaves have increased in recent years and are projected to continue increasing in the coming decades (Perkins et al., 2012; Hobday et al., 2016; Vose et al., 2017; IPCC, 2021). Despite the recognized vulnerability to extreme weather events, scientists and resource managers have limited understanding of the episodic or persistent effects, positive or negative, of the increased occurrence of atmospheric heatwaves on coastal marine ecosystems. Due in part to this limited understanding of what effects may be, scientists and resource managers may also be limited in how to best measure these effects. Acute thermal stress events, such as atmospheric heatwaves, can have short- and long-term detrimental effects on marine species (Hochachka and Somero, 2002; Harley, 2008; Sunday et al., 2019) including bivalves (Fousiya et al., 2022; Masanja et al., 2023). Temperatures that exceed thermal tolerance limits cause tissue damage that may be severe enough to cause short-term physiological and behavioral disruptions (sublethal stress), or imminent death. Tissue damage that is initially undetected may eventually result in decreased growth rate, reproductive output, or longevity due to the energetic cost of repair (Hochachka and Somero, 2002). These effects are especially pronounced in invertebrates, all of which are ectothermic. Intertidal marine invertebrates are particularly vulnerable to thermal extremes given they already live in environments where small differences in tidal elevation and microhabitat can be critical to survival (Helmuth et al., 2002; Gilman et al., 2015). Although short-term exposure to moderate thermal stress may confer stress tolerance (Pasparakis et al., 2016; Bible et al., 2020), the persistence of an atmospheric heatwave over several days may prevent recovery between low tides. Furthermore, such an event may heat shallow marine waters and the surrounding substrate thereby limiting the ability of the water to serve as a thermal refuge at high tides.
The threat of atmospheric heatwaves to bivalves has recently gained considerable research attention considering their increasing frequency and severity. Recent studies, from both persistent and repeated heatwaves, have documented changes to gene regulation and broad increases in metabolic processes indicating general physiological stress (He et al., 2022a, b; Masanja et al., 2023; Liang et al., 2024). These studies suggest that some mortality could lag as physiologically stressed organisms may have initially compensated but died later. Furthermore, short-term thermal stress may require long recovery periods (Fousiya et al., 2022) suggesting that even after the conditions have returned to normal, bivalves may have prolonged physiological stress that potentially decrease survival.
Mollusks found in estuarine ecosystems, particularly intertidal bivalves, represent vital components of community health and well-being and have supported Indigenous peoples for millennia (Garibaldi and Turner, 2004; Toniello et al., 2019; Reeder-Myers et al., 2022). Intertidal bivalves also provide important ecosystem services and support valuable commercial fisheries and aquaculture operations (Newell, 2004; Dumbauld et al., 2009; van der Schatte Oliver et al., 2018; Smith et al., 2023). The southern Salish Sea, which encompasses the marine inland waters of Washington State including Puget Sound and the Strait of Juan de Fuca, is a partially-mixed and highly productive estuarine system that supports diverse bivalve populations, including both native and naturalized clam and oyster species (Dethier, 2006). Many of these intertidal bivalve species support commercial, recreational, and subsistence fisheries that involve a unique co-management structure in which the Washington treaty tribes and the State of Washington’s Department of Fish and Wildlife (WDFW) are jointly responsible for the management of fisheries resources, including shellfish1, and providing equal (50/50) harvest opportunity for treaty tribes and state citizens2.
To fulfill management obligations, Washington State co-managers conduct intertidal bivalve population surveys, using standardized field methods, on selected tidelands across the region. These standard survey methods are designed for a specific management purpose — to allow co-managers to assess the status of existing clam and oyster resources at a specific location upon which a sustainable harvest biomass is based (Campbell, 1996; Point No Point Treaty Council (PNPTC), 1998; Bradbury et al., 2005). Population surveys generally target the following managed bivalve species: Manila clams (Ruditapes philippinarum) and Pacific oysters (Magallana gigas = Crassostrea gigas), which are naturalized or commercially-grown and represent the most-economically important species in the region; and native clams [native littleneck clams (Leukoma staminea), butter clams (Saxidomus gigantea), and cockles (Clinocardium nuttallii)], that are cultural keystone species for western Washington tribes and compose much of the recreational, subsistence, and/or commercial fisheries-targeted native intertidal clam biomass (Garibaldi and Turner, 2004; Dethier, 2006). Since 2007, surveys conducted by WDFW have also included purple varnish clams (Nuttallia obscurata) to track the increase in this non-native species and to determine standing stock for removal fisheries. These long-standing survey methods were originally tailored to the distribution patterns of Pacific oysters, Manila clams, and native littleneck clams to estimate total standing stocks on an annual basis with an accepted margin of error of ≤ 30% coefficient of variation (Campbell, 1996). Additional, yet comparable, survey designs target the only oyster native to the eastern Pacific Coast, Olympia oysters (Ostrea lurida), which have been reduced to < 5% of its original (circa 1850) population in this region (Blake and Bradbury, 2012). This species is now the subject of numerous regional restoration efforts and holds broad co-management and stakeholder interest (Ridlon, 2021).
From 26 - 29 June 2021, the Pacific Northwest region of North America, including the Salish Sea, experienced the most significant atmospheric heatwave event in recorded history for the area (Philip et al., 2021; White et al., 2023). Daytime high temperatures were 10° to 20°C above average for three to four consecutive days, with multiple locations breaking all-time temperature records. This atmospheric heatwave, which is distinct from a marine heatwave, coincided with the lowest daytime low tides of the year and some of the lowest in the 18.6-year tidal cycle exposing intertidal bivalves to anomalously high air temperatures for extended periods of time over multiple days (Figure 1). During and immediately following the heatwave event, numerous reports of dead and dying marine organisms were made throughout the region. On-the-ground observations, gathered through a structured semi-quantitative assessment, indicated a range of species-specific and location-specific effects but generally recorded widespread negative impacts to intertidal shellfish species across the Salish Sea (Raymond et al., 2022). These observations were not surprising given that bivalves are primarily sessile, lack options for thermoregulation, and are known to be adversely affected by increased temperatures and heatwaves (Domínguez et al., 2021; Masanja et al., 2023). Clams and oysters live in close contact with beach sediments, exposing them to conductive heating of sand and mud, and bivalves that are buried in wet sediments lose the opportunity for evaporative cooling (Helmuth, 1998). Thus, when an extreme heatwave occurs, intertidal bivalves are generally exposed to conditions that pose a high risk of thermal stress.
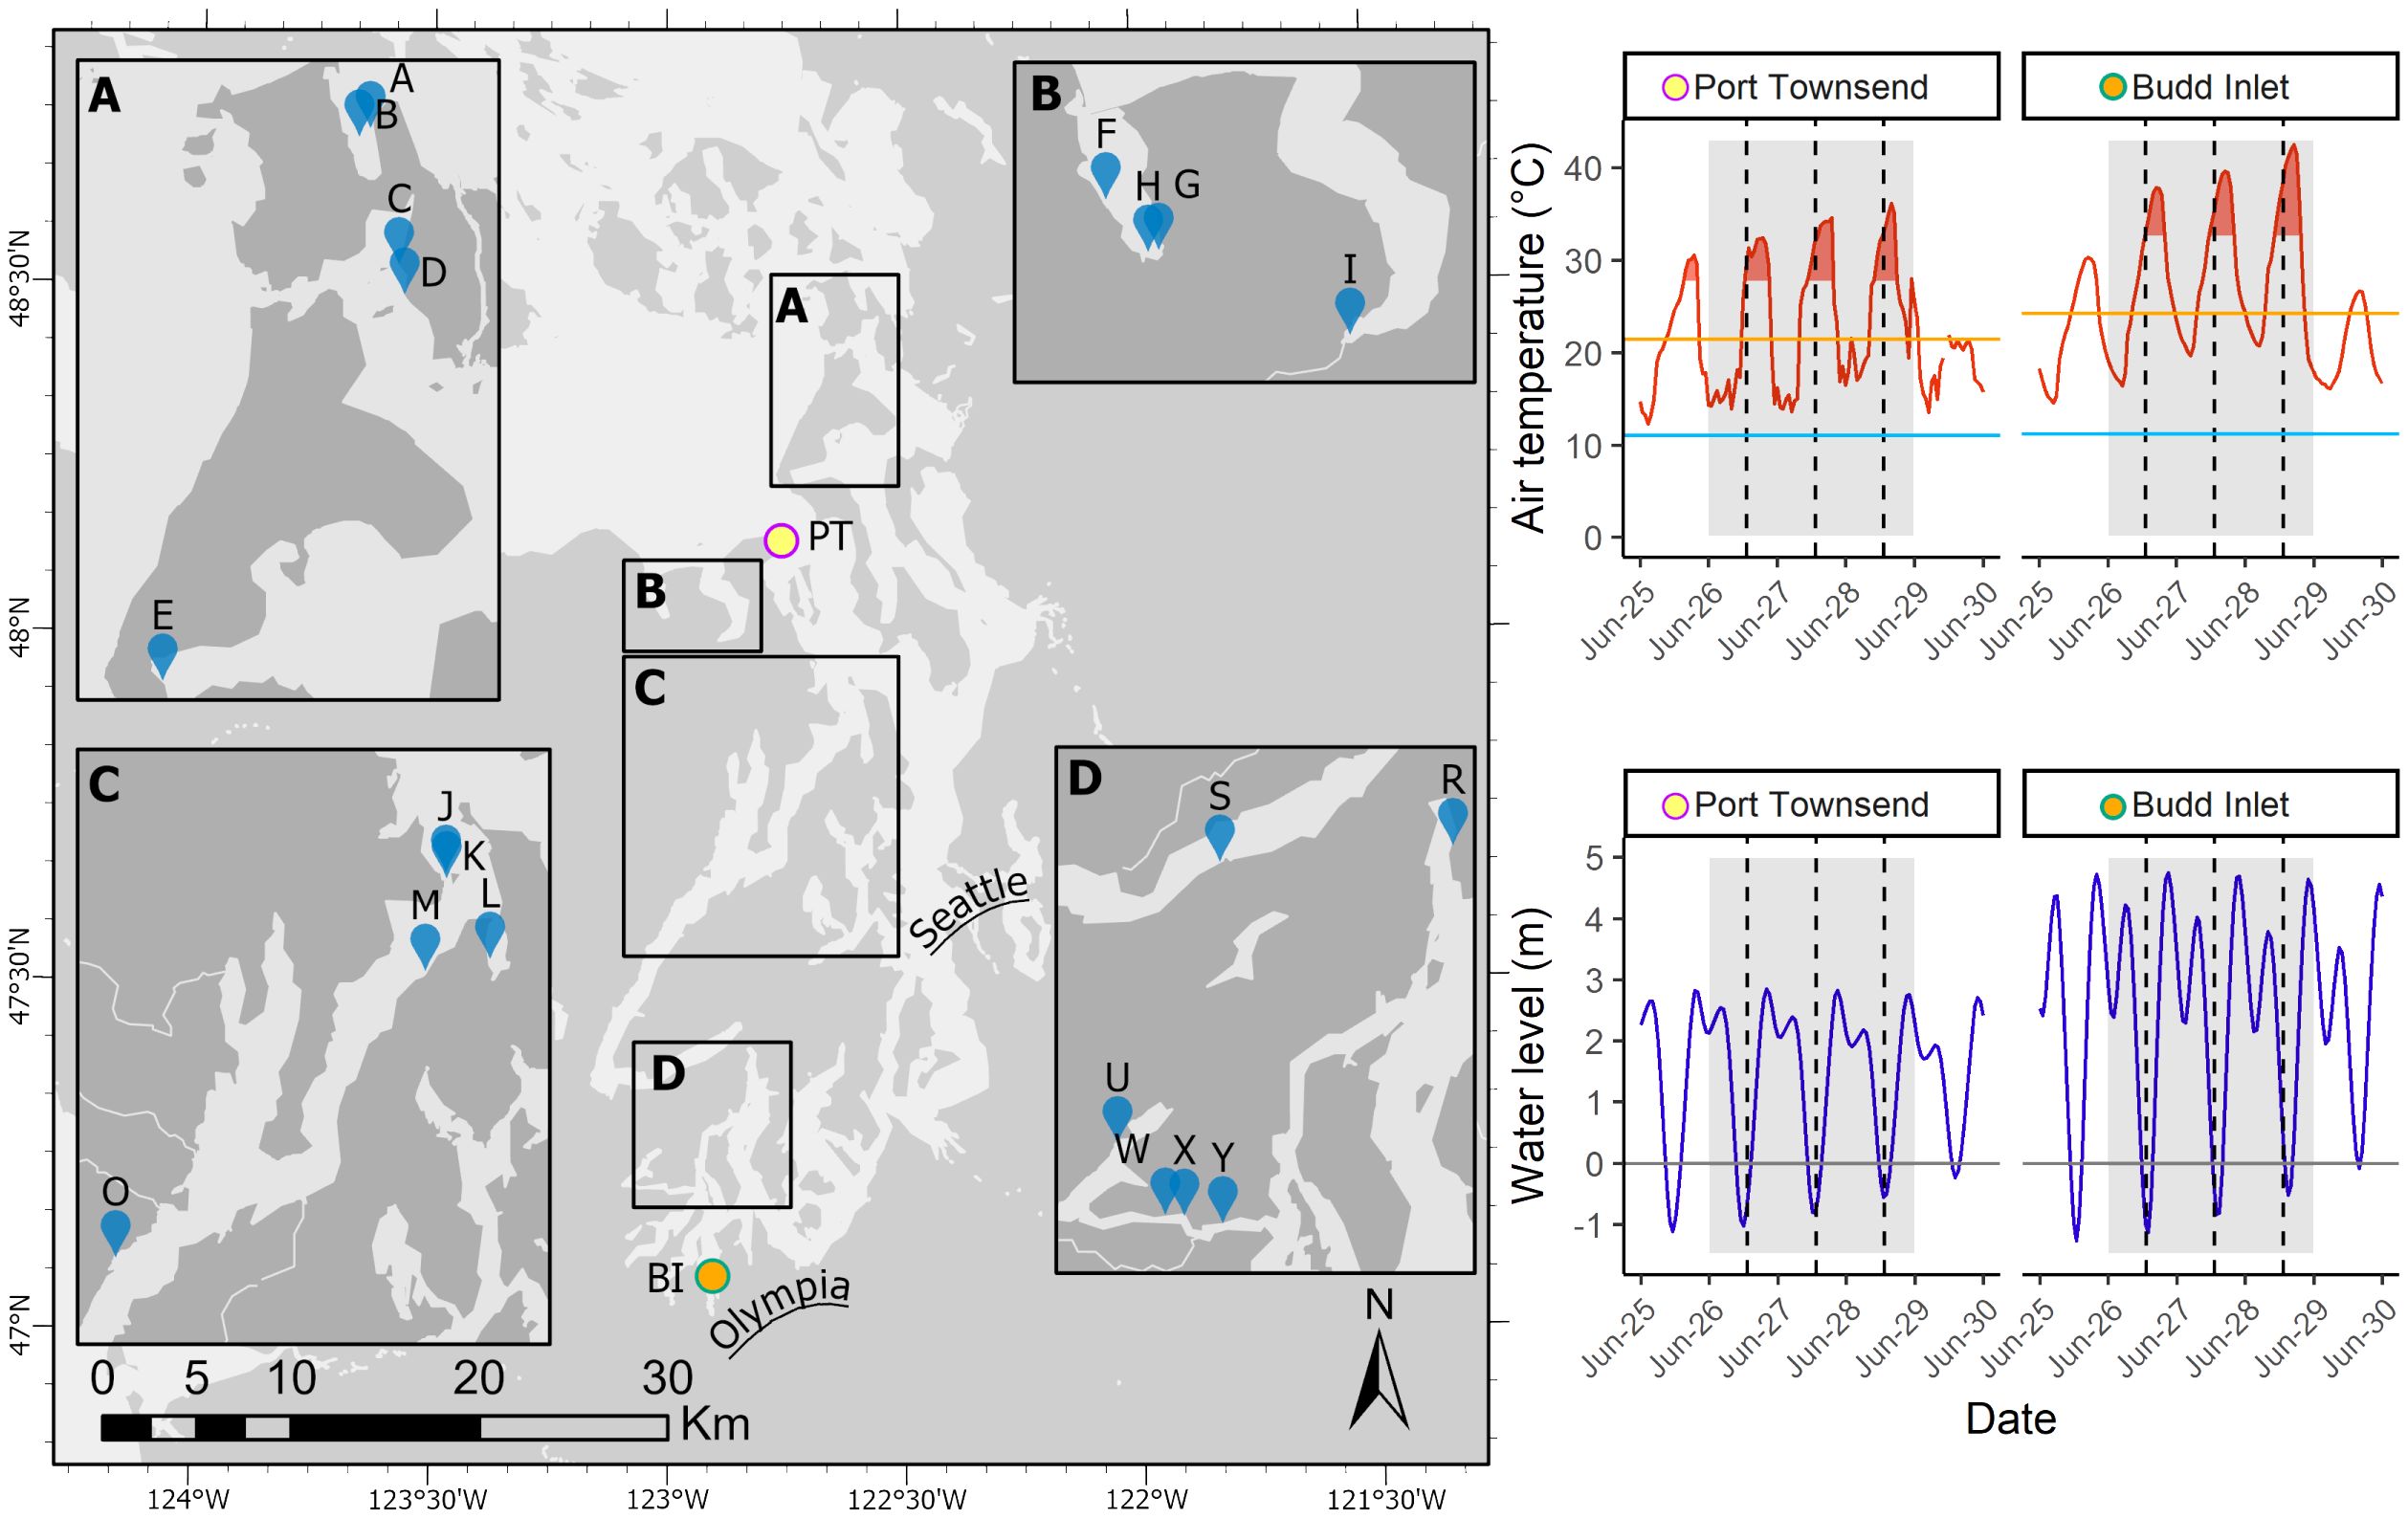
Figure 1 Study area in the southern Salish Sea and sampling sites. Temperature and water level data measured at PT - Port Townsend and BI - Budd Inlet. In temperature and water level plots, the gray shaded area represents the time frame of the heatwave in June 2021. Vertical dashed lines indicate solar noon. Horizontal lines in temperature plots indicate 1991 - 2020 mean summer (June-August) high (orange) and low (light blue) temperatures. Red shaded temperature regions represent the duration of time when temperatures exceeded two standard deviations above 1991 - 2020 mean summer high temperature. PT temperature and water level data was obtained from the National Oceanic and Atmospheric Administration (NOAA) tide station 9444900. BI temperature data was obtained from the Evergreen State College weather station and water level data from NOAA tide station 9446969.
In response to this significant mortality event, regional co-managers and stakeholders identified a pressing need for a quantitatively robust regional assessment of the heatwave’s impacts to inform future bivalve resource management and, ultimately, ensure sustainability of valuable shellfish resources. The purpose of this assessment was to gather and analyze existing clam and oyster population datasets from before and after the June 2021 heatwave in the southern Salish Sea to better understand both species- and/or location-specific short-term acute atmospheric heatwave effects. We opportunistically targeted use of the co-manager/stakeholder bivalve population surveys because they were the best data available to evaluate the effect of the June 2021 heatwave on wild populations. We were able to utilize these data because surveyors used the same methods before and after the heatwave. Here, we analyze bivalve population survey data from 20 sites covering 10 common bivalve species collected before and after the June 2021 heatwave to quantify effects of the heatwave on organism density, mean size, and population size distribution. Building off initial observations of the heatwave’s impact collected immediately following the event (Raymond et al., 2022), we hypothesized that the effect of the heatwave on clam and oyster populations would be large enough to detect apart from natural variability, and therefore, identifiable in available population survey data when examining metrics of density and size.
2 Materials and methods
2.1 Data aggregation and pre-processing
We leveraged the collaboration built from the initial semi-quantitative assessment of heatwave effects on intertidal shellfish to gather quantitative data on clam and oyster populations measured before and after the June 2021 heatwave in the southern Salish Sea (Raymond et al., 2022). We identified potential data contributors who routinely survey clam and oyster populations as part of their shellfish management, research, and/or restoration activities and had collected data before and after the heatwave. Our request comprised a diverse group of shellfish co-managers and researchers representing state, non-profit, and tribal organizations. We received data from the following contributors (in alphabetical order): Jamestown S’Klallam Tribe, Jefferson County Marine Resource Committee, Port Gamble S’Klallam Tribe, Puget Sound Restoration Fund, Skagit County Marine Resource Committee, Swinomish Indian Tribal Community, Squaxin Island Tribe, and Washington Department of Fish and Wildlife.
For inclusion in the analyses, we required that data from each contributor had been collected using the same survey methods and in the same location, before and after the heatwave. Due to the inherent variation in the timing and frequency of surveys across contributors, we defined ‘before’ heatwave data as those collected up to 3 years prior to June 2021 and ‘after’ heatwave data as those collected between 1 July 2021 and 30 September 2021. Clam and oyster data from all contributors were collected following similar standard field methods for quantitative sampling of population abundance and biomass (Campbell, 1996; Barber et al., 2012, 2019). Briefly, contributors primarily conducted surveys within a delineated area, representative of the local clam or oyster bed, and collected data within various grid structures such as evenly spaced transect lines with evenly spaced quadrats starting from a random point (i.e., systematic random design) with two exceptions that implemented haphazard quadrat placement within a delineated area. Each contributor may have made slight modifications from these methods; however, the overall goal of estimating the site-specific population size remained the same. Furthermore, these methods and resulting data are the same used among Washington State and tribal co-managers to manage intertidal bivalve populations, and therefore represent the best available population data of these species across a regional scale.
Raw data from each contributor were reviewed for errors and any formatting or data anomalies were resolved. Any data submitted only as size-frequency was converted to counts given that all sampled individuals were measured. Clam and oyster density was presented as counts per square meter (Supplementary Table S1). To ensure consistency in our comparative assessments, the total area surveyed (m2) before and after the heatwave must have been within 10% of each other for the site to be included in the analysis. We recognize that the standard survey methodology may not be optimized for all bivalve species. To account for this, we filtered density data for each before/after (B/A) survey pair to only include records where a species was present in at least 10% of quadrats sampled both before and after the heatwave. We also collated organism size (shell length) data where available. Most contributors counted all focal species at their sites regardless of size, except for surveys performed by WDFW which aims to measure at least 300 oysters per survey and at least 30% of all clams in sampled quadrats, then these data are filtered to exclude clams < 38mm and oysters < 64mm to represent legal sized individuals. Because our analytical framework (described below) was designed to test for heatwave effects within a site and species, our approach controls for this and other slight methodological differences among contributors. We filtered size data to only include sites where at least 30 individuals were measured both before and after the heatwave. After applying our filters for data inclusion, we analyzed densities at 42 before/after survey pairs and size at 27 survey pairs (Table 1).
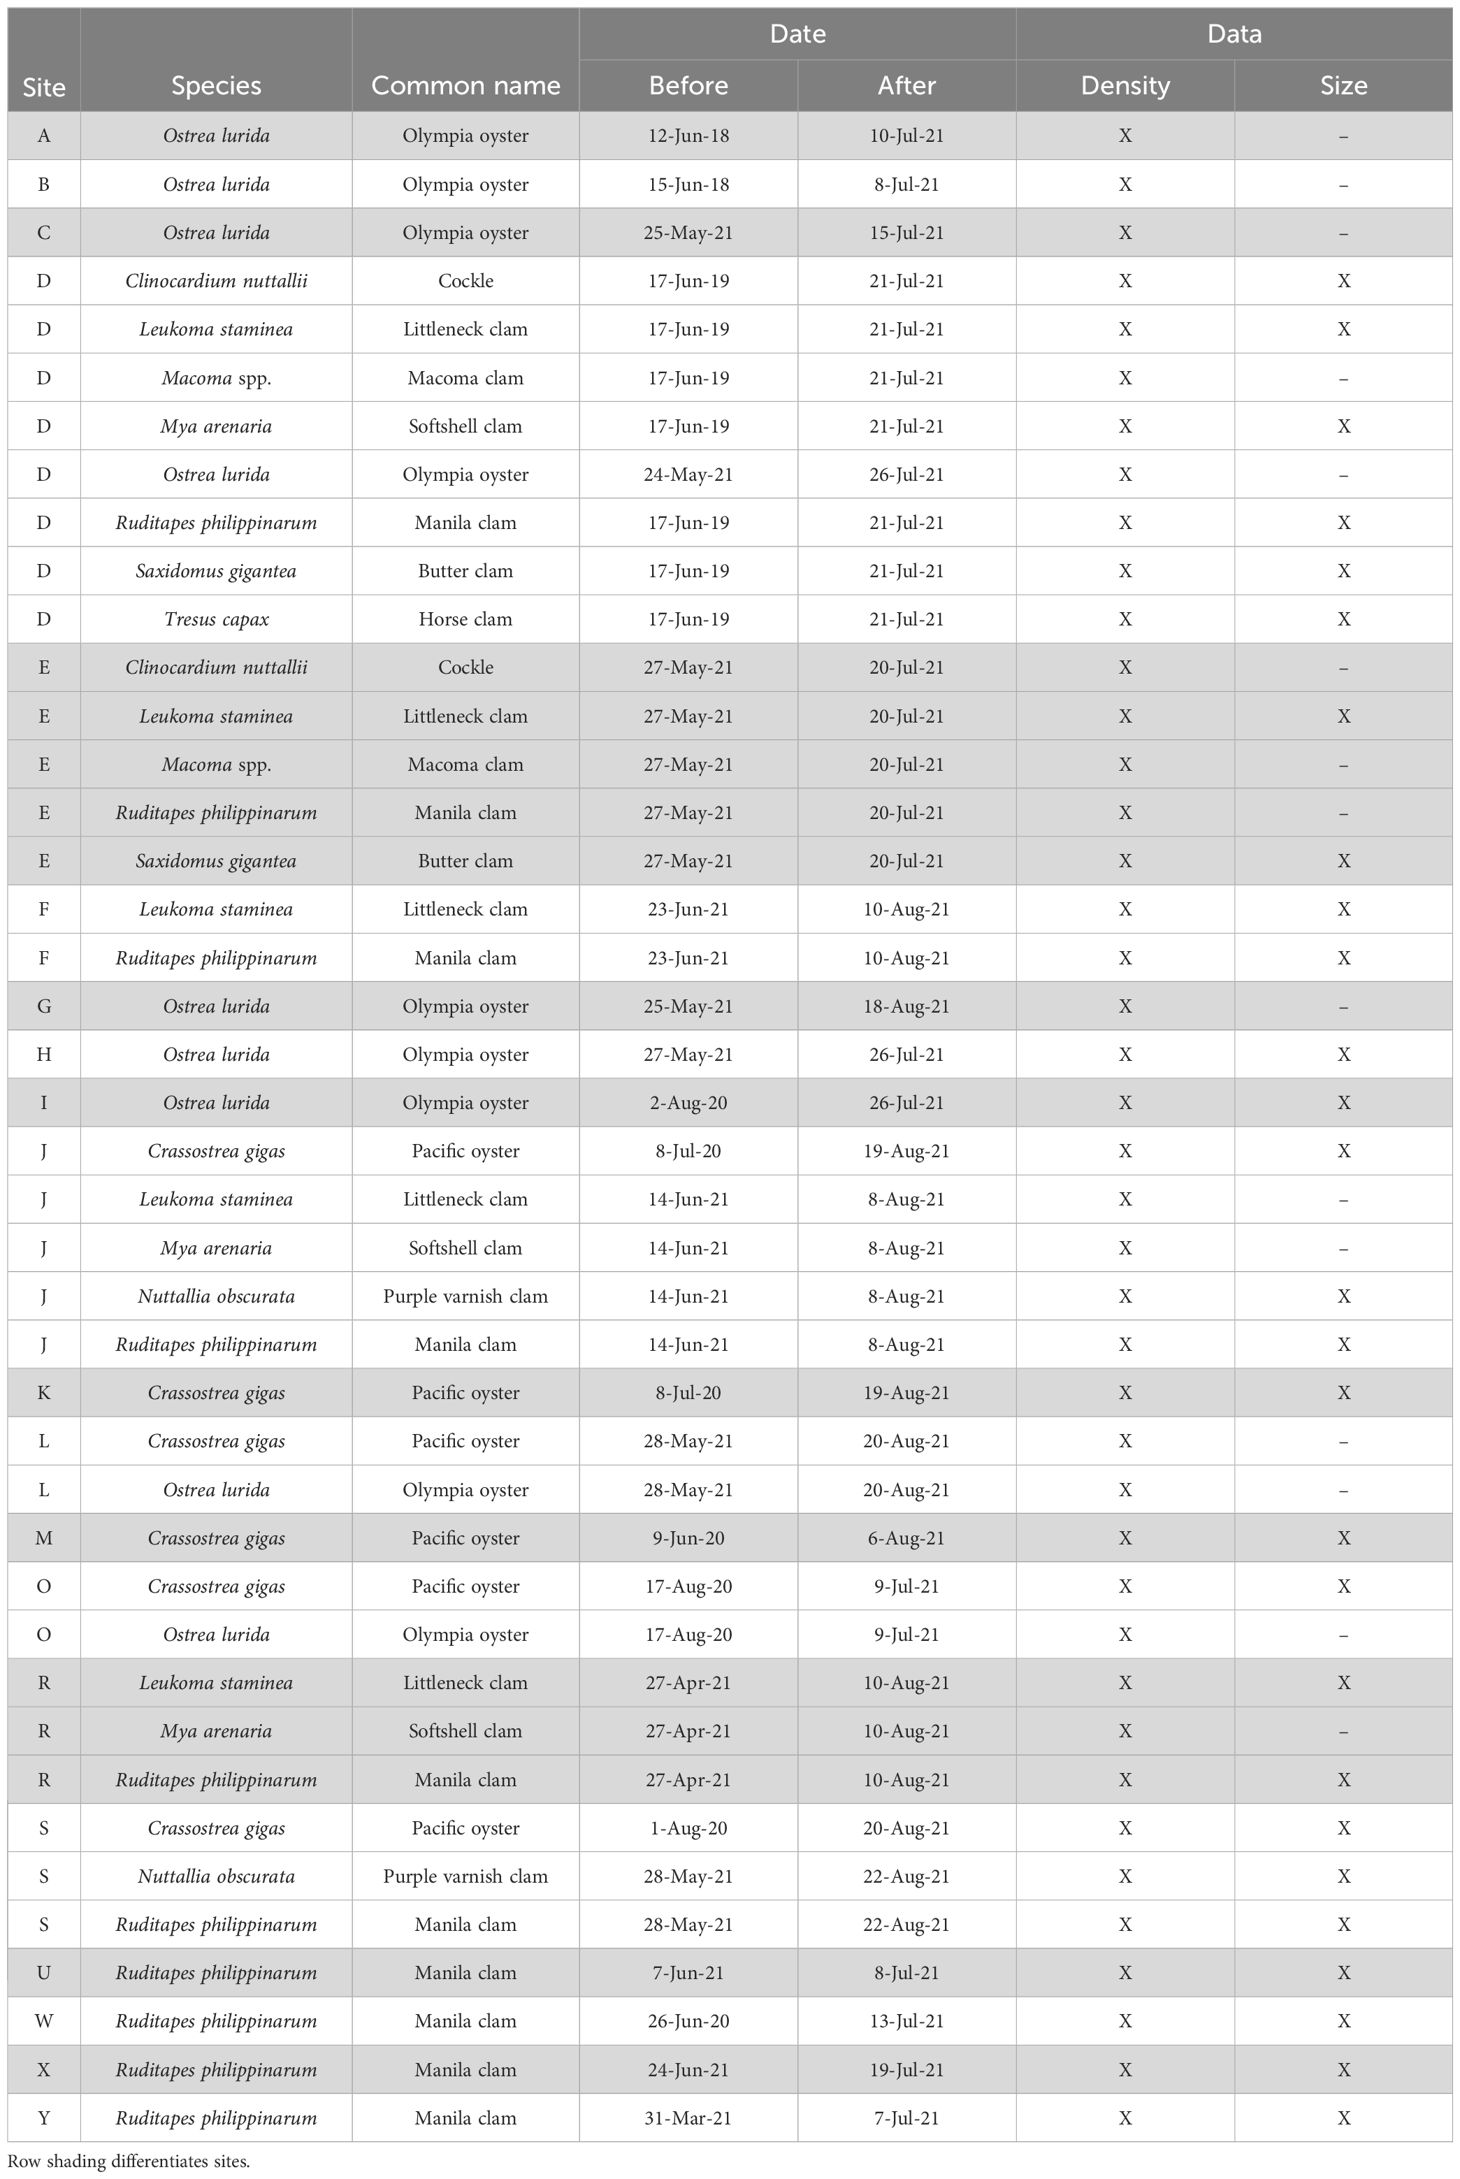
Table 1 Key to sites, species, date for before and after heatwave surveys and available data.
Upon collating survey data, 25 out of 42 B/A survey pairs had conducted before surveys in spring/early summer 2021 and the remaining 17 B/A survey pairs had before surveys between 2018 and 2020 (Table 1). We chose to include data from survey pairs with before surveys that were conducted prior to 2021 because many sites are not surveyed every year and excluding these data would drastically reduce spatial and species coverage of the analysis.
2.2 Analysis
Analyses were designed to evaluate the effect of the June 2021 heatwave by comparing clam and oyster density, mean size, and size distribution within each unique site-species B/A survey pair. This approach helped control for methodological variability among contributors as only one contributor sampled at each site and site-specific factors such as beach aspect, sediments type, or water flow. For each comparison, we computed three measures from the density and size data: (1) mean (+/- SD), (2) percent difference (before vs. after heatwave), and (3) Cohen’s D effect size (+/- 95% CI). Additionally, we used Kolmogorov–Smirnov tests (hereafter KS tests) to compare size distributions before and after the heatwave where data was available. Cohen’s D effect size is a statistical approach to evaluate the strength of an observed effect and was calculated using the ‘cohen.d’ function with pooled standard deviation in the ‘effsize’ package in R (Torchiano, 2020). Cohen’s D produces a range of values with no strict cut-off that determines significance or strength. However, general guidelines suggest Cohen’s D of ±0.2 or less are a small effect, ± 0.2 – ± 0.5 a moderate effect, ± 0.5 – ± 0.8 a large effect, and greater than ±0.8 a very large effect. KS tests were performed with the ‘ks.test’ function with two-sided p-values in the ‘dgof’ package in R (Arnold and Emerson, 2011). All analyses were performed in R 4.2.1.
We recognized that larger time intervals between surveys have greater potential for environmental and biological factors, other than the heatwave, to affect clam and oyster populations. To investigate this, we plotted the coefficient of variation (CV) — defined as the standard deviation divided by mean — of species densities in three general time categories: B/A surveys conducted within the same season (within 4 months); B/A surveys separated by one sampling season (between 10 and 15 months); and B/A surveys separated by two or more sampling seasons (greater than 25 months). We computed the mean and standard deviation of the coefficient of variation when population data for a single species were available across multiple sites for a time category.
3 Results
3.1 Regional patterns
The June 2021 heatwave had a wide range of effects on clam and oyster density and size, varying both among and within species and sites. Twenty-four of 42 B/A survey pairs showed a decrease in density after the heatwave, yet the percent differences in density was wide-ranging from an 85.0% decrease to a 471.6% increase (Figure 2A; Supplementary Table S1). While many surveyed species displayed considerable changes in density (> +/-25%), these percent differences often did not correspond to moderate or large Cohen’s D effect size values. We found small changes (< +/-5%) in organism size in 19 out of 27 sites (Figure 3A; Supplementary Table S2). No B/A survey pairs provided evidence of a large positive heatwave effect (effect size ≥ 0.5) on organism size; however, we did find evidence of a large negative heatwave effect (effect size ≤ -0.5) on organism size in four out of the 27 sites associated with Pacific oysters (Figure 3B; Supplementary Table S2). Tests for differences in size distribution found statistical evidence (p-value range < 0.001 to 0.043) of a change in size distribution in 10 out of 27 B/A survey pairs, mostly associated with Pacific oysters and Manila clams (Figure 4; Supplementary Table S2).
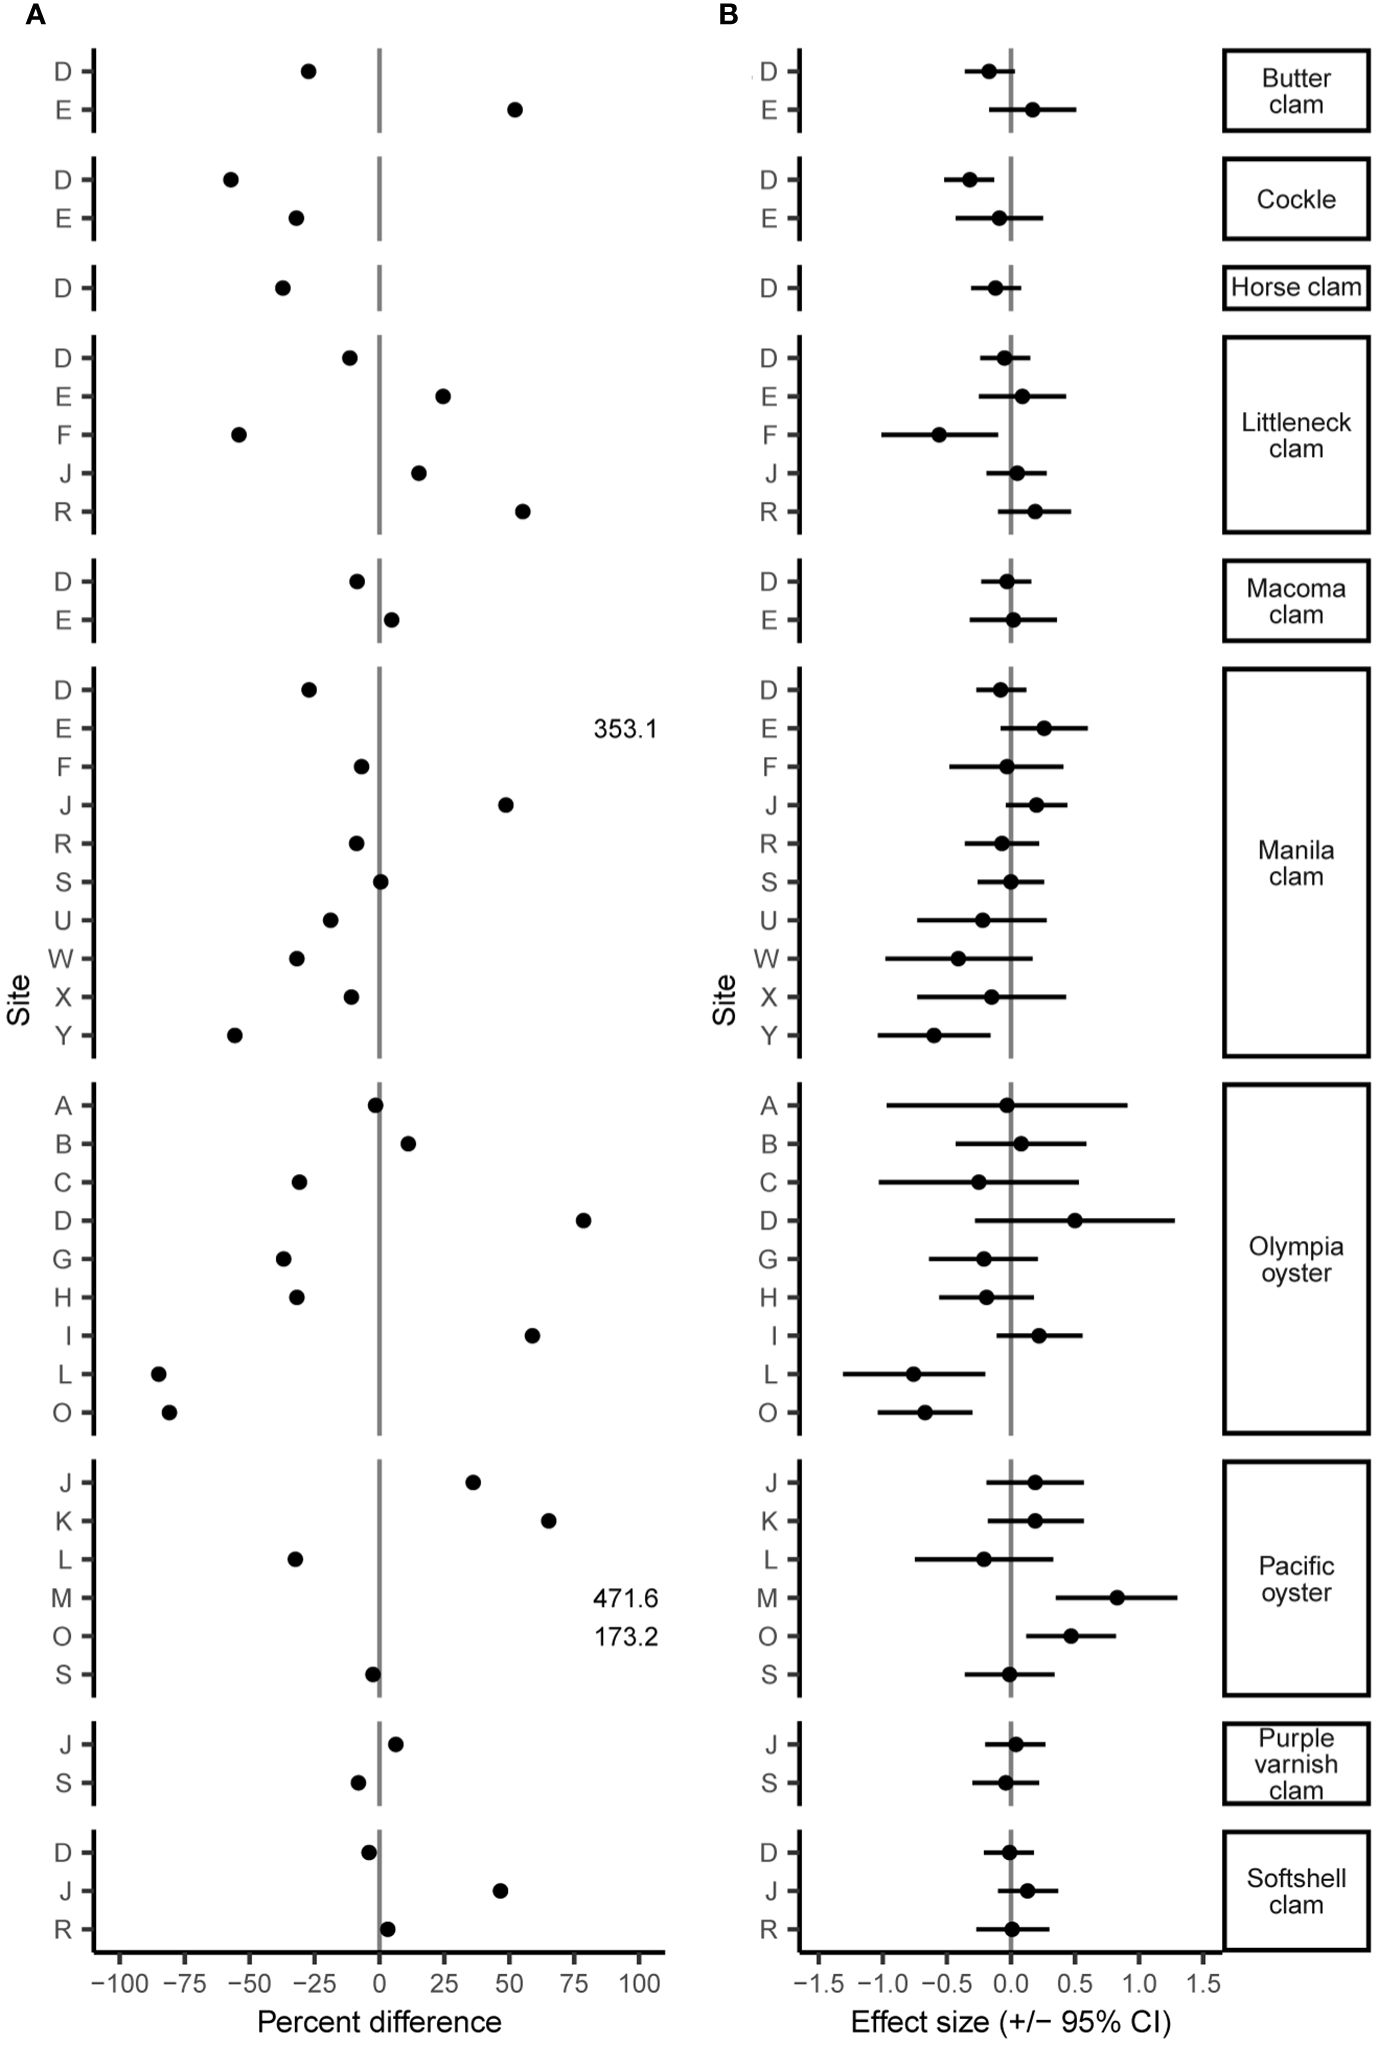
Figure 2 Percent difference (A) and Cohen’s D effect size (+/- 95% CI) (B) of species density before and after the June 2021 heatwave. Note percent difference of Manila clams at site E and Pacific oysters at site M and O extend beyond plot axes but are listed as values.
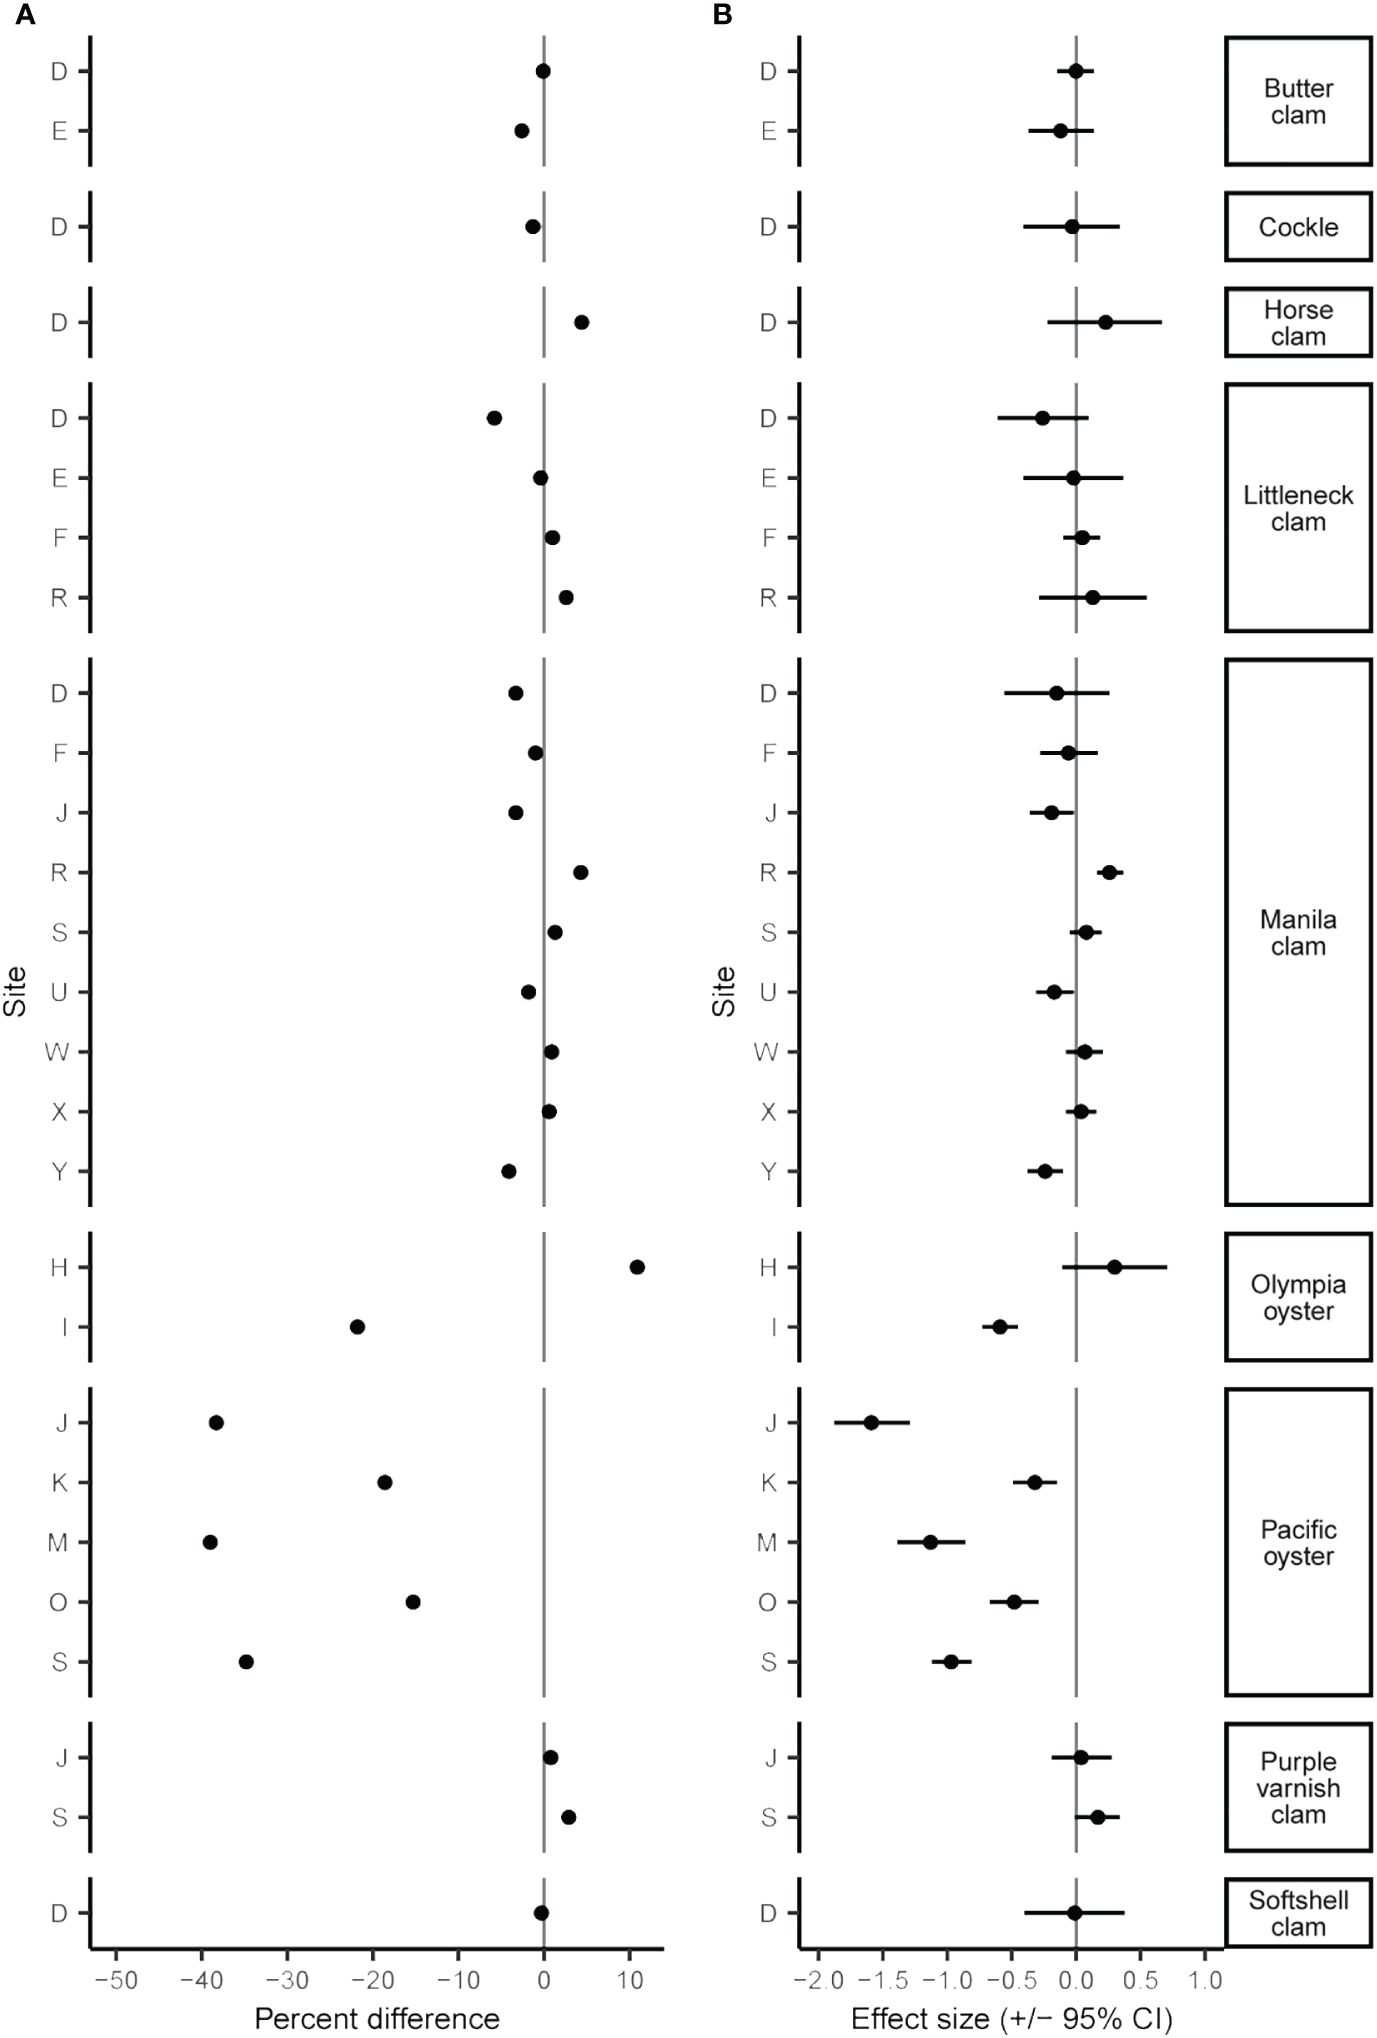
Figure 3 Percent difference (A) and Cohen’s D effect size (+/- 95% CI) (B) of species mean size before and after the June 2021 heatwave.
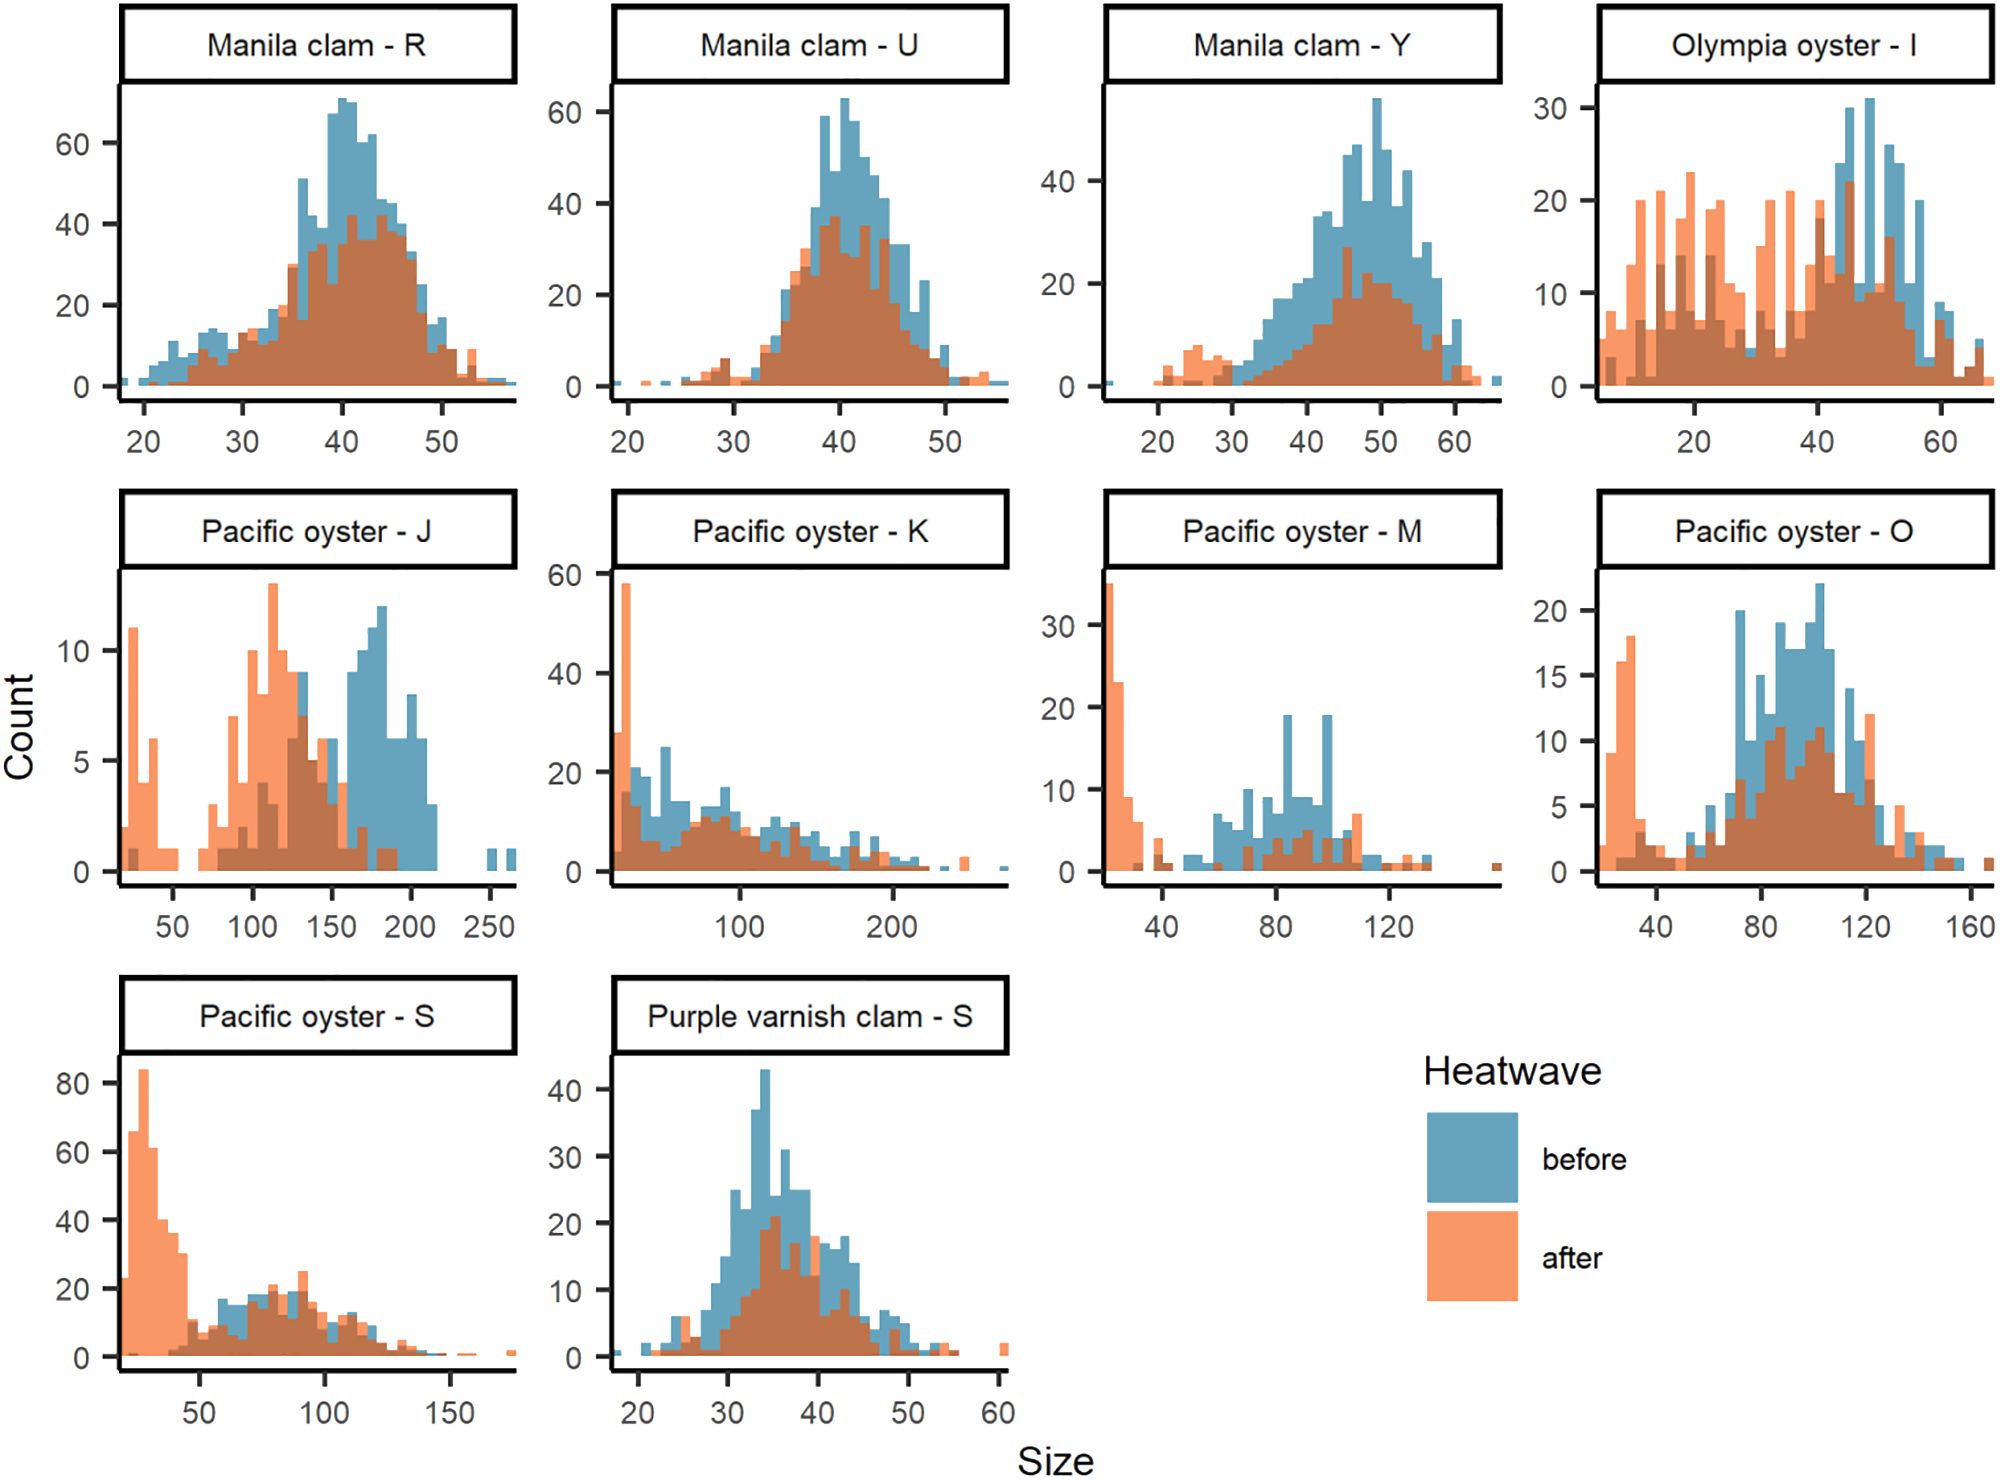
Figure 4 Size-frequency histograms of species - site with significant (KS tests p ≤ 0.05; Supplementary Table S2) difference in size distribution between before (blue) and after (orange) the June 2021 heatwave. Note that figure axes scaled to each data distribution.
3.2 Effects on clams
We found a decrease in clam density at 16 of 27 sites after the heatwave with all sampled species exhibiting declines for at least one site (Figure 2A; Supplementary Table S1). Cockles display the most dramatic declines, with two out of two sites surveyed displaying reduced density after the heatwave with a mean decrease of 44.6%. Manila clams also showed declines in density at seven out of 10 sites with a mean decrease of 22.8%. Conversely, 11 out of 27 sites showed increased clam densities after the heatwave with native littleneck clams exhibiting increases at three out of five sites with a mean increase of 31.6%. While many clam species display seemingly large (> +/- 25%) percent differences in density (Figure 2A), these differences often did not correspond to moderate or large Cohen’s D effect size values (Figure 2B). Only two out of 27 clam B/A survey pairs showed a large effect (effect size > +/- 0.5) of the heatwave, Manila clams at site Y (effect size = -0.6; -0.16 – -1.04 95% CI) and native littleneck clams at site F (effect size = -0.56; -0.1 – -1.01 95% CI), both of which indicate a negative effect.
Clam size declined after the heatwave at 11 out of 20 sites with an overall mean change in size of -0.26% (Figure 3; Supplementary Table S2). In general, effect sizes are small, often near and/or overlapping zero, suggesting little to no effect of the heatwave. However, we did observe four instances of significant changes in size distribution including Manila clams at site R (p < 0.001), U (p = 0.043), and Y (p = 0.009), and purple varnish clams at site S (p = 0.009; Figure 4; Supplementary Table S2). For Manila clams, changes in size distributions and directionality were site-specific. Site R had a significant increase in mean size from 39.6 mm (+/- 6.7 mm SD) to 40.4 mm (+/- 6.3 mm SD) due to a decrease in mostly small (< 30 mm) clams. Site U had a significant reduction in mean size from 40.4 mm (+/- 4.4 mm SD) to 39.7 mm (+/- 4.4 mm SD) due to a decrease in mostly larger (40-50 mm) clams. Site Y had a significant reduction in mean size of 47.1 mm (+/- 7.3 mm SD) to 45.1 mm (+/- 9.6 mm SD) due to an increase in small (< 30 mm) individuals and decrease in nearly all other size classes. Purple varnish clams at site S had a significant increase in mean size from 36.4 mm (+/- 6.0 mm SD) to 37.4 (+/- 6.3 mm SD) due to a decrease in small (< 30 mm) individuals and slight increase in very large individuals (> 50 mm).
3.3 Effects on oysters
Consistent with the clam results, we observed a large range of heatwave effects on the density of Pacific and Olympia oysters spanning -32.4% to 471.6% and -85.0% to 78.6%, respectively (Figure 2A; Supplementary Table S1). Four out of six sites showed increases in Pacific oyster density with a mean increase of 186.5%. Only sites L and S showed decreases in Pacific oyster density. Olympia oysters displayed the opposite pattern with declines in density at six out of nine sites with a mean decrease of 44.5%. Consistent with clams, these seemingly large changes in oyster density did not correspond to moderate or large effect sizes (Figure 2B). Only Pacific oysters at site M showed a large positive effect (effect size = 0.83; 1.3 - 0.35 95% CI), and Olympia oysters at sites L and O showed a large negative effect (effect size = -0.76; -0.2 - -1.31 95% CI and -0.67; -0.3 - -1.04 95% CI, respectively) of the heatwave.
Effects on oyster size were also species- and site-specific. For example, Olympia oysters at site I showed an overall reduction in size (-21.8%) with a large effect size of -0.59 (-0.45 – -0.73 95% CI), whereas site H showed an increase in size (10.9%) with a moderate effect size of 0.30 (0.71 – -0.11 95% CI). All five Pacific oyster sites showed a reduction in size after the heatwave, with a mean decrease of 28.7% with a moderate to large effect size (Figure 3B; Supplementary Table S2); the greatest declines in mean size were at sites J (-38.8%), M (-36.8%), and S (-34.8%). This decline in mean size is further evident by the significant change in Pacific oyster size frequency distributions at all sites (Supplementary Table S2, KS test, p < 0.001). Driving this decline in mean size is a notable shift to smaller size classes (< 50 mm) in the after-heatwave surveys (Figure 4). This demographic shift to smaller-sized Pacific oysters coincided with the large increases in Pacific oyster density described above and may be evidence of a large recruitment event. A similar observation was made for Olympia oysters at site I with the significant change in size distribution (KS test, p < 0.001) largely driven by an increase in the count of smaller (< 40 mm) individuals (Figure 4).
3.4 Variability
Mean values and effect size of clam and oyster densities and size displayed a high degree of variation for many B/A survey pairs, resulting in poor strength of evidence of heatwave effects (Figures 2, 3; Supplementary Tables S1, S2). In some cases, results also varied across relatively small spatial scales. For example, Olympia oyster density at sites C and D (separated by ~1.5 km) displayed opposite patterns, 30.8% decrease and 78.6% increase, respectively, following the heatwave. In contrast, Olympia oyster density at sites G and H (separated by ~300 m) reported similar changes after the heatwave (Figure 2). We suggest that these patterns may reflect the inherent biological and environmental heterogeneity that can be difficult to tease apart from heatwave effects.
Background variability in population estimates was expected and can be attributed to three features of the survey data: (1) duration of time between before and after surveys (i.e., sampling interval), (2) inherent variability of the population, and/or (3) other aspects of inherent variability of the survey design such as sampling area/resolution and seasonality. Our examination of coefficient of variation (CV) helps describe and potentially isolate these features of the data. It is reasonable to assume that the CV of ‘before’ surveys captures the natural variability in the population induced by background environmental and biological factors. The CV of ‘after’ surveys can be assumed to capture variability induced by the 2021 heatwave, plus background environmental and biological factors affecting the population in the time between surveys. As such, B/A survey pairs conducted within a season (i.e., shorter sampling intervals) may be primarily influenced by the heatwave while B/A survey pairs separated by a season or more (i.e., longer sampling intervals) have greater potential for factors beyond the heatwave to influence the population, including management activities such as enhancement and harvest, thereby increasing variability. Our results indicate that in many cases CV was similar between before and after surveys across distinct sample intervals within a species (Figure 5). Exceptions include Pacific oysters before/after survey pairs separated by 10-15 months (sites J, K, M, O, and S) for which there is evidence of a juvenile recruitment event (Figure 4), and Macoma spp. and Manila clams separated by > 25 months at a single site (site D).
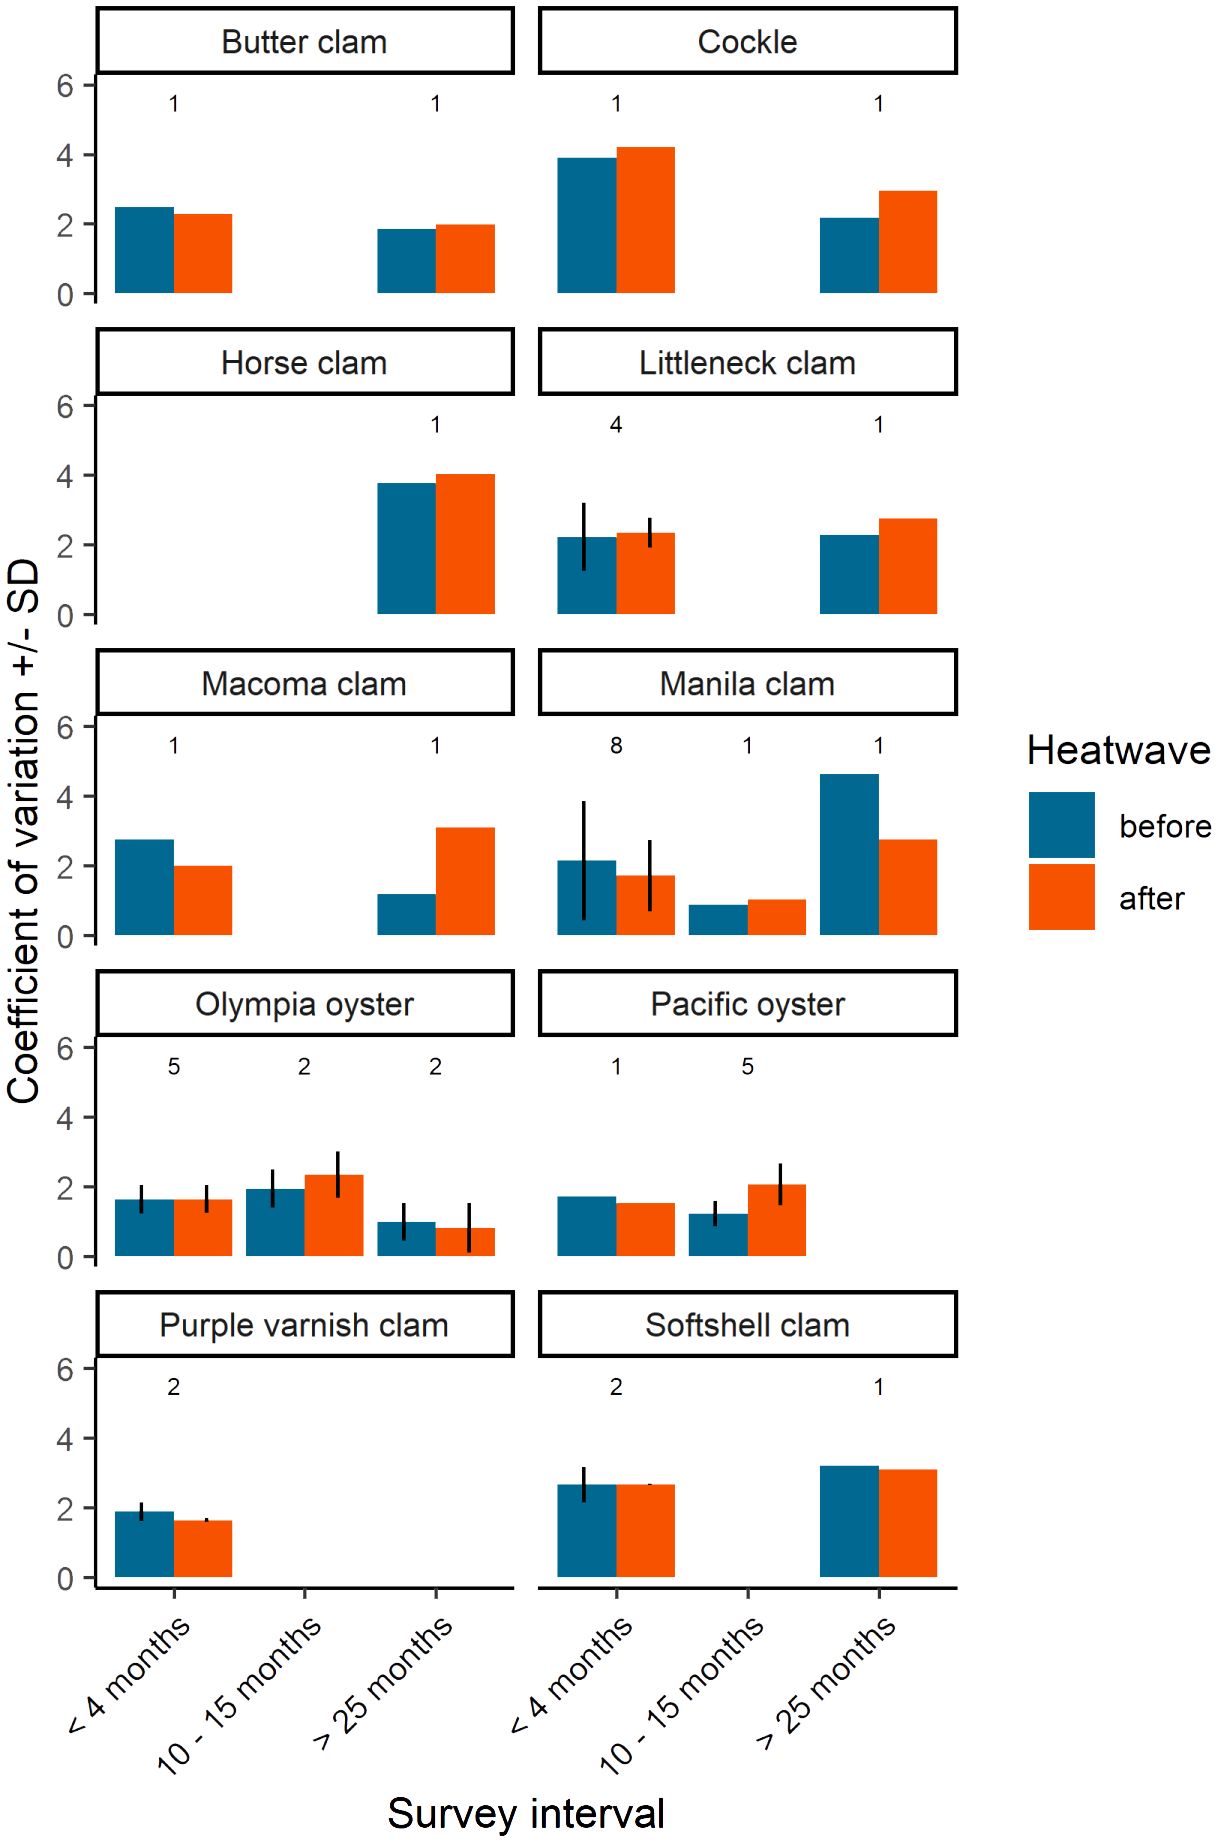
Figure 5 Coefficient of variation of bivalve density by species and sample interval. Sample interval is defined by three discrete groups; before and after samples that were (i) collected within the year 2021 (< 4 months), (ii) before samples collected in 2020 and after samples collected in 2021 (10 - 15 months), and (iii) before samples collected in 2018 or 2019 and after samples in 2021 (> 25 months). Values above each group represent the number of sites used to calculate coefficient of variation. When n > 1, mean and SD is displayed.
4 Discussion
The June 2021 heatwave that spanned much of the Pacific Northwest was an unprecedented weather event that was virtually impossible without the effects of climate change (Philip et al., 2021; White et al., 2023). Using the best available shellfish population dataset in the southern Salish Sea, we found variable and unexpected effects of the heatwave on intertidal bivalve density and size. Among all species and sites examined, we found a wide range of responses including large decreases in density; unexpected increases in density; mostly small changes in mean size; and in some instances, broad shifts in size distribution. High variability in the data complicated our assessment of impacts, often precluding statistical confidence of heatwave effects. While these results provide insight on the effects of the heatwave, more importantly they reveal key features of the available survey data and present a more nuanced picture of heatwave effects compared to observations made immediately after the heatwave (Raymond et al., 2022). As such, we suggest that the most compelling outcome of this work is that current bivalve management surveys, which are designed and perform adequately for estimating biomass of target species on co-managed beaches in the southern Salish Sea, are not the best tool for quantifying the impacts of acute or ‘extreme’ events on bivalve populations at specific sites or across the region. This result highlights the need to examine bivalve, and resource management in general, in new ways to respond to and prepare for the effects of climate change.
4.1 Comparison to initial assessment
Raymond et al. (2022) documented a range of effects of the 2021 heatwave on clam and oyster species in the southern Salish Sea, ranging from unprecedented high mortality to local pockets of resilience for some species. A key finding of this semi-quantitative, rapid assessment was that observed effects of the heatwave appeared to be site- and/or species-specific. Therefore, we expected to find a similar range of effects in this study but anticipated gaining more robust quantitative support of field observations. In some instances, we expected to detect large changes in bivalve density and size distributions with strong statistical support given the dramatic descriptions of mortality at some sites and species in Raymond et al. (2022) and other sources (e.g., WDFW Intertidal Bivalve Program pers. comm., White et al., 2023). While we did find multiple instances of decreased density after the heatwave, very few of these changes had even moderate statistical support (as determined by effect size > ± 0.2 with confidence intervals not overlapping zero). Our analysis also found some changes in mean size and broad shifts in size distribution, but again few instances had even moderate statistical support. Due to constraints with available survey data, this study was not able to test for or detect any geographic patterns of heatwave impacts as observed in Raymond et al. (2022). Those authors hypothesized that region-wide patterns were driven, in-part, by the timing of low tide during the heatwave. While we still consider the timing of the low tide to be an influential factor in heatwave impacts to intertidal bivalves, the spatial range of the data analyzed for this study was limited compared to the broader scope of Raymond et al. (2022) – covering less than 25% of the latitudinal range – and may not have had broad enough coverage to detect such geographic patterns.
Our quantitative analysis did not statistically support the broad scale of negative effects described by local data collectors in Raymond et al. (2022), and further confirmed by some co-managers maintaining site-specific harvest closures or harvest reductions in certain cases due to the conspicuous lack of certain bivalve species (Swinomish Fisheries pers. comm. 2023, Squaxin Fisheries pers. comm 2023). We attribute the lack of statistical support of heatwave effects to the inherent variability in the survey data, which is discussed in detail below, and acknowledge that our results could also be an artifact of having a more limited scope of survey data compared to the broader range of observations in the rapid assessment. This lack of statistical support does not imply that these bivalve species were not physiologically stressed as observations made immediately after the heatwave identified clear and widespread impact to intertidal organisms (Raymond et al., 2022; White et al., 2023) and the current body of research has described both chronic and acute stress of bivalves associated with increased temperature (Masanja et al., 2023 and references therein). Thus, in comparing the results of this quantitative study to that of the Raymond et al. (2022) rapid assessment, it could be concluded that we did not gain an increased understanding of heatwave effects by taking this more in-depth quantitative approach. However, we find it both informative and encouraging that these two distinct assessment approaches provide similar evidence and insights on the highly variable effects of the heatwave event on intertidal bivalves.
4.2 Variability and heatwave effects
Variability in the data was anticipated, however, our findings of large percent changes, particularly in species density, with small associated effect size was an unexpected result. Three types of variability associated with features of the survey data merit discussion in relation to our results: (1) sources of variability associated with the duration of time between before and after surveys (i.e., sampling interval), (2) population-level variability and, (3) sampling error inherent to the survey methods (aside from the time lapse between surveys) such as seasonality, survey area and sampling resolution.
Our analysis of CV among the three different survey intervals found that although several B/A survey pairs were separated by one sampling season or more (≥ 10 months), large shifts in CV were not generally observed. The overall similarity in CV between B/A survey pairs across sample intervals suggests that heatwave effects fall within the expected range of natural variability. However, there are two exceptions, all of which we interpret to be due to factors other than the heatwave: (1) The five Pacific oyster sites surveyed 10-15 months apart, and for Manila clams and Macoma spp. surveyed > 25 months apart at site D (Figure 5) that we believe have plausible explanations. The notable difference in CV among the five Pacific oyster sites surveyed 10-15 months apart can be explained by the demographic shift to greater numbers of smaller individuals in the after survey, likely an indication of seasonal juvenile recruitment (Figure 4). (2) Differences in CV for Manila clams and Macoma spp. surveyed > 25 months apart occurred at the same location, site D. These may be attributed to site-specific variability in population distributions rather than the sample interval. Known enhancement activities have influenced Manila clam distribution at site D resulting in high patchiness and large differences in survey-to-survey variability based on random placement of sample plots. Macoma spp. occupy different habitats than the other clams in this study (Dethier, 2006), and site D has a highly varied beach habitat, so random plot placement may not have consistently sampled Macoma spp. patches from survey-to-survey.
Natural population-level variability and sampling error inherent to the survey methods may interact in ways that skew or obscure our ability to statistically detect changes in the population. Population-level variability in bivalve populations in soft-sediment habitats has been widely described in the Salish Sea and elsewhere (McArdle and Blackwell, 1989; Morrisey et al., 1992; Lima et al., 2000; Dethier, 2006; Beukema and Dekker, 2020) A recent time-series analysis of native bivalve species including cockles (Clinocardium nuttallii), butter clams (Saxidomus gigantea), and native littleneck clams (Leukoma staminea) in the southern Salish Sea indicated that statistically significant changes in bivalve populations may only be detectable at the decadal scale due to natural population variability (Barber et al., 2019). Barber et al. (2019) also found that species-specific changes may be driven by both large-scale (e.g., native clams species exhibiting population synchrony associated with North Pacific Gyre Oscillation) and local factors (e.g., site-specific, population-level responses by cockles). Variability in natural growth rates is an important factor of population-level variability. Differences in growth rates in response to environmental factors including food availability, weather conditions, water quality and flow, beach aspect, tidal elevation and sediment type has been well documented across several species of intertidal clams and oysters (e.g., Bourne and Smith, 1972; Houghton, 1973; Paul and Feder 1973; Ratti, 1978; Goong and Chew, 2001; Beukema et al., 2009; Vânia et al., 2014; Ortega et al., 2016). Such spatial variation in bivalve growth parameters (shell length and weight) is taken into consideration by Washington resource managers when using their allometric relationship to generate clam and oyster biomass estimates for co-managed stocks (Bradbury et al., 2005; Barber et al., 2012). Given the available data and resulting design of our analysis, we were unable to account for how large-scale and local factors influencing bivalve population variability may have interacted with the stress of the heatwave but acknowledge that many bivalve populations included in our analyses exhibited site-specific responses and no synchronous effects were identified.
Sampling error inherent to the survey methodology may also contribute to unaccounted for variability. To be broadly applicable to regional co-managed bivalve resources, population surveys must be standardized. Compromises are therefore made with respect to sampling resolution (spacing of sample plots), population distribution types (e.g., uniform, aggregated), seasonality of surveys, topographic anomalies, and other naturally-occurring sources of variability. Therefore, the standard survey methodology may inadvertently lead to observations of change in a population, or lack thereof, that are artifacts of the survey design itself. For example, the general pattern of low strength of evidence of heatwave effects - effect size - observed here is partially driven by zero/near zero skewed data (Supplementary Figure S1). These zeros are at least a partial artifact of survey design and bivalve population abundance and/or distributions. We recognize that there are geospatial and/or advanced statistical methods that could have been applied to account for this drawback of the survey design; however, such approaches were outside the scope of this study which was to utilize existing co-managed bivalve datasets and apply straightforward quantitative approaches to evaluate the effect of the 2021 heatwave.
Our examination of CV of species density across survey intervals indicates a consistent magnitude of variability for most species and sites examined (Figure 5). This suggests that the population surveys that were opportunistically used in this study of heatwave effects are not prone to large shifts in variability and, therefore, effective for their intended management purpose (i.e., to obtain annual biomass estimates, with known precision, on which to assess a sustainable level of harvest). This finding indicates that factors affecting bivalve populations, including the 2021 heatwave and other environmental and biological factors, either have little effect on the variability of bivalve populations or the effects cannot be resolved with the current data and, by extension, the survey design.
4.3 Next steps and recommendations
Patterns of variability and the data resolution needed for effective management raises broader questions on our understanding of the dynamics of intertidal bivalve populations and application of survey methods, especially in the face of a changing climate. We acknowledge that our opportunistic approach, to use existing co-managed bivalve data to examine the effect of the anomalous 2021 heatwave, was not what the survey method was intended for. Due to the limited capacity of co-managers to complete multiple annual regional surveys, there would have been a novel management benefit if our results demonstrated that existing surveys could also be utilized to detect and quantify effects of acute or extreme events on bivalve resources. However, our analysis revealed that using existing survey methods is problematic due to background variability and challenges the efficacy of these surveys to quantify the effect of acute events. We therefore recommend exploring alternative survey designs and/or analytical methodologies as an important next step. We suggest defining meaningful units of change relevant to objectives, then considering the utility of broad semi-quantitative surveys, fixed reference sites, and focus on metrics of specific concern.
We recommend the following should be considered prior to designing new survey methods in order to maximize utility to the community and/or individuals posing the question. (1) Definition of “change”; i.e., how much environmental and/or biological change is meaningful change? and (2) identifying appropriate timeframes for measuring impacts. It is especially important to note that the definition of meaningful environmental change may vary based on the individual, community, or management entity. For example, a relatively small loss in biomass of a culturally-important bivalve will have a disproportionately large impact on Indigenous communities who are reliant on the species, and often cannot move to unaffected regions, and may be socioeconomically disadvantaged (Lynn et al., 2013; Poe et al., 2016). Alternatively, ecologists may focus on change that is biologically meaningful for the species and/or ecological community (e.g., recruitment success), whereas a shellfish manager may be concerned with effects to total harvestable biomass. Careful consideration must also be given to the frequency and duration upon which sampling occurs to ensure that the change or impact of interest can be detected.
A long-term dataset tracking microbenthic animals, including bivalves, from the Wadden Sea, Netherlands, may offer insight into best practices for detecting acute change in intertidal systems. These, researchers established several permanent sites and transects that are resampled biannually (Beukema and Cadée, 1997; Beukema and Dekker, 2020). By resampling fixed transects twice a year, they remove the variability associated with the systematic random sampling methods deployed in the surveys we analyzed and have been able to pinpoint change in biomass associated with variables such as sea surface temperature and eutrophication (Beukema and Dekker, 2020). Such fixed and repeated sampling approaches are particularly useful for long-term monitoring or conducting before-after-control-impact (BACI) studies where permanent sampling plots or transects are established in areas prior to an acute event or environmental perturbation. These types of study designs are particularly useful for detecting impact or monitoring resilience/recovery.
As with many ecological studies, the need to determine impacts of acute events is not only to determine cause, but to be able to predict impacts to populations due to future events with similar characteristics. However, biological mechanisms can also influence the timeframe of measurable impacts to a particular system. Therefore, individuals designing new quantitative surveys will need to consider that different tools may be needed to detect differential impacts. For example, our study looked directly at change in bivalve density and size following the heatwave. Yet, significant loss of reproductively mature adults during the heatwave may manifest itself as lower recruitment rates the following year and as lower harvestable biomass in the number of years it takes for a particular species to reach an adult size. Future studies could choose to focus on quantifying baseline bivalve recruitment data at selected sentinel sites where permanent sampling locations are established for the sole purpose of measuring interannual recruitment variation.
In Washington State, co-managers and affiliated researchers were engaged throughout the initial semi-quantitative effort (Raymond et al., 2022), and this current quantitative approach for assessing heatwave impacts. This not only provided data and valuable insights on patterns, but also built a diverse network that is now actively addressing how to prepare for documenting the next acute event. In December 2022, co-managers and affiliated researchers met to discuss the draft findings of the analyses presented here. In response, they have formed a rapid response planning team to develop supplemental survey approaches to quantifying the impacts of extreme events on intertidal bivalves. Based on our findings here, and our experiences as researchers and resource managers, a rapid assessment, similar to that of Raymond et al. (2022), may be a useful first approach to help identify when, where, and for what species, appropriate quantitative tools may be applied. Through this analysis and those of Raymond et al. (2022), we found the climate change induced extreme weather events have forced us to consider intertidal bivalve ecology and management in a new light. Moving forward, an adaptive approach may be needed to prepare for and respond to the effects, increased severity, and frequency of extreme weather events. The need for a new approach transcends intertidal bivalves and the Salish Sea to natural resource management worldwide as no ecosystems or socioecological systems will be immune from the effects of a changing climate.
Data availability statement
The datasets presented in this article are not readily available because the data present here come from multiple sources and were used with permission for the purposes of this study. Raw data may be available through a direct request to data contributors. Requests to access the datasets should be directed to Jamestown S’Klallam Tribe - ZXRvYmluQGphbWVzdG93bnRyaWJlLm9yZw==; Jefferson County Marine Resource Committee - bmhhcnJpbmd0b25AamFtZXN0b3dudHJpYmUub3Jn; Port Gamble S’Klallam Tribe - amFzb25oQHBnc3QubnNuLnVz; Puget Sound Restoration Fund - aGlsYXJ5QHJlc3RvcmF0aW9uZnVuZC5vcmc=; Skagit County Marine Resource Committee - cGFkaW5uZWxAYW9sLmNvbQ==; Swinomish Indian Tribal Community - amJhcmJlckBzd2lub21pc2gubnNuLnVz; Squaxin Island Tribe - cmJyb3duQHNxdWF4aW4udXM=; Washington Department of Fish and Wildlife - Y2FtaWxsZS5zcGVja0BkZncud2EuZ292.
Author contributions
WR: Conceptualization, Data curation, Formal analysis, Investigation, Methodology, Project administration, Visualization, Writing – original draft, Writing – review & editing. ET: Conceptualization, Data curation, Funding acquisition, Methodology, Project administration, Writing – original draft, Writing – review & editing. JB: Conceptualization, Methodology, Writing – original draft, Writing – review & editing. HH: Methodology, Writing – original draft, Writing – review & editing. AR: Data curation, Methodology, Writing – review & editing. CS: Writing – review & editing. DR: Writing – review & editing. RB: Writing – review & editing.
Funding
The author(s) declare financial support was received for the research, authorship, and/or publication of this article. This project has been funded wholly or in part by the United States Environmental Protection Agency under assistance agreement #PA-01J64601 to the Jamestown S’Klallam Tribe. The contents of this document do not necessarily reflect the views and policies of the Environmental Protection Agency, nor does the EPA endorse trade names or recommend the use of commercial products mentioned in this document.
Acknowledgments
This project would not have been possible without the time, expertise, and interest of many people and organizations. By its design, this project required the participation and hard work of many contributors to build the dataset. The authors are very grateful for the effort and feedback provided by the data contributors and supporting staff from Jamestown S’Klallam Tribe, Jefferson County Marine Resource Committee, Port Gamble S’Klallam Tribe, Puget Sound Restoration Fund, Skagit County Marine Resource Committee, Swinomish Indian Tribal Community, Squaxin Island Tribe, and Washington Department of Fish and Wildlife. In addition, we would also like to thank the following for their input on the project at various stages: M. Dethier, P. Dinnel, S. McDonald, S. Hines, L. Hunter, J. Jannetta, R. Knapp, N. Harrington, and G. Tarsa.
Conflict of interest
The authors declare that the research was conducted in the absence of any commercial or financial relationships that could be construed as a potential conflict of interest.
Publisher’s note
All claims expressed in this article are solely those of the authors and do not necessarily represent those of their affiliated organizations, or those of the publisher, the editors and the reviewers. Any product that may be evaluated in this article, or claim that may be made by its manufacturer, is not guaranteed or endorsed by the publisher.
Supplementary material
The Supplementary Material for this article can be found online at: https://www.frontiersin.org/articles/10.3389/fmars.2024.1390763/full#supplementary-material
Footnotes
- ^ Shellfish I, 873 F. Supp. 1422, 1430 (W.D. Wash. 1994).
- ^ United States v. Washington, 384 F.Supp. 312 (W.D.Wash. 1974) ("the Boldt Decision"), aff'd, 520 F.2d 676 (9th Cir. 1975).
References
Arnold T. A., Emerson J. W. (2011). Nonparametric goodness-of-fit tests for discrete null distributions. R J. 3, 34–39. doi: 10.32614/RJ-2011-016
Barber J. S., Mitchell T., Gibson J., Hoyopatubbi T., Gobert T., Ferderer A. (2012). Clam population variability within a Puget Sound bivalve management region (La Conner, WA: Swinomish Indian Tribal Community).
Barber J. S., Ruff C. P., McArdle J. T., Hunter L. L., Speck C. A., Rogers D. W., et al. (2019). Intertidal clams exhibit population synchrony across spatial and temporal scales. Limnol Oceanogr 64, S284–S300. doi: 10.1002/lno.11085
Beukema J. J., Cadée G. C. (1997). Local differences in macrozoobenthic response to enhanced food supply caused by mild eutrophication in a Wadden Sea area. Food is only locally a limiting factor. Limnology Oceanography 42, 1424–1435. doi: 10.4319/lo.1997.42.6.1424
Beukema J. J., Dekker R. (2020). Half a century of monitoring macrobenthic animals on tidal flats in the Dutch Wadden Sea. Mar. Ecol. Prog. Ser. 656, 1–18. doi: 10.3354/meps13555
Beukema J. J., Dekker R., Jansen J. M. (2009). Some like it cold: populations of the tellinid bivalve Macoma balthica (L.) suffer in various ways from a warming climate. Mar. Ecol. Prog. Ser. 384, 135–145. doi: 10.3354/meps07952
Bible J. M., Evans T. G., Sanford E. (2020). Differences in induced thermotolerance among populations of Olympia oysters. Comp. Biochem. Physiol. Part A: Mol. Integr. Physiol. 239, 110563. doi: 10.1016/j.cbpa.2019.110563
Blake B., Bradbury A. (2012). Washington Department of Fish and Wildlife plan for rebuilding Olympia oyster (Ostrea lurida) populations in Puget Sound with a historical and contemporary overview (Brinnon Washington USA: Washington Department of Fish and Wildlife).
Bourne N., Smith D. W. (1972). Breeding and growth of the horse clam, Tresus capax (Gould), in southern Brithish Columbia. Proc. Natl. Shellfisheries Assoc. 62, 38–46.
Bradbury A., Blake B., Speck C., Rogers D. (2005). Length-Weight Models for Intertidal Clams in Puget Sound (Bivalve Regions 1, 5, 6, 7, and 8) (Olympia Washington USA: Washington Department of Fish and Wildlife).
Campbell W. W. (1996). Procedures to determine intertidal populations of Protothaca staminea, Tapes philippinarum, and Crassostrea gigas in Hood Canal and Puget Sound, Washington (Brinnon Washington USA: Washington Department of Fish and Wildlife).
Dethier D. M. N. (2006). Native Shellfish in Nearshore Ecosystems of Puget Sound (Seattle, Washington: Army Corps of Engineers).
Domínguez R., Olabarria C., Woodin S. A., Wethey D. S., Peteiro L. G., Macho G., et al. (2021). Contrasting responsiveness of four ecologically and economically important bivalves to simulated heat waves. Mar. Environ. Res. 164, 105229. doi: 10.1016/j.marenvres.2020.105229
Doney S. C., Ruckelshaus M., Emmett Duffy J., Barry J. P., Chan F., English C. A., et al. (2012). Climate change impacts on marine ecosystems. Annu. Rev. Mar. Sci. 4, 11–37. doi: 10.1146/annurev-marine-041911-111611
Dumbauld B. R., Ruesink J. L., Rumrill S. S. (2009). The ecological role of bivalve shellfish aquaculture in the estuarine environment: A review with application to oyster and clam culture in West Coast (USA) estuaries. Aquaculture 290, 196–223. doi: 10.1016/j.aquaculture.2009.02.033
Fousiya A. A., Alberti M., Achyuthan H., Chakraborty S., Watanabe T. K., Gandhi N., et al. (20222022). Anomalous δ18O signal in a giant clam shell (Tridacna maxima) from the Lakshadweep Archipelago, India: signature of thermal stress during a coral bleaching event. Coral Reefs 41, 1173–1185. doi: 10.1007/s00338-022-02263-6
Garibaldi A., Turner N. (2004). Cultural keystone species: implications for ecological conservation and restoration. E&S 9, art1. doi: 10.5751/ES-00669-090301
Gilman S., Hayford H., Craig C., Carrington E. (2015). Body temperatures of an intertidal barnacle and two whelk predators in relation to shore height, solar aspect, and microhabitat. Mar. Ecol. Prog. Ser. 536, 77–88. doi: 10.3354/meps11418
Goong S., Chew K. (2001). Growth of butter clams, Saxidomus giganteus Deshayes, on selected beaches in the State of Washington. J. Shellfish Res. 20, 143–147.
Harley C. (2008). Tidal dynamics, topographic orientation, and temperature-mediated mass mortalities on rocky shores. Mar. Ecol. Prog. Ser. 371, 37–46. doi: 10.3354/meps07711
Harley C. D. G., Randall Hughes A., Hultgren K. M., Miner B. G., Sorte C. J. B., Thornber C. S., et al. (2006). The impacts of climate change in coastal marine systems: Climate change in coastal marine systems. Ecol. Lett. 9, 228–241. doi: 10.1111/j.1461-0248.2005.00871.x
He G., Peng Y., Liu X., Liu Y., Liang J., Xu X., et al. (2022a). Post-responses of intertidal bivalves to recurrent heatwaves. Mar. pollut. Bull. 184, 114223. doi: 10.1016/j.marpolbul.2022.114223
He G., Zou J., Liu X., Liang J., Yang K., Masanja F., et al. (2022b). Assessing the impact of atmospheric heatwaves on intertidal clams. Sci. Total Environ. 841, 156744. doi: 10.1016/j.scitotenv.2022.156744
Helmuth B. (1998). Intertidal mussel microclimates: predicting the body temperature of a sessile invertebrate. Ecol. Monographs. 68:54–71. doi: 10.1890/0012-9615(1998)068[0051:IMMPTB]2.0.CO;2
Helmuth B., Harley C. D. G., Halpin P. M., O’Donnell M., Hofmann G. E., Blanchette C. A. (2002). Climate change and latitudinal patterns of intertidal thermal stress. Science 298, 1015–1017. doi: 10.1126/science.1076814
Hobday A. J., Alexander L. V., Perkins S. E., Smale D. A., Straub S. C., Oliver E. C. J., et al. (2016). A hierarchical approach to defining marine heatwaves. Prog. Oceanography 141, 227–238. doi: 10.1016/j.pocean.2015.12.014
Hochachka P. W., Somero G. N. (2002). Biochemical adaptation: mechanism and process in physiological evolution (Oxford: Oxford university press). doi: 10.1093/oso/9780195117028.001.0001
Houghton J. (1973). The intertidal ecology of Kiket Islandm Washington, with emphasis on age and growth of Protothaca staminea and Saxidomus giganteus (Lamellibranchia: Veneridae) (Seattle, Washington: University of Washington).
IPCC (2021). “Summary for policymakers,” in Climate Change 2021: The Physical Science Basis. Contribution of Working Group I to the Sixth Assessment Report of the Intergovernmental Panel on Climate Change. (Intergovernmental Panel on Climate Change). Available at: https://www.ipcc.ch/report/ar6/wg1/.
Liang J., Masanja F., Li Y., Gou Y., Deng Y., Zhao L. (2024). Hard clam resilience to marine heatwaves in the face of climate change. Front. Mar. Sci. 11. doi: 10.3389/fmars.2024.1382825
Lima M., Brazeiro A., Defeo O. (2000). Population dynamics of the yellow clam Mesodesma mactroides: recruitment variability, density-dependence and stochastic processes. Mar. Ecol. Prog. Ser. 207, 97–108. doi: 10.3354/meps207097
Lynn K., Daigle J., Hoffman J., Lake F., Michelle N., Ranco D., et al. (2013). “The impacts of climate change on tribal traditional foods,” in Climate Change and Indigenous Peoples in the United States. Eds. Maldonado J. K., Colombi B., Pandya R. (Springer International Publishing, Cham), 37–48. doi: 10.1007/978-3-319-05266-3_4
Masanja F., Yang K., Xu Y., He G., Liu X., Xu X., et al. (2023). Impacts of marine heat extremes on bivalves. Front. Mar. Sci. 10. doi: 10.3389/fmars.2023.1159261
McArdle B. H., Blackwell R. G. (1989). Measurement of density variability in the bivalve Chione stutchburyiusing spatial autocorrelation. Mar. Ecol. Prog. Series. 52: 245–252.
Morrisey D., Howitt L., Underwood A., Stark J. (1992). Spatial variation in soft-sediment benthos. Mar. Ecol. Prog. Ser. 81, 197–204. doi: 10.3354/meps081197
Newell R. I. E. (2004). Ecosystem influences of natural and cultivated populations of suspension-feeding bivalve molluscs: A review. J. Shellfish Res. 23, 51–61.
Ortega L., Celentano E., Delgato E., Defeo O. (2016). Climate change influences on abundance, individual size and body abnormalities in a sandy beach clam. Mar. Ecol. Prog. Ser. 545, 203–213. doi: 10.3354/meps11643
Pasparakis C., Davis B. E., Todgham A. E. (2016). Role of sequential low-tide-period conditions on the thermal physiology of summer and winter laboratory-acclimated fingered limpets, Lottia digitalis. Mar. Biol. 163, 23. doi: 10.1007/s00227-015-2779-5
Paul A. J., Feder H. (1973). Growth, recruitment, adn distribution of the littleneck clam, Protothaca staminea in Galena Bay, Prince William Sound, Alaska. Fishery Bull. 71, 665–677.
Perkins S. E., Alexander L. V., Nairn J. R. (2012). Increasing frequency, intensity and duration of observed global heatwaves and warm spells. Geophys. Res. Lett. 39, 2012GL053361. doi: 10.1029/2012GL053361
Philip S. Y., Kew S. F., van Oldenborgh G. J., Anslow F. S., Seneviratne S. I., Vautard R., et al. (2021). Rapid attribution analysis of the extraordinary heatwave on the Pacific Coast of the US and Canada June 2021. Earth system change: Climate scenarios. 13: 1689–1713. doi: 10.5194/esd-2021-90
Poe M. R., Donatuto J., Satterfield T. (2016). Sense of place”: human wellbeing considerations for ecological restoration in puget sound. Coast. Manage. 44, 409–426. doi: 10.1080/08920753.2016.1208037
Point No Point Treaty Council (PNPTC) (1998). Procedures for estimating the biomass and annual harvest rates for intertidal oyster and clam (native littleneck and Manila) populations.
Ratti F. (1978). Reproduction and growth of the Pacific basket-cockle Clinocardium nuttallii Conrad, from intertidal and subtidal environments of Netarts Bay (Corvallis, Oregon: Oregon State University).
Raymond W. W., Barber J. S., Dethier M. N., Hayford H. A., Harley C. D. G., King T. L., et al. (2022). Assessment of the impacts of an unprecedented heatwave on intertidal shellfish of the Salish Sea. Ecology 103, 1–7. doi: 10.1002/ecy.3798
Reeder-Myers L., Braje T. J., Hofman C. A., Elliott Smith E. A., Garland C. J., Grone M., et al. (2022). Indigenous oyster fisheries persisted for millennia and should inform future management. Nat. Commun. 13, 2383. doi: 10.1038/s41467-022-29818-z
Ridlon A. D. (2021). Conservation of marine foundation species: learning from native oyster restoration from California to British Columbia. Estuaries Coasts. 44: 1723–1743. doi: 10.1007/s12237-021-00920-7
Smith R. S., Cheng S. L., Castorani M. C. N. (2023). Meta-analysis of ecosystem services associated with oyster restoration. Conserv. Biol. 37, 1–14. doi: 10.1111/cobi.13966
Sunday J., Bennett J. M., Calosi P., Clusella-Trullas S., Gravel S., Hargreaves A. L., et al. (2019). Thermal tolerance patterns across latitude and elevation. Phil. Trans. R. Soc B 374, 20190036. doi: 10.1098/rstb.2019.0036
Toniello G., Lepofsky D., Lertzman-Lepofsky G., Salomon A. K., Rowell K. (2019). 11,500 y of human–clam relationships provide long-term context for intertidal management in the Salish Sea, British Columbia. Proc. Natl. Acad. Sci. U.S.A. 116, 22106–22114. doi: 10.1073/pnas.1905921116
Torchiano M. (2020). effsize: Efficient Effect Size Computation. Available online at: https://CRAN.R-project.org/package=effsize.
van der Schatte Oliver A., Jones L., Le Vay L., Christie M., Wilson J., Malham S. K. (2018). A global review of the ecosystem services provided by bivalve aquaculture. Rev. Aquaculture 1–23, 3–25. doi: 10.1111/raq.12301
Vânia B., Ullah H., Teixeira C. M., Range P., Erzini K., Leitão F. (2014). Influence of environmental variables and fishing pressure on bivalve fisheries in an inshore lagoon and adjacent nearshore coastal area. Estuaries Coasts 37, 191–205. doi: 10.1007/s12237-013-9658-4
Vázquez E. (2021). Reproduction under stress: acute effect of low salinities and heat waves on reproductive cycle of four ecologically and commercially important bivalves. Front. Mar. Sci. 8. doi: 10.3389/fmars.2021.685282
Vose R. S., Easterling D. R., Kunkel K. E., LeGrange A. N., Wehner M. F. (2017). “Temperature changes in the United States,” in Climate Science Special Report: Fourth National Climate Assessment (U.S. Global Change Research Program, Washington, DC), 185–206. doi: 10.7930/J0N29V45
Keywords: Salish Sea, clam, oyster, thermal stress, resource management, sampling variability
Citation: Raymond WW, Tobin ED, Barber JS, Hayford HA, Raymond AET, Speck CA, Rogers D and Brown R (2024) Short-term effects of an unprecedented heatwave on intertidal bivalve populations: fisheries management surveys provide an incomplete picture. Front. Mar. Sci. 11:1390763. doi: 10.3389/fmars.2024.1390763
Received: 23 February 2024; Accepted: 11 July 2024;
Published: 06 August 2024.
Edited by:
Kwang-Sik Albert Choi, Jeju National University, Republic of KoreaReviewed by:
Hyun-Ki Hong, Gyeongsang National University, Republic of KoreaAasif Mohmad Lone, Indian Institute of Science Education and Research, India
Copyright © 2024 Raymond, Tobin, Barber, Hayford, Raymond, Speck, Rogers and Brown. This is an open-access article distributed under the terms of the Creative Commons Attribution License (CC BY). The use, distribution or reproduction in other forums is permitted, provided the original author(s) and the copyright owner(s) are credited and that the original publication in this journal is cited, in accordance with accepted academic practice. No use, distribution or reproduction is permitted which does not comply with these terms.
*Correspondence: Wendel W. Raymond, d2VuZGVsLnJheW1vbmRAZGZ3LndhLmdvdg==