 Maelle Sevellec
 Anaïs Lacoursière-Roussel
 Eric Normandeau3‡
 Louis Bernatchez
 Kimberly Howland
94% of researchers rate our articles as excellent or good
Learn more about the work of our research integrity team to safeguard the quality of each article we publish.
Find out more
ORIGINAL RESEARCH article
Front. Mar. Sci. , 13 June 2024
Sec. Marine Molecular Biology and Ecology
Volume 11 - 2024 | https://doi.org/10.3389/fmars.2024.1390489
Introduction: Arctic marine ecosystems are changing rapidly, largely due to the observed accelerated warming that is associated with ongoing climate change. Environmental DNA (eDNA) combined with metabarcoding has great potential for large-scale biomonitoring of Arctic marine communities. However, important limitations remain, such as understanding the complexity and drivers of spatio-temporal variation in eDNA distribution.
Methods: In this study, we investigated the effect of tidal dynamics on aquatic metazoan (vertebrates and invertebrates) on eDNA metabarcoding results from nearshore estuarine and marine Arctic ports of Churchill (Manitoba) and Milne Inlet (Nunavut), respectively. We collected and sequenced 54 water samples per port at low, middle and high tide across three days, as well as two depths (surface, bottom), using four universal primer pairs (two primers in the COI gene and two in the 18S rRNA gene).
Results: We observed a significant transition in the estuarine community structure from low to high tide, whereas the marine community structure was more stable across tides. The eDNA community structure differed between the surface and bottom waters in both the estuarine and marine ecosystems. However, the biodiversity pattern within the water column was significantly different between estuarine and marine ecosystems. Finally, we observed short-term temporal variation of the communities in both systems.
Discussion: Altogether, our results highlight the short-term temporal dynamic nature of eDNA derived from coastal communities. This variability should be accounted for in eDNA sampling design to ensure robust characterization of coastal communities and long-term time series, particularly for estuarine environments where the effects of tide and depth are more important.
As with many other ecosystems in the world, the Arctic is facing increasing impacts from both climate change and growing industrial activities (Post et al., 2009). The Arctic is a vast and remote area of over 30 million Km2, with several seas covered entirely by layers of sea ice in winter (Timmermans and Marshall, 2020). Because of extreme climatic conditions, the Arctic ecosystem contains unique but sensitive marine communities, many of which contain species endemic to the region (Udalov et al., 2021). This extreme, and often remote, environment also makes Arctic marine communities logistically difficult to sample (Archambault et al., 2010). Thus, standardized biomonitoring procedures that can easily be applied at large spatio-temporal scales are essential to documenting the rapid changes in Arctic marine communities. Metabarcoding analysis of environmental DNA (eDNA) offers a revolutionary approach to learn as much as possible about these communities and assist in tracking their inevitable change.
Environmental DNA (eDNA) is defined as genetic material originating from organisms (i.e. small whole organisms, feces, skin cells, gametes, body decomposition, etc.) that is present in the environment, such as in the water, soil or air (Deiner et al., 2017). When combined with metagenomic tools, such as high-throughput sequencing (HTS) of PCR amplicons or quantitative real-time polymerase chain reaction (qPCR), eDNA has the ability to greatly enhance our knowledge of biodiversity in a variety of environments, including in coastal marine regions. Three previous studies have evaluated coastal marine communities in the Arctic using eDNA metabarcoding (Lacoursière-Roussel et al., 2018; Leduc et al., 2019; Sevellec et al., 2021). Lacoursière-Roussel et al. (2018) highlighted the potential of eDNA metabarcoding as a monitoring tool in the Arctic and established methods applied in subsequent Arctic studies, including this manuscript. They observed that aquatic metazoan eDNA in Arctic coastal environments show significant temporal and spatial variation at small scales. Leduc et al. (2019) highlighted the potential of eDNA metabarcoding to assess large‐scale Arctic marine invertebrate diversity, showing that eDNA and standard species collection methods should be considered as complementary tools to provide a more complete picture of coastal marine invertebrate communities. Sevellec et al. (2021) highlighted a significant transition from summer to fall marine communities, suggesting the importance of considering more extended seasonal variation in developing guidance for coastal biomonitoring.
Over the past decade, eDNA metabarcoding has become an important tool for molecular biology and ecology (Taberlet et al., 2012; Thomsen and Willerslev, 2015; De Souza et al., 2016; Deiner et al., 2017; Kelly et al., 2019; Laporte et al., 2021; Gaither et al., 2022). For example, it has allowed for non-invasive monitoring of fish community structure and has complemented traditional methods in detecting community structure of smaller organisms like macroinvertebrates, plankton and microphytobenthos (García-Machado et al., 2022; Keck et al., 2022). Furthermore, eDNA metabarcoding has facilitated the detection of invasive, cryptic or rare species that are frequently missed using traditional methods (e.g., Larson et al., 2020; Sepulveda et al., 2020; Gold et al., 2021; Jerde, 2021). Compared to traditional sampling methods, collection of eDNA is relatively easy to implement in marine field settings, requiring only small volumes of seawater and basic equipment. Although use of sterile techniques and some level of training and experience are required, these methods are generally less costly than traditional methods and field collections can more easily be performed at any time, even in winter with ice cover and in a diverse range of locations, such as remote reaches of the Arctic or deep in the mesopelagic zone (Shu et al., 2020).
Despite the great potential of eDNA metabarcoding as a tool for monitoring changes in marine communities, important questions remain regarding the patterns of eDNA temporal and spatial variation. Presence of eDNA in aquatic environments is dependent on multiple factors, such as local environmental conditions and species-specific biotic and abiotic conditions, including water transport dynamics (De Souza et al., 2016; Seymour, 2019; Wood et al., 2021). Understanding the ecology of eDNA, the complex processes that lead to the production, transport and degradation of DNA in aquatic environments, is fundamental to minimize biases in interpreting eDNA-based community composition results (Barnes and Turner, 2016). As with all high-throughput sequencing methods, limitations, such as PCR bias, primers bias and limited reference databases, can also affect the accuracy of biodiversity assignment from eDNA (Goldberg et al., 2016; Kelly et al., 2019). Moreover, variation in field sampling designs among eDNA studies (e.g., water collection at different depths and tides) creates challenges for experimental replication and cross-comparison among studies (Gaither et al., 2022). In the case of marine systems, such as in our study, relatively small amounts of biomass are found in very large volumes of sea water, meaning that eDNA is likely more diluted than in other types of systems (Thomsen et al., 2012). Furthermore, the high salinity of marine environments and the turbidity of estuarine ecosystems could inhibit PCR, reducing the detectability of eDNA (Díaz-Ferguson and Moyer, 2014; Jeunen et al., 2019; Nagarajan et al., 2022).
The highly dynamic nature of marine and estuarine systems also makes detection of eDNA and interpretation more challenging. In both types of ecosystems, the multidirectional and temporally variable water movement, such as tidal influences and currents, leads to complex patterns of eDNA dispersion (Montagna et al., 2013; Goldberg et al., 2016). In estuarine ecosystems, mixing of higher-density sea water with lower-density freshwater from tributaries causes vertical stratification, or layering, in the water column. The depth of the stratification varies with the tide and depends on the volume of fresh versus seawater (Mitra and Zaman, 2016). In marine ecosystems, stratification occurs deeper in the column water and is determined by temperature, salinity and pressure (Li et al., 2020). To our knowledge, no study has evaluated how these differences in tidal dynamics affect the vertical distribution of eDNA in contrasting estuarine and marine environments. However, some studies have specifically investigated how the tide influences the persistence and detection rates of marine surface eDNA (Kelly et al., 2018; Jeunen et al., 2019; Ahn et al., 2020; van Bleijswijk et al., 2020; Lafferty et al., 2021). Likewise, in estuarine ecosystems, a few studies have investigated and observed a significant tidal effect on detected species from eDNA metabarcoding of samples collected at the surface (Ahn et al., 2020; Kume et al., 2021). Thus, considering how the dynamics of the water column alters eDNA metabarcoding results is fundamental to ensure that eDNA can be used properly to characterize ecosystems over short and long-term changes.
This study primarily aims to explore how tidal dynamics influence species detection in eDNA metabarcoding analyses for aquatic metazoan communities within estuarine and marine environments. More precisely, to inform how hydrodynamic conditions alter eDNA detection rates, we contrasted eDNA-derived biodiversity patterns at low, middle and high tides over multiple days and depths in representative Arctic estuarine and marine ecosystems. Based on our findings, we provide a set of guidelines designed to assist in future development of optimal sampling designs in coastal ecosystems.
Environmental DNA samples were collected and processed using field and laboratory protocols developed and applied in previous studies (Lacoursière-Roussel et al., 2018; Leduc et al., 2019; Sevellec et al., 2021).
Two Canadian Arctic ports were used to investigate the effect of tidal dynamics on eDNA detection in contrasting coastal environments. Churchill was historically Canada’s principal port on the Arctic Ocean (Chan et al., 2012), located in a substantial estuary at the mouth of the Churchill River where it enters Hudson Bay (Manitoba, Canada, 58°46′N, 94°11′O). Milne Inlet is a primarily marine port, located at the northern end of Baffin Island (Nunavut, Canada, 72°15′N, 80°30′W) and currently subject to the greatest shipping activity in the Canadian Arctic (Babin et al., 2019; Radtke et al., 2023). Churchill shows characteristics consistent with an estuarine ecosystem whereas Milne Inlet corresponds to a marine habitat as evidenced by representative water quality profiles collected during the various stages of the tide cycle in these two respective ports (Supplementary Figure 1). The tides are semidiurnal in both ports with amplitude ranges of 1.25 m and approximately 1 m in Churchill and Milne Inlet, respectively (Fissel, 1982; Prinsenberg and Freeman, 1986; Kleptsova and Pietrzak, 2018).
Water samples (250 ml each) from both locations were collected in the nearshore subtidal zone (10–20 m depth at chart datum) using a Niskin bottle deployed from a boat. Samples were collected at the surface and ~1 m from the bottom at each of three sites per port during the low, middle and high tides, over three consecutive days (Churchill: August 10 to 12, 2016; Milne Inlet: August 18 to 20, 2017) for a total of 54 water samples for each port (Supplementary Table 1).
Each water sample was filtered within <2 h of collection using a syringe (BD 60 mL, Kranklin Lakes, NJ, USA) equipped with a filter head containing a 0.7 μm glass microfiber filter (Whatman GF/F, 25 mm). Filters were preserved at 4°C in 700 µl of Longmire’s lysis preservation buffer within a 2 mL tube (Wegleitner et al., 2015) and then frozen at -20°C until DNA extraction. To test for background contamination in the field, a negative control (250 mL sterile distilled water) was filtered for every 10 water samples collected (total of N=8). Moreover, to reduce the risk of cross-contamination, individual and sterile sampling kits were used for each sample. These sampling kits, composed of bottles and filter housing sterilized with a 10% bleach solution and new sterilized gloves as well as syringes and tweezers, were bagged and sealed then exposed to UV for 30 minutes following assembly.
Meticulous care was taken to avoid contamination risk during the DNA extraction and library preparation. In brief, (i) eDNA extraction, PCR preparation, and post-PCR steps were performed in three separate rooms; (ii) All PCR manipulations were performed in a UV hood; (iii) samples within a specific port were all treated together but processed in a randomized order; (iv) all laboratory bench space and tools were bleached with a 10% solution and exposed to UV for 30 minutes before performing any manipulations.
DNA from filters was extracted using a QIAshredder and phenol/chloroform protocol as described in Lacoursière-Roussel et al. (2018). Three negative control extractions were performed with 950 µl sterile distilled water [one for every 23 samples (i.e., one batch)] and were treated as normal samples for the remaining manipulations until sequencing.
To maximize detection of biodiversity and reduce experimental biases associated with the PCR primers, four different universal primer pairs were used to amplify the eDNA. Two pairs of mitochondrial cytochrome c oxidase subunit I (COI) primers were used (mlCOIintF/jgHCO2198 and LCO1490/ill_C_R) amplifying 313 bp and 325 bp respectively (Folmer et al., 1994; Geller et al., 2013; Leray et al., 2013; Shokralla et al., 2015). Additionally, two other pairs in the ribosomal 18S gene were also used to amplify eDNA in the V4 region (the primers F-574/R-952 and TAReuk454FWD1/TAReukREV3) which amplify regions of 378 bp and 399 bp respectively (Stoeck et al., 2010; Hadziavdic et al., 2014). The primer genes 18S and COI have been shown to be complementary with respect to types of detected taxa (Zhan et al., 2014; Leduc et al., 2019). They are commonly used together with the goal of detecting large numbers of metazoan taxa present in the sampled environment and helping to reduce the effects of primer bias (Kelly et al., 2017). Details of the eDNA amplification using a one-step dual-indexed PCR approach with Illumina barcoded adapters are provided in Lacoursière-Roussel et al. (2018). Three PCR replicates were done for each sample and primer pair combination. The 12 resulting aliquots were pooled in equal molar concentrations after purification using Ultra AMPure beads and quantification by PicoGreen. Because barcodes were different for each sample, a negative PCR control was performed for each sample and each primer pair. Although PCR negative controls were checked but not sequenced, the 16 negative controls from the field and extraction steps were treated as regular samples and sequenced. Sequencing was carried out for each port separately using two separate Illumina MiSeq runs (Illumina, San Diego, CA, USA) at the Plateforme d’Analyses Génomiques (IBIS, Université Laval, Québec, Canada; www.ibis.ulaval.ca).
Preparation and analysis of the raw sequencing was done using the metabarcoding pipeline Barque version v1.5.2 (www.github.com/enormandeau/barque). Adaptor and primer sequences were first removed, then raw sequencing reads were demultiplexed into individual samples files using the MiSeq Control software v2.3. Raw forward and reverse reads were then quality trimmed and merged using several criteria. Contigs were split following their primer pairs (COI or 18S) then sequences with lengths outside the expected range and chimeric sequences were removed. The SILVA and BOLD databases were used to classify the sequences with a 0.03 cutoff level (http://v3.boldsystems.org/ and https://www.arb-silva.de/). Further details on data cleaning are described in Sevellec et al. (2021).
Sequences from non-marine species (insects, birds and most mammals) as well as those that could not be taxonomically assigned were removed from our dataset (Supplementary Table 2). Moreover, sequences with multiple hit assignment were annotated to the genus level and the species was left as “sp.”. More details about the removal of species and the management of multiple hits are described in Lacoursière-Roussel et al. (2018). Results were highly similar between primers (i.e. COI1 and 2 vs 18S1 and 2; see Supplementary Tables 3, 4). Thus, the sequences were summed between COI1 and COI2 as well as between 18S1 and 18S2 for each taxon within each sample. Hereafter, the terms COI and 18S correspond to the combined gene primers (COI1+COI2 and 18S1 + 18S2, respectively).
Finally, to limit potential bias in the dataset, taxa were removed if the total number of sequences detected in negative controls (field and PCR; N=16) was greater than 2% of the total number of sequences detected across all samples for a given genus or species (Leduc et al., 2019; Sevellec et al., 2021). Thus, we removed ten (18S) and five (COI) genera as well as eight (18S) and six (COI) species from the remaining analyses for both ports (Supplementary Table 5). Furthermore, for both gene primers, one sample from Milne Inlet and one sample from Churchill with no final annotated marine sequences were removed from the data set.
All analyses were performed with the combined sequences for the four gene primers (18S and COI) to document the change in eDNA metabarcoding based on: (i) tides, (ii) depth in the water column, (iii) daily temporal variation (iv) and interactions between these factors in two different ports (Churchill and Milne Inlet) representing contrasting coastal ecosystems (estuary and marine). The analyses were done with the vegan R package in R studio (Dixon, 2003) using the genus or species level matrix with two different statistical transformations: the Hellinger transformation (abundance score) and presence-absence transformation (presence/absence score) (Legendre and Gallagher, 2001). Although the eDNA abundance may be ascertained with a metabarcoding approach, the comparison between abundance and presence/absence scores can provide some reliable relative abundance score results (Deiner et al., 2017). PERMANOVAs (number of permutations = 10,000) were performed on the eDNA communities at the genus level. To document the variation in dominant detection rates among the low, middle and high tides, pie charts based on relative abundance were generated for both ports. The diversity based on inverse Simpson index and richness (number of species) was generated from the genus matrix with Hellinger transformation. These biodiversity indices were then sorted and plotted according to the tide, water column depth and day for comparison between ports. We also used a generalized linear model (GLM) with a Gaussian distribution followed by analysis of variance (ANOVA; number of permutations = 999) to test for differences in inverse Simpson index among the above-described groups. Similarly, a simple ANOVA (number of permutations = 999) was performed to compare richness among these groups.
To investigate the ecological status of species observed in both port ecosystems, taxa were classified as holoplanktonic or meroplanktonic, freshwater or marine mammals. Histograms were then constructed from abundance scores with a Hellinger transformation for each tide, sampling depth and days. Canonical correspondence analysis (CCA) was used to illustrate the correlation between environmental factors (temperature, salinity and pH) and detected eDNA communities for each port. CCA graphics were generated using presence-absence and Hellinger scores at the genus level which were plotted according to tide and depths for each port and gene primers. ANOVAs were performed on the environmental variables (number of permutations = 999) in R to test for correlations between environmental factors and eDNA communities. Finally, balanced accumulation curves, based on randomized subsampling, were used to estimate the change in rate of detection at the genus level depending on the number of sampling days, sampling depth and different tide levels using the BiodiversityR package and the function “balanced.specaccum” (Kindt and Coe, 2005).
A total of 10 145 830 sequences were obtained after trimming the raw data set (Supplementary Table 2) composed of 53 coastal eDNA samples each for the ports of Churchill and Milne Inlet. For both ports, although the genus accumulation curves for the 18S gene primers were at the end of the semilog curve, the accumulation curves for COI reached a plateau (Supplementary Figure 2).
In the estuarine ecosystem of Churchill Port, the community structures were distinct among the low, middle and high tides (PERMANOVA, P < 0.001 for both gene primers; Table 1). A greater number of freshwater taxa was observed at low tide (Figure 1; Supplementary Figure 3); among the fifteen most detected taxa, six (18S) and seven (COI) freshwater species were observed at low tide, whereas none (18S: Supplementary Figure 3) and two (COI: Figure 1) freshwater species were found at high tide. The dominant detected species were also different among tides. At low tide, the annelid Pectinaria granulata as well as the copepods Pseudocalanus newmani and Pseudocalanus acuspes were more represented, whereas the annelids Pectinaria hyperborea and Galathowenias oculata as well as the barnacle Balanus sp. were more detected at high tide. Among the dominant species detected at middle tide, some were observed in both high and low tide suggesting that the middle tide has an intermediary community structure. In the marine ecosystem (i.e., Milne Inlet Port), minimal influence of the tide was observed (PERMANOVA, 18S P=0.028, COI P=0.311; Table 1) and no freshwater species were detected (Figure 1; Supplementary Figure 3). Moreover, the variation in species composition among tides was less pronounced (Figure 1; Supplementary Figure 3). The relative abundance of the annelid Pectinaria granulata and the copepod Pseudocalanus minutus decreased from low tide to high tide, whereas the opposite pattern was observed for the bivalve Mytilus trossulus. Interestingly, for both ports and genes, no differences in species richness (number of species) and diversity indices (inverse of Simpson’s index) were observed among tides (Figure 2; Table 2).
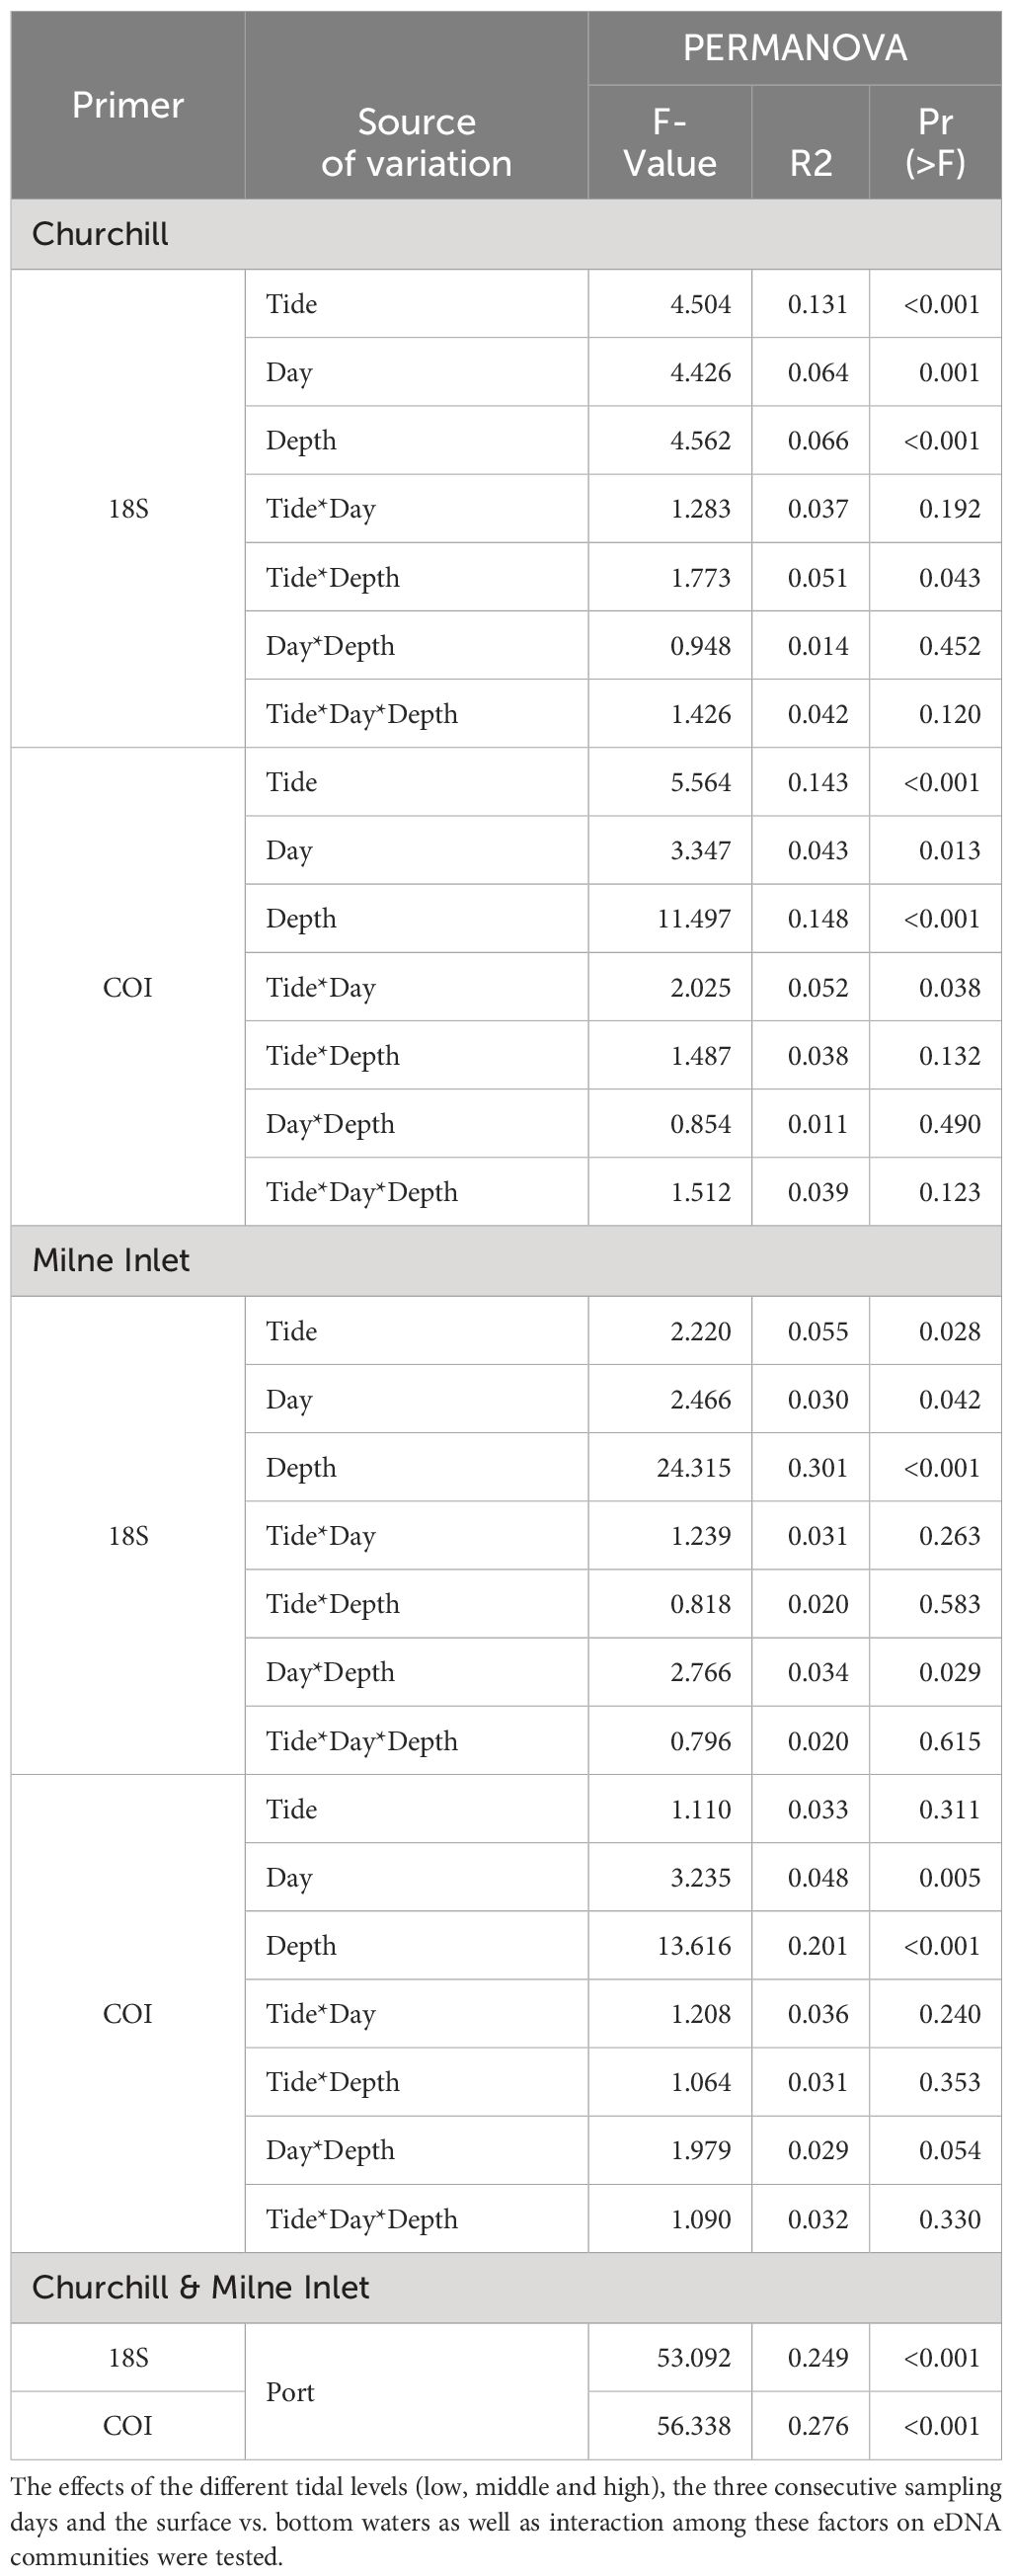
Table 1 Summary of PERMANOVA test statistics for two Arctic ports (Churchill and Milne Inlet) based on presence/absence of aquatic metazoan eDNA with two combined gene primers 18S and COI: F-574- R-952 (18S1), TAReuk454FWD1- TAReukREV3 (18S2), mlCOIintF-jgHCO2198 (COI1), LCO1490-ill_C_R (COI2).
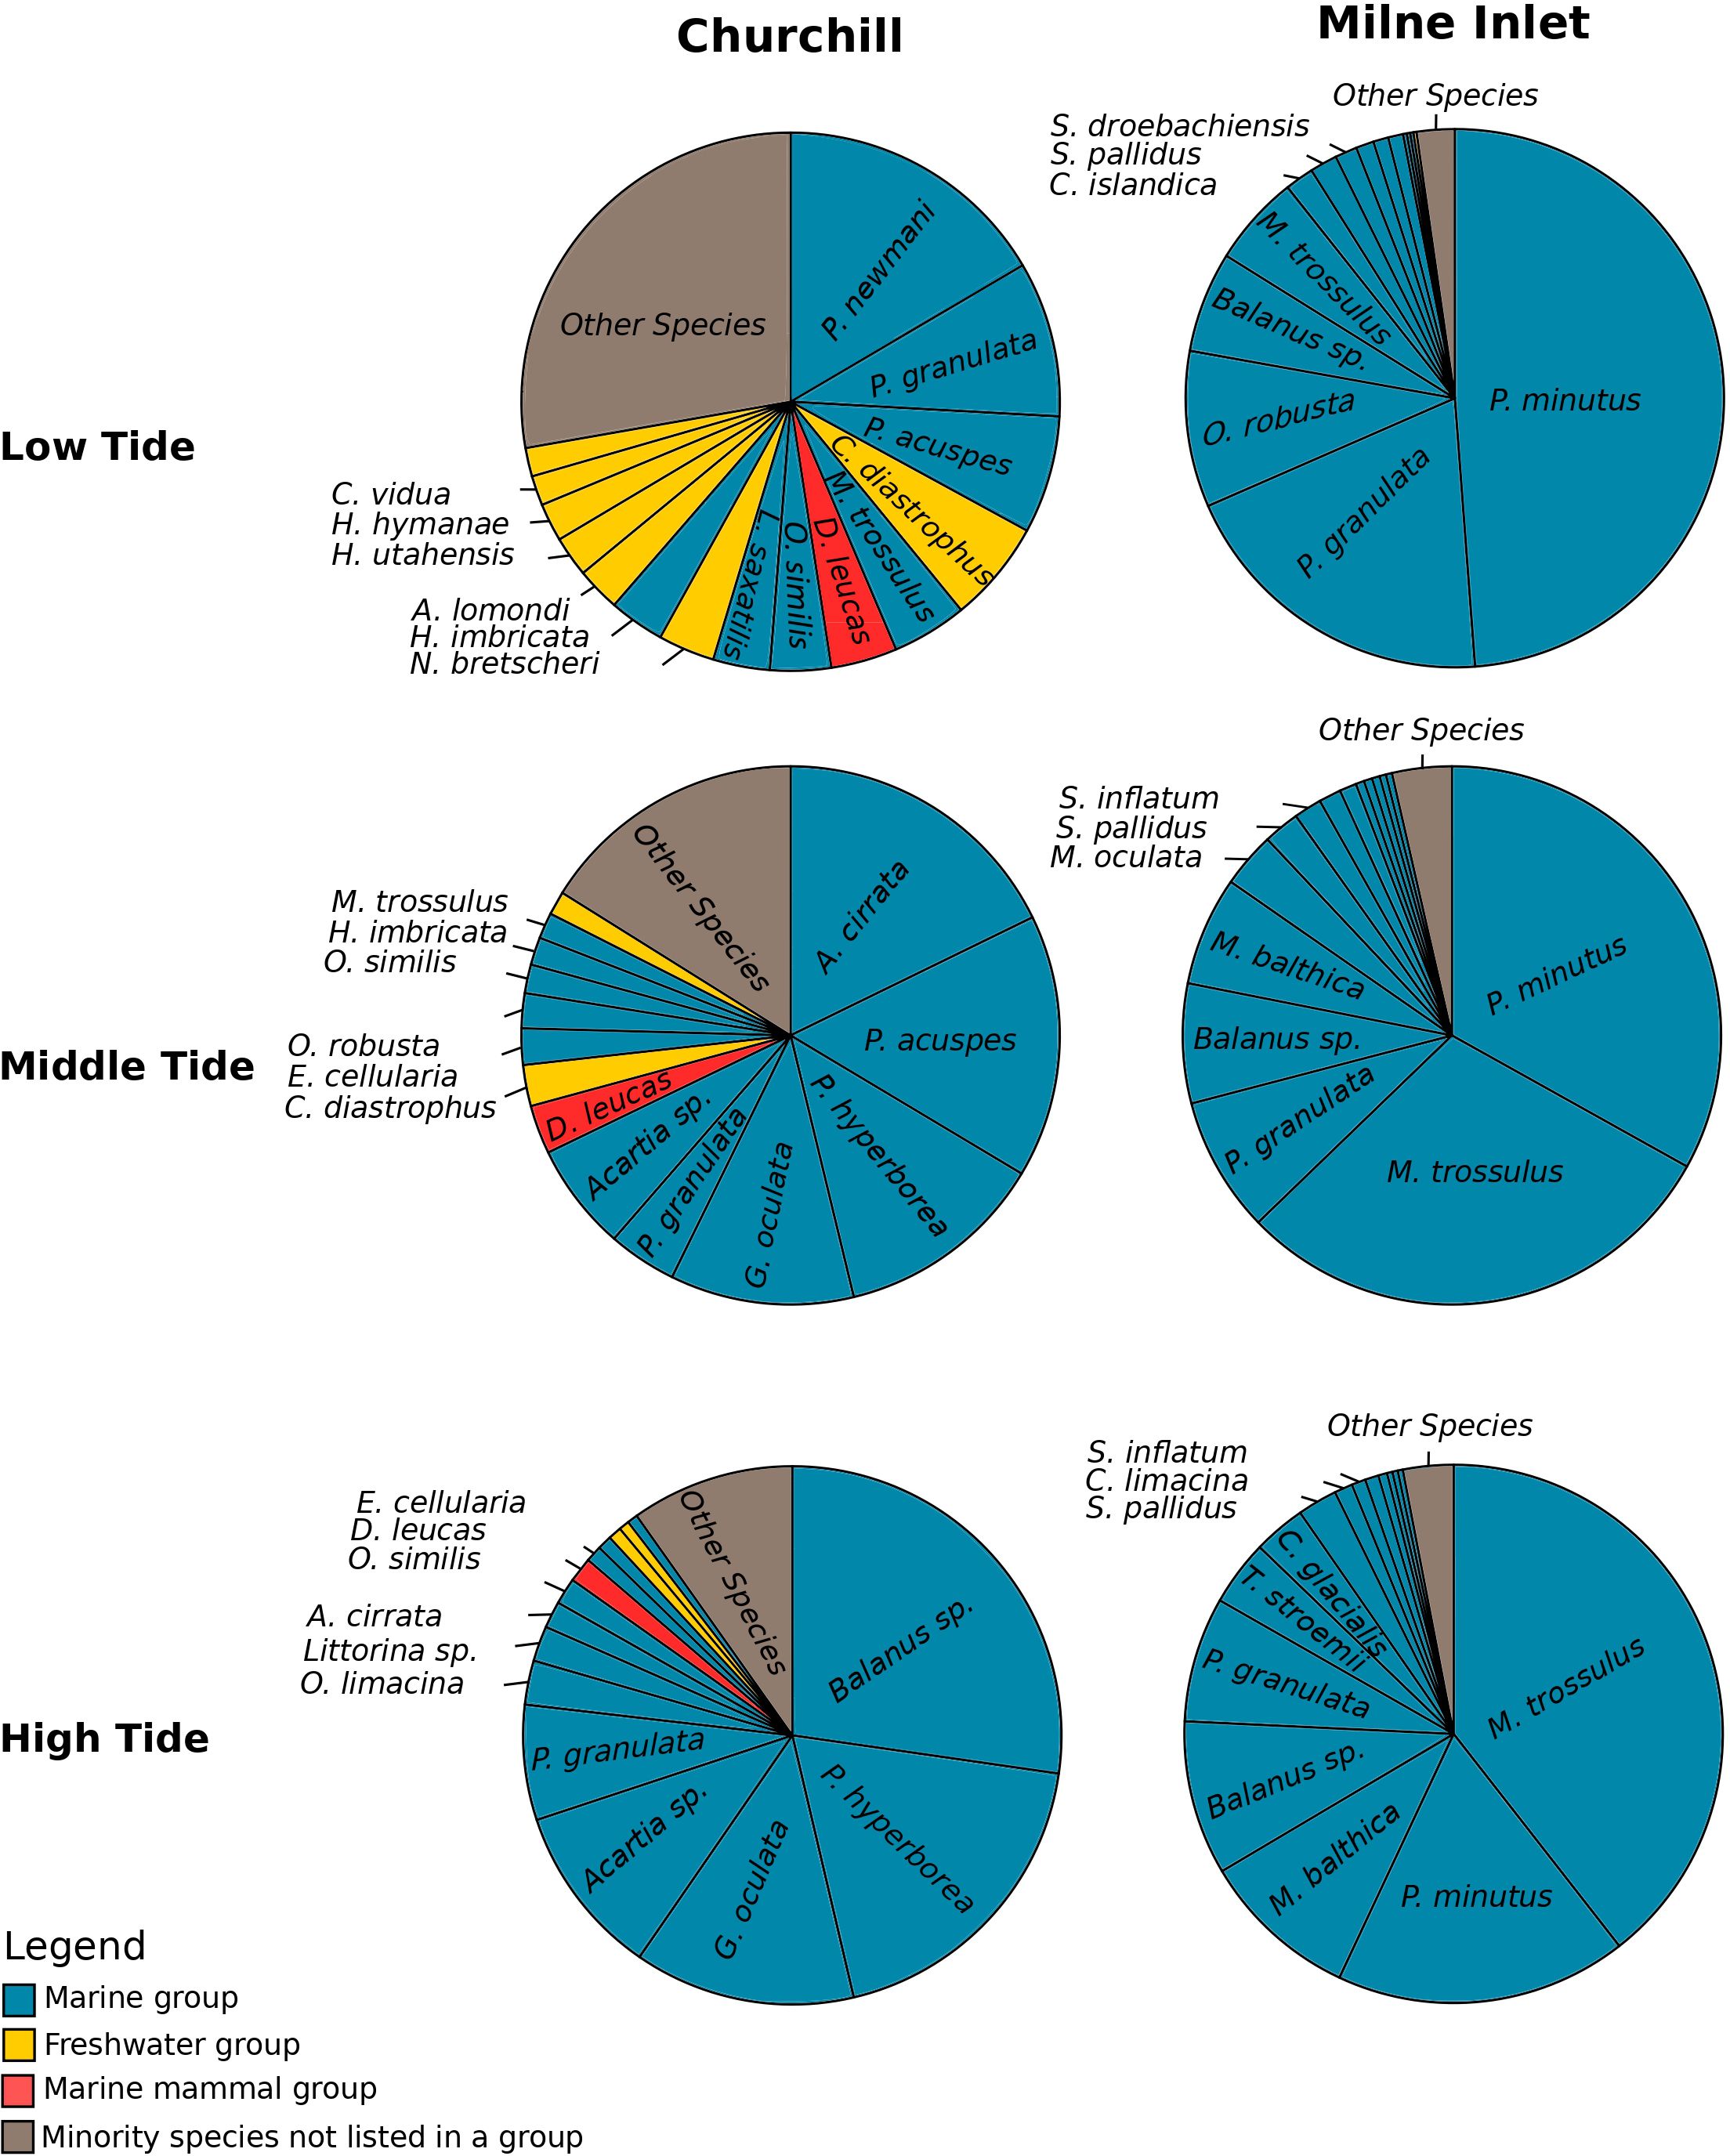
Figure 1 Relative abundance of species according to the tide variation in both the Arctic ports (Churchill and Milne Inlet) with the combined gene primers for COI (see legend Table 1). The most represented species with a high relative abundance were classified into four groups. Benthic and planktonic marine species as well as brackish species were listed in the marine group. Mammals living in seawater were classified in the marine mammal group. The most represented species from freshwater were classified in the freshwater group, while species with a low relative abundance were listed in the “other species” group and may belong to any one of the three groups. An equivalent analysis was done with the combined gene primers 18S (see Supplementary Figure 3).
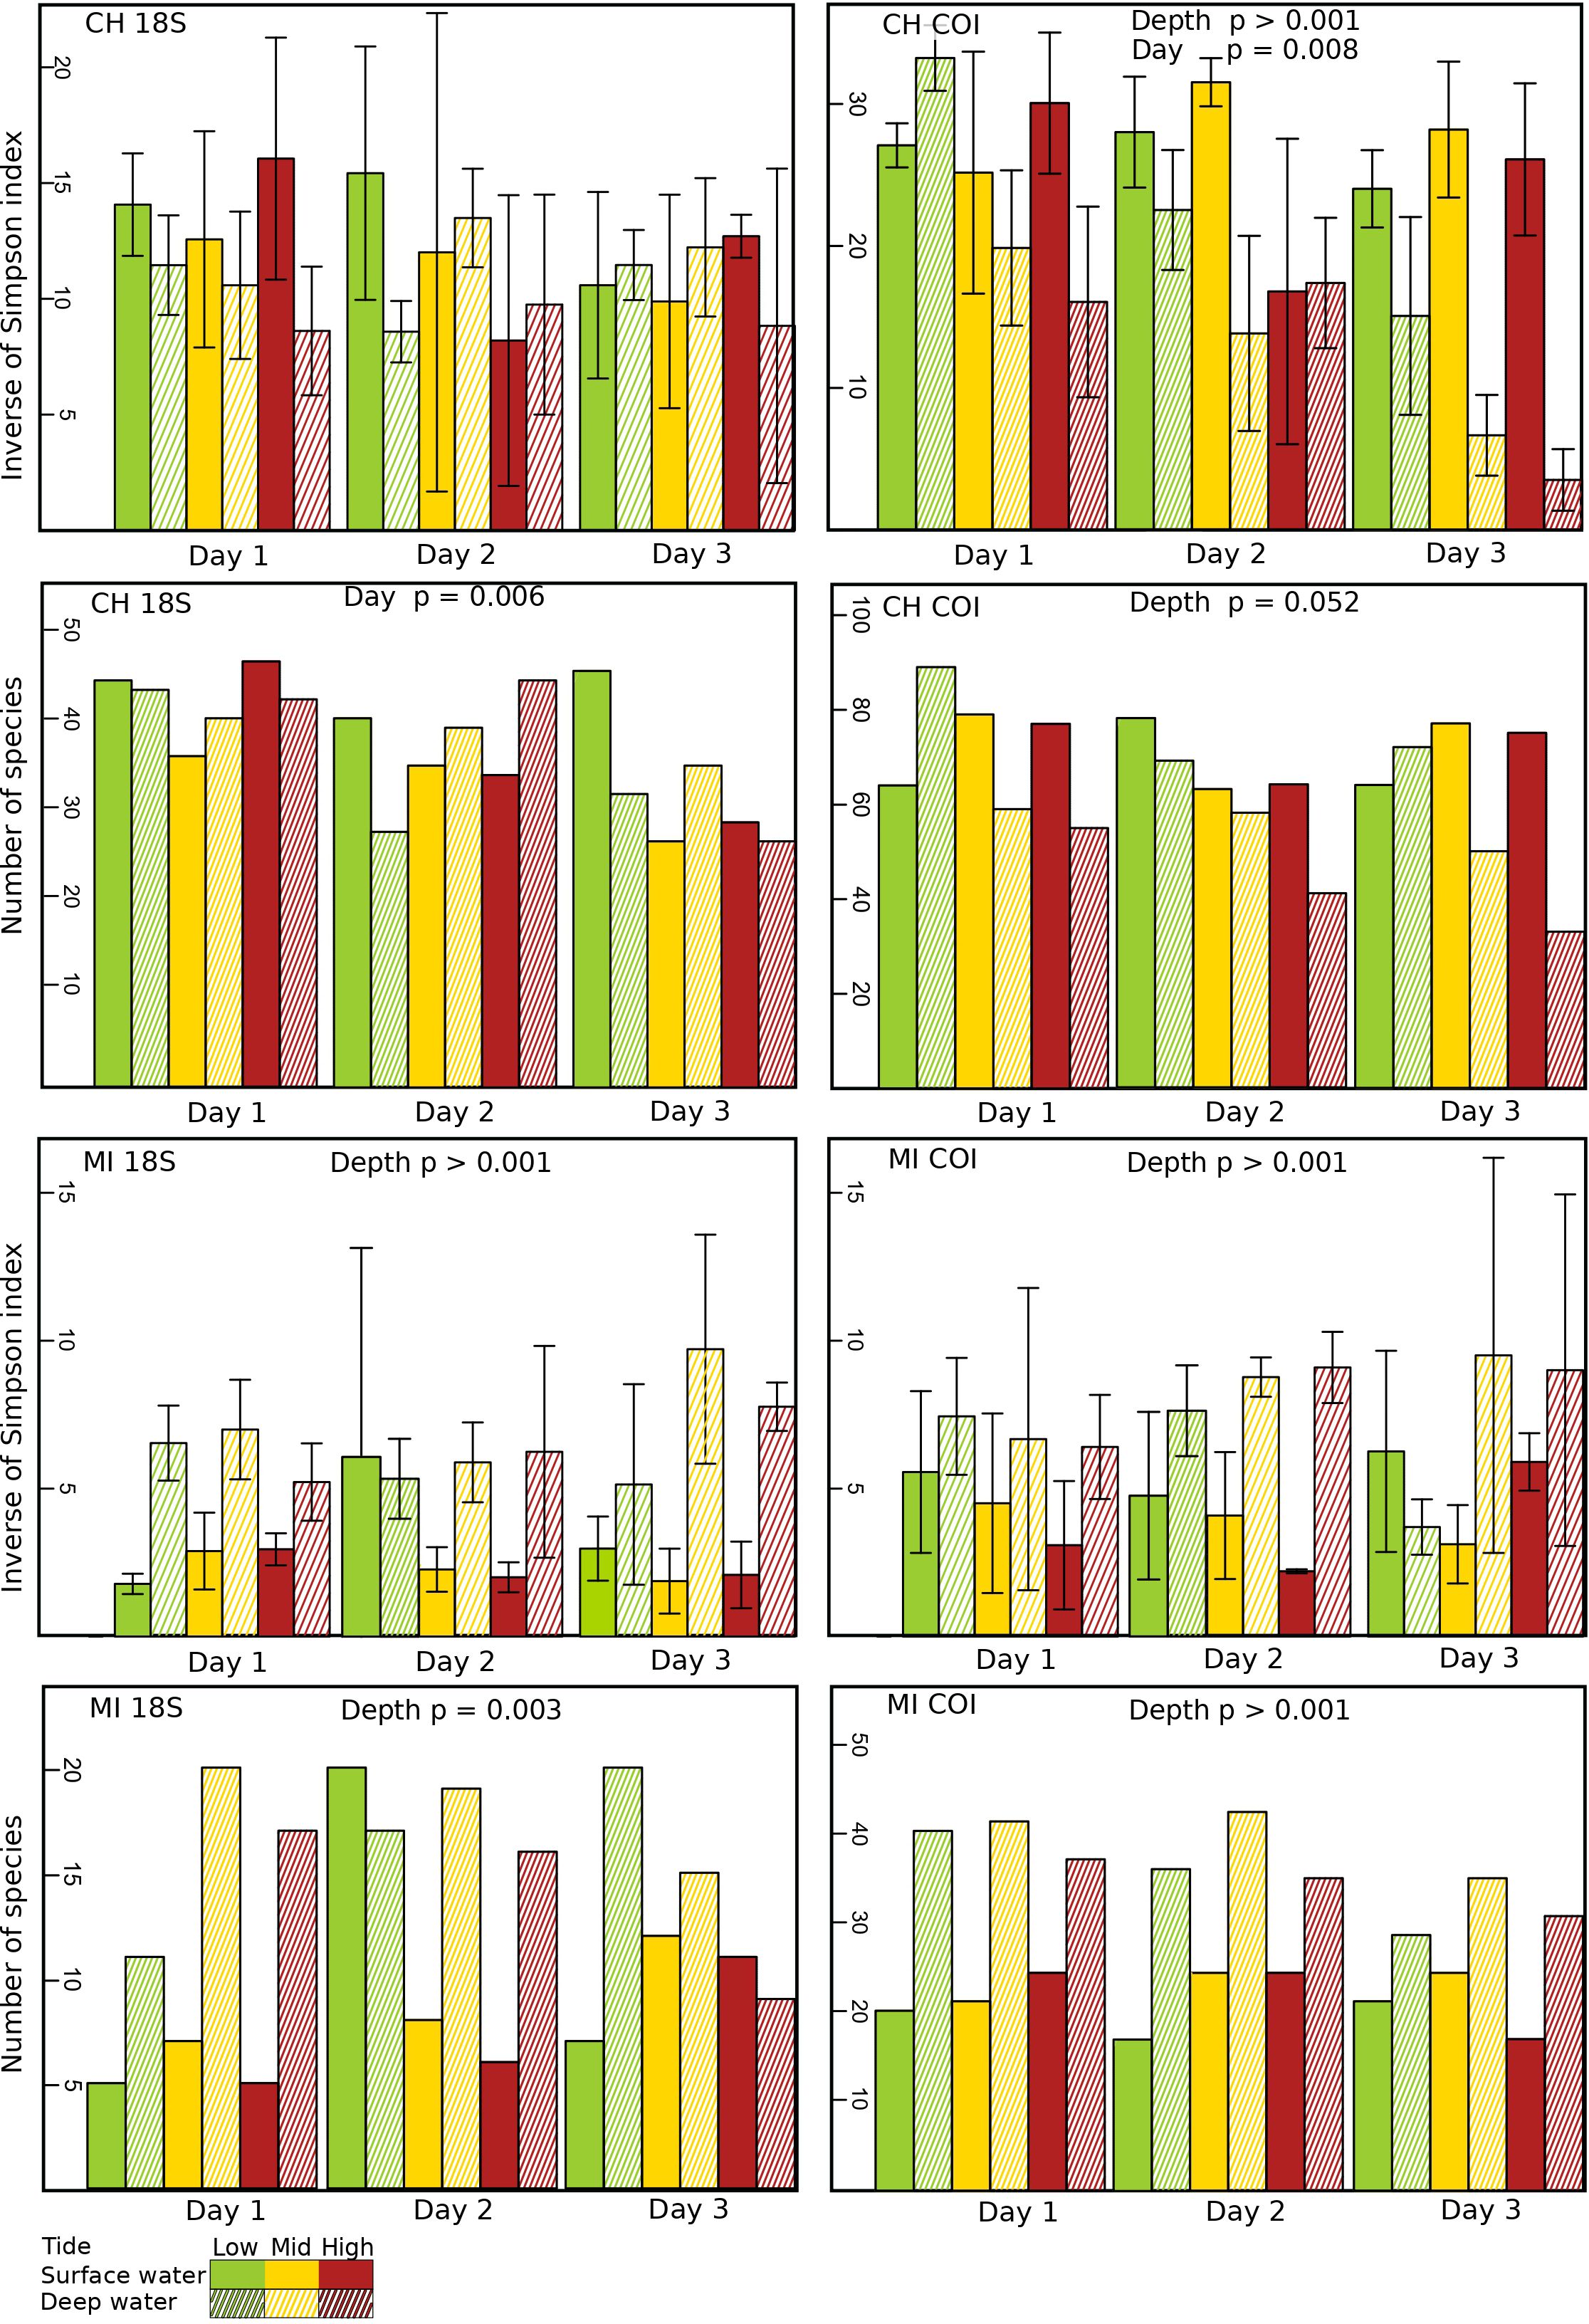
Figure 2 Diversity (Inverse of Simpson index) and richness (number of species) of eDNA marine coastal communities at different tidal levels [high (red), mid (yellow) and low (green)] and depths [surface waters (no cross-hatching) and bottom waters (cross-hatching)] in the ports of Churchill (CH) and Milne Inlet (MI), based on two combined gene primers for 18S and COI (see legend Table 1).
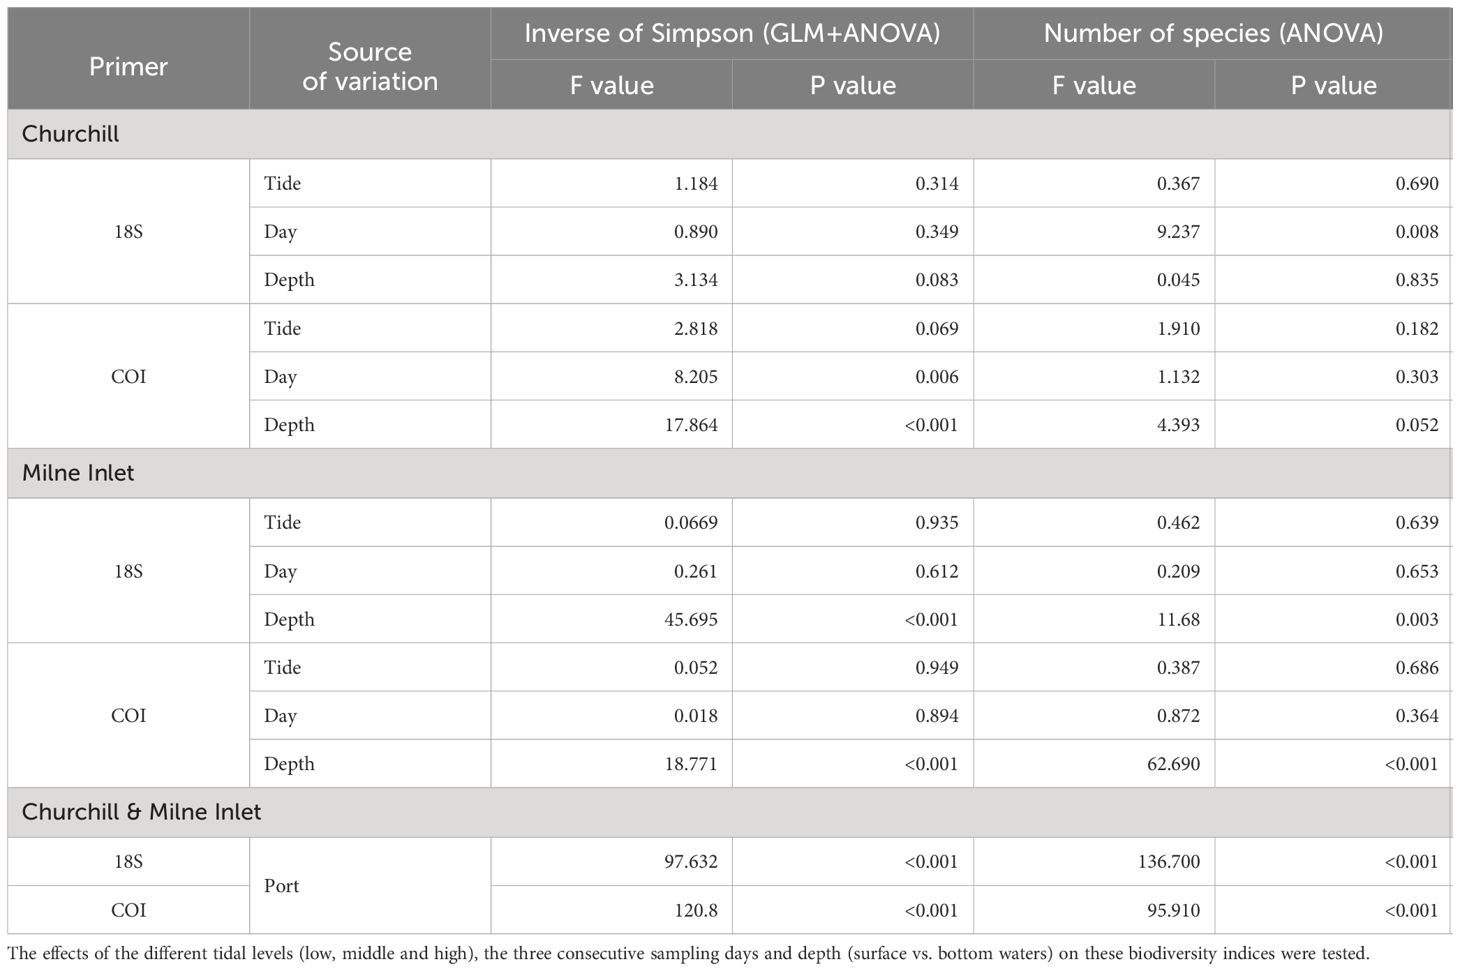
Table 2 Summary of GLM and ANOVA results for the Inverse of Simpson index and ANOVA results on the number of species of aquatic metazoans in both the Arctic ports (Churchill and Milne Inlet) with combined genes (18S and COI; see legend Table 1).
Both, the eDNA community structure and biodiversity indices differed between the surface and bottom of the water column in both the estuarine and marine ecosystem with both gene primers (PERMANOVA tide effect, P <0.001; Table 1). Benthic and holoplanktonic taxa were more frequently detected in bottom waters as compared to surface waters in both ports and with both primer pairs (Figure 3). In the marine system (i.e., Milne Inlet), the diversity and richness were higher in bottom waters as compared to surface waters (Figure 2; Depth effect on diversity COI/18S P<0.001, richness COI P<0.001 and 18S P=0.003, Table 2) with generally higher detected biodiversity in bottom waters during the middle tide (Figure 2). In the estuarine ecosystem (i.e., Churchill), although no difference in the inverse Simpson index was found between the surface and bottom waters with the 18S primers, differences were observed with the COI gene primers (GLM + ANOVA, p < 0.001; Table 2). Overall, diversity and number of species in the estuarine system tended to be higher in the surface as compared to bottom waters (Figure 2). Moreover, in the estuarine ecosystem, the relative abundance of freshwater taxa was greater in the surface waters with both gene primers (Figure 3).
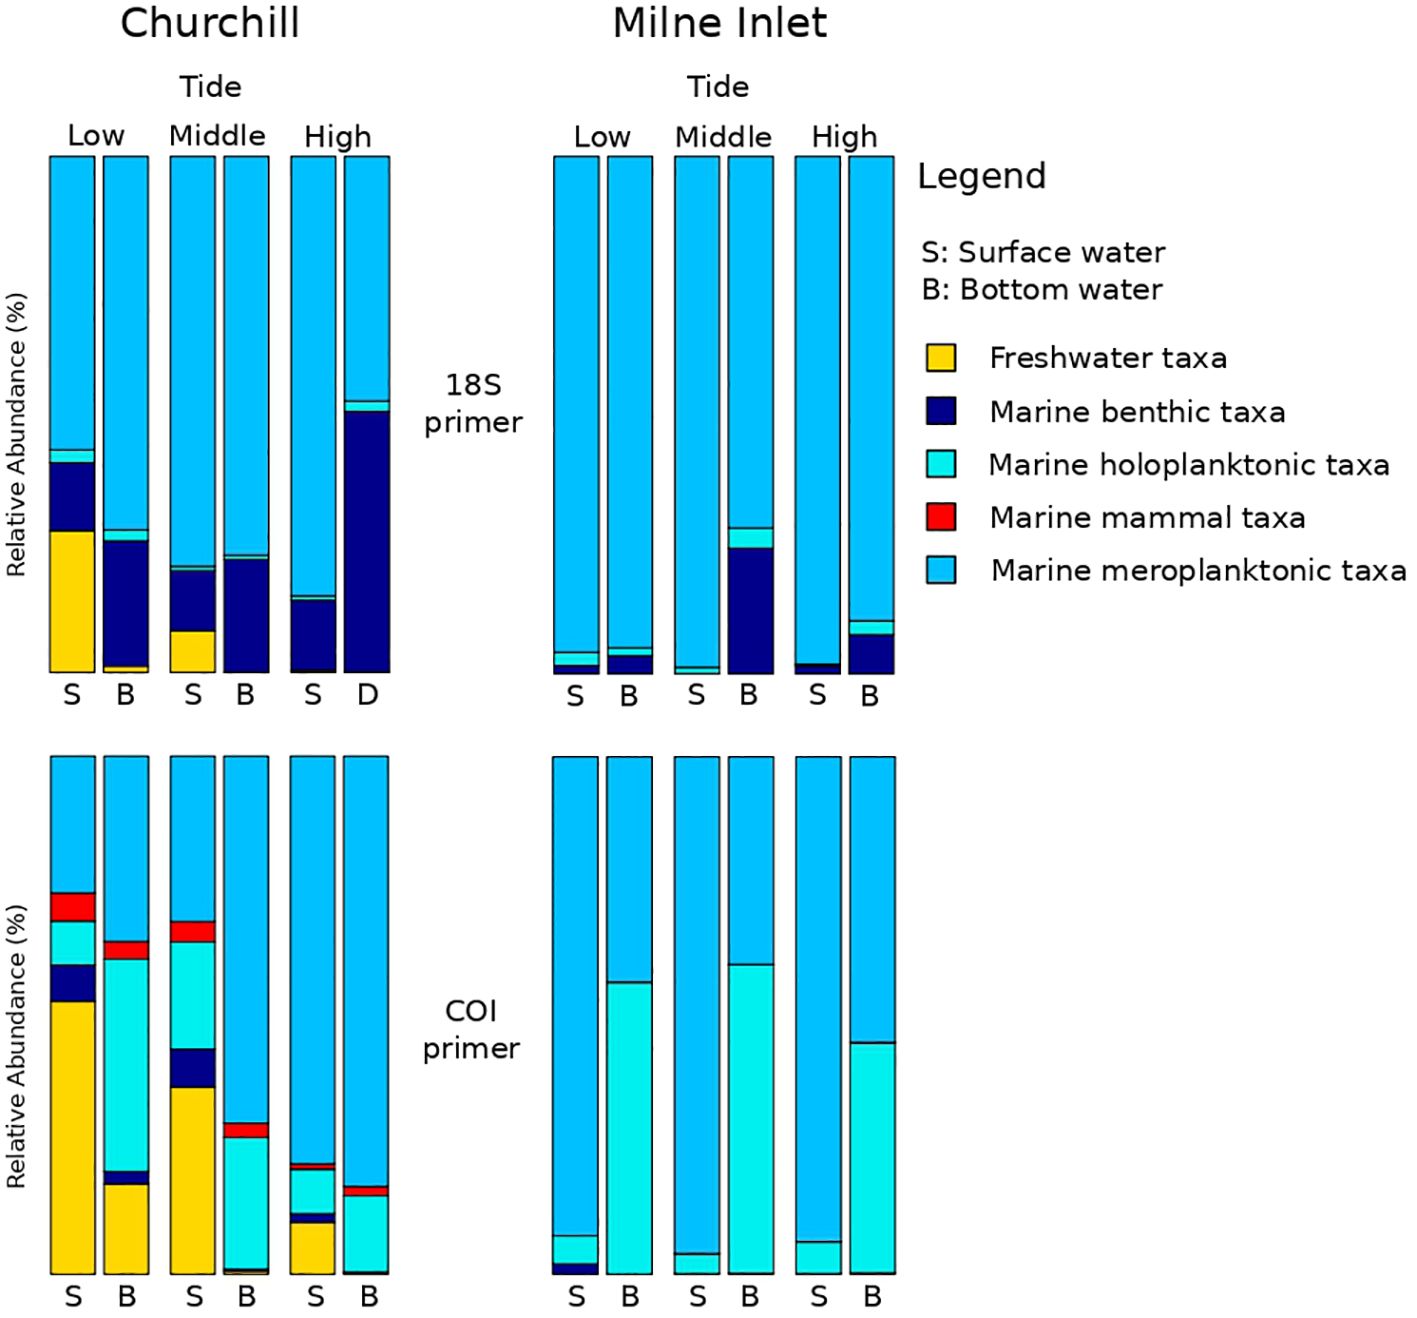
Figure 3 eDNA investigation of the ecologic status all along the tide variation. Sampling took place over three days in two Arctic ports: Churchill and Milne Inlet at two different depths. This figure presents the combined results of gene primers for 18S and COI (see legend Table 1).
Significant daily variation in the community structure was observed in both estuarine and marine ecosystems (PERMANOVA, CH 18S P=0.001, CH COI P=0.013 and MI 18S P=0.042, MI COI P=0.005; Table 1). Although the relative abundance of the different ecological groups varied among days (Figure 3), indices of diversity and richness remained stable among days, however, overall, both were greater in Churchill than in Milne Inlet (Figure 2; Table 2).
Canonical correspondence analysis (CCA) highlighted three distinct clusters representing the different tides in the estuarine ecosystem (i.e., Churchill) using both gene primers (Figure 4; Supplementary Figure 4). These clusters followed a trend of continuity from low tide to high tide in both surface and bottom waters. In surface waters, low and middle tide community structure, were generally associated with higher water temperatures (and lower salinities), whereas high tide communities were associated with greater salinities (and somewhat lower temperatures) for both genes (COI: Figure 4, Table 3; 18S: Supplementary Figure 4; Supplementary Table 6). In contrast, in bottom waters, higher temperatures (and lower salinities) were only associated with low tide community structure (with COI only; Table 3), while greater salinity and bottom depth (and lower water temperatures) were strongly associated with middle and high tide community structure, respectively. Unlike temperature and salinity, the pH factor did not have a significant effect on community structure. In the marine ecosystem (i.e., Milne Inlet), there were no distinct clusters according to the tide and no correlation with local environmental factors was observed in surface water (COI: Figure 4; Table 3; 18S: Supplementary Figure 4; Supplementary Table 6). In bottom waters, there was a slight significant correlation of salinity and the temperature with community structure (with COI only; Table 3), but these correlations were not linked to any distinct clusters by tide (COI: Figure 4).
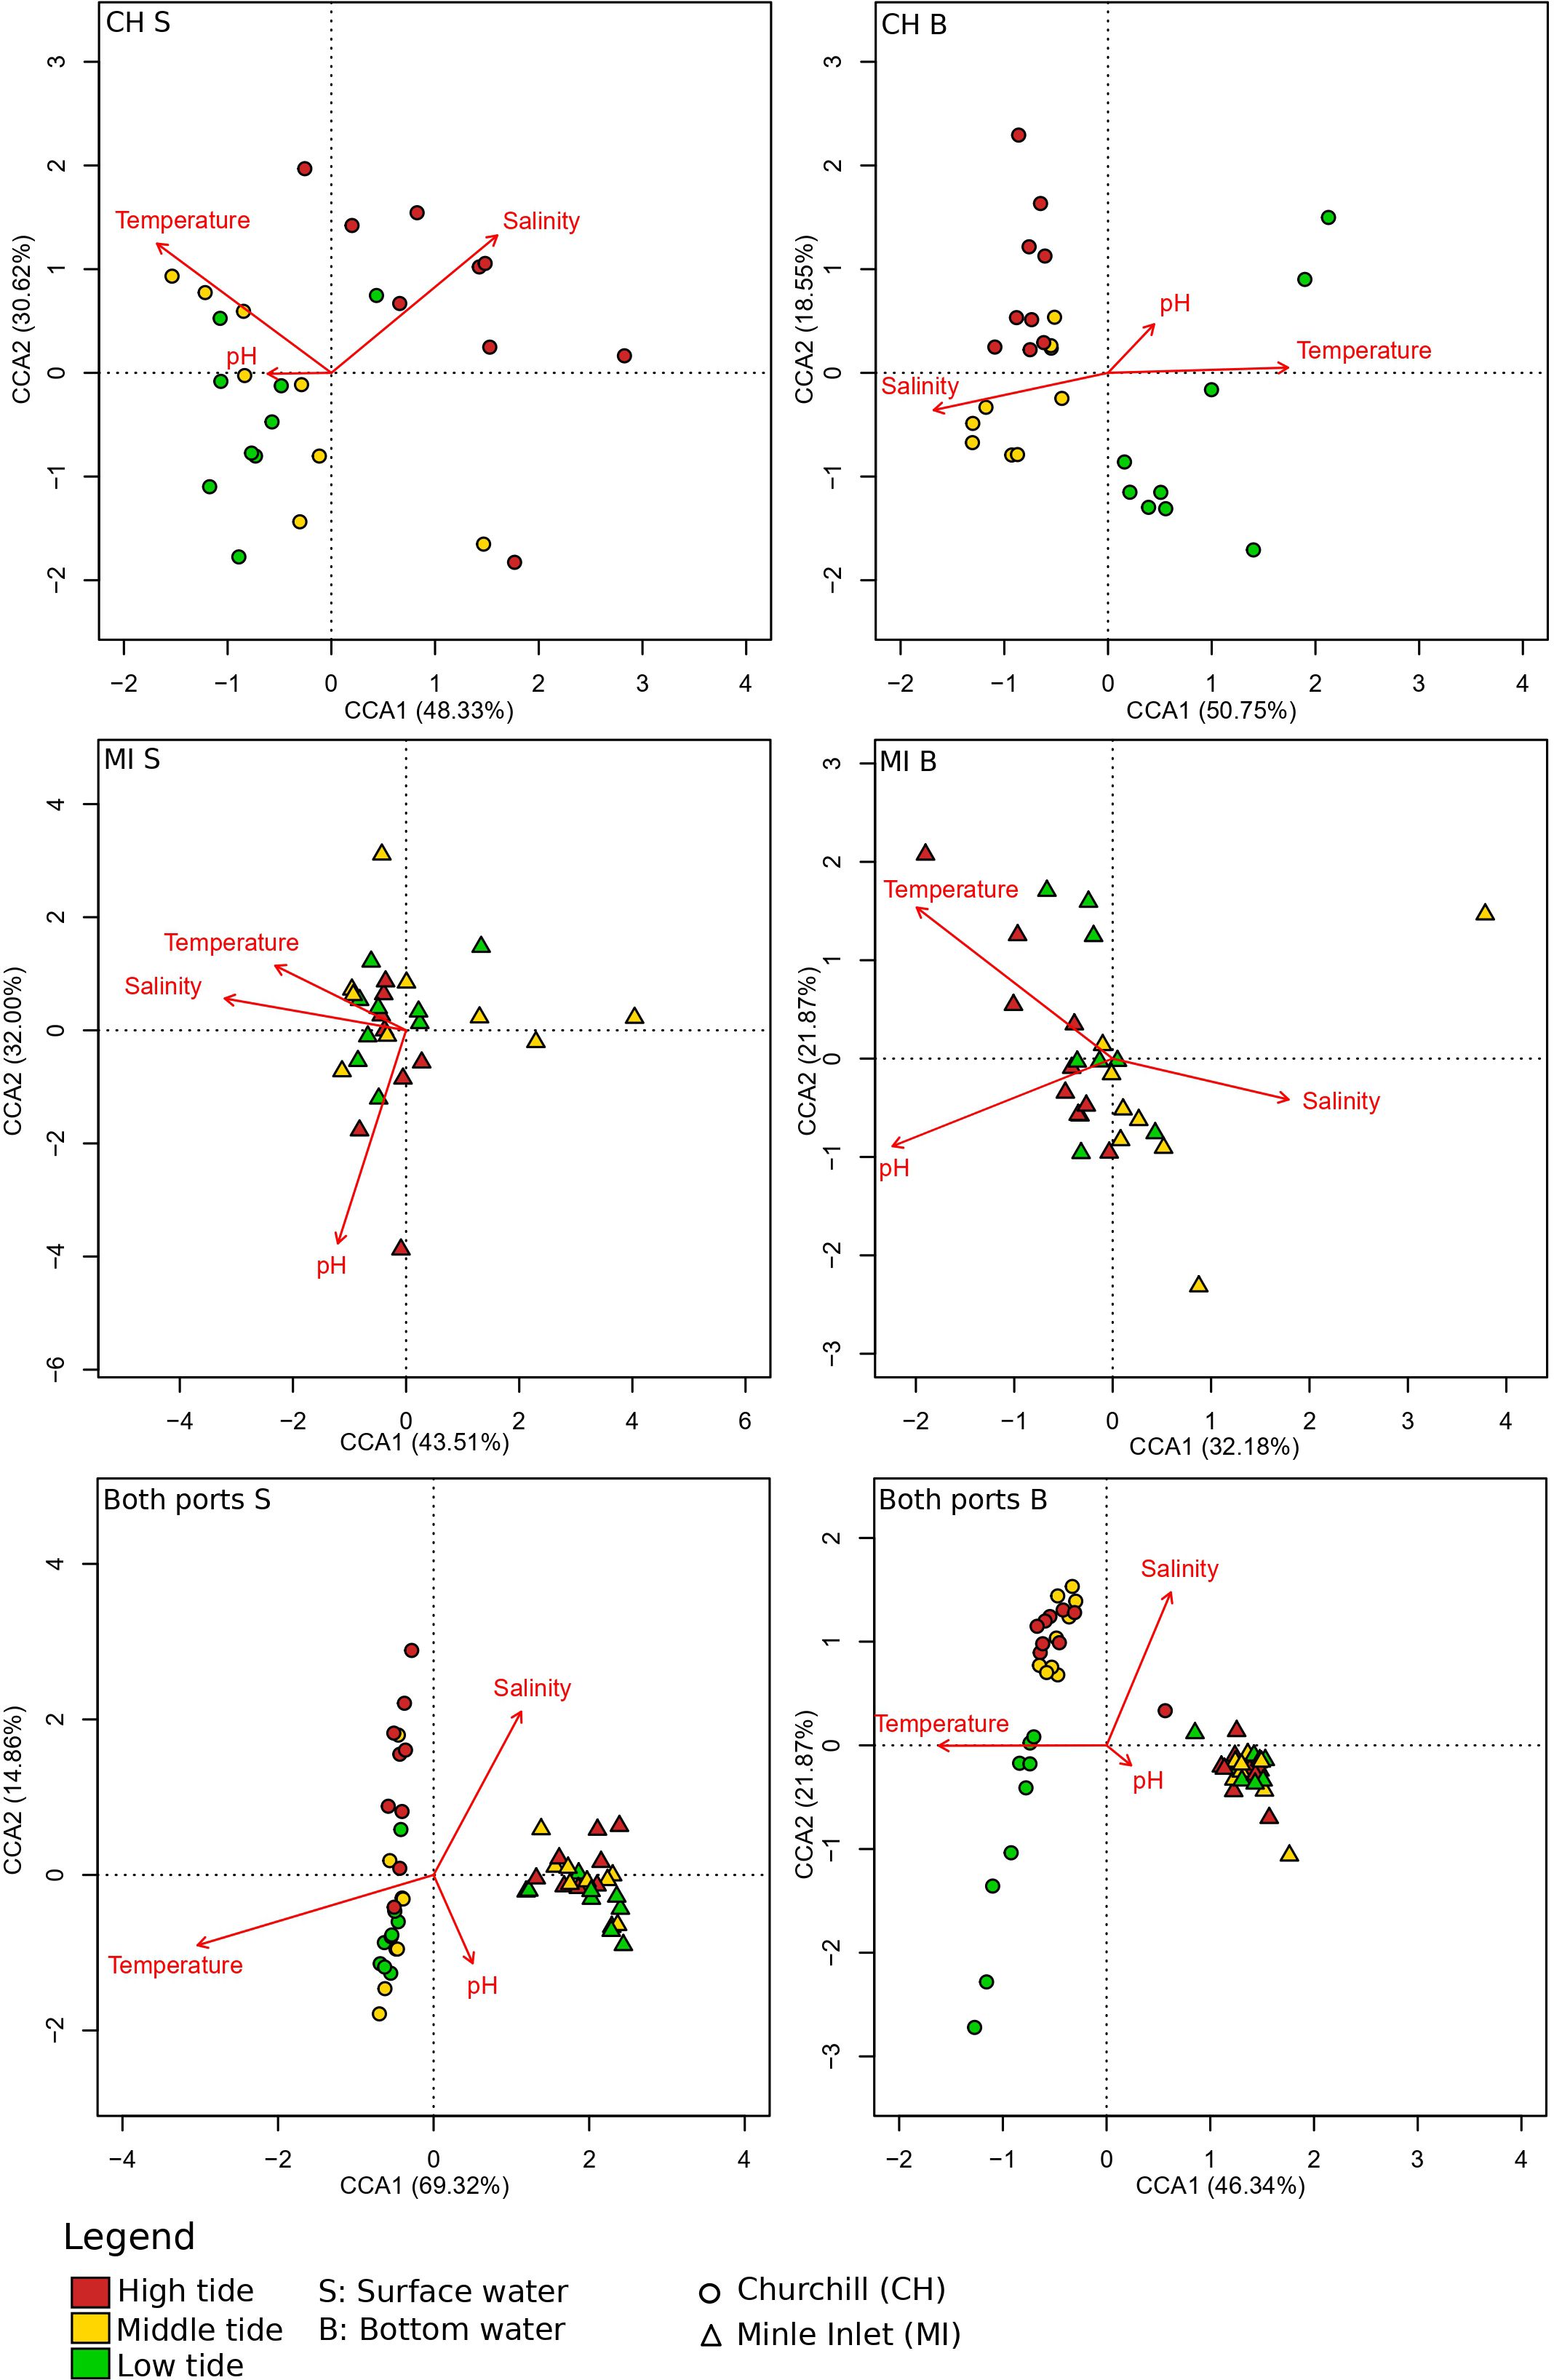
Figure 4 Canonical correspondence analysis (CCA) of eDNA aquatic metazoans of tidal variation for two Arctic ports. This figure was based on presence/absence scores with the COI primer gene at the genus level (see legend Table 1). Churchill and Milne Inlet ports are represented by the abbreviation CH and MI respectively and the surface and bottom waters are represented by S and B respectively. Arrows indicate the direction of environmental variables associated with the marine coastal communities. The length of the arrows indicated the strength of the influence of the environmental variables on the axes. Each point represented the eDNA samples. The eigenvalues associated with the projection are represented in % of the constrained variability. The constrained variability (inertia successfully constrained by the explanatory abiotic variables) represented 13.00% (CH S), 14.77% (CH D), 13.10% (MI S), 19.08% (MI D), 20.38% (CHMI S) and 22.85% (CHMI D) of the total variability.
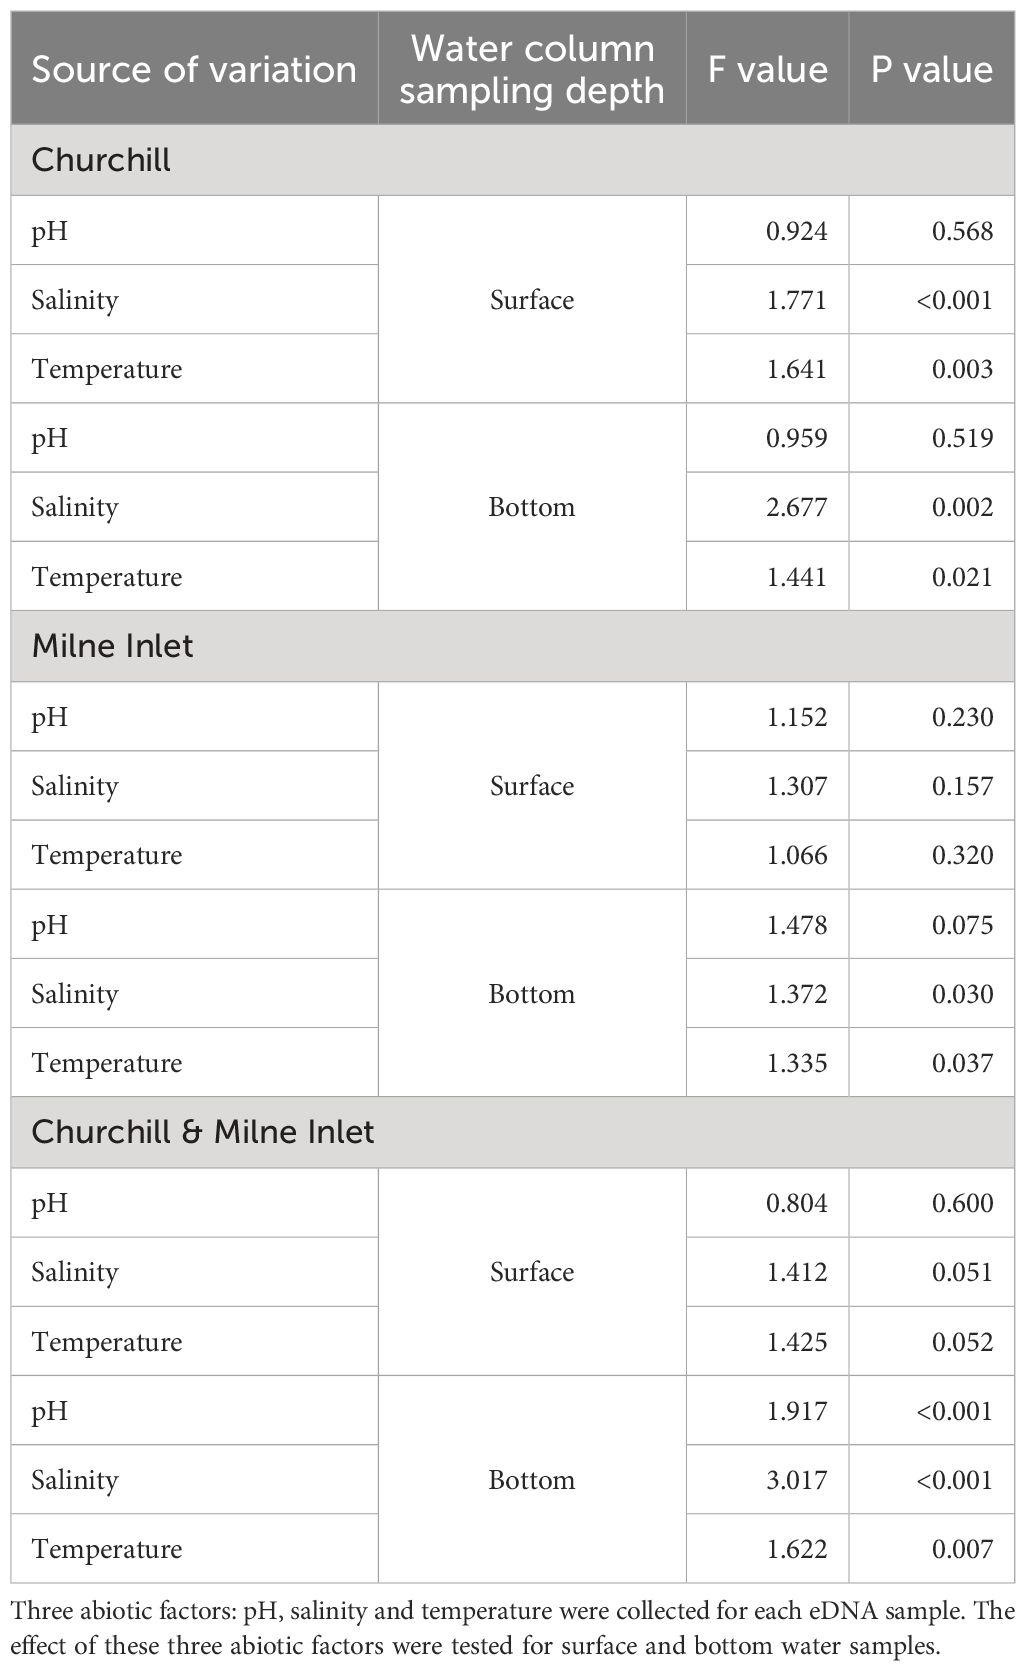
Table 3 ANOVA test statistics on the environmental variables of eDNA CCA results in both the Arctic ports (Churchill and Milne Inlet) for the primer gene COI (see legend Table 1).
As shown by the accumulation curves of Figure 5, sampling at multiple days, depths and tides can further increase detection of taxa (genus) in both estuarine and marine ecosystems. However, this improvement in detection was found to be more pronounced in the estuarine system. Interestingly, in the estuarian ecosystem, the greatest improvements in taxa detection by sampling at different days and depths were achieved for mid and low tides (see slopes in Figure 5 for the upper four panels, Figure 5).
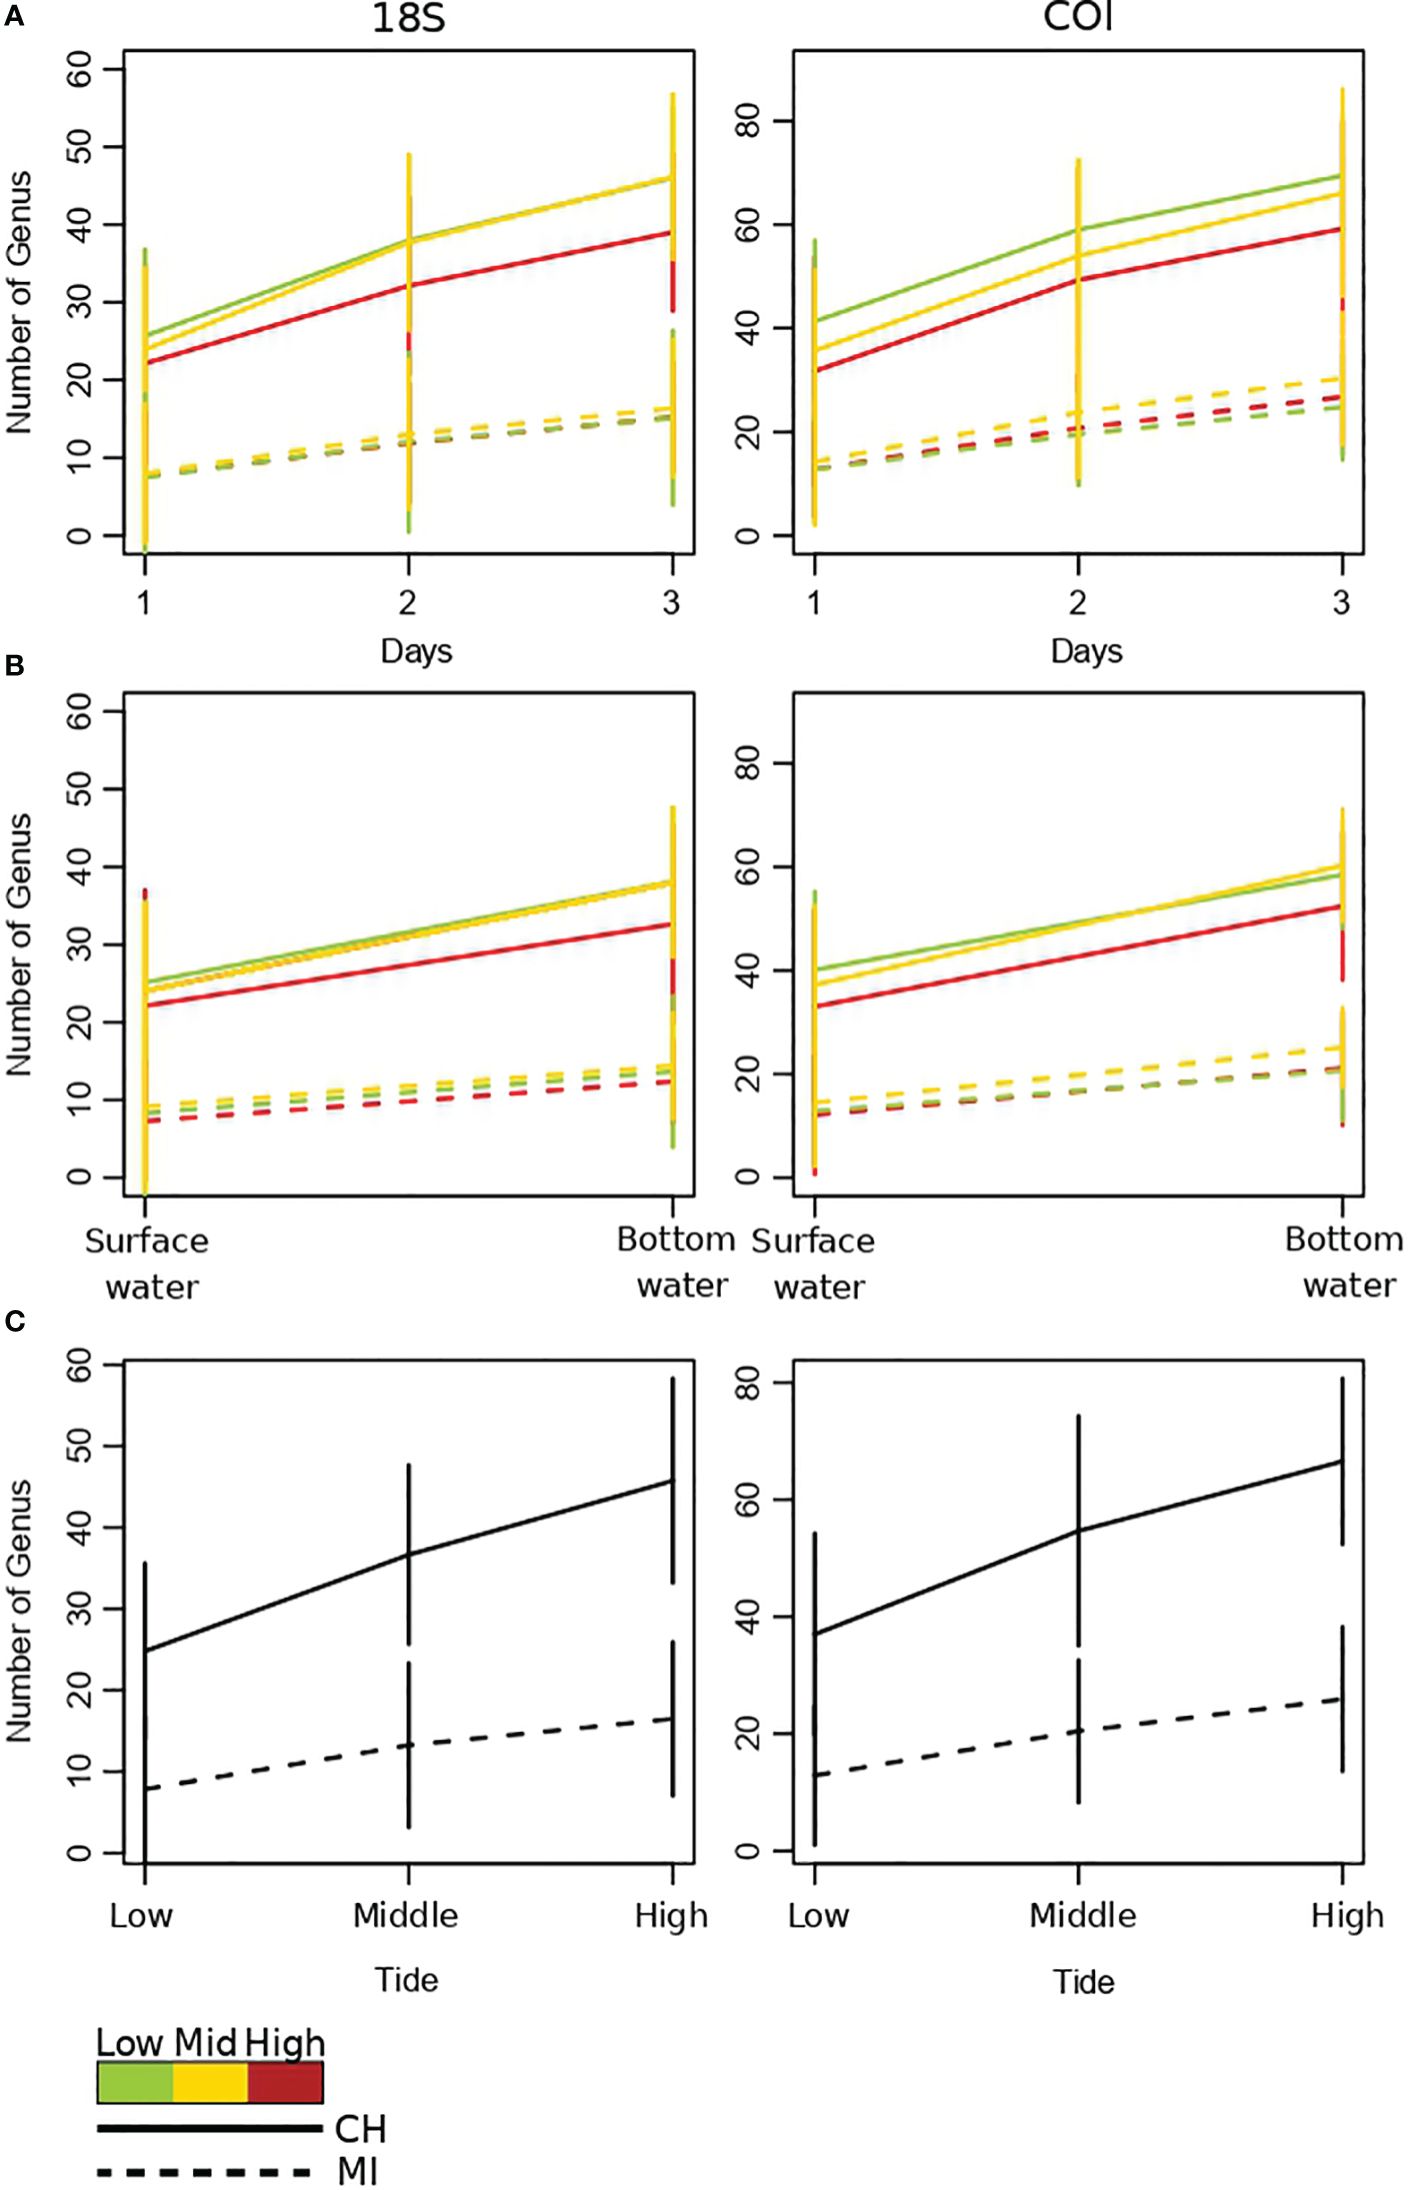
Figure 5 Accumulation curves of aquatic metazoans genii observed at both arctic ports Churchill and Milne Inlet. (A) Accumulation curves obtained by sampling days with the two combined primer genes 18S and COI (see legend Table 1). (B) Accumulation curves obtained by depth with 18S and COI gene primers. (C) Accumulation curves obtained by tide phase with 18S and COI gene primers. Confidence intervals are represented by vertical lines.
In this study, we investigated how the effect of tides alter community indices obtained from eDNA metabarcoding at different depths in both estuarine and marine ecosystems. Consistent with Kumar et al. (2022), greater biodiversity was detected in the estuarine ecosystem. We also observed a significant difference in community composition between estuarine and marine environments. Moreover, tides were identified as a major driver of community dynamics within the estuary, while depth was determined to significantly affect community structure in the marine ecosystem. Below, we highlight important factors to consider when designing sampling strategies to track ecosystem indicators through eDNA time-series in these dynamic coastal environments.
A strong effect of tide was observed in the estuarine community structure detected with eDNA, whereas there was no change in composition within the marine ecosystem. Both vertical and horizontal eDNA transport may explain the observed differences in the influence of tides on communities in estuarine versus marine environments. Although this study is the first to analyze the effect of tides on metazoan taxa detections with eDNA metabarcoding in an estuary ecosystem, Ahn et al. (2020) used eDNA metabarcoding to investigate the effect of incoming and outcoming tides on detection of fishes in five different estuaries of Japan. They also found that tidal movements had a strong influence on community composition. Indeed, in estuarine ecosystems, horizontal eDNA displacement through tides and currents may be especially strong, which would increase eDNA dispersion (Hansen et al., 2018; Rourke et al., 2022), particularly in the presence of larger, faster flowing rivers such as the Churchill River (Deiner and Altermatt, 2014; Pont et al., 2018; Cole et al., 2022). In marine ecosystem, previous studies have reported similar results with weak or no influence of tides on taxa detection using eDNA metabarcoding (Kelly et al., 2018; Jeunen et al., 2019; van Bleijswijk et al., 2020; Lafferty et al., 2021). The physical hydrodynamics associated with coastal morphology in marine areas, e.g., in inlets or fjords, can lead to slower and multi-directional flows which might be significant drivers limiting horizontal eDNA dispersion (Hansen et al., 2018; Rourke et al., 2022). Except for certain free-floating cells such as eggs, eDNA would likely sink rapidly through the water column with gravity in the absence of significant mixing or horizontal forces, explaining the higher diversity with depth in marine ecosystems (Hansen et al., 2018; Ratcliffe et al., 2021). Therefore, particles released in estuarine, marine or freshwater communities might vary depending on different sources of eDNA (e.g. nekton/benthos, phenology such as reproduction, feeding, nesting, resting) related with seasonality or time of the day in addition to different fates and dynamics associated with the local mixing and horizontal forces.
Variation in eDNA production rates may also contribute to differences in tidal effects on detection of estuarine and marine communities. In this study, we observed the strongest detection of the intertidal gastropod, Littorina saxatilis, at high tide in the Churchill River estuary. During the rising tide, the intertidal zone is submerged with tidal flood currents, allowing a potential accumulation of eDNA released by intertidal species. In contrast, the eDNA signal from intertidal species was generally found to be weaker at low and middle tide, likely due to the tidal ebb current (Jeunen et al., 2019). Thus, while in marine ecosystems the eDNA may be transported over shorter distances through the low-level influence of tides and currents and rapidly settle in the sediment, resuspension of eDNA from sediments may be possible in estuarine ecosystems (Hansen et al., 2018; Jeunen et al., 2019; van Bleijswijk et al., 2020).
In estuarine ecosystem, the eDNA from freshwater taxa may flow from the river over long distances and likely contributes to increasing the detected diversity at the river mouth (Deiner and Altermatt, 2014; Wood et al., 2021). Given that the strength of riverine inputs varies with tides, this could lead to complex spatio-temporal patterns of diversity. Our results reveal a shift in community composition from low tide to high tide that is characterized by a reduction of freshwater species, and an intermediate community structure at mid-tide.
A strong effect of depth on detected community structure was observed in both the estuarine and marine ecosystems, regardless of tides. While several studies have reported differences in eDNA communities between surface and bottom waters (Moyer et al., 2014; Yamamoto et al., 2016; Andruszkiewicz et al., 2017; Yamamoto et al., 2017; Lacoursière-Roussel et al., 2018; Uthicke et al., 2018; Jeunen et al., 2020; Littlefair et al., 2021), none have considered the potential dynamic interaction with tides. The vertical distribution of eDNA is well-described and known to have a consistent pattern with distinct communities being found over depth ranges of meters (Chappuis et al., 2014; Deiner et al., 2017). Indeed, water column stratification is a main physical process restricting eDNA vertical dispersion, while other factors, such as wave action (Jeunen et al., 2020) and biological transport from natural species behavior (e.g. daily vertical migration and predator–prey interactions), may increase eDNA dispersion through the water column (Hänfling et al., 2016; Easson et al., 2020; Rourke et al., 2022).
In the marine ecosystem of Milne Inlet, the diversity and the richness were higher in bottom waters, whereas in the estuarine ecosystem (i.e. Churchill), the surface samples tended to possess a greater biodiversity, an observation that is consistent with previously documented patterns in the Churchill estuary (Lacoursière-Roussel et al., 2018). In estuaries, lower density freshwater coming from the river accumulates in the surface layer of the estuarine water column (Prandle, 2009). As a result, eDNA transported by upstream freshwater into estuaries can explain the greater species diversity measured in these ecosystems through eDNA metabarcoding (Yamamoto et al., 2017). In marine ecosystem such as Milne Inlet, where there is an absence of stratification in the water column (Supplementary Figure 1), the non-floating eDNA would be expected to lead to rapid downward vertical advection, leading to greater detected biodiversity at the bottom. In addition, abiotic factors such as temperature, salinity, hydrodynamics may also influence food availability, and thus influence the species distribution across the water column. Although there can be seasonal variations in vertical distribution of organisms, zooplankton and benthic species are generally distributed deeper in the water column rather than near surface waters (Pados and Spielhagen, 2014; Bandara et al., 2016). These observations may also explain the greater richness detected with eDNA in the bottom waters of Milne Inlet.
We found that the eDNA community structure was distinct among the three sampling days in both the marine and estuarine ecosystems. Although the importance of temporal variation to understanding eDNA community dynamics is widely agreed upon, only a few studies have analyzed daily variation (Kelly et al., 2018; Ely et al., 2021; Jensen et al., 2022). This eDNA pattern is consistent with natural daily distribution of species. Ely et al. (2021) noted high variability in species observations on a day-to-day basis with many taxa being observed in all samples whereas the vast majority of species were only intermittently detected. This dynamic aspect to communities detected by eDNA may, in part, be explained by biological variation such as daily behaviors and variation of highly mobile or migratory species (Jensen et al., 2022). For example, Holm-Hansen et al. (2019) found that abundance of different types of fish (demersal, benthic and pelagic) varied with time of day and could explain observed diurnal differences in fish community structure with eDNA metabarcoding (e.g., as observed by Suzuki et al., 2022). Furthermore, for some taxa, the persistence times of eDNA in dynamic marine environments have been shown to be as short as a few hours rather than days, as previously noted in temperate freshwater samples (Jo et al., 2019). Such rapid degradation in marine environments may strongly influence taxa detection, leading to an incomplete picture when communities are characterized using eDNA samples from a single sampling site or time point. Indeed, Kelly et al. (2018) observed that temperature and salinity changes caused by the movement of water masses influenced the daily variation in eDNA-based community composition. To overcome this inherently heterogeneous distribution of eDNA in the water (Jensen et al., 2022), sampling over multiple days or short-term replication within a day would maximize taxa detection rates, thus leading to a better overall representation of actual biodiversity.
Our findings clearly demonstrate the importance of sampling eDNA at multiple time points within a day or over several days to help reduce the impact of stochasticity associated with sub-day and day-to-day variation. Moreover, we found substantial improvement in detected taxa rates when sampling over multiple tides in marine ecosystem but especially in estuarine ecosystem, suggesting that sampling more than one tide should maximize the chances of detecting taxa. Our results also show the need for considering tides as well as depth in water eDNA metabarcoding sampling designs for coastal biodiversity monitoring and how the relative importance and interaction between these factors can vary among ecosystems. Based on our findings, the first considerations for maximizing eDNA detection of biodiversity in marine environments should be choosing the appropriate depth and tide (Supplementary Table 7). Indeed, sampling closer to the bottom of the water column is likely to provide more robust estimates of coastal biodiversity. In estuarine conditions, the effect of tides on detected biodiversity was found to be stronger and is thus of primary importance in sampling design, and collecting samples at low and mid tides have a greater likelihood of generating higher biodiversity estimates. Our findings also show that, in an estuarine setting, surface samples contain a greater diversity of detected upstream (freshwater) and local marine taxa, whereas a lower diversity of local marine and brackish taxa were observed at the bottom of the water column. For studies that aim to achieve broad spatial coverage, we suggest that the inclusion of samples from both portions of the water column in estuaries can substantially increase the numbers of detected taxa that are distributed over a greater spatial area, including upstream portions of the estuary. Thus, sampling a broader range of physical conditions across multiple tides and depths may be particularly important in order to ensure accurate representation of biodiversity in estuarine environments which tend to be more dynamic (Nagarajan et al., 2022).
We demonstrate that sampling over consecutive days is particularly important for obtaining more comprehensive estimates of biodiversity in an estuarine setting when using eDNA metabarcoding. Provided resources allow for it, eDNA sampling and integration of associated biodiversity information across broader temporal scales, such as over different seasons, should provide even more accurate representations of the full breadth of diversity in a given location (Sevellec et al., 2021). We thus recommend that future studies explore how the dynamics of eDNA detection related to tides and depth may also vary between estuarine and marine systems in different seasons and regions.
The datasets presented in this study can be found in online repositories. The names of the repository/repositories and accession number(s) can be found below: https://www.ncbi.nlm.nih.gov/, PRJNA436081.
The manuscript presents research on animals that do not require ethical approval for their study.
MS: Writing – review & editing, Writing – original draft, Methodology, Formal analysis. AL-R: Writing – review & editing, Resources, Methodology, Conceptualization. EN: Writing – review & editing, Software. LB: Writing – review & editing, Resources. KH: Writing – review & editing, Resources, Conceptualization.
The author(s) declare financial support was received for the research, authorship, and/or publication of this article. This research was supported by ArcticNet Funding to LB, KH, and AL-R, Polar Knowledge Canada Funding to KH, LB, and AL-R (Award Number: PKC-NST-1617–0016A), and Fisheries and Oceans Canada (Aquatic Invasive Species Monitoring and Arctic Science) Funding, World Wildlife Funding and Natural Resources Canada Polar Continental Shelf Program in-kind logistics support to KH.
We would like to thank Professor LB, who passed away during the submission process of this article. He was a major supporter of development and optimization of eDNA methods for application in coastal Arctic regions. We acknowledge that this research was conducted on the unceded and unsurrendered traditional territories of Métis peoples (Churchill Estuary Hudson Bay); and the Inuit homelands of Inuit Nunangat in Nunavut (Milne Inlet). We thank A. Arreak, V. Cypihot, F. Hartog, C. Idlaut, N. Leduc, S. Pewatoalook, R. Smale and staff from the Churchill Northern Studies Center, especially L. Fishback, for assisting with field logistics and sample collection and F. Difallah, A. Dispas, M. Jaaka, C. McKindsey and N. Simard for help with field planning and coordination for the broader Milne Port Survey under which a portion of the sampling for this research was conducted. We thank the Government of Nunavut and the Nuliajuk crew for helping safely transport us to the Milne Inlet sample sites and providing food and accommodations for part of our team on their vessel as well Baffinland for providing accommodations and food to the remainder of our team while in the field. We are grateful to L. Deslauriers who performed laboratory work and B. Boyle for his help with the Illumina MiSeq sequencing. This work benefited from feedback received during presentations of draft results to the International Council for Exploration of the Seas (ICES) Expert Working Groups on Ballast Water and Other Shipping Vectors and Introductions and Transfers of Marine Organisms.
The authors declare that the research was conducted in the absence of any commercial or financial relationships that could be construed as a potential conflict of interest.
All claims expressed in this article are solely those of the authors and do not necessarily represent those of their affiliated organizations, or those of the publisher, the editors and the reviewers. Any product that may be evaluated in this article, or claim that may be made by its manufacturer, is not guaranteed or endorsed by the publisher.
The Supplementary Material for this article can be found online at: https://www.frontiersin.org/articles/10.3389/fmars.2024.1390489/full#supplementary-material
Ahn H., Kume M., Terashima Y., Ye F., Kameyama S., Miya M., et al. (2020). Evaluation of fish biodiversity in estuaries using environmental DNA metabarcoding. PloS One 15, e0231127. doi: 10.1371/journal.pone.0231127
Andruszkiewicz E. A., Starks H. A., Chavez F. P., Sassoubre L. M., Block B. A., Boehm A. B. (2017). Biomonitoring of marine vertebrates in monterey bay using eDNA metabarcoding. PloS One 12, e0176343. doi: 10.1371/journal.pone.0176343
Archambault P., Snelgrove P. V. R., Fisher J. A. D., Gagnon J.-M., Garbary D. J., Harvey M., et al. (2010). From sea to sea: Canadas three oceans of biodiversity. PloS One 5, e121825. doi: 10.1371/journal.pone.0012182
Babin J., Lasserre F., Pic P. (2019). “Arctic Shipping and Polar Seaways,” in Encyclopedia of Water, 1st ed. Ed. Maurice P. (New York: Wiley), 1–12. doi: 10.1002/9781119300762.wsts0098
Bandara K., Varpe Ø., Søreide J. E., Wallenschus J., Berge J., Eiane K. (2016). Seasonal vertical strategies in a high-arctic coastal zooplankton community. Mar. Ecol. Prog. Ser. 555, 49–64. doi: 10.3354/meps11831
Barnes M. A., Turner C. R. (2016). The ecology of environmental DNA and implications for conservation genetics. Conserv. Genet. 17, 1–17. doi: 10.1007/s10592-015-0775-4
Chan F. T., Bronnenhuber J. E., Bradie J. N., Howland K. L., Simard N., Bailey S. A. (2012). Risk Assessment for Ship-Mediated Introductions of Aquatic Nonindigenous Species to the Canadian Arctic (Department Fisheries and Oceans, Canadian Science Advisory Secretariat Research Document 2011/105). Available online at: https://www.dfo-mpo.gc.ca/csas-sccs/Publications/ResDocs-DocRech/2011/2011_105-eng.html (accessed 19 March 2015).
Chappuis E., Terradas M., Cefalì M. E., Mariani S., Ballesteros E. (2014). Vertical zonation is the main distribution pattern of littoral assemblages on rocky shores at a regional scale. Estuarine Coast. Shelf Sci. 147, 113–122. doi: 10.1016/j.ecss.2014.05.031
Cole V. J., Harasti D., Lines R., Stat M. (2022). Estuarine fishes associated with intertidal oyster reefs characterized using environmental DNA and baited remote underwater video. Environ. DNA 4, 50–62. doi: 10.1002/edn3.190
Deiner K., Altermatt F. (2014). Transport distance of invertebrate environmental DNA in a natural river. PloS One 9, e88786. doi: 10.1371/journal.pone.0088786
Deiner K., Bik H. M., Mächler E., Seymour M., Lacoursière-Roussel A., Altermatt F., et al. (2017). Environmental DNA metabarcoding: transforming how we survey animal and plant communities. Mol. Ecol. 26, 58725. doi: 10.1111/mec.14350
De Souza L. S., Godwin J. C., Renshaw M. A., Larson E. (2016). Environmental DNA (eDNA) detection probability is influenced by seasonal activity of organisms. PloS One 11, e0165273. doi: 10.1371/journal.pone.0165273
Díaz-Ferguson E., Moyer G. R. (2014). History, applications, methodological issues and perspectives for the use environmental DNA (eDNA) in marine and freshwater environments. Rev. Biología Trop. 62, 1273–1284. doi: 10.15517/rbt.v62i4
Dixon P. (2003). VEGAN, a package of R functions for community ecology. J. Vegetation Sci. 14, 927–930. doi: 10.1111/j.1654-1103.2003.tb02228.x
Easson C. G., Boswell K. M., Tucker N., Warren J. D., Lopez J. V. (2020). Combined eDNA and acoustic analysis reflects diel vertical migration of mixed consortia in the gulf of Mexico. Front. Mar. Sci. 7. doi: 10.3389/fmars.2020.00552
Ely T., Barber P. H., Man L., Gold Z. (2021). Short-lived detection of an introduced vertebrate eDNA signal in a nearshore rocky reef environment. PloS One 16, e0245314. doi: 10.1371/journal.pone.0245314
Fissel D. B. (1982). Tidal currents and inertial oscillations in northwestern baffin bay. Arctic 35, 201–210. doi: 10.14430/arctic2319
Folmer O., Black M., Hoeh W., Lutz R., Vrijenhoek R. (1994). DNA primers for amplification of mitochondrial cytochrome c oxidase subunit I from diverse metazoan invertebrates. Mol. Mar. Biol. Biotechnol. 3, 294–299.
Gaither M. R., DiBattista J. D., Leray M., von der Heyden S. (2022). Metabarcoding the marine environment: from single species to biogeographic patterns. Environ. DNA 4, 3–8. doi: 10.1002/edn3.270
García-Machado E., Laporte M., Normandeau E., Hernández C., Côté G., Paradis Y., et al. (2022). Fish Community Shifts along a Strong Fluvial Environmental Gradient Revealed by eDNA Metabarcoding. Environ. DNA 4, 117–134. doi: 10.1002/edn3.221
Geller J., Meyer C., Parker M., Hawk H. (2013). Redesign of PCR primers for mitochondrial cytochrome c oxidase subunit I for marine invertebrates and application in all-taxa biotic surveys. Mol. Ecol. Resour. 13, 851–861. doi: 10.1111/1755-0998.12138
Gold Z., Sprague J., Kushner D. J., Marin E. Z., Barber P. H. (2021). eDNA metabarcoding as a biomonitoring tool for marine protected areas. PloS One 16, e0238557. doi: 10.1371/journal.pone.0238557
Goldberg C. S., Turner C. R., Deiner K., Klymus K. E., Thomsen P. F., Murphy M. A., et al. (2016). Critical considerations for the application of environmental DNA methods to detect aquatic species. Methods Ecol. Evol. 7, 1299–13075. doi: 10.1111/2041-210X.12595
Hadziavdic K., Lekang K., Lanzen A., Jonassen I., Thompson E. M., Troedsson C. (2014). Characterization of the 18S RRNA gene for designing universal eukaryote specific primers. PloS One 9, e87624. doi: 10.1371/journal.pone.0087624
Hänfling B., Handley L. L., Read D. S., Hahn C., Li J., Nichols P., et al. (2016). Environmental DNA metabarcoding of lake fish communities reflects long-term data from established survey methods. Mol. Ecol. 25, 3101–3119. doi: 10.1111/mec.13660
Hansen B. K., Bekkevold D., Clausen L. W., Nielsen E. E. (2018). The sceptical optimist: challenges and perspectives for the application of environmental DNA in marine fisheries. Fish Fisheries 19, 751–768. doi: 10.1111/faf.12286
Holm-Hansen T. H., Carl H., Gravlund P., Krag M. A., Møller P. R. (2019). Assessing structure and seasonal variations of a temperate shallow water fish assemblage through snorkel visual census. Cybium 43, 4, 341–350. doi: 10.26028/CYBIUM/2019–434-004
Jensen M. R., Sigsgaard E. E., Ávila M. D. P., Agersnap S., Brenner-Larsen W., Sengupta M. E., et al. (2022). Short-Term temporal variation of coastal marine eDNA. Environ. DNA 4, 747–625. doi: 10.1002/edn3.285
Jerde C. L. (2021). Can we manage fisheries with the inherent uncertainty from edna? J. Fish Biol. 98, 34153. doi: 10.1111/jfb.14218
Jeunen G.-J., Knapp M., Spencer H. G., Lamare M. D., Taylor H. R., Stat M., et al. (2019). Environmental DNA (eDNA) metabarcoding reveals strong discrimination among diverse marine habitats connected by water movement. Mol. Ecol. Resour. 19, 426–438. doi: 10.1111/1755-0998.12982
Jeunen G.-J., Lamare M. D., Knapp M., Spencer H. G., Taylor H. R., Stat M., et al. (2020). Water stratification in the marine biome restricts vertical environmental DNA (eDNA) signal dispersal. Environ. DNA 2, 99–111. doi: 10.1002/edn3.49
Jo T., Murakami H., Yamamoto S., Masuda R., Minamoto T. (2019). Effect of water temperature and fish biomass on environmental DNA shedding, degradation, and size distribution. Ecol. Evol. 9, 1135–1146. doi: 10.1002/ece3.4802
Keck F., Blackman R. C., Bossart R., Brantschen J., Couton M., Hürlemann S., et al. (2022). Meta-analysis shows both congruence and complementarity of DNA and eDNA metabarcoding to traditional methods for biological community assessment. Mol. Ecol. 31, 1820–1835. doi: 10.1111/mec.16364
Kelly R. P., Closek C. J., O’Donnell J. L., Kralj J. E., Shelton A. O., Samhouri J. F. (2017). Genetic and manual survey methods yield different and complementary views of an ecosystem. Front. Mar. Sci. 3, 283. doi: 10.3389/fmars.2016.00283
Kelly R. P., Gallego R., Jacobs-Palmer E. (2018). The effect of tides on nearshore environmental DNA. PeerJ 6, e4521. doi: 10.7717/peerj.4521
Kelly R. P., Shelton A. O., Gallego R. (2019). Understanding PCR processes to draw meaningful conclusions from environmental DNA studies. Sci. Rep. 9, 12133. doi: 10.1038/s41598-019-48546-x
Kindt R., Coe R. (2005). Tree Diversity Analysis: A Manual and Software for Common Statistical Methods for Ecological and Biodiversity Studies (Nairobi, Kenya: World Agrofirestry Centre).
Kleptsova O., Pietrzak J. D. (2018). High resolution tidal model of canadian arctic archipelago, baffin and hudson bay. Ocean Model. 128, 15–47. doi: 10.1016/j.ocemod.2018.06.001
Kumar G., Farrell E., Reaume A. M., Eble J. A., Gaither M. R. (2022). One size does not fit all: tuning eDNA protocols for high- and low-turbidity water sampling. Environ. DNA 4, 167–180. doi: 10.1002/edn3.235
Kume M., Lavergne E., Ahn H., Terashima Y., Kadowaki K., Ye F., et al. (2021). Factors structuring estuarine and coastal fish communities across Japan using environmental DNA metabarcoding. Ecol. Indic. 121, 107216. doi: 10.1016/j.ecolind.2020.107216
Lacoursière-Roussel A., Howland K., Normandeau E., Grey E. K., Archambault P., Deiner K., et al. (2018). eDNA metabarcoding as a new surveillance approach for coastal arctic biodiversity. Ecol. Evol. 8, 7763–7777. doi: 10.1002/ece3.4213
Lafferty K. D., Garcia-Vedrenne A. E., McLaughlin J. P., Childress J. N., Morse M. F., Jerde C. L. (2021). At Palmyra Atoll, the Fish-Community Environmental DNA Signal Changes across Habitats but Not with Tides. J. Fish Biol. 98, 415–425. doi: 10.1111/jfb.14403
Laporte M., Reny-Nolin E., Chouinard V., Hernandez C., Normandeau E., Bougas B., et al. (2021). Proper environmental DNA metabarcoding data transformation reveals temporal stability of fish communities in a dendritic river system. Environ. DNA 3, 1007–1022. doi: 10.1002/edn3.224
Larson E. R., Graham B. M., Achury R., Coon J. J., Daniels M. K., Gambrell D. K., et al. (2020). From eDNA to citizen science: emerging tools for the early detection of invasive species. Front. Ecol. Environ. 18, 194–2025. doi: 10.1002/fee.2162
Leduc N., Lacoursière-Roussel A., Howland K. L., Archambault P., Sevellec M., Normandeau E., et al. (2019). Comparing eDNA metabarcoding and species collection for documenting arctic metazoan biodiversity. Environ. DNA 1, 342–358. doi: 10.1002/edn3.35
Legendre P., Gallagher E. D. (2001). Ecologically meaningful transformations for ordination of species data. Oecologia 129, 271–280. doi: 10.1007/s004420100716
Leray M., Yang J. Y., Meyer C. P., Mills S. C., Agudelo N., Ranwez V., et al. (2013). A new versatile primer set targeting a short fragment of the mitochondrial COI region for metabarcoding metazoan diversity: application for characterizing coral reef fish gut contents. Front. Zoology 10, 34. doi: 10.1186/1742-9994-10-34
Li G., Cheng L., Zhu J., Trenberth K. E., Mann M. E., Abraham J. P. (2020). Increasing ocean stratification over the past half-century. Nat. Climate Change 10, 1116–1123. doi: 10.1038/s41558-020-00918-2
Littlefair J. E., Hrenchuk L. E., Blanchfield P. J., Rennie M. D., Cristescu M. E. (2021). Thermal stratification and fish thermal preference explain vertical eDNA distributions in lakes. Mol. Ecol. 30, 3083–3096. doi: 10.1111/mec.15623
Mitra A., Zaman S. (2016). Basics of marine and estuarine ecology. (New Delhi: Springer India). doi: 10.1007/978-81-322-2707-6
Montagna P. A., Palmer T. A., Pollack J. B. (2013). Hydrological changes and estuarine dynamics (Vol. 8) (Springer New York, Heidelberg, Dordretch and London: Springer Science & Business Media). doi: 10.1007/978–1-4614–5833-3_1
Moyer G. R., Díaz-Ferguson E., Hill J. E., Shea C. (2014). Assessing environmental DNA detection in controlled lentic systems’. PloS One 9, e103767. doi: 10.1371/journal.pone.0103767
Nagarajan R. P., Bedwell M., Holmes A. E., TSanches T., Acuña S., Baerwald M., et al. (2022). Environmental DNA methods for ecological monitoring and biodiversity assessment in estuaries. Estuaries Coasts 45, 2254–2273. doi: 10.1007/s12237-022-01080-y
Pados T., Spielhagen R. F. (2014). Species distribution and depth habitat of recent planktic foraminifera in fram strait, arctic ocean. Polar Res. 33, 22483. doi: 10.3402/polar.v33.22483
Pont D., Rocle M., Valentini A., Civade R., Jean P., Maire A., et al. (2018). Environmental DNA reveals quantitative patterns of fish biodiversity in large rivers despite its downstream transportation. Sci. Rep. 8, 10361. doi: 10.1038/s41598–018-28424–8
Post E., Forchhammer M. C., Bret-Harte M. S., Callaghan T. V., Christensen T. R., Elberling B., et al. (2009). Ecological dynamics across the arctic associated with recent climate change. Science 325, 1355–1358. doi: 10.1126/science.1173113
Prandle D. (2009). Estuaries: Dynamics, Mixing, Sedimentation and Morphology (New York: Cambridge University Press). doi: 10.1017/CBO9780511576096
Prinsenberg S. J., Freeman N. G. (1986). Chapter 11 tidal heights and currents in hudson bay and james bay. Elsevier Oceanography Ser. 44, 205–216. doi: 10.1016/S0422-9894(08)70904-8
Radtke C. L., Terhune J. M., Frouin-Mouy H., Rouget P. A. (2023). Vocal count responses of narwhals to bulk carrier noise in milne inlet, nunavut, Canada. Mar. Mammal Sci. 39, 1057–1075. doi: 10.1111/mms.13028
Ratcliffe F. C., Uren W. T.M., de Leaniz C. G., Consuegra S. (2021). A drop in the ocean: monitoring fish communities in spawning areas using environmental DNA. Environ. DNA 3, 43–54. doi: 10.1002/edn3.87
Rourke M. L., Fowler A. M., Hughes J. M., Broadhurst M. K., DiBattista J. D., Fielder S., et al. (2022). Environmental DNA (eDNA) as a tool for assessing fish biomass: A review of approaches and future considerations for resource surveys. Environ. DNA 4, 9–33. doi: 10.1002/edn3.185
Sepulveda A. J., Nelson N. M., Jerde C. L., Luikart G. (2020). Are environmental DNA methods ready for aquatic invasive species management? TREE 35, 66878. doi: 10.1016/j.tree.2020.03.011
Sevellec M., Lacoursière-Roussel A., Bernatchez L., Normandeau E., Solomon E., Arreak A., et al. (2021). Detecting community change in arctic marine ecosystems using the temporal dynamics of environmental DNA. Environ. DNA 3, 573–590. doi: 10.1002/edn3.155
Seymour M. (2019). Rapid progression and future of environmental DNA research. Commun. Biol. 2, 1–3. doi: 10.1038/s42003-019-0330-9
Shokralla S., Porter T. M., Gibson J. F., Dobosz R., Janzen D. H., Hallwachs W., et al. (2015). Massively parallel multiplex DNA sequencing for specimen identification using an illumina MiSeq platform. Sci. Rep. 5, 9687. doi: 10.1038/srep09687
Shu L., Ludwig A., Peng Z. (2020). Standards for methods utilizing environmental DNA for detection of fish species. Genes 11, 296. doi: 10.3390/genes11030296
Stoeck T., David Bass D., Nebel M., Christen R., Jones M. D. M., Breiner H.-W., et al. (2010). Multiple marker parallel tag environmental DNA sequencing reveals a highly complex eukaryotic community in marine anoxic water. Mol. Ecol. 19, 21–31. doi: 10.1111/j.1365-294X.2009.04480.x
Suzuki J., Nakano D., Kobayashi S. (2022). Characteristics of diurnal and seasonal changes in fish detection patterns using environmental DNA metabarcoding in a mountain stream. Limnologica 93, 125955. doi: 10.1016/j.limno.2022.125955
Taberlet P., Coissac E., Pompanon F., Brochmann C., Willerslev E. (2012). Towards next-generation biodiversity assessment using DNA metabarcoding. Mol. Ecol. 21, 2045–2050. doi: 10.1111/j.1365-294X.2012.05470.x
Thomsen P. F., Kielgast J., Iversen L. L., Møller P. R., Rasmussen M., Willerslev E. (2012). Detection of a diverse marine fish fauna using environmental DNA from seawater samples. PloS One 7, e41732. doi: 10.1371/journal.pone.0041732
Thomsen P. F., Willerslev E. (2015). Environmental DNA – an emerging tool in conservation for monitoring past and present biodiversity. Biol. Conserv. 183, 4–18. doi: 10.1016/j.biocon.2014.11.019
Timmermans M.-L., Marshall J. (2020). Understanding arctic ocean circulation: A review of ocean dynamics in a changing climate. J. Geophysical Research: Oceans 125, e2018JC014378. doi: 10.1029/2018JC014378
Udalov A., Chikina M., Chava A., Vedenin A., Shchuka S., Mokievsky V. (2021). Patterns of benthic communities in arctic fjords (Novaya Zemlya Archipelago, Kara Sea): resilience vs. fragility. Front. Ecol. Evol. 9. doi: 10.3389/fevo.2021.777006
Uthicke S., Lamare M., Doyle J. R. (2018). eDNA detection of corallivorous seastar (Acanthaster cf. Solaris) outbreaks on the great barrier reef using digital droplet PCR. Coral Reefs 37, 1229–1239. doi: 10.1007/s00338-018-1734-6
van Bleijswijk J. D. L., Engelmann J. C., Klunder L., Witte H. J., Witte J. I. J., van der Veer H. W. (2020). Analysis of a coastal north sea fish community: comparison of aquatic environmental DNA concentrations to fish catches. Environ. DNA 2, 429–445. doi: 10.1002/edn3.67
Wegleitner B. J., Jerde C. L., Tucker A., Chadderton W. L., Mahon A. R. (2015). Long duration, room temperature preservation of filtered EDNA samples. Conserv. Genet. Resour. 7, 789–791. doi: 10.1007/s12686-015-0483-x
Wood Z. T., Lacoursière-Roussel A., LeBlanc F., Trudel M., Kinnison M. T., McBrine C. G., et al. (2021). Spatial heterogeneity of eDNA transport improves stream assessment of threatened salmon presence, abundance, and location. Front. Ecol. Evol. 9. doi: 10.3389/fevo.2021.650717
Yamamoto S., Kenji Minami K., Keiichi Fukaya K., Kohji Takahashi K., Hideki Sawada H., Hiroaki Murakami H., et al. (2016). Environmental DNA as a “Snapshot” of fish distribution: A case study of Japanese jack mackerel in maizuru bay, sea of Japan. PloS One 11, e01497865. doi: 10.1371/journal.pone.0149786
Yamamoto S., Masuda R., Sato Y., Sado T., Araki H., Kondoh M., et al. (2017). Environmental DNA metabarcoding reveals local fish communities in a species-rich coastal sea. Sci. Rep. 7, 40368. doi: 10.1038/srep40368
Keywords: Arctic, estuarine and marine ecosystems, eDNA dynamic, metabarcoding, tidal effect, coastal communities, eDNA daily variation
Citation: Sevellec M, Lacoursière-Roussel A, Normandeau E, Bernatchez L and Howland K (2024) Tidal effect on environmental DNA communities in Arctic estuarine and marine ecosystems. Front. Mar. Sci. 11:1390489. doi: 10.3389/fmars.2024.1390489
Received: 23 February 2024; Accepted: 16 May 2024;
Published: 13 June 2024.
Edited by:
Ylenia Carotenuto, Stazione Zoologica Anton Dohrn, ItalyReviewed by:
David Stanković, National Instiitute of Biology, SloveniaCopyright © 2024 Maelle Sevellec, Eric Normandeau, Louis Bernatchez and His Majesty the King in Right of Canada, as represented by Fisheries and Oceans Canada for the contribution of Anaïs Lacoursière-Roussel and Kimberly Howland. This is an open-access article distributed under the terms of the Creative Commons Attribution License (CC BY). The use, distribution or reproduction in other forums is permitted, provided the original author(s) and the copyright owner(s) are credited and that the original publication in this journal is cited, in accordance with accepted academic practice. No use, distribution or reproduction is permitted which does not comply with these terms.
*Correspondence: Maelle Sevellec, bWFlbGxlLnNldmVsbGVjQGdtYWlsLmNvbQ==
†Deceased
‡ORCID: Amir Sagi, orcid.org/0000-0003-2841-9391
Disclaimer: All claims expressed in this article are solely those of the authors and do not necessarily represent those of their affiliated organizations, or those of the publisher, the editors and the reviewers. Any product that may be evaluated in this article or claim that may be made by its manufacturer is not guaranteed or endorsed by the publisher.
Research integrity at Frontiers
Learn more about the work of our research integrity team to safeguard the quality of each article we publish.