 Qingqing Tian1,2,3
 Yu Tian
 Lei Guo
95% of researchers rate our articles as excellent or good
Learn more about the work of our research integrity team to safeguard the quality of each article we publish.
Find out more
ORIGINAL RESEARCH article
Front. Mar. Sci. , 26 April 2024
Sec. Coastal Ocean Processes
Volume 11 - 2024 | https://doi.org/10.3389/fmars.2024.1390364
Storm surges, a significant coastal hazard, cause substantial damage to both property and lives. Precise and efficient storm surge models are crucial for long-term risk assessment and guiding emergency management decisions. While high-fidelity dynamic models offer accurate predictions, their computational costs are substantial. Hence, recent efforts focus on developing data-driven storm surge surrogate models. This study focuses on the Pearl River Estuary in Guangdong Province. Initially, the dynamic ADvanced CIRCulation (ADCIRC) model was utilized to construct storm surge data for 16 historical typhoons, serving as training, validation, and testing data for data-driven models. Subsequently, Long Short-Term Memory (LSTM), Convolutional Neural Networks (CNN), and Informer deep learning (DL) models were employed for forecasting of storm surge over the next 1h, 3h, 6h, 12h, and 18h. Finally, Shapley Additive exPlanations (SHAP) values were used for interpretability analysis of the input factors across different models. Results indicated that the proposed DL storm surge prediction model can effectively replicate the dynamic model’s simulation results in short-term forecasts, significantly reducing computational costs. This model offers valuable scientific assistance for future coastal storm surge forecasts in the Greater Bay Area.
Storm surge is a phenomenon characterized by a significant rise in sea level in a coastal area due to intense atmospheric disturbance (Lagmay et al., 2015; Needham et al., 2015; Kohno et al., 2018). Storm surges are commonly classified into two types based on their triggers: extratropical and typhoon-induced. Extratropical surges have a slower rise and generally lower surge heights compared to typhoon-induced surges (Chu et al., 2019). Typhoon-induced surges, occurring predominantly in summer and autumn, are characterized by swift onset and high destructive potential. The Greater Bay Area, with its vital economic role in China, faces heightened storm surge risks due to the frequent typhoons, intricate terrain, and unique astronomical tide characteristics (Chen et al., 2014; Yin et al., 2017; Wu et al., 2018; Feng et al., 2021). Hence, studying and forecasting storm surges in this region is essential, offering practical applications for local disaster prevention and mitigation efforts (Munroe et al., 2018; Shi et al., 2020).
Traditional storm surge forecasting methods rely on dynamically driven numerical models, providing insights into coastal water level changes and inundation processes. For instance, departments such as the National Oceanic and Atmospheric Administration (NOAA) and the National Hurricane Center (NHC) in the United States employed the Sea, Lake, and Overland Surges from Hurricanes (SLOSH) model to study storm surge probability and maximum possible inundation, offering decision support for government agencies (Jelesnianski et al., 1992; Glahn et al., 2009; Kohno et al., 2018). However, these rapid, low-fidelity models may overlook critical physical features, potentially leading to high errors. Thanks to the development of computer technology, several high-fidelity physical ocean numerical models with non-structured grids have been developed, including ADCIRC, FVCOM, SELFE and others (Luettich et al., 1992; Chen et al., 2006; Burla et al., 2010). Yin et al. (2017) utilized a coupled ADCIRC and SWAN model to investigate the impact of sea-level rise and typhoon intensification on storm surge and coastal inundation in the Pearl River Estuary, China. Li et al. (2022) employed the FVCOM model, revealing that during Typhoon Chan-hom, storm surge in Hangzhou Bay, China, was primarily influenced by astronomical tides, with wind fields playing a secondary role. These dynamic numerical models require detailed data on seawall characteristics, land elevation, and land block properties, which are challenging to obtain accurately. Moreover, running high-resolution numerical models demands significant research resources and computational time (Pachev et al., 2023; Xie et al., 2023).
Machine learning has significant advantages over traditional numerical models, including flexibility, accuracy, and execution speed (Dobbelaere et al., 2021). Machine learning is ideally placed to identify salient features in the data that are comprehensible to the human brain. With this approach, it could significantly facilitate a generalization beyond the limits of data, letting data reveal possible structural errors in theory (Sonnewald et al., 2021). Moreover Machine learning offer a clear advantage in capturing the nonlinear interactions between typhoon influencing factors and storm surge magnitude. These models necessitate a one-time investment in training time, enabling swift forecasting using the pre-trained model, thus promoting widespread adoption (Tadesse et al., 2020; Ayinde et al., 2023; Ku and Liu, 2023; Li et al., 2023; Mulia et al., 2023). Ayyad et al. (2022a) employed a coupled ADCIRC and SWAN model to generate a dataset comprising 10,300 typhoon-induced storm surge events. Subsequently, they evaluated predictions using various machine learning (ML) models, including Ridge Regression (RR), Support Vector Machines (SVM), Decision Tree (DT), Random Forest (RF), Extra Trees (ET), Gradient Boosted Decision Tree (GBDT), and Adaptive Boost (AdaBoost). Sun and Pan (2023) innovatively integrated three ML algorithms, RF, GBDT, and XGBoost (XGB), to predict storm surge heights at four tide gauge stations along the coast of Hong Kong, achieving higher accuracy and stability. Al Kajbaf and Bensi (2020) compared the performance of storm surge prediction using artificial neural networks (ANN) based on DL, Gaussian process regression (GPR), and SVM based on ML. Results favored ANN for its superior accuracy in storm surge prediction. Hence, Ayyad et al. (2022b) combined ADCIRC and ANN models for storm surge prediction, revealing that the ANN model notably reduces prediction time while maintaining accuracy.
However, when dealing with long time-series data, the ANN model may face issues like vanishing or exploding gradients. Consequently, many researchers have turned to the LSTM model. For instance, Chen et al. (2022) used LSTM to forecast storm surges at the Lusi tidal station in the East China Sea. Ian et al. (2023) further improved storm surge prediction accuracy by integrating attention mechanisms into the LSTM model. While achieving satisfactory forecasting results, integrating two-dimensional input variables into one dimension leaves room for improvement. CNN offer a powerful solution and are increasingly utilized for predicting typhoon intensity and storm surges (Wimmers et al., 2019; Zhang et al., 2019; Wang R. Z. et al., 2021). Wang K. et al. (2021) assessed storm surge predictions using 11 years of sea level and wind data, finding that the combined LSTM-CNN and CNN-LSTM models outperformed individual CNN and LSTM models. Lee et al. (2021) proposed an improved CNN model that can rapidly forecast the peak storm surge in coastal areas based on the typhoon’s trajectory.
While LSTM and CNN excel in characterizing time series features, their serial computation may reduce efficiency and struggle to capture exceptionally long-term dependencies in sequences (Guo et al., 2021; Massaoudi et al., 2021; Cao et al., 2023). Zhou et al. (2020) introduced the Informer model, an algorithmic improvement based on the Transformer model. The model’s optimizations effectively reduce computational complexity and enhance efficiency, enabling it to capture long-term correlations between sequence inputs and outputs more efficiently (Vaswani et al., 2017; Gong et al., 2023). Despite the successful predictive performance of various enhanced models, their complex nonlinear structures pose challenges in interpreting prediction results, hindering the application of DL models (Montavon et al., 2018; McGovern et al., 2019).
Therefore, this study focuses on the Greater Bay Area of Guangdong Province and proposes an alternative storm surge prediction model that combines mechanistic and data-driven approaches. The main tasks are as follows: (1) Using the dynamic numerical model ADCIRC, construct storm surge data for 16 historical typhoons for training, validation, and testing the data-driven model; (2) Employ LSTM, CNN, and Informer data-driven models to identify the optimal lead time, providing short-term forecasts (1h, 3h, 6h, 12h, 18h) for storm surge at Sanzao (SZ) and Denglongshan (DLS) stations; (3) Utilize SHAP values for interpretability analysis of the input factors’ impact on different models. The framework of the paper is illustrated in Figure 1.

Figure 1 The flowchart of this paper.
The Guangdong-Hong Kong-Macao Greater Bay Area, located at the southern end of mainland China and bordered by the South China Sea, boasts a well-developed river network (see Figure 2). Its unique geographical location and climate contribute to a heightened susceptibility to frequent typhoon-induced storm surge disasters. On average, the region experiences 1.08 tropical cyclones making direct landfall each year (Ye et al., 2020), with some of their paths depicted in Figure 2. The resulting casualties and substantial economic losses pose a significant challenge to both the quality of life for residents and the high-quality development of the national economy.
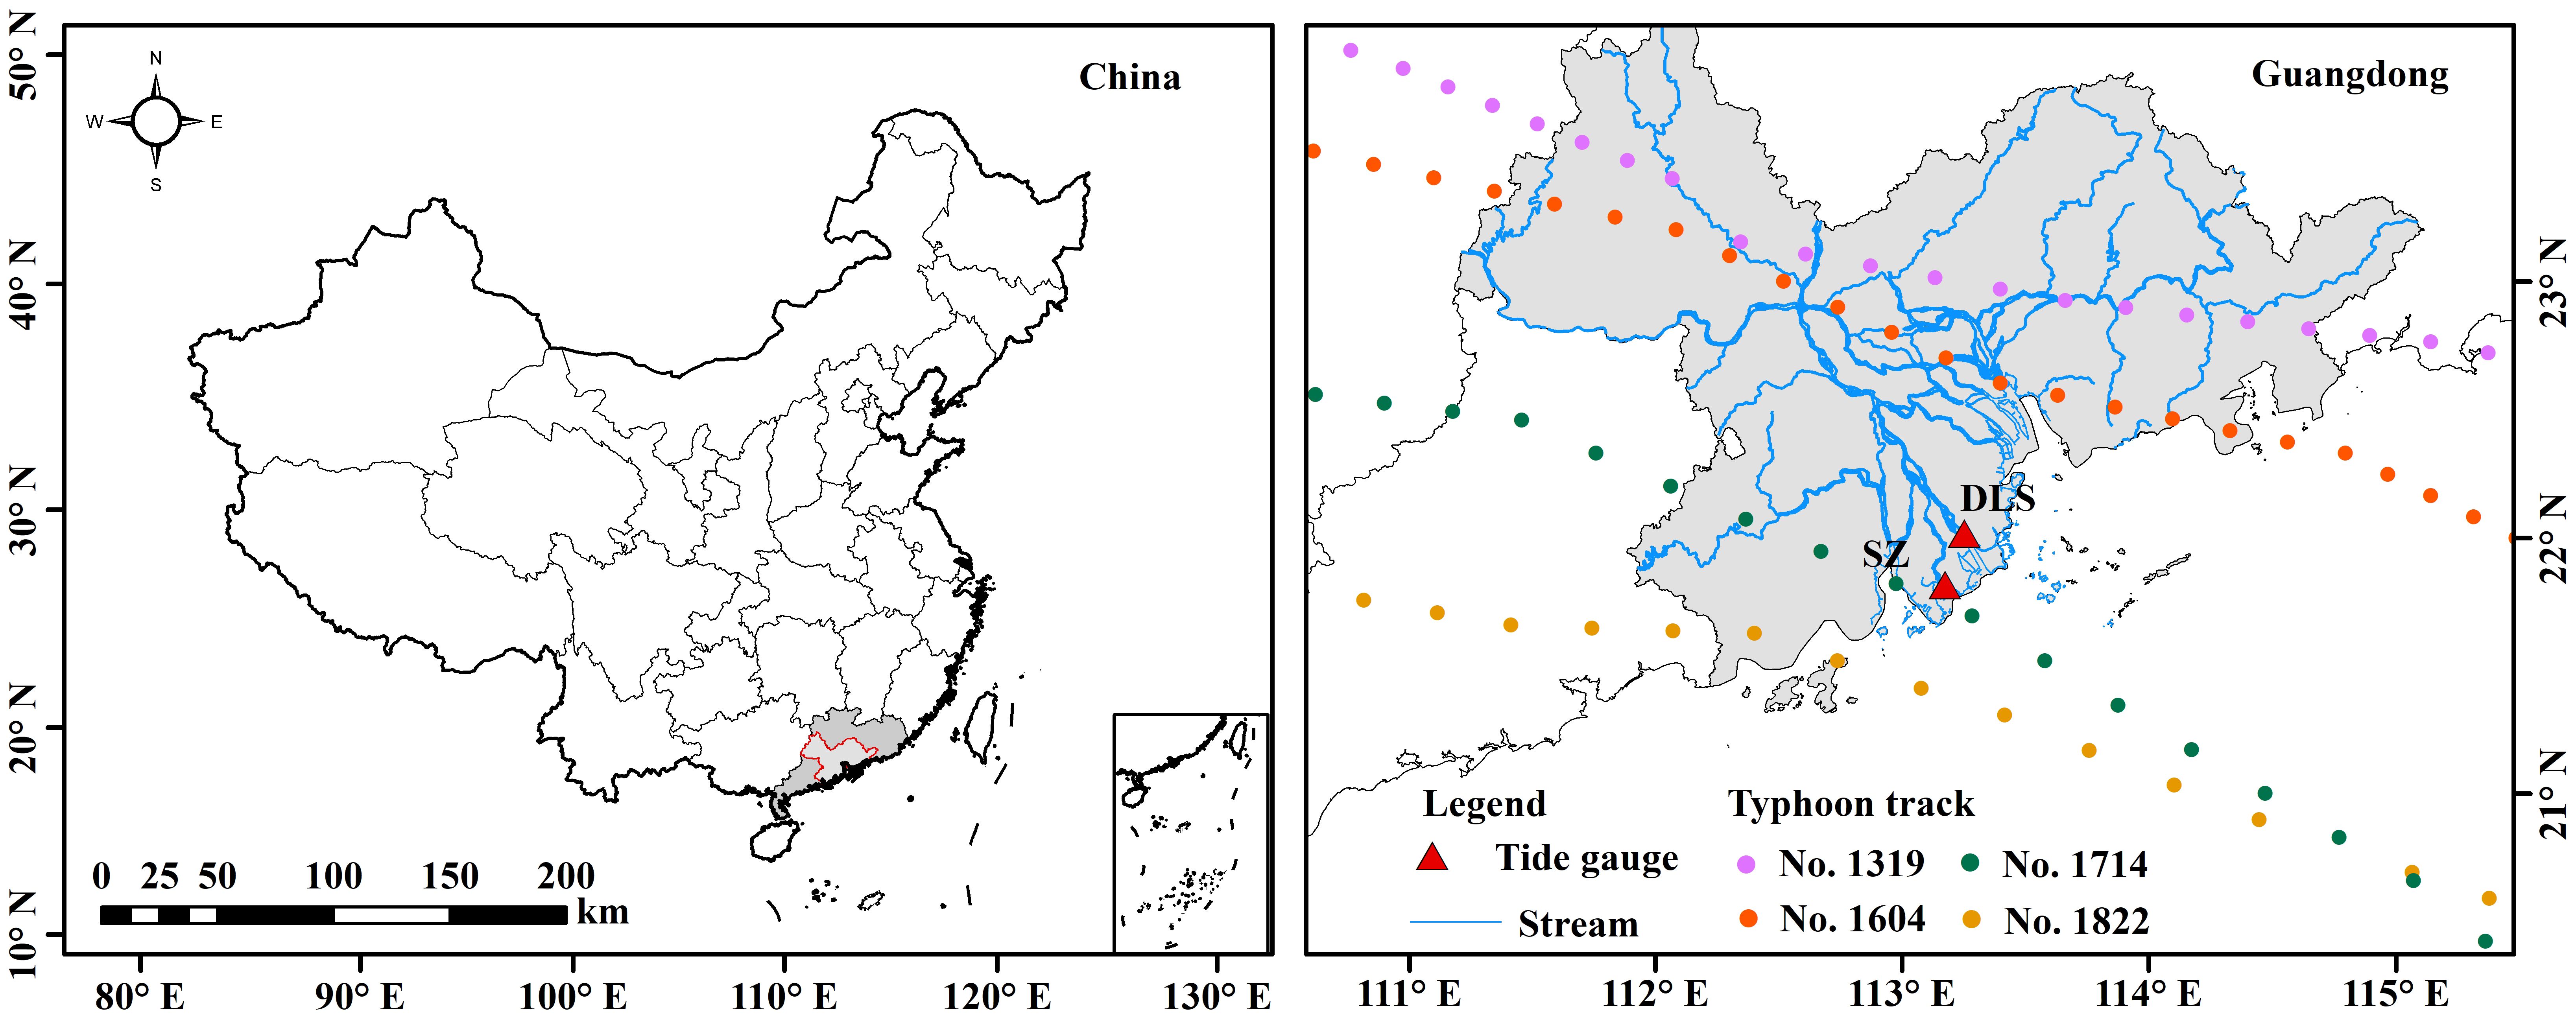
Figure 2 Research area and site distribution.
Selecting 16 typhoons that made landfall in Guangdong Province from 2003 to 2020 (see Table 1), the input factor data is sourced from the “China Meteorological Administration Typhoon Network,” including the time, latitude and longitude, central pressure, maximum wind speed, wind radius, and maximum storm surge data from the “China Historical Materials Collection on Storm Surge Disasters.” Since observed water levels at tide gauge stations were a combination of astronomical tide and storm surge, this study used data from tidal tables for astronomical tide values. Storm surge elevation was derived by subtracting astronomical tide data from real-time water level data.

Table 1 Basic information of typhoons.
The ADCIRC model used in this study is a finite element hydrodynamic model with a non-structured grid (Luettich et al., 1992; Pringle et al., 2021). The non-structured grid ensures higher resolution in areas with drastic changes in water depth and complex coastlines, optimizing computational efficiency (Smith et al., 2010; Zhao et al., 2014; Yin et al., 2017).
Since the two-dimensional model adequately simulates storm surge effects, this study utilized the ADCIRC two-dimensional model. In Cartesian coordinates, the ADCIRC model employs the following integrated two-dimensional continuity and momentum equations (Luettich et al., 1992) along the water depth (Equation 1).
In the spherical coordinate system, the original momentum equation for seawater is as follows (Equations 2, 3):
wherein
: Free surface height above mean sea level (m); t: Time (s); R: Earth’s radius (6378135 m); : Longitude and latitude; : Center point coordinates; (U,V): Depth-averaged horizontal seawater velocity (m/s); H: Total water depth (m); f: Coriolis parameter (s⁻¹); ps: Atmospheric pressure at the free surface (N/m²); ρ0 Seawater density (1025 kg/m³); g: Gravity acceleration (m/s²); η: Newtonian tidal potential (m); : Sea surface stress components (N); : Bottom frictional force components (N); Ω: Earth’s angular rotation velocity.
Typhoon structures are highly complex, and the pressure and wind fields continuously change during the typhoon’s genesis, development, maturation, and dissipation. Commonly used models for describing the pressure field distribution of typhoons include the Jelesnianski, Myers, Takahashi, Holland, and Fujita models (Jelesnianski, 1965; Xu et al., 2014). Accurate wind field models are crucial for calculating storm surge results, and the Holland Typhoon model, known for its high accuracy, is widely applied in the coastal regions of China. Therefore, this study employed the typhoon wind field model proposed by Holland (1980). The pressure equation and wind field formula are as follows (Equations 4, 5):
Where, Pc represents the typhoon’s central pressure, Pn is the peripheral pressure, Rmax is the maximum wind radius, r is the distance from the typhoon center, and B determines the typhoon’s peak and intensity. Increasing B leads to higher wind speeds at the maximum radius and weaker winds at more distant locations. The B parameter typically falls within the range of 1 to 2.5. The formula for calculating the B parameter is as follows (Equation 6):
The maximum wind radius is determined using the formula introduced by Willoughby and Rahn (2004) (Equation 7):
Where, Wmax represents the maximum wind speed, Lat denotes latitude. The inflow angle was set at 25°.
The LSTM addresses challenges in traditional models during long-time sequence training, overcoming issues such as gradient explosions, vanishing gradients, and difficulties in preserving historical data over extended periods (Hochreiter and Schmidhuber, 1997; Liu et al., 2019; Gauch et al., 2021; Tian et al., 2023). LSTM’s self-connected hidden layer captures both cell state and hidden layer state from the previous time step, utilizing ‘forget gates,’ ‘input gates,’ and ‘output gates’ to control information transmission and updating. The LSTM hidden layer structure, as depicted in Figure 3A, involves Ct-1 and Ct for cell state information at time steps t-1 and t. represents the candidate update information at time step t, ht-1 and ht denote the hidden layer state information at time steps t-1 and t, Xt is the input value at time step t, is the sigmoid function, and ft, it, and ot are the control coefficients for the ‘forget gate’, ‘input gate’, and ‘output gate’, respectively.

Figure 3 Model schematic diagram: (A) LSTM model; (B) CNN model.
CNN, equipped with powerful data processing capabilities, consists of convolutional layers and pooling layers responsible for convolution calculations, feature extraction, and parameter sampling and compression (Pradhan et al., 2018; Lee et al., 2019; Mitiche et al., 2020). Utilizing weight sharing and local connectivity, the CNN model maps and processes the initial dataset, extracting relevant features to reduce parameter dimensions and improve computational speed. The principle involves employing multiple filters for feature extraction through layer-by-layer convolution and pooling operations on input data. These features are then converged in fully connected layers, addressing regression problems through activation functions, as depicted in Figure 3B.
The Informer model, an enhanced version of the Transformer model, is a lightweight deep learning model based on attention mechanisms. It effectively captures dependencies in long sequences, offering a novel solution to address prolonged sequence challenges (Zhou et al., 2020). The Informer model comprises an encoder and a decoder, as depicted in Figure 4.
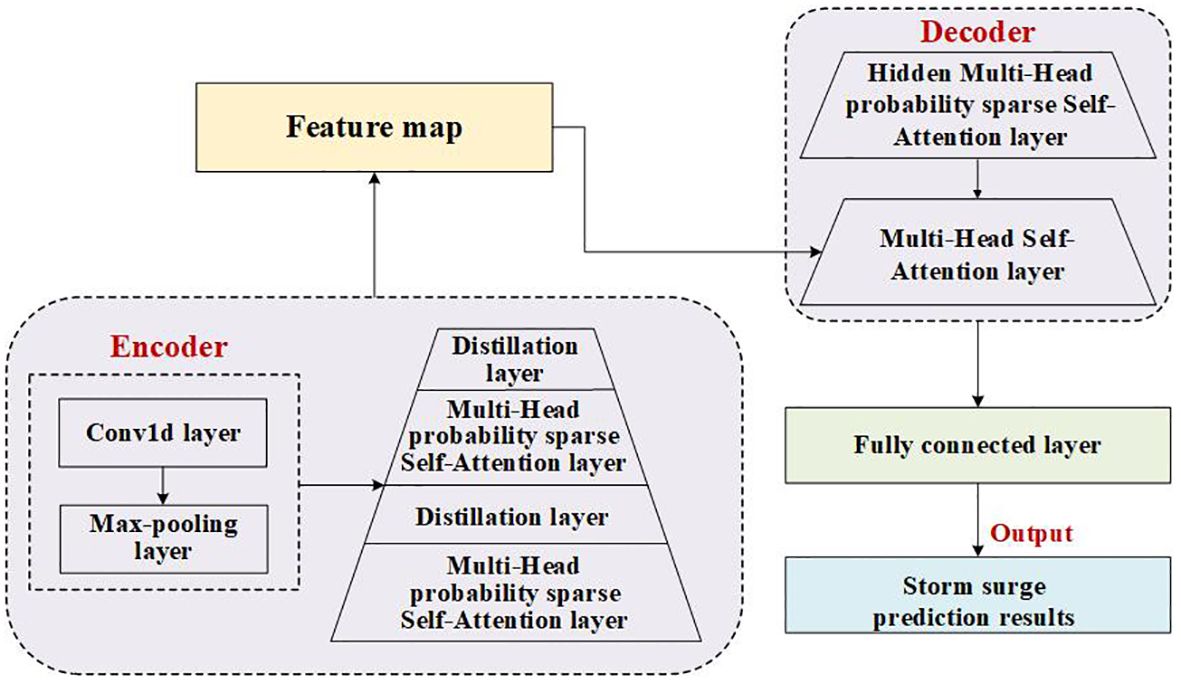
Figure 4 Model schematic of Informer.
The calculation of the attention mechanism primarily involves three vectors: the Query vector matrix (Q), the Key vector matrix (K), and the Value vector matrix (V). Here, LQ represents the sequence dimension of the query vector matrix, LK is the sequence dimension of the key vector matrix, LV is the sequence dimension of the value vector matrix, and d is the input dimension. The probability form A of the attention coefficients for the i-th query is expressed as follows (Equation 8):
The sparsity score M for the i-th Query is expressed as (Equation 9):
The final sparse self-attention formula is as follows (Equation 10):
Where, the matrix is obtained by probabilistic sparsification of the query vector matrix Q.
The Encoder captures long-range dependencies in sequences through a multi-head sparse self-attention module. A distillation layer is utilized to reduce network parameters and emphasize features, and the distillation principle can be expressed as follows (Equation 11):
Where, MaxPool denotes the maximum pooling operation; σ is the activation function, and Conv1d represents one-dimensional convolution operation along the sequence.
The Decoder computes forward and predicts long sequence outputs efficiently in the generative structure of Informer. Its input format is as follows (Equation 12):
Where, Xtoken represents the start character, X0 is a placeholder, and Concat signifies their concatenation.
To compare the predictive accuracy of various models, this study employs Root Mean Square Error (RMSE), Mean Absolute Error (MAE), and the coefficient of determination (R2), as well as the Maximum Relative Error (MRE), as evaluation metrics for model performance. As shown in Table 2, yobs represents the observed values, yf represents the predicted values, represents the mean of the observed values, and n is the number of observed values.
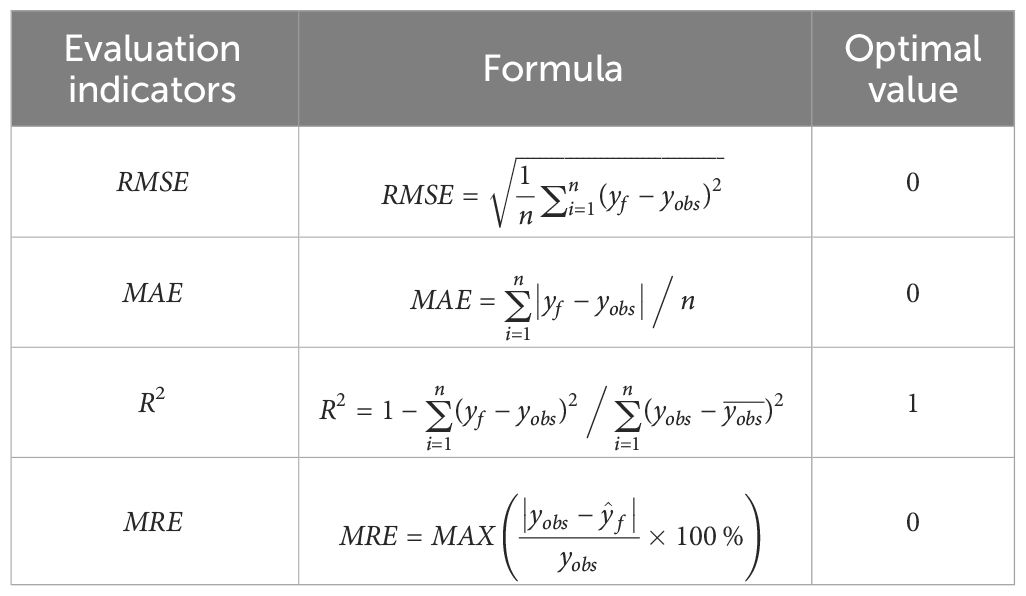
Table 2 Formulas of evaluation indicators.
SHAP, a game theory-based interpretable machine learning method, addresses the challenge of limited interpretability in machine learning models (Štrumbelj and Kononenko, 2014; Wang R. Z. et al., 2021; Wang et al., 2022). It quantifies the specific contributions of each feature to model results by comparing the average changes in output through the construction of combinations of different input variables. The SHAP value for each input variable represents its weighted average marginal contribution (Equation 13):
Where, denotes the SHAP value of input variable i, where a positive (negative) value indicates a positive (negative) contribution of variable i to the predicted result. n is the number of input variables, N is the complete set of input variables, S represents the set excluding variable i, which is a subset of N, and F(S) represents the predicted result based on the input S.
The storm surge model’s calculation region significantly influences the results. If the domain is too small, it may miss distant sea fluctuations, leading to large errors. Conversely, if it’s too large, computational efficiency is impacted. To enhance accuracy while maintaining efficiency, this study covered parts of the northwestern Pacific, central and northern South China Sea, Beibu Gulf, Qiongzhou Strait, and other regions, specifically 105°-132°E, 7°-32°N. The model employed a non-structured triangular mesh created by OceanMesh2D, with a minimum coastal resolution of 2000m and a maximum resolution of 30000m. For regions of less concern, the minimum resolution was set at 3000m. The entire computational domain comprised 160,551 grids and 91,158 nodes, as illustrated in Figure 5. The storm surge model for the Pearl River Estuary utilized GEBCO_2020 global bathymetric data with a resolution of 15″×15″. The typhoon wind fields were generated using the Holland model with input from the China Typhoon Network. The pressure and wind speed results were interpolated onto the model grid points. The model began with a cold start, setting initial water levels and flow fields to zero. In shallow areas, dynamic boundary dry-wet grid technology was applied with a 0.02m threshold for determining dry-wet grids. Grid points with a total water depth below 0.02m were considered dry. Each typhoon model was simulated for 3.5 days with a 10-second time step.
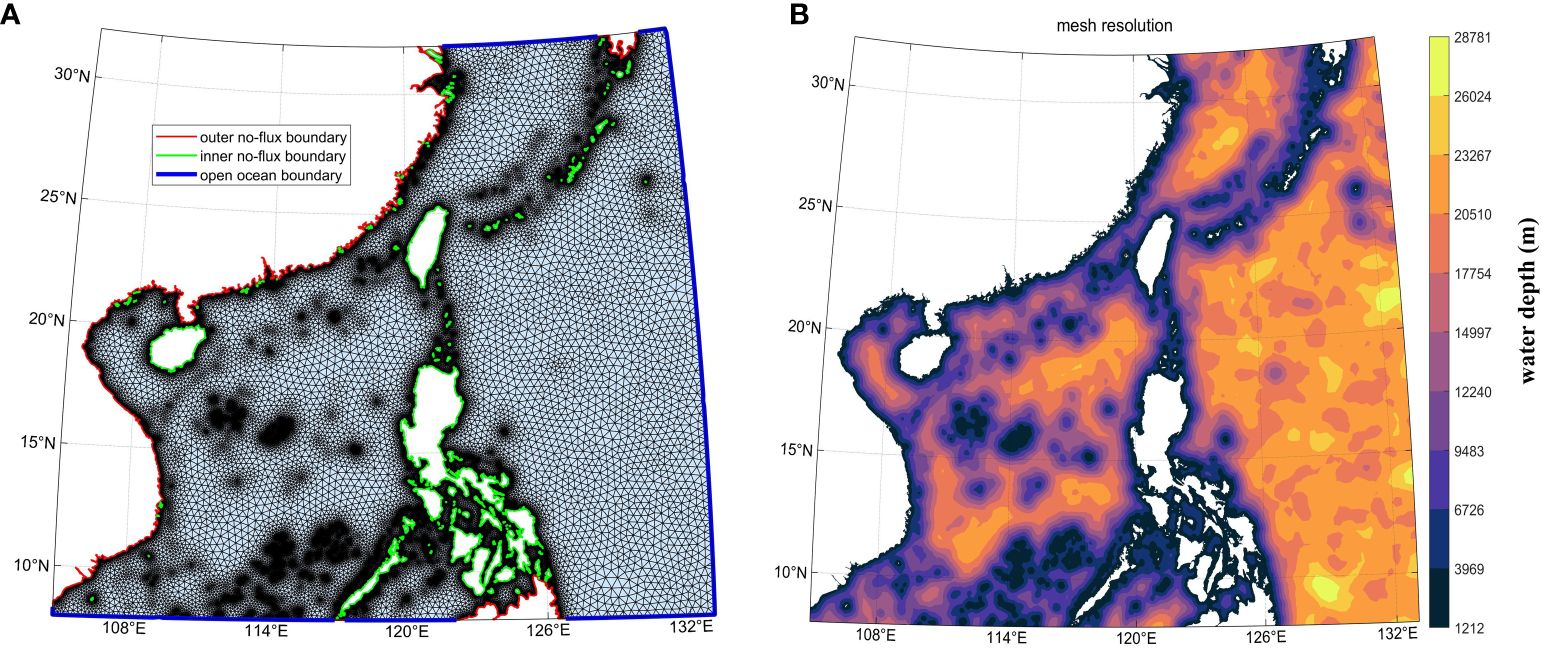
Figure 5 Grid meshing and water depth in the research area. (A) Regional division; (B) Water depth distribution.
Due to space constraints, this model validated storm surge numerical simulations using data from Typhoon “Mangkhut” (1822) and Typhoon “ Nesat “ (2220). As the SZ and DLS stations are located at the entrance of the Modaomen Waterway, they are typically the first to be impacted by typhoons landing near the Pearl River Estuary. Therefore, hourly surge data from these stations were used for verification, as depicted in Figure 6. Typhoon Mangkhut landed around 17:00 on September 16, coinciding with an astronomical neap tide. SZ station experienced a maximum surge of 3.39m at 17:00 on the 16th, with a simulated surge of 3.31m. The absolute water level error for the maximum surge was 0.08m, with a phase error within 1 hour. DLS station recorded a maximum surge of 2.81m at 17:00 on the 16th, while the simulated surge was 2.83m. The absolute water level error for the maximum surge was 0.02m, with a phase error within 1 hour. Due to the close timing of the astronomical tide’s highest level to the typhoon’s landfall, the combination of astronomical tide and storm surge increased the surge and destructive power. The maximum storm surge occurred before or during the typhoon’s landfall for typhoons directly affecting Zhuhai. Affected by Typhoon Nesat, the SZ station experienced a maximum surge of 0.69m around 7:00 on October 18. The simulated maximum surge was 0.67m, resulting in an absolute water level error of 0.02m, with a phase error within 1 hour. The DLS station had its maximum surge of 0.66m around 6:00 on the 18th. The simulated maximum surge was 0.71m, resulting in an absolute water level error of 0.05m, with a phase error within 1 hour.
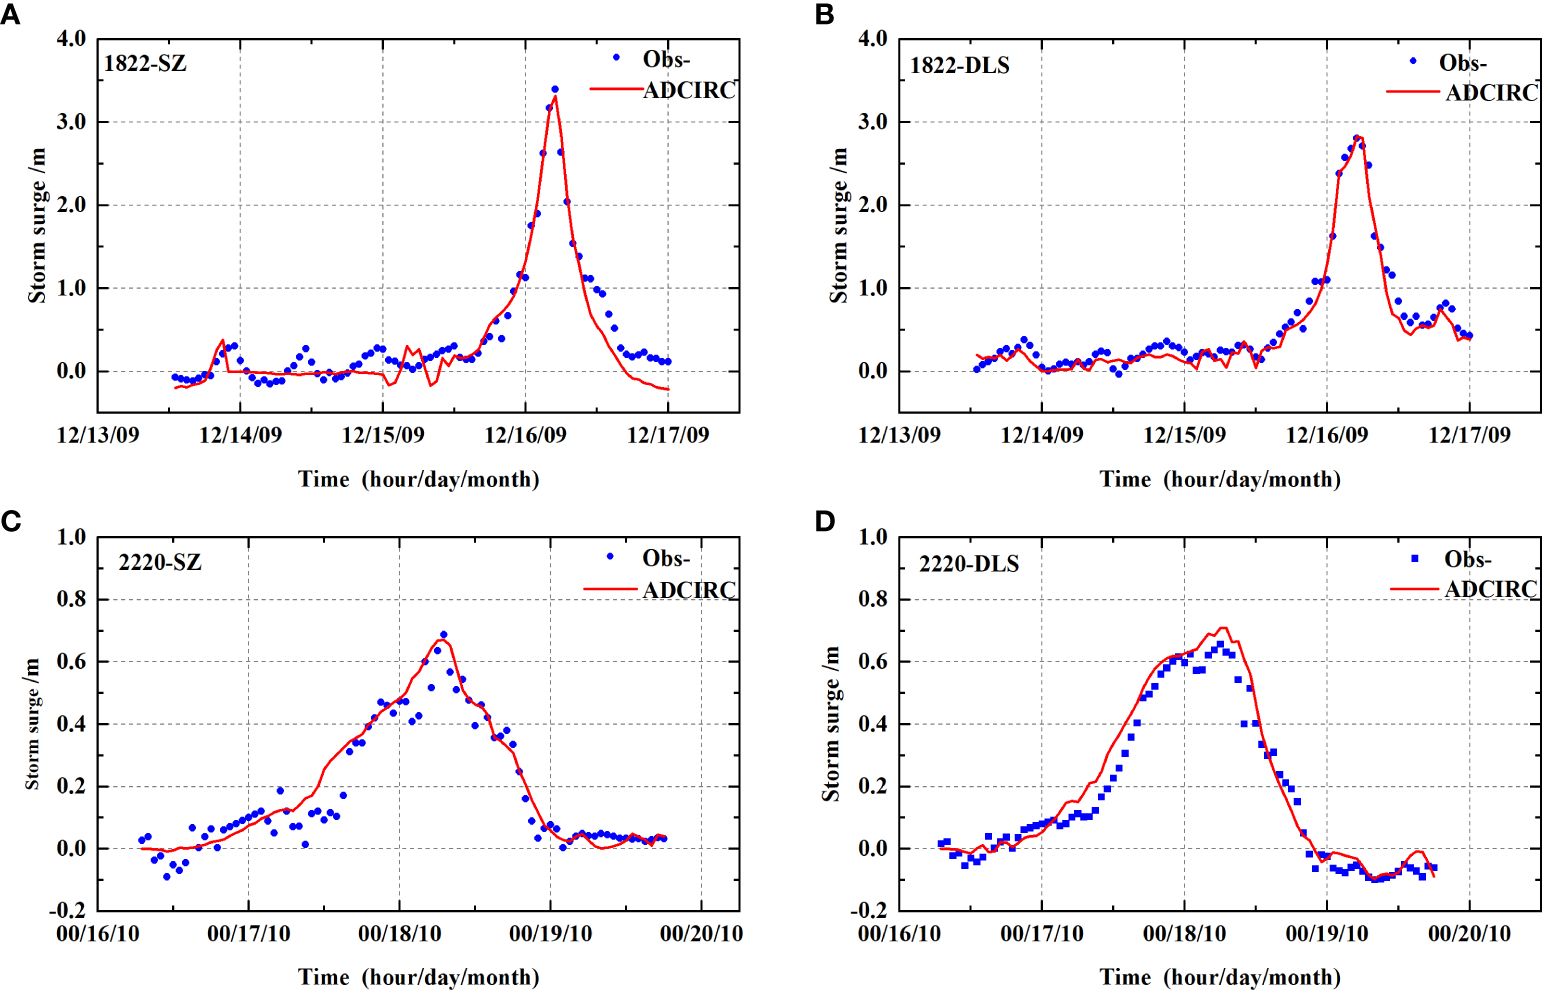
Figure 6 Fitting plots comparing the numerical simulations from the ADCIRC model with the observed value. (A) 1822-SZ station; (B) 1822-DLS station; (C) 2220-SZ station; (D) 2220-DLS station.
In conclusion, the simulation closely matched the observed water level changes, particularly in accurately predicting the maximum surge. The model’s results are reasonable, demonstrating its ability to simulate the storm surge process in the Pearl River Estuary effectively. This lays the groundwork for further analysis of storm surge impact mechanisms in the region.
Based on the simulations during Typhoon 1822 and Typhoon 2220, the maximum storm surge in the Pearl River Estuary were summarized, revealing a spatial distribution (see Figure 7). During Typhoons Mangkhut and Nesat, the surge gradually increased from outside the estuary to the entrance, ranging from 1.5-4.0 meters and 0.4-0.8 meters, respectively. This is attributed to their westward landfall, causing prolonged onshore winds and significant surge in the Pearl River network, influenced by the trumpet-shaped topography of Estuary and upstream runoff.
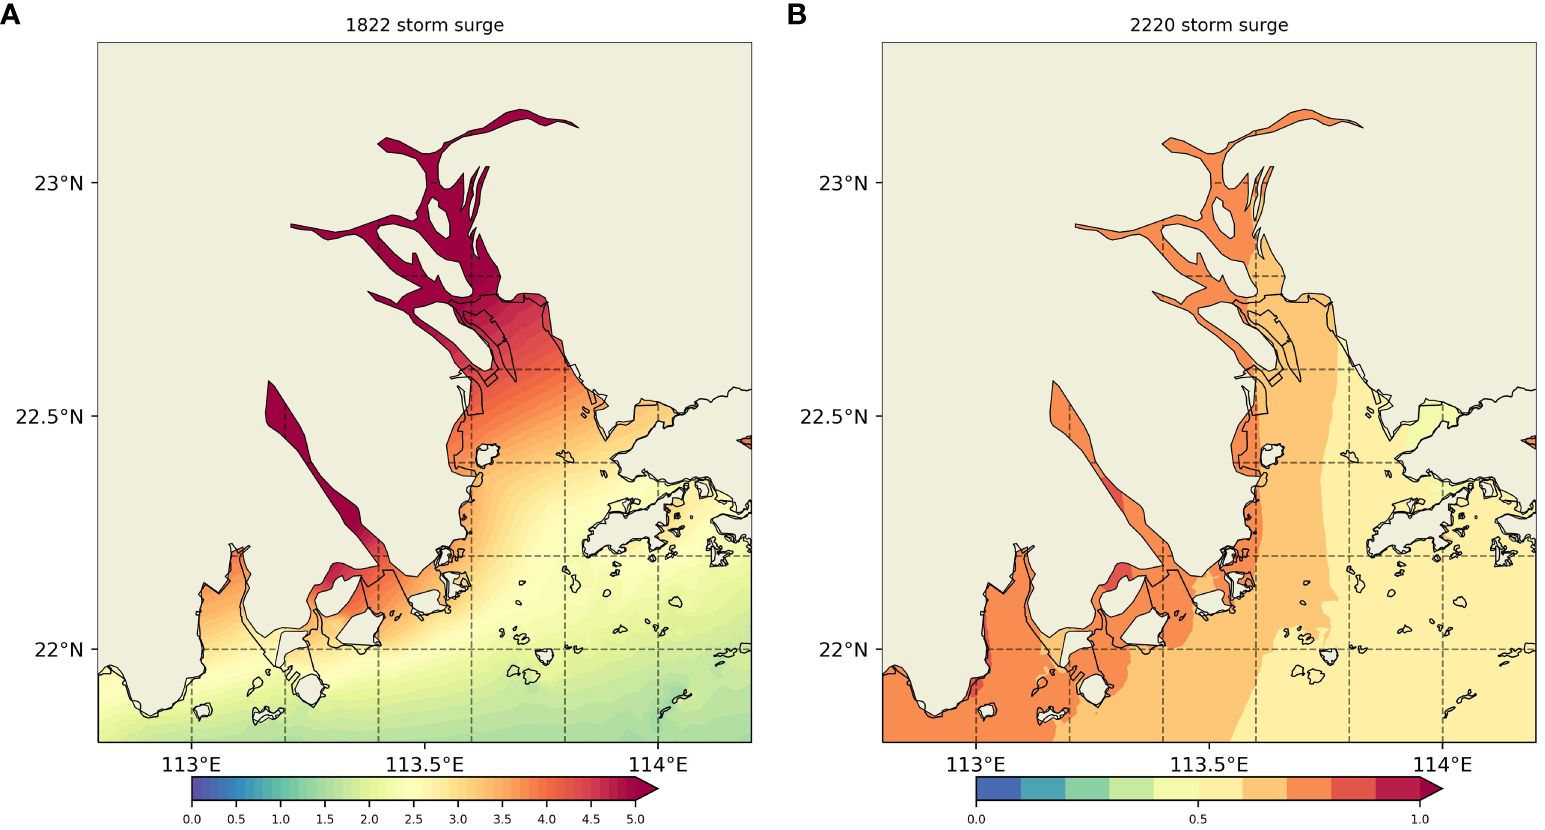
Figure 7 The spatial distribution of maximum storm surge in the Pearl River Estuary, (A) 1822, (B) 2220.
Astronomical tides exhibit predictable periodicity, allowing for relatively straightforward near-term forecasts, supported by mature forecasting methods. In contrast, storm surge prediction is more challenging as it involves not only the influence of previous time sequences but also numerous uncertain factors such as air pressure, wind speed, wind direction, etc (Goff et al., 2019; Bilskie et al., 2020). Especially during the approach of a typhoon, the low-pressure suction effect and sustained strong onshore winds can lead to significant seawater surges, particularly impactful when coinciding with high astronomical tides (Ding et al., 2013; Bilskie et al., 2014). Therefore, storm surge prediction is essentially a multi-factor time series forecasting challenge.
The storm surge prediction model in this study considered multiple factors, including date, latitude, longitude, atmospheric pressure, wind speed, and preceding water level. It’s a multi-factor input, single-output model. To objectively evaluate the model’s performance in forecasting tasks across various time sequences, the dataset was chronologically partitioned. Out of 1344 samples generated by the ADCIRC numerical model simulating 16 typhoons, 70% comprised the training set, 10% served as the validation set, and the remaining 20% constituted the test set.
Model parameter selection significantly impacts prediction outcomes. In this study, parameters were chosen using a controlled variable approach to prevent overfitting of the training set and enhance the generalization ability of the test set. Optimal parameters within predefined ranges are presented in Table 3.
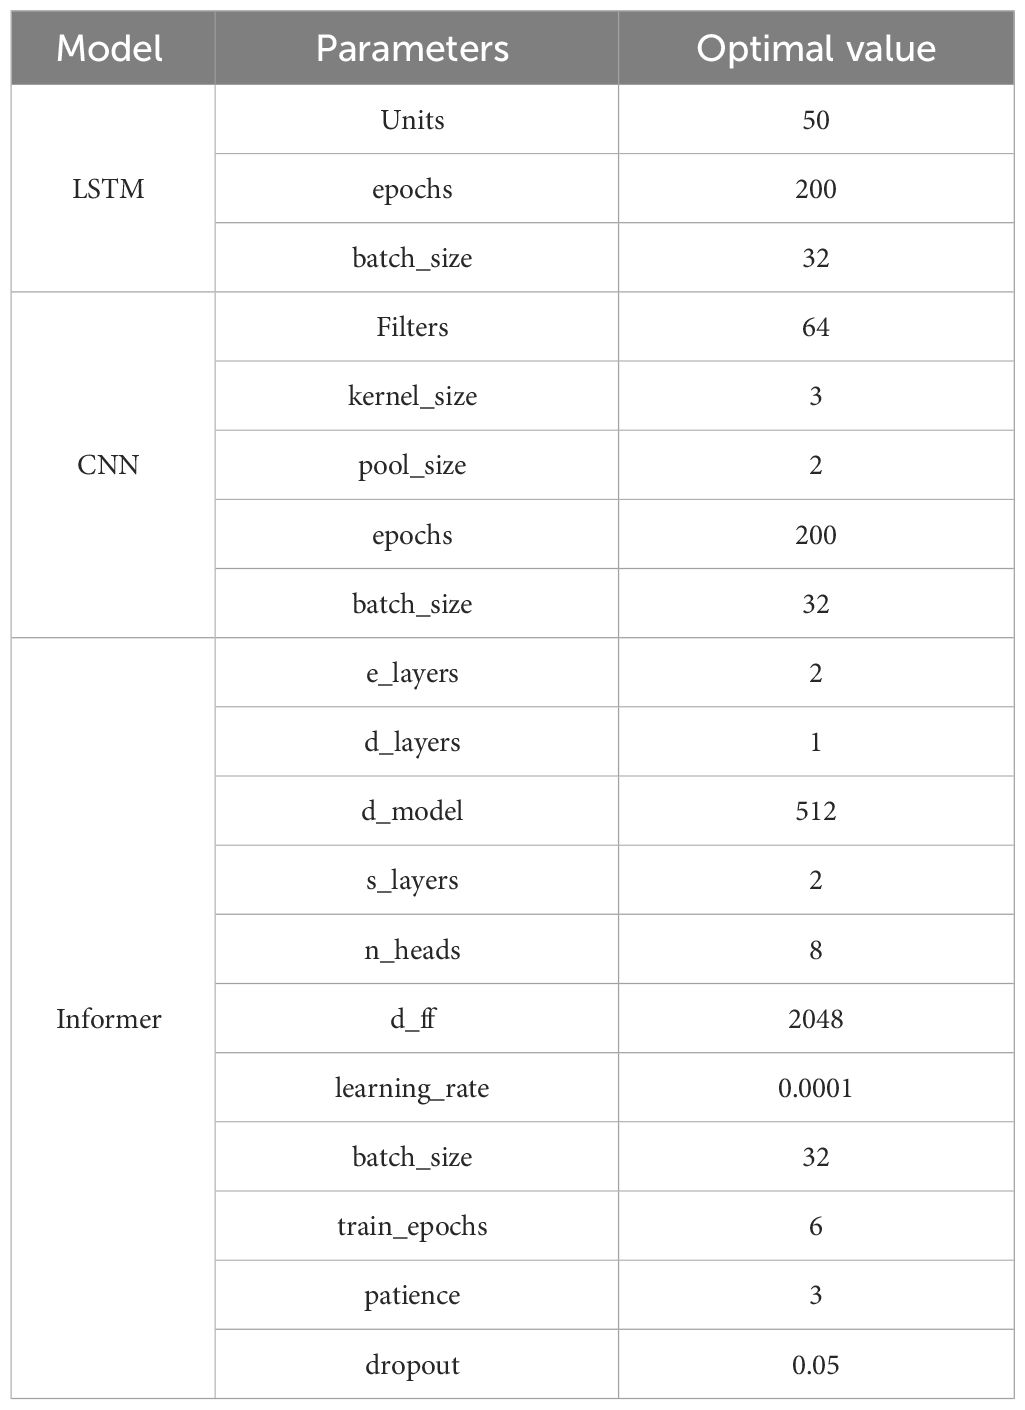
Table 3 Optimal parameters of the model.
To optimize the model’s accuracy, various factors at preceding time steps (6, 12, 18, 24, and 30 hours) were selected as input conditions for training. The trained model was then used to predict storm surge at the SZ and DLS stations for the next 1, 3, 6, 12, and 18 hours. The forecast error results for storm surge at the SZ station are shown in Figure 8. For the best model predicting the next 1 hour, the LSTM model with a preceding time step of 6 hours achieved an RMSE of 0.11m and MAE of 0.07m. The best model for predicting the next 3 hours was the CNN model with a preceding time step of 12 hours, resulting in an RMSE of 0.22m and MAE of 0.12m. The best model for predicting the next 6 hours was the Informer model with a preceding time step of 18 hours, resulting in an RMSE of 0.30m and MAE of 0.15m. For the next 12 hours, the best model was the Informer model with a preceding time step of 24 hours, resulting in an RMSE of 0.40m and MAE of 0.19m. Finally, for the next 18 hours, the best model was the Informer model with a preceding time step of 30 hours, resulting in an RMSE of 0.47m and MAE of 0.24m. The storm surge forecast error results for the DLS station were shown in Figure 9. Consistent with the forecast results for the SZ station, the optimal models and their respective preceding time steps for different forecast periods were as follows:
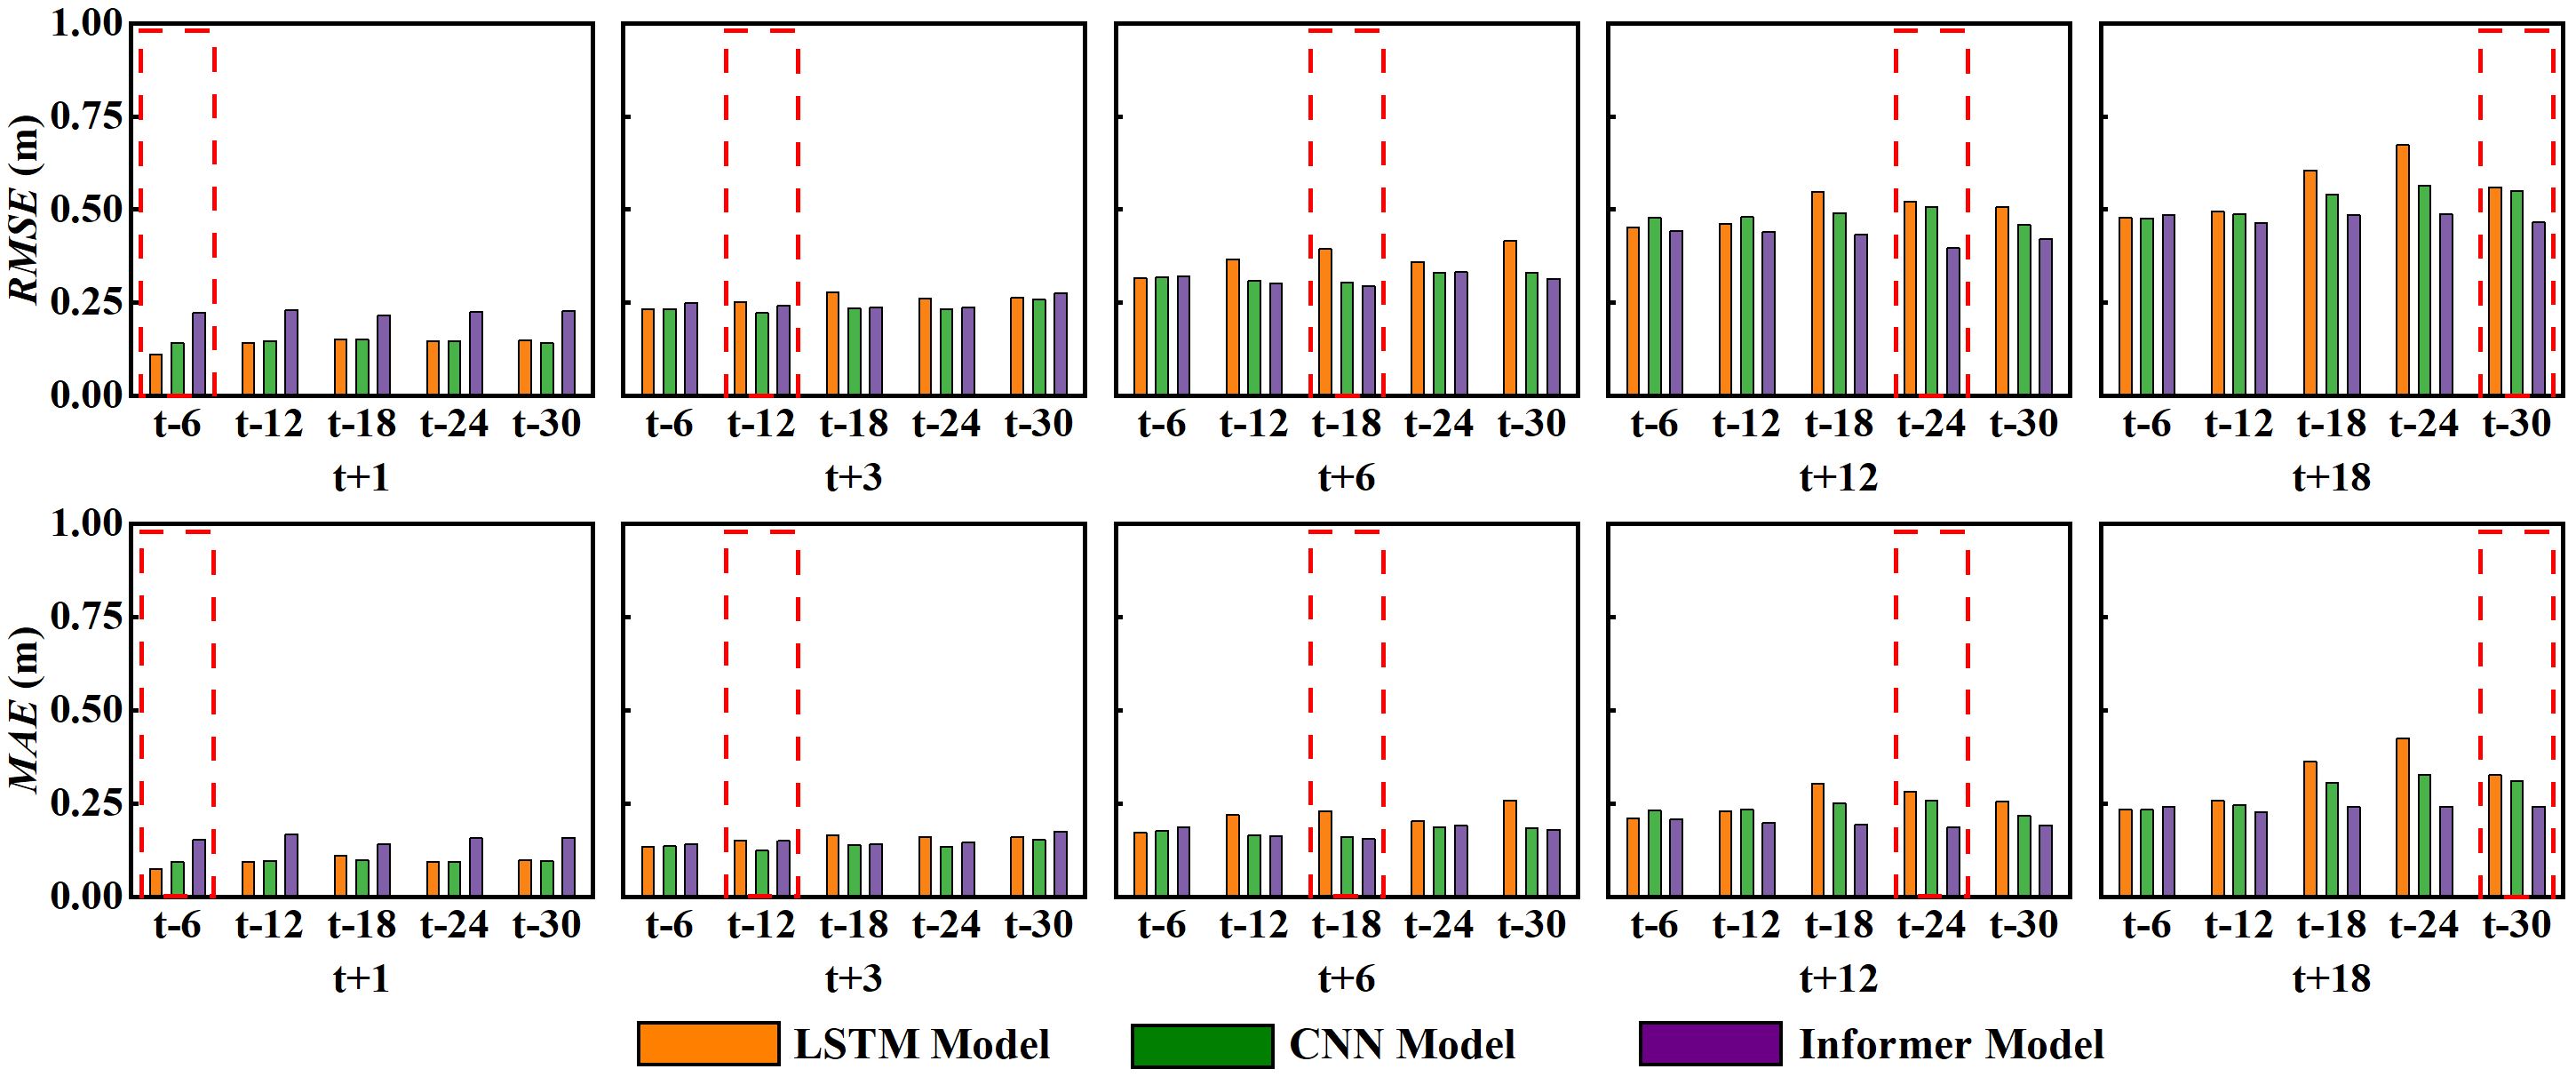
Figure 8 Forecast error chart at the SZ station.
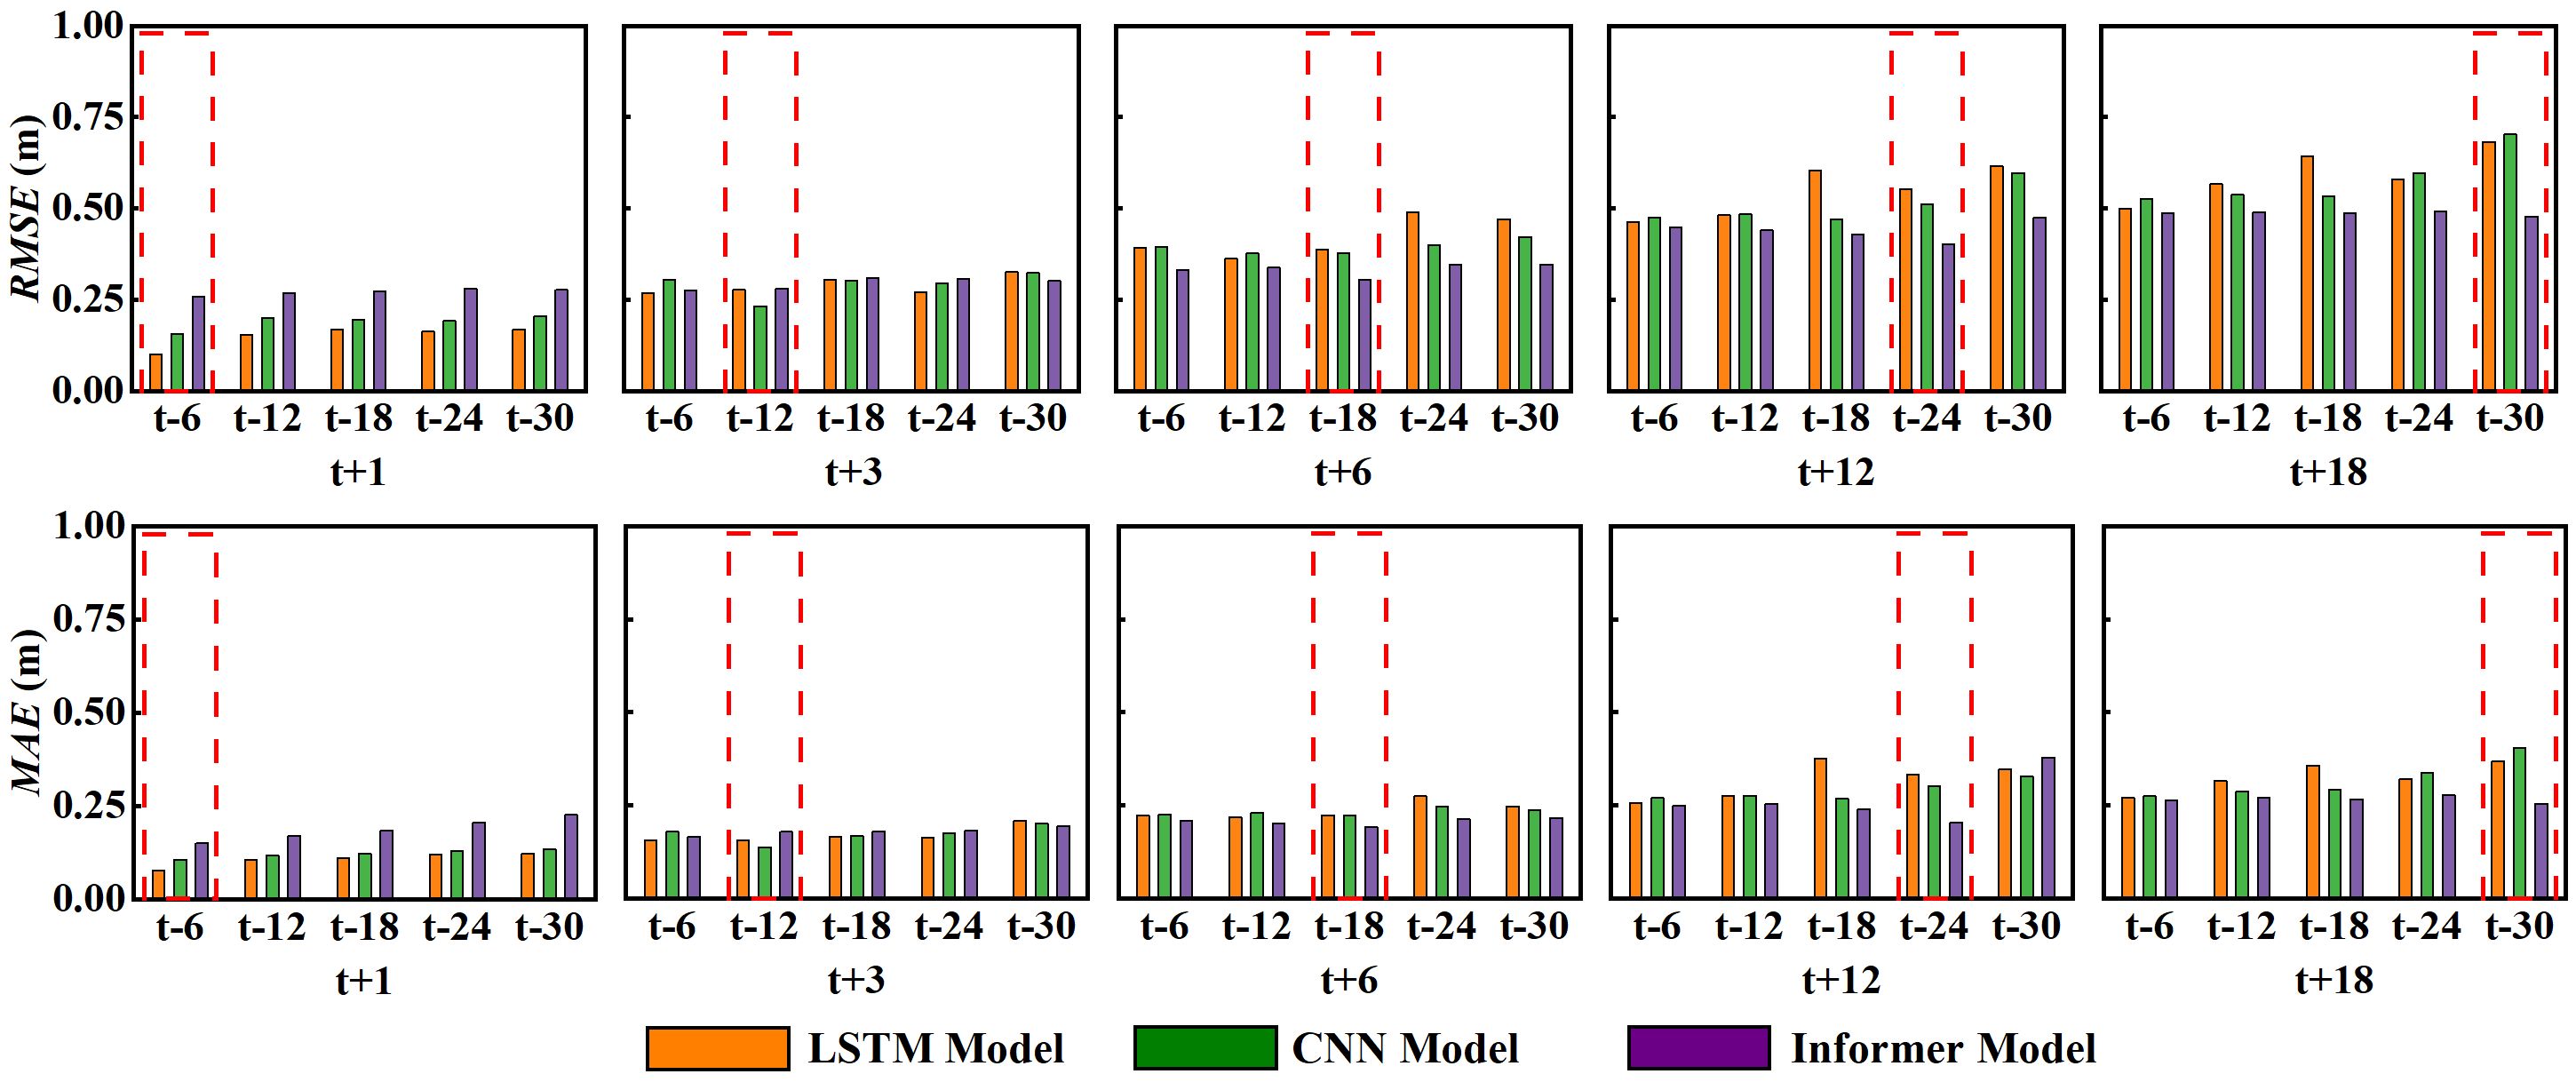
Figure 9 Forecast error chart at the DLS station.
1-hour forecast: LSTM model with a 6-hour preceding time step.
3-hour forecast: CNN model with a 12-hour preceding time step.
6-hour, 12-hour, and 18-hour forecasts: Informer model with preceding time steps of 18, 24, and 30 hours, respectively.
Based on the above analysis, optimal models and corresponding lead times were selected to forecast storm surge at SZ and DLS stations. As depicted in Figure 10, the model’s accuracy diminishes with longer forecast extension. Meanwhile, occasional significant deviations are noted in optimal model predictions across various forecast extension. While these deviations don’t affect overall predictions, they can impact the objectivity of evaluating model performance using MRE. Hence, when assessing overall performance using MRE, deviations at individual points were disregarded.
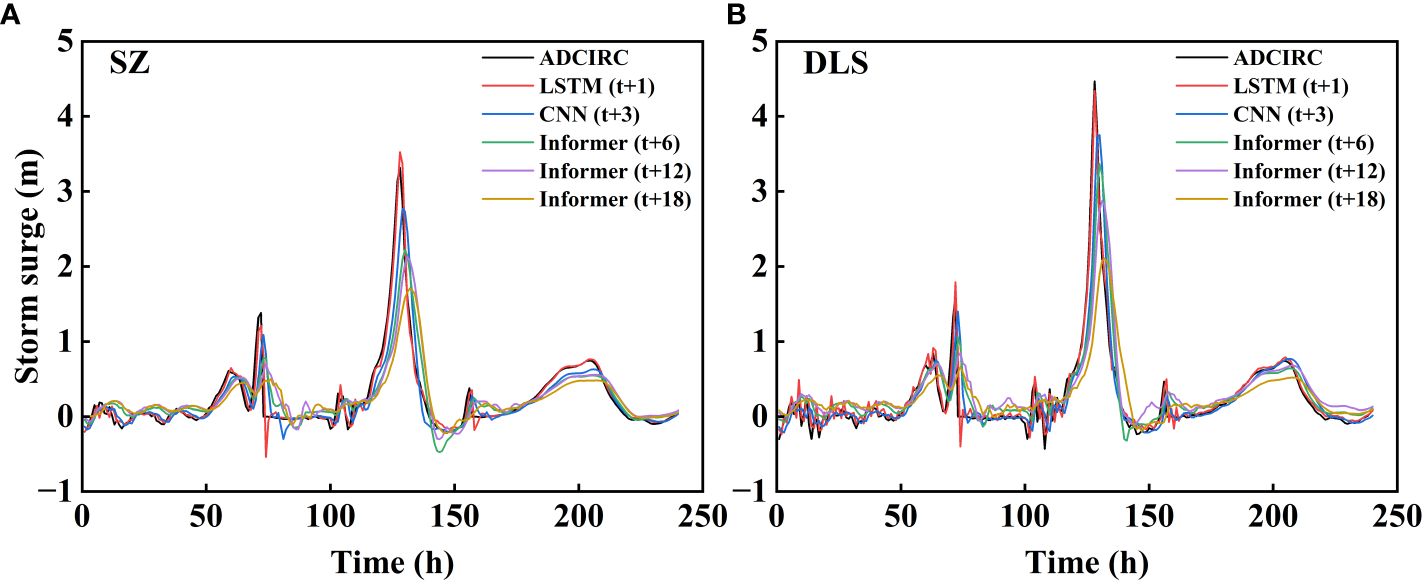
Figure 10 Fitting plots comparing the predicted results of data-driven models with the numerical simulations from the ADCIRC model. (A) SZ station; (B) DLS station.
Table 4 shows the performance of different models in predicting storm surges at SZ and DLS stations across various forecast extension. For the 1-hour forecast, LSTM performed best, with RMSE, MAE, R², and phase error indicators around 0.10, 0.07, 0.95, and 0.05 hours, respectively, and MRE between 13% and 16%. For the 3-hour forecast, CNN emerged as the top model, with RMSE, MAE, R², and phase error indicators approximately 0.22, 0.12, 0.79, and 0.21 hours, respectively, and MRE ranging from 25% to 43%. However, for longer forecast horizons, neither LSTM nor CNN outperformed the Informer model. The Informer model showed superior performance for forecasts spanning 6 to 18 hours, with RMSE, MAE, and R² ranging between 0.29-0.48, 0.15-0.26, and 0.50-0.70, respectively. Phase error was maintained within 0.30-0.51 hours, and MRE ranged from 70% to 75%. This highlights Informer’s superior adaptability to and proficiency in addressing long-term prediction needs, attributed to its lightweight Transformer-based design incorporating robust attention mechanisms for more precise capturing of dependencies in extended sequences.
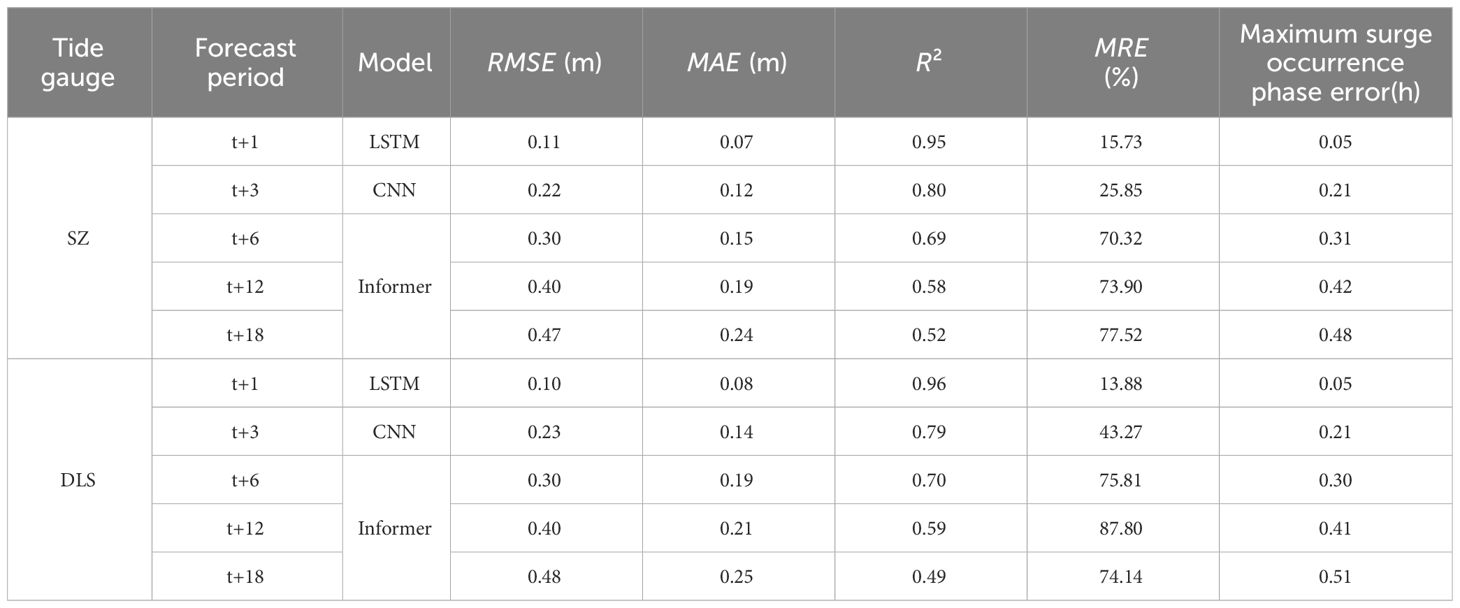
Table 4 Evaluation of predicted results against numerical simulation results on the test set.
For better interpretability of various prediction models, the SHAP visualization tool was used to investigate the importance and contribution of input features in predicting results at the two stations. The average SHAP value for each feature was calculated based on the mean of absolute SHAP values across all samples. Figure 11 showed varying importance rankings and global impact diagrams for input features among the three models at the SZ station. This discrepancy arises because SHAP value calculation is based on the model’s structure and specific feature values of each sample. Therefore, variations in the structure and parameters of different models lead to differences in their SHAP values for the same feature (Ullah et al., 2022; Prendin et al., 2023). In the LSTM model, longitude had the most significant impact, followed by latitude, and then atmospheric pressure and wind speed. In the CNN model, wind speed was the most influential, followed by longitude, and then latitude and atmospheric pressure. In the Informer model, longitude had the most substantial impact, followed by wind speed, and then latitude and atmospheric pressure.
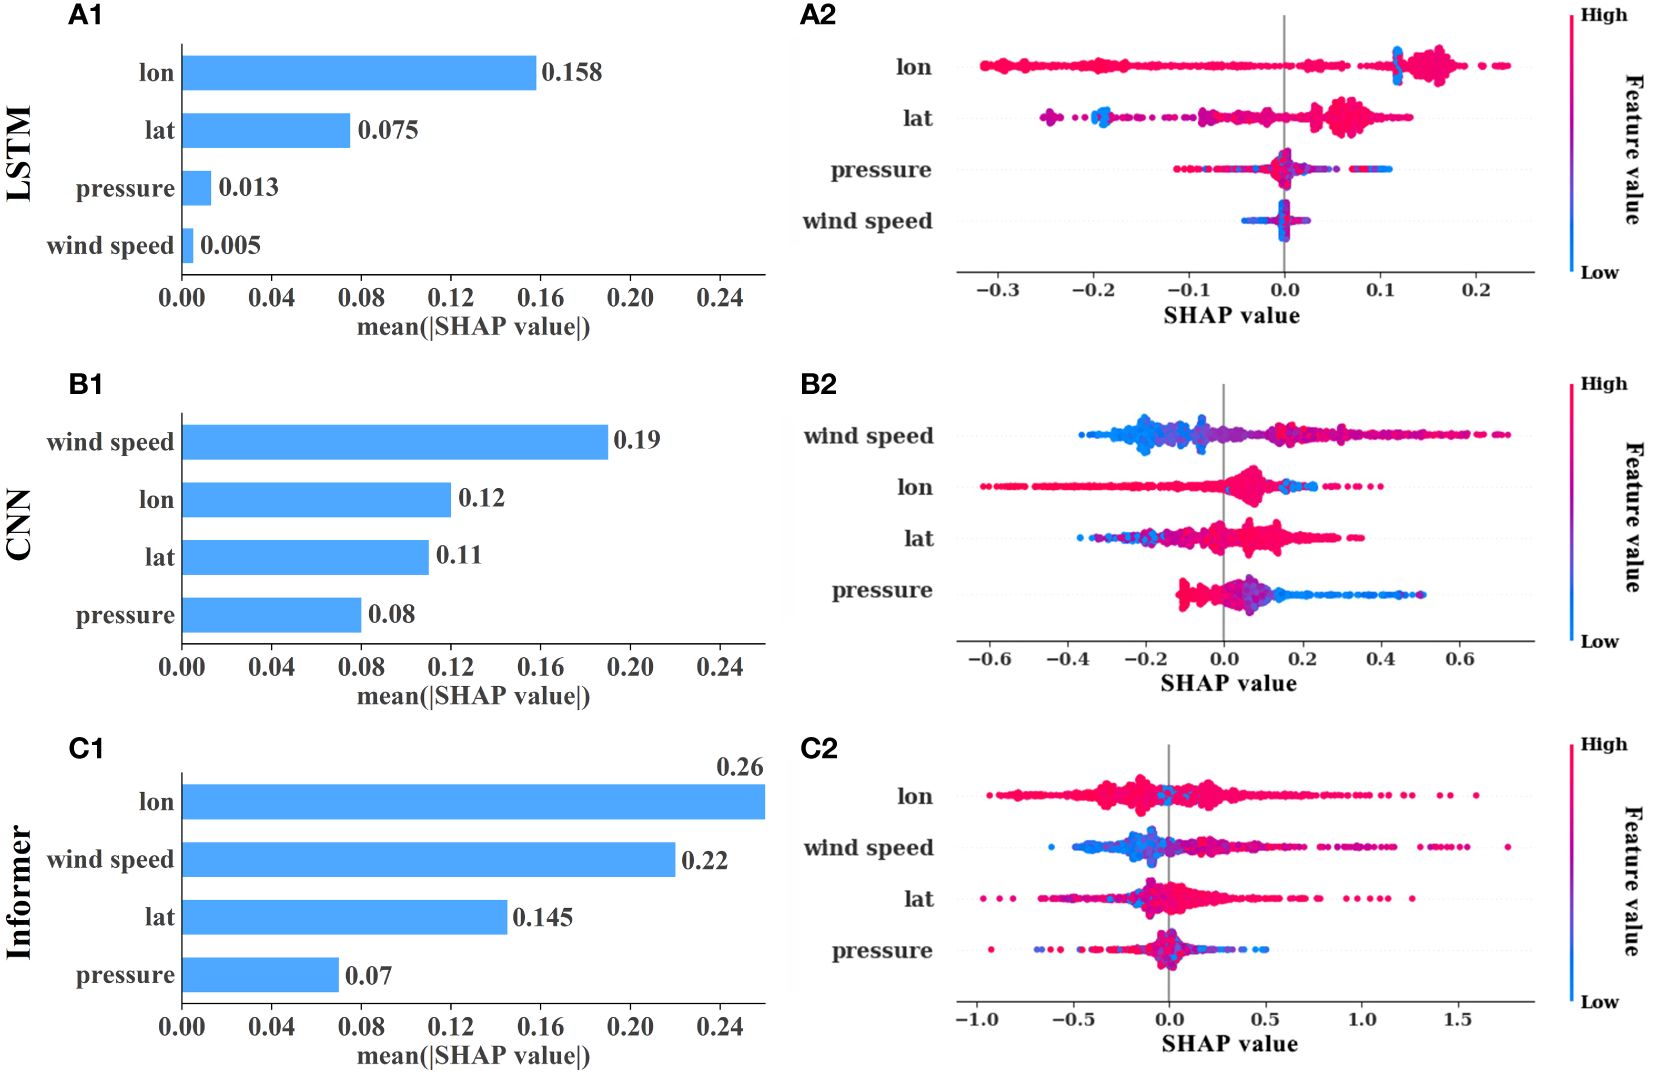
Figure 11 The feature importance and global impact charts for different prediction models at SZ station. (A–C) represent LSTM, CNN and Informer model respectively, corner mark 1 represents feature importance ranking, corner mark 2 represents global impact map.
In comparing Figure 12, it was evident that the feature importance rankings at DLS station were identical to those at SZ station within the same model. While different models exhibited varying feature importance rankings, longitude consistently hold a high degree of influence on prediction results. Even when ranked second, the difference in impact between longitude and the most influential feature was minimal. This emphasized the crucial role of longitude in predicting storm surge across different tide gauge stations. Considering Figures 11, 12, except for atmospheric pressure exhibiting a negative impact on prediction results in different models at the two stations, both latitude and wind speed consistently exerted noticeable positive influences on the prediction outcomes.
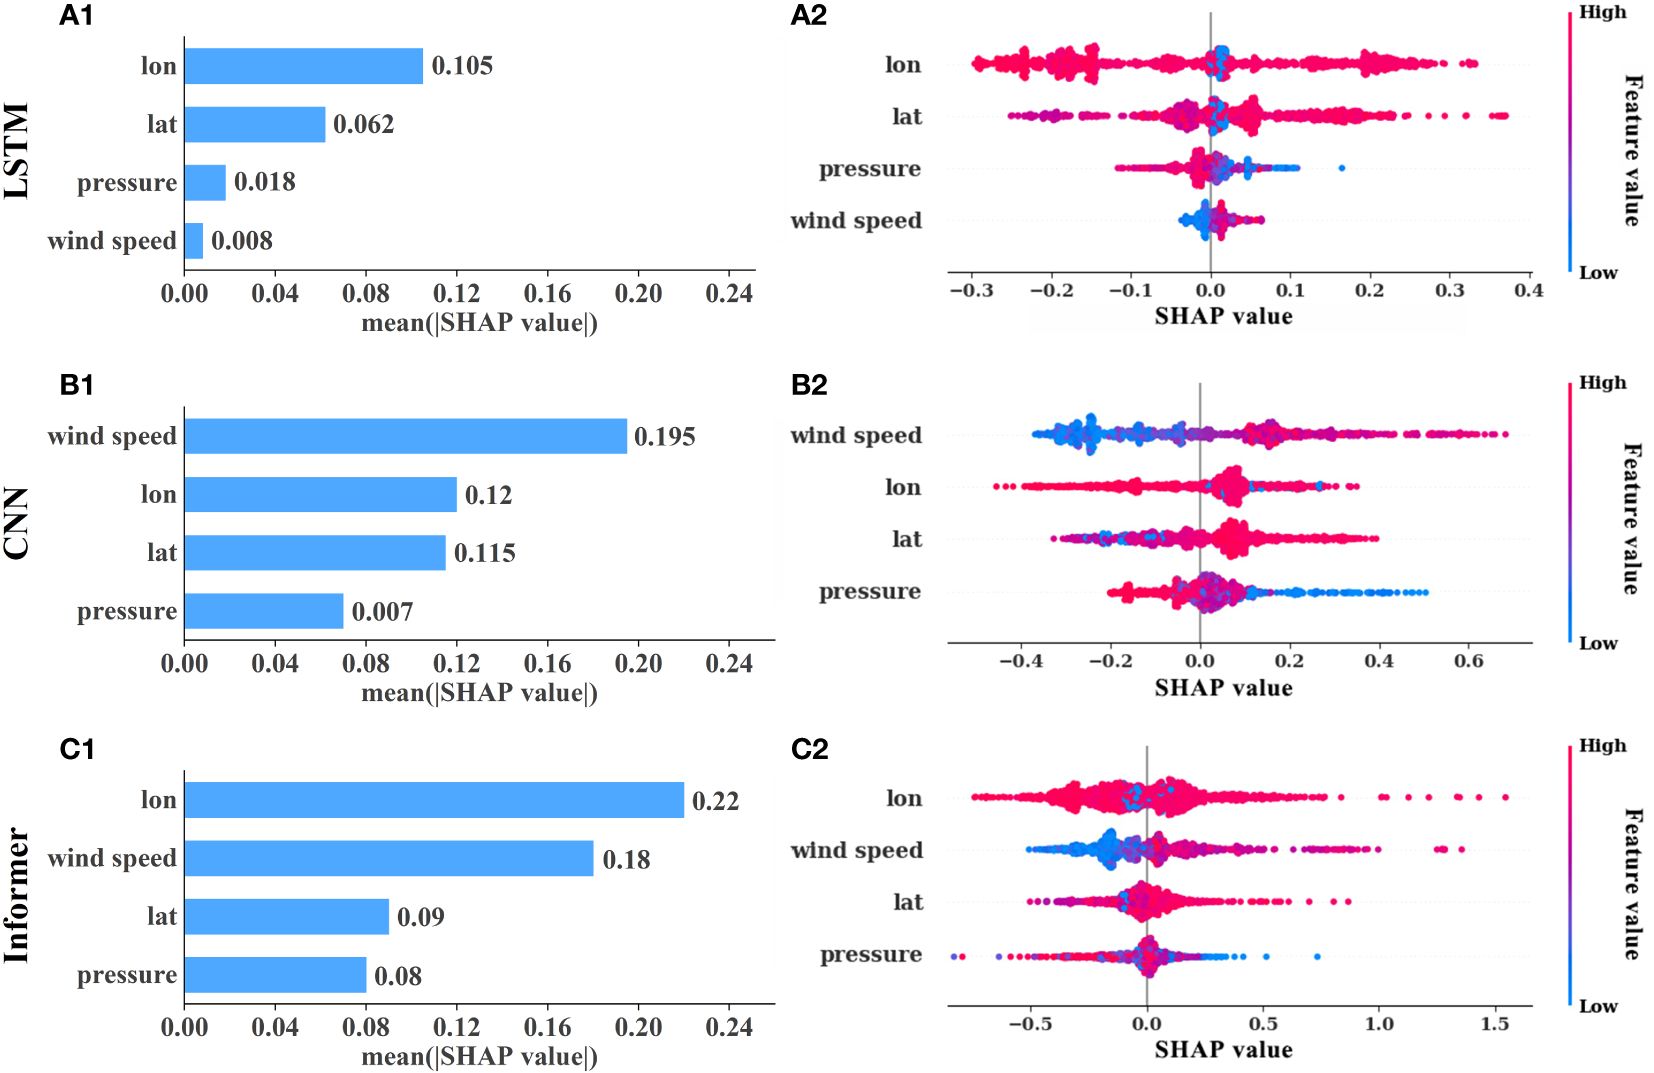
Figure 12 The feature importance and global impact charts for different prediction models at DLS station. (A–C) represent LSTM, CNN and Informer model respectively, corner mark 1 represents feature importance ranking, corner mark 2 represents global impact map.
Storm surges, dynamic and intricate systems with a distinct oceanic lifecycle, face a challenge due to the scarcity of real-time observational data. The intricate terrain around the Pearl River Estuary induces phenomena like wave reflection, refraction, and breaking as waves approach the shore, causing wave accumulation and subsequent water level rise. The absence of detailed data on seawall features, land elevation, and block properties has persistently impeded the development of higher-resolution numerical models for storm surges (Jia et al., 2016; Contento et al., 2020; Huang, 2022). Compared to traditional dynamic models, data-driven models have a more streamlined structure. Even in the absence of boundary conditions, terrain, and runoff signals, they can still replicate the numerical simulation results, serving as a reference for operational departments in short-term forecasting. The opaque nature of DL models complicates the understanding of neural network behavior, leading to diverse levels of interpretability across models. For landfalling typhoons, the landing location and central minimum pressure notably influence storm surge, aligning with SHAP interpretability analysis results. The study encountered computational memory constraints, limiting the expansion of network depth and neuron count per layer. As a consequence, the research primarily provided short-term forecasts within 24 hours. For forecasts beyond this timeframe, dynamical models were deemed more reliable. It’s crucial to recognize that the predictive performance of neural network models is closely tied to the representativeness of selected samples. The data used in this study were from tide gauges in the Modaomen Waterway of the Pearl River Estuary, exhibiting localized characteristics. In practical applications, considering the region’s spatiotemporal features, it’s advisable to leverage reanalysis data, satellite observations, synthetic typhoon data, etc. Techniques like transfer learning can be used for cross-space and cross-time data fusion and assimilation among diverse samples, enhancing the model’s generalization capability.
In this study, we employed both the dynamic numerical model ADCIRC and data-driven models, including LSTM, CNN, and Informer, to forecast storm surge. Simultaneously, we conducted interpretability analysis on the various input features of different models for two tide gauge stations. The key findings of this study are summarized as follows:
(1) The ADCIRC numerical model effectively simulated storm surge variations induced by Typhoon Mangkhut (1822) and Typhoon Nesat (2220), displaying excellent consistency with observed data and accurately portraying the storm surge processes.
(2) Using ADCIRC numerical simulation data as samples, storm surge predictions were performed with LSTM, CNN, and Informer models. The optimal models and their respective preceding time steps for different forecast periods were as follows:
1-hour forecast: LSTM model with a 6-hour preceding time step.
3-hour forecast: CNN model with a 12-hour preceding time step.
6-hour, 12-hour, and 18-hour forecasts: Informer model with preceding time steps of 18, 24, and 30 hours, respectively.
(3) Utilizing SHAP for interpretable machine learning analysis, diverse models displayed unique feature importance rankings. However, within the same model, consistency emerged across different tidal stations. longitude consistently exhibited a significant impact on prediction results in models at different stations. Moreover, apart from atmospheric pressure negatively affecting predictions, Latitude and wind speed consistently exerted positive influences.
In summary, the data-driven DL models showed robust forecasting performance, capturing the actual storm surge variations effectively. With significantly faster operational speeds compared to dynamic models, they offer high applicability and forecasting accuracy, providing valuable scientific support and references for future storm surge predictions along the Greater Bay Area coastline.
The raw data supporting the conclusions of this article will be made available by the authors, without undue reservation.
QT: Conceptualization, Data curation, Investigation, Writing – original draft. WL: Data curation, Formal analysis, Investigation, Writing – original draft. YT: Conceptualization, Investigation, Methodology, Supervision, Writing – review & editing. HG: Data curation, Investigation, Methodology, Writing – original draft. LG: Conceptualization, Resources, Writing – original draft. YJ: Conceptualization, Writing – original draft.
The author(s) declare financial support was received for the research, authorship, and/or publication of this article. National Key Research and Development Program of China (grant number 2021YFC3001000)
Author LG is employed by Henan Water Conservancy Investment Group Co., Ltd.
The remaining authors declare that the research was conducted in the absence of any commercial or financial relationships that could be construed as a potential conflict of interest.
All claims expressed in this article are solely those of the authors and do not necessarily represent those of their affiliated organizations, or those of the publisher, the editors and the reviewers. Any product that may be evaluated in this article, or claim that may be made by its manufacturer, is not guaranteed or endorsed by the publisher.
Al Kajbaf A., Bensi M. (2020). Application of surrogate models in estimation of storm surge: A comparative assessment. Appl. Soft Comput. 91, 106184. doi: 10.1016/j.asoc.2020.106184
Ayinde A. S., Yu H. M., Wu K. J. (2023). Sea level variability and modeling in the Gulf of Guinea using supervised machine learning. Sci. Rep-UK. 13, 21318. doi: 10.1038/s41598-023-48624-1
Ayyad M., Hajj M. R., Marsooli R. (2022a). Machine learning-based assessment of storm surge in the New York metropolitan area. Sci. Rep-UK. 12, 19215. doi: 10.1038/s41598-022-23627-6
Ayyad M., Hajj M. R., Marsooli R. (2022b). Artificial intelligence for hurricane storm surge hazard assessment. Ocean Eng. 245, 110435. doi: 10.1016/j.oceaneng.2021.110435
Bilskie M. V., Hagen S. C., Medeiros S. C. (2020). Unstructured finite element mesh decimation for real-time Hurricane storm surge forecasting. Coast. Eng. 156, 103622. doi: 10.1016/j.coastaleng.2019.103622
Bilskie M. V., Hagen S. C., Medeiros S. C., Passeri D. L. (2014). Dynamics of sea level rise and coastal flooding on a changing landscape. Geophys. Res. Lett. 41, 927–934. doi: 10.1002/2013GL058759
Burla M., Baptista A. M., Zhang Y. L., Frolov S. (2010). Seasonal and interannual variability of the Columbia River plume: A perspective enabled by multiyear simulation databases. J. Geophys. Res-Oceans 115, C00B16. doi: 10.1029/2008JC004964
Cao Y. S., Liu G., Luo D. H., Bavirisetti D. P., Xiao G. (2023). Multi-timescale photovoltaic power forecasting using an improved Stacking ensemble algorithm based LSTM-Informer model. Energy 283, 128669. doi: 10.1016/j.energy.2023.128669
Chen C. S., Beardsley R. C., Cowles G. (2006). An unstructured grid, finite-volume coastal ocean model (FVCOM) system. Oceanography 19, 78–89. doi: 10.5670/oceanog
Chen K., Kuang C. P., Wang L., Chen K., Han X. J., Fan J. D. (2022). Storm surge prediction based on long short-term memory neural network in the East China Sea. Appl. Sci. 12, 181. doi: 10.3390/app12010181
Chen Y. M., Huang W. R., Xu S. D. (2014). Frequency analysis of extreme water levels affected by sea-level rise in east and southeast coasts of China. J. Coast. Res. 68, 105–112. doi: 10.2112/SI68-014.1
Chu D. D., Zhang J. C., Wu Y. S., Jiao X. H., Qian S. H. (2019). Sensitivities of modelling storm surge to bottom friction, wind drag coefficient, and meteorological product in the East China Sea. Estuar. Coast. Shelf S. 231, 106460. doi: 10.1016/j.ecss.2019.106460
Contento A., Xu H., Gardoni P. (2020). Probabilistic formulation for storm surge predictions. Struct. Infrastruct. E. 16, 547–566. doi: 10.1080/15732479.2020.1721543
Ding Y., Kuiry S. N., Elgohry M., Jia Y. F., Altinakar M. S., Yeh K. C. (2013). Impact assessment of sea-level rise and hazardous storms on coasts and estuaries using integrated processes model. Ocean Eng. 71, 74–95. doi: 10.1016/j.oceaneng.2013.01.015
Dobbelaere M. R., Plehiers P. P., Van de Vijver R., Stevens C. V., Van Geem K. M. (2021). Machine learning in chemical engineering: strengths, weaknesses, opportunities, and threats. Engineering 7, 1201–1211. doi: 10.1016/j.eng.2021.03.019
Feng X. R., Li M. J., Li Y. L., Yu F. J., Yang D., Gao G. D., et al. (2021). Typhoon storm surge in the southeast Chinese mainland modulated by ENSO. Sci. Rep-UK. 11, 10137. doi: 10.1038/s41598-021-89507-7
Gauch M., Kratzert F., Klotz D., Nering G., Lin J., Hochreiter S. (2021). Rainfall-runoff prediction at multiple timescales with a single Long Short-Term Memory network. Hydrol. Earth Syst. Sc. 25, 2045–2062. doi: 10.5194/hess-25-2045-2021
Glahn B., Taylor A., Kurkowski N., Shaffer W. A. (2009). The role of the SLOSH model in National Weather Service storm surge forecasting. Natl. Weather Dig. 33, 3–14.
Goff J. A., Swartz J. M., Gulick S. P., Dawson C. N., de Alegria-Arzaburu A. R. (2019). An outflow event on the left side of Hurricane Harvey: Erosion of barrier sand and seaward transport through Aransas Pass, Texas. Geomorphology 334, 44–57. doi: 10.1016/j.geomorph.2019.02.038
Gong M. J., Yan C. C., Xu W., Zhao Z. X., Li W. X., Liu Y., et al. (2023). Short-term wind power forecasting model based on temporal convolutional network and Informer. Energy 283, 129171. doi: 10.1016/j.energy.2023.129171
Guo C. W., Deng Y. H., Zhang C. F., Deng C. (2021). “Remaining useful life prediction of bearing based on autoencoder-LSTM,” in International conference on mechanical engineering, measurement control, and instrumentation, vol. 11930. (Guangzhou, China: SPIE), 138–145. doi: 10.1117/12.2611404
Hochreiter S., Schmidhuber J. (1997). Long short-term memory. Neural Comput. 9, 1735–1780. doi: 10.1162/neco.1997.9.8.1735
Holland G. J. (1980). An analytic model of the wind and pressure profiles in hurricanes. Mon. Weather Rev. 108, 1212–1218. doi: 10.1175/1520-0493(1980)108<1212:aamotw>2.0.co;2
Huang P. C. (2022). An effective alternative for predicting coastal floodplain inundation by considering rainfall, storm surge, and downstream topographic characteristics. J. Hydrol. 607, 127544. doi: 10.1016/j.jhydrol.2022.127544
Ian V. K., Tse R., Tang S. K., Pan G. (2023). Bridging the gap: enhancing storm surge prediction and decision support with bidirectional attention-based LSTM. Atmosphere 14, 1082. doi: 10.3390/atmos14071082
Jelesnianski C. P. (1965). A numerical calculation of storm tides induced by a tropical storm impinging on a continental self. Mon. Weather Rev. 93, 343–358. doi: 10.1175/1520-0493(1993)093<0343:ancos>2.3.co;2
Jelesnianski C. P., Chen J., Shaffer W. A. (1992). SLOSH: Sea, lake, and overland surges from hurricanes Vol. 48 (United States: US Department of Commerce, National Oceanic and Atmospheric Administration, National Weather Service).
Jia G., Taflanidis A. A., Nadal-Caraballo N. C., Melby J. A., Kennedy A. B., Smith J. M. (2016). Surrogate modeling for peak or time-dependent storm surge prediction over an extended coastal region using an existing database of synthetic storms. Nat. Hazards 81, 909–938. doi: 10.1007/s11069-015-2111-1
Kohno N., Dube S. K., Entel M., Fakhruddin S. H. M., Greenslade D., Leroux M., et al. (2018). Recent progress in storm surge forecasting. Trop. Cyclone Res. Rev. 7, 128–139. doi: 10.6057/2018TCRR02.04
Ku C. Y., Liu C. Y. (2023). Modeling of land subsidence using GIS-based artificial neural network in Yunlin County, Taiwan. Sci. Rep-UK. 13, 4090. doi: 10.1038/s41598-023-31390-5
Lagmay A. M. F., Agaton R. P., Bahala M. A. C., Briones J. B. L. T., Cabacaba K. M. C., Caro C. V. C., et al. (2015). Devastating storm surges of Typhoon Haiyan. Int. J. Disast. Risk Re. 11, 1–12. doi: 10.1016/j.ijdrr.2014.10.006
Lee J., Im J., Cha D. H., Park H., Sim S. (2019). Tropical cyclone intensity estimation using multi-dimensional convolutional neural networks from geostationary satellite data. Remote Sens-Basel 12, 108. doi: 10.3390/rs12010108
Lee J. W., Irish J. L., Bensi M. T., Marcy D. C. (2021). Rapid prediction of peak storm surge from tropical cyclone track time series using machine learning. Coast. Eng. 170, 104024. doi: 10.1016/j.coastaleng.2021.104024
Li L., Li Z. X., He Z. G., Yu Z. Z., Ren Y. H. (2022). Investigation of storm tides induced by super typhoon in acro-tidal Hangzhou Bay. Front. Mar. Sci. 9, 890285. doi: 10.3389/fmars.2022.890285
Li L. B., Wu W. H., Zhang W. J., Zhu Z. Y., Li Z. Q., Wang Y. H., et al. (2023). Storm surge level prediction based on improved NARX neural network. J. Comput. Electron. 22, 783–804. doi: 10.1007/s10825-023-02005-z
Liu P., Wang J., Sangaiah A. K., Xie Y., Yin X. C. (2019). Analysis and prediction of water quality using LSTM deep neural networks in IoT environment. Sustainability-Basel 11, 2058. doi: 10.3390/su11072058
Luettich R. A., Westerink J. J., Scheffner N. W. (1992). ADCIRC: an advanced three-dimensional circulation model for shelves, coasts, and estuaries. Report 1, Theory and methodology of ADCIRC-2DD1 and ADCIRC-3DL. Coast. Eng. Res. Center (US).
Massaoudi M., Chihi I., Sidhom L., Trabelsi M., Refaat S. S., Abu-Rub H., et al. (2021). An effective hybrid NARX-LSTM model for point and interval PV power forecasting. IEEE Access 9, 36571–36588. doi: 10.1109/Access.6287639
McGovern A., Lagerquist R., Gagne D. J., Jergensen G. E., Elmore K. L., Homeyer C. R., et al. (2019). Making the black box more transparent: Understanding the physical implications of machine learning. Bull. Am. Meteorol. Soc 100, 2175–2199. doi: 10.1175/BAMS-D-18-0195.1
Mitiche I., Nesbitt A., Conner S., Boreham P., Morison G. (2020). 1D-CNN based real-time fault detection system for power asset diagnostics. IET Gener. Transm. Dis. 14, 5766–5773. doi: 10.1049/iet-gtd.2020.0773
Montavon G., Samek W., Müller K. R. (2018). Methods for interpreting and understanding deep neural networks. Digit. Signal Process. 73, 1–15. doi: 10.1016/j.dsp.2017.10.011
Mulia I. E., Ueda N., Miyoshi T., lwamoto T., Heidarzadeh M. (2023). A novel deep learning approach for typhoon−induced storm surge modeling through efficient emulation of wind and pressure fields. Sci. Rep-UK. 13, 7918. doi: 10.1038/s41598-023-35093-9
Munroe R., Montz B., Curtis S. (2018). Getting more out of storm surge forecasts: emergency support personnel needs in North Carolina. Weather Clim. Soc 10, 813–820. doi: 10.1175/WCAS-D-17-0074.1
Needham H. F., Keim B. D., Sathiaraj D. (2015). A review of tropical cyclone-generated storm surges: Global data sources, observations, and impacts. Rev. Geophys. 53, 545–591. doi: 10.1002/2014RG000477
Pachev B., Arora P., del-Castillo-Negrete C., Valseth E., Dawson C. (2023). A framework for flexible peak storm surge prediction. Coast. Eng. 186, 104406. doi: 10.1016/j.coastaleng.2023.104406
Pradhan R., Aygun R. S., Maskey M., Ramachandran R., Cecil D. J. (2018). Tropical cyclone intensity estimation using a deep convolutional neural network. IEEE T. Image Process. 27, 692–702. doi: 10.1109/TIP.2017.2766358
Prendin F., Pavan J., Cappon G., Del Favero S., Sparacino G., Facchinetti A. (2023). The importance of interpreting machine learning models for blood glucose prediction in diabetes: an analysis using SHAP. Sci. Rep-UK. 13, 16865. doi: 10.1038/s41598-023-44155-x
Pringle W. J., Wirasaet D., Roberts K. J., Westerink J. J. (2021). Global storm tide modeling with ADCIRC v55: Unstructured mesh design and performance. Geosci. Model. Dev. 14, 1125–1145. doi: 10.5194/gmd-14-1125-2021
Shi X. W., Han Z. Q., Fang J. Y., Tan J., Guo Z. X., Sun Z. L. (2020). Assessment and zonation of storm surge hazards in the coastal areas of China. Nat. Hazards 100, 39–48. doi: 10.1007/s11069-019-03793-z
Smith J. M., Cialone M. A., Wamsley T. V., McAlpin T. O. (2010). Potential impact of sea level rise on coastal surges in southeast Louisiana. Ocean Eng. 37, 37–47. doi: 10.1016/j.oceaneng.2009.07.008
Sonnewald M., Lguensat R., Jones D. C., Dueben P. D., Brajard J., Balaji V. (2021). Bridging observations, theory and numerical simulation of the ocean using machine learning. Environ. Res. Lett. 16, 073008. doi: 10.1088/1748-9326/ac0eb0
Štrumbelj E., Kononenko I. (2014). Explaining prediction models and individual predictions with feature contributions. Knowl. Inf. Syst. 41, 647–665. doi: 10.1007/s10115-013-0679-x
Sun K., Pan J. Y. (2023). Model of storm surge maximum water level increase in a coastal area using ensemble machine learning and explicable algorithm. Earth Space Sci. 10, 1029. doi: 10.1029/2023EA003243
Tadesse M., Wahl T., Cid A. (2020). Data-driven modeling of global storm surges. Front. Mar. Sci. 7, 260. doi: 10.3389/fmars.2020.00260
Tian Q. Q., Gao. H., Tian Y., Jiang Y. Z., Li Z. X., Guo L. (2023). Runoff prediction in the Xijiang River Basin based on Long Short-Term Memory with variant models and its interpretable analysis. Water 15, 3184. doi: 10.3390/w15183184
Ullah I., Liu K., Yamamoto T., Khattak M. Z., Jamal A. (2022). Prediction of electric vehicle charging duration time using ensemble machine learning algorithm and Shapley additive explanations. Int. J. Energ. Res. 46, 15211–15230. doi: 10.1002/er.8219
Vaswani A., Shazeer N., Parmar N., Uszkoreit J., Jones L., Gomez A. N., et al. (2017). Attention is all you need. Adv. Neural Inf. Process. Syst. 30, 5999–6009. Available at: http://arxiv.org/abs/1706.03762.
Wang R. Z., Kim J. H., Li M. H. (2021). Predicting stream water quality under different urban development pattern scenarios with an interpretable machine learning approach. Sci. Total Environ. 761, 144057. doi: 10.1016/j.scitotenv.2020.144057
Wang S., Peng H., Liang S. (2022). Prediction of estuarine water quality using interpretable machine learning approach. J. Hydrol. 605, 127320. doi: 10.1016/j.jhydrol.2021.127320
Wang K., Yang Y. S., Reniers G., Huang Q. Y. (2021). A study into the spatiotemporal distribution of typhoon storm surge disasters in China. Nat. Hazards 108, 1237–1256. doi: 10.1007/s11069-021-04730-9
Willoughby H. E., Rahn M. E. (2004). Parametric representation of the pri-mary hurricane vortex. Part l: Observations and evaluation of the Holland, (1980) model. Mon. Weather Rev. 132, 3033–3048. doi: 10.1175/MWR2831.1
Wimmers A., Velden C., Cossuth J. H. (2019). Using deep learning to estimate tropica cyclone intensity from satellite passive microwave imagery. Mon. Weather Rev. 147, 2261–2282. doi: 10.1175/MWR-D-18-0391.1
Wu W. Y., McInnes K., O'grady J., Hoeke R., Leonard M., Westra S. (2018). Mapping dependence between extreme rainfall and storm surge. J. Geophys. Res-Oceans. 123, 2461–2474. doi: 10.1002/2017JC013472
Xie W. H., Xu G. J., Zhang H. C., Dong C. M. (2023). Developing a deep learning-based storm surge forecasting model. Ocean Model. 182, 102179. doi: 10.1016/j.ocemod.2023.102179
Xu S., Yin K., Huang W. R., Zheng W. (2014). Numerical simulation of typhoon- induced storm surge on the coast of Jiangsu Province, China, based on coupled hydrodynamic and wave models. J. Southeast Univ. (Engl. Ed) 30, 489–494. doi: 10.1016/j.wse.2017.03.011
Ye R. H., Ge J., Zhang W. M., Zhao H. J. (2020). Statistical analysis on impact from tropical cyclone on Guangdong-Hong Kong-Macao Greater Bay Area. Water Resour. Hydropower Eng. 51, 37–43. (in chinese)
Yin K., Xu S. D., Huang W. R., Xie Y. (2017). Effects of sea level rise and typhoon intensity on storm surge and waves in Pearl River Estuary. Ocean Eng. 136, 80–93. doi: 10.1016/j.oceaneng.2017.03.016
Zhang R., Liu Q. S., Hang R. L. (2019). Tropical cyclone intensity estimation using two-branch convolutional neural network from infrared and water vapor images. IEEE T. Geosci. Remote 58, 586–597. doi: 10.1109/TGRS.36
Zhao C. J., Ge J. Z., Ding P. X. (2014). Impact of sea level rise on storm surges around the changjiang estuary. J. Coast. Res. 68, 27–34. doi: 10.2112/SI68-004.1
Keywords: storm surge, ADCIRC, DL, SHAP, intelligent forecasting
Citation: Tian Q, Luo W, Tian Y, Gao H, Guo L and Jiang Y (2024) Prediction of storm surge in the Pearl River Estuary based on data-driven model. Front. Mar. Sci. 11:1390364. doi: 10.3389/fmars.2024.1390364
Received: 23 February 2024; Accepted: 03 April 2024;
Published: 26 April 2024.
Edited by:
Reza Marsooli, Stevens Institute of Technology, United StatesReviewed by:
Jun-Whan Lee, The University of Texas at Austin, United StatesCopyright © 2024 Tian, Luo, Tian, Gao, Guo and Jiang. This is an open-access article distributed under the terms of the Creative Commons Attribution License (CC BY). The use, distribution or reproduction in other forums is permitted, provided the original author(s) and the copyright owner(s) are credited and that the original publication in this journal is cited, in accordance with accepted academic practice. No use, distribution or reproduction is permitted which does not comply with these terms.
*Correspondence: Yu Tian, dHkxMDA3OEAxMjYuY29t
Disclaimer: All claims expressed in this article are solely those of the authors and do not necessarily represent those of their affiliated organizations, or those of the publisher, the editors and the reviewers. Any product that may be evaluated in this article or claim that may be made by its manufacturer is not guaranteed or endorsed by the publisher.
Research integrity at Frontiers
Learn more about the work of our research integrity team to safeguard the quality of each article we publish.