 Deniz Dişa
 Ekin Akoglu
 Baris Salihoglu
94% of researchers rate our articles as excellent or good
Learn more about the work of our research integrity team to safeguard the quality of each article we publish.
Find out more
ORIGINAL RESEARCH article
Front. Mar. Sci., 11 June 2024
Sec. Marine Fisheries, Aquaculture and Living Resources
Volume 11 - 2024 | https://doi.org/10.3389/fmars.2024.1389941
The demand for marine living resources is increasing at an unprecedented scale because of the need for continuous food provision to the world’s population. The potential of already exploited fish stocks to meet this demand is limited. Therefore, mesopelagic fish have recently become attractive potential targets for fisheries because of their vast conjectured biomass. However, the role of mesopelagic fish in marine ecosystems is poorly understood. Before developing commercial exploitation plans, the relationship between mesopelagic fish and other groups in the marine food web and biogeochemical cycles should be analyzed quantitatively. In this study, we coupled a one-dimensional biogeochemical model (North Atlantic Generic Ecosystem Model) with a higher-trophic-level food web model (Ecopath with Ecosim) for the Sargasso Sea in the North Atlantic to investigate changes in carbon export and trophodynamics under two mesopelagic fish harvesting scenarios. The coupled model represented the marine food web from plankton to fish and mammals, vertical carbon export dynamics, and their interaction with fisheries. The results showed that when mesopelagic fish were not harvested, they contributed approximately 6% of the total carbon export in the surface waters, but up to 40% of the total carbon export below 400 m. Harvesting mesopelagic fish altered the energy transfers within the food web as well as to fisheries. The ecological footprint of fisheries increased significantly. Due to declining competition in the food web, epipelagic fish increased to exert elevated grazing pressure on phytoplankton; hence, phytoplankton-mediated carbon export decreased. The total carbon export decreased by 14% due to the decreases in mesopelagic fish- and phytoplankton-mediated carbon exports. The simulated increase in zooplankton- and non-mesopelagic fish-mediated carbon exports (up to 92% and 96%, respectively) did not compensate for the total decrease in carbon exports under harvesting scenarios. The findings of this study highlighted that mesopelagic fish not only have a direct control on carbon dynamics by their metabolic releases and diel vertical migration, but also strong indirect controls through prey-predator interactions within the food web. Therefore, the implications of harvesting mesopelagic fish should be carefully considered from a holistic perspective.
The exploitation of wild fish stocks began in shallow coastal waters centuries ago (Jackson et al., 2001), but quickly expanded offshore (Lear, 1998; Christensen et al., 2003; Myers and Worm, 2003; Christensen et al., 2004) and to the deep ocean (Morato et al., 2006; Pitcher et al., 2010) with the growing human population. In the last two decades, the ever-increasing demand and heavily overexploited global wild fish stocks have led to a striking rise in aquaculture production, from approximately 10 to 80 million tonnes per annum (Melnychuk et al., 2020). This increase has helped to maintain stable capture production and wild fish stocks (Melnychuk et al., 2020; Tacon, 2020). However, the supply of raw materials to aquaculture farms has become a problem. Mesopelagic fish have recently been proposed as a solution to the raw-material problem faced by aquaculture production (Olsen et al., 2020). Their high fat content (Lea et al., 2002; Alvheim et al., 2020) and vast conjectured biomass ranging from 1 to 20 billion tonnes (Gjosaeter and Kawaguchi, 1980; Irigoien et al., 2014; Anderson et al., 2019; Proud et al., 2019) make mesopelagic fish an attractive source of fish meal for the aquaculture industry.
Harvesting mesopelagic fish on a commercial scale is risky, particularly because our knowledge of the role of mesopelagic fish in marine ecosystems and food webs is in its infancy. Nevertheless, the number of studies on mesopelagic fish and their role in ecosystems has increased in recent years (e.g. Saba et al., 2021; Dowd et al., 2022; Sarmiento-Lezcano et al., 2022; Woodstock et al., 2022; Aksnes et al., 2023). Studies have revealed that mesopelagic fish directly contribute to ocean carbon pools via their physiological and life-history traits such as respiration, mortality, defecation, and diel vertical migration (Irigoien et al., 2014; Saba et al., 2021; Sarmiento-Lezcano et al., 2022). The gravitational sinking of mesopelagic fish-mediated particulate organic carbon (i.e., passive carbon export) contributes to the biological pump (Figure 1), i.e., the vertical transport of carbon from the surface to the deep ocean (Ducklow et al., 2001). Furthermore, mesopelagic fish actively transport carbon from the epipelagic zone to the mesopelagic zone by feeding at night in the epipelagic zone (< 200 m) and hiding from predators in the mesopelagic zone (400–1000 meters) during the day (Davison et al., 2013; Klevjer et al., 2016). This active transport deforms the power law of the Martin curve (Martin et al., 1987) by causing fluctuations in carbon export in the epipelagic and mesopelagic zones. The active transport of carbon by mesopelagic fish was hypothesized to close the discrepancy between gravitational export fluxes and geochemical tracer measurements in the global mesopelagic carbon budget (Boyd et al., 2019). Estimates of the contribution of active carbon export mediated by mesopelagic fish to the total carbon export in the oceans are highly variable and were calculated between 0.01–143% of the passive particulate organic carbon flux from the euphotic zone (Saba et al., 2021 and references therein); however, their exact contribution is yet to be delineated.
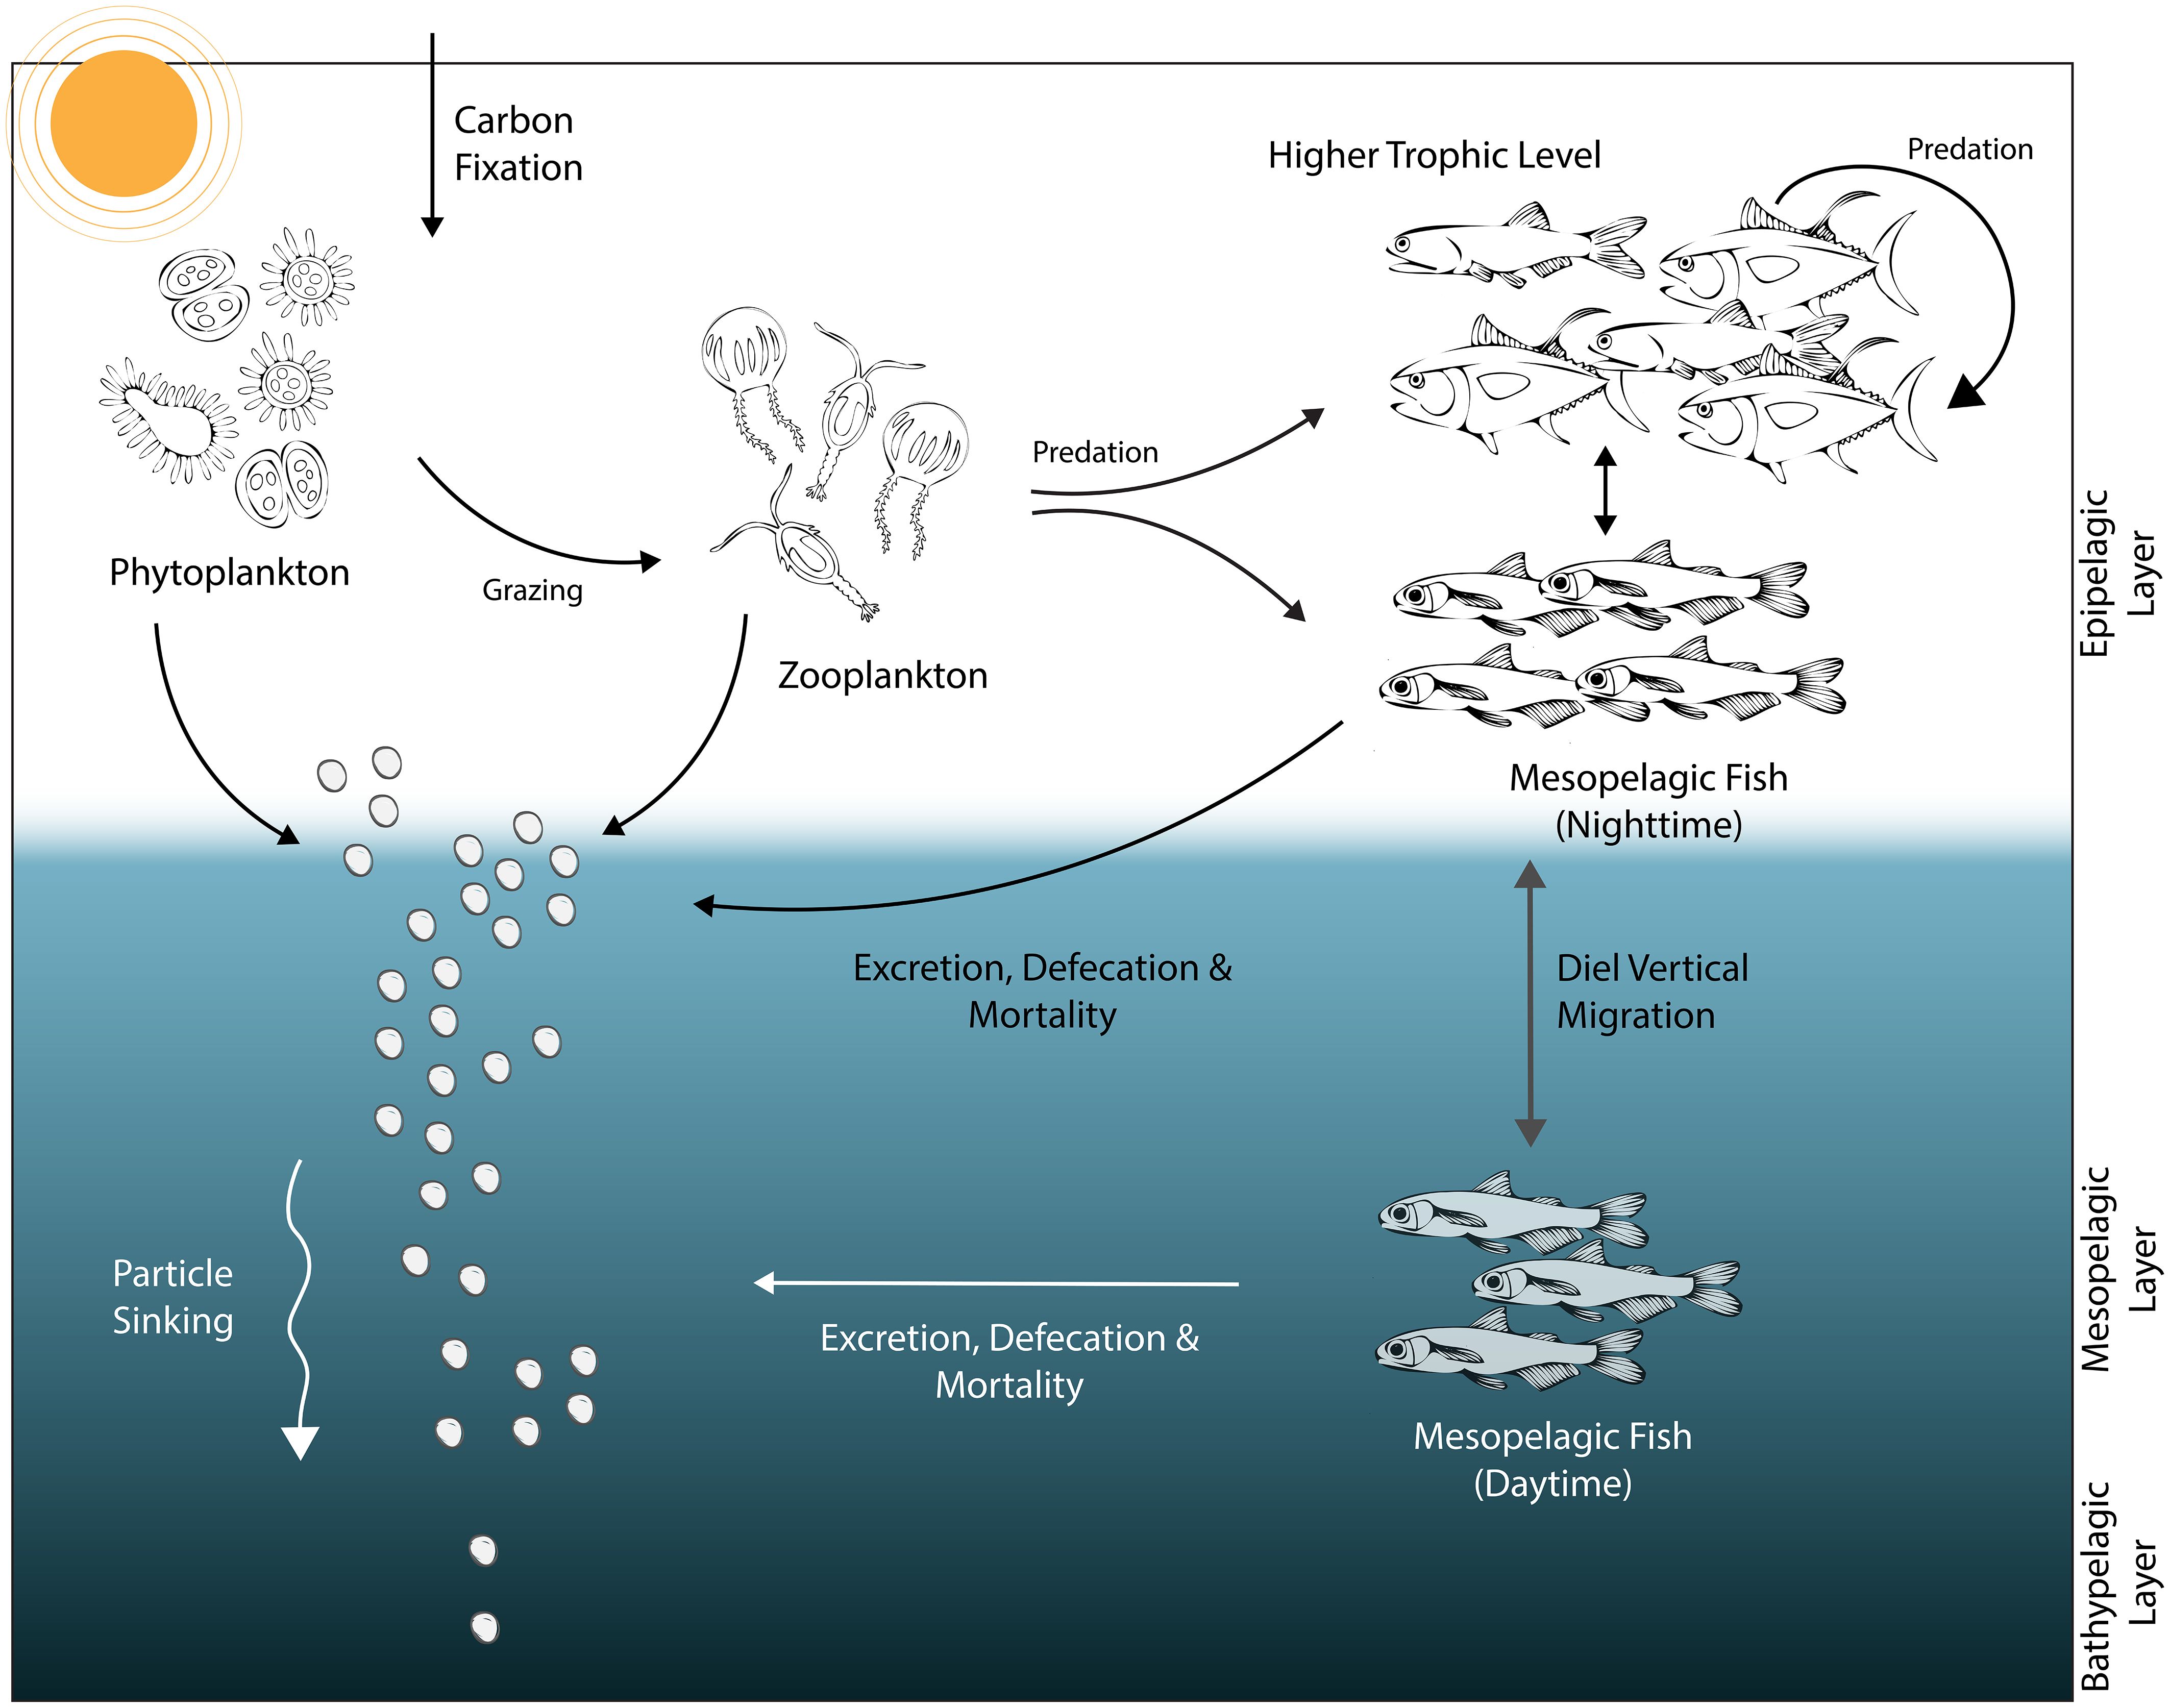
Figure 1 A schematic representation of a simplified food web composed of phytoplankton, zooplankton, non-mesopelagic fish and mesopelagic fish groups, and the contribution of each group to the ocean biological pump (i.e., particle sinking across vertical ocean layers). The diel vertical migration of mesopelagic fish is also depicted in the schematic.
Mesopelagic fish also play an important role in marine food webs because they are preys for higher trophic level organisms, such as squids, tunas, sharks, marine mammals, and even sea turtles and sea birds (Potier et al., 2007; Brophy et al., 2009). Furthermore, they directly affect plankton composition and hence primary production in the ocean by feeding on zooplankton (Bernal et al., 2015; Clarke et al., 2020; Woodstock et al., 2020). Therefore, mesopelagic fish constitutes a link in the transfer of production in the ocean to higher trophic levels in the food web (Irigoien et al., 2014). However, harvesting mesopelagic fish at large scales can limit energy transfer pathways across numerous trophic levels and hamper carbon export, thereby affecting the entire marine ecosystem (Trueman et al., 2014).
Quantifying the impact of mesopelagic fish communities on marine food webs and biogeochemical cycles prior to exploitation of mesopelagic fish stocks is vital. Considering that the linkages between mesopelagic fish and seawater biogeochemistry are not yet fully understood, the consequences of exploiting mesopelagic fish stocks can only be conjectured with high uncertainty (St. John et al., 2016; Hidalgo and Browman, 2019). Previous modeling studies have primarily focused on the diel vertical migration of zooplankton and its impact on marine biogeochemistry (e.g. Aumont et al., 2018; Gorgues et al., 2019, and references therein) or provided estimates for the active transport of carbon by diel vertical migration of mesopelagic fish without accounting for the trophodynamic consequences of harvesting mesopelagic fish in the food web (Aumont et al., 2018; Woodstock et al., 2022; Aksnes et al., 2023). The cascading effects of harvesting mesopelagic fish on the food web have only been investigated without considering biogeochemical feedbacks (Dowd et al., 2022). Therefore, the effects of altered prey-predator dynamics by the exploitation of mesopelagic fish and their direct and indirect feedbacks on carbon export have yet to be delineated. In this study, we aimed to quantify the possible effects of exploiting mesopelagic fish communities on both carbon export and trophic interactions in a marine food web in the North Atlantic Ocean by capitalizing on an end-to-end vertically resolved biogeochemical and higher-trophic-level modeling framework. The coupled model represented the open ocean food web dynamics in the Sargasso Sea by simulating the interplay between marine biogeochemistry, plankton dynamics, fish communities, and fisheries under different harvesting scenarios. We sought answers to three questions: (i) What is the magnitude of carbon transport mediated by mesopelagic fish under status quo fisheries exploitation? (ii) How would the harvesting of mesopelagic fish affect carbon export fluxes? (iii) What would be the trophic impact of harvesting mesopelagic fish?
This study was conducted for the Sargasso Sea in the North Atlantic Ocean (Figure 2). The Sargasso Sea is the only sea without any land boundaries, and the water depth extends to approximately 4500 meters (Laffoley et al., 2011). The Sargasso Sea is a large region bounded by the anticyclonic North Atlantic Subtropical Gyre, which is composed of the Gulf Stream along the west, North Atlantic Drift in the north, Canary Current along the east, and North Equatorial Current and Antilles Current in the south (Freestone and Morrison, 2012). It is an oligotrophic sea where major nutrients driving primary production, such as nitrogen and phosphorus, are often depleted (Sowell et al., 2009), and the mean annual primary productivity is between 50–150 g C m-2 y-1. The Bermuda Atlantic Time-series Study (BATS) station is located in the Sargasso Sea, 82 km southeast of Bermuda Island (31° 40’ N, 64° 10’ W), and has a depth of approximately 4680 m. This area is a favorable region for modeling studies because of the availability of monthly physical, chemical, and biological time series data since 1988 (Steinberg et al., 2001).
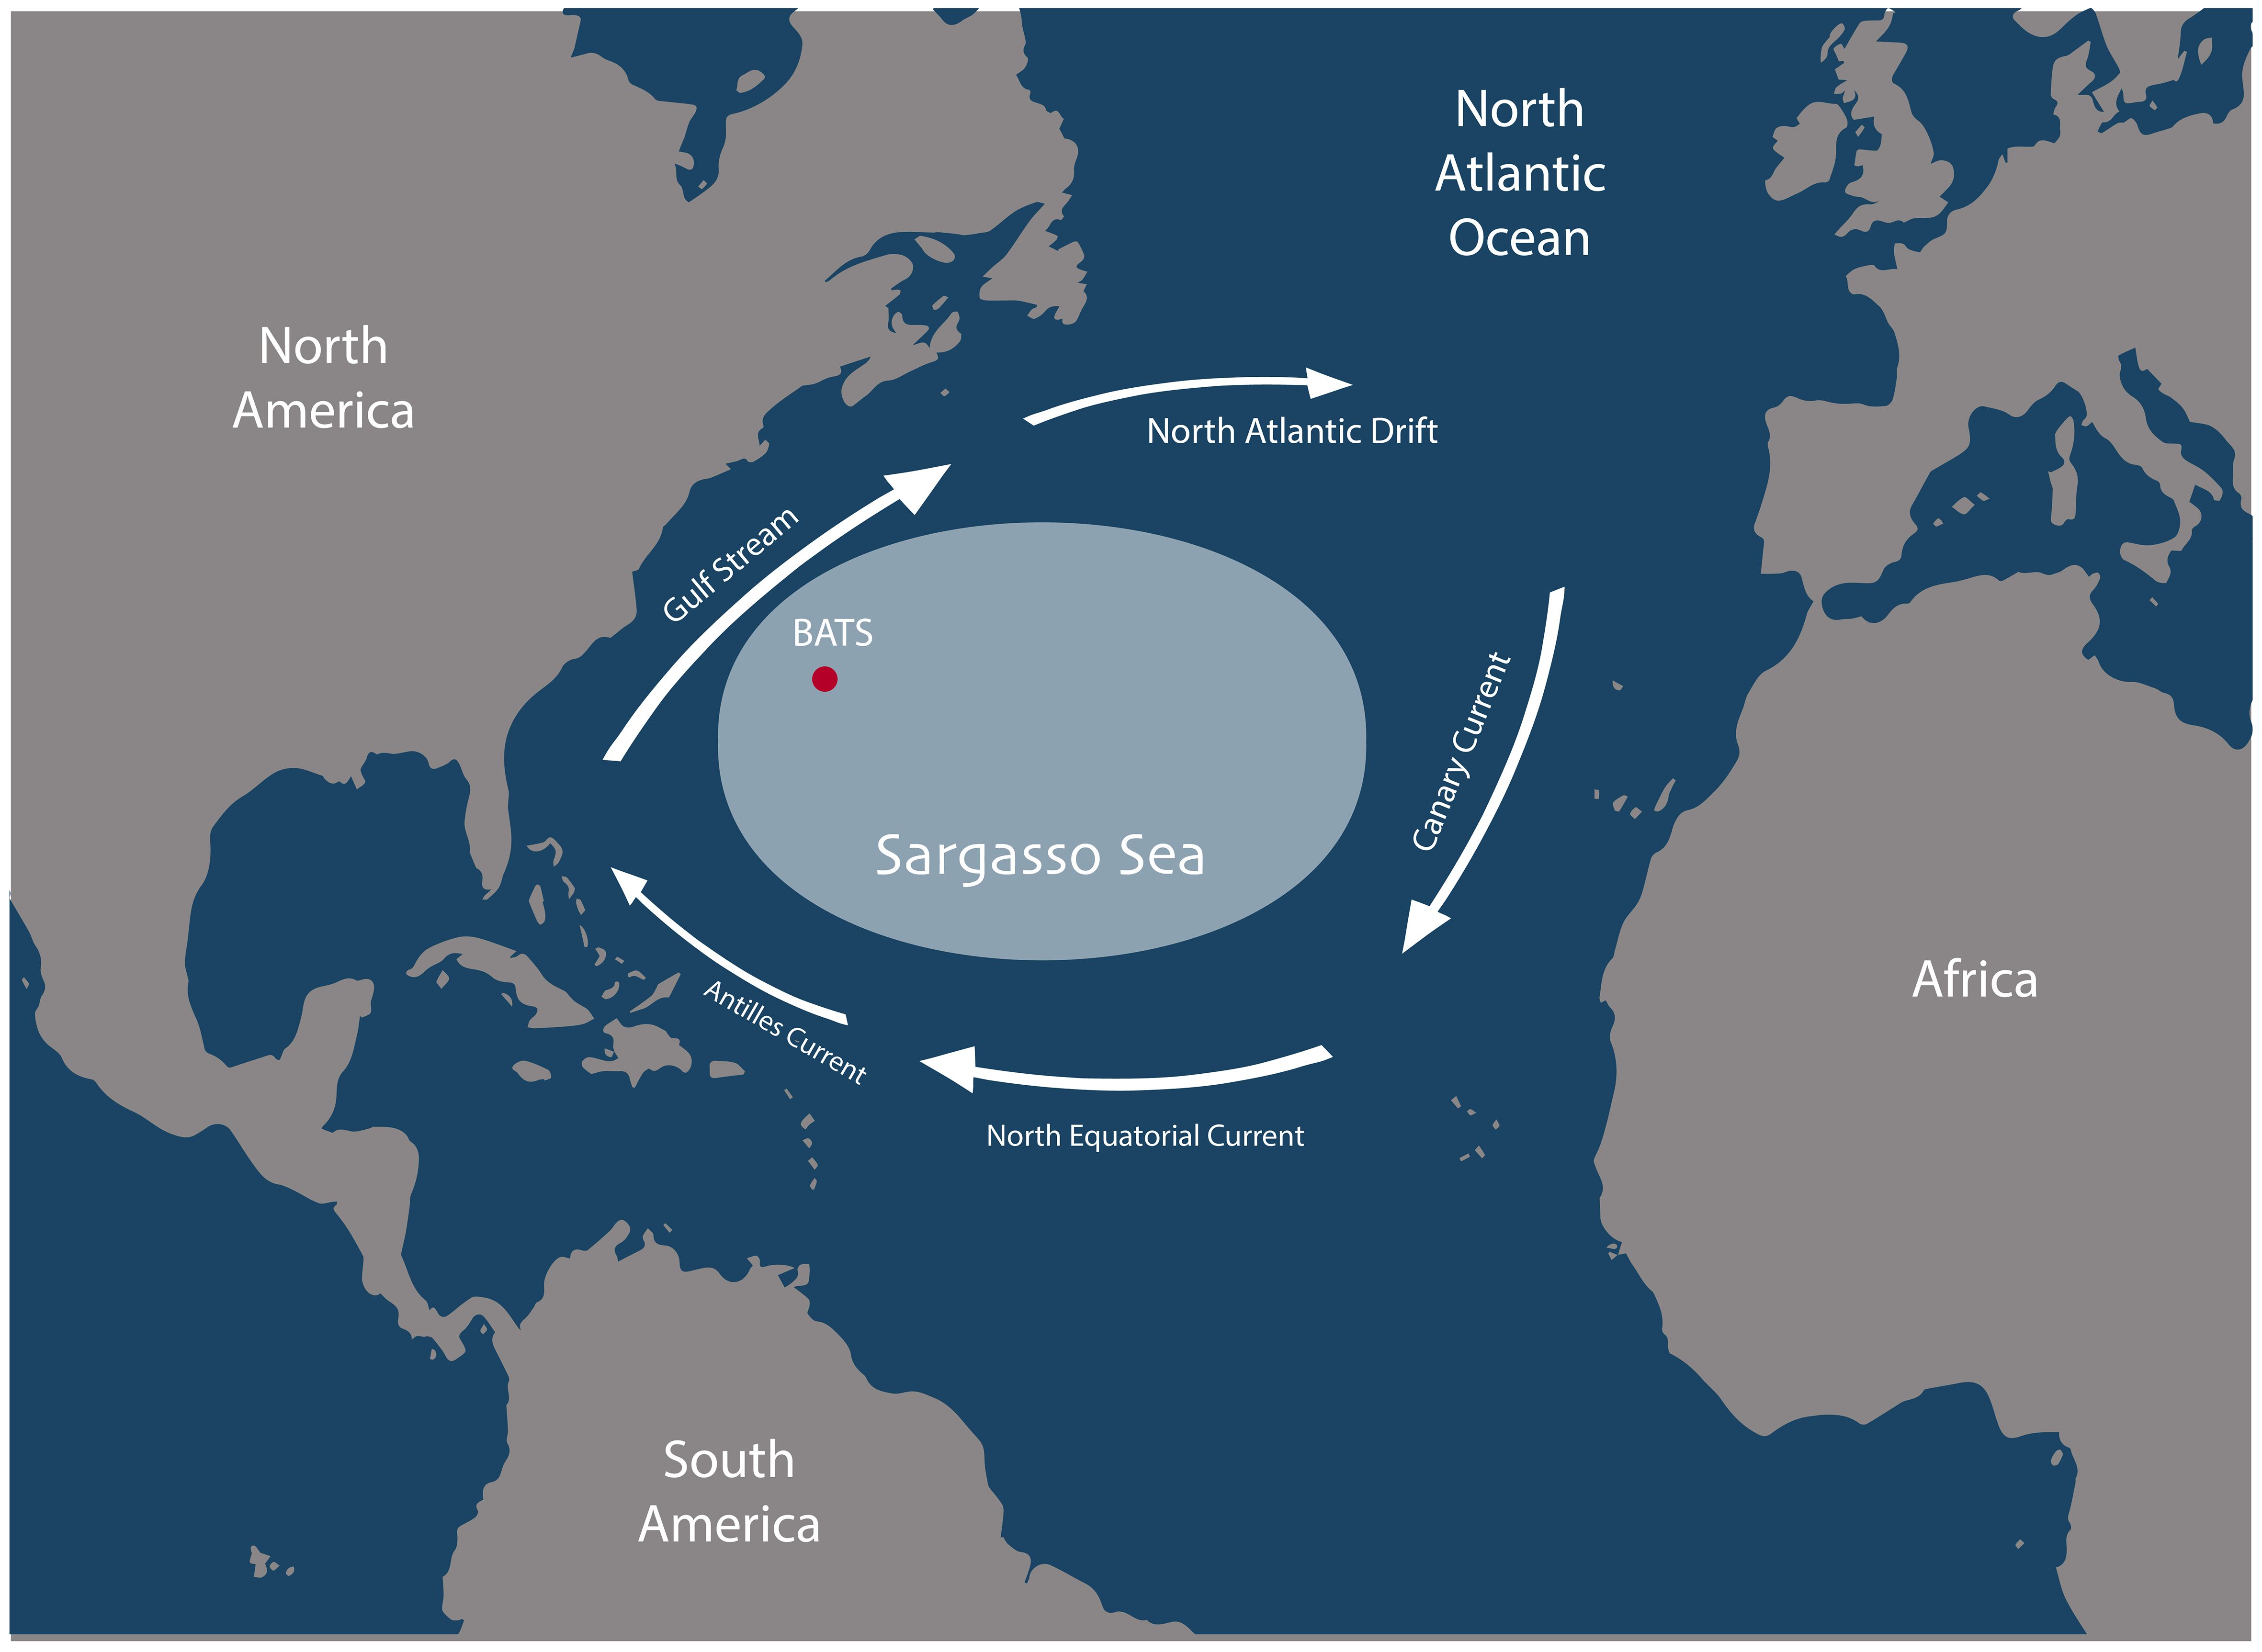
Figure 2 The location of the Sargasso Sea in the North Atlantic Ocean and the surrounding large-scale ocean currents. The location of the Bermuda Atlantic Time-series Study (BATS) is indicated by the red dot.
The North Atlantic Generic Ecosystem Model (NAGEM) is a one-dimensional multi-component lower-trophic-level ecosystem model developed to investigate time-varying carbon fluxes in the Equatorial Pacific (Salihoglu and Hofmann, 2007) and Subtropical North Atlantic (Salihoglu et al., 2008) for the late 1990s. Recently, NAGEM has been extended to represent the functioning and magnitude of the biological carbon pump over the entire North Atlantic Ocean (Yumruktepe et al., 2020). The model state equations and main parameters of the biogeochemical model (Supplementary Tables S1–S3) are provided in the Supplementary Material 1. A detailed description of NAGEM is available in Salihoglu et al. (2008) and Yumruktepe et al. (2020). Therefore, only a brief description has been provided.
NAGEM contains five phytoplankton groups: low-light adapted Prochlorococcus spp., high-light adapted Prochlorococcus spp., Synechococcus spp., autotrophic eukaryotes, and diatoms (Figure 3). The growth of phytoplankton is computed as a function of light and nutrient availability (i.e., nitrate, ammonium, and phosphate for all algal groups, and silicate for diatoms). The model also includes two zooplankton compartments based on size: microzooplankton (< 200 μm) and mesozooplankton (> 200 μm and < 2000 μm). Mesozooplankton graze on microzooplankton and diatoms, whereas microzooplankton graze on smaller algal groups. Detritus is composed of two compartments: slow- and fast-sinking detritus. Lighter slow-sinking detritus is formed by the mortality of phytoplankton and microzooplankton groups, as well as the unassimilated food fraction of zooplankton. Fast-sinking detritus is composed of zooplankton mortality, as well as the aggregation of slow-sinking detritus. Fast-sinking detritus represents the refractory material in the detritus pool. Both detritus compartments are represented by four subgroups: carbon, nitrogen, phosphorus, and silicate. The decomposition of nitrogen and phosphorus in detritus forms pools of dissolved organic nitrogen (DON) and dissolved organic phosphorus (DOP). Because carbon is not a limiting nutrient in marine ecosystems (Moore et al., 2013), a separate dissolved organic carbon (DOC) compartment is not included in the model. The silicate content of the detritus dissolves and forms the elemental silicate compartment, whereas NH4 and PO4 are formed by the remineralization of DON and DOP pools. The model represents additional processes in the nitrogen cycle, such as atmospheric deposition of nitrate, nitrogen fixation by diazotrophs, and nitrification, at constant rates.
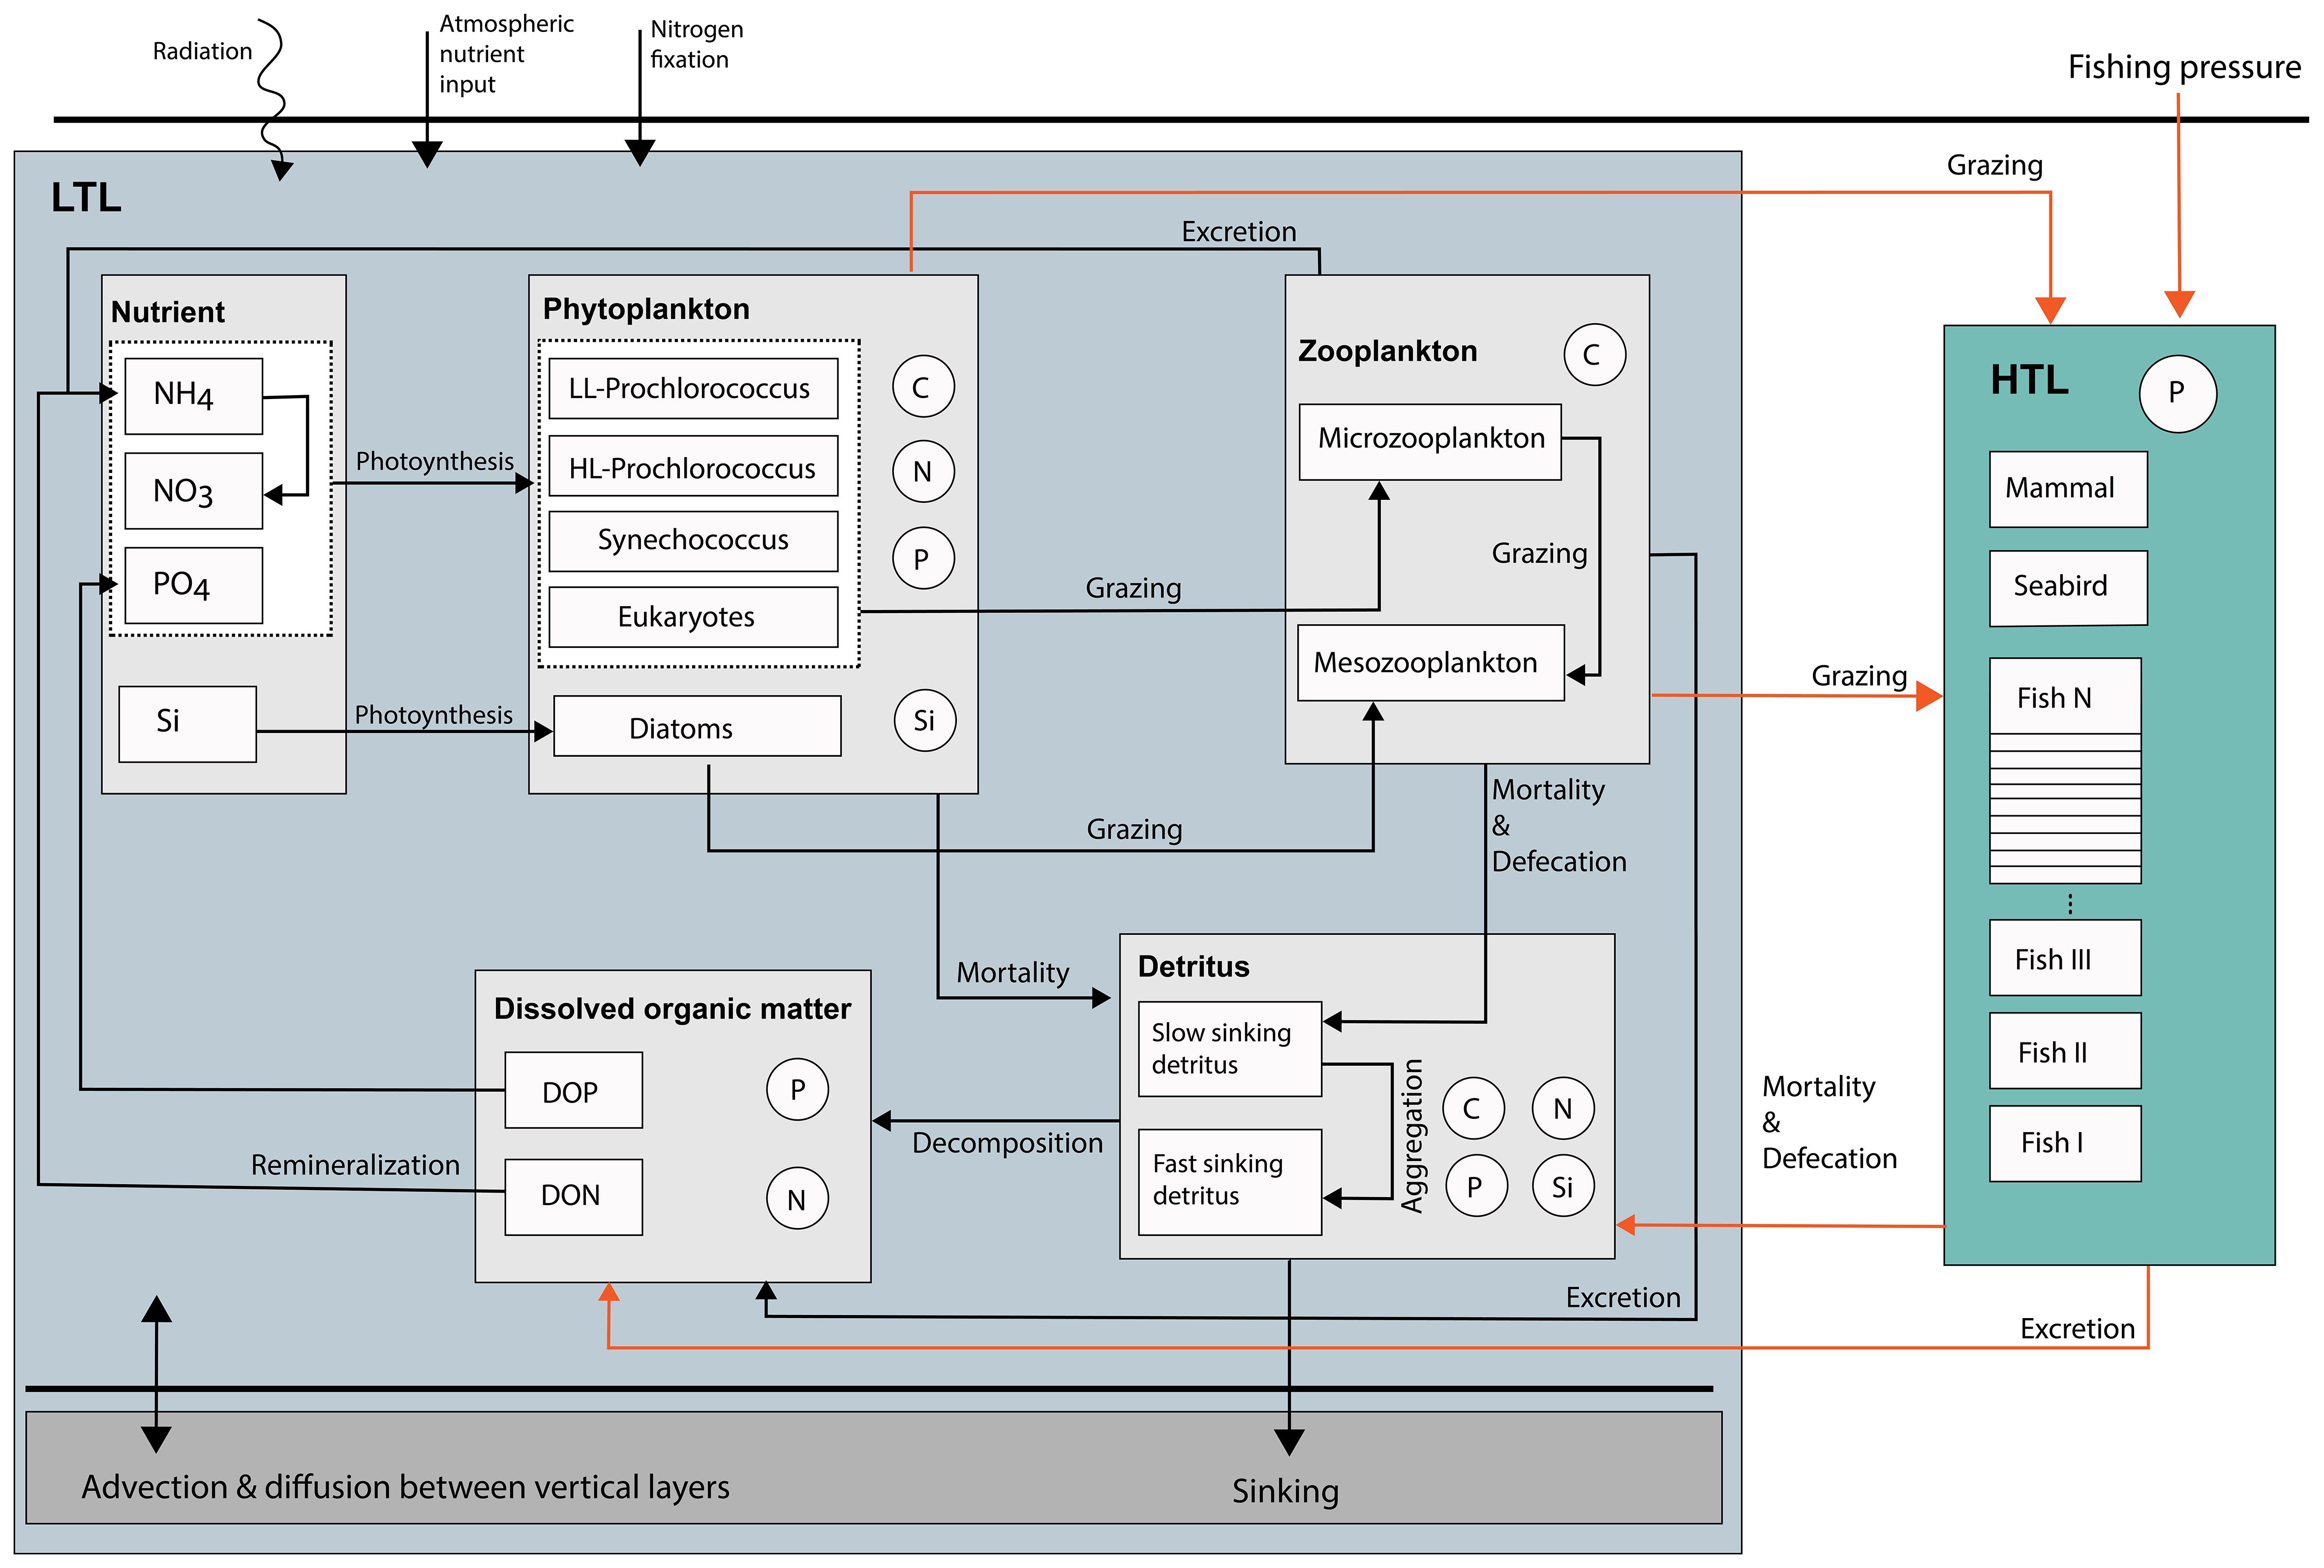
Figure 3 Conceptual diagram of the coupled model. The blue shaded box on the left depicts the lower-trophic-level dynamics simulated by the North Atlantic Generic Ecosystem Model (NAGEM). The turquois shaded box on the right depicts the higher-trophic-level dynamics simulated by the Fortran version of Ecosim model (Ecosim-F). The linkages between the two models are indicated by orange arrows.
Ecopath with Ecosim (EwE) is an ecological modeling software designed for the analysis of trophodynamic interactions in marine ecosystems and the impact of fishing (Christensen and Walters, 2004; Christensen et al., 2005). EwE has been widely used worldwide to analyze the structure and function of marine ecosystems and the impacts of fisheries (Colléter et al., 2015 and references therein). EwE comprises three components: Ecopath, a static, mass-balanced snapshot of the system; Ecosim, a time-dynamic simulation module; and Ecospace, a spatial-temporal dynamic module. Together, these three components allow dynamic representation of complex interactions within a food web in time and space. The food web may contain all ecosystem members from phytoplankton to mammals.
A mass balance is ensured for each ecosystem member by Ecopath, such that the total source (production) and sink (predation mortality; fishing mortality; non-predation mortality due to diseases, old age, etc.; net emigration; and biomass accumulation) terms are equal. Ecopath also ensures an energy balance for each ecosystem member such that the consumption is equal to the total production, respiration, and unassimilated part of the consumed food. Ecopath requires at least three of the following four input parameters for each ecosystem member to be defined: biomass, production/biomass ratio (or total mortality), consumption/biomass ratio, and ecotrophic efficiency. Given the mass and energy balanced representation of the system by Ecopath, Ecosim provides time-dynamic simulations. A detailed description of EwE model implementation is available in the literature (Christensen and Walters, 2004; Christensen et al., 2005; Steenbeek et al., 2016); therefore, technicalities regarding the EwE modeling suite are avoided here. However, equations for the Ecopath and Ecosim components used in this study are provided in the Supplementary Material 1.
The latest version of EwE (version 6) was originally written in the Microsoft .NET framework, but was later recoded in Fortran (EwE-F, Akoglu et al., 2015) to enable practical integration with physical and biogeochemical ocean models that were conventionally coded in Fortran. In this study, we coupled EwE-F with NAGEM to establish an end-to-end representation of the North Atlantic Ocean ecosystem in the Sargasso Sea. EwE-F includes implementations of the Ecopath (as Ecopath-F) and Ecosim (as Ecosim-F) modules. Similar to the original Ecopath and Ecosim modules of the EwE suite, Ecopath-F computes the mass and energy balances of each species/group in the food web, such that the production of a species/group is matched either by losses through predation, fishery, emigration, or natural mortality (i.e., by aging or disease) or accumulates as biomass. The mass and energy balance constraints of Ecopath ensure that the production of a state variable is not exceeded by the losses exerted upon it, so that the model is consistent with ecological theory. Ecosim-F provides a temporal simulation of food web interactions under given forcing functions such as fishing effort and changes in primary production.
The Ecopath model representing the late 1990s conditions of the North Atlantic Ocean (Vasconcellos and Watson, 2004, Supplementary Figure S1) was transferred to EwE-F for coupling with NAGEM. The North Atlantic Ecopath model consisted of 38 functional groups from phytoplankton to marine mammals (Supplementary Tables S4, S5). The lower-trophic-level (LTL) groups in the Ecopath model comprised heterotrophic bacteria, small and large deep-water zooplankton, shallow-water zooplankton, phytoplankton, and detritus. The model includes two mesopelagic fish compartments, i.e., large and small mesopelagic fish, enabling the investigation of the role and potential consequences of harvesting mesopelagic fish on the food web and biogeochemical dynamics.
The coupled model is based on Dişa (2016); however, it was updated to include the diel vertical migration (DVM) of mesopelagic fish. The biogeochemical and food web models were coupled such that the lower-trophic-level ecosystem components (i.e., nutrients, organic matter pools, detritus, phytoplankton, and zooplankton) were simulated by NAGEM, whereas the higher-trophic-level (HTL) ecosystem components (i.e., from benthos and fish to mammals) and the fishing fleet were represented by EwE-F (Figure 3).
To establish the North Atlantic Ecopath model in Ecopath-F, LTL groups were first replaced with the corresponding compartments in NAGEM, namely, low- and high-light-adapted Procholorococcus, Synechococcus, eukaryotic autotrophs, diatoms, micro- and mesozooplankton, slow- and fast-sinking detritus compartments, phosphate (PO4), and dissolved organic phosphorus (DOP). As carbon was not explicitly modeled in NAGEM, the most limiting nutrient, PO4, was used as the model currency in the EwE-F model. Modification of the North Atlantic Ecopath model for coupling was performed as described by Libralato and Solidoro (2009). The coupled model consisted of 42 groups (Figure 4, Supplementary Table S4).
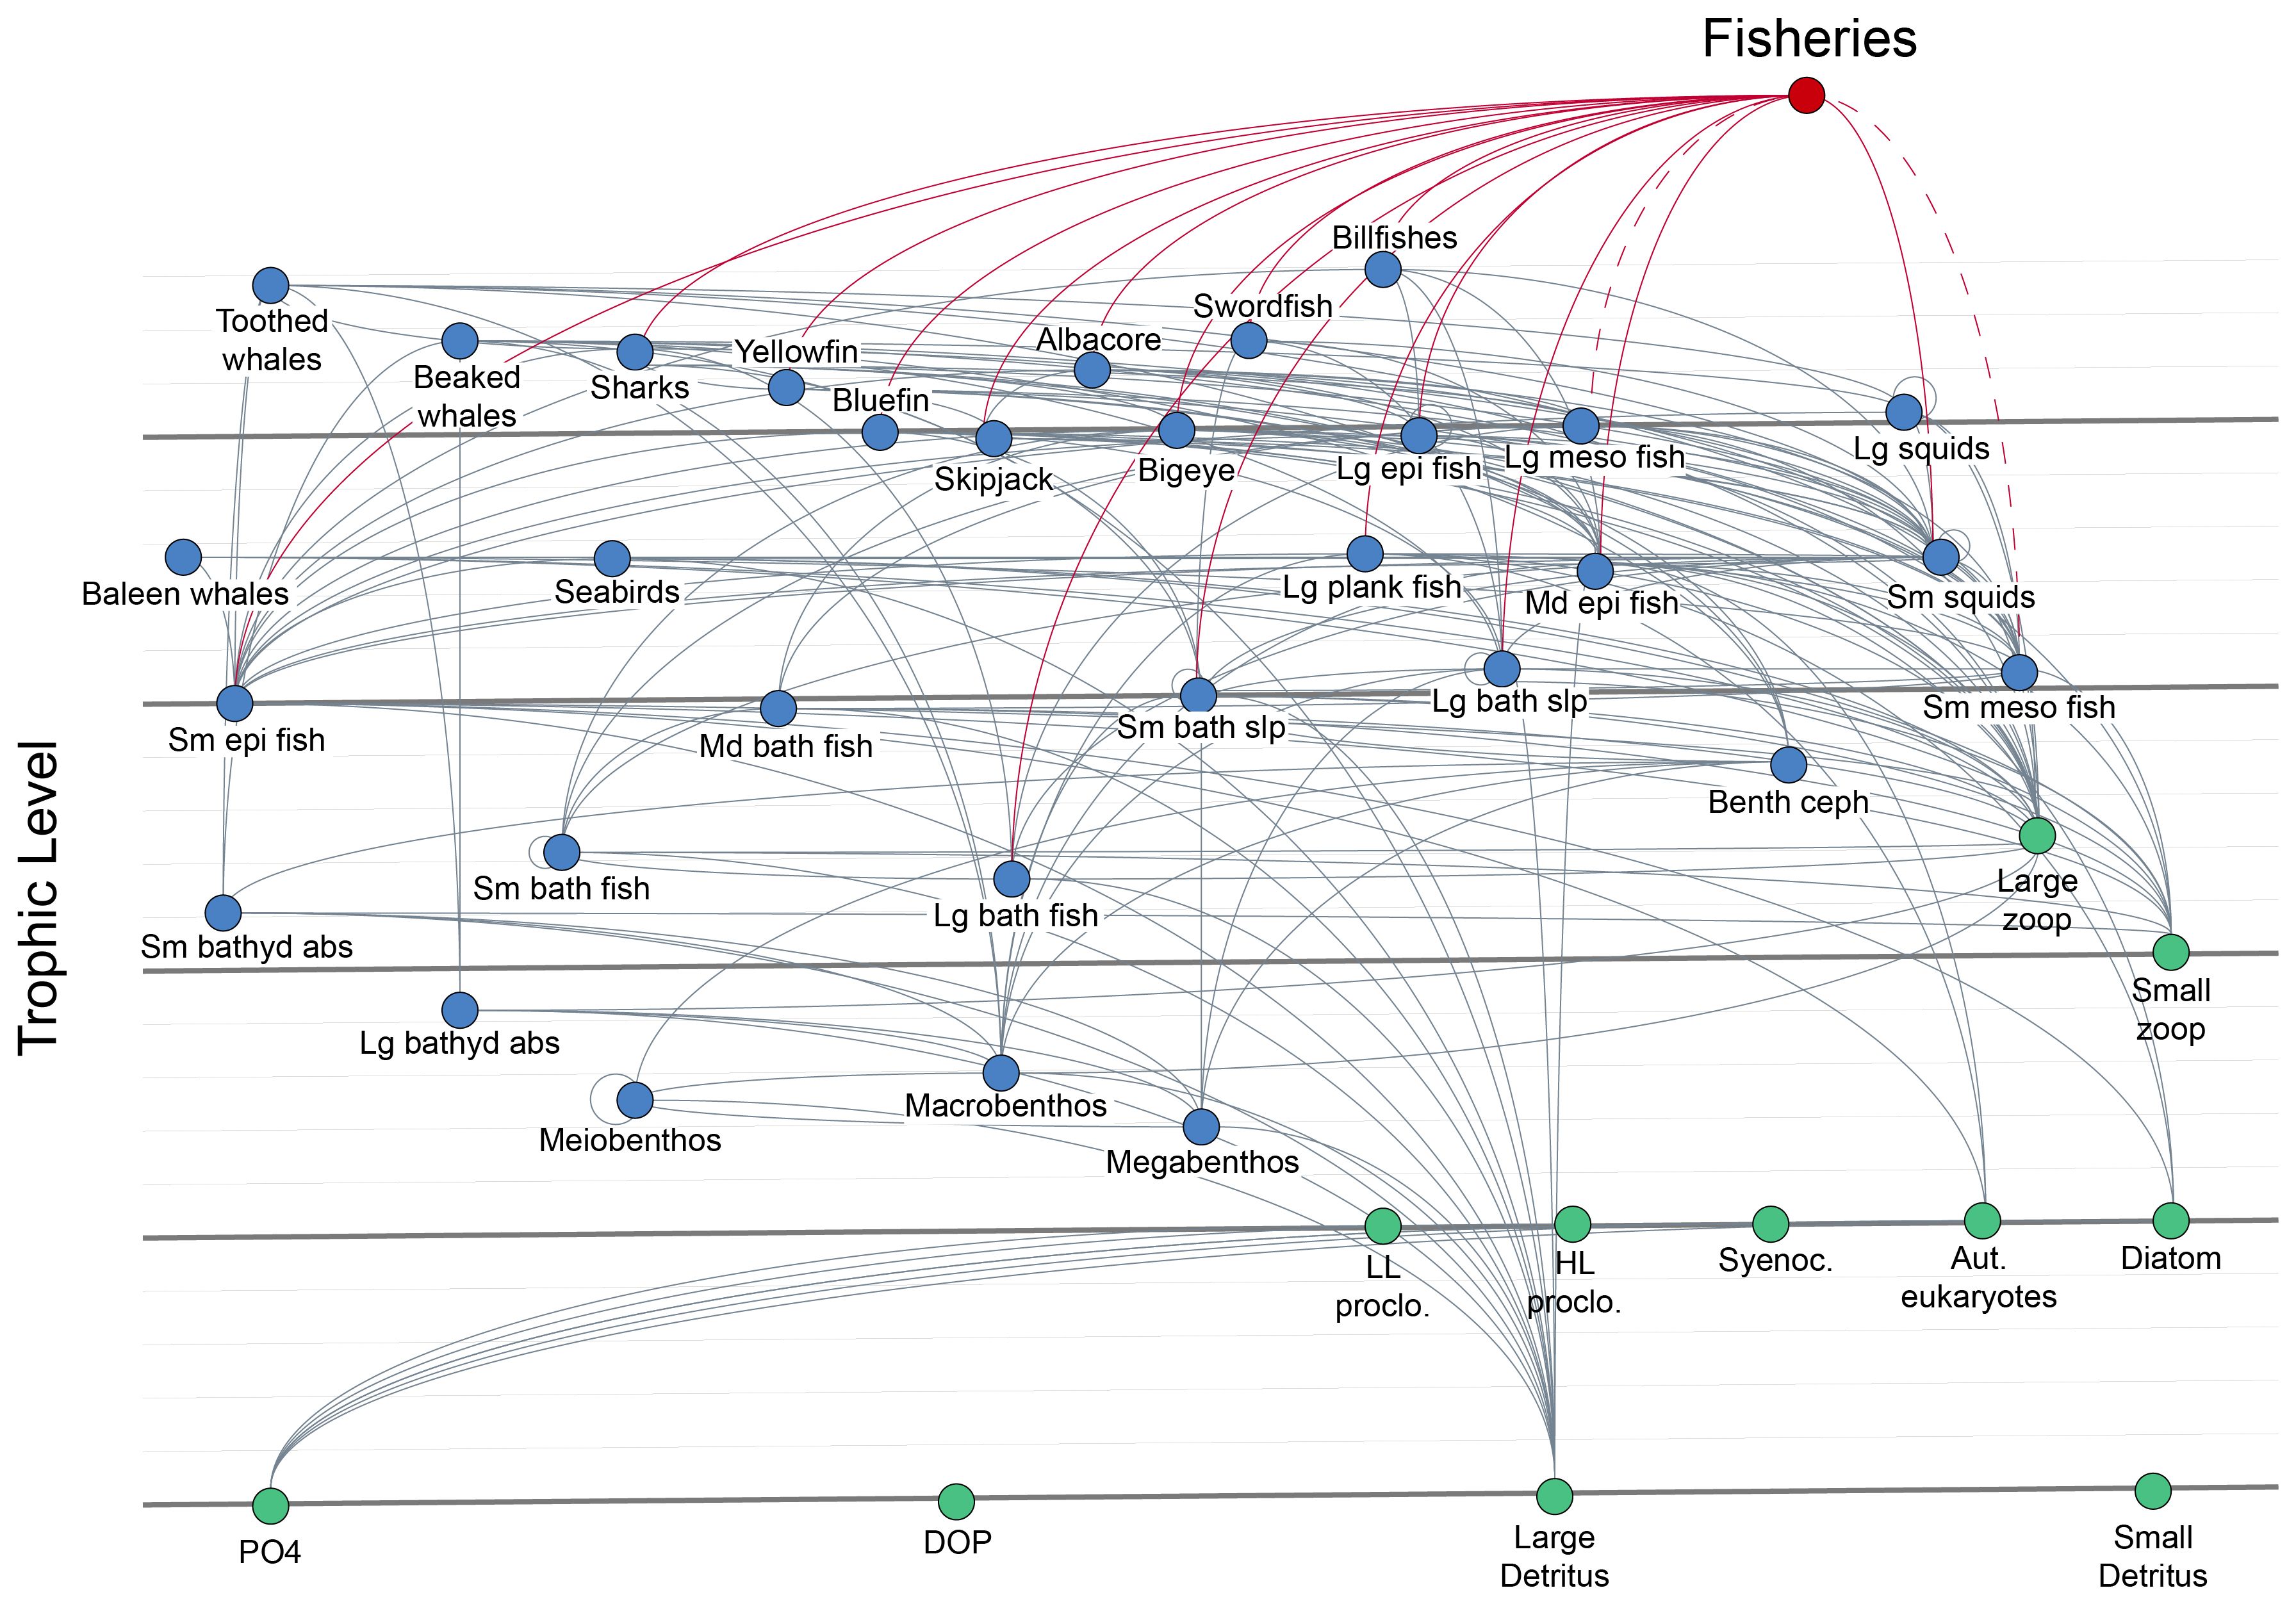
Figure 4 The flow diagram of the coupled North Atlantic Ecosystem Model (NAGEM) and Ecopath with Ecosim-Fortran (EwE-F) models (NAGEM/EwE-F). The green nodes represent the lower-trophic-level (LTL) groups simulated by NAGEM, and the blue nodes represent the higher-trophic-level (HTL) groups simulated by EwE-F. Prey-predator relationships are shown by grey, while fisheries are shown by red lines. Dashed red lines indicate the harvesting of mesopelagic fish groups in the scenarios.
The parameters of the original Ecopath and NAGEM models were kept intact; however, the parameters that were directly affected by the coupling procedure, i.e., sinking rates for detrital compartments and plankton closure mortalities, were adjusted. Furthermore, new parameters (namely, C:N:P ratio of the fish body, diel vertical migration depth of mesopelagic fish, and migrant portion of mesopelagic fish) were introduced in the coupled structure. In the coupled Ecopath-F HTL model, the diet matrix was revised such that the diet compositions of “small zooplankton shallow” and “small zooplankton deep” in the original North Atlantic Ecopath model were consolidated and used as the diet composition of microzooplankton (see Supplementary Material 2). Fish predation on phytoplankton (i.e., by large planktivorous fish, small epipelagic fish, and medium epipelagic fish) was equally distributed among diatoms and autotrophic eukaryotes in the coupled model. As bacterial activity was implicitly represented in the biogeochemical model, heterotrophic bacteria were removed from the Ecopath-F model. The parameterization of the HTL groups was inherited from Vasconcellos and Watson (2004); however, biomass units were converted to phosphorus based on the mean whole-body fish C:N:P stoichiometry measurements by Czamanski et al. (2011), i.e., 46.52:10.61:1. Ecopath uses annual rates for the production and consumption of groups, and these rates were converted to “per hour” in EwE-F for harmonization with the time step of NAGEM. To parameterize the LTL groups in Ecopath-F, the standalone NAGEM model was run for four years (i.e., 1996–1999) after a 20-year spin-up period and the model output for the last year of this simulation was used to calculate the annually averaged depth-integrated biomass, production, and consumption rates for LTL groups in Ecopath-F (Supplementary Table S4). The production-to-biomass ratios of the LTL groups in Ecopath-F were assumed to be equal to the simulated total mortality of plankton in NAGEM, as per Allen (1971). However, mortality rates of LTL groups were reparametrized because, in NAGEM, mortality rates represent the total mortality, i.e., the sum of the predation mortality and the natural mortality that stemmed from aging and/or diseases, as closure. Because the predation mortality of plankton groups was explicitly simulated in the coupled model, mortality rates were readjusted to represent only non-predation natural mortality for zooplankton groups. The consumption-to-biomass ratios of the LTL groups were computed from the nutrient uptake rates (i.e., PO4 uptake, as the unit of Ecopath-F was phosphorous) for phytoplankton and from grazing flows for zooplankton. The output of the Ecopath-F setup was used as the initial condition for the dynamic simulation of coupled NAGEM-Ecosim-F.
The migration depths of mesopelagic fish were defined based on Klevjer et al. (2016) and O'Driscoll et al. (2009), such that they feed in the epipelagic zone (the upper 200 m) at night, return to the mesopelagic zone (between 400–600 meters) before sunrise, and defecate their consumption there. The night-time mortality and defecation fluxes of mesopelagic fish were equally distributed between 400–600 meters, whereas the daytime mortality and defecation fluxes were distributed proportional to the vertical distribution of zooplankton biomass in the upper 200 m. The North Atlantic mesopelagic species included in the Ecopath model of Vasconcellos and Watson (2004) were Benthosema glaciale, Notoscopelus kroeyeri, Lobianchia dofleini, Lampanyctus pusillus, Ceratoscopelus maderensis, Lepidophanes guentheri, Lobiancia dofleini, Maurolicus muelleri, Ceratoscopelus warmingi, Diogenichthys atlanticus, Notolychnus valdiviae, Lepidophanes gaussi, Pollichthys mauli, Argyropelecus olfersi, Stomias boa and Cyclothone spp. Among these species, Lampanyctus pusillus, Ceratoscopelus warmingi, Diogenichthys atlanticus, Notolychnus valdiviae, Lepidophanes gaussi, and Pollochthys mauli were most abundant in the Sargasso Sea. The majority of these mesopelagic species in the North Atlantic (90%) were considered to have undergone diel vertical migration in Vasconcellos and Watson (2004). Therefore, we followed the same assumption, and 90% of the mesopelagic fish underwent diel vertical migration in the coupled model. To account for the mesopelagic fishes that are found in the surface during the daytime (O'Driscoll et al., 2009), the remaining 10% of mesopelagic fish were kept in the epipelagic zone throughout the day and allowed to feed on zooplankton. The biomass of the large mesopelagic fish group was estimated by the model based on the conservation of mass principle, as explained above, while the initial biomass of the small mesopelagic fish group was an input (1724.369 kg km-2 for the North Atlantic). This input was estimated by Vasconcellos and Watson (2004) based on Gjosaeter and Kawaguchi (1980).
The sinking velocities for the detrital compartments of small and large detritus pools were 5 and 24 m d-1, respectively, in Yumruktepe et al. (2020). However, the sinking velocities from Salihoglu et al. (2008) were adopted in this study (i.e., 2 and 30 m d-1) to improve the model’s ability to capture carbon export dynamics.
The coupled model was run for four years, from 1996 to 1999, after 20 years of spin-up. At each time step (i.e., one hour), Ecosim-F computed the HTL dynamics, whereas NAGEM computed the LTL dynamics. The two models exchanged information; i.e., consumption fluxes from the LTL to HTL groups, as well as the mortality, excretion, and defecation fluxes from the HTL to LTL groups, before proceeding to the next time step. The currency of the EwE-F model was phosphate, whereas that of the NAGEM model was carbon. The conversion between the HTL and LTL model currencies was performed based on the mean whole-body fish C:N:P stoichiometry measurements by Czamanski et al. (2011) at each time step to ensure harmonization between the models.
The model-simulated LTL dynamics were compared with the Bermuda Atlantic Time-series Study (BATS) dataset. Primary production, chlorophyll-a concentrations, POC flux, and meso- and micro-zooplankton biomasses were compared with the BATS data for the years 1996–1999. The model skill was evaluated using Taylor diagrams (Taylor, 2001) that combined information regarding the model results’ correlations with and root mean squared deviations (RMSD) from the observations, as well as their standard deviations. The original EwE model of the North Atlantic by Vasconcellos and Watson (2004) did not include a temporal simulation; therefore, the EwE-F model results for higher-trophic-level compartments were not validated.
Three scenarios were defined for the model simulations. In the reference scenario (REF), the coupled model was run under constant fisheries exploitation levels for functional groups and fish species, as defined by Vasconcellos and Watson (2004). In the REF scenario, mesopelagic fish groups were not harvested. In the second M1 (baseline fishing) scenario, a fisheries exploitation rate, i.e., annual fishing mortality (FA), was defined to the highest possible extent for the mesopelagic fish groups without breaking the mass balance constraint in Ecopath-F, as detailed in Section 2.3. (FA = 1.71 x 10⁻⁶ and FA = 6.64 x 10⁻⁵ for the large and small mesopelagic fish groups, respectively). In the third M2 (commercial fishing) scenario, fisheries exploitation levels on the mesopelagic fish groups in M1 were increased 10-fold.
The trophic interactions between the functional groups of the coupled mass-balanced Ecopath-F model were analyzed using mixed trophic impact (MTI) analysis (Ulanowicz and Puccia, 1990). MTI analysis can be considered a sensitivity analysis showing the impact of a biomass decrease/increase of a group on the biomasses of other groups in the food web. MTI values scale between -1, indicating a strong negative impact, and 1, indicating a strong positive impact. Furthermore, three synthetic ecosystem indicators, Relative Primary Production Required to sustain catches (%PPRc), mean trophic level of catches (mTLc), and the probability of the ecosystem being sustainably fished (Psus), were evaluated to assess the ecosystem response to changes in fisheries. %PPRc shows the fisheries footprint on the ecosystem by means of calculating how much of the primary production in the system is required to support the amount of biomass removal by fisheries capitalizing on transfer efficiency (TE) of energy/biomass across trophic levels in the food web (Pauly and Christensen, 1995). The mTLc is an indicator of the relative proportions of higher- and lower-trophic-level species in the fisheries catch. As fishing intensity on lower trophic level organisms, such as mesopelagic fish, increases, the mTLc decreases (Pauly and Palomares, 2005; Branch 2010). Psus combines ecosystem properties (primary production and TE) with fishing activities (mTLc of catches and %PPRc) to assess the probability of the ecosystem being sustainably fished (Libralato et al., 2008). In this study, we computed Psus and %PPRc, assuming a mean TE of 8% between trophic levels in the food web, using the geometric mean of the transfer efficiencies calculated by the Ecopath model.
The simulated zooplankton biomass, carbon export, primary production, and chlorophyll-a by NAGEM/EwE-F were compared with the BATS data, as well as with the stand-alone (i.e., uncoupled) NAGEM (Figures 5, 6). The model successfully simulated total zooplankton biomass (Figure 5A) in terms of both magnitude and seasonality. The model-estimated carbon export fluxes at 150, 200, and 300 m were comparable to the BATS data (Figure 5B). The model could capture the increase in carbon export in winter, as well as the reduction in carbon export with depth from 150 m to 200 m and 300 m. However, the POC export flux at 300 m showed strong peaks compared with the data. The model captured the increase in zooplankton biomass following the spring algal bloom, in agreement with observations. The coupled model captured the magnitude and depth of total primary productivity pattern (Supplementary Figure S2). The maximum total primary production concentration simulated within the upper 50 m agreed with the data. However, the model overestimated total primary production with respect to the BATS data.
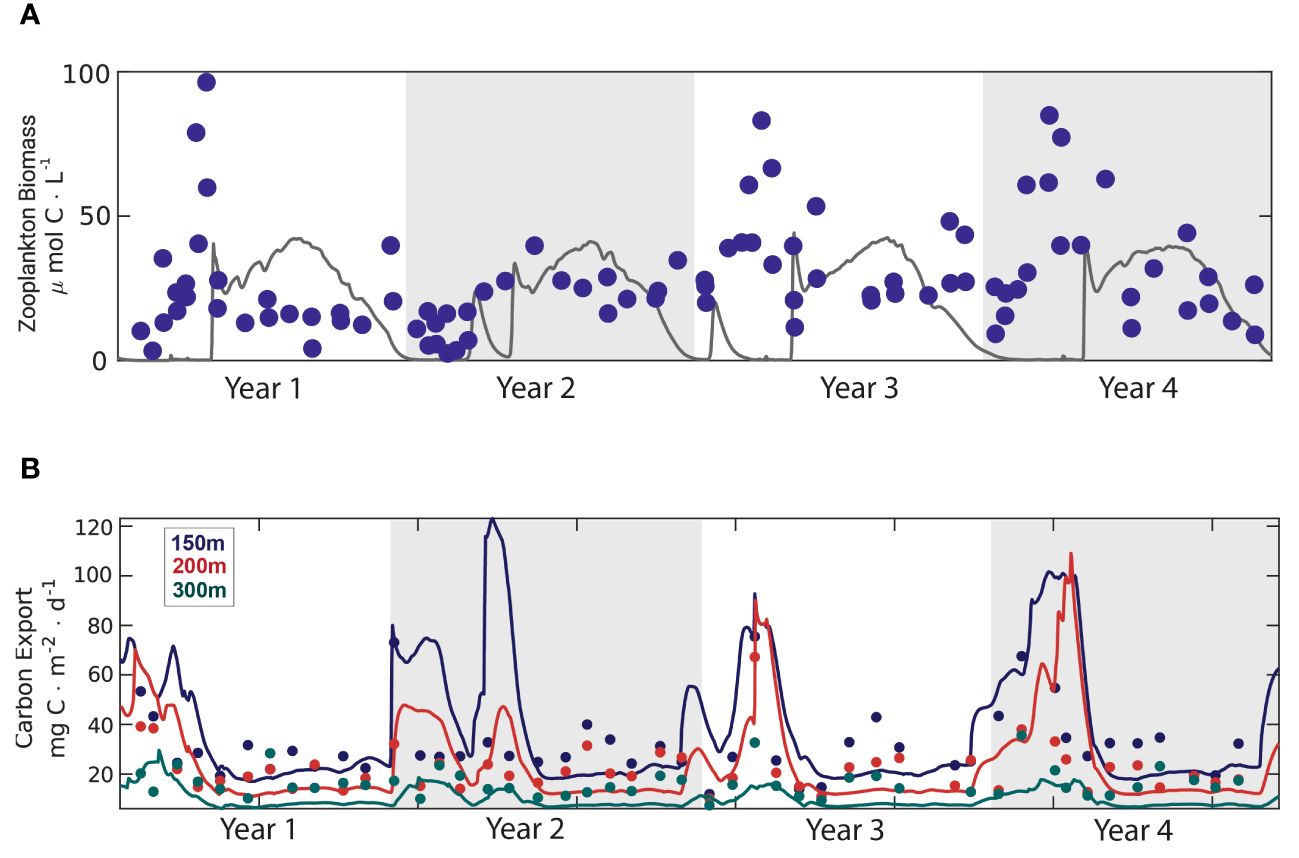
Figure 5 Comparison of coupled model results with Bermuda Atlantic Time-series Study (BATS) data: (A) total zooplankton biomass simulated by the coupled model (grey line) and the BATS total zooplankton data (dark blue dots) (B) carbon export simulated by the coupled model at 150 m (dark blue line), 200 m (red line), 300 m (green line); and BATS carbon export data at 150 m (dark blue dots), 200 m (red dots), 300 m (green dots).
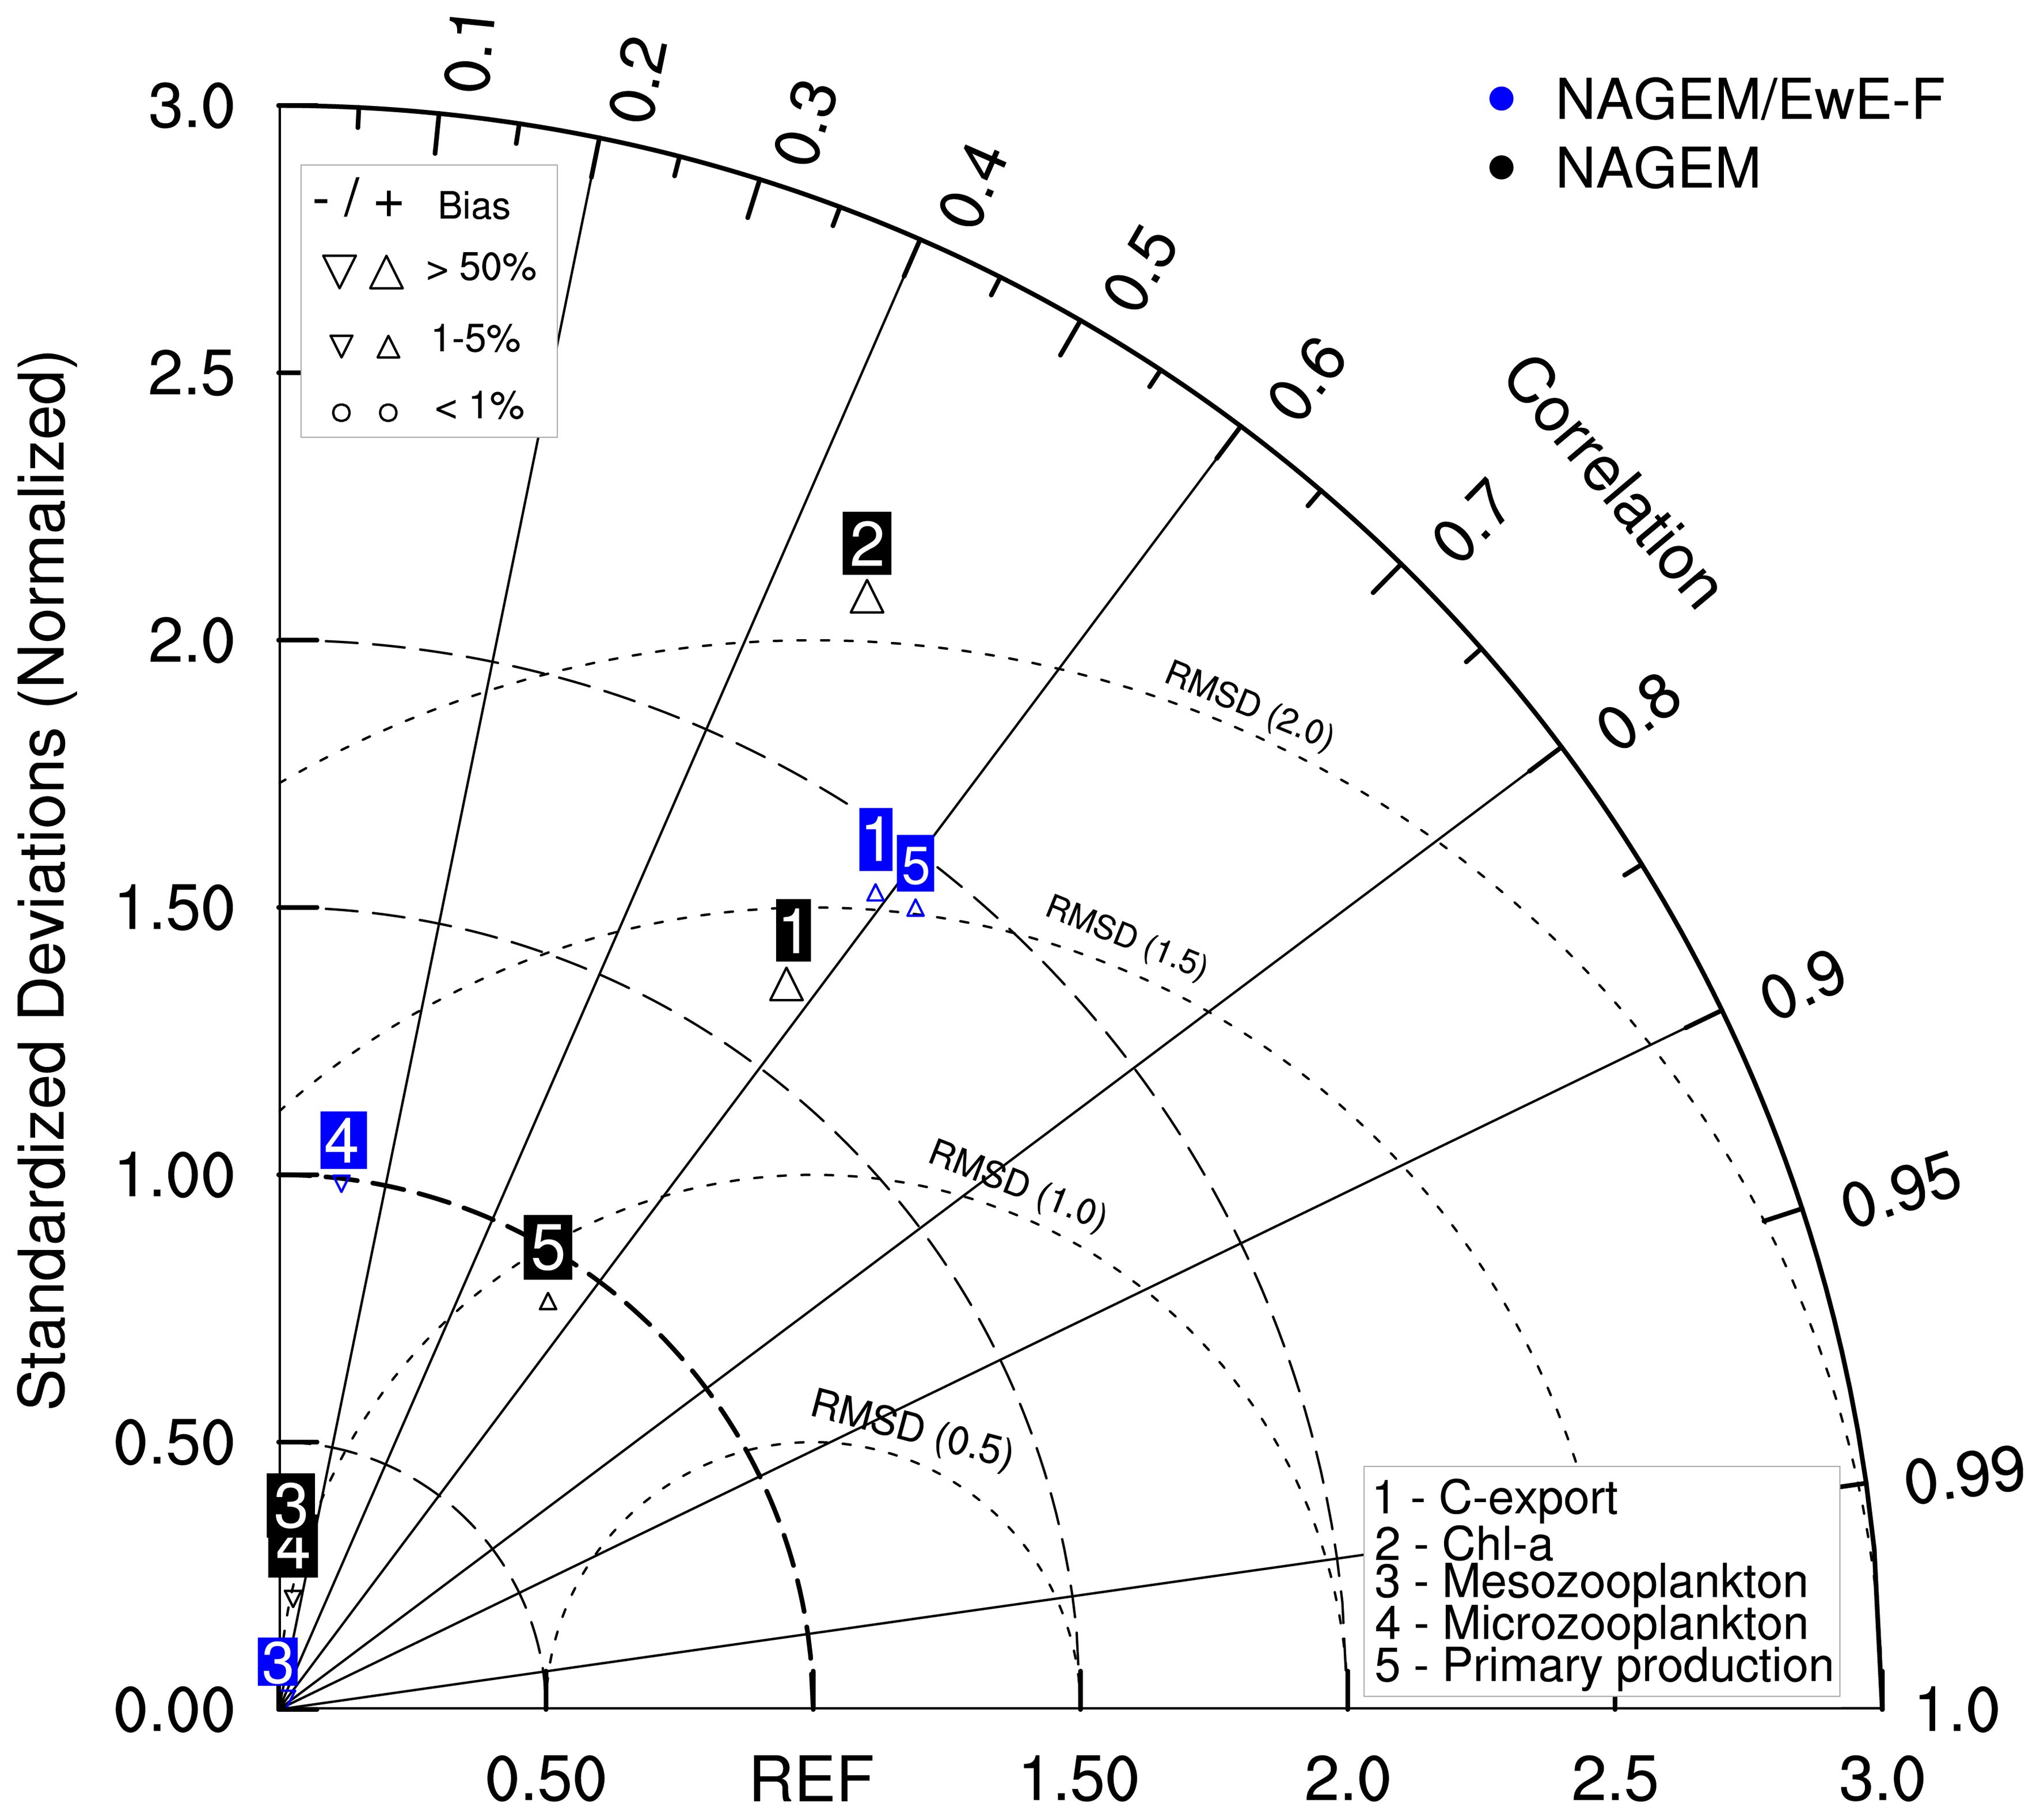
Figure 6 Taylor diagram for model statistics showing the performance of the standalone (uncoupled) North Atlantic Generic Ecosystem Model (NAGEM, black markers) and the coupled model (blue markers) with respect to the Bermuda Atlantic Time-series Study (BATS) data. The numbers within the blue and black markers (from 1 to 5) indicate the model variables listed in the legend on the bottom-right corner of the diagram. The x and y axes (connected with dashed lines) show the standard deviation. The inner angular dashed lines show the root mean squared distances (RMSD) with respect to the BATS reference data (REF). The outer angular axis shows the correlation coefficient. REF represents the reference point (i.e., the hypothetical location of the data, where correlation coefficient and standard deviation are 1.0 and RMSD is zero). The triangles under the blue and black markers indicate the bias, as scaled on the top-left corner of the diagram. The coupled model statistics for the chlorophyll-a concentration in the water column had a correlation coefficient of 0.44 and standard deviation of 8.43 and were not shown in this diagram.
The skill of the coupled model in terms of simulating total primary production was comparable to that of the standalone NAGEM (Figure 6); however, it had a higher correlation and RMSD. The carbon export and primary production simulated by NAGEM/EwE-F were highly correlated with observations (r = 0.59 and 0.62, respectively) and RMSE values were close to 1. Chl-a simulated by NAGEM/EwE-F had a correlation coefficient of 0.44 with the data. The model skill for zooplankton values simulated by NAGEM/EwE-F was comparable to that of the standalone NAGEM, although the zooplankton concentrations simulated by both models had low correlations with the BATS data (Figure 6). Overall, model performance was considered successful.
The total mesopelagic fish biomass estimated by the model in the REF scenario was 18.80 g C m-2, corresponding to 82% of the total biomass in the non-mesopelagic HTL groups (Table 1). When mesopelagic fish were harvested in scenario M1, the annual average biomass of the phytoplankton, zooplankton, mesopelagic fish, and non-mesopelagic HTL groups did not change significantly (Table 1). However, the biomass of detrital compartments decreased by 3% (Table 1). When the fishing pressure on mesopelagic fish increased by an order of magnitude in scenario M2, total phytoplankton biomass decreased by 37%. The reductions in the total phytoplankton biomass were mainly due to reductions in the biomass of diatoms (from 4.46 to 2.66 g C m-2, not shown). However, total zooplankton biomass increased by 26%. In the M2 scenario, increased harvesting rates led to a 95% decrease in mesopelagic fish biomass but a 25% increase in non-mesopelagic HTL group biomass (Table 1). The main contributor to the increase in the total non-mesopelagic HTL group biomass was small epipelagic fish (Figure 7). The biomasses of other non-mesopelagic HTL groups also varied, but the changes were relatively small. The overall changes in HTL and LTL biomasses in M2 decreased total detritus by 19% (Table 1), leading to strong reductions in carbon export throughout the water column.
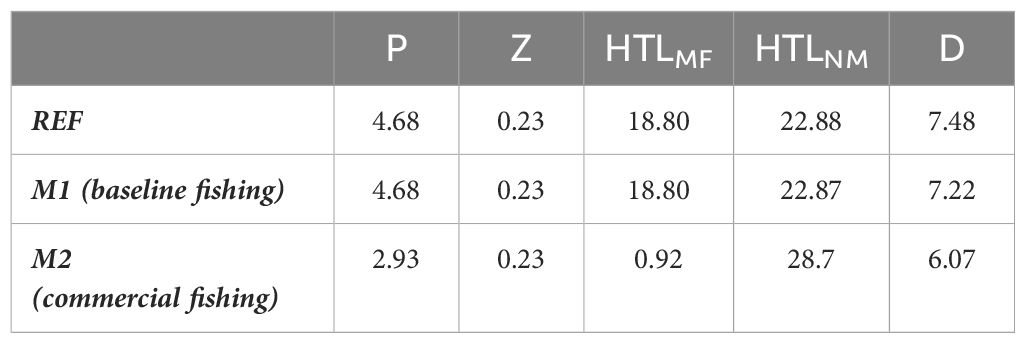
Table 1 Total biomasses (g C m-2) in model compartments (P: Phytoplankton, Z: Zooplankton, HTLMF: Mesopelagic fish groups, HTLNM: HTL groups other than mesopelagic fish, D: Detritus) under the reference scenario (REF) and two mesopelagic fish harvesting scenarios (M1: baseline fishing and M2: commercial fishing).
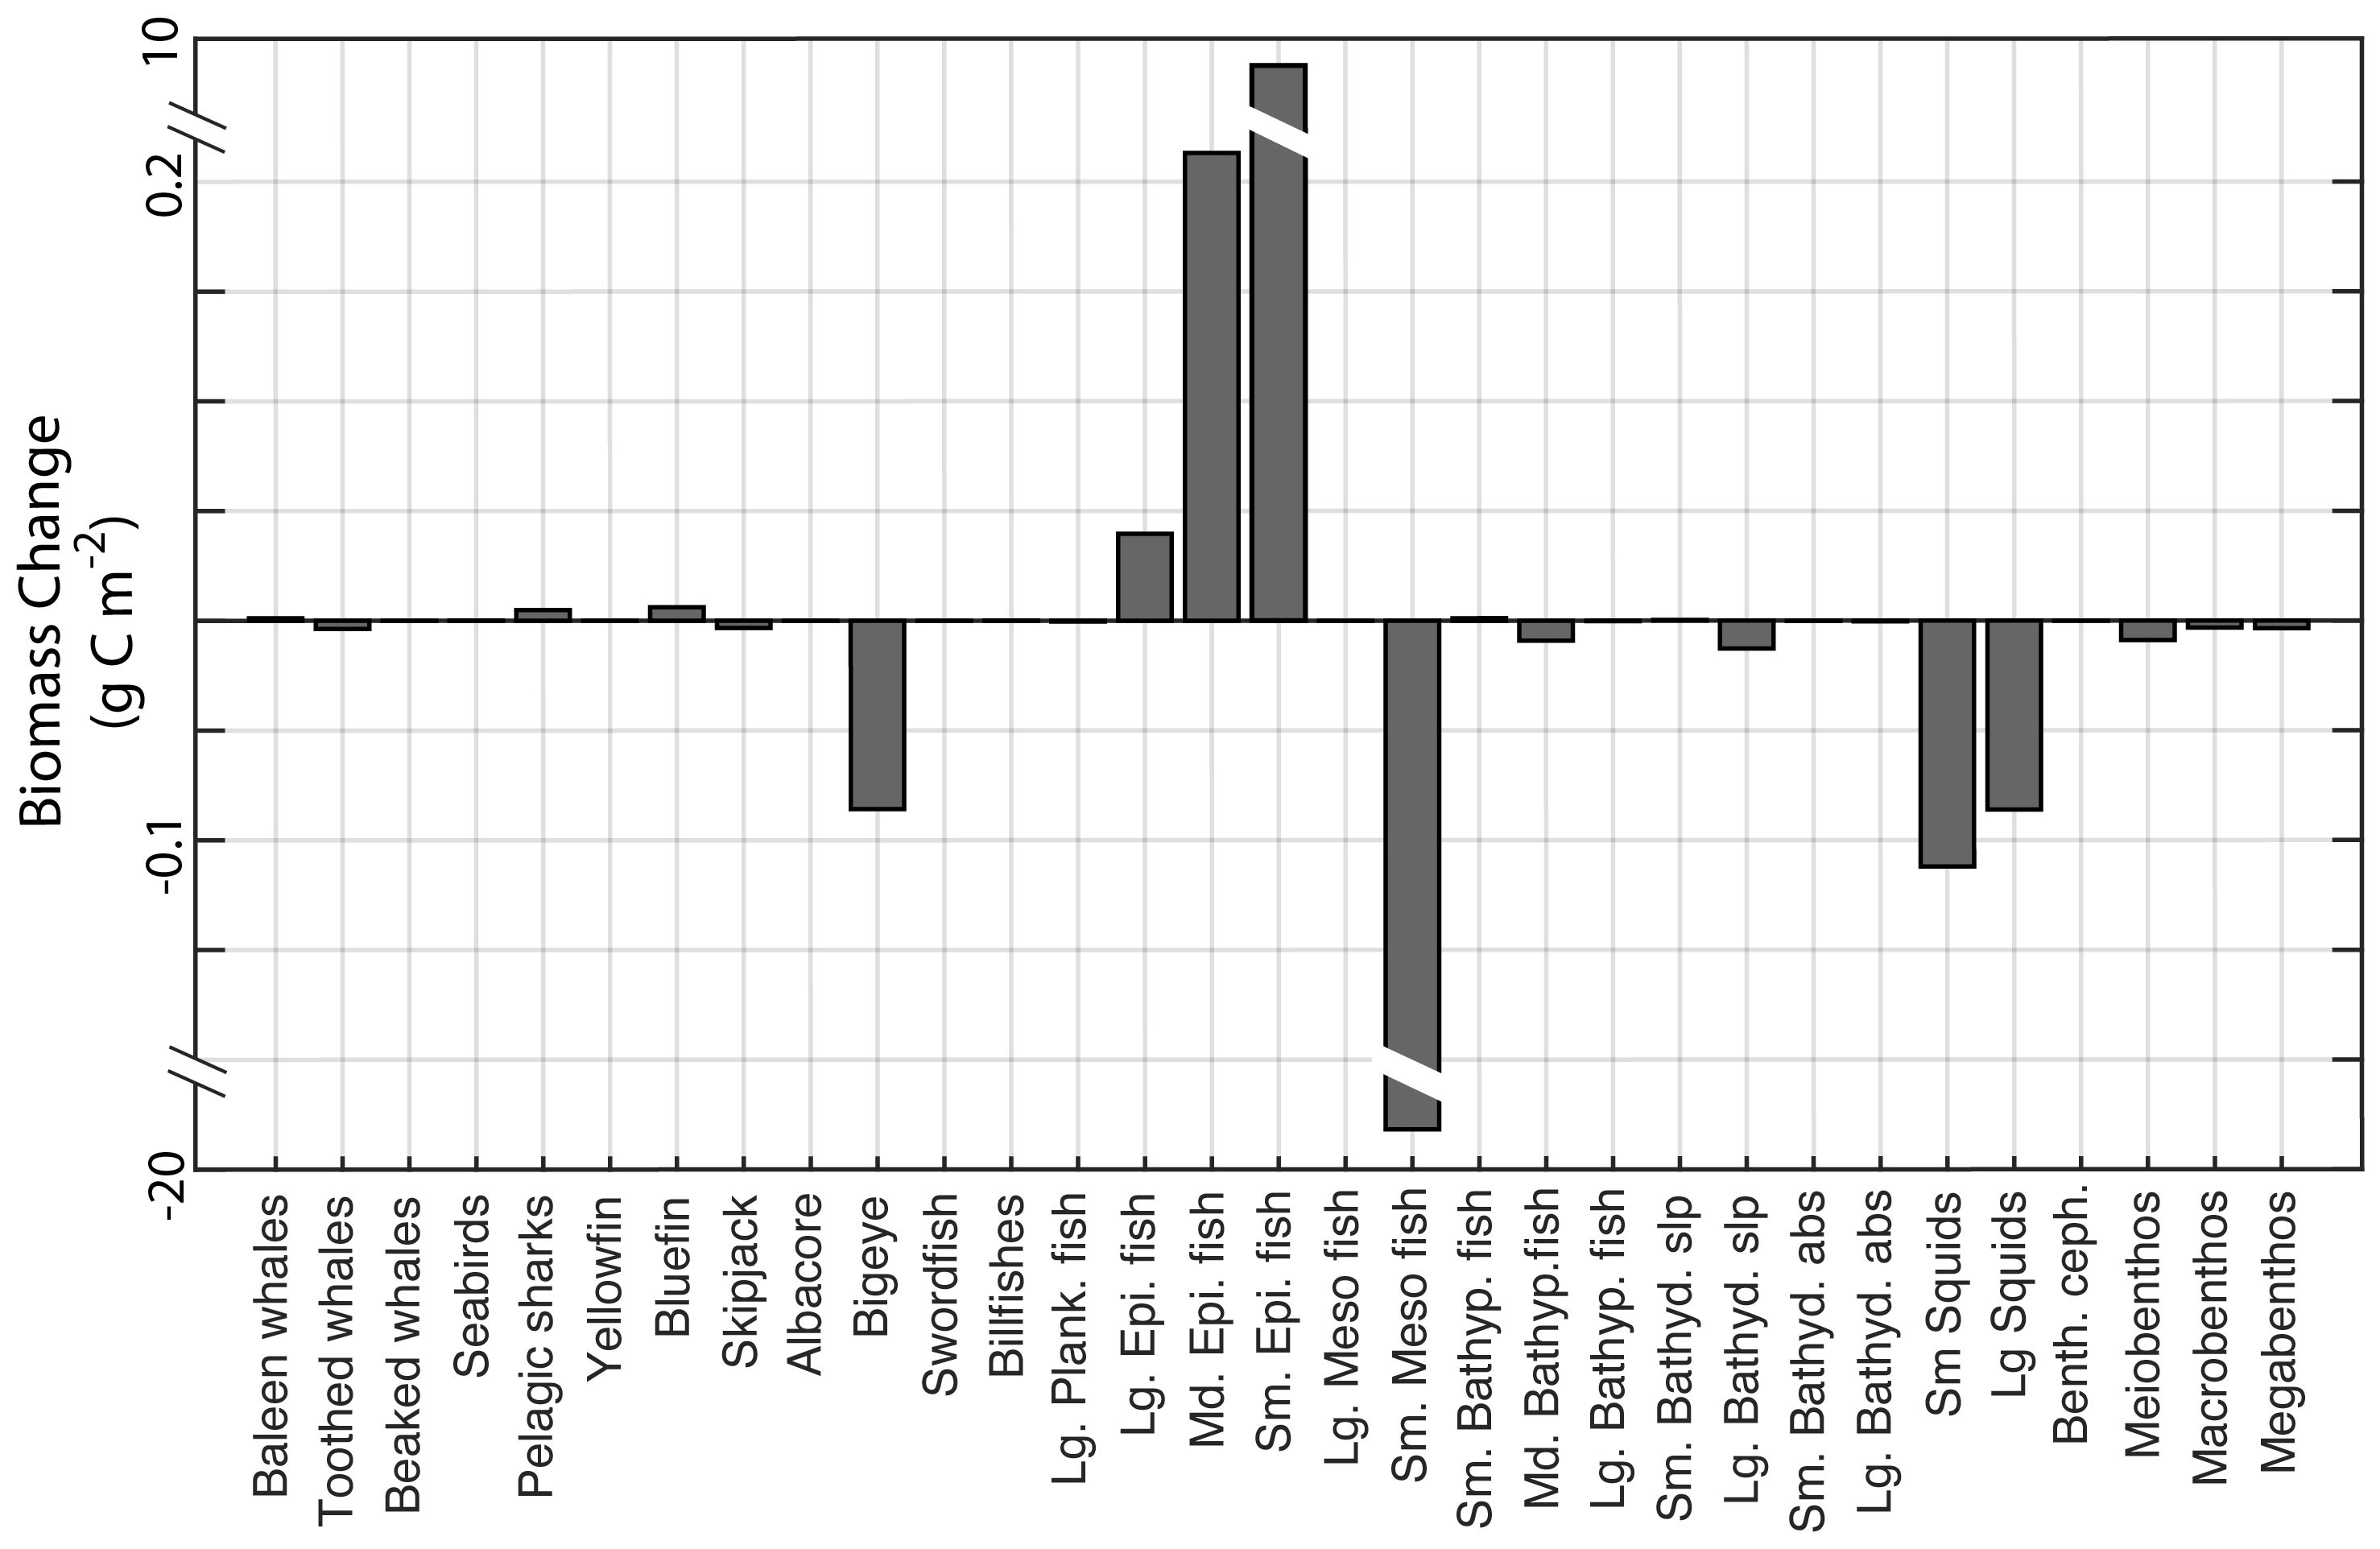
Figure 7 Change in higher-trophic-level organism biomasses (g C m-2) in the M2 scenario (commercial fishing) with respect to the reference scenario. The positive values indicate an increase in the biomass of the corresponding higher-tropic-level (HTL) group after removal of mesopelagic fish by fisheries, while the negative values indicate a decrease.
Mesopelagic fish provided 54.7 and 28.8 mg C m-2 d-1 POC to detritus in the water column via the release of unassimilated part of their food (i.e., defecation) and mortality fluxes, respectively. The total defecation and mortality fluxes from non-mesopelagic HTL groups to detritus was 342.7 and 14.4 mg C m-2 d-1, respectively. The defecation and mortality fluxes from the non-mesopelagic HTL groups contributed to the detritus pool mainly in the upper 200 m. However, the fluxes from mesopelagic fish also strongly affected depths below 400 m (Figure 8A). At approximately 550 m, the active carbon transport by mesopelagic fish was comparable to that of passive exports (Figure 8B). The contribution of mesopelagic fish to the total carbon export between 400–600 meters was ~40% of the total carbon export (Figure 8C), while the remaining portion was driven by the gravitational sinking of particles from above (i.e., passive export). Active transport of carbon from the euphotic zone led to a bump in the vertical carbon export profile at 400–600-meter depths. In the epipelagic zone, carbon export decreased by 12%, and the bump in the carbon export profile at 400–600 depths disappeared in the M2 scenario.
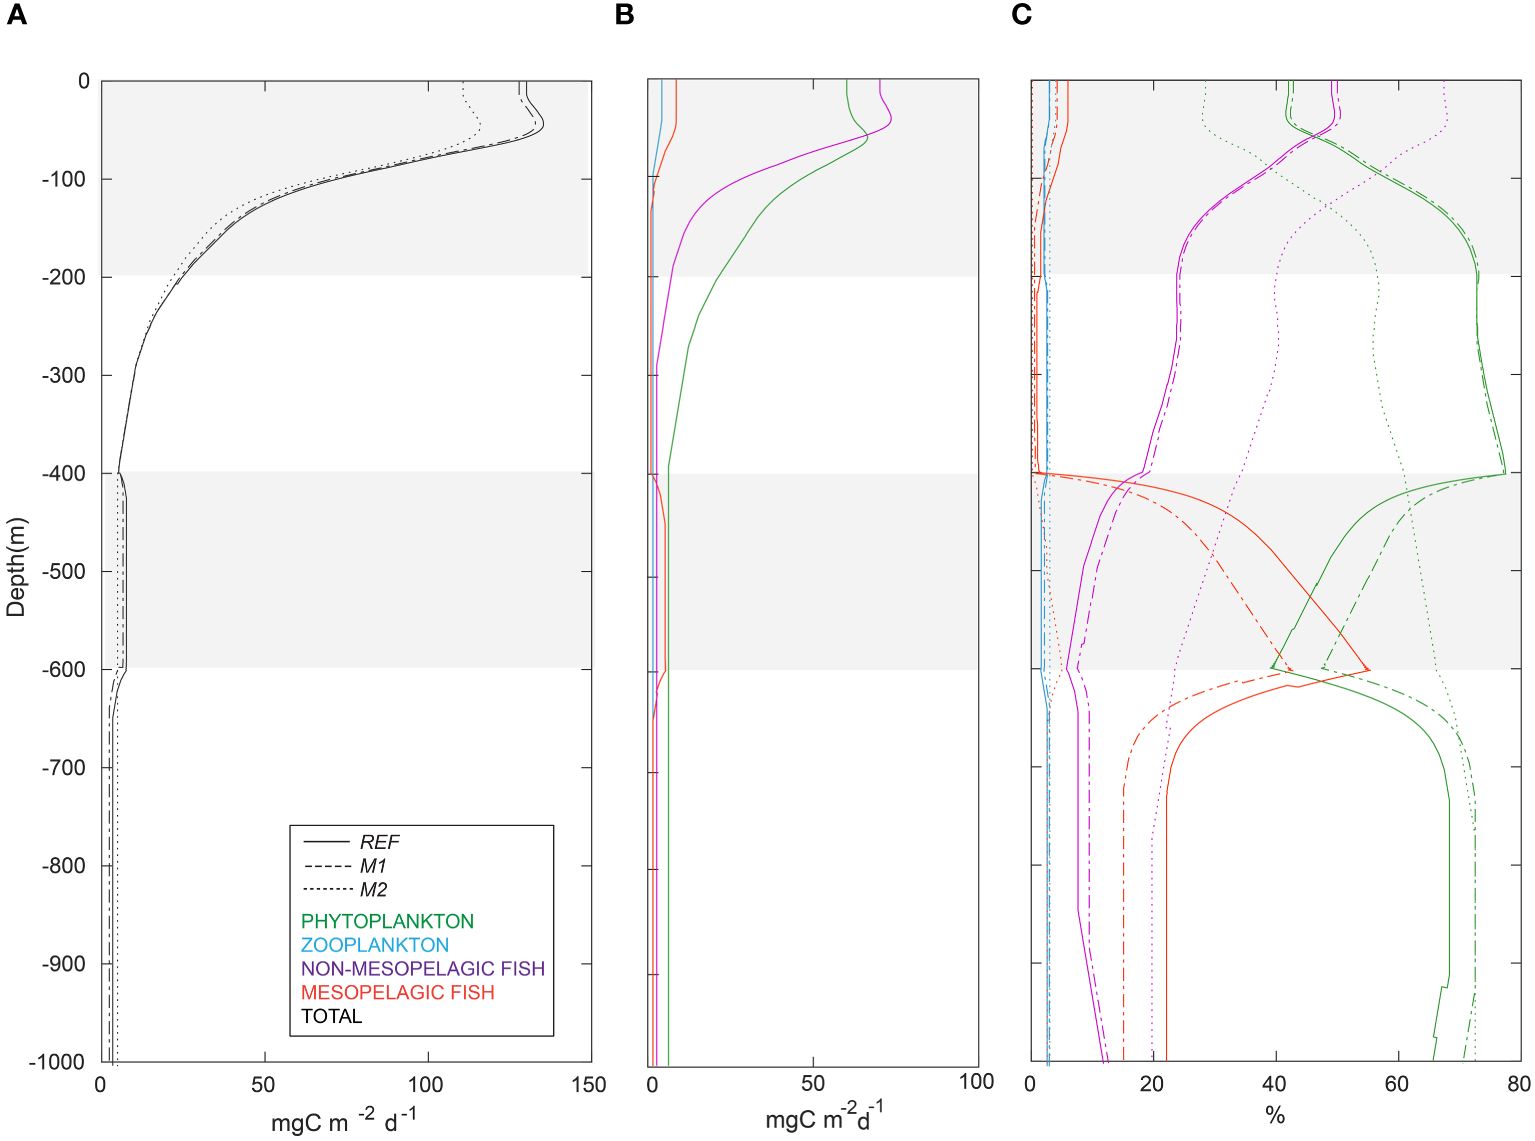
Figure 8 (A) vertical profiles of total carbon exports in the first reference scenario (REF, solid), in the second mesopelagic fish harvesting scenario (M1: baseline fishing, dashed), and in the third mesopelagic fish harvesting scenario (M2: commercial fishing, dotted); (B) absolute contributions (mg C m-2 d-1) of organisms to daily carbon export at different depth layers in the REF scenario: phytoplankton-mediated (green), zooplankton-mediated (blue), mesopelagic fish-mediated (red), and non-mesopelagic HTL groups-mediated (purple); (C) relative contributions (%) of phytoplankton, zooplankton, mesopelagic fish, and non-mesopelagic HTL groups to total carbon export in the REF, M1, and M2 scenarios.
Mesopelagic fish accounted for up to 6% of the total carbon export above 400 m in the REF scenario (Table 2). In the epipelagic zone (upper 200 m), the largest contributors to carbon export were phytoplankton (57.4%) and non-mesopelagic HTL groups (36.6%) in the REF scenario. At 400 m, the relative contributions of the non-mesopelagic HTL groups gradually decreased to approximately 9%. Phytoplankton dominated the total carbon export between 400–600 meters, accounting for 49.4% of the total carbon export in the REF scenario (Table 2). Although phytoplankton did not survive below 200 m, passive sinking of phytoplankton-driven carbon contributed 74.5% of the total carbon export in the 200–400-meter depth layer. Among the phytoplankton groups, diatoms were the major contributor to the total phytoplankton-mediated carbon export, accounting for almost 95% (not shown).
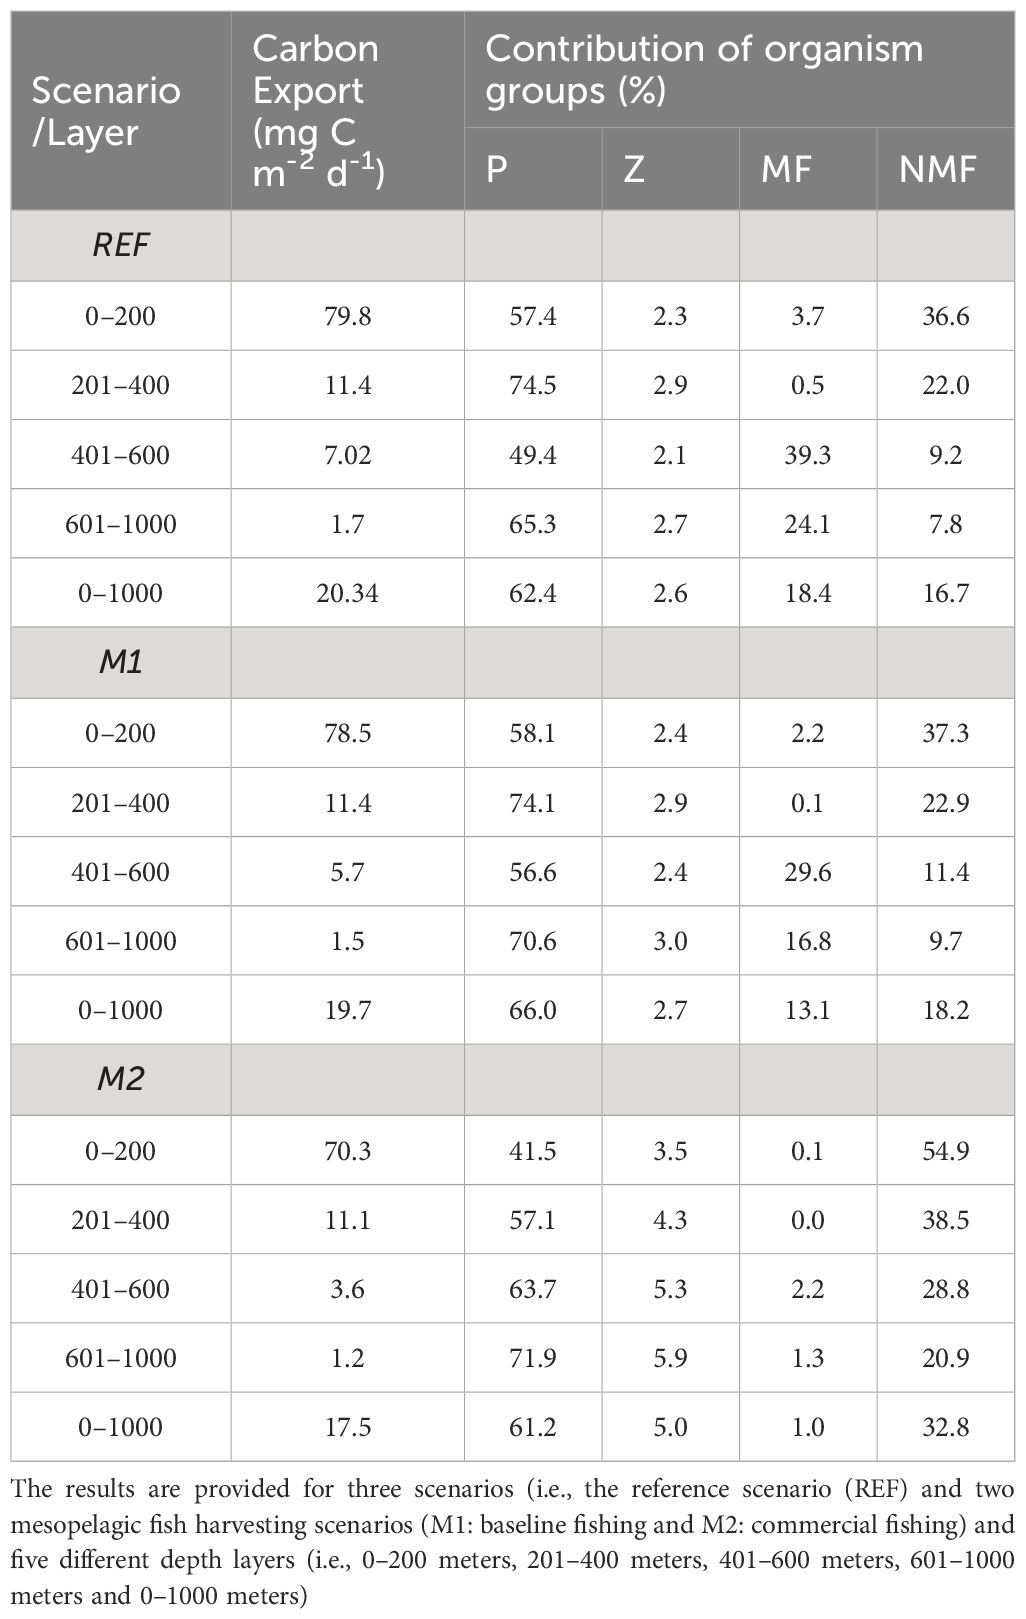
Table 2 Average total carbon exports (mg C m-2 d-1) in different depth layers of the water column and relative contributions of organism groups to these exports in percent.
The mixed trophic impact analysis for the REF scenario showed that mesopelagic fish groups had direct negative impacts on zooplankton and indirect positive impacts on all phytoplankton groups due to being predators of zooplankton (Figure 9). The trophic impact of the large mesopelagic fish on the non-mesopelagic groups was small. However, small mesopelagic fish had indirect negative impacts on epipelagic fish due to trophic competition for similar resources (i.e., small and large zooplankton). Small mesopelagic fish negatively affected the majority of the other planktivorous fish (i.e., large planktivorous fish, other epipelagic fish, and bathydemersal fish) due to trophic competition; however, they positively affected tuna fish groups due to being their preys.
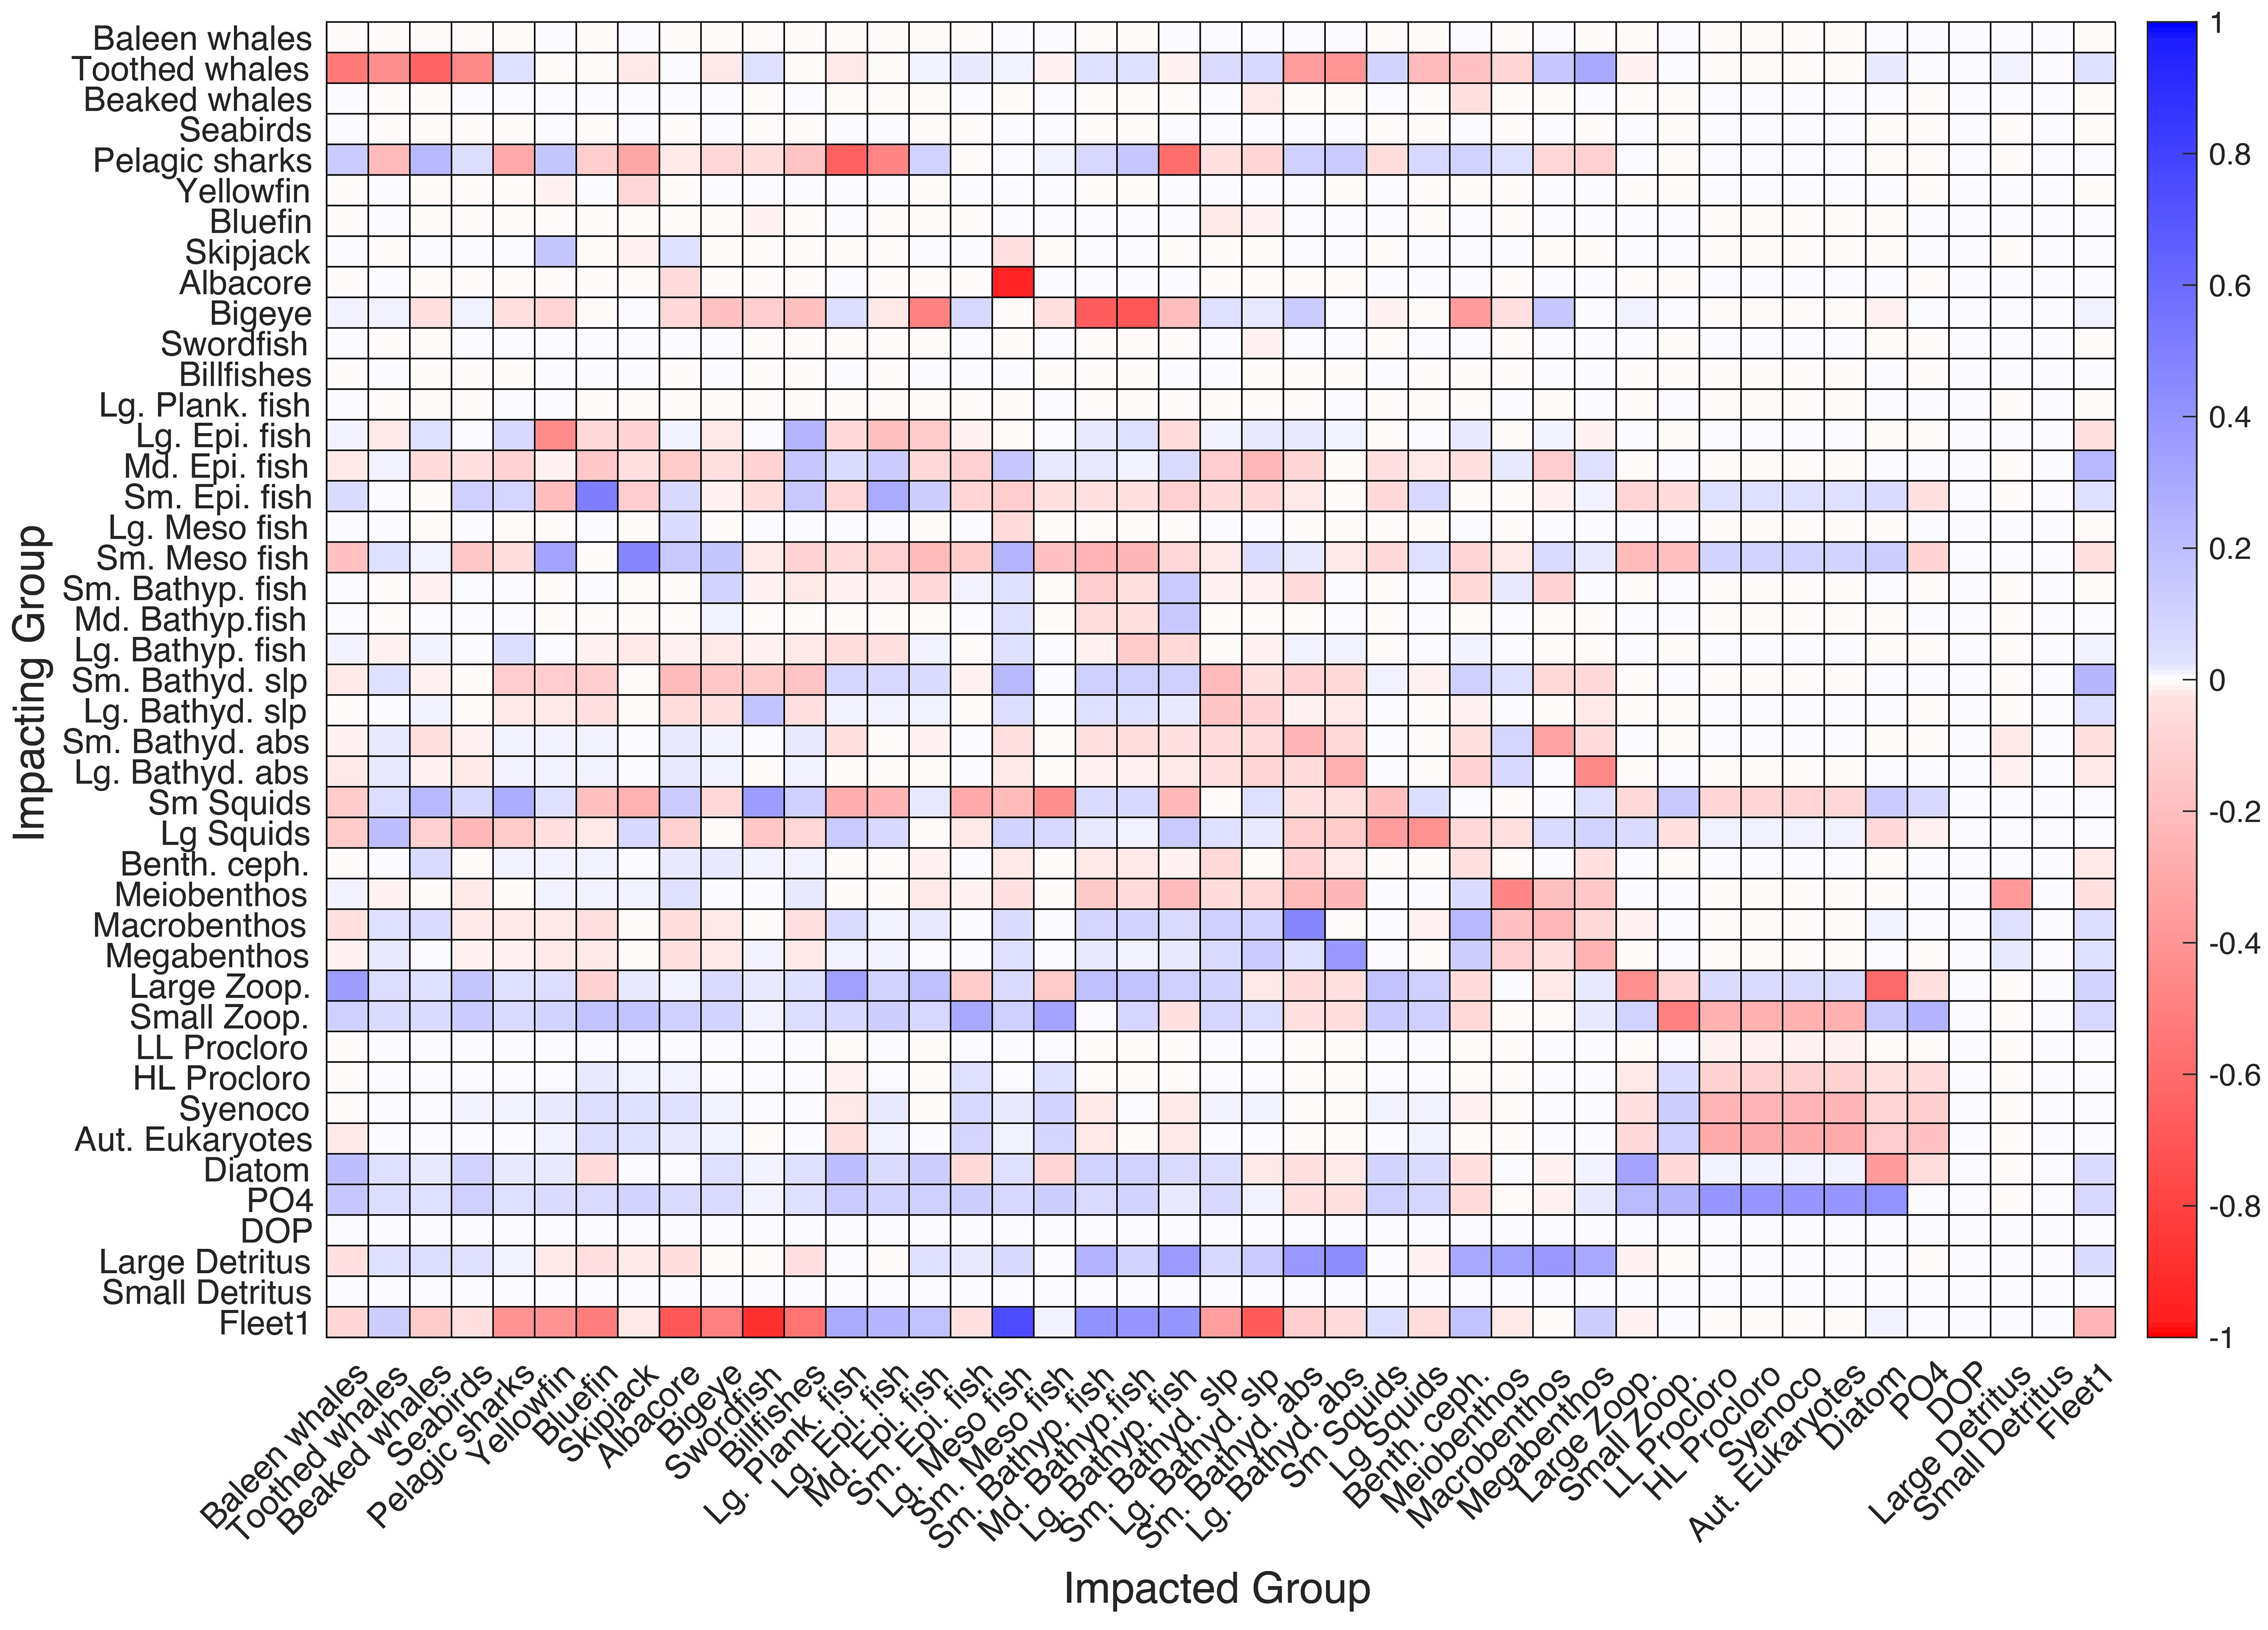
Figure 9 Mixed trophic impact (MTI) analysis of the reference scenario (REF) shows positive and negative impacts between the modeled functional groups and species.
The relative primary production required to sustain catches (%PPRc) in the REF scenario was 7% (Table 3) and the mTLc was 4.08. In the M1 scenario, where mesopelagic fish were harvested, %PPRc increased to 20%, while mTLc decreased to 3.24. The probability of the ecosystem being sustainably fished (Psus) under the REF scenario was high (>95%), but decreased to 70% in the M1 scenario. In M2 scenario, %PPRc increased to 73%, mTLc remained close to that in M1 scenario (3.22), and Psus decreased further to 20% (see Supplementary Table S5 in the Supplementary Material for the list of catches under the three scenarios).
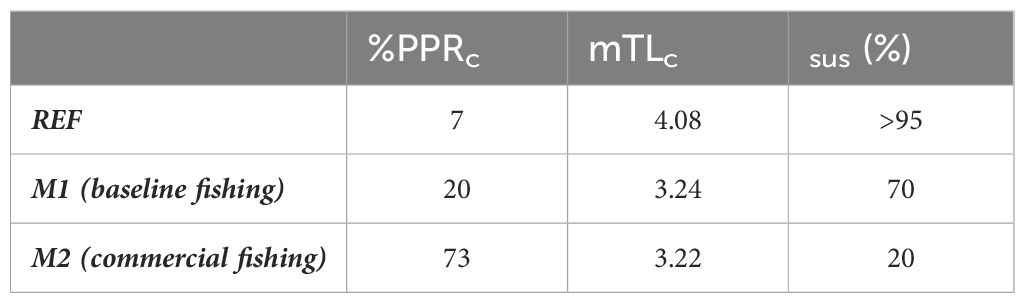
Table 3 Percent primary production required to sustain catches (%PPRc), mean trophic level of the catch (mTLc), and probability of being sustainably fished (Psus) in the reference (REF), and mesopelagic fish harvesting scenarios (M1: baseline fishing and M2: commercial fishing).
Our study showed that the contribution of mesopelagic fish to total carbon export in the water column ranged between 1–6% in the epipelagic zone (0–200 m) and was as much as ~39% at 400–600 meters in the REF scenario. In scenarios M1 and M2, harvesting mesopelagic fish decreased carbon export mediated by this group in the entire water column. Harvesting mesopelagic fish also led to a strong decrease in total carbon export mediated by phytoplankton. This was due to the increased grazing exerted by the increase in the biomass of phytoplankton-grazing epipelagic fish following alleviated trophic competition with mesopelagic fish. Furthermore, the biomasses of skipjack and bigeye tunas decreased. Zooplankton biomass did not change significantly between the scenarios. This was because the decreased grazing pressure on zooplankton by the removal of mesopelagic fish was matched by proportional increases in other competing planktivorous fish species that feed on zooplankton. Overall, the model results showed that exploitation of mesopelagic fish would hamper carbon export dynamics directly because of their decreasing biomass and indirectly because of their trophic interactions with plankton grazers in the food web. In addition, biomasses of some commercially important tuna species would decrease.
There are high uncertainties in the global and regional biomass estimates of mesopelagic fish, which are associated with inadequate measurement techniques (O'Driscoll et al., 2009; Kaartvedt et al., 2012; Davison et al., 2015; Kloser et al., 2016). Globally, estimates vary from 1 to 20 gigatonnes (Gt) of wet weight (Gjosaeter and Kawaguchi, 1980; Irigoien et al., 2014; Anderson et al., 2019; Proud et al., 2019). A recent study from the North Atlantic suggested that the total micronekton biomass ranged between 2–150 g WW m−2, and 75% of this total biomass (1.5–113 g WW m−2) was attributed to mesopelagic species (Klevjer et al., 2020). Although the initial biomass of small mesopelagic fish in Ecopath-F was towards the lower end of this spectrum (1.7 g WW m−2), the system reached an equilibrium state with higher mesopelagic fish biomass in Ecosim-F (i.e., 125 g WW m-2 with a C:WW ratio of 0.15 for fish (Childress et al., 1990).
The diel vertical migration of the vast mesopelagic fish biomass structured the vertical distribution of carbon export within the water column in the three model scenarios. Their impact on carbon export in the upper 200 m was most significant at 60–70 meters (Figure 8B), i.e., just below the mixed layer depth and where the deep chlorophyll maximum occurs in the North Atlantic (Campbell and Aarup, 1992). This was because both migrating and non-migrating mesopelagic fish (at night and day, respectively) were concentrated at this depth to feed on zooplankton. Non-mesopelagic fish were also concentrated at this depth because the vertical distributions of all fish were prescribed in the model to follow the vertical distribution of zooplankton. Therefore, the highest total carbon export rates were observed at 60–80-meter depths in the euphotic layer. Hidaka et al. (2001) measured carbon export rates within the euphotic layer in the western equatorial North Pacific, as well as the contribution of mesopelagic fish to the total export. They showed that both the total carbon export and the contribution of mesopelagic fish to the total carbon export reached a maximum below the mixed layer depth (80 m) in the euphotic layer, supporting our simulation results.
The carbon incorporated in the bodies of mesopelagic fish in the euphotic zone at night was transported to the mesopelagic layer during the daytime. Mesopelagic fish-mediated active carbon transport accounted for 54.6% (29.9 mg C m−2 d−1), and 27.7% (15.2 mg C m−2 d−1) of the total carbon exported from the euphotic layer (0–150 meters) in the western equatorial Pacific (Hidaka et al., 2001). The amount of carbon actively transported below the euphotic zone by mesopelagic fish was much higher (22–24 mg C m-2 d-1) in the northeastern Pacific Ocean, corresponding to 15–17% of the total export (Davison et al., 2013). A global end-to-end modeling study of pelagic marine ecosystems estimated that active transport by diurnal vertical migration of marine organisms accounted for as much as 18% of the passive flux of carbon due to sinking particles at 150 m, 18–25% of this active carbon export was driven by fish (Aumont et al., 2018). The annual mean carbon export rates at 150 m due to the diel vertical migration of organisms in the Sargasso Sea could be as high as 30 mg C m-2 d-1 (Aumont et al., 2018). In our simulations, the average active transport of carbon by mesopelagic fish groups was 4.5 mg C m−2 d−1 at their daytime residence depth (400–600 meters), which was 39.3% of the total carbon export at this depth. This active carbon transport deformed the smooth depth-wise carbon export rates formulated by the power law in the Martin curve, which was fundamentally based on the gravitational sinking of particles from surface waters (Martin et al., 1987). A number of studies have underlined the insufficiency of gravitational carbon export to meet the carbon demand by mesopelagic biota for different regions across the globe, including the North Atlantic (e.g. Reinthaler et al., 2006; Baltar et al, 2009). The biological injection of carbon into the ocean interior by the diel vertical migration of organisms is considered a pathway to fill this gap (Burd et al., 2010; Boyd et al., 2019). Our study supported this perspective and highlighted the necessity to reconsider the empirical formulations used to simulate biological carbon pump.
The BATS data used for model validation in this study included carbon export measurements at 150 m, 200 m, and 300 m. Recent profiling float measurements revealed two seasonal peaks of carbon export at 500 m and 1000 m, as much as 10–20 mg C m−2 d−1, which were uncoupled from surface export (Estapa et al., 2019). In other words, the measured peaks were driven by a different source than the passive settling of particles from the surface. This observation supported the simulated mesopelagic fish-driven carbon export peak of 7 mg C m−2 d−1 between 400–600 meters in our REF scenario. However, contrary to the findings of Estapa et al. (2019), our model did not simulate a peak at 1000 meters. Furthermore, the modeled peak at 400–600 meters was smaller in magnitude than that of the float observations and was not seasonal but permanent. Field measurements of carbon exports have uncertainties, and sediment traps can underestimate carbon exports by as much as 70% (Usbeck et al., 2003; Boyd et al., 2019). In particular, for optical sediment traps, which were also used by Estapa et al. (2019), the challenge was to catch large and rare particles (Buesseler et al., 2007). In oligotrophic waters, large particles (e.g., fecal pellets from fish and dead fish) may largely contribute to carbon export (Saba et al., 2021). Furthermore, differentiating between particles that sunk passively from the surface or particles that were transported by horizontal flows was not possible using sediment trap data (Waniek et al., 2005; Siegel et al., 2008). Thus, the seasonal peak observed at 1000 m in Estapa et al. (2019) might have also been driven by lateral fluxes that NAGEM/EwE-F could not capture because of its 1D structure.
The discrepancy between float measurements and model results might also have stemmed from uncertainties in the prescribed migratory behavior of mesopelagic fish in our model. Considering the migratory mesopelagic fish species included in their model, Vasconcellos and Watson (2004) assumed that 90% of mesopelagic fish carried out diel vertical migration. Several studies have highlighted the variation in the diel vertical migration behavior of the mesopelagic species (e.g. Staby and Aksnes, 2011; Aksnes et al., 2017; Woodstock et al., 2022). Klevjer et al. (2016), who analyzed the mesopelagic acoustic scattering layer on global scale argued that the proportion of the mesopelagic acoustic scattering layer that perform diel vertical migration could be as low as 38% in the North Atlantic. This is much lower than the migration proportion used in this study. However, Klevjer et al. (2016) estimated the DVM of the entire mesopelagic acoustic scattering layer, whereas this study considered only 15 mesopelagic fish species (see Section 2.4 for the list) that were included in the original higher trophic model configuration (Vasconcellos and Watson, 2004). Therefore, the small and large mesopelagic fish groups included in our model do not represent the entire mesopelagic fish assemblage, but only a selection of 15 species that are abundant in the study area. Of these species, 67% belong to the family Myctophidae and perform diel vertical migration. Of the remaining species, namely Stomias boa, Maurolicus muelleri, Argyropelecus olfersi, Cyclothone spp. and Pollichthys mauli, all species except Cyclothone spp. are known to perform DVM (Whitehead et al., 1986), although not to the extent of the myctophid DVM. According to the species-level survey conducted by Olivar et al. (2017), more than 90% of the Myctophidae and approximately 80% of all mesopelagic fish species (i.e., mainly Myctophidae and Gonostomatidae), perform DVM in the equatorial and tropical Atlantic. The survey results were similar throughout the study area, regardless of the physical environmental conditions, suggesting that the estimates may be potentially representative of our study area in the North Atlantic. Furthermore, acoustic estimates always must be cautiously interpreted and should be supported by ground-truthing data, as there are a number of uncertainties associated with the acoustic estimates (Davison et al., 2015). For instance, the acoustic measurements cannot account of the resonance effect (Godø et al., 2009). The gas-filled swim bladders of mesopelagic fish expand and contract as they perform DVM, affecting their resonance, and hence, the acoustic signals. Therefore, acoustic measurements require ground truthing with other data sources, such as net samples, which was not done by Klevjer et al. (2016). Finally, the acoustic estimates of organisms in the mesopelagic layer are also associated with a positive bias, as the signals can be mixed with baythpelagic/demersal fish (O'Driscoll et al., 2009). In view of the above aspects, we believe that the migration behavior assumed in this study is not unrealistic. Nevertheless, the variation in the migration behavior of mesopelagic fish could easily lead to the seasonal disappearance of the carbon export peak in the mesopelagic layer. The asynchronous diel vertical migration behavior of mesopelagic fish, i.e., vertical migration performed not on a daily basis but with resting periods between days (Woodstock et al., 2022), may also introduce additional variations to carbon export dynamics. Furthermore, variations in the migration behavior of mesopelagic fish may alter prey-predator interactions, the magnitude of the fluxes mediated by each organism in the food web, and thus the carbon export profile in the water column. Furthermore, a relatively narrower prescribed spread of mesopelagic fish within the mesopelagic zone may approach the modeled export rates closer to the float measurements. Similarly, a prescribed concentration of mesopelagic fish at approximately 1000 m could simulate a third local peak in the water column. Therefore, different definitions of vertical spread for mesopelagic fish in the water column should be considered in future modeling studies to achieve more realistic representations for model simulations.
Previous studies (Hidaka et al., 2001; Davison et al., 2013) have estimated mesopelagic fish-mediated carbon export from conjectured mesopelagic fish biomasses (e.g. Hidaka et al., 2001; Davison et al., 2013; Saba et al., 2021 and references therein). However, such an approach is not convenient for assessing the potential consequences of harvesting mesopelagic fish, as it directly depends on mesopelagic fish biomass, excludes prey-predator interactions in the food web and hinders the prediction of ecosystem-wide changes driven by the fishing of mesopelagic fish. Our study showed that harvesting mesopelagic fish altered the mesopelagic fish biomass and led to a series of cascading effects in the food web, i.e., increases in phytoplankton grazing fish that reduced phytoplankton-mediated carbon export. Furthermore, biomasses of some commercially important predator fish species decreased. Therefore, these changes in the food web should be considered when assessing the potential consequences of harvesting mesopelagic species.
The indirect link between harvesting mesopelagic fish and carbon export, i.e., through changes in plankton dynamics, was prominent, especially in the epipelagic zone. When mesopelagic fish groups were harvested in our scenarios, the biomass of phytoplankton grazing fish, i.e., epipelagic fish groups, increased because of released competition with decreasing mesopelagic fish biomass. This resulted in decreased carbon export flows from primary producers but increased carbon export flows from non-mesopelagic phytoplankton grazing fish. The carbon export flow from zooplankton also increased because of the reduced predation pressure due to the removal of mesopelagic fish. However, the non-mesopelagic HTL groups- and zooplankton-driven increases in carbon export were inadequate to compensate for the phytoplankton- and mesopelagic fish-driven decreases in carbon export, and the depth-integrated total carbon export decreased.
Harvesting mesopelagic fish also increased the impact of fisheries on the ecosystem. In the REF scenario, %PPRc accounted for 7% of total primary production. According to a previous estimate (Chassot et al., 2007), %PPRc ranges between 1–50% in the entire North Atlantic, with oligotrophic waters having the lowest values (<1%), as only tunas were harvested in these regions. Although our biogeochemical model was set up for oligotrophic waters of the Sargasso Sea, our estimates were larger. One explanation for this is that, following Vasconcellos and Watson (2004), epipelagic fishes that directly feed on phytoplankton were also harvested in the reference scenario (REF) of this study. In scenario M2, %PPRc increased to 20% because of the increased export flows from the system resulting from the increased catches of mesopelagic fish groups (see Supplementary Table S5 for catches). Since the trophic level of mesopelagic fish (~3 for small and ~4 for large mesopelagic fish group) were lower than the other fished groups (see Supplementary Table S1 for the list), the mean trophic level of catch decreased from 4.08 to 3.24 when mesopelagic fish were harvested. Furthermore, the total biomass of the two mesopelagic fish groups in the model was more than twice that of other HTL species. Harvesting mesopelagic fish increased the ecological footprint of fisheries in the ecosystem, as indicated by the increased %PPRc value. Considering a mean transfer efficiency of 8% between trophic levels, the calculated Psus values indicated more than a 95% probability of being sustainably fished in the REF scenario and 70% in the M1 scenario. This indicated that, even at a low exploitation rate, fisheries sustainability can decrease significantly. However, Psus values need to be evaluated tentatively as they evaluate the total catch in the ecosystem and do not differentiate between individual stocks or whether they are sustainably fished. In the M2 scenario, where annual fishing mortality increased by one order of magnitude compared to the M1 scenario, Psus indicated a 20% probability of being sustainably fished. This change was significant because, although the increase in the annual fishing mortality was 10-fold, it was quite low due to the mass-balance constraint exerted by the initial Ecopath-F model. These low values were sufficient to decrease the probability of being sustainably fished by more than 75% from scenarios REF to M2. In the case of the potential exploitation of mesopelagic fish stocks, there is no doubt that the actual fishing mortality rates would be orders of magnitude higher than the rates used in our study. Therefore, harvesting mesopelagic fish may initiate cascading trophic effects in marine ecosystems and has the potential to trigger regime shifts in many marine regions. In this study, we used low levels of annual fishing mortality for mesopelagic fish groups in the M1 (baseline fishing) scenario to avoid re-parameterizing the original Ecopath model by Vasconcellos and Watson (2004) and triggering regime shifts. Therefore, we defined fishing mortality levels for mesopelagic fish assemblages without disturbing prey-predator interactions in the food web, or in other words, without disturbing the mass balance of the Ecopath model. In the M2 (commercial fishing) scenario, we increased the fishing mortality by one order of magnitude, which could be considered a reasonable increase when commercial fishing is first established. Although the defined annual mortality rates can be considered low in relation to commercial fisheries worldwide, the catchability of mesopelagic fisheries would probably be low due to the low accessibility of these fish given their natural habitat and may not be considered completely unrealistic.
Coupling a higher-trophic-level model with a lower-trophic-level model requires integration of various processes with uncertainties. We detected four different sets of parameters in the coupled model that had the highest uncertainty range in the literature and could potentially have the strongest impact on the model results. Among these parameters, the prescribed migration depth and behavior of mesopelagic fish are discussed in Section 4.1. The second set of parameters was the sinking velocities of detritus groups. Following Salihoglu et al. (2008), the sinking velocities of detritus were set to 2 and 30 m d-1 for slow- and fast-sinking detritus, respectively. However, the sinking velocities of detritus were reported to be highly variable. The velocity of slow-sinking particles could be as low as 0.7 m d-1 (Alonso-González et al., 2010), and the velocity of fast-sinking particles may be as high as 700 m d-1 depending on the geography, season and depth (Villa-Alfageme et al., 2016). Because this study incorporated an end-to-end approach for representing the ecosystem, from higher-trophic-level organisms to primary producers, variations in fast-sinking detritus were of particular importance. Villa-Alfageme et al. (2016) showed that in the North Atlantic, the average sinking velocities varied seasonally between 30–60 m d-1 at 50–70-meter depths, between 40–100 m d-1 at 150–200-meter depths, and between 100–400 m d-1 at 400–500-meter depths. Yumruktepe et al. (2020) showed that variations in fast-sinking detritus velocity significantly affected carbon exports below 300 m. For instance, a three-fold increase in fast-sinking detritus velocity led to a five-fold increase in the carbon export rate at 500 m. Thus, the implementation of a depth-resolving sinking rate parameterization could elevate carbon export rates in the mesopelagic layer and may lead to further deformation of the Martin curve. However, the general conclusions drawn from the results of our study remain valid.
The third parameter that our findings were most sensitive to was the C:N:P ratio of the fish. Most fish body C:P measurements from aquatic systems were for freshwater species (Elser et al., 2000; Sterner and George, 2000). Our model calculations were based on measurements by Czamanski et al. (2011), who provided C:P measurements ranging from 10.82:1 to 190.42:1 for different wild-caught species. The mean value of the range was used in this study. However, choosing species-specific C:P ratios would directly affect the magnitude of the simulated carbon export rates. Nevertheless, the relative change in carbon export rates in response to varying fishing intensities was insensitive to this choice. Furthermore, as the system was limited by phosphorus, variations in the C:P ratio would not affect dynamics other than carbon export (e.g., primary production, plankton community composition, and HTL dynamics). Although the magnitude of our results could differ based on the stoichiometric ratio, the general conclusions drawn with respect to the relative changes in carbon export and food web dynamics would be similar.
Finally, uncertainties regarding the representation of microbial activity in the water column must be considered. In this study, the microbial loop was not explicitly represented in NAGEM/EwE-F; instead, microbial processes were parameterized via temperature-dependent remineralization rates that decreased with increasing depth for fast- and slow-sinking detritus pools. The metabolic fluxes of mesopelagic fish have been proposed to generate hotspots for heterotrophic prokaryotes in the mesopelagic layer, where bacterial activity is twice that of the surface layer (Hoppe et al., 1993; Calleja et al., 2018). A 40% increase in the remineralization rate of slow-sinking detritus reduced the export rate by almost 40% in NAGEM (Yumruktepe et al., 2020). Thus, variations in the remineralization rates within the mesopelagic layer would alter the carbon rates and should be considered in future studies.
To date, the ecological and biogeochemical impacts of harvesting mesopelagic fish have not been investigated from a holistic perspective. To the best of our knowledge, this is the first study to investigate the impact of harvesting mesopelagic fish on the ecosystem and to provide quantitative assessments that consider the role of mesopelagic fish on trophic interactions and carbon export. Our study showed that harvesting mesopelagic fish is expected to alter biogeochemical dynamics not only because of reduced mesopelagic fish biomass but also through a series of cascading changes in the food web. The influence of mesopelagic fish on the water column differed at different depth layers; therefore, harvesting mesopelagic fish would potentially have varying effects throughout the water column, cascading through trophic levels. Future studies should focus on developing ecosystem-based management advice considering the potential decrease in mesopelagic fish biomass due to prospective fisheries exploitation and the indirect effects that may occur due to disrupted prey-predator interactions in the food web by the removal of mesopelagic fish species. The one-dimensional modeling scheme used in this study was practical. We relied on readily available models developed for the study region. The model also had a sufficient complexity to simulate the impact of fisheries on trophic dynamics. Because the model compartments are generic, NAGEM/EwE-F could be adapted to other marine ecosystems that can be represented from a one-dimensional perspective.
The original contributions presented in the study are included in the article/Supplementary Material. The model used for this study can be accessed freely under the link: https://gitlab.com/eakoglu/nagem_ewe-f.
DD: Conceptualization, Data curation, Formal analysis, Investigation, Methodology, Software, Validation, Visualization, Writing – original draft. EA: Conceptualization, Methodology, Supervision, Validation, Visualization, Writing – review & editing, Investigation, Software. BS: Conceptualization, Funding acquisition, Project administration, Supervision, Writing – review & editing.
The author(s) declare financial support was received for the research, authorship, and/or publication of this article. This study is partly a contribution to the European Union Project ‘Sustainable Management of Mesopelagic Resources’ (SUMMER, Grant Agreement 817806) as funded by the Horizon 2020 Research and Innovation Program, and was supported by the DEKOSIM project (National Excellence Center for Marine Ecosystem and Climate Research (Project Code: BAP-08–11-DPT.2012K120880) and the Middle East Technical University Climate Change and Sustainable Development Application and Research Center.
The authors declare that the research was conducted in the absence of any commercial or financial relationships that could be construed as a potential conflict of interest.
All claims expressed in this article are solely those of the authors and do not necessarily represent those of their affiliated organizations, or those of the publisher, the editors and the reviewers. Any product that may be evaluated in this article, or claim that may be made by its manufacturer, is not guaranteed or endorsed by the publisher.
The Supplementary Material for this article can be found online at: https://www.frontiersin.org/articles/10.3389/fmars.2024.1389941/full#supplementary-material.
Akoglu E., Salihoglu B., Oguz T., Solidoro C. (2015). EwE-F 1.0: an implementation of Ecopath with Ecosim in Fortran 95/2003 for coupling and integration with other models. Geoscientific Model. Dev. 8, 2687–2699. doi: 10.5194/gmd-8–2687-2015
Aksnes D. L., Løtvedt A. S., Lindemann C., Calleja M. L., Morán X. A. G., Kaarvedt S., et al. (2023). Effects of migrating mesopelagic fishes on the biological carbon pump. Mar. Ecol. Prog. Ser. 717, 107–126. doi: 10.3354/meps14373
Aksnes D. L., Røstad A., Kaartvedt S., Martinez U., Duarte C. M., Irigoien X. (2017). Light penetration structures the deep acoustic scattering layers in the global ocean. Sci. Adv. 3, e1602468. doi: 10.1126/sciadv.1602468
Allen K. R. (1971). Relation between production and biomass. J. Fisheries Board Canada 28, 1573–1581. doi: 10.1139/f71–236
Alonso-González I. J., Arístegui J., Lee C., Sanchez-Vidal A., Calafat A., Fabrés J., et al. (2010). Role of slowly settling particles in the ocean carbon cycle. Geophysical Res. Lett. 37, 13. doi: 10.1029/2010GL043827
Alvheim A. R., Kjellevold M., Strand E., Sanden M., Wiech M. (2020). Mesopelagic species and their potential contribution to food and feed security—A case study from Norway. Foods 9, 344. doi: 10.3390/foods9030344
Anderson T. R., Martin A. P., Lampitt R. S., Trueman C. N., Henson S. A., Mayor D. J. (2019). Quantifying carbon fluxes from primary production to mesopelagic fish using a simple food web model. ICES J. Mar. Sci. 76, 690–701. doi: 10.3390/foods9030344
Aumont O., Maury O., Lefort S., Bopp L. (2018). Evaluating the potential impacts of the diurnal vertical migration by marine organisms on marine biogeochemistry. Global Biogeochemical Cycles 32, 1622–1643. doi: 10.1029/2018GB005886
Baltar F., Arístegui J., Gasol J. M., Sintes E., Herndl G. J. (2009). Evidence of prokaryotic metabolism on suspended particulate organic matter in the dark waters of the subtropical North Atlantic. Limnology Oceanograph 54, 182–193. doi: 10.4319/lo.2009.54.1.0182
Bernal A., Olivar M. P., Maynou F., de Puelles M. L. F. (2015). Diet and feeding strategies of mesopelagic fishes in the western Mediterranean. Prog. Oceanograph 135, 1–17. doi: 10.1016/j.pocean.2015.03.005
Boyd P. W., Claustre H., Levy M., Siegel D. A., Weber T. (2019). Multi-faceted particle pumps drive carbon sequestration in the ocean. Nature 568, 327–335. doi: 10.1038/s41586–019-1098–2
Branch T. A., Watson R., Fulton E. A., Jennings S., McGilliard C. R., Pablico G. T., et al. (2010). The trophic fingerprint of marine fisheries. Nature 468, 431–435. doi: 10.1038/nature09528
Brophy J. T., Murphy S., Rogan E. (2009). “The diet and feeding ecology of the short-beaked common dolphin (Delphinus delphis) in the northeast Atlantic,” in International Whaling Commission Scientific Committee Document SC/61/SM, vol. 14.
Buesseler K. O., Antia A. N., Chen M., Fowler S. W., Gardner W. D., Gustafsson O., et al. (2007). Estimating upper ocean particle fluxes using sediment traps. J. Mar. Res. 65, 345–416.
Burd A. B., Hansell D. A., Steinberg D. K., Anderson T. R., Arístegui J., Baltar F., et al. (2010). Assessing the apparent imbalance between geochemical and biochemical indicators of meso-and bathypelagic biological activity: What the@ $♯! is wrong with present calculations of carbon budgets? Deep Sea Res. Part II: Topical Stud. Oceanograph 57, 1557–1571. doi: 10.1016/j.dsr2.2010.02.022
Calleja M. L., Ansari M. I., Røstad A., Silva L., Kaartvedt S., Irigoien X., et al. (2018). The mesopelagic scattering layer: a hotspot for heterotrophic prokaryotes in the Red Sea twilight zone. Front. Mar. Sci. 5. doi: 10.3389/fmars.2018.00259
Campbell J. W., Aarup T. (1992). New production in the North Atlantic derived from seasonal patterns of surface chlorophyll. Deep Sea Res. Part A. Oceanographic Res. Papers 39, 1669–1694. doi: 10.1016/0198–0149(92)90023-M
Chassot E., Mélin F., Le Pape O., Gascuel D. (2007). Bottom-up control regulates fisheries production at the scale of eco-regions in European seas. Mar. Ecol. Prog. Ser. 343, 45–55. doi: 10.3354/meps06919
Childress J. J., Price M. H., Favuzzi J., Cowles D. (1990). Chemical composition of midwater fishes as a function of depth of occurrence off the Hawaiian Islands: food availability as a selective factor? Mar. Biol. 105, 235–246. doi: 10.1007/BF01344292
Christensen V., Amorim P., Diallo I., Diouf T., Guénette S., Heymans J. J., et al. (2004). Trends in fish biomass off Northwest Africa 1960–2000. Fisheries Centre Res. Rep. 12, 215.
Christensen V., Guenette S., Heymans J. J., Walters C. J., Watson R., Zeller D., et al. (2003). Hundred-year decline of North Atlantic predatory fishes. Fish fisheries 4, 1–24. doi: 10.1046/j.1467–2979.2003.00103.x
Christensen V., Walters C. J. (2004). Ecopath with Ecosim: methods, capabilities and limitations. Ecol. modeling 172, 109–139. doi: 10.1016/j.ecolmodel.2003.09.003
Christensen V., Walters C. J., Pauly D. (2005). Ecopath with Ecosim: a user’s guide. Fisheries Centre Univ. Br. Columbia Vancouver 154, 31.
Clarke L. J., Trebilco R., Walters A., Polanowski A. M., Deagle B. E. (2020). DNA-based diet analysis of mesopelagic fish from the southern Kerguelen Axis. Deep Sea Res. Part II: Topical Stud. Oceanograph 174. doi: 10.1016/j.dsr2.2018.09.001
Colléter M., Valls A., Guitton J., Gascuel D., Pauly D., Christensen V. (2015). Global overview of the applications of the Ecopath with Ecosim modeling approach using the EcoBase models repository. Ecol. Modeling 302, 42–53. doi: 10.1016/j.ecolmodel.2015.01.025
Czamanski M., Nugraha A., Pondaven P., Lasbleiz M., Masson A., Caroff N., et al. (2011). Carbon, nitrogen and phosphorus elemental stoichiometry in aquacultured and wild-caught fish and consequences for pelagic nutrient dynamics. Mar. Biol. 158, 2847–2862. doi: 10.1007/s00227–011-1783–7
Davison P. C., Checkley D. M. Jr., Koslow J. A., Barlow J. (2013). Carbon export mediated by mesopelagic fishes in the northeast Pacific Ocean. Prog. Oceanograph 116, 14–30. doi: 10.1016/j.pocean.2013.05.013
Davison P. C., Koslow J. A., Kloser R. J. (2015). Acoustic biomass estimation of mesopelagic fish: backscattering from individuals, populations, and communities. ICES J. Mar. Sci. 72, 1413–1424. doi: 10.1016/j.pocean.2013.05.013
Dişa D. (2016). Modeling the impact of fish and fisheries on marine biogeochemistry: A case study in the sargasso sea (Master's thesis, Middle East Technical University).
Dowd S., Chapman M., Koehn L. E., Hoagland P. (2022). The economic tradeoffs and ecological impacts associated with a potential mesopelagic fishery in the California Current. Ecol. Appl. 32, e2578. doi: 10.1002/eap.2578
Ducklow H. W., Steinberg D. K., Buesseler K. O. (2001). Upper ocean carbon export and the biological pump. Oceanography 14, 50–58. doi: 10.5670/oceanog.2001.06
Elser J. J., Sterner R. W., Galford A. E., Chrzanowski T. H., Findlay D. L., Mills K. H., et al. (2000). Pelagic C: N: P stoichiometry in a eutrophied lake: responses to a whole-lake food-web manipulation. Ecosystems 3, 293–307. doi: 10.1007/s100210000027
Estapa M. L., Feen M. L., Breves E. (2019). Direct observations of biological carbon export from profiling floats in the subtropical North Atlantic. Global Biogeochemical Cycles 33, 282–300. doi: 10.1029/2018GB006098
Freestone D., Morrison K. K. (2012). “The sargasso sea,” in The International Journal of Marine and Coastal Law, vol. 27, 647–655. doi: 10.1163/15718085–12341240
Gjosaeter J., Kawaguchi K. (1980). A review of the world resources of mesopelagic fish. FAO Fisheries Technical Paper No 193, Food and Agriculture Organisation of The United Nations, Rome.
Godø O. R., Patel R., Pedersen G. (2009). Diel migration and swimbladder resonance of small fish: some implications for analyses of multifrequency echo data. ICES J. Mar. Sci. 66, 1143–1148. doi: 10.1093/icesjms/fsp098
Gorgues T., Aumont O., Memery L. (2019). Simulated changes in the particulate carbon export efficiency due to diel vertical migration of zooplankton in the North Atlantic. Geophysical Res. Lett. 46, 5387–5395. doi: 10.1029/2018GL081748
Hidaka K., Kawaguchi K., Murakami M., Takahashi M. (2001). Downward transport of organic carbon by diel migratory micronekton in the western equatorial Pacific: its quantitative and qualitative importance. Deep Sea Res.1 Oceanogr. Res. Papers 48, 1923–1939. doi: 10.1016/S0967–0637(01)00003–6
Hidalgo M., Browman H. I. (2019). Developing the knowledge base needed to sustainablymanage mesopelagic resources. ICES J. Mar. Sci. 76, 609–615. doi: 10.1093/icesjms/fsz067
Hoppe H. G., Ducklow H., Karrasch B. (1993). Evidence for dependency of bacterial growth on enzymatic hydrolysis of particulate organic matter in the mesopelagic ocean. Mar. Ecol. Prog. Ser. 93, 277–283.
Irigoien X., Klevjer T. A., Røstad A., Martinez U., Boyra G., Acuña J. L., et al. (2014). Large mesopelagic fishes biomass and trophic efficiency in the open ocean. Nat. Commun. 5, 3271. doi: 10.1038/ncomms4271
Jackson J. B., Kirby M. X., Berger W. H., Bjorndal K. A., Botsford L. W., Bourque B. J., et al. (2001). Historical overfishing and the recent collapse of coastal ecosystems. science 293, 629–637. doi: 10.1126/science.1059199
Kaartvedt S., Staby A., Aksnes D. L. (2012). Efficient trawl avoidance by mesopelagic fishes causes large underestimation of their biomass. Mar. Ecol. Prog. Ser. 456, 1–6. doi: 10.3354/meps09785
Klevjer T. A., Irigoien X., Røstad A., Fraile-Nuez E., Benítez-Barrios V. M., Kaartvedt S. (2016). Large scale patterns in vertical distribution and behaviour of mesopelagic scattering layers. Sci. Rep. 6, 19873. doi: 10.1038/srep19873
Klevjer T. A., Melle W., Knutsen T., Aksnes D. L. (2020). Vertical distribution and migration of mesopelagic scatterers in four north Atlantic basins. Deep Sea Res. Part II: Topical Stud. Oceanograph 180, 104811. doi: 10.1016/j.dsr2.2020.104811
Kloser R. J., Ryan T. E., Keith G., Gershwin L. (2016). Deep-scattering layer, gas-bladder density, and size estimates using a two-frequency acoustic and optical probe. ICES J. Mar. Sci. 73, 2037–2048. doi: 10.1093/icesjms/fsv257
Laffoley D. D. A., Roe H. S., Angel M. V., Ardron J., Bates N. R., Boyd I. L., et al. (2011). The protection and management of the Sargasso Sea: The golden floating rainforest of the Atlantic Ocean. Summary Sci. Supporting Evidence Case. Sargasso Sea Alliance 44.
Lea M. A., Nichols P. D., Wilson G. (2002). Fatty acid composition of lipid-rich myctophids and mackerel icefish (Champsocephalus gunnari)–Southern Ocean food-web implications. Polar Biol. 25, 843–854. doi: 10.1007/s00300–002-0428–1
Lear W. H. (1998). History of fisheries in the Northwest Atlantic: the 500-year perspective. J. Northwest Atlantic Fishery Sci. 23, 41–73. doi: 10.2960/J.v23.a4
Libralato S., Coll M., Tudela S., Palomera I., Pranovi F. (2008). Novel index for quantification of ecosystem effects of fishing as removal of secondary production. Mar. Ecol. Prog. Ser. 355, 107–129. doi: 10.3354/meps07224
Libralato S., Solidoro C. (2009). Bridging biogeochemical and food web models for an End-to-End representation of marine ecosystem dynamics: The Venice lagoon case study. Ecol. Modeling 220, 2960–2971. doi: 10.1016/j.ecolmodel.2009.08.017
Martin J. H., Knauer G. A., Karl D. M., Broenkow W. W. (1987). VERTEX: carbon cycling in the northeast Pacific. Deep Sea Res. Part A. Oceanographic Res. Papers 34, 267–285. doi: 10.1016/0198–0149(87)90086–0
Melnychuk M. C., Baker N., Hively D., Mistry K., Pons M., Ashbrook C. E., et al. (2020). Global trends in status and management of assessed stocks: achieving sustainable fisheries through effective management. FAO Fisheries and Aquaculture Technical Paper No. 665. FAO, Rome. doi: 10.4060/cb1800en
Moore C. M., Mills M. M., Arrigo K. R., Berman-Frank I., Bopp L., Boyd P. W., et al. (2013). Processes and patterns of oceanic nutrient limitation. Nat. Geosci. 6, 701–710. doi: 10.1038/ngeo1765
Morato T., Watson R., Pitcher T. J., Pauly D. (2006). Fishing down the deep. Fish fisheries 7, 24–34. doi: 10.1111/j.1467–2979.2006.00205.x
Myers R. A., Worm B. (2003). Rapid worldwide depletion of predatory fish communities. Nature 423, 280–283. doi: 10.1038/nature01610
O'Driscoll R. L., Gauthier S., Devine J. A. (2009). Acoustic estimates of mesopelagic fish: as clear as day and night? ICES J. Mar. Sci. 66, 1310–1317. doi: 10.1093/icesjms/fsp015
Olivar M. P., Hulley P. A., Castellón A., Emelianov M., López C., Tuset V. M., et al. (2017). Mesopelagic fishes across the tropical and equatorial Atlantic: biogeographical and vertical patterns. Prog. Oceanograph 151, 116–137. doi: 10.1016/j.pocean.2016.12.001
Olsen R. E., Strand E., Melle W., Nørstebø J. T., Lall S. P., Ringø E., et al. (2020). Can mesopelagic mixed layers be used as feed sources for salmon aquaculture? Deep Sea Res. Part II: Topical Stud. Oceanograph 180, 104722. doi: 10.1016/j.dsr2.2019.104722
Pauly D., Christensen V. (1995). Primary production required to sustain global fisheries. Nature 374, 255–257. doi: 10.1038/374255a0
Pauly D., Palomares M. L. (2005). Fishing down marine food web: it is far more pervasive than we thought. Bulletin of Marine science 76, 197–212.
Pitcher T. J., Clark M. R., Morato T., Watson R. (2010). Seamount fisheries: do they have a future? Oceanography 23, 134–144. doi: 10.5670/oceanog.2010.66
Potier M., Marsac F., Cherel Y., Lucas V., Sabatié R., Maury O., et al. (2007). Forage fauna in the diet of three large pelagic fishes (lancetfish, swordfish and yellowfin tuna) in the western equatorial Indian Ocean. Fisheries Res. 83, 60–72. doi: 10.1016/j.fishres.2006.08.020
Proud R., Handegard N. O., Kloser R. J., Cox M. J., Brierley A. S. (2019). From siphonophores to deep scattering layers: uncertainty ranges for the estimation of global mesopelagic fish biomass. ICES J. Mar. Sci. 76, 718–733. doi: 10.1093/icesjms/fsy037
Reinthaler T., Van Aken H., Veth C., Arístegui J., Robinson C., Williams P. J. L. B., et al. (2006). Prokaryotic respiration and production in the meso-and bathypelagic realm of the eastern and western North Atlantic basin. Limnology Oceanograph 51, 1262–1273. doi: 10.4319/lo.2006.51.3.1262
Saba G. K., Burd A. B., Dunne J. P., Hernández-León S., Martin A. H., Rose K. A., et al. (2021). Towards a better understanding of fish-based contribution to ocean carbon flux. Limnology Oceanograph 66, 1639–1664. doi: 10.1002/lno.11709
Salihoglu B., Garçon V., Oschlies A., Lomas M. W. (2008). Influence of nutrient utilization and remineralization stoichiometry on phytoplankton species and carbon export: A modeling study at BATS. Deep Sea Res. Part I: Oceanographic Res. Papers 55, 73–107. doi: 10.1016/j.dsr.2007.09.010
Salihoglu B., Hofmann E. E. (2007). Simulations of phytoplankton species and carbon production in the equatorial Pacific Ocean 1. Model configuration and ecosystem dynamics. J. Mar. Res. 65, 219–273.
Sarmiento-Lezcano A. N., Olivar M. P., Pena M., Landeira J. M., Armengol L., Medina-Suárez I., et al. (2022). Carbon remineralization by small mesopelagic and bathypelagic Stomiiforms in the Northeast Atlantic Ocean. Prog. Oceanograph 203, 102787. doi: 10.1016/j.pocean.2022.102787
Siegel D. A., Fields E., Buesseler K. O. (2008). A bottom-up view of the biological pump: Modeling source funnels above ocean sediment traps. Deep Sea Res. Part I: Oceanographic Res. Papers 55, 108–127. doi: 10.1016/j.dsr.2007.10.006
Sowell S. M., Wilhelm L. J., Norbeck A. D., Lipton M. S., Nicora C. D., Barofsky D. F., et al. (2009). Transport functions dominate the SAR11 metaproteome at low-nutrient extremes in the Sargasso Sea. ISME J. 3, 93–105. doi: 10.1038/ismej.2008.83
Staby A., Aksnes D. L. (2011). Follow the light—diurnal and seasonal variations in vertical distribution of the mesopelagic fish Maurolicus muelleri. Mar. Ecol. Prog. Ser. 422, 265–273. doi: 10.3354/meps08938
Steenbeek J., Buszowski J., Christensen V., Akoglu E., Aydin K., Ellis N., et al. (2016). Ecopath with Ecosim as a model-building toolbox: source code capabilities, extensions, and variations. Ecol. Modeling 319, 178–189. doi: 10.1016/j.ecolmodel.2015.06.031
Steinberg D. K., Carlson C. A., Bates N. R., Johnson R. J., Michaels A. F., Knap A. H. (2001). Overview of the US JGOFS Bermuda Atlantic Time-series Study (BATS): a decade-scale look at ocean biology and biogeochemistry. Deep Sea Res. Part II: Topical Stud. Oceanograph 48, 1405–1447. doi: 10.1016/S0967–0645(00)00148-X
Sterner R. W., George N. B. (2000). Carbon, nitrogen, and phosphorus stoichiometry of cyprinid fishes. Ecology 81, 127–140. doi: 10.1890/0012–9658(2000)081[0127:CNAPSO]2.0.CO;2
St. John M. A., Borja A., Chust G., Heath M., Grigorov I., Mariani P., et al. (2016). A dark hole in our understanding of marine ecosystems and their services: perspectives from the mesopelagic community. Front. Mar. Sci. 3. doi: 10.3389/fmars.2016.00031
Tacon A. G. (2020). Trends in global aquaculture and aquafeed production: 2000–2017. Rev. Fisheries Sci. Aquaculture 28, 43–56. doi: 10.1080/23308249.2019.1649634
Taylor K. E. (2001). Summarizing multiple aspects of model performance in a single diagram. J. geophysical research: atmospheres 106, 7183–7192. doi: 10.1029/2000JD900719
Trueman C. N., Johnston G., O'hea B., MacKenzie K. M. (2014). Trophic interactions of fish communities at midwater depths enhance long-term carbon storage and benthic production on continental slopes. Proc. R. Soc. B: Biol. Sci. 281, 20140669. doi: 10.1098/rspb.2014.0669
Usbeck R., Schlitzer R., Fischer G., Wefer G. (2003). Particle fluxes in the ocean: comparison of sediment trap data with results from inverse modeling. J. Mar. Syst. 39, 167–183. doi: 10.1016/S0924–7963(03)00029–0
Vasconcellos M., Watson R. (2004). “Mass balance models of oceanic systems in the Atlantic,” in West african marine ecosystems: models and fisheries impacts, vol. 12. Eds. Palomares M. L. D., Pauly D. (Vancouver, Canada: Fisheries Centre Research Reports, University of British Columbia), 171–214. doi: 10.14288/1.0074805
Villa-Alfageme M., de Soto F. C., Ceballos E., Giering S. L. C., Le Moigne F. A., Henson S., et al. (2016). Geographical, seasonal, and depth variation in sinking particle speeds in the North Atlantic. Geophysical Res. Lett. 43, 8609–8616. doi: 10.1002/2016GL069233
Waniek J. J., Schulz-Bull D. E., Blanz T., Prien R. D., Oschlies A., Müller T. J. (2005). Interannual variability of deep water particle flux in relation to production and lateral sources in the northeast Atlantic. Deep Sea Res. Part I: Oceanographic Res. Papers 52, 33–50. doi: 10.1016/j.dsr.2004.08.008
Whitehead P. J. P., Bauchot M.-L., Hureau J.-C., Nielsen J., Tortonese E. (1986). Fishes of the north-eastern atlantic and the mediterranean (Paris: UNESCO).
Woodstock M. S., Blanar C. A., Sutton T. T. (2020). Diet and parasites of a mesopelagic fish assemblage in the Gulf of Mexico. Mar. Biol. 167, 184. doi: 10.1007/s00227–020-03796–6
Woodstock M. S., Sutton T. T., Zhang Y. (2022). A trait-based carbon export model for mesopelagic fishes in the Gulf of Mexico with consideration of asynchronous vertical migration, flux boundaries, and feeding guilds. Limnology Oceanograph 67, 1443–1455. doi: 10.1002/lno.12093
Keywords: mesopelagic fish, carbon export, fisheries, biological pump, trophic interactions, food web
Citation: Dişa D, Akoglu E and Salihoglu B (2024) Exploitation of mesopelagic fish stocks can impair the biological pump and food web dynamics in the ocean. Front. Mar. Sci. 11:1389941. doi: 10.3389/fmars.2024.1389941
Received: 23 February 2024; Accepted: 27 May 2024;
Published: 11 June 2024.
Edited by:
Francois Bastardie, Technical University of Denmark, DenmarkReviewed by:
Konstantinos Tsagarakis, Hellenic Centre for Marine Research (HCMR), GreeceCopyright © 2024 Dişa, Akoglu and Salihoglu. This is an open-access article distributed under the terms of the Creative Commons Attribution License (CC BY). The use, distribution or reproduction in other forums is permitted, provided the original author(s) and the copyright owner(s) are credited and that the original publication in this journal is cited, in accordance with accepted academic practice. No use, distribution or reproduction is permitted which does not comply with these terms.
*Correspondence: Deniz Dişa, ZG56ZGlzYUBnbWFpbC5jb20=
Disclaimer: All claims expressed in this article are solely those of the authors and do not necessarily represent those of their affiliated organizations, or those of the publisher, the editors and the reviewers. Any product that may be evaluated in this article or claim that may be made by its manufacturer is not guaranteed or endorsed by the publisher.
Research integrity at Frontiers
Learn more about the work of our research integrity team to safeguard the quality of each article we publish.