 Jacqueline Umbricht
 Alba Filella
 Angelina Klett1
 Angela Vogts
 Maren Voss
- 1Department of Biological Oceanography, Leibniz Institute for Baltic Sea Research Warnemuende, Rostock, Germany
- 2Aix Marseille Université, Université de Toulon, CNRS, IRD, MIO UM 110, Marseille, France
- 3Turing Center for Living Systems, Aix-Marseille University, Marseille, France
The response of N2 fixation to projected future conditions in the ocean cannot be reliably predicted to date. We conducted a minicosm experiment with pre-acclimated cultures of the globally significant diazotroph Crocosphaera watsonii strain WH8501 (“Crocosphaera”). PH and temperature were altered simultaneously to match the RCP scenarios 4.5 and 6 and investigate a more realistic future scenario compared to studies that focus on changes of a single stressor only. The cell abundance and nitrogen metabolism of Crocosphaera was monitored over 5 days. Our results imply that Crocosphaera is able to simultaneously perform N2 fixation and assimilate dissolved inorganic nitrogen (DIN, i.e., nitrate and ammonium) under all the conditions tested and implies a competition with non-diazotrophic phytoplankton for DIN, which should be further investigated. Using NanoSIMS analysis of single cells, our results point towards a preference for DIN assimilation over N2 fixation under more acidic and warmer conditions. Overall, our results show that while the combined alteration of pH and temperature had a negative effect on the diazotroph’s growth and N2 fixation, Crocosphaera is likely to cope well with conditions in the future ocean. The high intra-population variability in nitrogen assimilation pathways may give this species the flexibility to quickly react to environmental changes.
1 Introduction
As two consequences of climate change, ocean warming and ocean acidification can potentially alter biogeochemical cycles (Gruber, 2011). Compared to other N assimilation processes, N2 fixation is a highly energy intensive process (Großkopf and LaRoche, 2012). To meet their high energy demand, many diazotrophs possess carbon concentrating mechanisms to accumulate CO2, which is used to generate energy during photosynthesis (e.g. Czerny et al., 2009; Kranz et al., 2010). Elevated CO2 concentrations in the future, acidified ocean may facilitate the uptake of CO2, resulting in an increase in energy available for other processes like N2 fixation (Barcelos e Ramos et al., 2007; Hutchins et al., 2007; Levitan et al., 2007; Fu et al., 2008; Kranz et al., 2009). Ocean warming is predicted to intensify the stratification of the water column, which will likely reduce the nutrient supply to the surface from deeper waters (Sarmiento et al., 2004; Steinacher et al., 2010; Laufkötter et al., 2015; Li et al., 2020). Diazotrophs that are capable of using dinitrogen (N2) can thrive in N-limited regions in contrast to non-diazotrophic phytoplankton. Further, N2 fixation has the potential to partly counter the emerging N-limitation as it supplies new N to the surface ocean and sustains primary production (Zehr, 2011). By supplying reactive N, N2 fixation fuels the biological pump, which transports CO2 from surface water to the deep ocean, as dead biomass sinks. To date, it is still unclear how N2 fixation will respond to projected future conditions (Zehr and Capone, 2020). Given the importance of diazotrophy to keep the carbon cycle going, it is important to improve our knowledge on this issue to enable reliable predictions of the effects of climate change on primary production and the associated CO2 uptake and storage in the ocean (Wrightson and Tagliabue, 2020).
Crocosphaera watsonii (hereafter called Crocosphaera) is a cyanobacterial diazotroph dominant in tropical and subtropical regions of the ocean contributing to new nitrogen inputs globally (Zehr and Capone, 2020). N2 fixation in Crocosphaera cultures has been shown to increase with increasing CO2 concentrations (Fu et al., 2008; Garcia et al., 2013). However, field studies have found no effect of an elevated partial pressure of CO2 (pCO2) on natural diazotroph communities dominated by Crocosphaera (Böttjer et al., 2014). An explanation for this discrepancy could be an increase in pCO2 associated with a decrease in seawater pH. Shi et al. (2012), Hong et al. (2017) and Luo et al. (2019) have shown that the nitrogenase enzyme, responsible for N2 fixation, is sensitive to a pH decrease of 0.2–0.3 units and therefore the stimulating effect of elevated pCO2 levels is offset resulting in a decrease of N2 fixation.
Complicating matters further, climate change is expected to have other side effects besides acidification, of which the most impactful is warming (IPCC (Intergovernmental Panel on Climate Change), 2019). Many microbial metabolic processes are dependent on temperature (Brown et al., 2004; Regaudie-de-Gioux and Duarte, 2012) and warming influences phytoplankton growth and physiology (Eppley, 1972; Raven and Geider, 1988). As a result, an increase in temperature mostly has a stimulating effect on the growth of diazotrophs and N2 fixation, as long as temperature does not exceed the upper tolerance threshold of the species investigated, reported to be ~32–33°C for most diazotrophs (Fu et al., 2014; Gao et al., 2019). It seems plausible that enhanced diazotroph activity could mitigate the N-limitation resulting from intensified stratification. The process of N2 fixation is controlled by other nutrients as well, with iron and/or phosphorus often limiting diazotrophs’ activity (Sañudo-Wilhelmy et al., 2001; Mills et al., 2004; Luo et al., 2014). If diazotrophs are stressed by ocean warming, acidification and nutrient limitation and in response switch their N metabolism, this could potentially result in competition of diazotrophs and non-diazotrophs for DIN in a future ocean. Several studies have shown that nanomolar concentrations of DIN do not inhibit N2 fixation (Holl and Montoya, 2005; Dekaezemacker and Bonnet, 2011; Masuda et al., 2013) and that Crocosphaera is capable of DIN uptake and N2 fixation in parallel (Masuda et al., 2013, 2022), which supports the hypothesis that diazotrophs could be in competition with non-diazotrophic phytoplankton for DIN. As another consequence, N release by diazotrophs could be reduced and even less DIN would be available for other phytoplankton groups.
Most studies worked with cultured diazotrophs only and did not simulate in-situ conditions with multiple stressors. To date there are only few studies investigating combined stressors in more realistic scenarios (Boyd et al., 2018), but such studies are needed to reliably predict the future of N2 fixation and primary production in times of climate change, even though they might be difficult to conduct. Additionally, many diazotrophs thought to contribute significantly to global N2 fixation have not yet been cultivated (Zehr and Capone, 2020) and thus effects of climate change on these species remain unstudied and unpredictable. In this study, we investigate the effect of combined ocean acidification and warming on cultures of Crocosphaera with a focus on the potential competition between a unicellular diazotrophic species and non-diazotrophs for DIN. We aim here to simulate a more realistic climate change scenario by altering two variables simultaneously and follow the response of growth, N2 and carbon fixation and DIN assimilation of Crocosphaera.
2 Materials and methods
We conducted a minicosm experiment with cultures of the unicellular diazotroph Crocosphaera watsonii strain WH8501 (Waterbury and Rippka, 1989). Seawater used for the culturing of the species and the experiment was collected from the Mediterranean Sea in an acid-cleaned 1 m³ polyethylene tank. While the water was pumped into the tank it was filtered by 0.2 µm. Water from the tank was transferred to sampling or incubation containers (see below) by siphoning when needed and was filtered again by 0.2 µm before further use. Nutrient concentrations in the Mediterranean seawater were< 0.03 µM for nitrate and ~ 0.01 µM for phosphorus.
2.1 Growth and acclimation of cultures
Batch cultures of Crocosphaera were grown in nitrogen-free YBC-II medium prepared with 0.2 µm filtered sea water (Chen et al., 1996) at 26°C under a light:dark cycle of 12h:12h with a daytime photon flux of ~250 µmol photons m−2 s−1. Cultures were gradually adapted to lower phosphate concentrations than normally used in the YBC-II medium for 8 weeks to approximate natural phosphate concentrations. Nevertheless, to avoid phosphate limitation during the experiment, the final phosphate concentrations in experimental cultures was 25 µM. We tested three different scenarios in our experiment simulating representative concentration pathways (RCP) 2.6 (26°C and pH 8.1), 4.5 (28°C and pH 8.0) and 6.0 (30°C and pH 7.9) (IPCC, 2014), here called “low”, “intermediate” and “extreme” treatments. The cultures were acclimated to these experimental conditions for six weeks (~20 generations). Temperature in the cultures was increased from 26°C to 28°C and 30°C, respectively at a rate of 0.5°C per day. After eight days, the thermal acclimation was completed. From these temperature-acclimated cultures, we prepared new parent cultures by enriching water with CO2 until the targeted pH levels of 8.1, 8.0 and 7.9 were reached prior to the addition of diazotroph cultures. These new cultures were grown for another seven days, corresponding to about four generations and were then used to start the experiment.
2.2 Experimental setup
A detailed description of the experimental setup and daily sampling routine is given in Filella et al. (2024). In brief, we worked with eight cylindric minicosms with a volume of 40 l each (Figure 1). Every minicosm was equipped with a manual stirrer, a thermostat, a CO2 diffusor and a sensor to measure pH and temperature that were connected to an automated system (IKS aquastar, IKS Aquastar Computer System GmbH, Karlsbad, Germany). The IKS system autonomously monitored temperature and pH and maintained both parameters at the targeted levels by controlling the thermostat and CO2 diffusor in the tanks. In addition, every tank was continuously bubbled with air to avoid stratification inside the tanks.
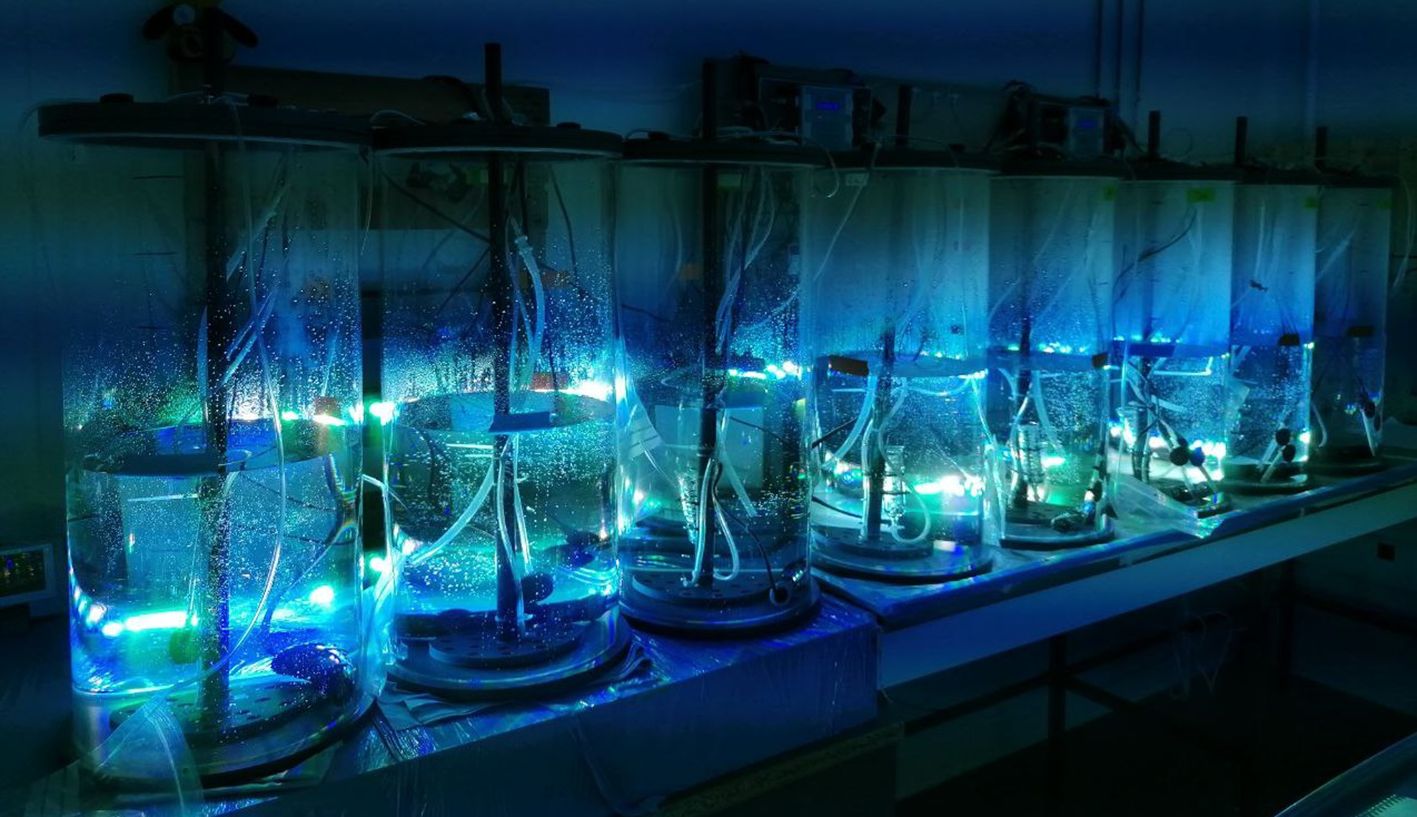
Figure 1 Experimental setup showing the minicosms under daylight conditions.
Two minicosms (1A, 1B) were used for the low treatment and three minicosms were used to simulate the intermediate (2A, 2B, 2C) and extreme (3A, 3B, 3C) treatment, respectively. The minicosms were kept in a temperature-controlled room with an ambient temperature of 24°C. Minicosms were placed in front of lights simulating a natural daily light cycle with sunrise and sunset in the surface ocean (Alpheus LED lamps, Montgeron, France), such that every tank received ~250 µmol photons m−2 s−1 during the daylight period. The light:dark cycle was 12h:12h. The actual experiment was run for one week (day −2 to day 5). One day before the start of the experiment (day −3), sea water, which had been filtered twice by 0.2 µm by then, was transferred into the minicosms from the reservoir tank. The 40 l minicosms were filled with 25 l of sea water each and nutrients and trace metals corresponding to the concentrations in the YBC-II medium were added. Phosphate was added to a final concentration of 25 µM only, corresponding to the concentration during the prior culturing process. Diazotroph cultures were added to the minicosms on day −2 (two days before daily measurements started) in a final concentration of ~1.5 × 10⁴ cells ml−1 in each minicosm. On day −1, sodiumhydroxide solution (NaOH, 1 N of which 1 ml NaOH raised the pH by 0.06) was added to adjust the pH. Accordingly, 1 ml NaOH was added to tanks 2A and 2B, 1.5 ml to minicosm 2C and 0.5 ml to tanks 3A, 3B and 3C. The pH in the low treatments did not require an adjustment.
From day −2 to day 5, temperature and salinity were measured daily with a thermosalinograph. In addition, daily samples were taken from day −2 onwards to determine cell abundance of Crocosphaera via microscopy counts and pH via discrete spectrophotometry. In combination with measurements of total alkalinity (TA) at the beginning and end of the experiment (days −2 and 5), these pH measurements were used to monitor the carbonate chemistry. CO2 concentrations and other parameters of the carbonate system were calculated using the seacarb R package (Gattuso et al., 2023) and are reported in the companion study of this manuscript (Filella et al., 2024). Every other day, starting on day −2, samples for the determination of the natural abundance of δ15N and δ13C of particulate organic material (POM), concentrations of nitrite (NO2−), nitrate (NO3−), ammonium (NH4+), phosphate (PO43−), DON, dissolved organic phosphorus (DOP), as well as for counts of heterotrophic bacteria via flow cytometry were taken. Samples for nutrient concentrations were filtered by 0.2 µm and were stored frozen (−20°C) until analysis. Inorganic nutrient concentrations were measured with a segmented flow analyser (AAIII HR, Seal Analytical) according to Aminot et al. (2009), except from NH4+ concentrations, which were determined via fluorometry (Aminot et al., 1997; Holmes et al., 1999) directly after sampling. Concentrations of total dissolved nitrogen and phosphate were determined by high-temperature (120°C) persulfate wet oxidation mineralization (Pujo-Pay & Raimbault, 1994) and subtracting phosphate and nitrate concentrations from the total dissolved nitrogen and phosphate concentrations to obtain the correspondent dissolved fraction (DON and DOP concentrations). Detection limits were 0.02 µM for NH4+, 0.05 µM for NO3−, 0.01 µM for NO2−, 0.05 µM for PO43−, 0.02 µM for DON and 0.02 µM for DOP. The limit of detection corresponds to three times the standard deviation of more than 10 nutrient-poor surface samples. The limit of quantification is 10 times this measurement.
We further collected subsamples to measure bulk N2 fixation and carbon fixation rates and single-cell rates of N2 fixation, NO3– and NH4+-assimilation on day 0, day 2 and day 4. Prior to each sampling, the tanks were carefully homogenized with the custom-made stirrer to minimise adhesion to the walls of the tanks and sedimentation.
2.3 Bulk rate measurements
To determine community N2 fixation rates, the dissolved method was applied (Mohr et al., 2010; Klawonn et al., 2015). Two weeks prior to the experiment, 15N enriched seawater was prepared in 600 ml Schott bottles equipped with a septum cap by filtration (0.2 µm) of water collected from the Mediterranean Sea and subsequent adjustment of the pH to the three target scenarios by bubbling with CO2. Six ml of 15N2 gas were added to every bottle with a gas-tight syringe. Bottles were shaken vigorously for one minute and then stored horizontally at 4°C until usage during the experiment.
During the actual experiment, 30 ml of enriched seawater was siphoned into 300 ml polycarbonate bottles and 30 µL of NaH13CO3 (0.1 M) was pipetted into the bottles prior to sampling. Bottles were then filled directly from the minicosms until overflowing, avoiding air bubbles, and sealed gas-tight with a septum cap. The bottles were then incubated for 24 h in water baths set to the target temperature of the respective treatment, receiving the same light:dark cycle as the minicosms. After the incubation, bottles were inverted several times and 12 ml of the sample were removed with a pipette and transferred to an Exetainer® for the determination of the 15N enrichment in the water via membrane inlet mass spectrometry (MIMS). Afterwards, the whole water sample was filtered onto precombusted (450°C, 4 h) GF/F filters (Advantec GF-075, nominal pore size 0.3 µm) with a peristaltic pump. Filters were then placed into Eppendorf tubes and stored at −20°C until analysis via isotope ratio mass spectrometry (IRMS).
Bulk N2 fixation rates were calculated after Montoya et al. (1996) as following (Equation 1):
Where A = atom% 15N in the particulate organic nitrogen (PN) at the end (final) or beginning (t = 0) of the incubation or in the dissolved N2 pool (N2).
Bulk carbon fixation rates were calculated after Collos (1987) as follows (Equation 2):
Where VC is the specific uptake rate (carbon uptake per unit particulate carbon per unit time), 13Cfinal is the concentration of 13C in atom% in the sample after incubation, 13Cinitial is the concentration of 13C in atom% at the beginning of the incubation, hence the natural abundance of 13C in the sample, DIC – 13Cinitial is the concentration of 13C in the dissolved phase, and t is the incubation time. To obtain the transport rate of C normalized to biomass, is then multiplied by the concentration of particulate organic carbon (POC).
2.4 Single-cell rates of N2 fixation, nitrate and ammonium assimilation
Single-cell analyses were performed on only one sample per treatment, which was collected from either 1A, 2B or 3C, respectively.
For the determination of single-cell N2 fixation rates, 6 ml of 15N enriched sea water, prepared as explained in the previous subsection, was added to 60 ml glass vials, which were then filled with water from the respective minicosm until overflowing. Vials were sealed gas-tight, inverted 30 times to mix the sample and placed into the incubators matching the respective scenario for 24 hours. Samples where then filtered onto 0.2 µm pore-size 25 mm diameter polycarbonate filters using a peristaltic pump. Filters were preserved with 2 ml of a 4% paraformaldehyde solution and stored at −20°C until analysis via nanometer-scale secondary ion mass spectrometry (NanoSIMS).
For NO3− and NH4+ assimilation rates, water was collected from the minicosms in 60 ml glass vials before noon every other day over the course of the experiment. Na15NO3 or 15NH4Cl, respectively, was added to a final concentration of 0.03 µM and vials were inverted 30 times before being placed in the incubators. Samples for the analysis of NO3− uptake were incubated for 3–4 hours, while the incubation of samples enriched with 15N-NH4 was terminated after 2 hours. The incubation covered the period of maximum daylight, when phytoplankton is thought to be most active in terms of nitrogen assimilation (Cochlan et al., 1991). Incubations were terminated by filtration of the whole sample onto polycarbonate filters (same as for N2 fixation rates). Filters were handled in the same way as described for N2 fixation rates.
As a first step for NanoSIMS analysis, regions of interest (ROIs) were marked on sample filters using a laser dissection microscope (Leica LMD 7000). Healthy cells, detected by active fluorescence of Chlorophyll a and phycoerythrin, were identified and marked. At least 20 cells per filter were analyzed. A 10 mm piece was cut out of the filter, mounted onto an aluminum stub equipped with a conductive graphite sticky tape layer and sputtered with 30 nm gold with a Cressington 108 auto Sputter Coater (Watford, United Kingdom) to ensure conductivity. Filters were then placed into the NanoSIMS for the analysis of 15N and 13C enrichment with a Cameca NanoSIMS 50 L (Cameca, Paris, France). Every third sample is a natural abundance sample without tracer, hence a known ratio of heavy to light isotopes (in my case 13C/12C and 15N/14N) for quality control of the measurement. The lateral resolution of the NanoSIMS goes down to 50 nm. The precision of the measurements was calculated as three times the standard deviation of natural abundance samples and was 0.001 atom% for 13C and 0.0003 atom% for 15N. Images of secondary ion (12C−, 13C−, 12C14N−,12C15N−, 31P−,32S−) as well as secondary electrons were recorded simultaneously using mass detectors equipped with electron multipliers (Hamamatsu) for the ions. The mass resolving power was adjusted to be sufficient to suppress interferences at all masses, allowing e.g., the separation of 12C15N− from interfering ions such as 13C14N−. Prior to the analysis, sample areas of 50×50 µm were sputtered for 10–15 min with 600 pA to erode the gold, clean the surface and reach the steady state of secondary ion formation. The primary ion beam current during the analysis was 1 pA. The scanning parameters were 512×512 pixels for areas of 45×45 to 49×49 µm, with a dwell time of 250 µs per pixel. 60 planes were analyzed and accumulated using the software Look@NanoSIMS (Polerecky et al., 2012). The planes were checked for inconsistencies and the drift was corrected. ROIs were defined based on 12C14N in combination with 31P and 12C as templates by applying the interactive thresholding function of the software. Where automatic cell identification was difficult the other ion pictures, the secondary electron pictures before and after implantation (not shown) as well as the fluorescence images (supplementary picture 2) were taken into account. If the cells were located right next to each other the ROIs were defined manually. Thus, each ROI represents a securely identified single Crocosphaera cell. In those cases, where the cells were located right next to each other or were slightly overlapping, the ROIs were defined manually. Isotope enrichment (13C, 15N) in atom% was obtained from ion counts accumulated over all ROI pixels and over all selected planes by the software.
Single cell rates of N2 fixation were calculated in the same way as bulk rates as explained in the previous section, but for a single cell in fmol cell−1 d−1. NO3− and NH4+ uptake rates were calculated following the same principal after Dugdale and Wilkerson (1986) as (Equation 3):
Where VN (t) is the specific uptake rate (N taken up per unit particulate N per unit time), 15Nxs, sample is the atom% excess in the sample (15Nxs, sample = 15Ns – F with 15Ns being the atom% 15N in the sample), 15Nxs, pool is the atom% 15N in the initially labelled fraction, F is the natural abundance of 15N and t is the incubation time. NH4+ uptake rates per hour were calculated assuming a NH4+ concentration of 0.02 µM, as concentrations were below detection limit at all times during the experiment.
The volumetric rate ρN (t) (N uptake in concentration units) was then calculated using V (t) and the PON concentration of the respective cell (Equation 4):
The carbon content of Crocosphaera cells (POC) was obtained from cell biovolume derived from its equivalent spherical diameter (Sun and Liu, 2003) directly measured on the nanoSIMS images and using a volumetric carbon content of 360 fg C µm−3 according to Verity et al. (1992). The cell nitrogen content (PON) was calculated assuming an average C/N ratio of 5.5 (Dekaezemacker and Bonnet, 2011; Knapp et al., 2012). To extrapolate rates to daily rates, we multiplied by 12 hours for NO3− and NH4+ uptake rates and by 24 hours for N2 fixation rates.
To test for significant differences of uptake rates between the treatments, a Kruskal-Wallis test was applied using the “kruskal.test()” function from the package “stats” in the software R (R Core Team, 2023). Subsequently, a Wilcoxon Rank Sum test was done using the function “pairwise.wilcox.test()” from the package “stats” (R Core Team, 2023) for pairwise comparisons.
3 Results
The temperature in the tanks was quite stable over the course of the experiment and was close to the target scenarios (Figure 2). The pH was more variable at the beginning of the experiment due to mixing processes with air during the filling of the tanks, but stabilized after the addition of NaOH on day −1. At the start of the experiment on day 0, the pH clearly differed between the three scenarios and was close to the respective target values (Figure 2). The pH was well controlled by the IKS system over the course of the experiment and stayed relatively constant at the targeted values.
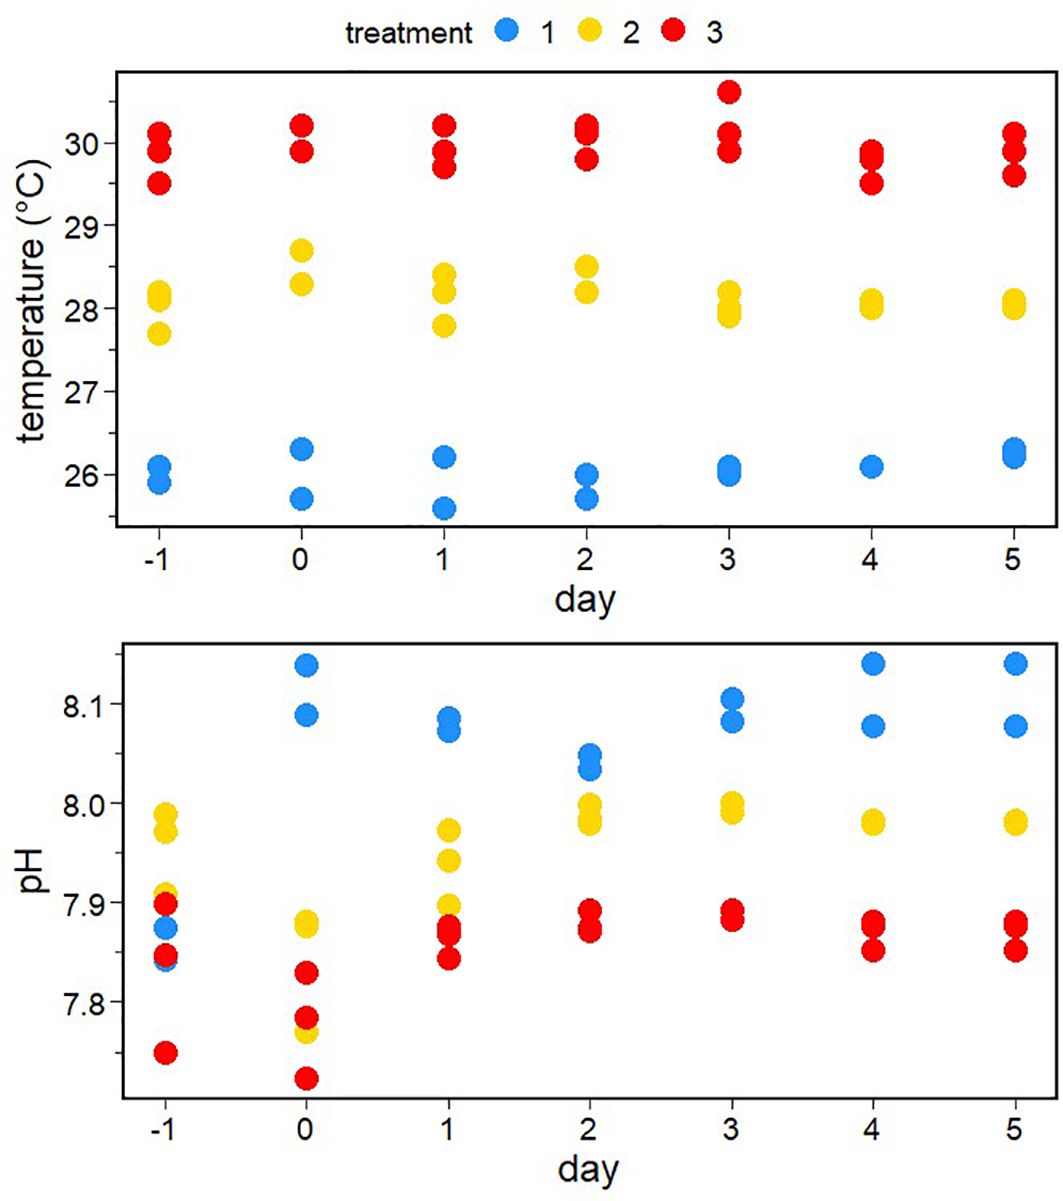
Figure 2 Daily measurements of temperature (obtained with a thermosalinograph) and pH (obtained by discrete spectrophotometry) in the different minicosms over the course of the experiment.
Phosphate concentrations stayed constant around 20 µM in all minicosms of the low and extreme treatments and minicosms 2A and of the intermediate treatment during the experiment. However, phosphate concentrations were around 28 µM in the intermediate treatment in minicosm 2B and minicosm 2C (only on day 3) over the course of the experiment (Figure 3). Ammonium concentrations remained below the detection limit (0.02 µM) in all minicosms (data not shown). Nitrate concentrations were more variable, with a tendency to an increase after day 2 (Figure 3), probably due to degradation of dead biomass. The high nitrate concentration in the extreme treatment on day 3 is likely the result of some kind of contamination and was not considered in further evaluation.
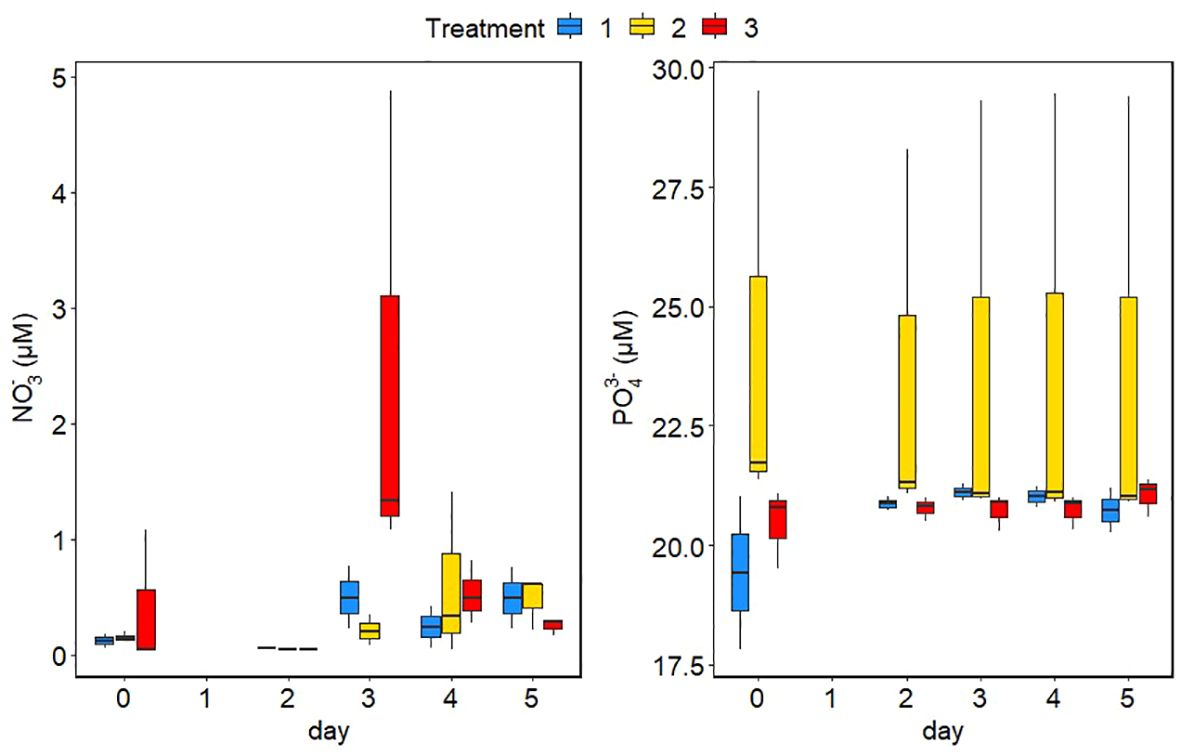
Figure 3 Phosphate and nitrate concentrations in the different minicosms over the course of the experiment. The colours of the bars represent the three different treatments. Blue is the control treatment, yellow is the intermediate treatment and red is the extreme treatment. The mean between replicates minicosms is marked in each boxplot by a black horizontal line and the minimum and maximum are marked by the edges of the boxes. Outliers (exceeding the 95% confidence interval) are shown by the whiskers of the boxplots.
The abundance of Crocosphaera increased in all treatments from day −2 until day 0 (Figure 4). The increase was stronger in the low and high temperature scenarios than in the intermediate one. However, while cell abundance reached a plateau between day 0 and day 2 in the low and high temperature treatments and dropped after day 2, cell abundance continued to increase in the intermediate treatment until day 4. The decrease of cells was strongest in the high temperature treatment. The abundance of bacteria increased in the first two days after filling of the tanks and stayed relatively constant around 7.5 × 10⁶ cells ml−1 over the course of the experiment (Figure 5). A slightly higher abundance of bacteria was observed in the extreme treatment (Figure 5).
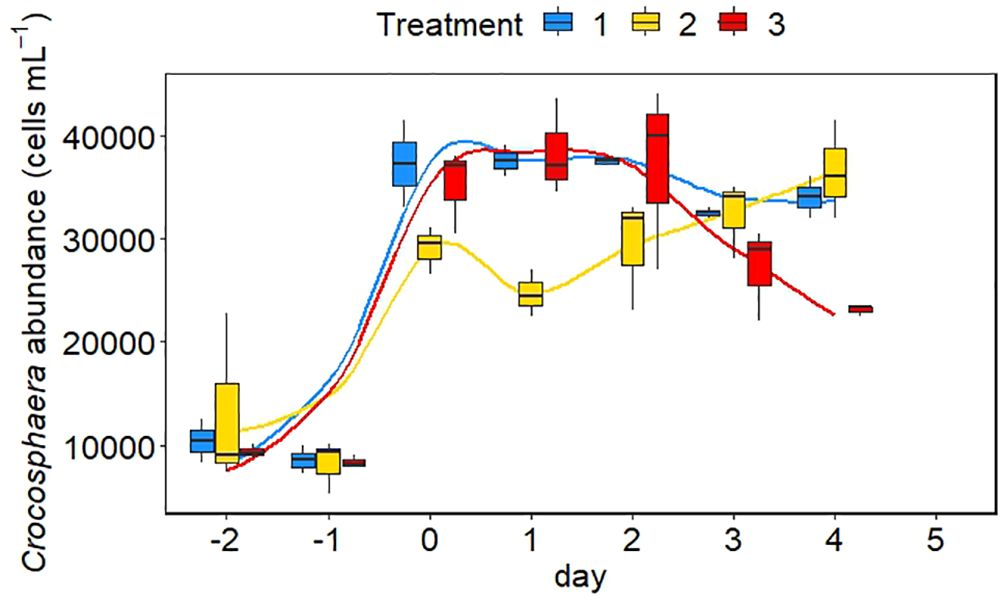
Figure 4 Abundance of Crocosphaera cells in the different minicosms over the course of the experiment. The colours of the bars represent the three different treatments. Blue is the control treatment, yellow is the intermediate treatment and red is the extreme treatment. The mean between replicates is marked in each boxplot by a black horizontal line and the minimum and maximum are marked by the edges of the boxes. Outliers (exceeding the 95% confidence interval) are shown by the whiskers of the boxplots.
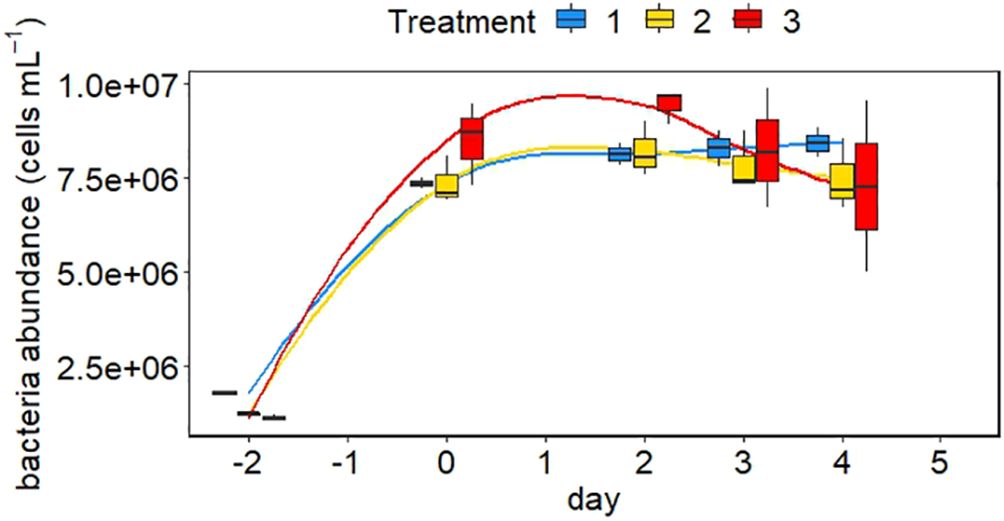
Figure 5 Abundance of heterotrophic bacteria in the different minicosms over the course of the experiment The colours of the bars represent the three different treatments. Blue is the control treatment, yellow is the intermediate treatment and red is the extreme treatment. The mean between replicates is marked in each boxplot by a black horizontal line and the minimum and maximum are marked by the edges of the boxes. Outliers (exceeding the 95% confidence interval) are shown by the whiskers of the boxplots.
Bulk N2 and carbon fixation rates were maximal in the intermediate treatment on day 2, mirroring the behavior of cell abundance (Figure 6). Both metabolic rates were highest in the intermediate treatment at all three sampling points, while they were lowest in the low treatment at the beginning of the experiment (day 0). On days two and 4, N2 fixation rates were lowest in the extreme temperature treatment, but carbon fixation rates were still lowest in the low treatment on day 2. The variability of N uptake rates among the different cells within the Crocosphaera population was high (Figure 7). While both NO3− and NH4+ uptake rates were quite similar between treatments and were drastically reduced to almost zero on day 4, cell-specific N2 fixation rates gradually increased in the intermediate treatment and did not drop after day 2 in contrast to the bulk rates (Figure 7). Unexpectedly, cell-specific NO3− uptake rates were up to 10-fold higher than cell-specific NH4+ uptake rates (Figure 7). There was no clear or consistent pattern in N uptake rates between treatments or experimental days (Mann-Whitney-U test, Supplementary Table S1). NO3− uptake rates were lowest on day 4 in the intermediate treatment, where N2 fixation was still high. NH4+ uptake rates were significantly higher in the extreme than in the low treatment on day 2 (Mann-Whitney-U test; p = 0.006), before a decline to almost 0 on day 4.
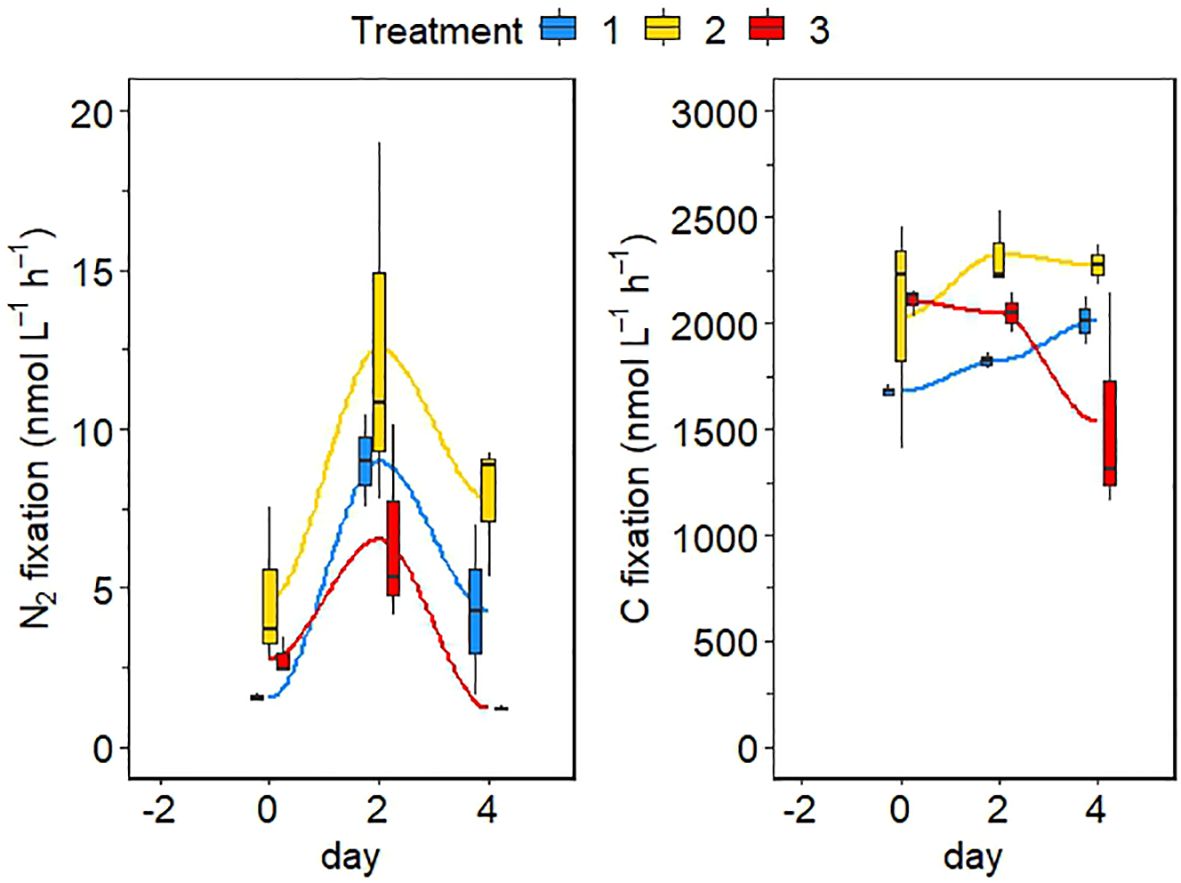
Figure 6 Bulk N2 and C fixation rates in the different minicosms at the three sampling points. Blue is the control treatment, yellow is the intermediate treatment and red is the extreme treatment. The mean between the replicates is marked in each boxplot by a black horizontal line and the minimum and maximum are marked by the edges of the boxes. Outliers (exceeding the 95% confidence interval) are shown by the whiskers of the boxplots.
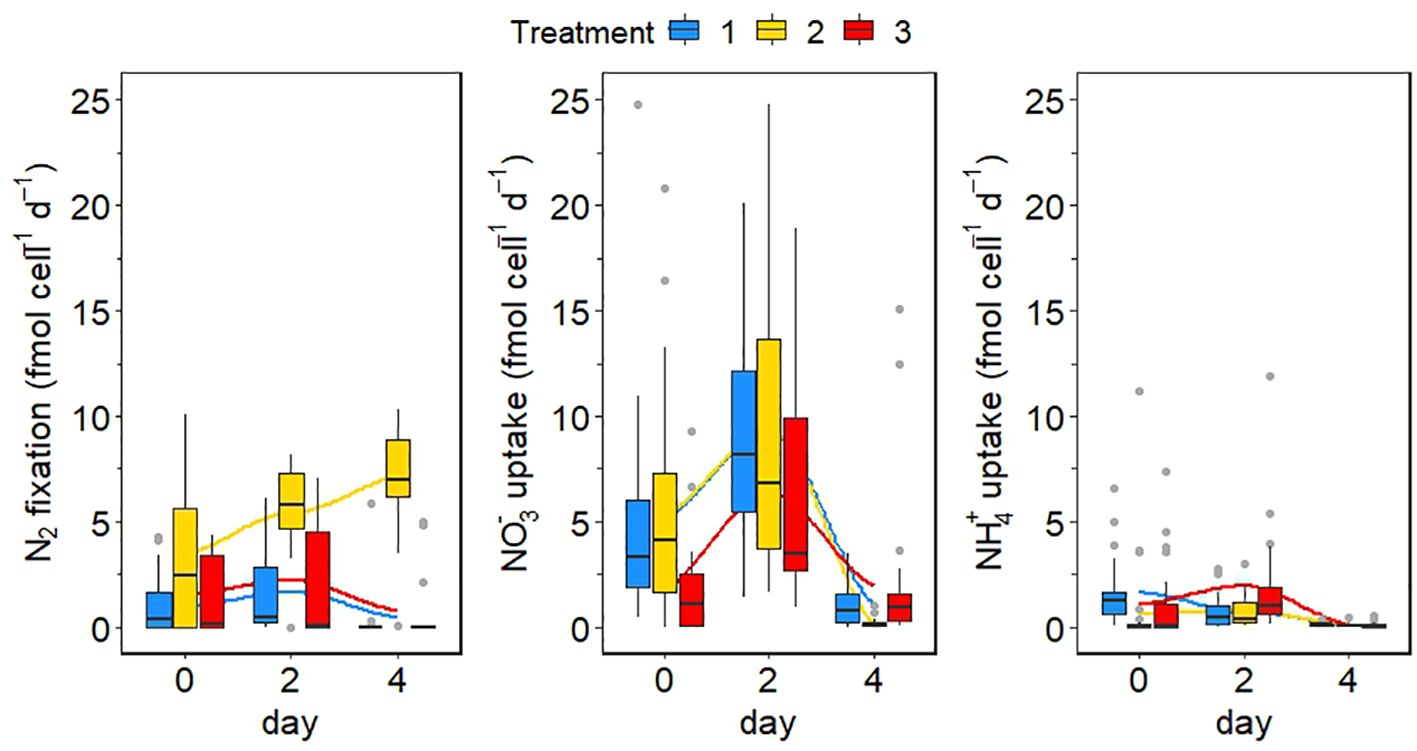
Figure 7 Cell-specific rates in fmol cell −1 day −1 for N2 fixation, NO3− assimilation and NH4+ assimilation (from left to right). Outliers are shown as grey dots. Blue is the control treatment, yellow is the intermediate treatment and red is the extreme treatment. The mean per treatment is marked in each boxplot by a black horizontal line and the minimum and maximum are marked by the edges of the boxes. Outliers (exceeding the 95% confidence interval) are shown by the whiskers of the boxplots.
4 Discussion
We applied a new approach that mimics conditions closer to the natural environment to investigate simultaneous effects of ocean warming and acidification on Crocosphaera. Simulating distinct pH and temperature climate change scenarios, we studied the combined effect of these stressors on DIN uptake in Crocosphaera, which to the best of our knowledge, had not been done before. To our surprise, we observed different preferences for distinct DIN sources (e.g., N2, NO3− and NH4+) depending on the treatments and experimental time.
4.1 Effects of warming and acidification on the growth and N2 fixation of Crocosphaera
In all treatments, cell numbers increased exponentially from days −2 to 0 (Figure 4). Interestingly, the change in cell abundance was similar between the low and extreme treatments while the cells in the intermediate treatment behaved differently (Figure 4). Cell abundance declined in the low and extreme treatments but increased continuously in the intermediate treatment, which could indicate that conditions in the intermediate treatment were optimal for the growth of Crocosphaera. Indeed, it has been shown that optimum growth temperature for this species ranges between 28 and 30°C (Fu et al., 2014). The rapid decline of cell abundance in the extreme treatment after day 2 however implies that a temperature of 30°C in combination with a low pH repressed the growth of Crocosphaera, which is confirmed by the response of N2 fixation rates (Figure 6). N2 fixation rates were highest in the intermediate treatment and showed a similar behavior between the low and extreme treatments (Figures 6, 7). Somehow, cell-specific N2 fixation rates in the intermediate treatment continued to increase after day 2, while bulk rates showed a slight decrease towards the end of the experiment. Nevertheless, N2 fixation rates in the intermediate treatment were always significantly higher compared to the low and extreme treatments on days 2 and 4 (Supplementary Table S1), stressing that N2 fixation in Crocosphaera was enhanced by an increase in pCO2, but only if temperature did not exceed 28°C. Phosphate concentrations barely decreased during the experiment, implying that this nutrient was in excess and not limiting (Figure 3), and no other bacterial growth was noted (Figure 5). Changes of growth and N metabolism of Crocosphaera are therefore attributed to the alteration of potential stressors in our experiment. However, cells grown in batch incubations without continued nutrient additions, slowly consume limiting elements contained in the culture medium (YBC-II), including vitamins and trace metals such as iron which might cause cultures to end collapsing.
The trend of bulk carbon fixation rates over the course of the experiment was similar to that of N2 fixation, with highest rates in the intermediate treatment and a sharp decline in the extreme treatment after day 2. However, unlike N2 fixation rates, carbon fixation rates in the low treatment continued to increase after day 2, implying that cells were still fixing CO2 but might have stored sufficient nitrogen or alternatively use a different nitrogen source. While an increasing temperature up to 30°C alone does not seem to reduce the growth or N2 fixation of this diazotroph (Fu et al., 2014), the combined alteration of temperature and pH in our experiment seems to have stressed cells to some extent and reduced their tolerance towards higher temperatures. This finding is supported by the high expression of stress-induced protein genes such as heat shock chaperones in the low and extreme treatments reported by the companion study to this experiment (Filella et al., 2024). Our rates fall within the range of global N2 fixation rates reported by Shao et al. (2023), but while maximum rates from the intermediate treatment are similar in magnitude as most of the rates reported globally, rates from the other two treatments rather fall within the lowest rates summarized in Shao et al. (2023). This supports the observation that the low and extreme treatments represented stressful conditions for Crocosphaera.
Due to the setup of our experiment, we cannot clearly separate the effects of temperature and pH, but it seems that temperature has a greater impact on the growth and N assimilation activity of Crocosphaera than pH, at least within the ranges tested in this study, which are likely quite common in the surface ocean due to production and degradation processes and upwelling of deep water. Global diazotroph nifH gene abundance and, random forest algorithms created to estimate diazotroph distribution indicate that sea surface temperature is the most important predictor of UCYN-B (Crocosphaera) abundance Tang et al. (2019) and Bopp et al. (2022) stress the role of temperature in controlling the resource cost for nitrogen fixation, which confirms our suggestion. Temperature in the low treatment was below the optimum for this species (~28°C; e.g., Waterbury and Willey, 1988; Falcon et al., 2005; Webb et al., 2009), while temperature in the extreme treatment was still within the temperature growth range reported for Crocosphaera (Fu et al., 2014). In accordance with previous studies, our results showed that 28°C was the optimum temperature for growth as well as for carbon and N2 fixation by Crocosphaera. The slightly reduced pH in this scenario (7.9) seems to have had no negative effect on the diazotroph, as cells continued growing steadily. Still, the rapid decline of cell numbers as well as carbon and N2 fixation rates in the extreme treatment seems to confirm the hypothesis that the combination of elevated temperature and reduced pH was stressful for Crocosphaera. Contradictory to our results, Levitan et al. (2010) observed that high pCO2 increased N2 fixation rates independently of temperature (25°C or 31°C) in Trichodesmium sp. This points to a species-specific response of N2 fixation to climate change conditions and argues against general reactions of all diazotrophs like often applied in models simulating the future of N2 fixation and primary production. However, it is difficult to draw conclusions from only two experiments, especially as the volumes used to test scenarios were very different between our study and the one of Levitan et al. (2010). Our results hint that a combined alteration of pCO2 and temperature possibly affects Crocosphaera differently than changes of a single stressor alone, but more studies are needed to fully understand the consequences of environmental changes on this species and other diazotrophs. Enzymes and membrane proteins will be involved in shaping the response of microbial communities to warming and ocean acidification (Hutchins and Sañudo-Wilhelmy, 2022). For example, there is evidence that future declines in pH could impact the carbon concentrating mechanisms in phytoplankton (Hutchins and Sañudo-Wilhelmy, 2022). Further, warming increases the carboxylase turnover rate of RuBisCO favoring photorespiration (Galmés et al., 2015) and ocean acidification may reduce the efficiency of the nitrogenase (Luo et al., 2019). It is unclear at the moment, how much energy marine microbes are currently allocating to counteract the physiological effects of simultaneous increase in temperature and decrease in pH and how much this investment will need to increase in the future (Hutchins and Sañudo-Wilhelmy, 2022).
4.2 DIN assimilation and potential competition between diazotrophs and non-diazotrophs
DIN uptake rates were determined to investigate the competitive effect with other photoautotroph species of combined temperature and pH on the DIN uptake of Crocosphaera. In general, although both NO3− and NH4+ were assimilated, we did not find a clear switch in N metabolism under the scenarios tested. Thus, an interesting finding is that while single-cell N2 fixation rates in the low and extreme treatments were negligible on day 4, Crocosphaera consumed NO3− at low rates in these two treatments, but not in the intermediate treatment, where N2 fixation was still high (Figure 7). This observation might hint at a potential switch from N2 fixation to NO3− uptake under stressful conditions. NO3− availability in the minicosms was low during the experiment, so the applicability of this finding under in-situ conditions remains to be tested. Nevertheless, N2 fixation and NO3− uptake rates were significantly different between the low or extreme and the intermediate treatment (Supplementary Table S1). A switch to alternative nitrogen sources has been shown by previous studies for the uptake of DON. Walworth et al. (2018) have shown that Trichodesmium sp. assimilates DON under elevated pCO2 conditions. Therefore, it seems likely that DON could be an alternative N source for this species. Our experiments found DOC uptake in Crocosphaera (Filella et al., 2024) and for field data from the Baltic Sea, Korth et al. (2012) could confirm DON uptake of diazotrophs.
Mulholland and Capone (1999) stressed the importance of N-recycling in extremely oligotrophic areas, where N2 fixation and NH4+ uptake are likely tightly coupled in diazotrophs. A high capacity of a Crocosphaera population to cope with changing environmental conditions, with individual cells being able to quickly react to environmental changes such as a DIN pulse is implied by the large intra-population variability observed in cell-specific N assimilation rates in our experiment, implies a high capacity of a Crocosphaera population to cope with changing environmental conditions, with individual cells being able to quickly react to environmental changes such as DIN pulses. Heterogeneity within the population might be the result of different growth stages of individual cells within the population (Elowitz et al., 2002; Martins and Locke, 2015) or point to deviating substrate preferences between cells (Matantseva et al., 2016; Berthelot et al., 2018). Intra-population variability seems to be a common phenomenon (Junker and Van Oudenaarden, 2014; Martins and Locke, 2015). For example, Berthelot et al. (2018) found large differences between the N uptake of individual cells of Synechococccus spp., Klawonn et al. (2019) observed a high variability in NH4+ assimilation and carbon fixation rates of single cells of different phytoplankton species, Eichner et al. (2017) report a high variability of carbon and N2 fixation rates between different cells of a Trichodesmium sp. colony and Matantseva et al. (2016) revealed substantial variability in N and carbon uptake rates between different cells of a dinoflagellate species. Heterogeneity between cells seems to help populations of phytoplankton to adapt to environmental changes, like fluctuating N availability and could represent a mechanism that enables communities to cope with climate change conditions. Furthermore, DIN uptake by Trichodesmium sp. has been demonstrated as well (Goering et al., 1966; Holl and Montoya, 2005). Eichner et al. (2014) investigated the response of Trichodesmium sp. to different levels of pCO2 and growth on NO3− and reported that while N2 fixation rates were reduced in cells grown on NO3−, primary production rates were enhanced in these cells, implying that NO3− assimilation had no negative effect on the growth of Trichodesmium sp. In combination with our results, this points to a much higher flexibility of the N metabolism of diazotrophs than previously thought, which provides them with an even greater advantage over non-diazotrophic phytoplankton. Polerecky et al. (2021) observed multiple mechanisms for nitrogen management in the unicellular cyanobacterium Cyanothece spp., which according to the authors facilitates the species’ success in dynamic environments.
In contrast to our results, Dekaezemacker and Bonnet (2011) found no assimilation of DIN, if concentrations of NO3− or NH4+ were below 1 µM. Surprisingly, NO3− uptake rates were higher than NH4+ uptake rates in our study (Figure 7). Even though NH4+ is energetically cheaper and preferred over NO3− by most species (Dugdale and Goering, 1967; Thompson et al., 1989), Crocosphaera seems to have preferred NO3−. As NO3− concentrations increased towards the end of the experiment and the activation of NO3− transporters in the cell wall are induced by the presence of this substrate (Glibert et al., 2016), this might explain the seeming preference of Crocosphaera for NO3- over NH4+. However, we cannot rule out the possibility that NH4+ was also consumed by bacteria in our cultures. The abundance of heterotrophic bacteria increased over the first two days of the experiment and then stayed constant (Figure 5). It is possible that some 15N-NH4+ added to our samples was assimilated by heterotrophic bacteria, as the background of nanoSIMS filters was highly enriched in 15N, especially in the 15N-NH4+ incubations (Supplementary Figure S2). This is likely, as we used filters with a pore size of 0.2µm that can capture bacteria as well as larger cells. Nevertheless, the abundance of heterotrophic bacteria in the minicosms was equivalent to in-situ conditions in the ocean and accordingly, our results hint that heterotrophic bacteria might contribute to NH4+ assimilation in natural communities as well, reflecting realistic uptake rates. Furthermore, Kirchman (1994) found that heterotrophic bacteria were accountable for ~30% of total DIN uptake only, implying that our DIN uptake rates might be overestimated by 30% at maximum.
Dekaezemacker and Bonnet (2011) observed that Crocosphaera is able to simultaneously fix N2 and consume both NO3− and NH4+, with NO3− being consumed at lower rates than NH4+. The same study reports an inhibition of N2 fixation in Crocosphaera by an NH4+ concentration > 0.2 µM, while no inhibition by NO3− was observed, which was also demonstrated by Großkopf and LaRoche (2012). Masuda et al. (2022) investigated the potential of Crocosphaera to assimilate DIN and found that both NH4+ and NO3− were consumed by the diazotroph. In an earlier study, the same authors even found that the growth of Crocosphaera was limited, if cells were grown in an NH4+ free medium, while N2 fixation rates were independent of NH4+ availability at low concentrations (Masuda et al., 2013). Masuda et al. (2013, 2022) concluded that the diazotroph is likely to be in competition for DIN with non-diazotrophic phytoplankton. The larger diazotroph Trichodesmium spp. has been shown to reduce its N2 fixation activity even in the presence of only 0.5 µM of DIN (Holl and Montoya, 2005), while other studies suggest the inhibition of N2 fixation when DIN concentrations exceed several µM (Capone et al., 1990; Ohki et al., 1991; Mulholland et al., 2001). Other work indicates that Trichodesmium spp. is capable of simultaneous N2 fixation and DIN uptake (Mulholland and Capone, 1999; Mulholland et al., 1999). As indicated by our study, Crocosphaera seems to continue fixing N2 at a constant rate in the presence of DIN as well. This ability gives the species an enormous advantage in N limited regions of the ocean, but also allows it to occur where DIN is available and to possibly outcompete other phytoplankton species in regions with DIN pulses. Further, it seems that the release of fixed N as NH4+ or DON by Crocosphaera is higher when NH4+ is absent, implying that N-limitation results in a lower retention of fixed N as compared to conditions in which ample DIN is available (Masuda et al., 2013). Consequently, Crocosphaera is likely to compete for DIN with non-diazotrophs and, if DIN is available, might not be a source for new nitrogen, but rather a sink itself with consequences for the phytoplankton community structure. This seems to be especially true in the decaying phase of a Crocosphaera bloom, as indicated by higher DIN assimilation rates towards the end of the experiment, where cell numbers started to decrease. On contrast, there seem to be no differences in N metabolism between climate change scenarios investigated here during the plateau phase of growth. These observations underscore the complexity of Crocosphaera’s physiological state during plateau and decay phases and, by extension, the complexity of its overall responses to environmental shifts.
In summary, our results show that Crocosphaera is stressed to some extent by a combined alteration of pH and temperature, but due to the high heterogeneity of N metabolism within a population appears to be well suited to acclimate to environmental changes on short time scales of weeks to months. The assimilation of DIN and organic carbon and nitrogen might help diazotrophs to cope with ocean warming and acidification. Small unicellular species like Crocosphaera seem to be rather favoured than disfavoured by ocean warming and ocean acidification and the structure of phytoplankton communities is likely to change in a future ocean. The overall consequences for global primary production and carbon sequestration remain to be resolved. Future studies should focus on multi stressor experiments and community diversity, as well as the ability of diazotrophs to adapt to phosphorus or iron limitation to address open questions.
Data availability statement
The data is available at http://doi.io-warnemuende.de. Additional data and information on the experimental setup is available in Figshare (https://figshare.com/articles/dataset/DOM_offsets_the_detrimental_effects_of_climate_change_in_the_nitrogen_fixing_cyanobacterium_em_Crocosphaera_em_/22773503).
Author contributions
JU: Conceptualization, Data curation, Formal analysis, Investigation, Methodology, Visualization, Writing – original draft, Writing – review & editing. AF: Conceptualization, Investigation, Writing – review & editing. AK: Investigation, Writing – review & editing. AV: Investigation, Resources, Writing – review & editing. MB: Conceptualization, Funding acquisition, Investigation, Project administration, Supervision, Writing – review & editing. MV: Conceptualization, Funding acquisition, Investigation, Supervision, Validation, Writing – review & editing.
Funding
The author(s) declare financial support was received for the research, authorship, and/or publication of this article. This study was funded in the scope of the project NOTION funded by the BNP Paribas Foundation for Climate and Biodiversity (MB) from 2021–2023. The MIMS equipment used in this study was obtained with European FEDER Funds. The NanoSIMS at the Leibniz-Institute for Baltic Sea Research in Warnemuende (IOW) was funded by the German Federal Ministry of Education and Research (BMBF), grant identifier 03F0626A. JU was funded with BMBF KüNO (funding number 03F0858A) for 2 months.
Acknowledgments
The authors would like to thank M. Camps and S. Bonnet for their comments and valuable advice on diazotroph culture work. F. Van Wambeke, S. Duhamel and N. Wannicke for advice regarding the experimental setup and osmotrophy studies, T. Wagener and F. Gazeau for carbonate system measurements advice, and E. Seris, J. Berdún, C. Ducrocq and J.-C. Cancel for their help during pilot experiments. We are indebted to M. Lafont, D. Malengros, K. Idri, N. Bhairy of the SAM platform of the MIO and to L. Thyssen and the Endoume marine station for facilitation and assistance in setting up the experimental infrastructure and advice in handling large volumes. The captain and crew of R/V Antedon II are warmly thanked for the collection of seawater and, D. Lefèvre, O. Pringault and S. Alliouane for training and assistance in light, oxygen respiration and total alkalinity measurements, respectively. The PRECYM Flow Cytometry Platform (https://precym.mio.osupytheas.fr/) and S. Nunige are acknowledged for flow cytometry and nutrient analyses respectively, and the Centre de Calcul Intensif d’Aix-Marseille for granting access to its high-performance computing resources.
Conflict of interest
The authors declare that the research was conducted in the absence of any commercial or financial relationships that could be construed as a potential conflict of interest.
Publisher’s note
All claims expressed in this article are solely those of the authors and do not necessarily represent those of their affiliated organizations, or those of the publisher, the editors and the reviewers. Any product that may be evaluated in this article, or claim that may be made by its manufacturer, is not guaranteed or endorsed by the publisher.
Supplementary material
The Supplementary Material for this article can be found online at: https://www.frontiersin.org/articles/10.3389/fmars.2024.1388214/full#supplementary-material
References
Aminot A., Kérouel R., Coverly S. C. (2009). “Practial guidelines for the analysis of seawater,” in Nutrients in seawater using segmented flow analysis. Ed. Wurl O. (Boca Raton: CRC), 143–178.
Aminot A., Kirkwood D. S., Kérouel R. (1997). Determination of ammonia in seawater by the indolphenol-blue method: Evaluation of the ICES NUTS I/C 5 questionnaire. Mar. Chem. 56, 59–75. doi: 10.1016/S0304–4203(96)00080–1
Barcelos e Ramos J., Biswas H., Schulz K. G., LaRoche J., Riebesell U. (2007). Effect of rising atmospheric carbon dioxide on the marine nitrogen fixer Trichodesmium. Global Biogeochemical Cycles 21, 1–6. doi: 10.1029/2006GB002898
Berthelot H., Duhamel S., L’Helguen S., Maguer J. F., Wang S., Cetinić I., et al. (2018). NanoSIMS single cell analyses reveal the contrasting nitrogen sources for small phytoplankton. ISME J. 13, 651–662. doi: 10.1038/s41396–018-0285–8
Bopp L., Aumont O., Kwiatkowski L., Clerc C., Dupont L., Ethé C., et al. (2022). Diazotrophy as a key driver of the response of marine net primary productivity to climate change. Biogeosciences 19, 4267–4285. doi: 10.5194/bg-19–4267-2022
Böttjer D., Karl D. M., Letelier R. M., Viviani D. A., Church M. J. (2014). Experimental assessment of diazotroph responses to elevated seawater pCO2 in the North Pacific Subtropical Gyre. Global Biogeochemical Cycles 6, 601–616. doi: 10.1002/2013GB004690
Boyd P. W., Collins S., Dupont S., Fabricius K., Gattuso J. P., Havenhand J., et al. (2018). Experimental strategies to assess the biological ramifications of multiple drivers of global ocean change—A review. Global Change Biol. 24, 2239–2261. doi: 10.1111/gcb.14102
Brown J. H., Gillooly J. F., Allen A. P., Savage V. M., West G. B. (2004). Toward a metabolic theory of ecology. Ecology 85, 1771–1789. doi: 10.1890/03-9000
Capone D. G., O’Neil J. M., Zehr J., Carpenter E. J. (1990). Basis for diel variation in nitrogenase activity in the marine planktonic cyanobacterium Trichodesmium thiebautii. Appl. Environ. Microbiol. 56, 3532–3536. doi: 10.1128/aem.56.11.3532–3536.1990
Chen Y. B., Zehr J. P., Mellon M. (1996). Growth and nitrogen fixation of the diazotrophic filamentous nonheterocystous cyanobacterium Trichodesmium sp. IMS 101 in defined media: Evidence for a circadian rhythm. J. Phycology 32, 916–923. doi: 10.1111/j.0022–3646.1996.00916.x
Cochlan W. P., Harrison P. J., Denman K. L. (1991). Diel periodicity of nitrogen uptake by marine phytoplankton in nitrate-rich environments. Limnology Oceanography 36, 1689–1700. doi: 10.4319/lo.1991.36.8.1689
Collos Y. (1987). Calculations of 15N uptake rates by phytoplankton assimilating one or several nitrogen sources. Int. J. Radiat. Appl. Instrumentation. Part 38, 275–282. doi: 10.1016/0883–2889(87)90038–4
Czerny J., Ramos J. B., Riebesell U. (2009). Influence of elevated CO2 concentrations on cell division and nitrogen fixation rates in the bloom-forming cyanobacterium nodularia spumigena. Biogeosciences 6, 1865–1875. doi: 10.5194/bg-6–1865-2009
Dekaezemacker J., Bonnet S. (2011). Sensitivity of N 2 fixation to combined nitrogen forms (NO -3 and NH +4) in two strains of the marine diazotroph Crocosphaera watsonii (Cyanobacteria). Mar. Ecol. Prog. Ser. 438, 33–46. doi: 10.3354/meps09297
Dugdale R. C., Goering J. J. (1967). Uptake of new and regenerated forms of nitrogen in primary productivity. Limnology Oceanography 31, 673–689. doi: 10.4319/lo.1986.31.4.0673
Dugdale R. C., Wilkerson F. P. (1986). The use of 15N to measure nitrogen uptake; experimental considerations. Limnology Oceanography 31, 673–689. doi: 10.4319/lo.1986.31.4.0673
Eichner M. J., Klawonn I., Wilson S. T., Littmann S., Whitehouse M. J., Church M. J., et al. (2017). Chemical microenvironments and single-cell carbon and nitrogen uptake in field-collected colonies of Trichodesmium under different pCO2. ISME J. 11, 1305–1317. doi: 10.1038/ismej.2017.15
Eichner M. J., Kranz S. A., Rost B. (2014). Combined effects of different CO2 levels and N sources on the diazotrophic cyanobacterium Trichodesmium. Physiologia Plantarum 152, 316–330. doi: 10.1111/ppl.12172
Elowitz M. B., Levine A. J., Siggia E. D., Swain P. S. (2002). Stochastic gene expression in a single cell. Science 297, 1183–1186. doi: 10.1126/science.1070919
Falcon L. I., Pluvinage S., Carpenter E. J. (2005). Growth kinetics of marine unicellular N2-fixing cyanobacterial isolates in continuous culture in relation to phosphorus and temperature. Mar. Ecol. Prog. Ser. 285, 3–9. doi: 10.3354/meps285003
Filella A., Umbricht J., Klett A., Vogts A., Vannier T., Grosso O., et al. (2024). Dissolved organic matter offsets the detrimental effects of climate change in the nitrogen-fixing cyanobacterium Crocosphaera. Limnology And Oceanography Lett. 229037, 296–306. doi: 10.1002/lol2.10380
Fu F. X., Mulholland M. R., Garcia N. S., Beck A., Bernhardt P. W., Warner M. E., et al. (2008). Interactions between changing pCO2, N2 fixation, and Fe limitation in the marine unicellular cyanobacterium Crocosphaera. Limnology Oceanography 53, 2472–2484. doi: 10.4319/lo.2008.53.6.2472
Fu F. X., Yu E., Garcia N. S., Gale J., Luo Y., Webb E. A., et al. (2014). Differing responses of marine N2 fixers to warming and consequences for future diazotroph community structure. Aquat. Microbial Ecol. 72, 33–46. doi: 10.3354/ame01683
Galmés J., Kapralov M. V., Copolovici L. O., Hermida-Carrera C., Niinemets (2015). Temperature responses of the Rubisco maximum carboxylase activity across domains of life: Phylogenetic signals, trade-offs, and importance for carbon gain. Photosynthesis Res. 123, 183–201. doi: 10.1007/s11120–014-0067–8
Gao K., Beardall J., Häder D. P., Hall-Spencer J. M., Gao G., Hutchins D. A. (2019). Effects of ocean acidification on marine photosynthetic organisms under the concurrent influences of warming, UV radiation, and deoxygenation. Front. Mar. Sci. 6. doi: 10.3389/fmars.2019.00322
Garcia N. S., Fu F. X., Hutchins D. A. (2013). Colimitation of the unicellular photosynthetic diazotroph Crocosphaera watsonii by phosphorus, light, and carbon dioxide. Limnology Oceanography 58, 1501–1512. doi: 10.4319/lo.2013.58.4.1501
Gattuso J., Epitalon J., Lavigne H., Orr J. (2023). _seacarb: seawater carbonate chemistry_ (R package version 3.3.2).
Glibert P. M., Wilkerson F. P., Dugdale R. C., Raven J. A., Dupont C. L., Leavitt P. R., et al. (2016). Pluses and minuses of ammonium and nitrate uptake and assimilation by phytoplankton and implications for productivity and community composition, with emphasis on nitrogen-enriched conditions. Limnology Oceanography 61, 165–197. doi: 10.1002/lno.10203
Goering J. J., Dugdale R. C., Menzel D. W. (1966). ESTIMATES OF IN SITU RATES OF NITROGEN UPTAKE BY TR1CHODESMIUM SP. IN THE TROPICAL ATLANTIC OCEAN. Limnology Oceanography 11, 614–620. doi: 10.4319/lo.1966.11.4.0614
Großkopf T., LaRoche J. (2012). Direct and indirect costs of dinitrogen fixation in Crocosphaera watsonii WH8501 and possible implications for the nitrogen cycle. Front. Microbiol. 3. doi: 10.3389/fmicb.2012.00236
Gruber N. (2011). Warming up, turning sour, losing breath: Ocean biogeochemistry under global change. Philos. Trans. R. Soc. A: Mathematical Phys. Eng. Sci. 369, 1980–1996. doi: 10.1098/rsta.2011.0003
Holl C. M., Montoya J. P. (2005). Interactions between nitrate uptake and nitrogen fixation in continuous cultures of the marine diazotroph Trichodesmium (Cyanobacteria). J. Phycology 41, 1178–1183. doi: 10.1111/j.1529–8817.2005.00146.x
Holmes R. M., Aminot A., Kerouel R., Hooker B. A., Peterson B. J. (1999). Fluorometric measurement of ammonium in marine and fresh water. Can J Fish Aquat Sci. 6, 1801–1808. doi: 10.1139/f99-128
Hong H., Shen R., Zhang F., Wen Z., Chang S., Lin W., et al. (2017). The complex effects of ocean acidification on the prominent N2-fixing cyanobacterium Trichodesmium. Science 356, 527–531. doi: 10.1126/science.aal2981
Hutchins D. A., Fu F. X., Zhang Y., Warner M. E., Feng Y., Portune K., et al. (2007). CO2 control of Trichodesmium N2 fixation, photosynthesis, growth rates, and elemental ratios: Implications for past, present, and future ocean biogeochemistry. Limnology Oceanography 52, 1293–1304. doi: 10.4319/lo.2007.52.4.1293
Hutchins D. A., Sañudo-Wilhelmy S. A. (2022). The enzymology of ocean global change. Annu. Rev. Mar. Sci. 14, 187–211. doi: 10.1146/annurev-marine-032221–084230
IPCC (Intergovernmental Panel on Climate Change) (2019). “The ocean and cryosphere in a changing climate,” in The ocean and cryosphere in a changing climate. Eds. Pörtner H.-O., Roberts D. C., Masson-Delmotte V., Zhai P., Tignor M., Poloczanska E., Mintenbeck K., Alegría A., Nicolai M., Okem A., Petzold J., Rama B., Weyer N. M. (Geneva, Switzerland: Cambridge University Press). doi: 10.1017/9781009157964
Junker J. P., Van Oudenaarden A. (2014). Every cell is special: Genome-wide studies add a new dimension to single-cell biology. Cell 157, 8–11. doi: 10.1016/j.cell.2014.02.010
Kirchman D. L. (1994). The uptake of inorganic nutrients by heterotrophic bacteria. Microbial Ecol. 28, 255–271. doi: 10.1007/BF00166816
Klawonn I., Bonaglia S., Whitehouse M. J., Littmann S., Tienken D., Kuypers M. M. M., et al. (2019). Untangling hidden nutrient dynamics: rapid ammonium cycling and single-cell ammonium assimilation in marine plankton communities. ISME J. 13, 1960–1974. doi: 10.1038/s41396–019-0386-z
Klawonn I., Lavik G., Böning P., Marchant H. K., Dekaezemacker J., Mohr W., et al. (2015). Simple approach for the preparation of 15–15N2-enriched water for nitrogen fixation assessments: Evaluation, application and recommendations. Front. Microbiol. 6. doi: 10.3389/fmicb.2015.00769
Knapp A. N., Dekaezemacker J., Bonnet S., Sohm J. A., Capone D. G. (2012). Sensitivity of Trichodesmium erythraeum and Crocosphaera watsonii abundance and N2 fixation rates to varying NO3– and PO43– concentrations in batch cultures. Aquat. Microbial Ecol. 66 (3), 223–236.
Korth F., Deutsch B., Liskow I., Voss M. (2012). Uptake of dissolved organic nitrogen by size-fractionated plankton along a salinity gradient from the North Sea to the Baltic Sea. Biogeochemistry 111, 347–360. doi: 10.1007/s10533–011-9656–1
Kranz S. A., Levitan O., Richter K. U., Prášil O., Berman-Frank I., Rost B. (2010). Combined effects of CO2 and light on the N2-fixing cyanobacterium Trichodesmium IMS101: Physiological responses. Plant Physiol. 154, 334–345. doi: 10.1104/pp.110.159145
Kranz S. A., Sültemeyer D., Richter K. U., Rost B. (2009). Carbon acquisition by Trichodesmium: The effect of pCO2 and diurnal changes. Limnology Oceanography 54, 548–559. doi: 10.4319/lo.2009.54.2.0548
Laufkötter C., Vogt M., Gruber N., Aita-Noguchi M., Aumont O., Bopp L., et al. (2015). Drivers and uncertainties of future global marine primary production in marine ecosystem models. Biogeosciences 12, 6955–6984. doi: 10.5194/bg-12–6955-2015
Levitan O., Brown C. M., Sudhaus S., Campbell D., LaRoche J., Berman-Frank I. (2010). Regulation of nitrogen metabolism in the marine diazotroph Trichodesmium IMS101 under varying temperatures and atmospheric CO2 concentrations. Environ. Microbiol. 12, 1899–1912. doi: 10.1111/j.1462–2920.2010.02195.x
Levitan O., Rosenberg G., Setlik I., Setlikova E., Grigel J., Klepetar J., et al. (2007). Elevated CO2 enhances nitrogen fixation and growth in the marine cyanobacterium Trichodesmium. Global Change Biol. 13, 531–538. doi: 10.1111/j.1365–2486.2006.01314.x
Li G., Cheng L., Zhu J., Trenberth K. E., Mann M. E., Abraham J. P. (2020). Increasing ocean stratification over the past half-century. Nat. Climate Change 10, 1116–1123. doi: 10.1038/s41558–020-00918–2
Luo Y.-W., Lima I. D., Karl D. M., Deutsch C. A., Doney S. C. (2014). Data-based assessment of environmental controls on global marine nitrogen fixation. Biogeosciences 11, 691–708. doi: 10.5194/bg-11–691-2014
Luo Y.-W., Shi D., Kranz S. A., Hopkinson B. M., Hong H., Shen R., et al. (2019). Reduced nitrogenase efficiency dominates response of the globally important nitrogen fixer Trichodesmium to ocean acidification. Nat. Commun. 10, 1–12. doi: 10.1038/s41467–019-09554–7
Martins B. M. C., Locke J. C. W. (2015). Microbial individuality: how single-cell heterogeneity enables population level strategies. Curr. Opin. Microbiol. 24, 104–112. doi: 10.1016/j.mib.2015.01.003
Masuda T., Furuya K., Kodama T., Takeda S., Harrison P. J. (2013). Ammonium uptake and dinitrogen fixation by the unicellular nanocyanobacterium crocosphaera watsonii in nitrogen-limited continuous cultures. Limnology Oceanography 58, 2029–2036. doi: 10.4319/lo.2013.58.6.2029
Masuda T., Inomura K., Kodama T., Shiozaki T., Kitajima S., Armin G., et al. (2022). Crocosphaera as a major consumer of fixed nitrogen. Microbiol. Spectr. 10, e02177–21. doi: 10.1128/spectrum.02177–21
Matantseva O., Skarlato S., Vogts A., Pozdnyakov I., Liskow I., Schubert H., et al. (2016). Superposition of individual activities: Urea-mediated suppression of nitrate uptake in the dinoflagellate prorocentrum minimum revealed at the population and single-cell levels. Front. Microbiol. 7. doi: 10.3389/fmicb.2016.01310
Mills M. M., Ridame C., Davey M., La Roche J., Geider R. J. (2004). Iron and phosphorus co-limit nitrogen fixation in the eastern tropical North Atlantic. Nature 429, 292–294. doi: 10.1038/nature02550
Mohr W., Großkopf T., Wallace D. W. R., LaRoche J. (2010). Methodological underestimation of oceanic nitrogen fixation rates. PloS One 5, 1–7. doi: 10.1371/journal.pone.0012583
Montoya J. P., Voss M., Ka P., Capone D. G. (1996). A simple, high-precision, high-sensitivity tracer assay for N 2 fixation. Appl. Environ. Microbiol. 62, 986–993. doi: 10.1128/aem.62.3.986-993.1996
Mulholland M. R., Capone D. G. (1999). Nitrogen fixation, uptake and metabolism in natural and cultured populations of Trichodesmium spp. Mar. Ecol. Prog. Ser. 188, 33–49. doi: 10.3354/meps188033
Mulholland M. R., Ohki K., Capone D. G. (1999). Nitrogen utilization and metabolism relative to patterns of N2 fixation in populations of Trichodesmium from the North Atlantic Ocean and Caribbean Sea. Mar. Ecol. Prog. Ser. 188, 33–49. doi: 10.3354/meps188033
Mulholland M. R., Ohki K., Capone D. G. (2001). Nutrient controls on nitrogen uptake and metabolism by natural populations and cultures of Trichodesmium (Cyanobacteria). J. Phycology 37, 1001–1009. doi: 10.1046/j.1529–8817.2001.00080.x
Ohki K., Zehr J. P., Falkowski P. G., Fujita Y. (1991). Regulation of nitrogen-fixation by different nitrogen sources in the marine non-heterocystous cyanobacterium Trichodesmium sp. NIBB1067. Arch. Microbiol. 156, 335–337. doi: 10.1007/BF00248706
Polerecky L., Adam B., Milucka J., Musat N., Vagner T., Kuypers M. M. M. (2012). Look@NanoSIMS - a tool for the analysis of nanoSIMS data in environmental microbiology. Environ. Microbiol. 14, 1009–1023. doi: 10.1111/j.1462–2920.2011.02681.x
Polerecky L., Masuda T., Eichner M., Rabouille S., Vancová M., Kienhuis M. V. M., et al. (2021). Temporal patterns and intra- and inter-cellular variability in carbon and nitrogen assimilation by the unicellular cyanobacterium cyanothece sp. ATCC 51142. Front. Microbiol. 12. doi: 10.3389/fmicb.2021.620915
Pujo-Pay M., Raimbault P. (1994). Improvement of the wet-oxidation procedure for simultaneous determination of particulate organic nitrogen and phosphorus collected on filters. Mar. Ecol. Prog. Ser. 105, 203. doi: 10.3354/meps105203
R Core Team (2023). R: A language and environment for statistical computing (Vienna, Austria: R Foundation for Statistical Computing). Available at: https://www.R-project.org.
Raven J. A., Geider R. J. (1988). Temperature and algal growth. New Phytol. 110, 441–461. doi: 10.1111/j.1469–8137.1988.tb00282.x
Regaudie-de-Gioux A., Duarte C. M. (2012). Temperature dependence of planktonic metabolism in the ocean. Global Biogeochemical Cycles 26. doi: 10.1029/2010GB003907
Sañudo-Wilhelmy S. A., Kustka A. B., Gobler C. J., Hutchins D. A., Yang M., Lwiza K., et al. (2001). Phosphorus limitation of nitrogen fixation by Trichodesmium in the central Atlantic Ocean. Nature 411, 66–69. doi: 10.1038/35075041
Sarmiento J. L., Slater R., Barber R., Bopp L., Doney S. C., Hirst A. C., et al. (2004). Response of ocean ecosystems to climate warming. Global Biogeochemical Cycles 18. doi: 10.1029/2003GB002134
Shao Z., Xu Y., Wang H., Luo W., Wang L., Huang Y., et al. (2023). Global oceanic diazotroph database version 2 and elevated estimate of global oceanic N2 fixation. Earth System Sci. Data 15, 3673–3709. doi: 10.5194/essd-15-3673-2023
Shi D., Kranz S. A., Kim J. M., Morel F. M. M. (2012). Ocean acidification slows nitrogen fixation and growth in the dominant diazotroph Trichodesmium under low-iron conditions. Proc. Natl. Acad. Sci. United States America 109, E3094–E3100. doi: 10.1073/pnas.1216012109
Steinacher M., Joos F., Frölicher T. L., Bopp L., Cadule P., Cocco V., et al. (2010). Projected 21st century decrease in marine productivity: A multi-model analysis. Biogeosciences 7, 979–1005. doi: 10.5194/bg-7–979-2010
Sun J., Liu D. (2003). Geometric models for calculating cell biovolume and surface area for phytoplankton. J. Plankton Res. 25 (11), 1331–1346. doi: 10.1093/plankt/fbg096
Tang W., Li Z., Cassar N. (2019). Machine learning estimates of global marine nitrogen fixation. J. Geophysical Research: Biogeosciences 124 (3), 717–730.
Thompson P. A., Levasseur M. E., Harrison P. J. (1989). Light-limited growth on ammonium vs nitrate: What is the advantage for marine phytoplankton? Limnology Oceanography 34, 1014–1024. doi: 10.4319/lo.1989.34.6.1014
Verity P. G., Robertson C. Y., Tronzo C. R., Andrews M. G., Nelson J. R., Sieracki M. E. (1992). Relationships between cell volume and the carbon and nitrogen content of marine photosynthetic nanoplankton. Limnology Oceanography 37 (7), 1434–1446. doi: 10.4319/lo.1992.37.7.1434
Walworth N. G., Fu F. X., Lee M. D., Cai X., Saito M. A., Webb E. A., et al. (2018). Nutrient-colimited Trichodesmium as a nitrogen source or sink in a future ocean. Appl. Environ. Microbiol. 84, 1–14. doi: 10.1128/AEM.02137–17
Waterbury J. B., Rippka R. (1989). “Cyanobacteria. subsection i. order chroococcales,” in Bergey’s manual of systematic bacteriology, vol. 3 . Eds. Krieg N. R., Holt &J.B. (Baltimore), 1728–1746.
Waterbury J. B., Willey J. M. (1988). “Isolation and growth of marine planktonic cyanobacteria,” in Methods in enzymology (Academic Press), 100–105.
Webb E. A., Ehrenreich I. M., Brown S. L., Valois F. W., Waterbury J. B. (2009). Phenotypic and genotypic characterization of multiple strains of the diazotrophic cyanobacterium, Crocosphaera watsonii, isolated from the open ocean. Environ. Microbiol. 11, 338–348. doi: 10.1111/j.1462-2920.2008.01771.x
Wrightson L., Tagliabue A. (2020). Quantifying the impact of climate change on marine diazotrophy: insights from earth system models. Front. Mar. Sci. 7. doi: 10.3389/fmars.2020.00635
Zehr J. P. (2011). Nitrogen fixation by marine cyanobacteria. Trends Microbiol. 19, 162–173. doi: 10.1016/j.tim.2010.12.004
Keywords: nitrogen fixation, ocean warming, ocean acidification, nitrogen assimilation, Crocosphaera, minicosm experiment
Citation: Umbricht J, Filella A, Klett A, Vogts A, Benavides M and Voss M (2024) Uptake of dissolved inorganic nitrogen and N2 fixation by Crocosphaera watsonii under climate change scenarios. Front. Mar. Sci. 11:1388214. doi: 10.3389/fmars.2024.1388214
Received: 19 February 2024; Accepted: 07 June 2024;
Published: 25 June 2024.
Edited by:
Thomas Browning, Helmholtz Association of German Research Centres (HZ), GermanyReviewed by:
Takako Masuda, Japan Fisheries Research and Education Agency, JapanZuozhu Wen, Xiamen University, China
Copyright © 2024 Umbricht, Filella, Klett, Vogts, Benavides and Voss. This is an open-access article distributed under the terms of the Creative Commons Attribution License (CC BY). The use, distribution or reproduction in other forums is permitted, provided the original author(s) and the copyright owner(s) are credited and that the original publication in this journal is cited, in accordance with accepted academic practice. No use, distribution or reproduction is permitted which does not comply with these terms.
*Correspondence: Maren Voss, bWFyZW4udm9zc0Bpby13YXJuZW11ZW5kZS5kZQ==