 Paulina Huanca-Valenzuela
 Jacob A. Cram
 Clara A. Fuchsman
- Horn Point Laboratory, University of Maryland Center for Environmental Science, Cambridge, MD, United States
Introduction: Assimilation of reduced nitrogen is less energetically costly than assimilation of oxidized forms. In the open ocean, ammonium is generally absent from the water column, including in oxygen-deficient zones (ODZs). Some microorganisms can use alternative organic reduced nitrogen forms like urea and cyanate, as indicated by the presence of cyanase (cynS) and urease (ureC) genes.
Methods: Here we examine the Hawaii Ocean Time series, two stations in the Eastern Tropical South Pacific ODZ and one in the Eastern Tropical North Pacific ODZ, using phylogenetic read placement of metagenomic reads to define the proportion of each taxon capable of using cyanate and/or urea in oxic and anoxic environments.
Results: An improved phylogenetic tree found that Thioglobaceae and Verrucomicrobia had the capability to use urea. Our detailed examination of all the microbial groups able to use cyanate and urea illuminated that niche differentiation, an adaptation to minimize competition, determines chosen nitrogen sources, partitioning by depth and oxygen. Urease genes were found in Picocyanobacteria and SAR11 in surface waters, Thaumarchaeota and Nitrospina in deep waters, Thioglobaceae and Cand. Scalindua in ODZs, and Verrucomicrobia in the deep oxycline. In the ODZs, the percentage of Anammox bacteria that contained cynS was double that of those containing ureC, and their cynS transcripts were abundant, indicating a preference for cyanate over urea.
Discussion: While Prochlorococcus could utilize cyanate in the deep chlorophyll maximum, in the ODZs, Prochlorococcus uses nitrite rather than compete with Cand. Scalindua for cyanate, even though cyanate is present. SAR11 and Prochlorococcus may compete for urea in surface waters, but for SAR11, the presence of ureC was negatively correlated with nitrate concentration (p = 10−17), with ~ 40% of SAR11 genomes containing the ureC gene in oxic surface waters but none at depth, indicating that SAR11 bacteria switched to using nitrate when available. In the oxycline above the ODZ, where Thaumarchaeota and Nitrospina both could use urea, 50% of Nitrospina were also able to use cyanate, and their cyanase transcripts were present. This use of dissolved organic N should allow a higher biomass of N-cycling microbes and higher N-transformation rates than in a system competing for ammonia only.
Introduction
Oxygen-deficient zones (ODZs) are regions of the ocean that naturally have < 10 nM oxygen (Revsbech et al., 2009; Tiano et al., 2014). However, the oxygen content of the Pacific Ocean has been decreasing since the 1980s, and ODZs are expanding (Stramma et al., 2008; Horak et al., 2016; Ito et al., 2017). Ocean ODZs host 30%–50% of marine fixed-N loss (DeVries et al., 2013). In ODZs, bacteria and archaea utilize nitrate and nitrite as electron donors instead of oxygen (Lam et al., 2009), leading to N2 production by heterotrophic denitrification (Org. C + 2NO3− → N2 + CO2) and Anammox (NO2 + NH4+ → N2) (Dalsgaard et al., 2012; Babbin et al., 2014). Anammox is considered linked to denitrification in a 30% to 70% ratio because Anammox needs the ammonia produced by denitrification (Devol, 2003). However, measured rates do not always follow these proportions (Babbin et al., 2020). Ammonium concentrations are extremely low in both ODZs and the oxic oligotrophic ocean (< 10 nM), probably because of consumption by phytoplankton in surface waters, efficient scavenging by ammonia-oxidizing Thaumarchaeota in oxic deeper waters, and Anammox bacteria in ODZs (Priddle et al., 1997; Martens-Habbena et al., 2009; Widner et al., 2018a). It has been modeled that competition for ammonia between Anammox and nitrite-oxidizing bacteria causes oscillations in the volume of anoxic water and the amount of N loss in ODZs (Penn et al., 2019). Utilization of organic nitrogen provides an adaptive capacity for accessing reduced nitrogen pools other than ammonium. Urea and cyanate are two examples of small, reduced organic N sources.
Urea (CH4N2O) is a reduced nitrogen compound that is produced both as an excretion product by crustacean and gastropod zooplankton (Miller and Glibert, 1998; Pitt et al., 2009; Thibodeau et al., 2020) and as a part of organic matter degradation (Cho et al., 1996; Berman et al., 1999). Microorganisms can metabolize urea by using the enzyme urease, encoded by the gene ureC, which catalyzes urea hydrolysis (Hausinger, 2004). In the Atlantic, urea averaged 25%–30% of total N uptake and was generally maximal in the euphotic zone (Painter et al., 2008). In the oxic waters above the Eastern Tropical North Pacific (ETNP) ODZ, uptake experiments using dual 13C and 15N isotopically labeled urea demonstrated that the N in urea was preferentially assimilated over the carbon, indicating that organisms were using urea as a N source (Widner et al., 2018a).
Urea concentrations are typically in the nanomolar range (50–350 nM) (Painter et al., 2008; Kitzinger et al., 2019; Takeda et al., 2020). Urea in the subtropical North Pacific (HOT) ranged from 50 to 150 nM in the top 200 m, with a maximum at the chlorophyll maximum (Takeda et al., 2020). In the ETNP, urea concentrations as high as 1.5 µM were found at coastal stations, but concentrations were much lower offshore (generally 0–150 nM) (Widner et al., 2018a). At the station examined further here, measurements of urea showed that urea was generally absent from the water column, with concentrations below the detection limit (b.d.l.; 70 nM) until 958 m in the oxycline below the ODZ, where urea concentration reached 0.71 µM, possibly due to zooplankton migrating to that depth (Widner et al., 2018a).
Cyanate is a small organic form of reduced nitrogen (OCN−) that can be produced abiotically from photoproduction, biotic organic matter degradation, and senescent algal cultures (Widner et al., 2016). Cyanase (cynS) is an enzyme that catalyzes the conversion of cyanate to CO2 and ammonia (Johnson and Anderson, 1987). In the marine environment, cyanate is measured in the nanomolar concentration range using a recently developed chromatographic method (Widner et al., 2013). Therefore, cyanate concentrations have only been measured in a few places in the ocean, such as the coastal North Atlantic (0.4 nM to 11 nM; Widner and Mulholland, 2017), the Gulf of Mexico (median 11.5 nM; Kitzinger et al., 2019), and the ETNP and ETSP ODZs. In the oxic ocean, the cyanate vertical distribution resembles the vertical distribution of ammonium and nitrite, with a primary maximum right below the chlorophyll maximum (Widner et al., 2016). In the ETSP and ETNP, cyanate uptake was observed in the euphotic zone, although it accounted for less than 2% of total N uptake (Widner et al., 2018b, 2018a). Cyanate uptake was also detected in the upper ETNP ODZ but was lower than 0.4 nM/h (Widner et al., 2018a). In the ETSP, cyanate concentrations along a transect at 17°S ranged from below detection (0.4 nM) to 45 nM in oxic waters, but concentrations in the ODZ only reached 7 nM (Widner et al., 2018b). In the ETNP ODZ, cyanate concentrations were much higher, ranging from below detection to 50 nM in the upper ODZ (Widner et al., 2018a).
Most microorganisms prefer ammonia over nitrate for assimilation because reducing oxidized N compounds, like nitrate, for use in proteins or DNA has an extra energy cost (Glibert et al., 2016). As primary producers, picocyanobacteria Prochlorococcus and Synechococcus need to obtain N from inorganic sources but can also use the small organic compounds cyanate and urea (Rocap et al., 2003; Kamennaya and Post, 2011). In oligotrophic regions, Picocyanobacteria contribute greatly to primary production (Rii et al., 2016). Prochlorococcus ecotypes and abundances change dramatically in depth profiles, with highlighted ecotypes in the surface, Low Light I in the middle of the euphotic zone and Low Light II and Low Light IV at the bottom (Ahlgren et al., 2006; Johnson et al., 2006; Zinser et al., 2007). Specific ecotypes (Low Light V, AMZ3) of Prochlorococcus live at the top of ODZs when > 1% blue light overlaps with anoxic water (Cepeda-Morales et al., 2009; Ulloa et al., 2021). In the ETNP ODZ, all of the Prochlorococcus contained the gene for urease but not cyanase; only an extremely small proportion of Low Light I Prochlorococcus contained the gene for cyanase above the ODZ (Widner et al., 2018a). However, the proportion of Prochlorococcus that can use urea and cyanate in the environment, outside the ETNP, has not been quantified.
In the ocean, many microbial groups that contain the urease or cyanase gene have been shown to have key roles in the nitrogen cycle. Three key N-cycling microbes can use both urea and cyanate. First, some cultured isolates of Thaumarchaeota were found to have urease and can use urea as a sole N source (Qin et al., 2014). In the environment, Thaumarchaeota can use urea degradation to fuel the dissimilatory process of ammonia oxidation to obtain energy along with carbon assimilation (Tolar et al., 2017; Shiozaki et al., 2021). The presence of ureC is widespread in Thaumarchaeota genomes, with 60%–100% of Thaumarchaeota in the coastal time series SPOT and in the ETNP (Ahlgren et al., 2017; Widner et al., 2018a). However, in the Gulf of Mexico, only between 10% and 15% of Thaumarchaeota cells contain the ureC gene, indicating that not all Thaumarchaeota have urease (Kitzinger et al., 2019). Thaumarchaeota can also grow on cyanate as the only energy and nitrogen source but do not have the cyanase gene (Palatinszky et al., 2015), so we cannot presently trace this ability in the population. Secondly, some Nitrospina single-cell genomes were found to contain genes for urea and cyanate degradation (Pachiadaki et al., 2017). The marine nitrite-oxidizing bacteria Nitrospina are aerobic and obligate chemolithotrophs that oxidize nitrite to nitrate and use CO2 as the sole C-source (Spieck et al., 2014). In the ETNP ODZ, Nitrospina had one copy per genome of urease at the top of the ODZ, but only ~ 50% of Nitrospina had cyanase (cynS) (Widner et al., 2018a). Thirdly, cyanase was found in the first Cand. Scalindua genome (van de Vossenberg et al., 2013). Cand. Scalindua are free-living bacteria (Fuchsman et al., 2017, 2012) that undergo the Anammox process, producing N2 gas. Later, single-cell genomes of Cand. Scalindua were found to also have genes for urea transport and urease (Ganesh et al., 2018). Cand. Scalindua possessed one copy of the cyanase gene per genome in the ETNP and were the only bacteria able to use cyanate in the ODZ (Widner et al., 2018a). When dual 13C and 15N isotopically labeled cyanate was used by Anammox bacteria in the ETNP ODZ, the C in cyanate was assimilated but the N was not, indicating dissimilatory use of the N (Widner et al., 2018a). Experimental data in the ETSP ODZ showed that Anammox N2 production rates could be supported by the N in cyanate (Babbin et al., 2017). Urea could only stimulate Anammox N2 production rates after a 1.5-day lag time, indicating that the Anammox bacteria were not utilizing the urea in situ at the time of sampling (Babbin et al., 2017). Thus, urea and cyanate have the potential to be important reactants for microbes mediating the marine N cycle.
Stable isotope probing has indicated that some SAR11 can utilize urea in Arctic surface waters (Connelly et al., 2014), and isolates of estuarine ecotypes of SAR11 also can assimilate urea (Lanclos et al., 2023). SAR11 is an abundant growing group of free-living marine heterotrophic Alphaproteobacteria with small cells and streamlined genomes (Morris et al., 2002; Rappe et al., 2002; Giovannoni et al., 2005). The fact that SAR11 can utilize urea is particularly interesting, as most of the microbes that use urea and cyanate as N sources are autotrophic (Widner et al., 2018a). Although SAR11 in oxic waters utilizes oxygen, SAR11 bacteria in ODZs encode genes for nitrate reductase of the narG variety, and different SAR11 ecotypes live in ODZs compared to oxic waters (Tsementzi et al., 2016). In the ETNP ODZ, ~ 10% of SAR11 contained the urease gene (ureC) (Widner et al., 2018a). However, the use of urea by SAR11 has not otherwise been investigated in the oligotrophic ocean.
Some eukaryotic algae also have the ability to use cyanate. Analysis of marine planktonic metatranscriptomes from TARA oceans (global ocean sampling at three depths) has shown that cynS transcripts were as prevalent as those for ureC (Mao et al., 2022). In the large size fraction (> 0.8 µm), various eukaryotic algae produced cynS transcripts, including Pelagophytes, Dinophytes, Bacillariophyta, and fungi. In the smaller size fraction (< 0.8 µm), Synechococcus cynS transcripts dominated surface waters, whereas Prochlorococcus and unclassified microbes contributed to the cynS transcripts at the deep chlorophyll maximum (DCM) (Mao et al., 2022). The abundance of cynS transcripts negatively correlated with dissolved inorganic N concentrations (Mao et al., 2022). Although total cynS transcripts were reduced in the mesopelagic region compared to the euphotic zone, Nitrospina cynS transcripts were found in the mesopelagic region (Mao et al., 2022).
In this paper, we use phylogenetic read placement of metagenomic reads to examine the spatial distribution of microbes that utilize urea and cyanate at 3 ODZ stations and three sampling dates from the oxic Hawaii Ocean Time Series (HOT) station in the subtropical North Pacific. The study of the proportions and abundance of cyanase cynS and urease ureC has been previously reported in and above the ETNP ODZ (Widner et al., 2018a). However, since 2017, sequences of ureC previously classified as “unknown” have been assigned to new taxonomic groups. The phylogenetic tree for urease was significantly improved here to include genes from Cand. Scalindua (Anammox) single-cell genomes (Ganesh et al., 2018), S-oxidizing Thioglobus isolates (Marshall and Morris, 2015; Shah and Morris, 2015), and Verrucomicrobia and Alphaproteobacteria MAGs (Sun and Ward, 2021; Zhang et al., 2023), increasing the number of microbes with known biogeochemical functions examined. Additionally, we complete the ETNP metagenomic profile, first published in 2017, by adding new metagenomes covering the bottom of the ODZ and the deep oxycline. Our detailed examination of all the microbial groups with the ability to use cyanate and urea illuminates that niche differentiation rather than direct competition determines gene depth profiles.
Methods
The metagenomic reads from the genes ureC and cynS were extracted from the metagenomic databases of interest (ETSP, ETNP, and HOT), and subsequently placed and aligned by using phylogenetic read placement methods onto phylogenetic trees containing aligned amino acid sequences of urease or cyanase enzymes of known taxonomic groups (Supplementary Figures S1, S2). Once the reads were placed in the tree, we classified the reads according to the taxonomy of the sequence of known taxonomic groups. We then estimated the ratio of ureC and/or cynS to the housekeeping gene RNA polymerase (rpoB). The ratio ureC/rpoB and cynS/rpoB were expressed as % of the total prokaryotic community (Archaea + Bacteria) or as the total of specific microbial taxa across depth profiles at each station.
Compilation of metagenomic data
Metagenomes from microbial communities were obtained from publicly available datasets across four station locations in the Pacific (Figure 1). Detailed depth profiles of cellular metagenomes from St ALOHA were obtained as part of the Hawaii Ocean Time-series (HOT) (22°45°N and 158°W) for May (HOT 272), August (HOT 275), and November 2015 (HOT 278) and were downloaded from Bioproject PRJNA352737 (Luo et al., 2020). Nutrient and CTD measurements for these cruises can be downloaded with the Hawaii Ocean Time Series Data Organization and Graphical System (HOT-DOGS) application at the University of Hawai’i at Mānoa (https://hahana.soest.hawaii.edu/hot/hot-dogs/) and in the supplement to the original paper (Luo et al., 2020). For Eastern Tropical South Pacific (ETSP) Station 9 (13°S and 82.2°W) and Station 17 (16.7°S and 79°W) sampled in July 2013, metagenomes were obtained from Bioproject PRJNA704804 (Fuchsman et al., 2022). Hydrographic and nutrient data from this ETSP cruise have previously been published (Peters et al., 2018; Fuchsman et al., 2022). Cyanate data from this ETSP cruise were published, but urea was not measured (Widner et al., 2018b) (Supplementary Figure S3). Metagenomes from ETNP Station 136 (17.04°N, 106.54°W) in April 2012 can be found in Bioproject PRJNA350692 (Fuchsman et al., 2017), and nutrient data for ETNP ST136 can be seen in Fuchsman et al. (2017). Cyanate and urea concentration data from this ETNP cruise are published (Widner et al., 2018a), and data for ST136 is included here (Supplementary Figure S4). Temperature, salinity, and nutrient metadata for all samples can be found in Supplementary Table S1.
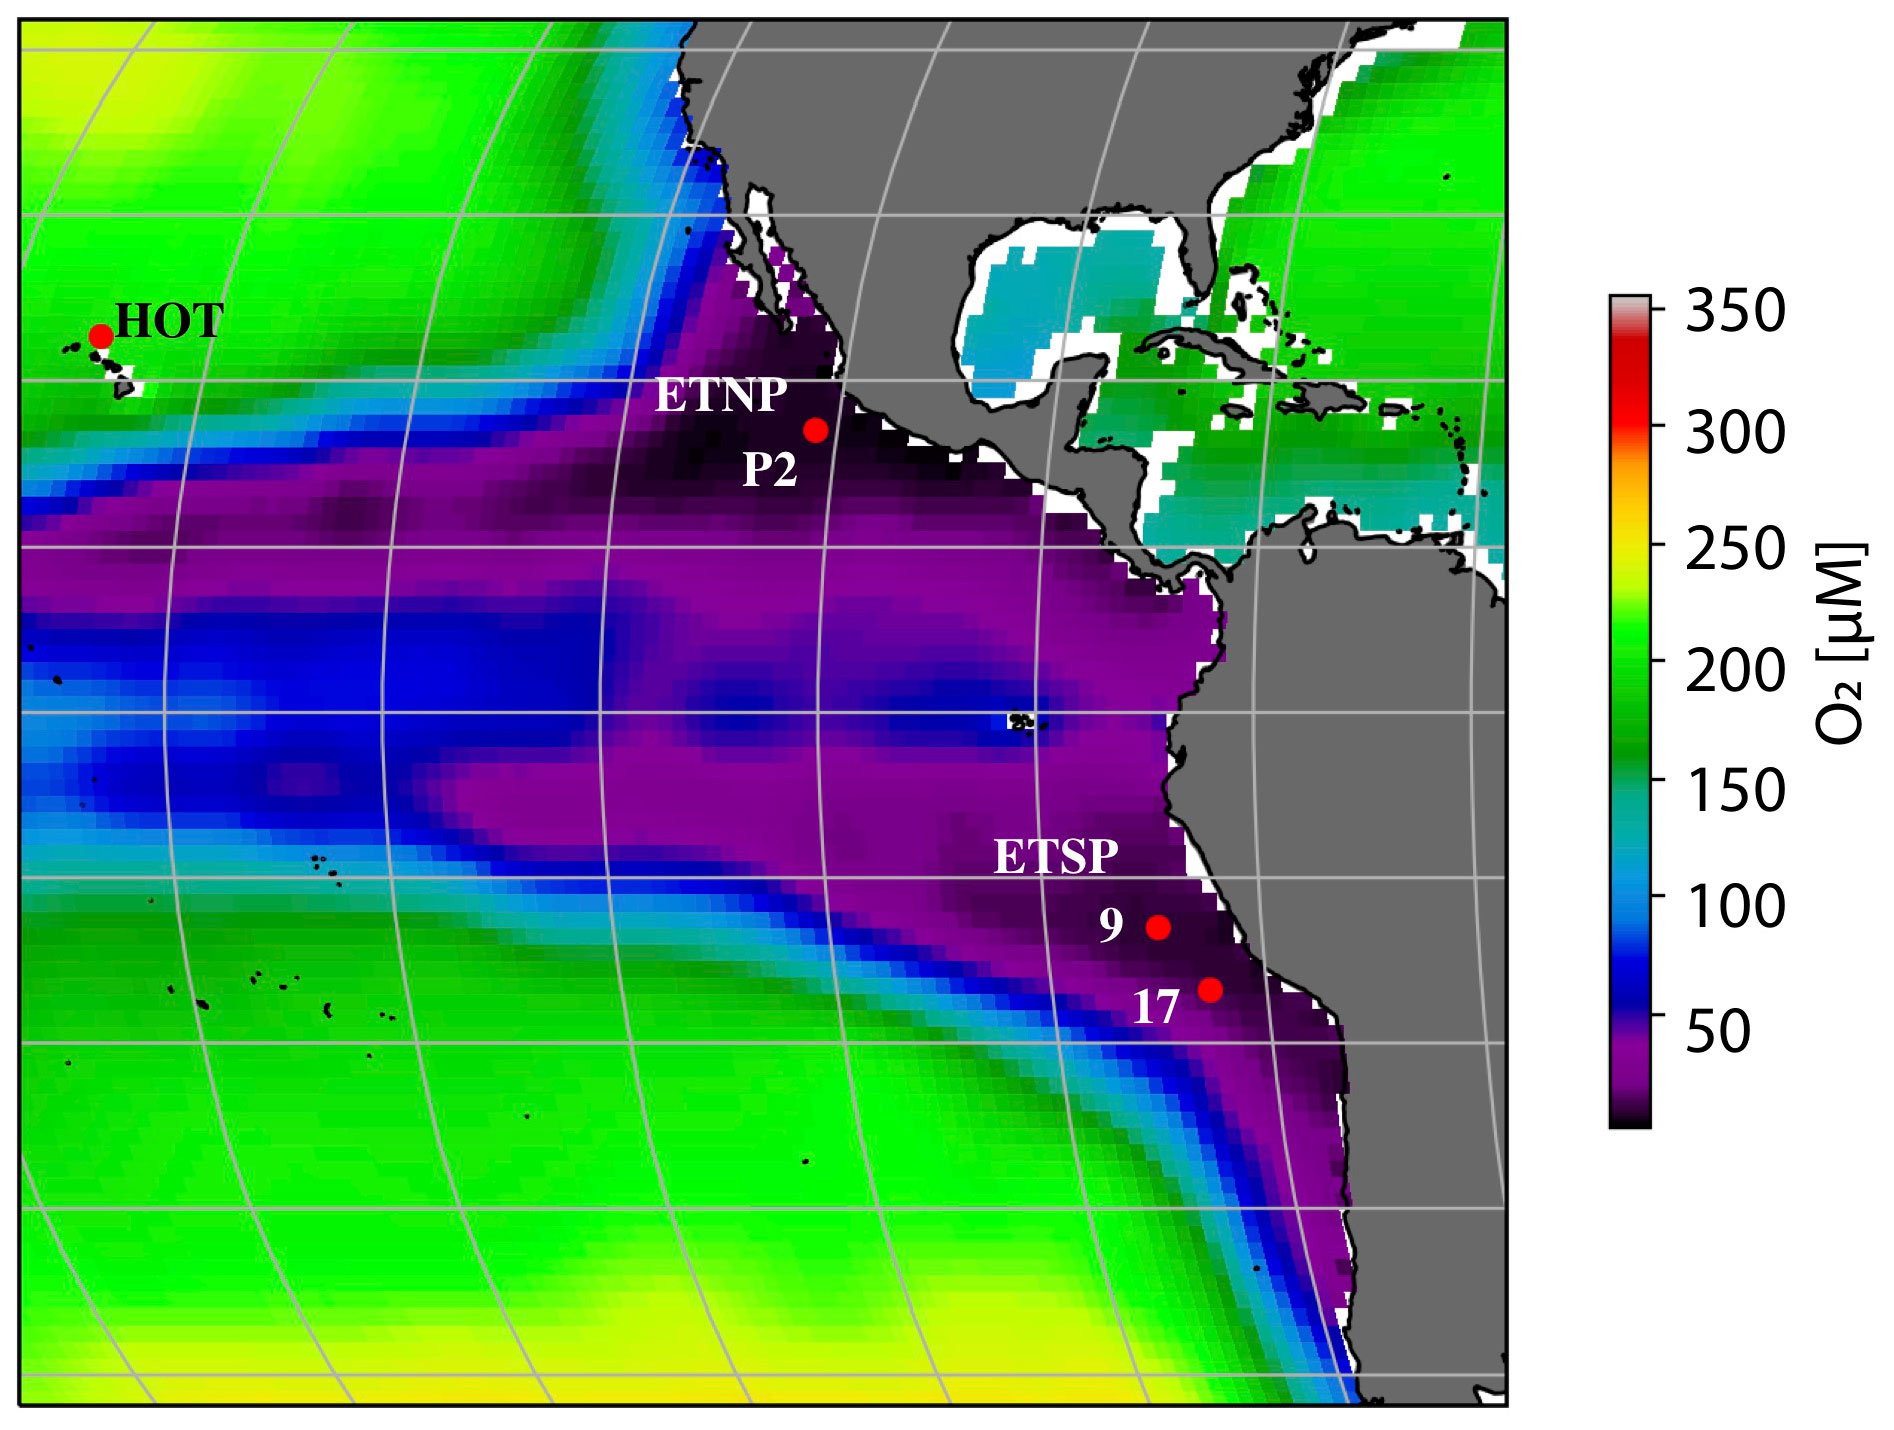
Figure 1 Location of the stations. Map of World Ocean Atlas 2018 oxygen concentration at 250 m (Garcia et al., 2019). The color scale indicates oxygen concentration (in µM], and the red dots indicate station locations for the Hawaii Time Series (HOT; oxic), and ODZ stations are from the ETNP (P2) and ETSP (ST9 and ST17).
In this paper, we add five metagenomes to existing ETNP ST136 (600 m [deep ODZ], 800 m [ODZ boundary], 1,000 m [hypoxic]) and ETSP ST17 (80 m [oxic], 125 m [hypoxic]) depth profiles. As described in Fuchsman et al. (2017, 2022), 4 L of water from the CTD was filtered through 0.2 µm SUPOR filters on board the ship and immediately frozen at -80°C. These filters were extracted in June 2023, following the protocol in Fuchsman et al. (2017); DNA was extracted from filters using freeze–thaw followed by incubation with lysozyme and proteinase K and phenol/chloroform extraction. Libraries were created and run on a NovaSeq 6000 at the Northwest Genomics Center (Seattle, WA). The two new ETSP metagenomes can be found with the rest of the 2013 ETSP metagenomes at Bioproject PRJNA704804, but the three new 2012 ETNP metagenomes are in Bioproject PRJNA1083228.
All ETSP samples, new and old, were assembled separately, and assemblies are available at Bioproject PRJNA704804. Samples were quality-screened using Trimmomatic v0.39 (Bolger et al., 2014) and assembled using Megahit v1.2.8 (Li et al., 2015). To find the genes of interest in the assembled contigs, genes were called and annotated with Prokka 1.14.6 (Seemann, 2014). Sequence information about the new metagenomes can be found in Supplementary Table S2.
Transcripts of sequences corresponding to station P2 (16°55 N, 107°09 W) in the ETNP in May 2018 were obtained from the oxycline and top of the ODZ (76–150 m) (Mattes et al., 2022), downloaded from BioProject PRJNA727903, and processed following the same methodology described below. These transcript samples were sampled over multiple days at the station, and thus, due to variations such as internal waves, oxygen concentrations from the samples do not change linearly with depth (Mattes et al., 2022). STP2 is geographically close to ETNP ST136, examined for metagenomes.
Phylogenetic read placement technique
Phylogenetic trees for urease (ureC) (Supplementary Figure S1) and cyanase (cynS) (Supplementary Figure S2) from Widner et al. (2018a) and nitrite oxidoreductase (nxrB) from Fuchsman et al. (2017) were updated using assembled sequences from the ETSP, marine single-cell genomes (Berube et al., 2018), and eukaryotic assemblies from the MMETSP (Keeling et al., 2014). Hydrazine oxidoreductase (hzo) data have already been published (Fuchsman et al., 2022). Nitrate reductase gene (narG) data for Thioglobaceae was obtained using a phylogenetic tree modified by Fuchsman et al. (2017).
The RNA polymerase (rpoB) phylogenetic tree has already been published (Fuchsman and Hays, 2023). A set of reference amino acid sequences (encoding for the genes nxrB, ureC, and cynS separately) were used as a query to be blasted against custom databases for the assembled protein ETSP 2013 dataset and for single-celled genomes and eukaryotic assemblies using blastp (Altschul et al., 1997). References and assembled sequences were aligned using MUSCLE v3.8.1551 (Edgar, 2004). The alignment was used to build a phylogenetic tree with bootstrapping using RAxML-ng (Kozlov et al., 2019) and later visualized using FigTree v1.4.4 (https://github.com/rambaut/figtree/releases). The tree constructed using RAxML-ng was used as the reference frame to place the metagenomic reads from the ETSP, ETNP, and HOT datasets.
As described previously (Fuchsman et al., 2023), read placement was done by recruiting short metagenomic reads via a tblastn search of the metagenomes (using an e-value of ≤ 5). The reads were trimmed to remove Ns and converted to amino acid sequences. After the quality trimming, only sequences longer than 100 bp (33 amino acids) were kept. The amino acid-translated reads were then aligned against the reference sequences using PaPaRa 2.0 (Berger and Stamatakis, 2011). The nonoverlapping paired read ends were then combined into one sequence in the same alignment using a Python script, and they were later placed in the tree using EPA-ng v0.3.6 with filter-max as 1 (Barbera et al., 2019). Placed reads have a pendant length, indicating the similarity between a query read and the location it places on the tree. Reads that were placed with a pendant length greater than 2 were removed; 1% or less of reads were removed at this step. To sort the reads into taxonomic groups, the reads in each group were enumerated using the assigned subcommand of Gappa v0.6.1 and a taxonomy file listing the taxonomy of the tree reference sequences (Czech et al., 2020). Taxonomic read counts were normalized using the method previously described by Fuchsman et al. (2019) where normalization factors for each sample were determined by dividing 48,556,135 (the number of reads in the 100-m ETNP sample) by the number of good-quality reads in the sample. The read counts were multiplied by the sample normalization factor, divided by the gene length (1,704 base pairs (bp) for ureC, 468 bp for cynS, 3847 bp for rpoB, and 1,275 bp for nxrB), and then multiplied by 100 to make visualization easier. We refer to these numbers as normalized reads. We then calculated the percentage of the total microbial community containing cynS and ureC by dividing the normalized reads for cynS or ureC by the combined Bacteria- and Archaea-normalized reads for single-copy core gene RNA polymerase (rpoB). Similarly, we calculated the proportions of individual taxa containing cynS or ureC by dividing by rpoB normalized reads for that taxa. The numerical results from these analyses can be found in Supplementary Table 3.
The errors in these analyses can be broken into three types of error. For HOT 272 (May 2015), 700 m and 1,000 m samples were sequenced twice. Our analysis of these duplicate samples produced almost identical results; the average standard deviation between ureC groups was 0.05 normalized reads for 700 m and 0.15 normalized reads for 1,000 m. These data indicated that we have good reproducibility. However, there are two systemic caveats to this analysis: (1) some organisms may be missing from the phylogenetic trees, and (2) gene lengths vary between organisms. In the case of incomplete phylogenetic trees, it is less accurate to place sequences when there are no near relatives to that sequence. We have minimized this source of error by building trees both with known genomes and with environmentally assembled contigs. In terms of length variability, any differences between organisms’ genes and our estimates of gene length will result in misestimated gene ratios. However, the magnitude of such an error is small: the average length of reference genes composing the trees here were cynS = 460 bp ± 40 bp, ureC = 1,706 bp ± 23 bp, and rpoB = 3,815 bp ± 333 bp. RNA polymerase (rpoB) was the longest gene with the most variability. This variability in rpoB would change a proportion of ureC/rpoB of 100% by ± 10%.
Results
In this paper, we describe the proportion of the community harboring ureC or cynS from functional gene/single-copy core gene ratios, with the understanding that this value is complicated by functional gene copies per cell. For HOT, the ureC/rpoB ratios were > 100% of the microbial prokaryotic community (Bacteria and Archaea) in surface waters (top 100 m depth), indicating that many organisms harbored more than one ureC gene per cell. This value decreased to ~ 30% in the mesopelagic, indicating that 30% or fewer organisms harbored this gene. In the ODZs, ~ 30% of the community had ureC, but below the ETNP ODZ and at 80 m in the ETSP ST17, ~ 60% of the community had the ureC gene. Some microbial groups containing ureC were present in both the ODZs and oxic sampling dates, like Nitrospina, Thaumarchaeota, and Picocyanobacteria. However, at the ODZ stations, we observed more diverse groups containing ureC than at HOT, including Anammox bacteria (Cand. Scalindua), Verrucomicrobia, and members of the Gammaproteobacteria, including Thioglobus (Figure 2A).
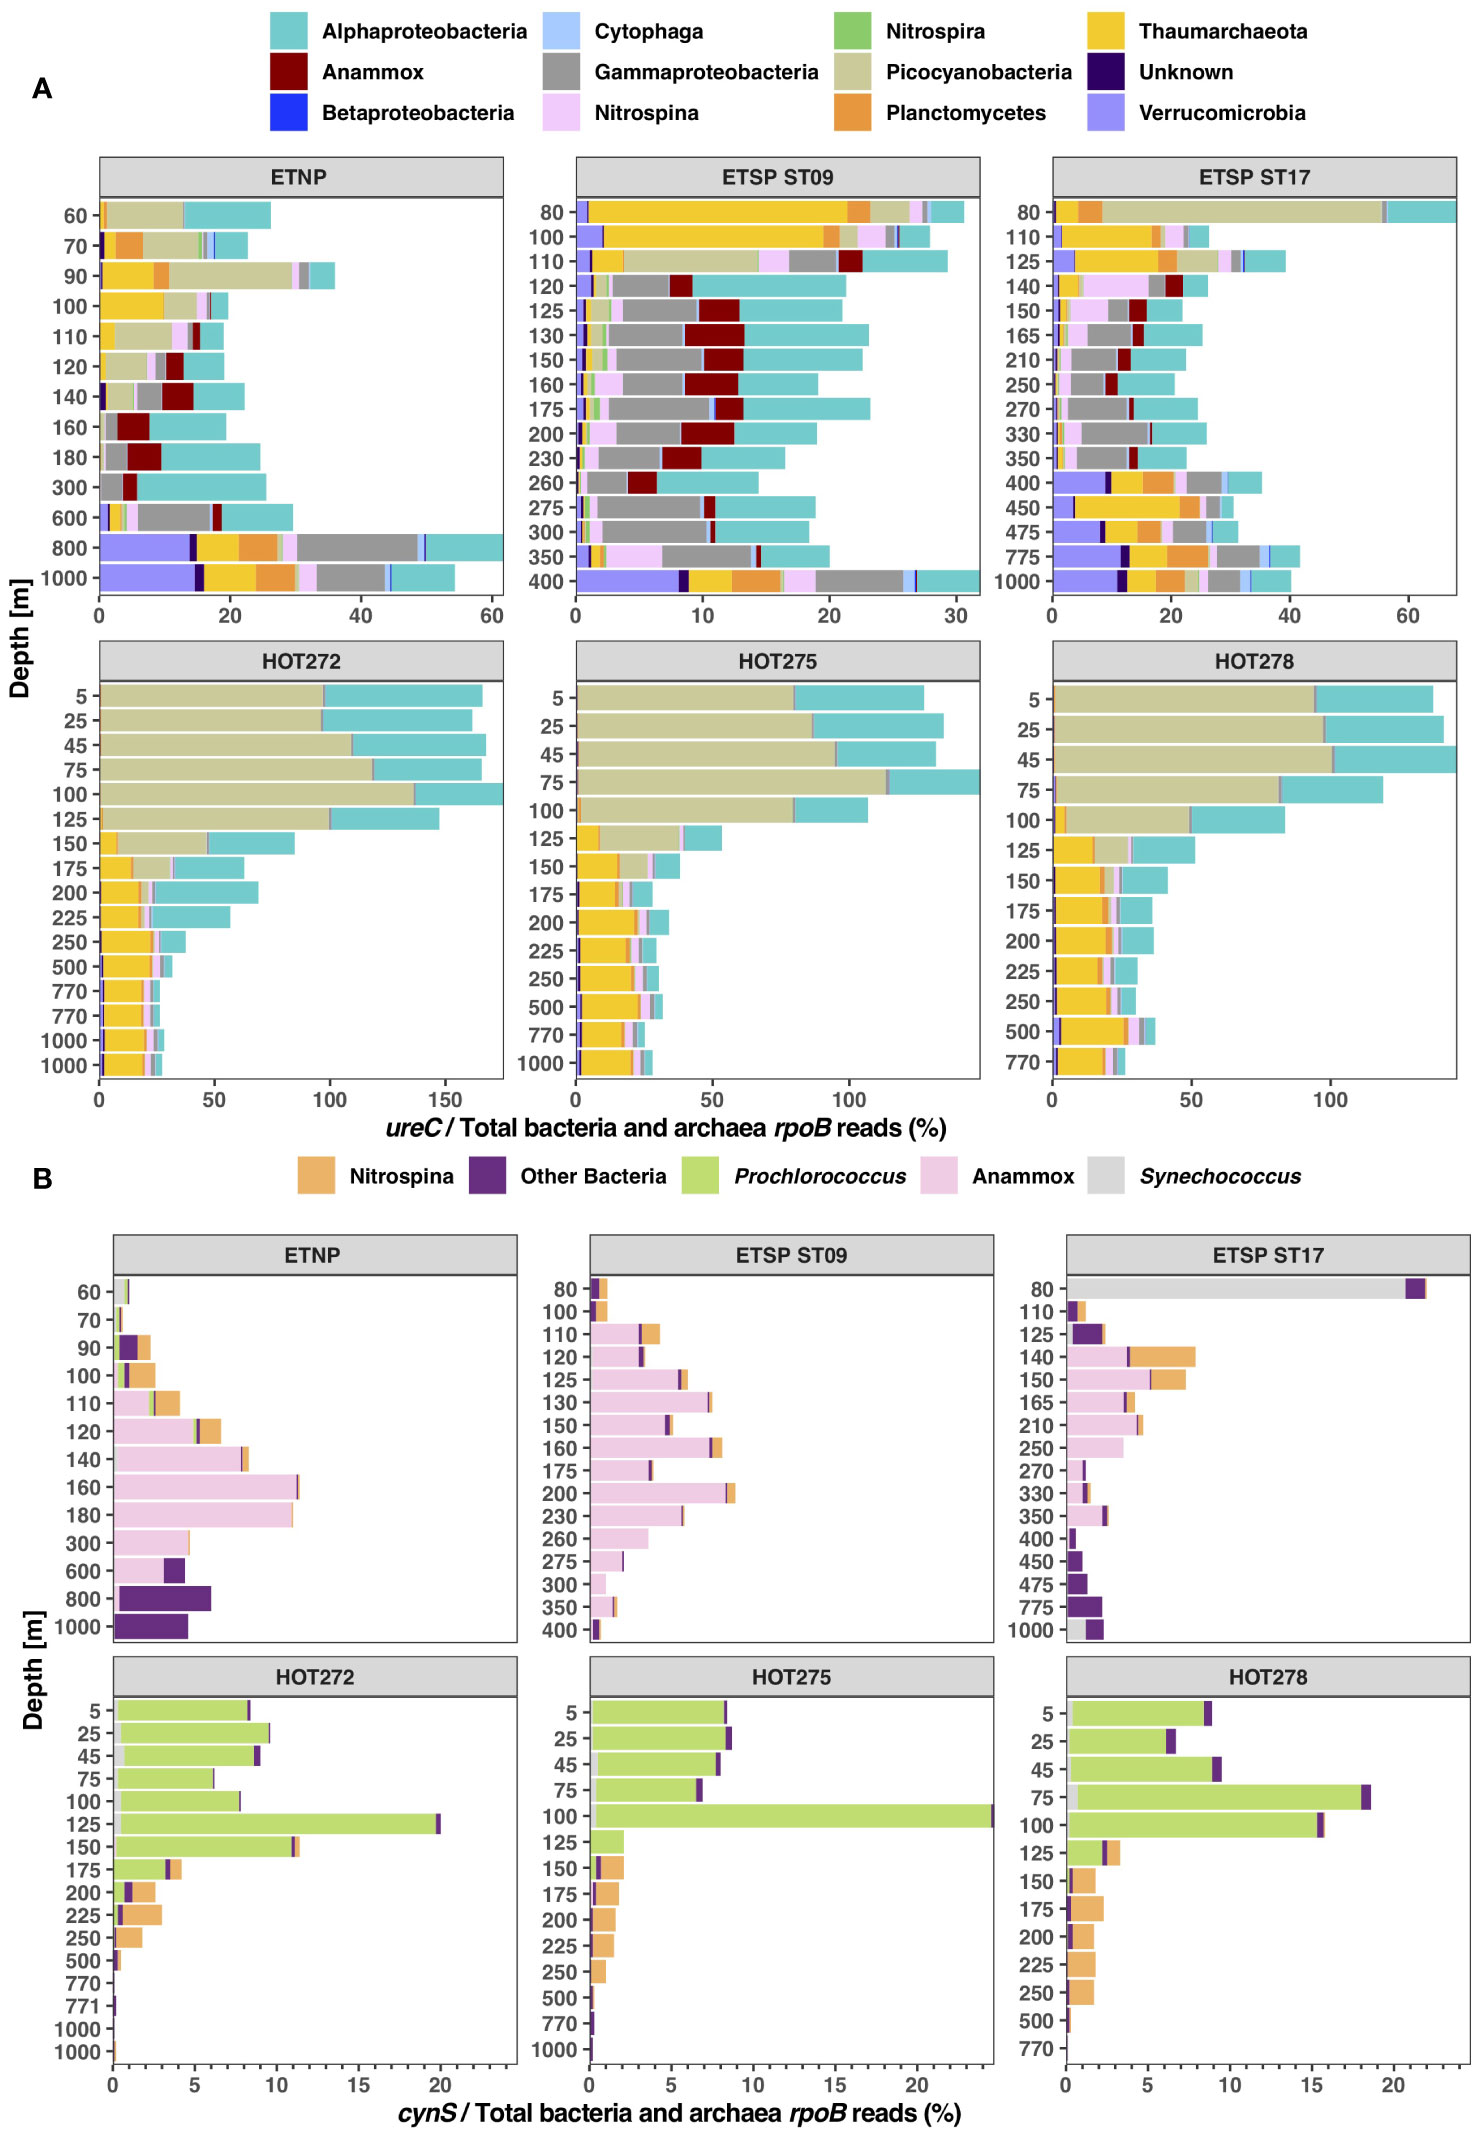
Figure 2 Abundance of urease and cyanase in the total microbial community. Stacked bar charts showing (A) the ratio of total ureC reads/total bacterial and archaeal rpoB reads in percentage, and (B) the ratio of total cynS reads/total bacterial and archaeal rpoB reads in percentage, classified by taxonomic groups according to depth at ODZ stations (ETNP, ETSP ST09, ETSP ST17) and HOT 272 (May), 275 (Aug), and 278 (Nov). The depth is not to scale.
At HOT, up to 25% of the total bacterial and archaeal communities had cynS genes at the DCM, but 8%–10% of the community had cynS in most of the upper euphotic zone, decreasing to < 2% from 150 to 250 m and to < 0.5% in the mesopelagic. The majority of cynS reads correspond to Prochlorococcus; for example, at HOT 275 (August 2015), Prochlorococcus cynS reached 24.1% of the total community at 100 m. Nitrospina cynS was present at depth, reaching 1.4% at 150 m. In the mesopelagic zone at HOT, < 1% of the community contained the cynS gene. In the ODZs, less than 12% of the total bacterial and archaeal communities had cynS genes (Figure 2B). Among the ODZ microbial communities, the highest abundance of cynS corresponded to Cand. Scalindua (Anammox), with up to 11.1% of the community in the ETNP at 160 m (Figure 2B). The second highest abundant cynS gene was “other bacteria”, a group of unclear taxonomy including many proteobacteria but also single representatives from other phyla such as Nitrospira and Verrucomicrobia (Supplementary Figure S2). The other bacteria cynS group was mostly found in the oxyclines above and below the ODZs. When examined on an individual reference level, the majority of the other bacteria reads placed on environmental assembled contigs with a minority placed on Alteromonas. The highest abundance of Nitrospina cynS was 4% of the total microbial community at 140 m at ETSP station 17, the top of the ODZ at that station (Figure 2B). Synechococcus cynS was dominant at ETSP ST17 80 m, a fully oxic depth, reaching 20% of the community. We also checked the presence of cynS in eukaryotic groups like algae. Eukaryotic algae could not be normalized to a percent of the bacterial and archaeal communities and are thus are examined separately. At the ODZ stations, we only found algae cynS above the ODZs: 11 normalized reads at 70 m depth at ETNP station 136, four normalized reads from ETSP station 9 at 80 m, and seven reads at 80 m from ETSP ST17 (Supplementary Figure S5). At HOT, algae cynS reads were found at the DCM, with three algae cynS normalized reads in the 125–150-m range for HOT 272, six to nine algae cynS normalized reads at 100–125 m depth for HOT 275, and four algae cynS normalized reads in the 75–100-m range for HOT 278 (Supplementary Figure S5). The algae cynS normalized reads at HOT, ETSP ST9, and the ETNP were from Pelagomonales, but at ETSP ST17, five reads were Pelagomonales, but two were Phaeocystis. Though present, algae cynS were never abundant.
Proportion of taxa harboring functional genes
In this section, we will describe the ratios of taxon-specific functional genes ureC and cynS to taxon-specific rpoB reads for a variety of groups important to biogeochemical cycling. We also explore the proportions of the taxon-specific functional genes nitrite oxidoreductase (nxrB; Nitrospina), nitrate reductase (narG; Thioglobaceae) and hydrazine oxidoreductase (hzo; Anammox) to support our taxon-specific rpoB data.
Anammox cynS, ureC, and hzo
Anammox bacteria were found only in the ODZ core. The abundance of Anammox, measured by rpoB gene copy number, was highest in the ETNP station, comprising up to ~ 10% of the prokaryotic community at 300 m, but decreased at the bottom of the ODZ. In contrast, its total abundance peaked at 6% for both ETSP stations (Figure 3A). Anammox bacteria have both ureC and cynS genes. Anammox cynS games are usually almost twice as abundant as Anammox ureC genes within each depth (Figure 3B). In the ETNP ODZ, the highest Anammox cynS to rpoB ratio was 116.4% at 180 m, while the ureC to rpoB ratio was 56.1%. At the ETSP ODZ station 17, the cynS abundance was 157% of Anammox bacteria, versus 80.5% of ureC reads at 210 m. The highest abundance of cynS reads was found in the ETSP ST9, with 177.6% cynS reads and 80.5% ureC reads at 275 m. The gene for hydrazine oxidoreductase (hzo, a key gene in the Anammox process) showed similar patterns and abundance to the cynS gene in the ETSP stations (Figure 3B); however, in the ETNP and the ETSP ST17, the abundance of hzo was lower than that of cynS at some depths in the ODZ core.
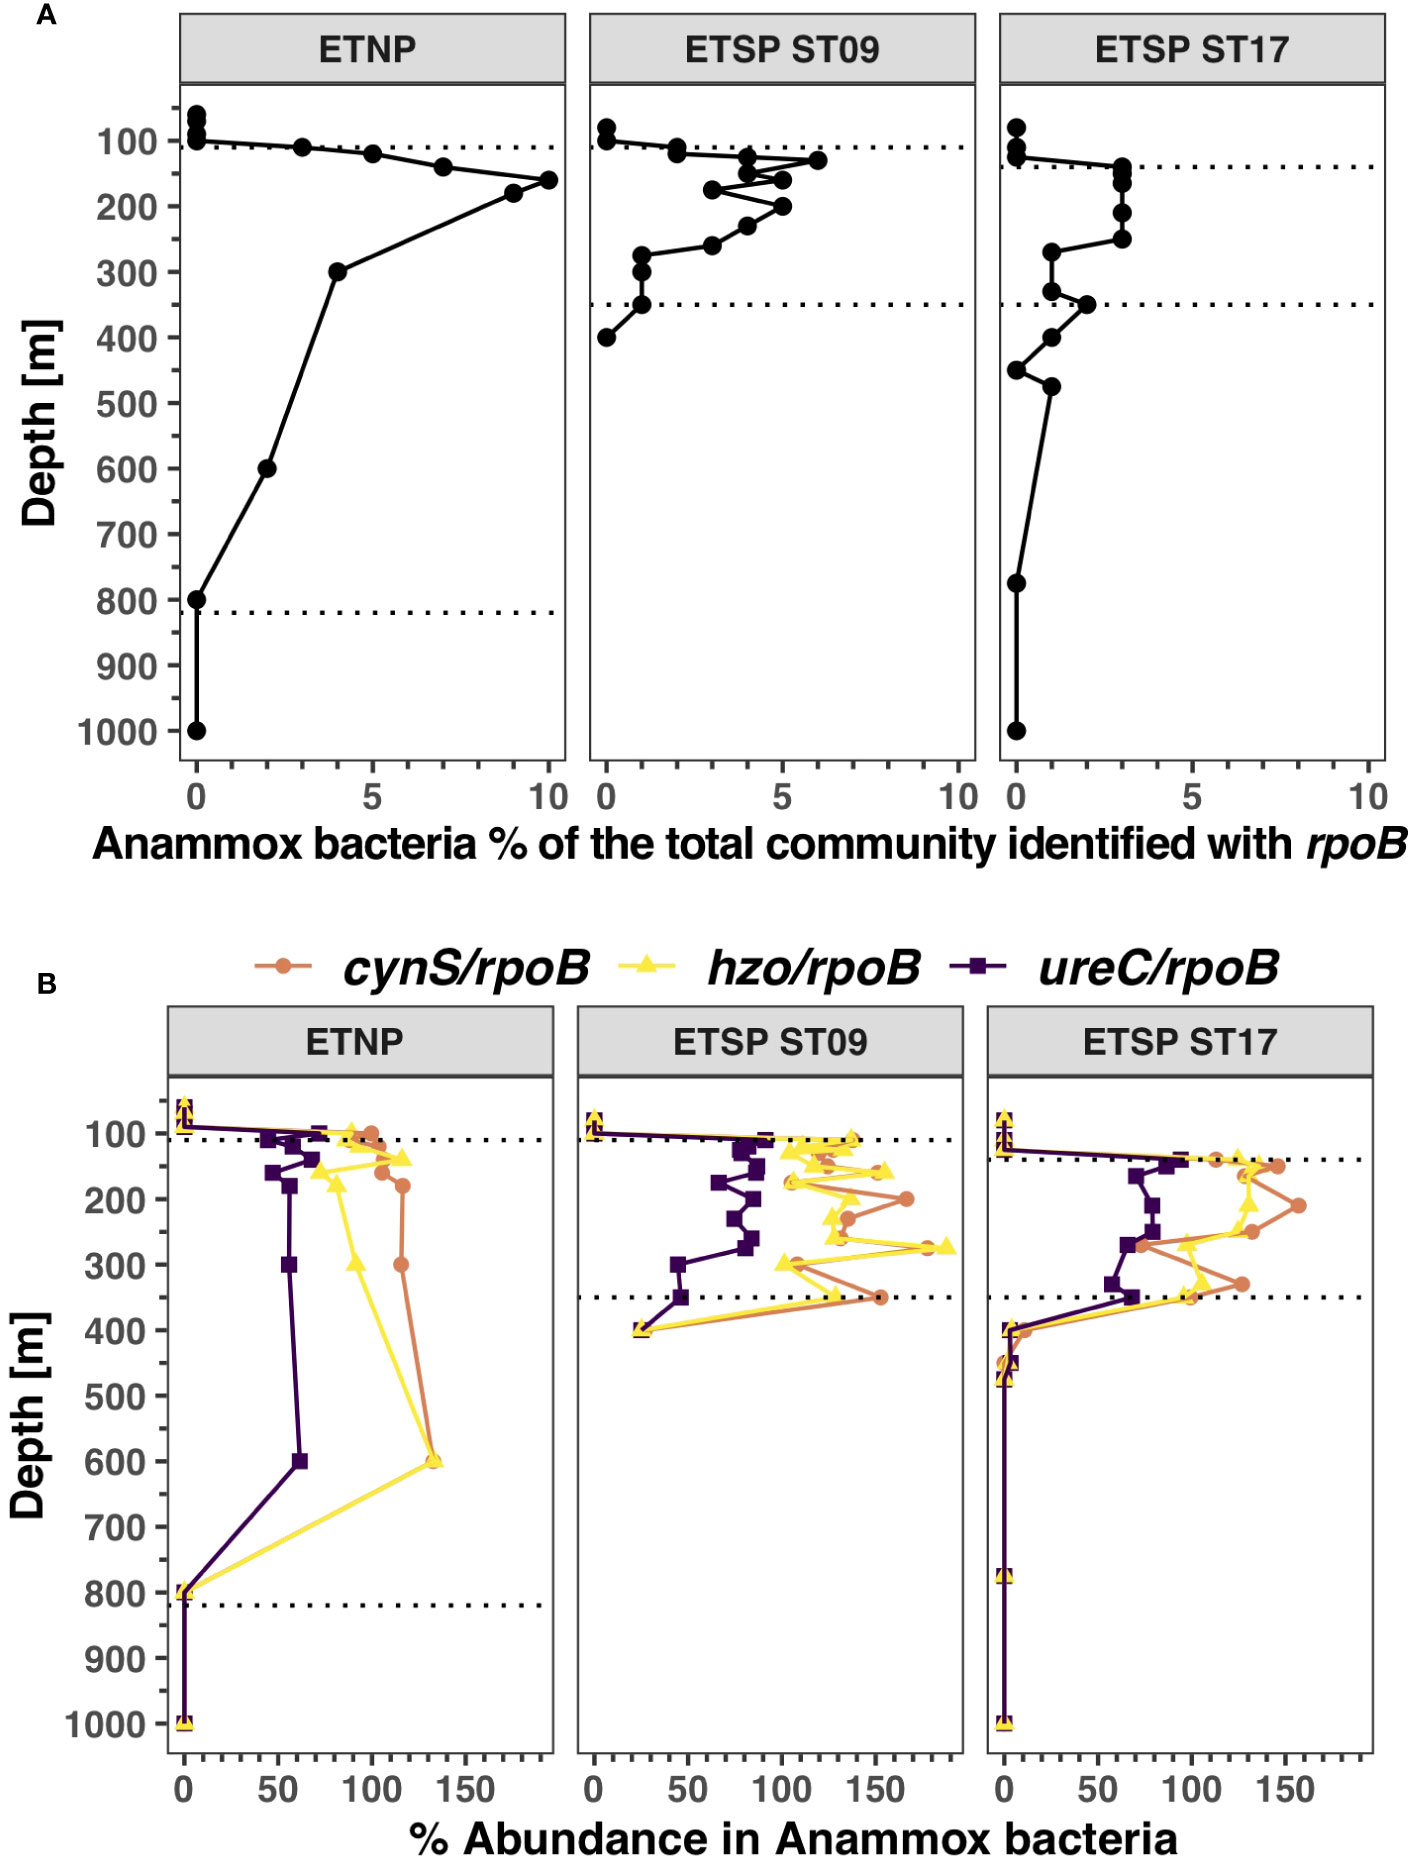
Figure 3 Distribution of Anammox bacteria and its functional genes in ODZs. (A) Percentage of the bacterial and archaeal community identified as Anammox bacteria (Cand. Scalindua) using RNA polymerase (rpoB). (B) Functional gene abundance in Anammox bacteria for cyanase (cynS), urease (ureC), and hydrazine oxidoreductase (hzo) as Anammox-specific cynS/rpoB ratios (orange), hzo/rpoB ratios (yellow), and ureC/rpoB ratios (purple). Each panel corresponds to a different ocean region. The area between the dotted lines corresponds to the ODZ core.
Nitrospina cynS, ureC, and nxrB
The abundance of Nitrospina (Figure 4A) estimated using the rpoB gene was highest in the ODZ ETSP station 17, reaching 11.4% of the prokaryotic community at 140 m, which was the oxic/anoxic transition. The abundance of Nitrospina was below 6% of the prokaryotic community in the other two ODZ stations and was below 3% at HOT. The Nitrospina community has both genes cynS and ureC, but a higher proportion of Nitrospina had ureC than cynS in the ODZ and at HOT (Figure 4B). Within the sampling dates at HOT, the proportion of Nitrospina with ureC varied between 77.1% and 161.3%, and for cynS, varied between 37.4% to 118.8% in the top 250 m, but there was a marked decrease in the proportion of Nitrospina with cynS at depth, with values of 2%–3% at 750 m and below (Figure 4B; Supplementary Figure S6). In the ETNP station, the abundance of ureC was also higher than cynS; the cynS reads were between 25.9% and 63.4% and ureC was ~ 100% of Nitrospina (Figure 4B). In the ETSP ODZ ST9, ureC reads were between 46% and 107.8% and cynS reads were between 2.6% and 45.8%. The proportion of both cynS and ureC genes was lower than the proportion of the gene nitrite oxidoreductase (nxrB) (Figure 4B), a key gene in the nitrite oxidation pathway in Nitrospina, which is often found at two copies per genome (Lücker et al., 2013; Fuchsman et al., 2017).
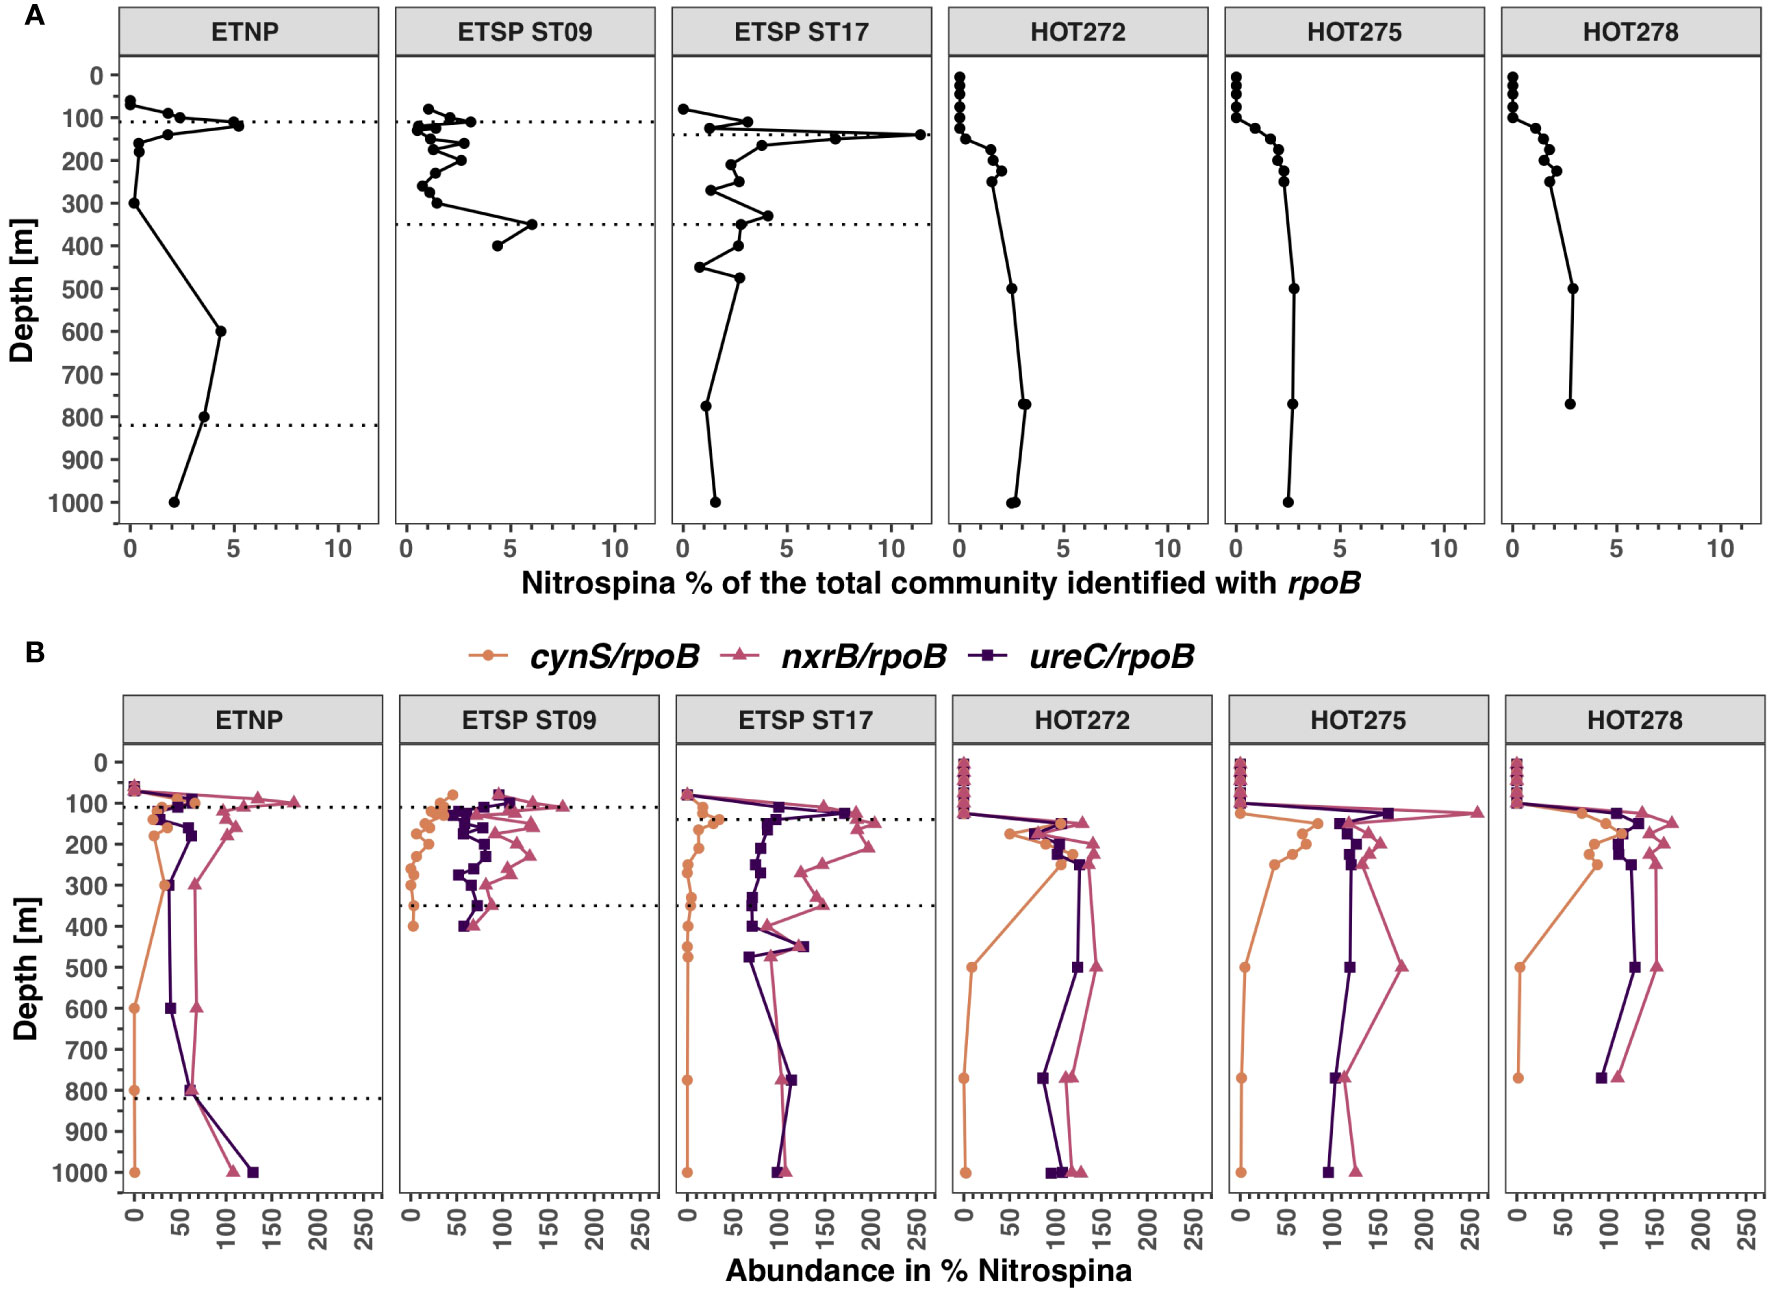
Figure 4 Distribution of Nitrospina and its functional genes in ODZs and HOT. (A) Percentage of the bacterial and archaeal community identified as Nitrospina using RNA polymerase (rpoB). (B) Abundance of cyanase, nitrite oxidoreductase, and urease in % of Nitrospina for cynS/rpoB ratios (orange), nxrB/rpoB ratios (pink), and ureC/rpoB ratios (purple). Each panel corresponds to a different ocean region. The area between the dotted lines corresponds to the ODZ core.
Thioglobaceae ureC
The abundance of Thioglobaceae estimated using the rpoB was higher in the mesopelagic (Figure 5A). At the ETSP stations, Thioglobaceae reached ~ 11% of the prokaryotic community in the ODZ, but only reached 5.6% in the ETNP ODZ. At HOT, Thioglobaceae reached 7% of the prokaryotic community with a maximum at 500 m (Figure 5A). Using the rpoB gene, the Thioglobaceae group was composed of subclades SUP05, Arctic-96BD19, and a new ODZ clade (phylogenetic tree; Supplementary Figure S7). The ODZ clade had the highest abundance, reaching 10.7% of the community at ETSP ST9 at 350 m and 10.5% at 350 m at ETSP ST17 (Figure 6). Similarly, in the ETNP, the ODZ clade was the most abundant, increasing from 1.6% at 110 m to a maximum of 5% of the community at 300 m depth, but then decreasing at the bottom of the ODZ (Figure 6). Additionally, we observe that the Thioglobaceae in the ODZ contained nitrate reductase (narG). In the ETNP, narG was approximately one copy per genome, but in the ETSP, it was approximately two copies per genome (Figure 5B). Given the ecotype abundances, we can conclude that the ODZ Thioglobaceae clade can reduce nitrate. At all three ODZ stations, the Arctic-96BD19 clade was abundant in the hypoxic oxyclines above and below the ODZs but was generally < 1% of the community in the ODZ. For example, at ETSP ST17, the abundance of the Arctic-96BD19 was 5.6% at 110 m in hypoxic oxycline above the ODZ and 7.7% at 450 m in hypoxic oxycline below the ODZ, but < 1% of the community in the ODZ. The sulfide-oxidizing SUP05 clade had a low abundance (< 1.4%) in all the ODZ stations. At HOT, only the Arctic-96BD19 clade was present, with abundances that increased with depth from 0.4% of the community at 150 m to a maximum of 8% at 500 m and then decreased to 2% at 1000 m (Figure 6).
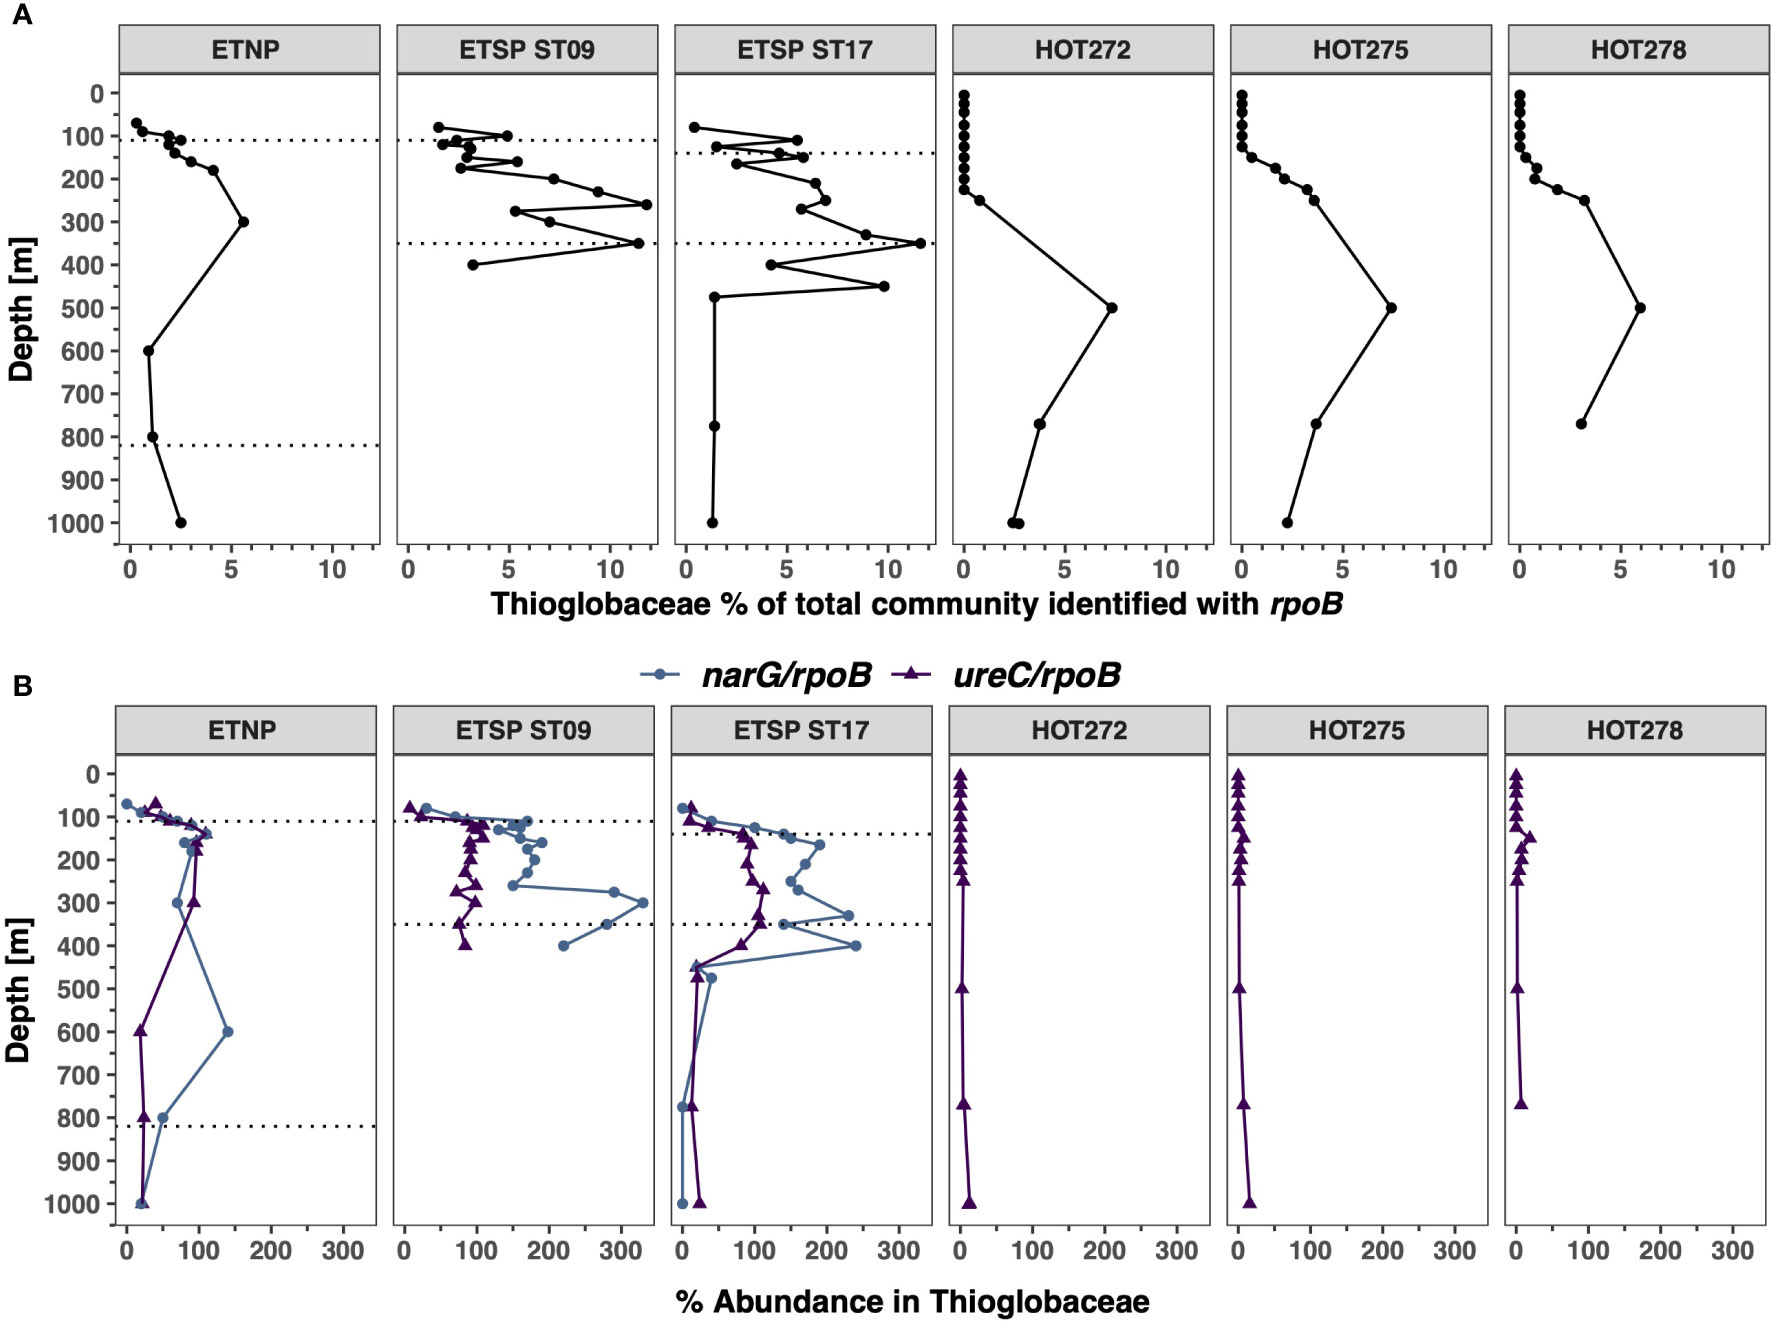
Figure 5 Distribution of Thioglobaceae and its functional genes in ODZs and HOT. (A) Abundance of the Thioglobaceae in % of the total bacterial and archaeal community identified with rpoB. (B) Abundance of urease and nitrate reductase in % of Thioglobaceae for ureC/rpoB ratios (purple) and narG/rpoB ratios (blue). Each panel corresponds to a different ocean region. The area between the dotted lines corresponds to the ODZ core.
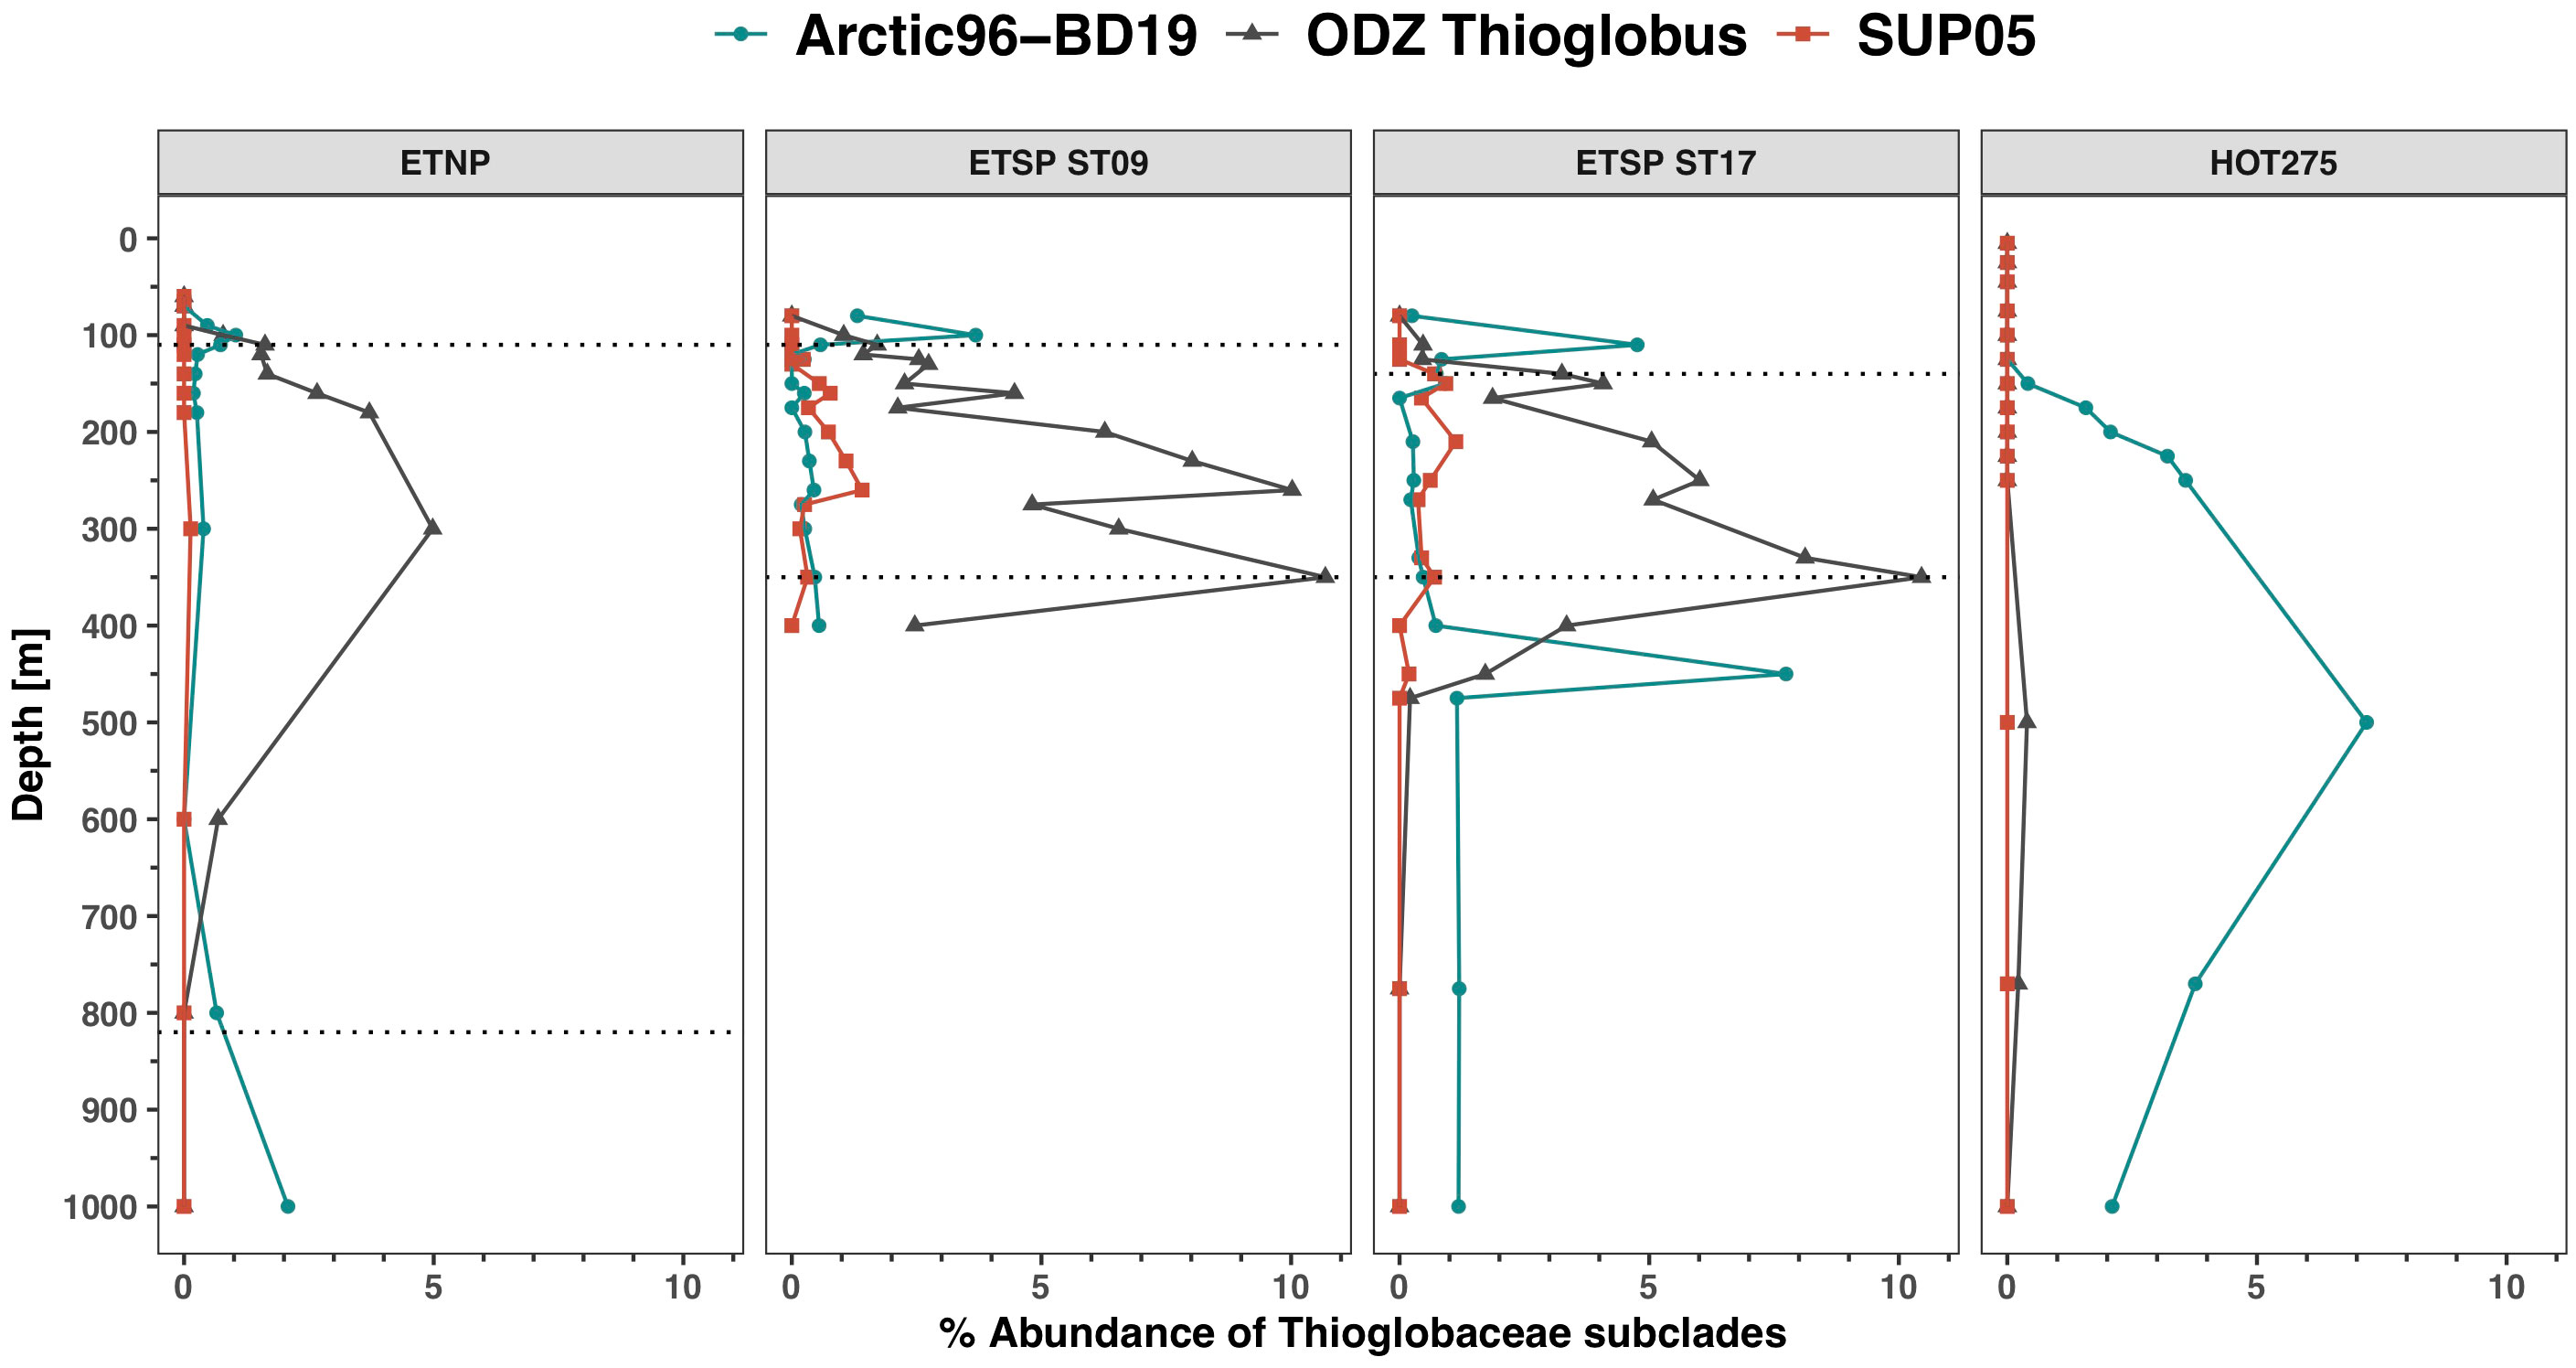
Figure 6 Thioglobaceae rpoB subclades distribution in ODZs and HOT. Depth profile of normalized metagenomic reads encoding for enzyme RNA polymerase (rpoB) of the Thioglobaceae subclades, expressed as % of the total bacterial and archaeal community, in the ODZ stations (ETNP, ETSP ST09, ETSP ST17) and at a representative HOT sampling date (HOT 275; August 2015). The area between the dotted lines corresponds to the ODZ core.
We observed that Thioglobaceae had urease but no cyanase genes. At HOT, the proportion of Thioglobaceae with ureC reads was below 7.5% in the top 250 m for the majority of the sampling dates, with the exception of one point: 18.8% of Thioglobaceae at 150 m at HOT 278 (November) had the ureC gene, and 10%–20% of Thioglobaceae contained ureC at 1000 m (Figure 5B). Contrastingly, at the ODZ stations, the proportion of Thioglobaceae with ureC increased inside the ODZ core. In the ETNP, the proportion of Thioglobaceae with ureC was 27.5% at 90 m in the hypoxic oxycline but varied between 60.3% and 109.3% in the ODZ core and decreased to 20% at the bottom of the ODZ (Figure 5B). Similarly, in the ETSP ODZ ST9, the proportion of Thioglobaceae with ureC in the oxic region reached 22.1% at 100 m in hypoxic waters above the ODZ but varied between 71.6% and 109.8% in the ODZ core; in the ETSP ST17, the proportion of Thioglobaceae with ureC varied from 9.7% at 110 m depth in oxic waters to 87.3%–111.8% in the ODZ but then decreased to 21.7% at 475 m in the hypoxic oxycline below the ODZ (Figure 5B). Thus, Thioglobaceae particularly contained the ureC gene in the ODZ.
SAR11 ureC
The abundance of SAR11 at HOT, according to rpoB, ranged between 24.9% and 39.4% (Figure 7A). SAR11 made up to 60% of the microbial community identified with the rpoB gene in the ETNP in the ODZ core (Fuchsman et al., 2017) but decreased to 5% at the bottom of the ODZ (Figure 7A). Contrastingly, the abundance of SAR11 in the ETSP stations was 6% to 32% of the microbial community. The SAR11 genomes had urease but no cyanase genes. The proportion of the ureC gene was higher at HOT, specifically on the surface (30%–42.6%), and decreased with depth, reaching < 1% of SAR11 at 500 m and below (Figure 7B; Supplementary Figure S8). In the ODZs, the proportions of the ureC reads were low but had a slight increase compared to the hypoxic waters above and below the ODZ, reaching 6.2% of SAR11 at 260 m at the ETSP ST9, 5.5% of SAR11 at 250 m in the ETSP ST17, and 10% of SAR11 at 300 m in the ETNP. Below the ODZ core, the proportion of SAR11 with ureC decreased to below 1% (Figure 7B).
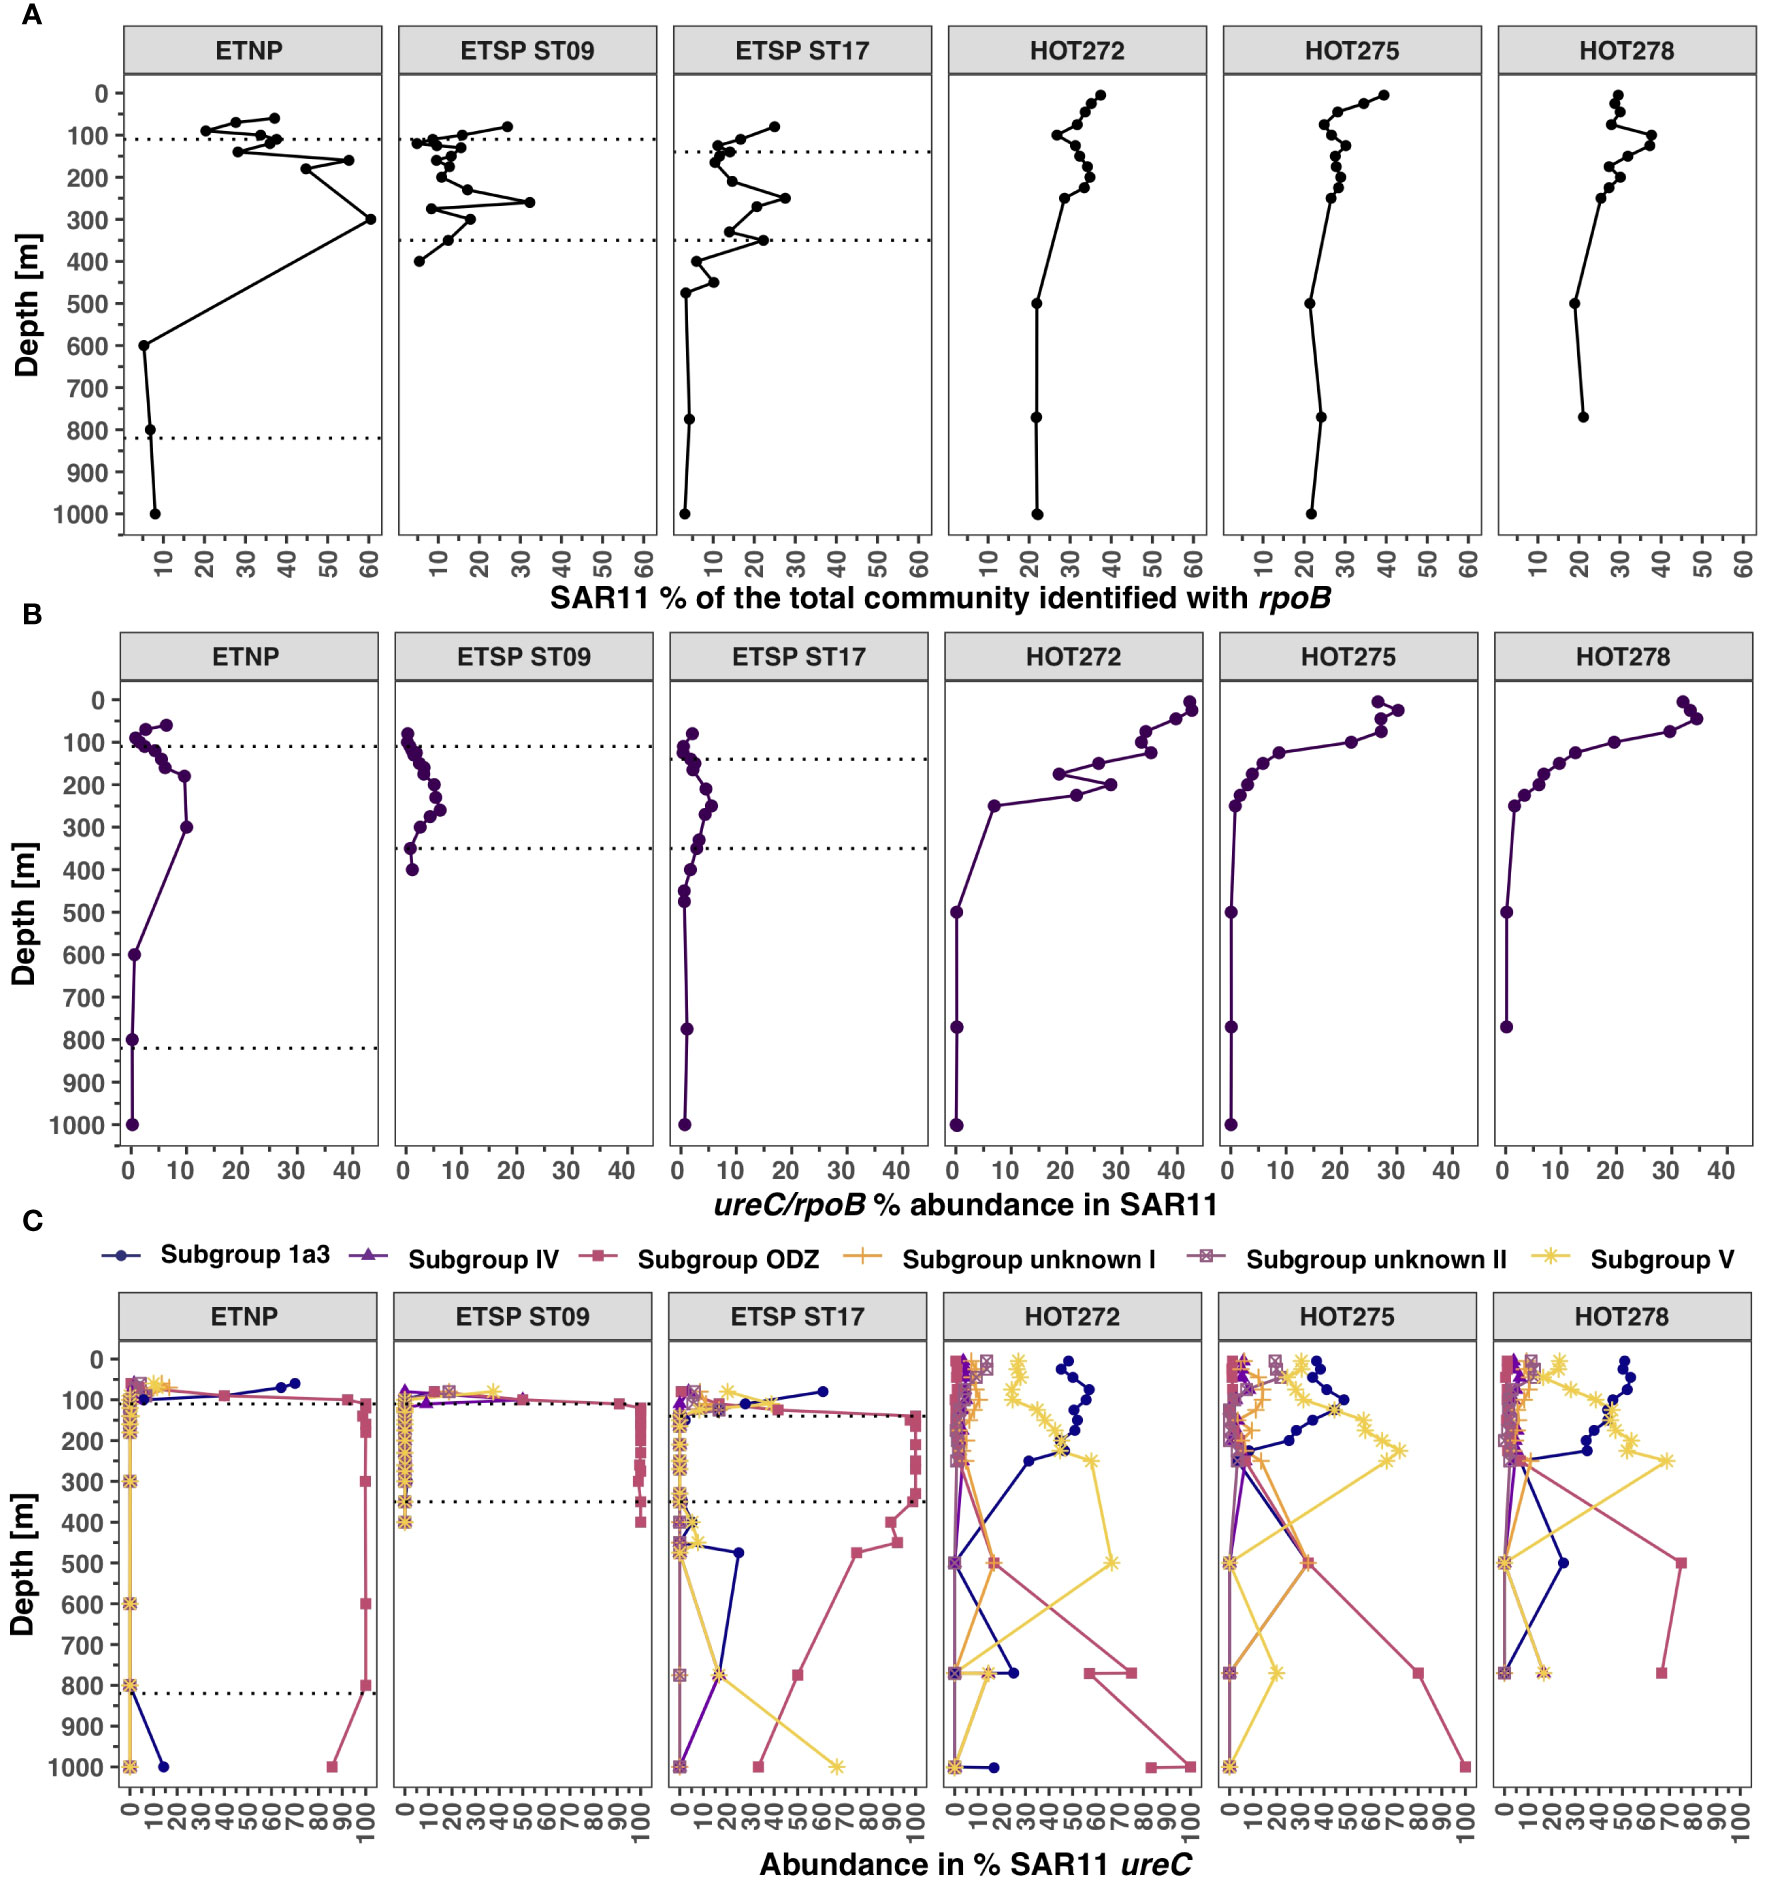
Figure 7 Distribution of SAR11 and its urease genes in ODZs and HOT. (A) Abundance of SAR11 in the total bacterial and archaeal community identified with rpoB. (B) Abundance of urease in % of the SAR11 from ureC/rpoB ratios. (C) Abundance of each SAR subgroup (ureC) calculated from the total SAR11 ureC. Each panel corresponds to a different ocean region. The area between the dotted lines corresponds to the ODZ core.
We observed that ureC reads could be assigned to different SAR11 subgroups: subgroup 1a.3, subgroup ODZ, subgroup IV, subgroup V, and two unidentified subgroups (I, II). The proportion of each subgroup varied according to the presence of oxygen. Inside the ODZs, 100% of the SAR11 ureC reads corresponded to the ODZ subgroup (Figure 7C). In the ETSP ST17, subgroup 1a.3 ureC was found only in the oxic waters on top of the ODZ (27.8% of SAR11 ureC at 110 m) but was below 1.2% at 350 m, increasing to 25% in the hypoxic oxycline below the ODZ at 475 m. All the sampling dates for HOT had similar profiles; for example, in HOT 272 (May 2015), two subgroups contributed to most of the SAR11 ureC abundance: subgroup V and subgroup 1a.3, whereas the other subgroups had ureC abundances below 13.5% of SAR11 ureC. Subgroup 1a.3 ureC abundance varied between 31.4% and 57.7% of total SAR11 ureC, decreasing with depth. Subgroup V ureC abundance, on the other hand, increased with depth, peaking at 250 m depth. While the ODZ subgroup had the most abundant SAR11 ureC in the deep water at HOT, the total SAR11 ureC at these depths was negligible (Figures 7B, C).
Verrucomicrobia ureC
The abundance of Verrucomicrobia, calculated using the rpoB gene, was extremely low in the top 250 m at HOT, at < 1% of the prokaryotic community, but increased in the meso and bathypelagic, reaching 2% of the community at 4,000 m (Figure 8A; Supplementary Figure S9). Verrucomicrobia abundance estimated using the rpoB gene was consistently 1%–2% of the community in the ODZ core in the ETSP ODZ ST9 and ST17. However, the abundance of Verrucomicrobia increased in hypoxic waters both above and below the ODZ, reaching 7.9% of the community in station 17 at 400 m, 6.9% at 400 m in ST9, and 4.5% at 1,000 m in the ETNP. We only identified urease in Verrucomicrobia, not cyanase. In the ETNP, the abundance of ureC reads in the oxic waters above the ODZ and in the ODZ varied between 2.3% and 10% of Verrucomicrobia (Figure 8B). However, at the bottom of the ETNP ODZ, 100% of Verrucomicrobia had ureC (Figure 8B). At ETSP ST17, the proportion of Verrucomicrobia with ureC was higher in the hypoxic waters above the ODZ at 63.9% of Verrucomicrobia at 110 m, decreasing in ODZ waters to 14.2%–27.7%, but increasing again below the ODZ to 112.5% at 400 m (Figure 8B). Similarly, at ETSP ST9, the proportion of Verrucomicrobia with ureC was higher in the hypoxic waters above the ODZ (66% at 100 m) and below (117.4% at 400 m depth) than in the ODZ core (6.7%–25.8%) (Figure 8B). For all ODZ stations, the proportions of Verrucomicrobia with ureC were higher in the hypoxic regions above and below the ODZ than in the ODZ.
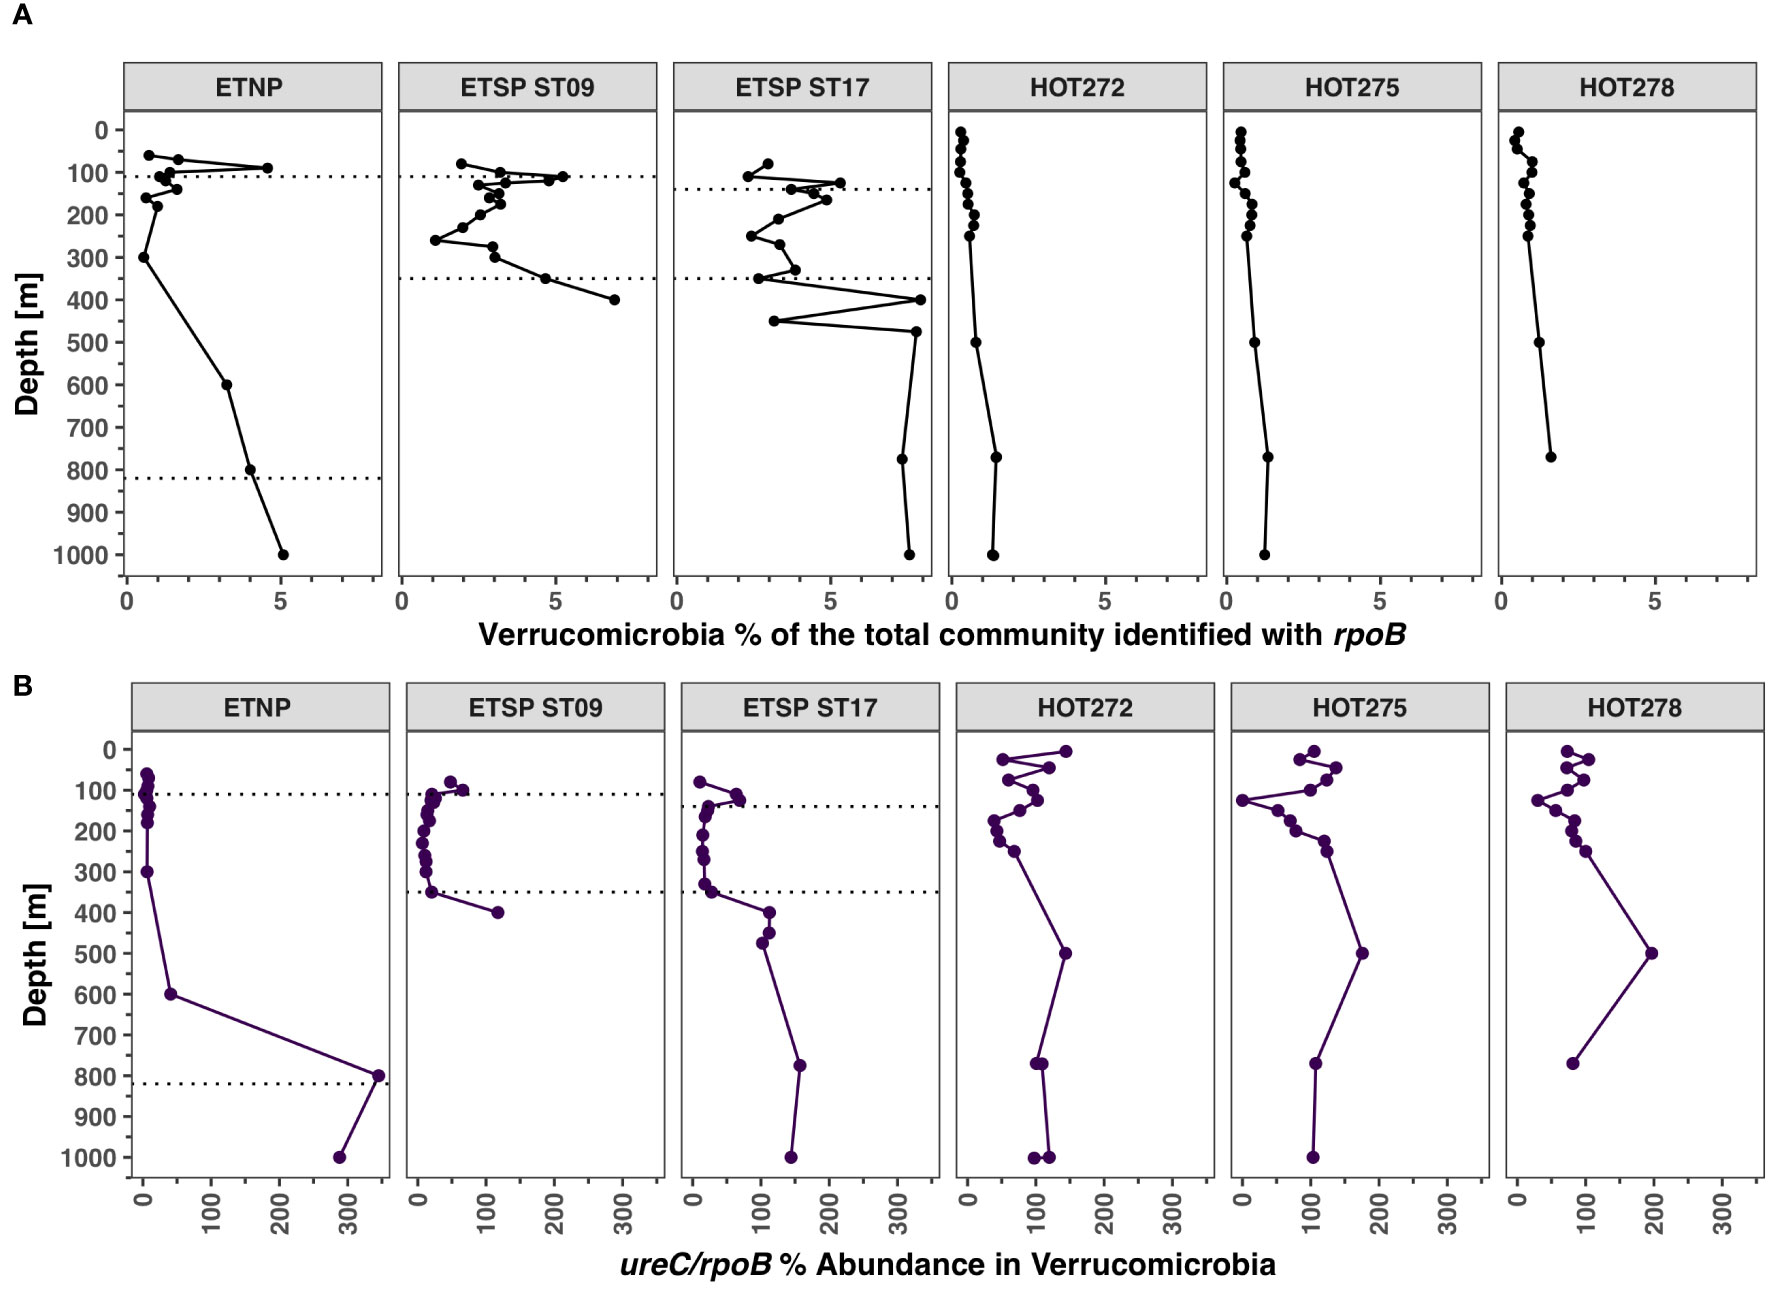
Figure 8 Distribution of Verrucomicrobia and its urease genes in ODZs and HOT. (A) Abundance of Verrucomicrobia in the total bacterial and archaeal community identified with rpoB. (B) Abundance of urease in % of Verrucomicrobia from ureC/rpoB ratios. Each panel corresponds to a different ocean region. The area between the dotted lines corresponds to the ODZ core.
Thaumarchaeota ureC
Thaumarchaeota abundance, estimated with the rpoB gene, was higher at HOT and increased with depth, reaching 30%–40% of the prokaryotic community at 500 m at all sampling dates and then decreasing to 20%–30% at 750–4,000 m (Figure 9A; Supplementary Figure S10). In contrast, at the ODZ stations, the abundance of Thaumarchaeota was higher in areas above and below the ODZ core. In the oxic waters above the ETNP ODZ, Thaumarchaeota rpoB reads reached a maximum of 11.5% of the community at 100 m, decreasing to < 1% in the ODZ, but below the ODZ, Thaumarchaeota rpoB reads once again reached 11% of the community (Figure 9A). At ETSP ST9 and ST17, the rpoB abundance was also < 1% of the community in the ODZ core. However, in hypoxic waters below the ODZ core, Thaumarchaeota were 6.2% of the community at 400 m depth in ST9 and 28.1% of the community at ST17 at 450 m (Figure 9A).
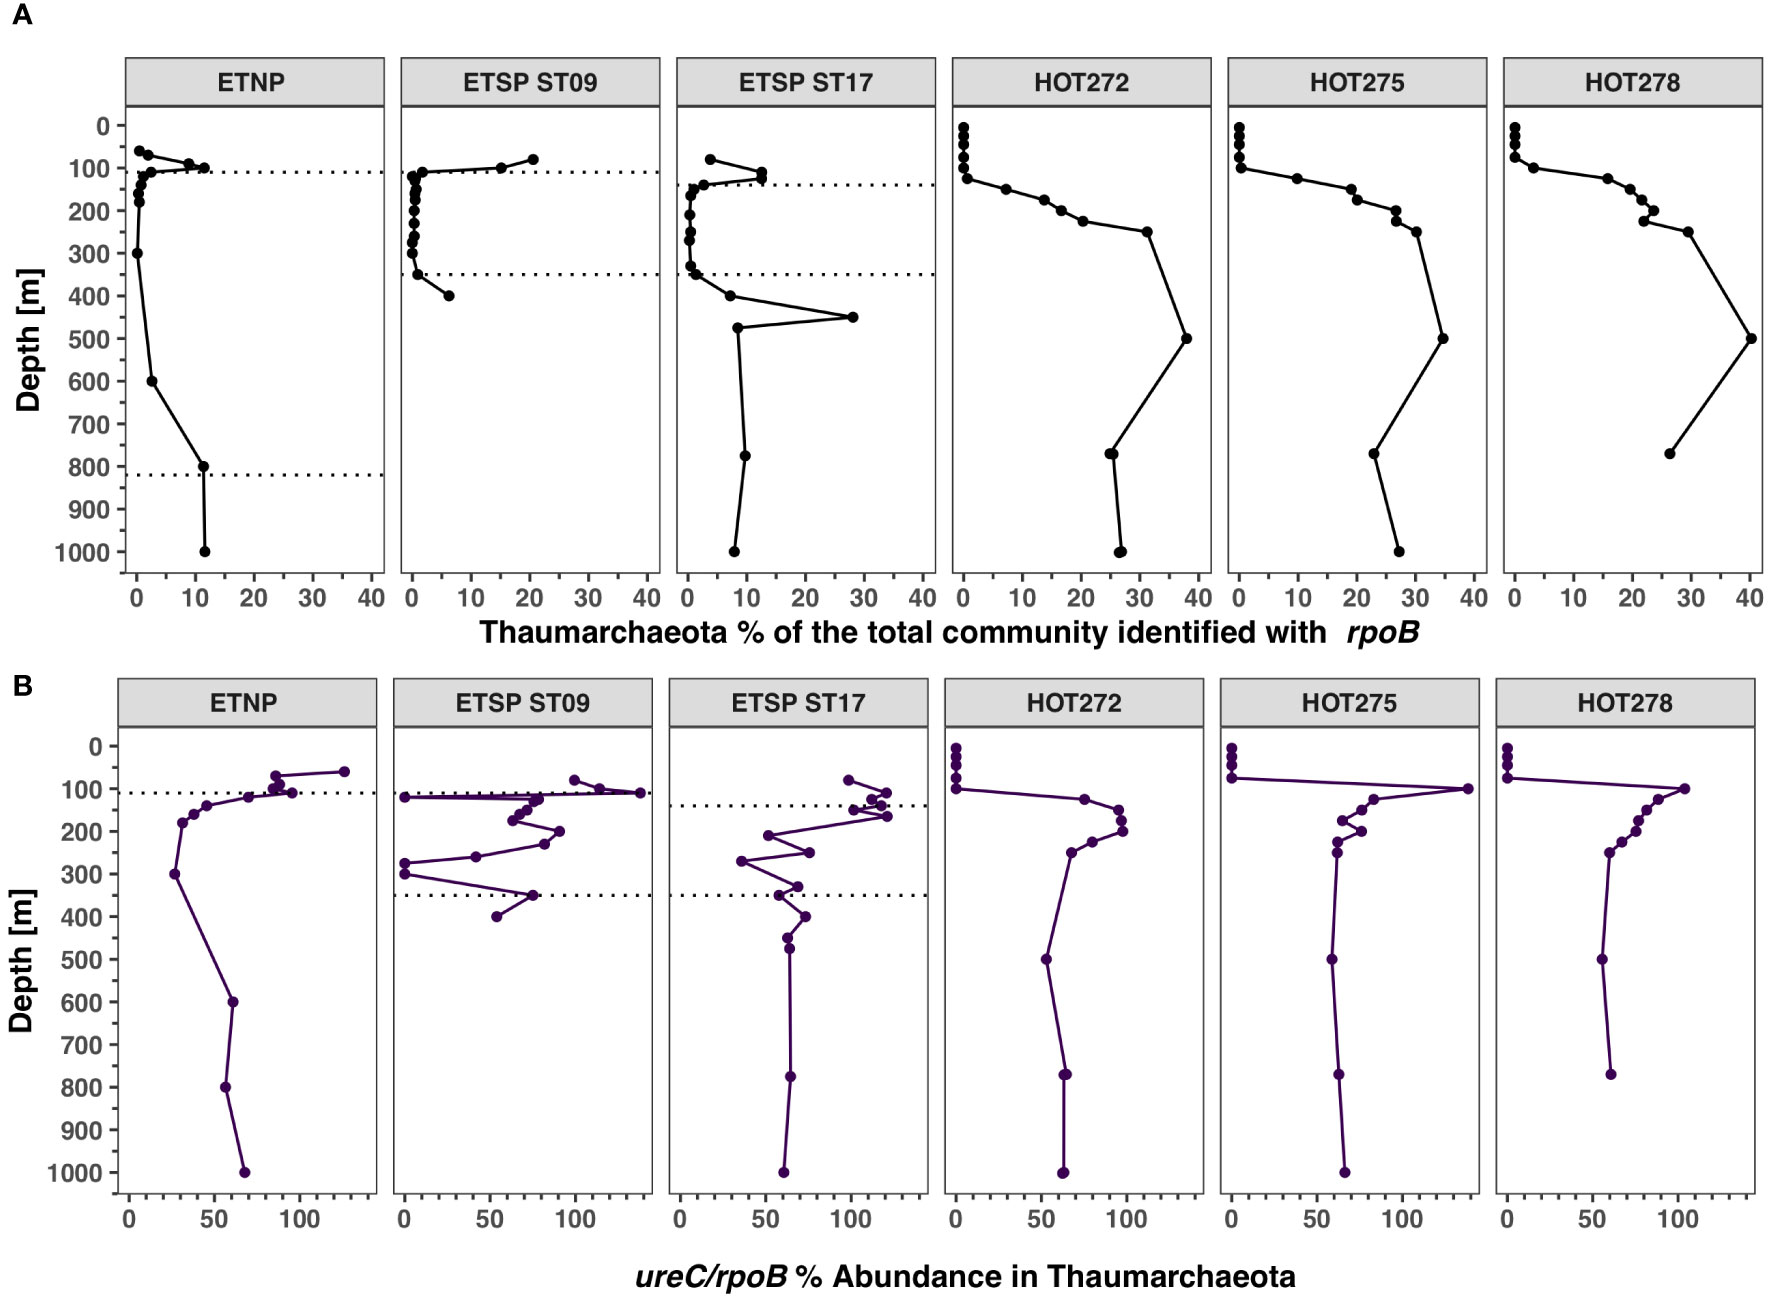
Figure 9 Distribution of Thaumarchaeota and its urease genes in ODZs and HOT. Depth profile of metagenomic reads encoding for enzyme beta subunit of RNA polymerase (rpoB) and urease subunit alpha (ureC). (A) Abundance of Thaumarchaeota in the total bacterial and archaeal community identified with rpoB. (B) Abundance of urease in % of the Thaumarchaeota from ureC/rpoB ratios. Each panel corresponds to a different ocean region. The area between the dotted lines corresponds to the ODZ core.
The proportion of Thaumarchaeota with ureC had similar trends with depth at each station (Figure 9B). For HOT, > 100% of Thaumarchaeota contained ureC at 100 m, but this proportion steadily declined until 250 m; 60%–70% of Thaumarchaeota had ureC from 250 to 1,000 m (Figure 9B). However, at 4,000 m, 100% of Thaumarchaeota again had the ureC gene (Supplementary Figure S10). Similarly, in the ODZ stations, in the oxic waters above the ODZ, > 100% of Thaumarchaeota contained ureC, and below the ODZs, the proportion of Thaumarchaeota with ureC was in the 60%–70% range (Figure 9B). The proportion of Thaumarchaeota with ureC decreased in the ODZs, but the abundance of Thaumarchaeota was also quite low in these regions (Figure 9).
Cyanobacteria cynS and ureC
Picocyanobacteria abundance identified with the rpoB gene was highest at HOT (Figure 10A), particularly at the surface. The sampling dates 272 (May), 275 (August), and 278 (November) had similar rpoB profiles, so only one profile is described here. At sampling date 272 (May 2015), the abundance of Picocyanobacteria estimated with the rpoB gene increased steadily with depth from 32.4% at 5 m, reaching the highest abundance of 53.9% at 100 m; below 100 m, the abundance decreased, reaching 0.6% of the microbial community at 225 m. The abundance of picocyanobacteria in the ETNP (Figure 10A) was highest at 60 m, comprising 15.4% of the prokaryotic community, but then it decreased with depth, with a small maximum in the upper ODZ (Figure 10A). Picocyanobacteria in the ETSP were generally low since profiles skipped surface waters: at ST9, it was below 2%, and ST17 only had Picocyanobacteria at 80 m (~ 20% of the community) (Figure 10A).
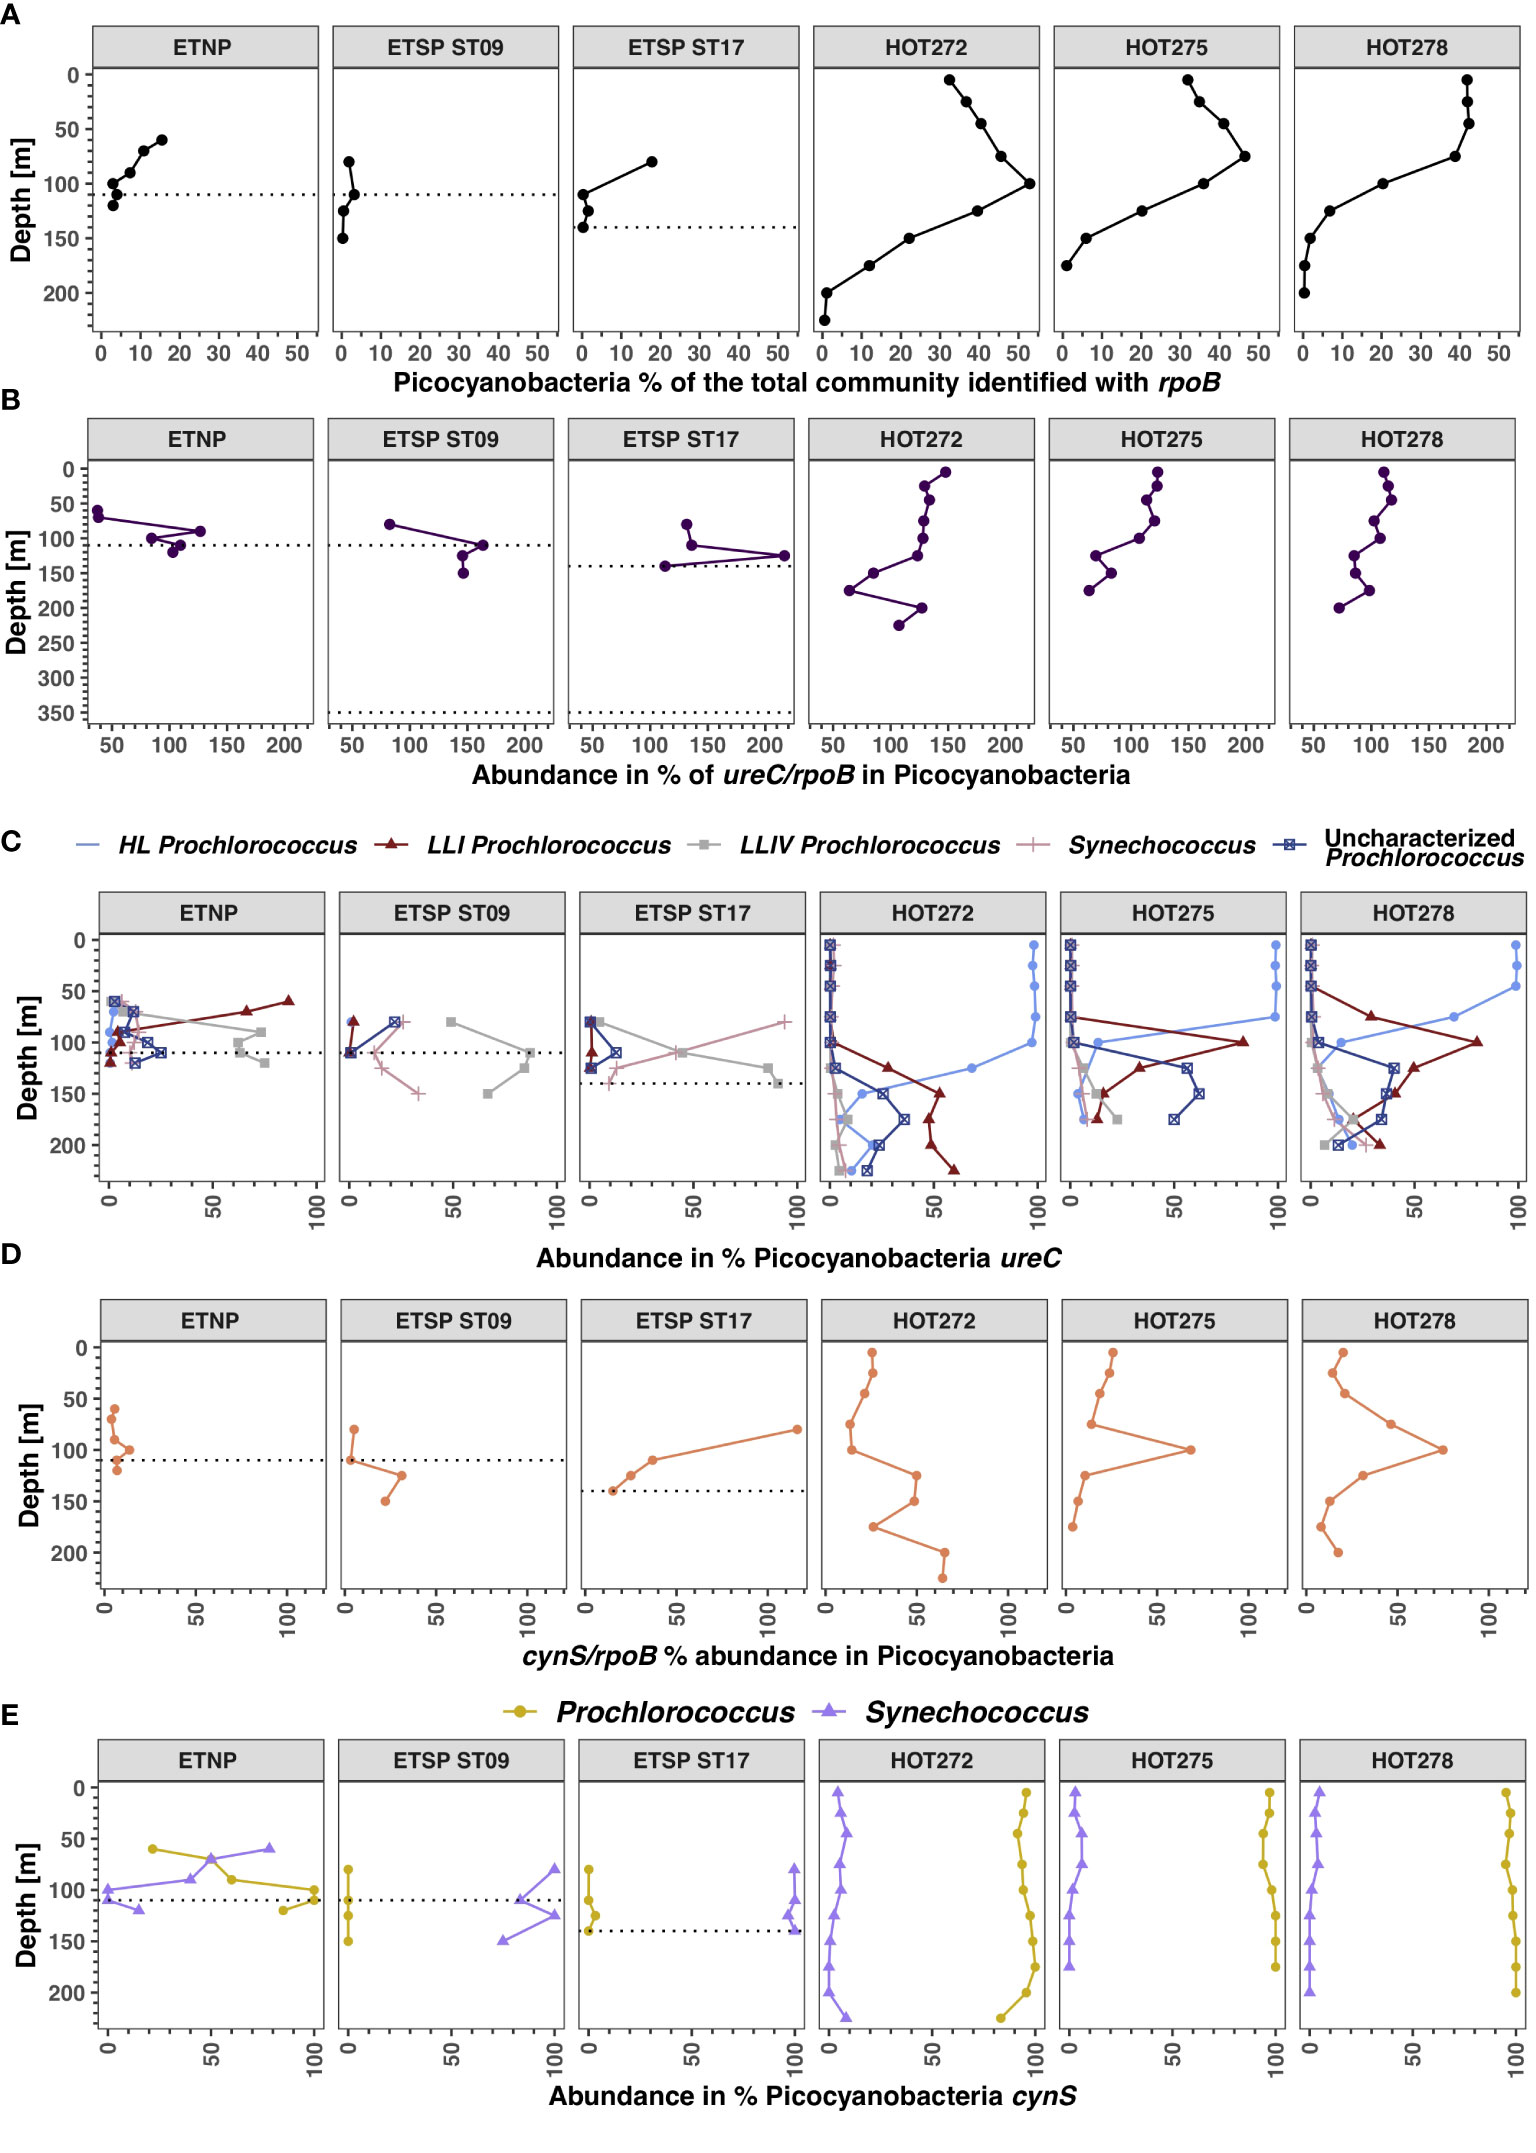
Figure 10 Distribution of Picocyanobacteria and its functional genes in ODZs and HOT. (A) Abundance of Picocyanobacteria in the total bacterial and archaeal community identified with rpoB. (B) Abundance of urease in % of the total Picocyanobacteria from ureC/rpoB ratios. (C) Abundance in % of each of the Picocyanobacteria ecotypes containing ureC out of the total Picocyanobacteria ureC. (D) Abundance of cyanase in % of the total Picocyanobacteria from cynS/rpoB ratios. (E) Prochlorococcus and Synechococcus cynS abundance calculated as % of the total Picocyanobacteria cynS. Each panel corresponds to a different ocean region. The area between the dotted lines corresponds to the ODZ core; the ODZs extend beyond the region shown in the figure.
We calculated the total number of Picocyanobacteria that contained the ureC gene (Figure 10B). Picocyanobacteria ureC abundances at HOT were higher on the surface (~ 150%) and decreased with depth to 50%, close to 100 m depth (Figure 10B). In the ODZs, however, the ETNP and ETSP ST9 had an increase in the ureC with depth from < 10% in oxic waters to 100% to 130% in the ODZ (Figure 10B). Among the Picocyanobacteria that had ureC, we found four phylotypes: Synechococcus, High Light Prochlorococcus (HL), Low Light I Prochlorococcus (LLI), Low Light IV Prochlorococcus (LLIV), and uncharacterized Prochlorococcus (Figure 10C). The Picocyanobacteria ureC groups had similar profiles at the three sampling dates examined at the oxic station (HOT). For example, at HOT 272, the HL Prochlorococcus was ~ 100% of the total Picocyanobacteria ureC from 5 to 100 m, but below 125 m depth, the abundance of HL Prochlorococcus decreased to 10.4% at 225 m depth (Figure 10C). The LLI Prochlorococcus ureC increased from 28% of the total Picocyanobacteria ureC at 125 m to 59.7% at 225 m (Figure 10C).
In the ETSP ST9, the High Light Prochlorococcus ureC group was not detected in the water column, and LLI Prochlorococcus ureC was only present at 2.1% at 80 m depth, probably because much of the euphotic zone was not sampled. Uncharacterized Prochlorococcus ureC was 21.9% of the total Picocyanobacteria ureC at 80 m. However, the LLIV Prochlorococcus ureC group had the highest ureC abundance out of the total Picocyanobacteria ureC, changing from 49% of Picocyanobacteria at 80 m to a maximum of 87.1% at 110 m and 66.7% at 150 m (Figure 10C). In addition, the Synechococcus ureC group ranged from 12 to 33.3% of the total Picocyanobacteria ureC in the ODZ (Figure 10C). In the ETNP, HL Prochlorococcus ureC had a low abundance, generally below 3.4% of total Picocyanobacteria ureC, and LLI Prochlorococcus ureC abundance decreased with depth, from 86.5% at 60 m depth to 0.7% at 120 m depth. The uncharacterized Prochlorococcus ureC increased with depth, reaching a maximum of 25.1% of total Picocyanobacteria ureC at 110 m (Figure 10C). The LLIV Prochlorococcus group had the highest ureC abundance; within the ODZ, the LLIV Prochlorococcus ureC varied between 63.1% and 75% of total Picocyanobacteria ureC.
In the ODZ stations, the abundance of total Picocyanobacteria containing cynS was up to 31.2% at ETSP ST9. In ETSP ST17, the percentage of total Picocyanobacteria containing cynS was 116.2% at 80 m but was negligible in the ETNP (Figure 10D). At HOT, the abundance was 10% to 30% in the top 50 m but increased, reaching 70% at 100 m at HOT 275 and 278 (Figure 10D). At HOT 272, Picocyanobacteria cynS had two peaks: one of ~ 50% between 100 and 150 m depth and a secondary peak of ~ 70% at around 200 m depth (Figure 10D). Picocyanobacteria cynS can be separated into Prochlorococcus and Synechococcus (Figure 10E). At HOT, Prochlorococcus cynS abundance varied between 80% and 100% of the total Picocyanobacteria cynS, whereas at ETSP ST9 and ST17, Synechochocus cynS was ~ 90%–100% of the total Picocyanobacteria cynS (Figure 10E). In the ETNP, Synechococcus cynS abundance peaked in the oxic region, composing 78.3% of Picocyanobacteria cynS at 60 m depth, the primary chlorophyll maximum, but was negligible in the ODZ (Figure 10E).
ureC and cynS expression in transcriptional data
Although the transcript data and the metagenomic reads data from the ETNP shown here do not correspond to the same sample collection date (April 2018 versus April 2012, respectively), we observed similar trends between datasets. When ureC transcripts from STP2 in the ETNP were also analyzed, we observed several groups: Picocyanobacteria had the highest abundance of ureC transcripts, with 16.4 normalized ureC transcripts at depths of 106 m and 150 m, and the general alphaproteobacteria and gammaproteobacteria groups also had significant numbers of transcripts. Key N cycling microbes had low abundances of ureC transcripts: Thaumarchaeota had 1 to 2.5 normalized ureC transcripts at oxic depths; Anammox bacteria (Cand. Scalindua) had 2.4 normalized ureC transcripts at 112 m depth and 2.7 at 150 m depth; and Nitrospina ureC transcript abundances were low but present at all the sampled depths, with abundances between 0.2 and 1.8 normalized ureC transcripts (Figure 11A). Verrucomicrobia had low numbers of transcripts throughout, with three normalized reads at 150 m. The cynS transcripts in station P2 were dominated by transcripts of Anammox bacteria (Cand. Scalindua) (Figure 11B), with 104.4 normalized transcripts at 112 m and 83.2 normalized transcripts at 150 m depth. After Anammox bacteria (Cand. Scalindua), the second-highest number of cynS transcripts belonged to "other bacteria". Nitrospina cynS transcripts were found at 106 m and 112 m with a maximum of 2.9 normalized cynS transcripts at 112 m depth (Figure 11B).
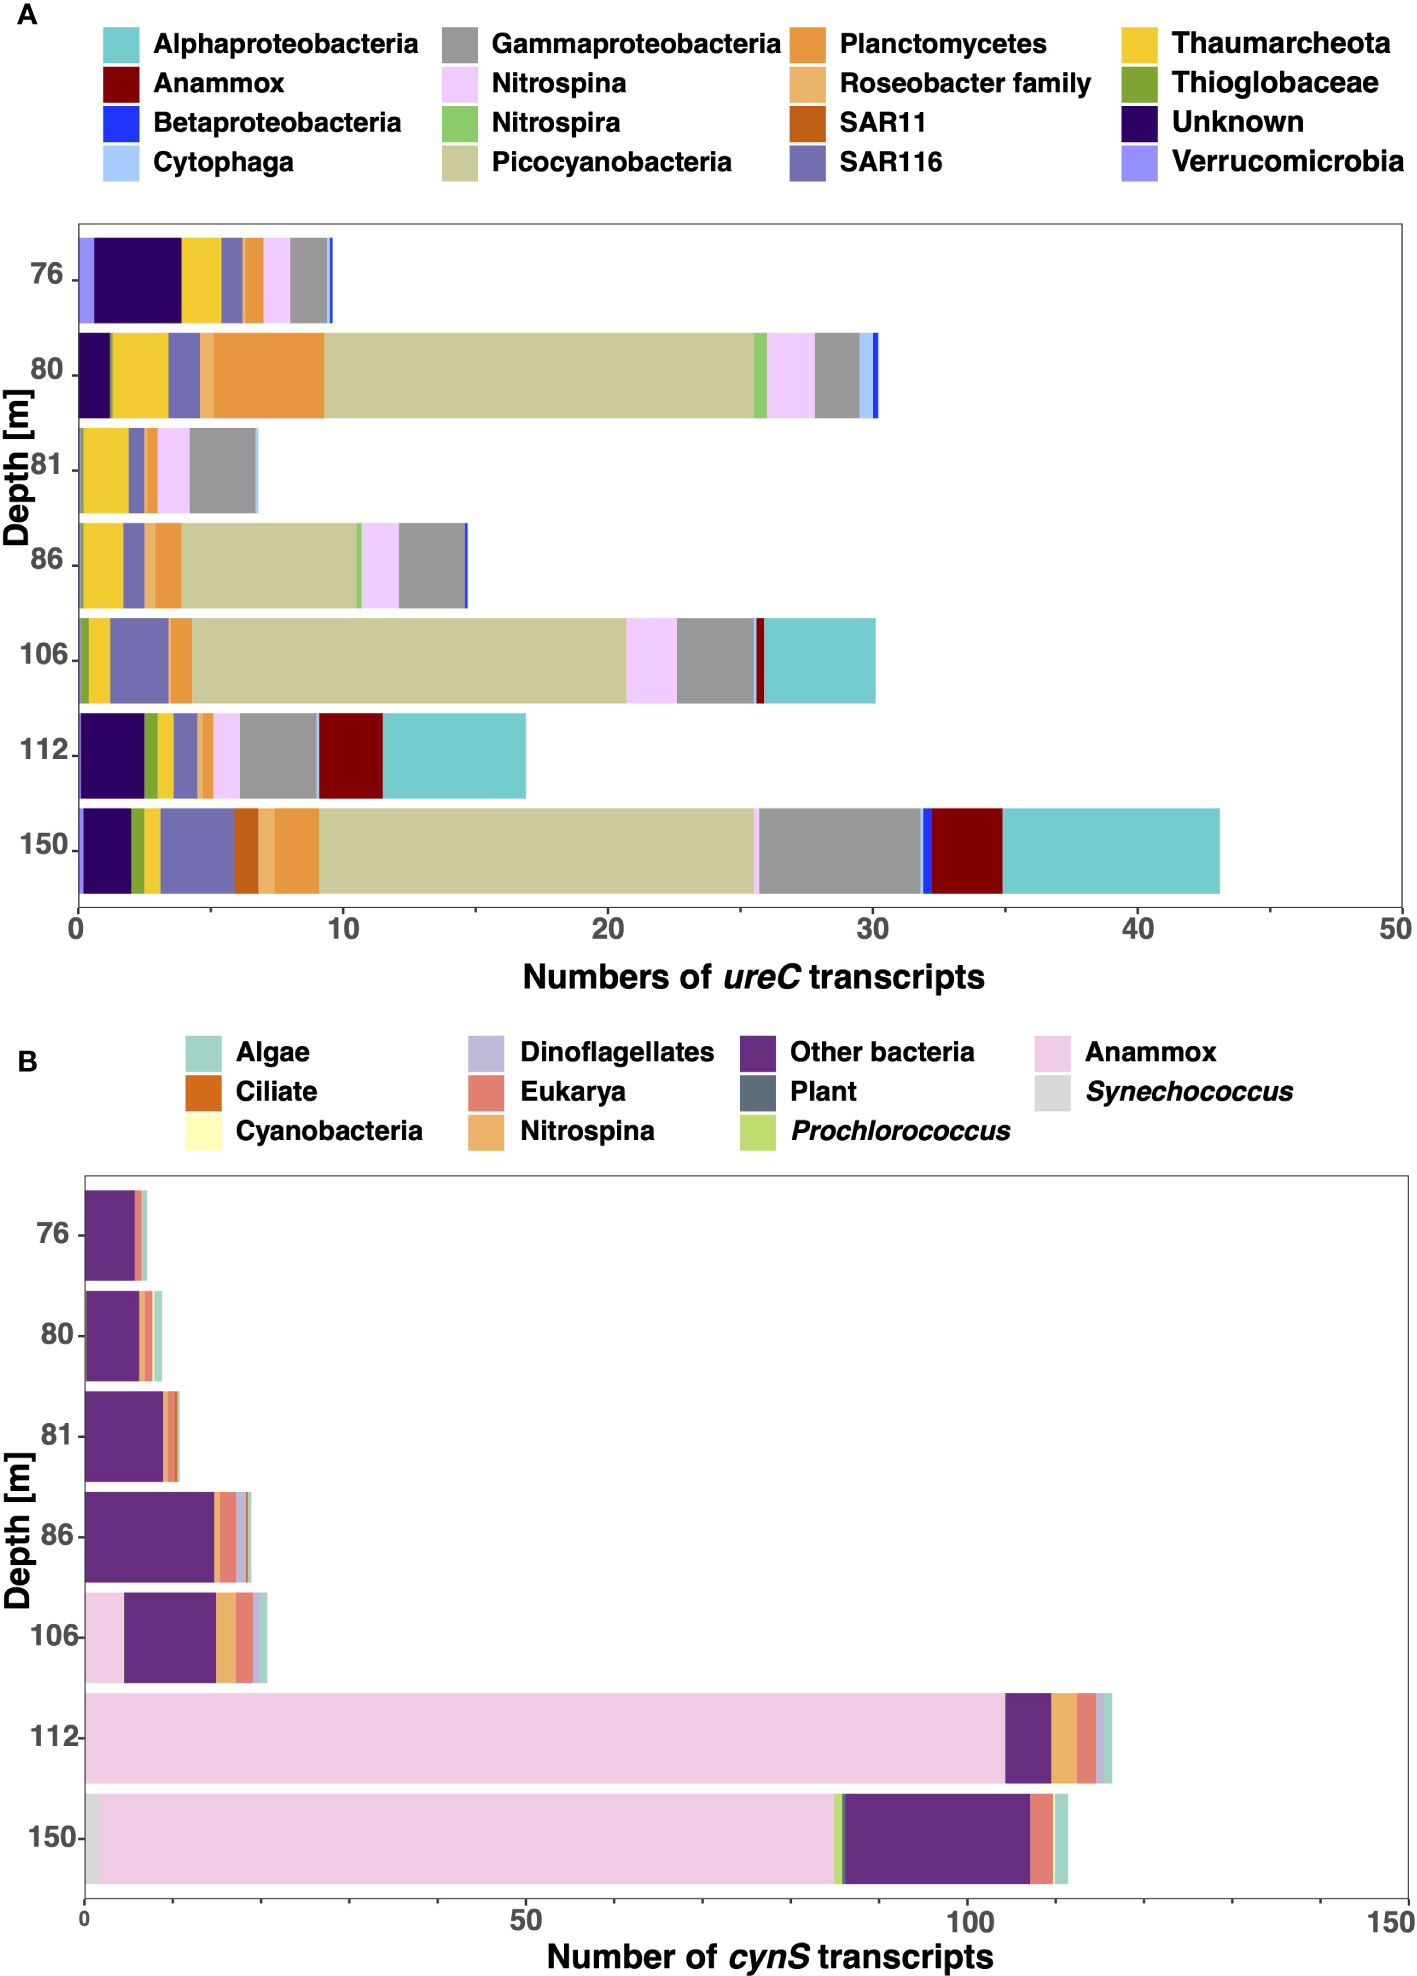
Figure 11 Urease and cyanase gene expression in the ETNP. Stacked bar chart showing the normalized urease and cyanase transcripts of station P2 in the ETNP sampled in May 2018. (A) The ureC transcripts are classified by taxonomic groups. (B) The cynS transcripts are classified by taxonomic groups. The graphs include the oxycline and top of the ODZ (76–150 m) with 106–150 m sampled from the ODZ. The depth is not to scale.
Discussion
Many microorganisms prefer reduced nitrogen forms for assimilation (Glibert et al., 2016). However, ammonium concentrations are extremely low in both ODZs and the oxic oligotrophic ocean (Martens-Habbena et al., 2009; Widner et al., 2018a). One adaptation to ammonium limitation is for microbes to use small organic reduced N sources, such as urea and cyanate. Urea and cyanate concentrations are also generally in the nanomolar range (Painter et al., 2008; Widner et al., 2018a; Kitzinger et al., 2019; Takeda et al., 2020, 2018b). However, the ability to use urea or cyanate in addition to ammonium increases microbes’ chances of obtaining reduced N. Some microbes may have the ability to utilize multiple N sources, but preferentially choose one over the others; however, this preference may be overridden by environmental concentrations of these sources (Aldunate et al, 2020; Qin et al, 2024).
The ETNP ST136 was the only station examined here with both measured urea and cyanate concentrations (Supplementary Figure S1). Urea was undetectable in the water column until 900 m. In contrast, cyanate was measured at high concentrations (40 nM) at several depths in the surface and upper ODZ (Supplementary Figure S3; Widner et al., 2018a). However, the detection limit for urea (70 nM) was much higher than the detection limit for cyanate (0.4 nM), so it is difficult to compare (Widner et al., 2018a). At our ETSP stations, cyanate concentrations were low but measurable in the ODZ (Supplementary Figure S4; Widner et al., 2018b). Though urea was below detection in the ETNP ODZ, sources of urea were likely available. Crustacean and gastropod zooplankton excrete urea (Miller and Glibert, 1998; Thibodeau et al., 2020). Despite the anoxia, crustacean and gastropod zooplankton migrate into ODZs (Bianchi et al., 2014; Maas et al., 2014; Wishner et al., 2020) and likely excrete urea there. Additionally, urea is produced as a part of organic matter degradation (Cho et al., 1996; Berman et al., 1999). While, in the ocean, the majority of organic matter degradation occurs in the upper water column, degradation does occur throughout (Brown et al., 2022).
By analyzing the abundance of normalized reads of the genes in metagenomes for cyanase (cynS) and urease (ureC), we found that the proportion of each taxonomic group with the ability to utilize urea or cyanate varied among the individual groups with depth and between oxic waters and ODZs. This variation implies niche differentiation in cyanate and urea utilization in the ocean.
Niche partitioning of cyanase and urease
Unlike Mao et al. (2022), who found that cynS in larger-size fractionated samples (>0.8 µm) was dominated by eukaryotic phytoplankton, we only observed small numbers of algae-derived cynS at all stations. The highest normalized reads were found at the DCM for each station and corresponded to Pelagomonales. The lack of algae-derived cynS in the ODZs was not surprising, as eukaryotic algae do not thrive in the ODZs (Fuchsman et al., 2022; Wong et al., 2023), but algae cynS reads were also not particularly abundant at HOT (Supplementary Figure S5). This finding could be because HOT is dominated by Picocyanobacteria rather than eukaryotic algae, though eukaryotic algae are definitely present (Rii et al., 2016). Part of the difference between our results and those of Mao et al. (2022) could also be because our data were obtained from bulk water samples dominated by bacteria, while Mao et al. examined > 0.8 µm fractions enriched in eukaryotic algae. In either case, our results imply that eukaryotic algae are present but not dominant consumers of cyanate in the systems studied here.
Both Nitrospina and Cand. Scalindua Anammox bacteria have representatives with cyanase and urease, but the two bacterial groups appear to have different preferences for urea and cyanase (Figures 3, 4). The Anammox (Cand. Scalindua) bacterial community, which can use these compounds for dissimilatory energy production, had a higher proportion of Anammox bacteria containing the cynS gene compared to ureC, indicating a preference for cyanate over urea (Figure 3). These results are consistent with rate data from our 2013 ETSP cruise, which showed that Anammox N2 production rates could be supported by the N in cyanate while urea could only stimulate Anammox N2 production rates after a 1.5-day lag time (Babbin et al., 2017), indicating that the Anammox bacteria were not utilizing the urea in situ at the time of sampling. Similar results were observed with the ETNP transcripts (Figure 11), where the highest abundance of the cynS transcript in the ODZ core corresponded to Cand. Scalindua and the abundance of ureC in the transcript data was low in numbers compared to cynS. These transcripts imply that Anammox bacteria (Cand. Scalindua) were actively transcribing the cynS gene to metabolize cyanate in the ETNP, and assimilation rate data from the ETNP ODZ indicate that cyanate was used both for C assimilation and N dissimilation (Widner et al., 2018a). Contrastingly, the proportion of Nitrospina with ureC was higher than for cynS both at HOT and in ODZ waters, indicating a metabolic preference for urea as a reduced nitrogen form over cyanate. Additionally, expression of Nitrospina ureC transcripts was similar in numbers and present at all depths, but Nitrospina cynS transcripts showed lower expression (< 1 cynS transcript) in oxic water but increased to 2.2 and 2.9 at 106 and 112 m depth in the ODZ (Figure 11). These observations suggest that Nitrospina could be actively transcribing both genes to possibly metabolize both cyanate and urea in the upper ETNP ODZ. The transcript numbers were low, but they contrasted with the distribution of ureC and cynS metagenomic reads (Figure 4). A possible explanation for the presence of cynS transcripts from Nitrospina in the upper ODZ could be due to the high cyanate concentrations (40 nM) at the top of the ETNP ODZ (Supplementary Figure S3; Widner et al., 2018a). The differences in the organic N preferences of Anammox and Nitrospina bacteria may prevent them from competing where their depth ranges overlap, except when an abundantly reduced N resource is available.
Although Thaumarchaeota does not possess the cynS gene, members of the group can use cyanate and urea both for nitrification (dissimilatory) and for assimilation (Kitzinger et al., 2019). Here we only examine urease in Thaumarchaeota since the cyanase gene in these archaea is unknown. At HOT, Thaumarchaeota abundance increased from depths of 100 to 500 m but then decreased again in deeper waters (Figure 9A). The proportion of Thaumarchaeota with ureC reached 100% at ~ 175 m but then decreased to 60%–70% at 500 to 1000 m (Figure 9B). However, at 4,000 m, 100% of Thaumarchaeota again had the ureC gene (Supplementary Figure S10). In the ODZ stations, the abundances of Thaumarchaeota and its ureC gene were high in hypoxic areas above the ODZ (Figure 9). ureC transcripts from the ETNP mirrored these findings, with abundant ureC transcripts for Thaumarchaeota in the upper oxycline but fewer in the ODZ (Figure 11). However, similar to at HOT, in the 500- to 1,000-m range below the ODZs, 60%–70% of Thaumarchaeota had ureC. There is little previous data about Thaumarchaeota ureC in deep waters. Thaumarchaeota subpopulations (ecotypes) vary with depth and with coastal to offshore regions (Luo et al., 2014; Santoro et al., 2017, 2015). In the Arctic Ocean, the abundance of Thaumarchaeota ureC increased with depth from the surface to 100 m, but there was no data for deep waters (Shiozaki et al., 2021). In the more coastal Gulf of Mexico, only between 10% and 15% of Thaumarchaeota cells contain an ureC gene (Kitzinger et al., 2019), while 60%–100% of Thaumarchaeota contain ureC at SPOT (Ahlgren et al., 2017). It seems likely that only some ecotypes of Thaumarchaeota have ureC. In the open ocean datasets examined here, Thaumarchaeota is the dominant microbe with ureC at depth, but a smaller proportion of the population contains ureC in the mesopelagic.
Contrastingly, SAR11 bacteria were abundant (estimated by rpoB) throughout the water column, but the abundance of ureC from SAR11 was highest in surface waters and decreased with depth (Figure 7). Urea is likely used for assimilation in SAR11. The abundance of the ureC reads gives an insight into the potential this microbial group has to use urea in oxic waters with low concentrations of other N-containing nutrients. At HOT, nitrate, an oxidized form of N, was not detected in surface waters (Supplementary Figure S11; Supplementary Table S1). In fact, the proportion of SAR11 containing ureC negatively correlated with nitrate concentrations (log (nitrate) = − 0.053 * proportion of SAR11 with urease + 1.1487; R2 = 0.89, p-value = 1E−17) (Supplementary Figure S12). In contrast, in the ETNP and ETSP, the SAR11 ureC read abundances were low but tended to increase slightly (5%–10%) in the ODZ regions. The phylotypes of SAR11 ureC were completely different in oxic waters and in the ODZ, with an ODZ-specific ureC phylotype. SAR11 ureC was identified in ETNP ureC transcripts, but only at 150 m, the deepest depth sampled for transcripts. Ammonium is often undetectable (< 10 nM) in ODZ regions, but nitrate concentrations are high (~ 20 µM), so oxidized sources of N are present (Fuchsman et al., 2018; Widner et al., 2018b, 2018a). Urease appears to be less advantageous to SAR11 when oxidized sources of inorganic N are present, even though energy is needed to convert oxidized N to reduced N.
In Picocyanobacteria, we observed different proportions of cynS and ureC from different Picocyanobacteria groups occurring at different depths. For example, at HOT 275 (August 2015), on the surface, the majority of ureC reads corresponded to HL Prochlorococcus (Figure 10C), followed by a peak of the LLI Prochlorococcus at 100 m depth; the uncharacterized Prochlorococcus peaked at 150 m depth, whereas in the ODZs, LLIV Prochlorococcus ureC had the highest abundance. We hypothesize that uncharacterized Prochlorococcus corresponds to the uncultured NC1/LLVII ecotype of Prochlorococcus found in ITS data from these stations (Fuchsman et al., 2023). Our ureC data corresponds to the typical cascade of Prochlorococcus ecotypes with depth (Fuchsman et al., 2023).
The distribution of Picocyanobacteria cynS varied between stations and between depths (Figure 10D). At HOT, the abundances of picocyanobacteria cynS were lower in the top 50 m (10%–30%) but increased, reaching 70% at 150 m at HOT 272 and 100 m at HOT 275 and 278 (Figure 10D). The majority of these reads correspond to members of the Prochlorococcus group, but it is not possible to assign cynS to specific ecotypes (Supplementary Figure S2). Some Prochlorococcus can utilize nitrate under N-limited conditions (Martiny et al., 2009; Berube et al., 2016). However, the distribution of cyanase in Prochlorococcus is not consistent with a negative correlation with nitrate. Rather, cyanase becomes the most abundant at the depth where nitrate first becomes measurable (Supplementary Figure S11; Supplementary Table S1), which is also in the region of the DCM (Supplementary Figure S5), where LLI Prochlorococcus is dominant (Fuchsman et al., 2023). While we do not have cyanate concentrations from HOT, in the North Atlantic, there are often cyanate maxima at the primary nitrite maxima, right below the DCM (Widner et al., 2016). Thus, more Prochlorococcus may be able to use cyanate at depths where it is available. The DCM region is also where eukaryotic algae have the cyanase gene (Supplementary Figure S5). For the ODZ stations, a larger proportion of picocyanobacteria had cynS in the ETSP compared to the ETNP; Synechococcus was the main picocyanobacteria containing cynS in the ETSP (Figure 10E). This is consistent with published ITS data, which indicated that Synechococcus was more abundant in our ETSP dataset than in the ETNP (Fuchsman et al., 2023). Indeed, transcripts from the ETNP indicated that Prochlorococcus was using urea, but not cyanate, in and above the ODZ (Figure 11). Thus, the ODZ Prochlorococcus are not competing with Anammox for cyanate in the ODZs. Stable isotopes of ODZ Prochlorococcus cells indicate that they primarily utilize nitrite, a partially oxidized form of inorganic N, which reaches 2–3 µM in ODZs (Aldunate et al., 2020). Thus, Picocyanobacteria and SAR11, which use urea or cyanate for assimilation rather than dissimilation, can use oxidized forms of nitrogen instead of urea and cyanate and appear to prefer these more abundant oxidized N compounds.
Identification of new urease-containing taxa
We identified two new groups of bacteria that use urea in low oxygen conditions: the Gammaproteobacteria Thioglobaceae and an unknown Verrucomicrobia. The Thioglobaceae clade has two distinct published subclades. A cultured strain EF1 of the SUP05 subgroup is capable of respiration with either oxygen or nitrate to oxidize sulfide to fuel carbon fixation (Shah et al., 2017). The EF1 culture can perform nitrate reduction and some steps of the denitrification pathway but cannot produce nitrogen gas (Shah et al., 2017). A cultured strain of the Arctic96BD-19 subgroup oxidized reduced sulfur, particularly thiosulfate, with oxygen but was a mixotroph, increasing growth in the presence of glucose (Marshall and Morris, 2013). In the ocean, the Arctic96BD-19 subgroup primarily lives where oxygen is present, and SUP05 primarily lives where sulfide is available (Walsh et al., 2009). Due to its ability to store elemental S, SUP05 can metabolize for some time after being taken out of more coastal sulfidic regions (Callbeck et al., 2018; Shah et al., 2019). In offshore ODZs, sulfide is not present. Instead of two clades of Thioglobacaea, by looking at the rpoB phylogenetic tree (Supplementary Figure S7), we observed three subclades: Arctic96-BD19, SUP05, and a new ODZ clade of Thioglobaceae. The ODZ clade of Thioglobaceae dominated in ODZs (Figure 6). While we have defined this clade using rpoB data, not genomic data, we can see that all the Thioglobaceae in the ODZ have a narG-type of nitrate reductase (Figure 5). Additionally, based on the fact that the cultured Thioglobaceae clades are both autotrophic (Marshall and Morris, 2013; Shah et al., 2017), we assume that the ODZ clade is also autotrophic.
The members of the ODZ-specific subclade of Thioglobaceae appear to all be capable of using urea in the ODZ (100%), while the Arctic96BD-19 subclade only had 10%–20% of its members having ureC in oxic waters (Figures 5, 6). Thioglobaceae abundance (from rpoB) was only high in deep water (> 250 m) at HOT (Figure 5A). In contrast, at the ODZ stations, the abundance of Thioglobaceae was higher in the hypoxic and anoxic water columns (Figure 5). The ODZ clade was the clade with the highest abundances in the ODZ core, so this clade likely contributed to the high number of ureC reads there. Thus, the ODZ Thioglobaceae may have a greater preference for using urea in the ODZ than does the oxic Thioglobaceae Arctic96-BD19 at HOT. We did not see many ureC transcripts for Thioglobaceae in the ETNP ODZ (Figure 11), but the depth range of the transcripts only reached 150 m, and the maximal proportions of Thioglobaceae with ureC in the metagenomes were deeper than that (300 m) in the ODZ (Figure 6).
Verrucomicrobia has the potential to use urea. At HOT, the abundance of Verrucomicrobia was low (< 2%) (Figure 8A), but the proportion of Verrucomicrobia with ureC was high (29.8%–150%) (Figure 8B). Contrastingly in the ODZ, the abundance of Verrucomicrobia examined with the rpoB gene is slightly higher (2%–4%), but the proportion of ureC is low (2%–25%) in the ODZ core (Figure 8). In the hypoxic waters below the ODZs, Verrucomicrobia abundance increased to 5%–7% of the community, and all of the Verrucomicrobia contained the ureC gene (Figure 8). Verrucomicrobia had low numbers of transcripts throughout the ETNP oxycline and upper ODZ, with three normalized reads at 150 m. However, activity below the ODZ, where ureC in Verrucomicrobia was the most abundant, is still unknown (Figure 11). Verrucomicrobia is a phylum of bacteria whose members have many biogeochemical functionalities. Some Verrucomicrobia are heterotrophs that degrade polysaccharides and cellulose compounds and are often nitrogen fixers (Nixon et al., 2019; Delmont et al., 2022). Other members of the Verrucomicrobia phylum are methanotrophs (Schmitz et al., 2021; Howe et al., 2023). MAGs from the ETNP ODZ indicate that Verrucomicrobia had the napA type of nitrate reductase but did not have the rest of the denitrification pathway (Zhang et al., 2023). Verrucomicrobia MAGs from the ETNP were related to methane-oxidizing Verrucomicrobia of the Pedosphaerales group (Howe et al., 2023; Zhang et al., 2023), but methane monooxygenase is not present in these incomplete MAGs. Methane oxidizers are heterotrophs, and their carbon source is methane, so they need an external source of N (Sieburth et al., 1987). We cannot be sure of the metabolism of the Verrucomicrobia in our systems, but we can see that under low but not zero oxygen conditions, Verrucomicrobia were present and could utilize urea.
Though the majority of the unknown contigs on the urease (ureC) tree have now been identified (Supplementary Figure S1), and we have a good understanding of which microbes are using urea in ODZs, the cyanase tree (cynS) still has an Other Bacteria group with unclear taxonomy (Supplementary Figure S2). This group had significant numbers of metagenomic reads in the oxyclines above and below the ODZs and was fairly abundant in the ETNP transcripts (Figures 2, 11). Thus, there appears to be another key player still to be identified using cyanase in the oxyclines around ODZs.
Conclusions
An interesting common feature of the microbial taxa we analyzed was that the majority correspond to cells that are either photo or chemoautotrophs, including picocyanobacteria, Nitrospina, Thaumarcheota, Anammox, and Thioglobaceae (Table 1). This is probably because most heterotrophs can assimilate N from organic matter. Methane oxidizers, potentially such as the Verrucomicrobia discussed above, are heterotrophs but use methane, a C1 compound that contains no N, as a C source and thus need to assimilate N from the environment. SAR11 may seem like an exception to this trend. However, SAR11 is a small free-living heterotroph that has one carbon (C1) metabolism; it consumes methyl groups in dissolved organic matter (Sun et al., 2011; Tripp, 2013). For example, SAR11 can consume methylated arsenate, which contains no N (Giovannoni et al., 2019). Thus, in such cases, SAR11 must need additional sources of N, such as nitrate or urea.
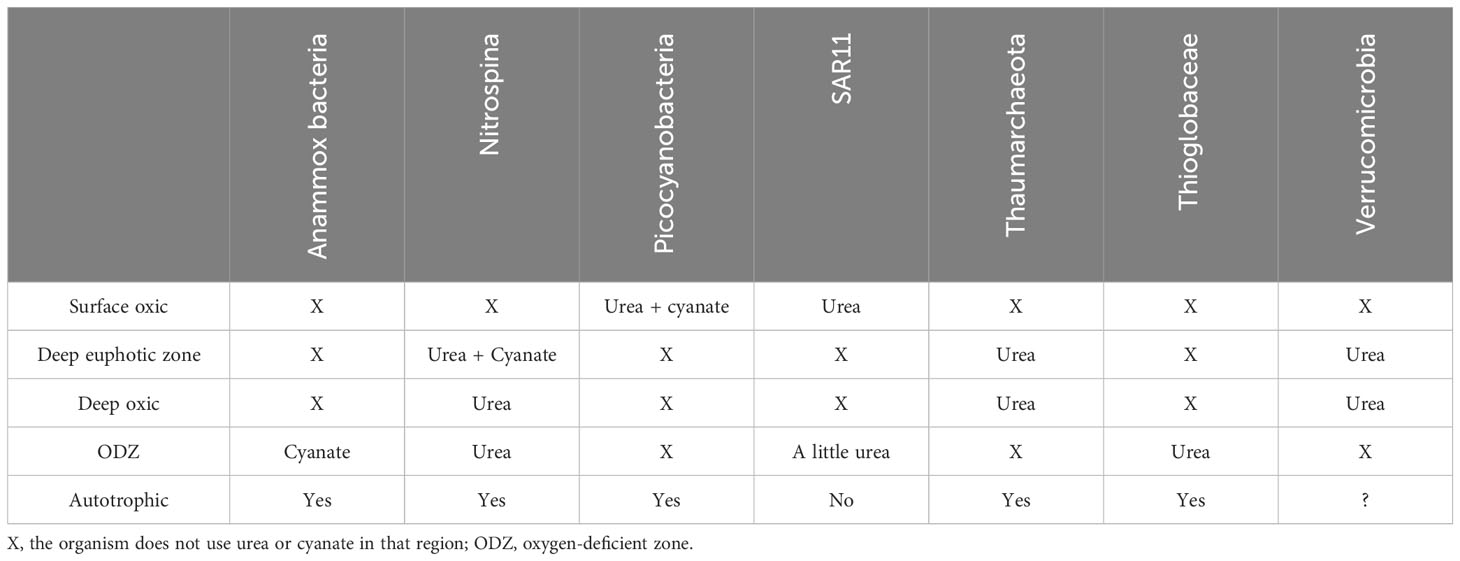
Table 1 Summary of microbial urea and cyanate preference in different ocean regions for the bacteria/archaea examined and whether each bacteria/archaea is autotrophic.
Microbial access to alternative reduced nitrogen forms such as urea and cyanate might provide them with a selective advantage in offshore oceanic regions, contributing to the observed patterns of taxonomic distributions. The differences in cyanase and urease depth profiles between microbes imply niche differentiation. Different microbes have higher proportions of genes for urease in different parts of the water column: SAR11 and Prochlorococcus in surface waters, Verrucomicrobia in hypoxic waters, Thioglobacaea in ODZ waters, and Thaumarchaeota in the lower euphotic zone/mesopelagic. Additionally, Prochlorococcus could utilize cyanate in the euphotic zone, and Nitrospina could utilize cyanate at 150–250 m under oxic conditions, and Anammox bacteria (Cand. Scalindua) could utilize cyanate in the ODZs (Table 1). Described differently, the organisms differentiated their N sources rather than compete with each other: Cand. Scalindua uses cyanate in the ODZ, while Thioglobacaea uses urea in the core. In the edges of the ODZ, Nitrospina utilizes urea, but in the oxycline above the ODZ, where Thaumarchaeota and Nitrospina both could use urea, 50% of Nitrospina are also able to use cyanate, and cyanase transcripts are present, and in the oxycline below the ODZ, all Verrucomicrobia could utilize urea. While Prochlorococcus could utilize cyanate in the DCM, in the ODZ, Prochlorococcus use nitrite rather than compete with Cand. Scalindua for cyanate, even though cyanate is present. SAR11 and Prochlorococcus may compete for urea in surface waters, but we show that SAR11 bacteria switch to nitrate as soon as it is available. This niche differentiation could be attributed to adaptation to avoid microbial competition over nitrogen sources.
Cyanate and urea are only two small, reduced organic N compounds of many. Amino acids and nucleosides, for example, are also small reduced organic N compounds that are measurable at nanomolar concentrations in the ocean (Yamashita and Tanoue, 2003), excreted by zooplankton (Webb and Johannes, 1967; Clifford et al., 2017; Maas et al., 2020), produced by organic matter degradation (e.g., Lehmann et al., 2020), and assimilated by microbes (Zubkov et al., 2008; Clifford et al., 2019; Maas et al., 2020). Experiments indicate that Thaumarcheota and Nitrospina can also assimilate N from amino acids (Bayer et al., 2021; Parada et al., 2022). Our work highlights that other chemoautotrophs, such as S oxidizers, and heterotrophs that use C1 metabolisms are also likely to assimilate various small, reduced organic N compounds. The capability of microbes to use small, reduced organic nitrogen compounds, which are rarely measured, adds important information about adaptations of individual taxa to N limitation. However, DON assimilation has broader implications. When dissolved organic nitrogen was added to a Regional Ocean Model System (ROMS) of the mid-Atlantic Bight, phytoplankton biomass and primary productivity increased by 30%–300%, depending on the location, due to assimilation from regeneration (Druon et al., 2010). Similarly, utilization of DON likely increases chemoautotrophy rates and increases the growth of microbes using C1 metabolisms. In particular, this niche differentiation and use of dissolved organic N should allow a higher biomass of N cycling microbes and higher N transformation rates than a system competing for ammonia only. For example, Anammox bacteria are limited by ammonia in ocean ODZs (Bianchi et al., 2014), and competition for ammonia between Anammox and nitrite oxidizers is modeled to lead to oscillations in the volume of anoxia and amount of N loss (Penn et al., 2019). Additionally, other chemoautotrophs, such as S-oxidizing Thioglobacaea, might need to compete for this same ammonia. The use of small reduced organic N compounds expands the options for Anammox, nitrite oxidizers, and other chemoautotrophs beyond those typically considered in models, allowing for more niche differentiation and less competition, while also further decoupling Anammox from denitrification, a key source of ammonia in ODZs.
Data availability statement
The datasets presented in this study can be found in online repositories. The names of the repository/repositories and accession number(s) can be found here: NCBI SRA (https://www.ncbi.nlm.nih.gov/sra)- BioProject PRJNA704804, PRJNA350692 and PRJNA352737. The numerical results from this work are available in Supplementary Table S3.
Author contributions
PH-V: Conceptualization, Formal analysis, Funding acquisition, Visualization, Writing – original draft, Writing – review & editing. JC: Supervision, Visualization, Writing – original draft, Writing – review & editing. CF: Conceptualization, Formal analysis, Methodology, Supervision, Visualization, Writing – original draft, Writing – review & editing.
Funding
The author(s) declare financial support was received for the research, authorship, and/or publication of this article. This work was funded by the Horn Point startup and student funds.
Acknowledgments
We thank Brittany Widner for providing numbers for cyanate concentrations from the ETSP. Sequencing of the five new metagenomes was paid by an award from the Isaac Walton League Mid-shore Chapter to PHV. We would like to acknowledge the captains and crews of the R/V Thompson and R/V Nathaniel B. Palmer and Chief Scientist Allan Devol. Cruises were funded by NSF OCE-1046017 for Allan Devol. This paper was a chapter of PHV’s thesis. We appreciate the comments from her committee on the manuscript. This work is partially based on Hawaii Ocean Time Series observations supported by the US National Science Foundation under Award No. 1756517.
Conflict of interest
The authors declare that the research was conducted in the absence of any commercial or financial relationships that could be construed as a potential conflict of interest.
Publisher’s note
All claims expressed in this article are solely those of the authors and do not necessarily represent those of their affiliated organizations, or those of the publisher, the editors and the reviewers. Any product that may be evaluated in this article, or claim that may be made by its manufacturer, is not guaranteed or endorsed by the publisher.
Supplementary material
The Supplementary Material for this article can be found online at: https://www.frontiersin.org/articles/10.3389/fmars.2024.1386686/full#supplementary-material
SUPPLEMENTARY TABLE S1 | Metadata for metagenomes used in this study.
SUPPLEMENTARY TABLE S2 | Sequence information for the new metagenomes from this paper.
SUPPLEMENTARY TABLE S3 | The data published in this study, arranged by graph.
References
Ahlgren N. A., Chen Y., Needham D. M., Parada A. E., Sachdeva R., Trinh V., et al. (2017). Genome and epigenome of a novel marine Thaumarchaeota strain suggest viral infection, phosphorothioation DNA modification and multiple restriction systems. Environ. Microbiol. 19, 2434–2452. doi: 10.1111/1462-2920.13768
Ahlgren N. A., Rocap G., Chisholm S. W. (2006). Measurement of Prochlorococcus ecotypes using real-time polymerase chain reaction reveals different abundances of genotypes with similar light physiologies. Environ. Microbiol. 8, 441–454. doi: 10.1111/j.1462-2920.2005.00910.x
Aldunate M., Henríquez-Castillo C., Ji Q., Lueders-Dumont J., Mulholland M. R., Ward B. B., et al. (2020). Nitrogen assimilation in picocyanobacteria inhabiting the oxygen-deficient waters of the eastern tropical North and South Pacific. Limnol. Oceanogr. 65, 437–453. doi: 10.1002/lno.11315
Altschul S. F., Madden T. L., Schäffer A. A., Zhang J., Zhang Z., Miller W., et al. (1997). Gapped BLAST and PSI-BLAST: a new generation of protein database search programs. Nucleic Acids Res. 25, 3389–3402. doi: 10.1093/nar/25.17.3389
Babbin A. R., Buchwald C., Morel F. M. M., Wankel S. D., Ward B. B. (2020). Nitrite oxidation exceeds reduction and fixed nitrogen loss in anoxic Pacific waters. Mar. Chem. 224, 103814–103814. doi: 10.1016/j.marchem.2020.103814
Babbin A. R., Keil R. G., Devol A. H., Ward B. B. (2014). Organic matter stoichiometry, flux, and oxygen control nitrogen loss in the ocean. Science 344, 406–408. doi: 10.1126/science.1248364
Babbin A. R., Peters B. D., Mordy C. W., Widner B., Casciotti K. L., Ward B. B. (2017). Multiple metabolisms constrain the anaerobic nitrite budget in the Eastern Tropical South Pacific. Global Biogeochem. Cycles 31, 258–271. doi: 10.1002/2016GB005407
Barbera P., Kozlov A. M., Czech L., Morel B., Darriba D., Flouri T., et al. (2019). EPA-ng: massively parallel evolutionary placement of genetic sequences. Systematic Biol. 68, 365–369. doi: 10.1093/sysbio/syy054
Bayer B., Saito M. A., McIlvin M. R., Lücker S., Moran D. M., Lankiewicz T. S., et al. (2021). Metabolic versatility of the nitrite-oxidizing bacterium Nitrospira marina and its proteomic response to oxygen-limited conditions. ISME J. 15, 1025–1039. doi: 10.1038/s41396-020-00828-3
Berger S. A., Stamatakis A. (2011). Aligning short reads to reference alignments and trees. Bioinformatics 27, 2068–2075. doi: 10.1093/bioinformatics/btr320
Berman T., Béchemin C., Maestrini S. (1999). Release of ammonium and urea from dissolved organic nitrogen in aquatic ecosystems. Aquat. Microb. Ecol. 16, 295–302. doi: 10.3354/ame016295
Berube P. M., Biller S. J., Hackl T., Hogle S. L., Satinsky B. M., Becker J. W., et al. (2018). Data descriptor: Single cell genomes of Prochlorococcus, Synechococcus, and sympatric microbes from diverse marine environments. Sci. Data 5, 180154–180154. doi: 10.1038/sdata.2018.154
Berube P. M., Coe A., Roggensack S. E., Chisholm S. W. (2016). Temporal dynamics of Prochlorococcus cells with the potential for nitrate assimilation in the subtropical Atlantic and Pacific oceans. Limnol. Oceanogr. 61, 482–495. doi: 10.1002/lno.10226
Bianchi D., Babbin A. R., Galbraith E. D. (2014). Enhancement of anammox by the excretion of diel vertical migrators. Proc. Natl. Acad. Sci. 111, 15653–15658. doi: 10.1073/pnas.1410790111
Bolger A. M., Lohse M., Usadel B. (2014). Trimmomatic: a flexible trimmer for Illumina sequence data. Bioinformatics 30, 2114–2120.
Brown S. A., Balmonte J. P., Hoarfrost A., Ghobrial S., Arnosti C. (2022). Depth-related patterns in microbial community responses to complex organic matter in the western North Atlantic Ocean. Biogeosciences 19, 5617–5631. doi: 10.5194/bg-19-5617-2022
Callbeck C. M., Lavik G., Ferdelman T. G., Fuchs B., Gruber-Vodicka H. R., Hach P. F., et al. (2018). Oxygen minimum zone cryptic sulfur cycling sustained by offshore transport of key sulfur oxidizing bacteria. Nat. Commun. 9, 1729. doi: 10.1038/s41467-018-04041-x
Cepeda-Morales J., Beier J., Gaxiola-Castro G., Lavin M. F., Godinez V. M. (2009). Effect of the oxygen minimum zone on the second chlorophyll maximum in the Eastern Tropical Pacific off Mexico. Cienc. Marinas 35, 389–403. doi: 10.7773/cm.v35i4.1622
Cho B., Park M., Shim J., Azam F. (1996). Significance of bacteria in urea dynamics in coastal surface waters. Mar. Ecol. Prog. Ser. 142, 19–26. doi: 10.3354/meps142019
Clifford E. L., Hansell D. A., Varela M. M., Nieto-Cid M., Herndl G. J., Sintes E. (2017). Crustacean zooplankton release copious amounts of dissolved organic matter as taurine in the ocean. Limnol. Oceanogr. 62, 2745–2758. doi: 10.1002/lno.10603
Clifford E. L., Varela M. M., De Corte D., Bode A., Ortiz V., Herndl G. J., et al. (2019). Taurine is a major carbon and energy source for marine prokaryotes in the North atlantic ocean off the iberian peninsula. Microbial. Ecol. 78, 299–312. doi: 10.1007/s00248-019-01320-y
Connelly T. L., Baer S. E., Cooper J. T., Bronk D. A., Wawrik B. (2014). Urea uptake and carbon fixation by marine pelagic bacteria and archaea during the arctic summer and winter seasons. Appl. Environ. Microbiol. 80, 6013–6022. doi: 10.1128/AEM.01431-14
Czech L., Barbera P., Stamatakis A. (2020). Genesis and Gappa: processing, analyzing and visualizing phylogenetic (placement) data. Bioinformatics 36, 3263–3265. doi: 10.1093/bioinformatics/btaa070
Dalsgaard T., Thamdrup B., Farías L., Peter Revsbech N. (2012). Anammox and denitrification in the oxygen minimum zone of the eastern South Pacific. Limnol. Oceanogr. 57, 1331–1346. doi: 10.4319/lo.2012.57.5.1331
Delmont T. O., Pierella Karlusich J. J., Veseli I., Fuessel J., Eren A. M., Foster R. A., et al. (2022). Heterotrophic bacterial diazotrophs are more abundant than their cyanobacterial counterparts in metagenomes covering most of the sunlit ocean. ISME J. 16, 927–936. doi: 10.1038/s41396-021-01135-1
Devol A. H. (2003). Solution to a marine mystery. Nature 422, 575–575. doi: 10.1007/s00340-003-1120-z
DeVries T., Deutsch C., Rafter P. A., Primeau F. (2013). Marine denitrification rates determined from a global 3-D inverse model. Biogeosciences 10, 2481–2496. doi: 10.5194/bg-10-2481-2013
Druon J. N., Mannino A., Signorini S., McClain C., Friedrichs M., Wilkin J., et al. (2010). Modeling the dynamics and export of dissolved organic matter in the Northeastern U.S. continental shelf. Estuarine Coast. Shelf Sci. 88, 488–507. doi: 10.1016/j.ecss.2010.05.010
Edgar R. C. (2004). MUSCLE: multiple sequence alignment with high accuracy and high throughput. Nucleic Acids Res. 32, 1792–1797. doi: 10.1093/nar/gkh340
Fuchsman C. A., Cherubini L., Hays M. D. (2022). An Analysis of Protists in Pacific Oxygen Deficient Zones: Implications for Prochlorococcus and N2 producing bacteria. Environ. Microbiol. 24, 1790–1804. doi: 10.1111/1462-2920.15893
Fuchsman C. A., Devol A. H., Casciotti K. L., Buchwald C., Chang B. X., Horak R. E. A. (2018). An N isotopic mass balance of the Eastern Tropical North Pacific oxygen deficient zone. Deep-Sea Res. Part II: Topical Stud. Oceanogr. 156, 137–142. doi: 10.1016/j.dsr2.2017.12.013
Fuchsman C. A., Devol A. H., Saunders J. K., McKay C., Rocap G. (2017). Niche Partitioning of the N cycling microbial community of an offshore Oxygen Deficient Zone. Front. Microbiol. 8, 2384. doi: 10.3389/fmicb.2017.02384
Fuchsman C. A., Garcia Prieto D., Hays M. D., Cram J. A. (2023). Associations between picocyanobacterial ecotypes and cyanophage host genes across ocean basins and depth. PeerJ 11, e14924. doi: 10.7717/peerj.14924
Fuchsman C. A., Hays M. D. (2023). Increased cyanophage infection at the bottom of the euphotic zone, especially in the fall. Environ. Microbiol. 25, 3349–3363. doi: 10.1111/1462-2920.16525
Fuchsman C. A., Palevsky H. I., Widner B., Duffy M., Carlson M. C. G., Neibauer J. A., et al. (2019). Cyanobacteria and cyanophage contributions to carbon and nitrogen cycling in an oligotrophic oxygen-deficient zone. ISME J. 13, 2714–2726. doi: 10.1038/s41396-019-0452-6
Fuchsman C. A., Staley J. T., Oakley B. B., Kirkpatrick J. B., Murray J. W. (2012). Free-living and aggregate-associated planctomycetes in the black sea. FEMS Microbiol. Ecol. 80, 402–416. doi: 10.1111/fem.2012.80.issue-2
Ganesh S., Bertagnolli A. D., Bristow L. A., Padilla C. C., Blackwood N., Aldunate M., et al. (2018). Single cell genomic and transcriptomic evidence for the use of alternative nitrogen substrates by anammox bacteria. ISME J. 12, 2706–2722. doi: 10.1038/s41396-018-0223-9
Garcia H. E., Weathers K. W., Paver C. R., Smolyar I., Boyer T. P., Locarnini R. A., et al. (2019). World Ocean Atlas 2018 Volume 3: Dissolved Oxygen, Apparent Oxygen Utilization, and Dissolved Oxygen Saturation Vol. 83 (USA: NOAA National Centers for Environmental Information), 1–38.
Giovannoni S. J., Halsey K. H., Saw J., Muslin O., Suffridge C. P., Sun J., et al. (2019). A parasitic arsenic cycle that shuttles energy from phytoplankton to heterotrophic bacterioplankton. mBio 10, e00246-19. doi: 10.1128/mBio.00246-19
Giovannoni S. J., Tripp H. J., Givan S., Podar M., Vergin K. L., Baptista D., et al. (2005). Genome streamlining in a cosmopolitan oceanic bacterium. Sci. (New York N.Y.) 309, 1242–1245. doi: 10.1126/science.1114057
Glibert P. M., Wilkerson F. P., Dugdale R. C., Raven J. A., Dupont C. L., Leavitt P. R., et al. (2016). Pluses and minuses of ammonium and nitrate uptake and assimilation by phytoplankton and implications for productivity and community composition, with emphasis on nitrogen-enriched conditions. Limnol. Oceanogr. 61, 165–197. doi: 10.1002/lno.10203
Hausinger R. P. (2004). Metabolic versatility of prokaryotes for urea decomposition. J. Bacteriol. 186, 2520–2522. doi: 10.1128/JB.186.9.2520-2522.2004
Horak R. E. A., Ruef W., Ward B. B., Devol A. H. (2016). Expansion of denitrification and anoxia in the eastern tropical North Pacific from 1972 to 2012. Geophysical Res. Lett. 43, 5252–5260. doi: 10.1002/2016GL068871
Howe K. L., Seitz K. W., Campbell L. G., Baker B. J., Thrash J. C., Rabalais N. N., et al. (2023). Metagenomics and metatranscriptomics reveal broadly distributed, active, novel methanotrophs in the Gulf of Mexico hypoxic zone and in the marine water column. FEMS Microbiol. Ecol. 99, fiac153. doi: 10.1093/femsec/fiac153
Ito T., Minobe S., Long M. C., Deutsch C. (2017). Upper ocean O2 trends: 1958–2015. Geophysical Res. Lett. 44, 4214–4223. doi: 10.1002/2017GL073613
Johnson W. V., Anderson P. M. (1987). Bicarbonate is a recycling substrate for cyanase. J. Biol. Chem. 262, 9021–9025. doi: 10.1016/S0021-9258(18)48040-4
Johnson Z. I., Zinser E. R., Coe A., Mcnulty N. P., Malcolm E. S., Chisholm S. W., et al. (2006). Partitioning among prochlorococcus ecotypes along environmental gradients. Science 311, 1737–1740. doi: 10.1126/science.1118052
Kamennaya N. A., Post A. F. (2011). Characterization of cyanate metabolism in marine synechococcus and prochlorococcus spp. Appl. Environ. Microbiol. 77, 291–301. doi: 10.1128/AEM.01272-10
Keeling P. J., Burki F., Wilcox H. M., Allam B., Allen E. E., Amaral-Zettler L. A., et al. (2014). The marine microbial eukaryote transcriptome sequencing project (MMETSP): illuminating the functional diversity of eukaryotic life in the oceans through transcriptome sequencing. PloS Biol. 12, e1001889–e1001889. doi: 10.1371/journal.pbio.1001889
Kitzinger K., Padilla C. C., Marchant H. K., Hach P. F., Herbold C. W., Kidane A. T., et al. (2019). Cyanate and urea are substrates for nitrification by Thaumarchaeota in the marine environment. Nat. Microbiol. 4, 234–243. doi: 10.1038/s41564-018-0316-2
Kozlov A. M., Darriba D., Flouri T., Morel B., Stramatakis A. (2019). RAxML-ng: a fast, scalable and user-friendly tool for maximum likelihood phylogenetic inference. Bioinformatics 35, 4453–4455. doi: 10.1093/bioinformatics/btz305
Lam P., Lavik G., Jensen M. M., Van De Vossenberg J., Schmid M., Woebken D., et al. (2009). Revising the nitrogen cycle in the Peruvian oxygen minimum zone. Proc. Natl. Acad. Sci. U.S.A. 106, 4752–4757. doi: 10.1073/pnas.0812444106
Lanclos V. C., Rasmussen A. N., Kojima C. Y., Cheng C., Henson M. W., Faircloth B. C., et al. (2023). Ecophysiology and genomics of the brackish water adapted SAR11 subclade IIIa. ISME J. 17, 620–629. doi: 10.1038/s41396-023-01376-2
Lehmann M. F., Carstens D., Deek A., McCarthy M., Schubert C. J., Zopfi J. (2020). Amino acid and amino sugar compositional changes during in vitro degradation of algal organic matter indicate rapid bacterial re-synthesis. Geochimica Cosmochimica Acta 283, 67–84. doi: 10.1016/j.gca.2020.05.025
Li D., Liu C. M., Luo R., Sadakane K., Lam T. W. (2015). MEGAHIT: An ultra-fast single-node solution for large and complex metagenomics assembly via succinct de Bruijn graph. Bioinformatics 31, 1674–1676.
Lücker S., Nowka B., Rattei T., Spieck E., Daims H. (2013). The genome of Nitrospina gracilis illuminates the metabolism and evolution of the major marine nitrite oxidizer. Front. Microbiol. 4. doi: 10.3389/fmicb.2013.00027
Luo E., Eppley J. M., Romano A. E., Mende D. R., DeLong E. F. (2020). Double-stranded DNA virioplankton dynamics and reproductive strategies in the oligotrophic open ocean water column. ISME J. 14, 1304–1315. doi: 10.1038/s41396-020-0604-8
Luo H., Tolar B. B., Swan B. K., Zhang C. L., Stepanauskas R., Ann Moran M., et al. (2014). Single-cell genomics shedding light on marine Thaumarchaeota diversification. ISME J. 8, 732–736. doi: 10.1038/ismej.2013.202
Maas A. E., Frazar S. L., Outram D. M., Seibel B. A., Wishner K. F. (2014). Fine-scale vertical distribution of macroplankton and micronekton in the Eastern Tropical North Pacific in association with an oxygen minimum zone. J. Plankton Res. 36, 1557–1575. doi: 10.1093/plankt/fbu077
Maas A. E., Liu S., Bolaños L. M., Widner B., Parsons R., Kujawinski E. B., et al. (2020). Migratory zooplankton excreta and its influence on prokaryotic communities. Front. Mar. Sci. 7. doi: 10.3389/fmars.2020.573268
Mao X., Chen J., van Oosterhout C., Zhang H., Liu G., Zhuang Y., et al. (2022). Diversity, prevalence, and expression of cyanase genes (cynS) in planktonic marine microorganisms. ISME J. 16, 602–605. doi: 10.1038/s41396-021-01081-y
Marshall K. T., Morris R. M. (2013). Isolation of an aerobic sulfur oxidizer from the SUP05/Arctic96BD-19 clade. ISME J. 7, 452–455. doi: 10.1038/ismej.2012.78
Marshall K. T., Morris R. M. (2015). Mixotroph from the SUP05 clade of marine gammaproteobacteria. Genome Announcements 3, e01155–e01115. doi: 10.1128/genomeA.01155-15
Martens-Habbena W., Berube P. M., Urakawa H., de la Torre J. R., Stahl D. A. (2009). Ammonia oxidation kinetics determine niche separation of nitrifying Archaea and Bacteria. Nature 461, 976–979. doi: 10.1038/nature08465
Martiny A. C., Kathuria S., Berube P. M. (2009). Widespread metabolic potential for nitrite and nitrate assimilation among Prochlorococcus ecotypes. Proc. Natl. Acad. Sci. United States America 106, 10787–10792. doi: 10.1073/pnas.0902532106
Mattes T. E., Burke S., Rocap G., Morris R. M. (2022). Two metatranscriptomic profiles through low-dissolved-oxygen waters (DO, 0 to 33 µM) in the eastern tropical North pacific ocean. Microbiol. Resource Announcements 11, e01201–e01221. doi: 10.1128/mra.01201-21
Miller C. A., Glibert P. M. (1998). Nitrogen excretion by the calanoid copepod Acartia tonsa : results of mesocosm experiments. J. Plankton Res. 20, 1767–1780. doi: 10.1093/plankt/20.9.1767
Morris R. M., Rappe M. S., Connon S. A., Vergin K. L., Siebold W. A., Carlson C. A., et al. (2002). SAR11 clade dominates ocean surface bacterioplankton communities. Nature 420, 806–810. doi: 10.1038/nature01281.1
Nixon S. L., Daly R. A., Borton M. A., Solden L. M., Welch S. A., Cole D. R., et al. (2019). Genome-resolved metagenomics extends the environmental distribution of the verrucomicrobia phylum to the deep terrestrial subsurface. mSphere 4, e00613-19. doi: 10.1128/mSphere.00613-19
Pachiadaki M. G., Sintes E., Bergauer K., Brown J. M., Record N. R., Swan B. K., et al. (2017). Major role of nitrite-oxidizing bacteria in dark ocean carbon fixation. Science 1051, 1046–1051. doi: 10.1126/science.aan8260
Painter S., Sanders R., Waldron H., Lucas M., Torres-Valdes S. (2008). Urea distribution and uptake in the Atlantic Ocean between 50°N and 50°S. Mar. Ecol. Prog. Ser. 368, 53–63. doi: 10.3354/meps07586
Palatinszky M., Herbold C., Jehmlich N., Pogoda M., Han P., von Bergen M., et al. (2015). Cyanate as an energy source for nitrifiers. Nature 524, 105–108. doi: 10.1038/nature14856
Parada A. E., Wollard J., Pett-ridge J., Mayali X., Weber P. K., Santoro A. E., et al. (2022). Constraining the composition and quantity of organic matter used by abundant marine Thaumarchaeota. Environ. Microbiol., 25, 689–704. doi: 10.1111/1462-2920.16299
Penn J. L., Weber T., Chang B. X., Deutsch C. (2019). Microbial ecosystem dynamics drive fluctuating nitrogen loss in marine anoxic zones. Proc. Natl. Acad. Sci. 116, 7220–7225. doi: 10.1073/pnas.1818014116
Peters B., Horak R., Devol A. H., Fuchsman C. A., Forbes M., Mordy C. W., et al. (2018). Estimating fixed nitrogen loss and associated isotope effects using concentration and isotope measurements of NO3–, NO2–, and N2 from the Eastern Tropical South Pacific oxygen deficient zone. Deep-Sea Res. Part II: Topical Stud. Oceanogr. 156, 121–136. doi: 10.1016/j.dsr2.2018.02.011
Pitt K. A., Welsh D. T., Condon R. H. (2009). Influence of jellyfish blooms on carbon, nitrogen and phosphorus cycling and plankton production. Hydrobiologia 616, 133–149. doi: 10.1007/s10750-008-9584-9
Priddle J., Whitehouse M. J., Atkinson A., Brierley A. S., Murphy E. J. (1997). Diurnal changes in near-surface ammonium concentration—interplay between zooplankton and phytoplankton. J. Plankton Res. 19, 1305–1330. doi: 10.1093/plankt/19.9.1305
Qin W., Amin S. A., Martens-Habbena W., Walker C. B., Urakawa H., Devol A. H., et al. (2014). Marine ammonia-oxidizing archaeal isolates display obligate mixotrophy and wide ecotypic variation. Proc. Natl. Acad. Sci. United States America 111, 12504–12509. doi: 10.1073/pnas.1324115111
Qin W., Wei S. P., Zheng Y., Choi E., Li X., Johnston J., et al. (2014). Ammonia-oxidizing bacteria and archaea exhibit differential nitrogen source preferencesx. Nat. Microbiol. 9, 524–536.
Rappe M. S., Connon S. A., Vergin K. L., Giovannoni S. J. (2002). Cultivation of the ubiquitous SAR11 marine bacterioplankton clade. Nature 418, 630–633. doi: 10.1038/nature00917
Revsbech N. P., Larsen L. H., Gundersen J., Dalsgaard T., Ulloa O., Thamdrup B. (2009). Determination of ultra-low oxygen concentrations in oxygen minimum zones by the STOX sensor. Limnol. Oceanogr.: Methods 7, 371–381. doi: 10.4319/lom.2009.7.371
Rii Y. M., Karl D. M., Church M. J. (2016). Temporal and vertical variability in picophytoplankton primary productivity in the North Pacific Subtropical Gyre. Mar. Ecol. Prog. Ser. 562, 1–18. doi: 10.3354/meps11954
Rocap G., Larimer F. W., Lamerdin J., Malfatti S., Chain P., Ahlgren N. A., et al. (2003). Genome divergence in two Prochlorococcus ecotypes reflects oceanic niche differentiation. Nature 424, 1042–1047. doi: 10.1038/nature01947
Santoro A. E., Dupont C. L., Richter R. A., Craig M. T., Carini P., McIlvin M. R., et al. (2015). Genomic and proteomic characterization of “Candidatus Nitrosopelagicus brevis”: An ammonia-oxidizing archaeon from the open ocean. Proc. Natl. Acad. Sci. 112, 1173–1178. doi: 10.1073/pnas.1416223112
Santoro A. E., Saito M. A., Goepfert T. J., Lamborg C. H., Dupont C. L., DiTullio G. R. (2017). Thaumarchaeal ecotype distributions across the equatorial Pacific Ocean and their potential roles in nitrification and sinking flux attenuation. Limnol. Oceanogr. 62, 1984–2003. doi: 10.1002/lno.10547
Schmitz R. A., Peeters S. H., Versantvoort W., Picone N., Pol A., Jetten M. S. M., et al. (2021). Verrucomicrobial methanotrophs: ecophysiology of metabolically versatile acidophiles. FEMS Microbiol. Rev. 45, fuab007. doi: 10.1093/femsre/fuab007
Shah V., Chang B. X., Morris R. M. (2017). Cultivation of a chemoautotroph from the SUP05 clade of marine bacteria that produces nitrite and consumes ammonium. ISME J. 11, 263–271. doi: 10.1038/ismej.2016.87
Shah V., Morris R. M. (2015). Genome sequence of “Candidatus thioglobus autotrophica” Strain EF1, a chemoautotroph from the SUP05 clade of marine. Genome Announcements 3, e01156–e01115. doi: 10.1128/genomeA.01156-15.Copyright
Shah V., Zhao X., Lundeen R. A., Ingalls A. E., Nicastro D., Morris R. M. (2019). Morphological plasticity in a sulfur-oxidizing marine bacterium from the SUP05 clade enhances dark carbon fixation. mBio 10, e00216–e00219. doi: 10.1128/mBio.00216-19
Shiozaki T., Hashihama F., Endo H., Ijichi M., Takeda N., Makabe A., et al. (2021). Assimilation and oxidation of urea-derived nitrogen in the summer Arctic Ocean. Limnol. Oceanogr. 66, 4159–4170. doi: 10.1002/lno.11950
Sieburth J. N., Johnson P. W., Eberhardt M. A., Sieracki M. E., Lidstrom M., Laux D. (1987). The first methane-oxidizing bacterium from the upper mixing layer of the deep ocean: Methylomonas pelagica sp. nov. Curr. Microbiol. 14, 285–293. doi: 10.1007/BF01568138
Spieck E., Keuter S., Wenzel T., Bock E., Ludwig W. (2014). Characterization of a new marine nitrite oxidizing bacterium, Nitrospina watsonii sp. nov., a member of the newly proposed phylum “Nitrospinae. Systematic Appl. Microbiol. 37, 170–176. doi: 10.1016/j.syapm.2013.12.005
Stramma L., Johnson G. C., Sprintall J., Mohrholz V. (2008). Expanding oxygen-minimum zones in the tropical oceans. Science 320, 655–658. doi: 10.1126/science.1153847
Sun J., Steindler L., Thrash J. C., Halsey K. H., Smith D. P., Carter A. E., et al. (2011). One carbon metabolism in SAR11 pelagic marine bacteria. PloS One 6, e23973–e23973. doi: 10.1371/journal.pone.0023973
Sun X., Ward B. B. (2021). Novel metagenome-assembled genomes involved in the nitrogen cycle from a Pacific oxygen minimum zone. ISME Commun. 1, 26. doi: 10.1038/s43705-021-00030-2
Takeda N., Hashihama F., Kanda J. (2020). Automated colorimetric determination of nanomolar urea in seawater by gas-segmented continuous flow analysis using a liquid waveguide capillary cell. Talanta 208, 120371. doi: 10.1016/j.talanta.2019.120371
Thibodeau P. S., Steinberg D. K., Maas A. E. (2020). Effects of temperature and food concentration on pteropod metabolism along the Western Antarctic Peninsula. J. Exp. Mar. Biol. Ecol. 530–531, 151412–151412. doi: 10.1016/j.jembe.2020.151412
Tiano L., Garcia-Robledo E., Dalsgaard T., Devol A. H., Ward B. B., Ulloa O., et al. (2014). Oxygen distribution and aerobic respiration in the north and south eastern tropical Pacific oxygen minimum zones. Deep Sea Res. Part I: Oceanographic Res. Papers 94, 173–183. doi: 10.1016/j.dsr.2014.10.001
Tolar B. B., Wallsgrove N. J., Popp B. N., Hollibaugh J. T. (2017). Oxidation of urea-derived nitrogen by thaumarchaeota-dominated marine nitrifying communities. Environ. Microbiol. 19, 4838–4850. doi: 10.1111/1462-2920.13457
Tripp H. J. (2013). The unique metabolism of SAR11 aquatic bacteria. J. Microbiol. 51, 147–153. doi: 10.1007/s12275-013-2671-2
Tsementzi D., Wu J., Deutsch S., Nath S., Rodriguez-R L. M., Burns A. S., et al. (2016). SAR11 bacteria linked to ocean anoxia and nitrogen loss. Nature 536, 179–183. doi: 10.1038/nature19068
Ulloa O., Henríquez-Castillo C., Ramírez-Flandes S., Plominsky A. M., Murillo A. A., Morgan-Lang C., et al. (2021). The cyanobacterium Prochlorococcus has divergent light-harvesting antennae and may have evolved in a low-oxygen ocean. Proc. Natl. Acad. Sci. United States America 118, e2025638118–e2025638118. doi: 10.1073/pnas.2025638118
van de Vossenberg J., Woebken D., Maalcke W. J., Wessels H. J. C. T., Dutilh B. E., Kartal B., et al. (2013). The metagenome of the marine anammox bacterium ‘Candidatus Scalindua profunda’ illustrates the versatility of this globally important nitrogen cycle bacterium. Environ. Microbiol. 15, 1275–1289. doi: 10.1111/j.1462-2920.2012.02774.x
Walsh D. A., Zaikova E., Howes C. G., Song Y. C., Wright J. J., Tringe S. G., et al. (2009). Metagenome of a versatile chemolithoautotroph from expanding oceanic dead zones. Science 326, 578–582. doi: 10.1126/science.1175309
Webb K. L., Johannes R. E. (1967). Studies of the release of dissolved free amino acids by marine zooplankton. Limnol. Oceanogr. 12, 376–382. doi: 10.4319/lo.1967.12.3.0376
Widner B., Fuchsman C. A., Chang B. X., Rocap G., Mulholland M. R. (2018a). Utilization of urea and cyanate in waters overlying and within the eastern tropical north Pacific oxygen deficient zone. FEMS Microbiol. Ecol. 94, fiy138. doi: 10.1093/femsec/fiy138
Widner B., Mordy C. W., Mulholland M. R. (2018b). Cyanate distribution and uptake above and within the Eastern Tropical South Pacific oxygen deficient zone. Limnol. Oceanogr. 63, 177–192. doi: 10.1002/lno.10730
Widner B., Mulholland M. R. (2017). Cyanate distribution and uptake in North Atlantic coastal waters. Limnol. Oceanogr. 62, 2538–2549. doi: 10.1002/lno.10588
Widner B., Mulholland M. R., Mopper K. (2013). Chromatographic determination of nanomolar cyanate concentrations in estuarine and sea waters by precolumn fluorescence derivatization. Anal. Chem. 85, 6661–6666. doi: 10.1021/ac400351c
Widner B., Mulholland M. R., Mopper K. (2016). Distribution, sources, and sinks of cyanate in the coastal North atlantic ocean. Environ. Sci. Technol. Lett. 3, 297–302. doi: 10.1021/acs.estlett.6b00165
Wishner K. F., Seibel B., Outram D. (2020). Ocean deoxygenation and copepods: Coping with oxygen minimum zone variability. Biogeosciences 17, 2315–2339. doi: 10.5194/bg-17-2315-2020
Wong J. C. Y., Raven J. A., Aldunate M., Silva S., Gaitán-Espitia J. D., Vargas C. A., et al. (2023). Do phytoplankton require oxygen to survive? A hypothesis and model synthesis from oxygen minimum zones. Limnol. Oceanogr. 68, 1417–1437. doi: 10.1002/lno.12367
Yamashita Y., Tanoue E. (2003). Distribution and alteration of amino acids in bulk DOM along a transect from bay to oceanic waters. Mar. Chem. 82, 145–160. doi: 10.1016/S0304-4203(03)00049-5
Zhang I. H., Fortin S. G., Ward B. B., Babbin A. R. (2023). Partitioning of the denitrification pathway and other nitrite metabolisms within global oxygen deficient zones. ISME Commun. 3, 76. doi: 10.1038/s43705-023-00284-y
Zinser E. R., Johnson Z. I., Coe A., Karaca E., Veneziano D., Chisholm S. W. (2007). Influence of light and temperature on Prochlorococcus ecotype distributions in the Atlantic Ocean. Limnol. Oceanogr. 52, 2205–2220. doi: 10.4319/lo.2007.52.5.2205
Keywords: oxygen deficient zones, urea, cyanate, urease, cyanase, Hawaii Ocean Time Series
Citation: Huanca-Valenzuela P, Cram JA and Fuchsman CA (2024) Niche differentiation in microorganisms capable of using alternative reduced nitrogen sources studied across depth and between oxic and anoxic ocean regions. Front. Mar. Sci. 11:1386686. doi: 10.3389/fmars.2024.1386686
Received: 15 February 2024; Accepted: 18 June 2024;
Published: 16 July 2024.
Edited by:
Li Jianlon, Shandong University, ChinaReviewed by:
Karen L. Casciotti, Stanford University, United StatesXin Sun, Carnegie Institution for Science (CIS), United States
Copyright © 2024 Huanca-Valenzuela, Cram and Fuchsman. This is an open-access article distributed under the terms of the Creative Commons Attribution License (CC BY). The use, distribution or reproduction in other forums is permitted, provided the original author(s) and the copyright owner(s) are credited and that the original publication in this journal is cited, in accordance with accepted academic practice. No use, distribution or reproduction is permitted which does not comply with these terms.
*Correspondence: Clara A. Fuchsman, Y2Z1Y2hzbWFuQHVtY2VzLmVkdQ==