 Gen Liu1,2,3
 Feng Cai1,2*
 Hongshuai Qi1,2Jianhui Liu1,2
 Chao Cao1,2
 Shaohua Zhao1,2Yanyu He1,2
 Jun Zhu2,4Chao Yin5Wenyuan Mo6
- 1Third Institute of Oceanography, Ministry of Natural Resources, Xiamen, China
- 2Key Laboratory of Marine Ecological Conservation and Restoration, Ministry of Natural Resources, Xiamen, China
- 3Hainan Key Laboratory of Marine Geological Resources and Environment, Haikou, China
- 4School of Hydraulic Engineering, Ludong University, Yantai, China
- 5Hainan Academy of Ocean and Fisheries Sciences, Haikou, China
- 6School of Civil Engineering and Architecture, Hainan University, Haikou, China
As escalating environmental pressures threaten the world’s beaches, understanding the driving factors influencing their geomorphological changes is of critical global importance. This study focuses on the morphological changes of Sigeng beach adjacent to Changhua River Mouth in Hainan Island, China through decadal monitoring of shoreline and profile topography and tries to illuminate the natural and anthropogenic factors that drove geomorphological changes. The results showed that Sigeng beach undergone significant changes between 2008 and 2024, with notable accretion at the northernmost and southernmost and general erosion at other sections. The shoreline change rates ranged between -18.4 m/yr and 13.0 m/yr, with the average rate of -1.9 m/yr, indicating overall erosion. The net longshore sediment transport (LST) rates along Sigeng beach was estimated through the combination of the cross-shore (profile) and longshore (shoreline) changes. The overall direction of net LST along the beach were southward, except for the northern section where the direction was northward due to the diffraction of NE waves by the long sand spit at the northernmost. The net LST rates at each profile varied from 0.8×10⁴ m3/yr to 3.5×10⁴ m3/yr. The main factors controlling Sigeng beach evolution, including seasonal wave action and reduction in fluvial sediment load, followed by sand spit and coastal structures, typhoon events, aeolian transport, and sea level rise, were discussed. Subsequently, adaptive protection measures, including beach nourishment, accompanied with groin system or multiple detached breakwaters were proposed to combat with beach erosion. The analysis presented in this study is helpful to understand the morphodynamics and to predict the future change of beaches.
1 Introduction
Sandy beaches, accounting for about one-third of the world’s coastlines, are not only important tourism resources and biological habitats, but also the first line of defense for the coast, providing crucial protect for coastal populations and infrastructure (Temmerman et al., 2013; Luijendijk et al., 2018). As loose sediment accumulations, beaches are fragile and highly dynamic in coastal areas where the atmosphere, hydrosphere and lithosphere interact (Vousdoukas et al., 2020). In past decades, beaches are undergoing rapid changes under threat from the combined effects of natural processes (longshore currents, waves, tidal fluctuations, sediment transport, and surround environment) (Short, 1999; Masselink et al., 2016; Bozzeda et al., 2023), anthropogenic pressure (Mentaschi et al., 2018; Syvitski et al., 2022) and climate change (Ranasinghe, 2016; Almar et al., 2023). Analysis of satellite-derived shoreline data indicates that 24% of the world’s sandy beaches are eroding at rates exceeding 0.5 m/yr (Luijendijk et al., 2018). In China, over 50% of the sandy beaches suffer from erosion (Hou et al., 2016). In the future, beach erosion is likely to be exacerbated by rising sea levels and more frequent extreme events under climate change (Ranasinghe, 2016; Vousdoukas et al., 2020; Shi et al., 2024). Severe beach erosion has led to the loss of land, damage of coastal infrastructures, and even relocation of residents, placing oceanfront ecosystems and population at great risk (Beck et al., 2018; Vousdoukas et al., 2020; Li et al., 2024). Therefore, understanding the morpho-dynamic evolution of beaches and identifying the erosion causes and mechanism is crucial for coastal protection and management.
Whether long-term beach erosion occurs depends ultimately/primarily on the state of the sediment budget for a particular part of the coast (Bowen and Inman, 1966; Rosati, 2005; Thom et al., 2018). If the sediment losses exceed the gains within a compartment over a period of time, then the shoreline within that compartment will recede. Various natural and man-induced causes could lead to long-term beach erosion (Dean and Galvin, 1976; Komar, 1998; Woodroffe, 2002; Cai et al., 2009; Van Rijn, 2011; Pranzini et al., 2015; Bozzeda et al., 2023). Beach erosion can be induced by prolonged sea level rise, increased storm frequency and intensity, and increasing frequency of extreme ENSO (El Niño-Southern Oscillation) events as a consequence of global warming (Hinkel et al., 2013; Barnard et al., 2015; Ranasinghe, 2016; Passeri et al., 2018; Vousdoukas et al., 2020). Shoreline recession can also result from continuously decreasing sediment inputs from adjacent rivers due to damming, afforestation and channel solidification (Syvitski et al., 2005, 2022). Coastal human activities, such as dredging, sand extraction (Peduzzi, 2014; Bendixen et al., 2019; UNEP, 2022; Rangel-Buitrago et al., 2023), construction of coastal structures (such as groins, jetties, seawalls, breakwaters and harbors) (de Schipper et al., 2021), could also trigger beach erosion. For the beaches along Hainan Island, extensive studies have been conducted on the dynamic changes, erosion characteristics and causes, and the impact of human activities previously (e.g., Gong et al., 2017; Ran et al., 2017; Zhong, 2017; Tian et al., 2018; Li et al., 2019; Shi et al., 2021b). Luo and Luo (1995) were the earliest to analyze the relationship between human activities and sandy coast erosion in Hainan Island. Huang and Wu (1997) attributed the coastal erosion on Hainan Island to sea level rise. Then, Huang and Luo (2003) and Ji et al. (2007) demonstrated that Hainan Island’s beach erosion is mainly related to insufficient sediment supply, sea level rise, tectonic subsidence, changes in climate and human activities. Recently, He et al. (2021); Li (2021) and Shi et al. (2021b) analyzed some local sites of beach erosion. However, previous studies have focused on the qualitative description of beach erosion rather than quantitative elaboration on the causes of beach erosion, especially the contribution of longshore sediment transport (LST).
On coastal beaches, waves are the main forces that drive sediment transport in the breaker zone, then shaping beach morphology (Komar, 1998; de Vries et al., 2020; Short and Jackson, 2022). When waves propagate from deep water to nearshore, they will finally break on the beach after shoaling and surfing process. Once waves break, they will suspend quantities of sand particles and produce currents; wave-induced currents then will simply transport the suspended particles. Oblique waves could cause sediment movement in two directions in the surf zone, cross-shore (perpendicular to the shoreline) and longshore (parallel to the shoreline) (Komar and Inman, 1970; Longuet-Higgins, 1970). The sediment movement in cross-shore causes beach morphology changes at short-term period, while the sediment movement in longshore determines the long-term evolution of coastal beaches (Dean and Galvin, 1976; Komar, 1998; Chen et al., 2010; Van Rijn, 2011). Thus, for a specific beach, a detailed LST pattern (including the magnitude and direction) is of paramount importance to understand the morphological evolution and predict the future change of the beach. For beaches with varied wave climate, LST can occur in both alongshore directions, and the net LST determines the accretion or erosion of the beach. Also, the LST along a sandy beach system varies in the alongshore direction due to the alongshore variation in waves, beach morphology, and also coastal structures. In estimating wave-driven LST, bulk formulations are often used (Inman and Bagnold, 1963; Kamphuis and Readshaw, 1978; Kamphuis, 1991; Komar, 1998; Bayram et al., 2007; Mil-Homens et al., 2013).The most commonly used formula is the CERC formulation (CERC, 1984). Numerical models (such as UNIBEST CL +, LITPACK and GENESIS) are also developed to provide elaborate estimations of cumulative LST (de Vries et al., 2020). These models incorporate the processes of bedload transport and the complex dependencies between grain size, local wave and current energy (de Vries et al., 2020). However, some of wave and current forcing processes are simplified in these formulations or models, leading to uncertainties in estimating the amount of net LST at arbitrary locations. For example, CERC (1984) and Kamphuis (1991) only consider wave-induced currents and ignore wind and tidal currents and alongshore varying wave heights that can also affect this transport. Beach sediment grain size that generally vary alongshore and cross-shore is considered as longshore-uniform for the purpose of simplification in almost all existing formulas and models. Moreover, these empirical formulas and models require reliable and continuous wind and wave data with field studies and need to be calibrated or supported by field measurements. A small error in the wave angle (an order of 1.5–2°) at breaking will result in a large error in estimating LST (Bertin et al., 2008). Since LST mainly occurs across the surf and swash zone, repeated topography surveys of them can measure the bed-level changes and hence provide much precise estimations of net LST. For this purpose, this study try to estimate the net LST rate along a sandy beach through the combination of the cross-shore (profile) and longshore (shoreline) changes.
This research focuses on the decadal evolution of Sigeng beach along the western coast of Hainan island, where multiple wind generators were built along the coast. Some of the wind generator bases have been directly exposed to the seawater due to beach erosion and shoreline recession. This research aims to analyze the evolution patterns of Sigeng beach by repeated surveys and provide a better framework for the understanding and interpretation of beach erosion, which would be beneficial for coastal researchers and decision-makers to adopt appropriate and sustainable management measures. The main purposes of this research includes: (1) to identify the morphological changes along the beach, (2) to quantify the LST rates, and (3) to illuminate the drivers of beach evolution.
2 Materials and methods
2.1 Study area
Sigeng beach is located to the south of Changhua River Estuary, the western coast of Hainan Island, China (Figures 1A, B). The beach extends from Danyuan Village in the north and to Sigeng Sand Spit in the south, with a total length of approximately 8.1 km (Figure 1C). The north of the beach is a long narrow spit and the south is Beili bay. The coastline is straight, facing west to the open sea. Along the beach, there are two obvious artificial structures. In the north, there is a wind generator base with a size of 60 m × 70 m protrude out to sea, whose effect on the beach is similar to that of a groin (Figures 1D, E). In the south, there is a sand groin perpendicular to the coast, with a length of approximately 90 m (Figure 1F). The beach could be divided into three segments by the two artificial structures: northern, middle and southern, with the lengths of each section being 2000 m, 3300 m and 2800 m, respectively (Figure 1C). The beach slope is relatively steep, with about 10°. Aeolian sand dunes are widely developed in the backshore area of Sigeng beach. Most of dunes are continuously spread out, extending from hundreds of meters to thousands of meters parallel to the coastline. The height of the dunes generally ranges from 0.2 to 1.0 m along the beach, with variation alongshore. The mean grain size of beach sediment ranges from 0.23 mm to 0.51 mm, with well-sorted sands (HAOFS, 2014).
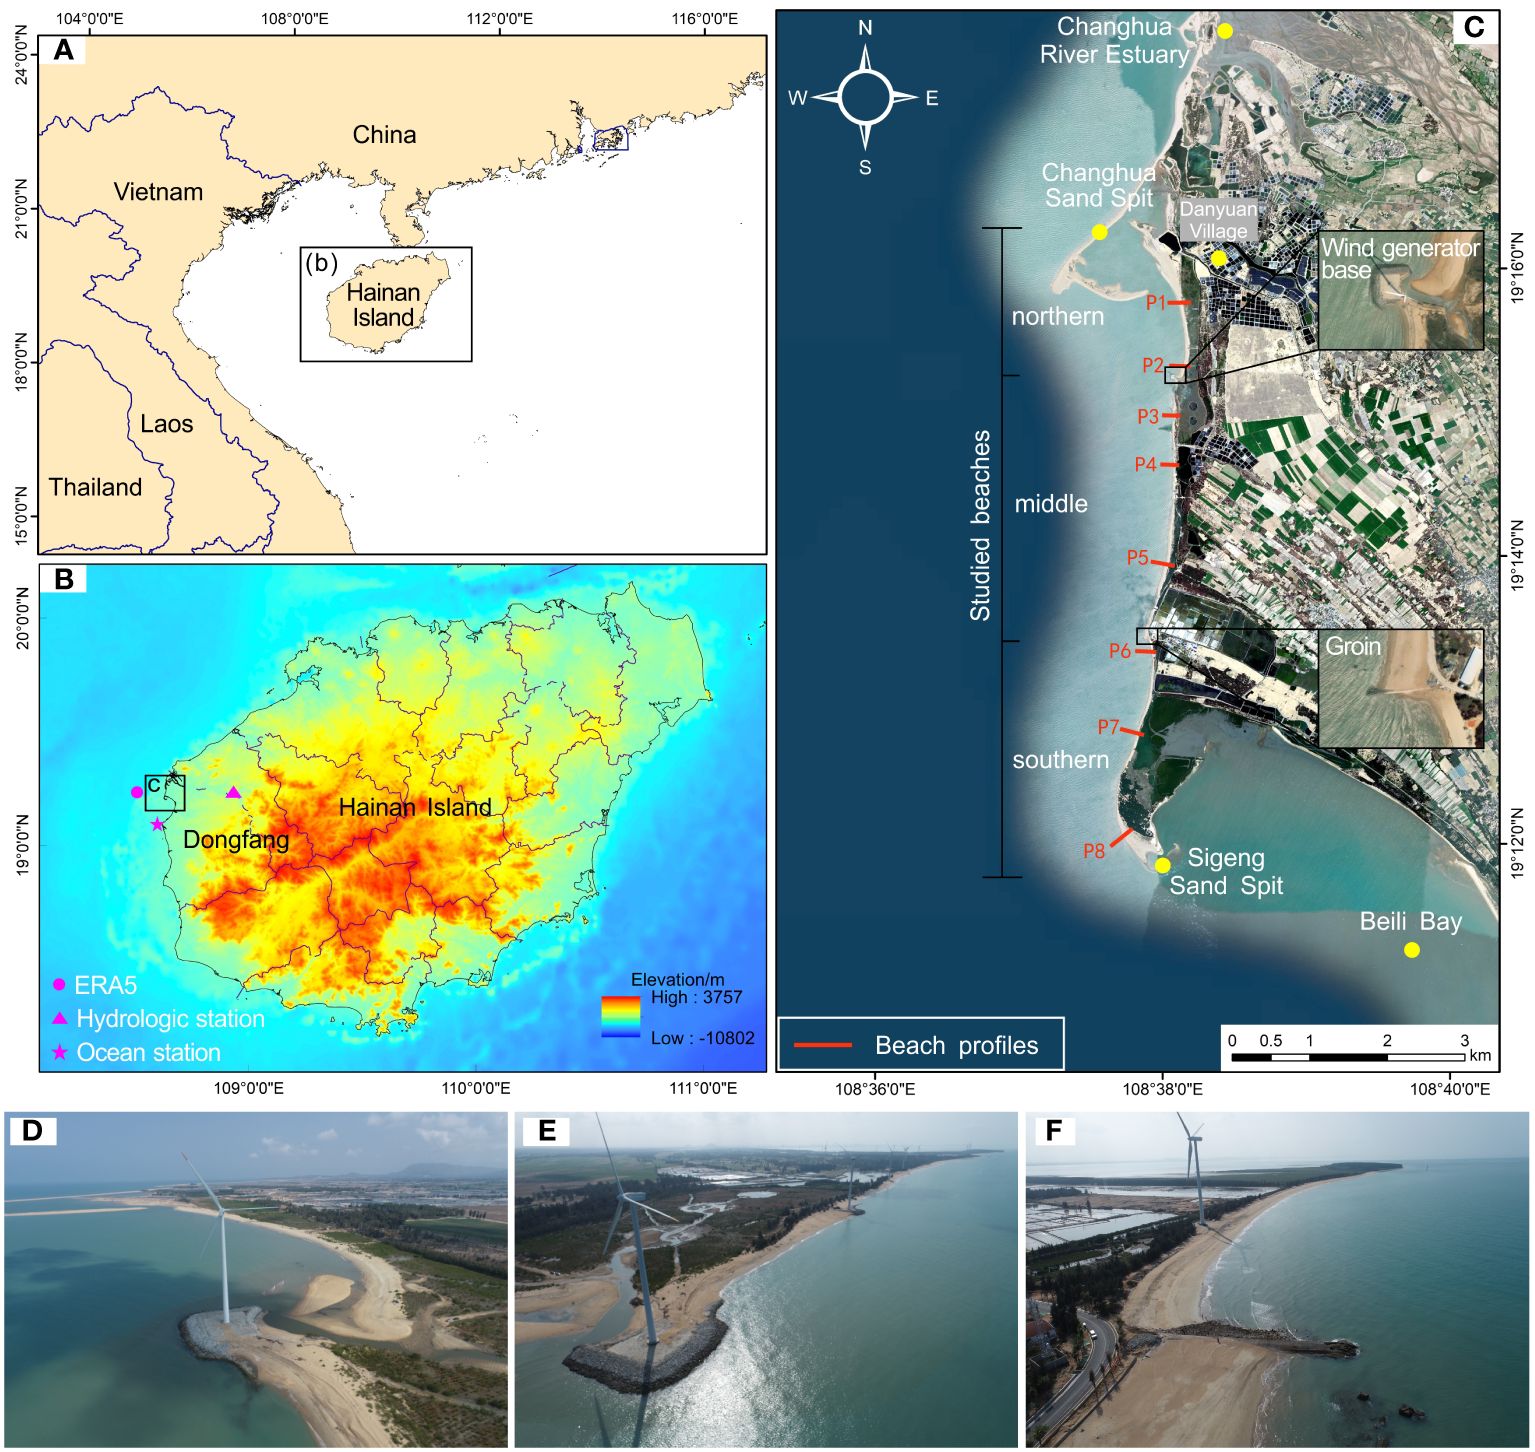
Figure 1 The study area. (A) and (B) Location map of Sigeng beach, which is located at the western coast of Hainan Island, China. ERA5 is the extraction point of hindcast wave data for the study area. (C) Geomorphology of Sigeng beach, which is positioned to the south of Changhua River Estuary. Both of the ends of the beach are sand spits. Sigeng beach is interrupted by a wind generator base and a groin in the northern and southern, respectively (inserted figures). (D), (E), and (F) are aerial photos (taken by DJI Phantom 4 UAV at an altitude of approximately 90 meters in 02/03/2024) of the northern, middle, and southern segment of Sigeng beach, respectively.
According to Dongfang marine observation station (including tidal water levels, waves and winds, 19°05′57″N, 108°36′51″E, Figure 1B), 14 km south of the study area, the tides are regular daily, with an average tidal range of 1.69 m. The maximum tidal range is 3.31 m, and the minimum tidal range is 0.30 m. The mean water level is 0.52 m (above the National Vertical Datum of China 1985 (NVDC85)), with the mean high and low water level of 1.41 m and -0.29 m, respectively. The tidal current in this sea area is reciprocating, flowing to the NE at flood tide and to the SW at ebb tide. The flood tide speed is 0.05–0.41 m/s, and the ebb tide speed is 0.16–0.66 m/s. The waves in the study area are mixed waves dominated by wind waves, accounting for nearly 62.4%. The dominant waves are from SSW, SW, NNE, NNW, and N in order. The strong wave directions are mainly SSW-SW and NNW. There are obvious seasonal changes in the wave climate caused by the monsoons. In summer (June, July, and August), waves are mainly from south, with a SSW-W frequency of 64.2%. In winter (December, January and February), waves are mainly from north, with NW-NE frequency of 64.5%. The average H1/10 is 0.8 m, and the average wave period is 3.4 s (HODPDI, 2013). The frequency of waves below 0.5 meters accounts for 35.5%, and the frequency of waves below 1.5 m accounts for 99.2%. The western coast of Hainan Island has a tropical monsoon oceanic climate, with the least precipitation, the driest, the highest average wind speed and the largest number of windy days in Hainan Island. According to the statistical data of the wind speed, the dominant wind direction in this area is NE, with an occurrence frequency of 23%, and the sub-normal wind direction is S, with an occurrence frequency of 13%.The average wind speed is 4.26 m/s. Strong winds, higher than 10.80 m/s, are generally from NNE and SW. Across the whole year, the wind speeds in May, June, July, November and December are relatively higher (PCZECL, 2008).
2.2 Topographic surveys
Shoreline change is one of the important parameters for quantifying beach changes. Among the various indicators and methods of shoreline positions (Boak and Turner, 2005), the actual traces formed at the high tide spring were adopted to indicate the shoreline position in this study. Specifically at Sigeng beach, scarps, aquatic plant residues and other garbage residue zones (Figures 2A-D) were identified as shoreline traces. In field surveys, the above trace line is precisely determined by a walking man with a Global Navigation Satellite System-Real Time Kinematic (GNSS-RTK, Stonex S9II) at distance intervals. Four repeated measurements were conducted on the study beach shoreline in July 2008, June 2014, September 2021, and February 2024 (Figure 2E). All of the shoreline surveys were conducted in calm weather and during spring tides, aiming to minimize the tidal effects on shoreline locations (Liu et al., 2022b). The estimated horizontal position error was less than 2 m for each of these surveyed shorelines.
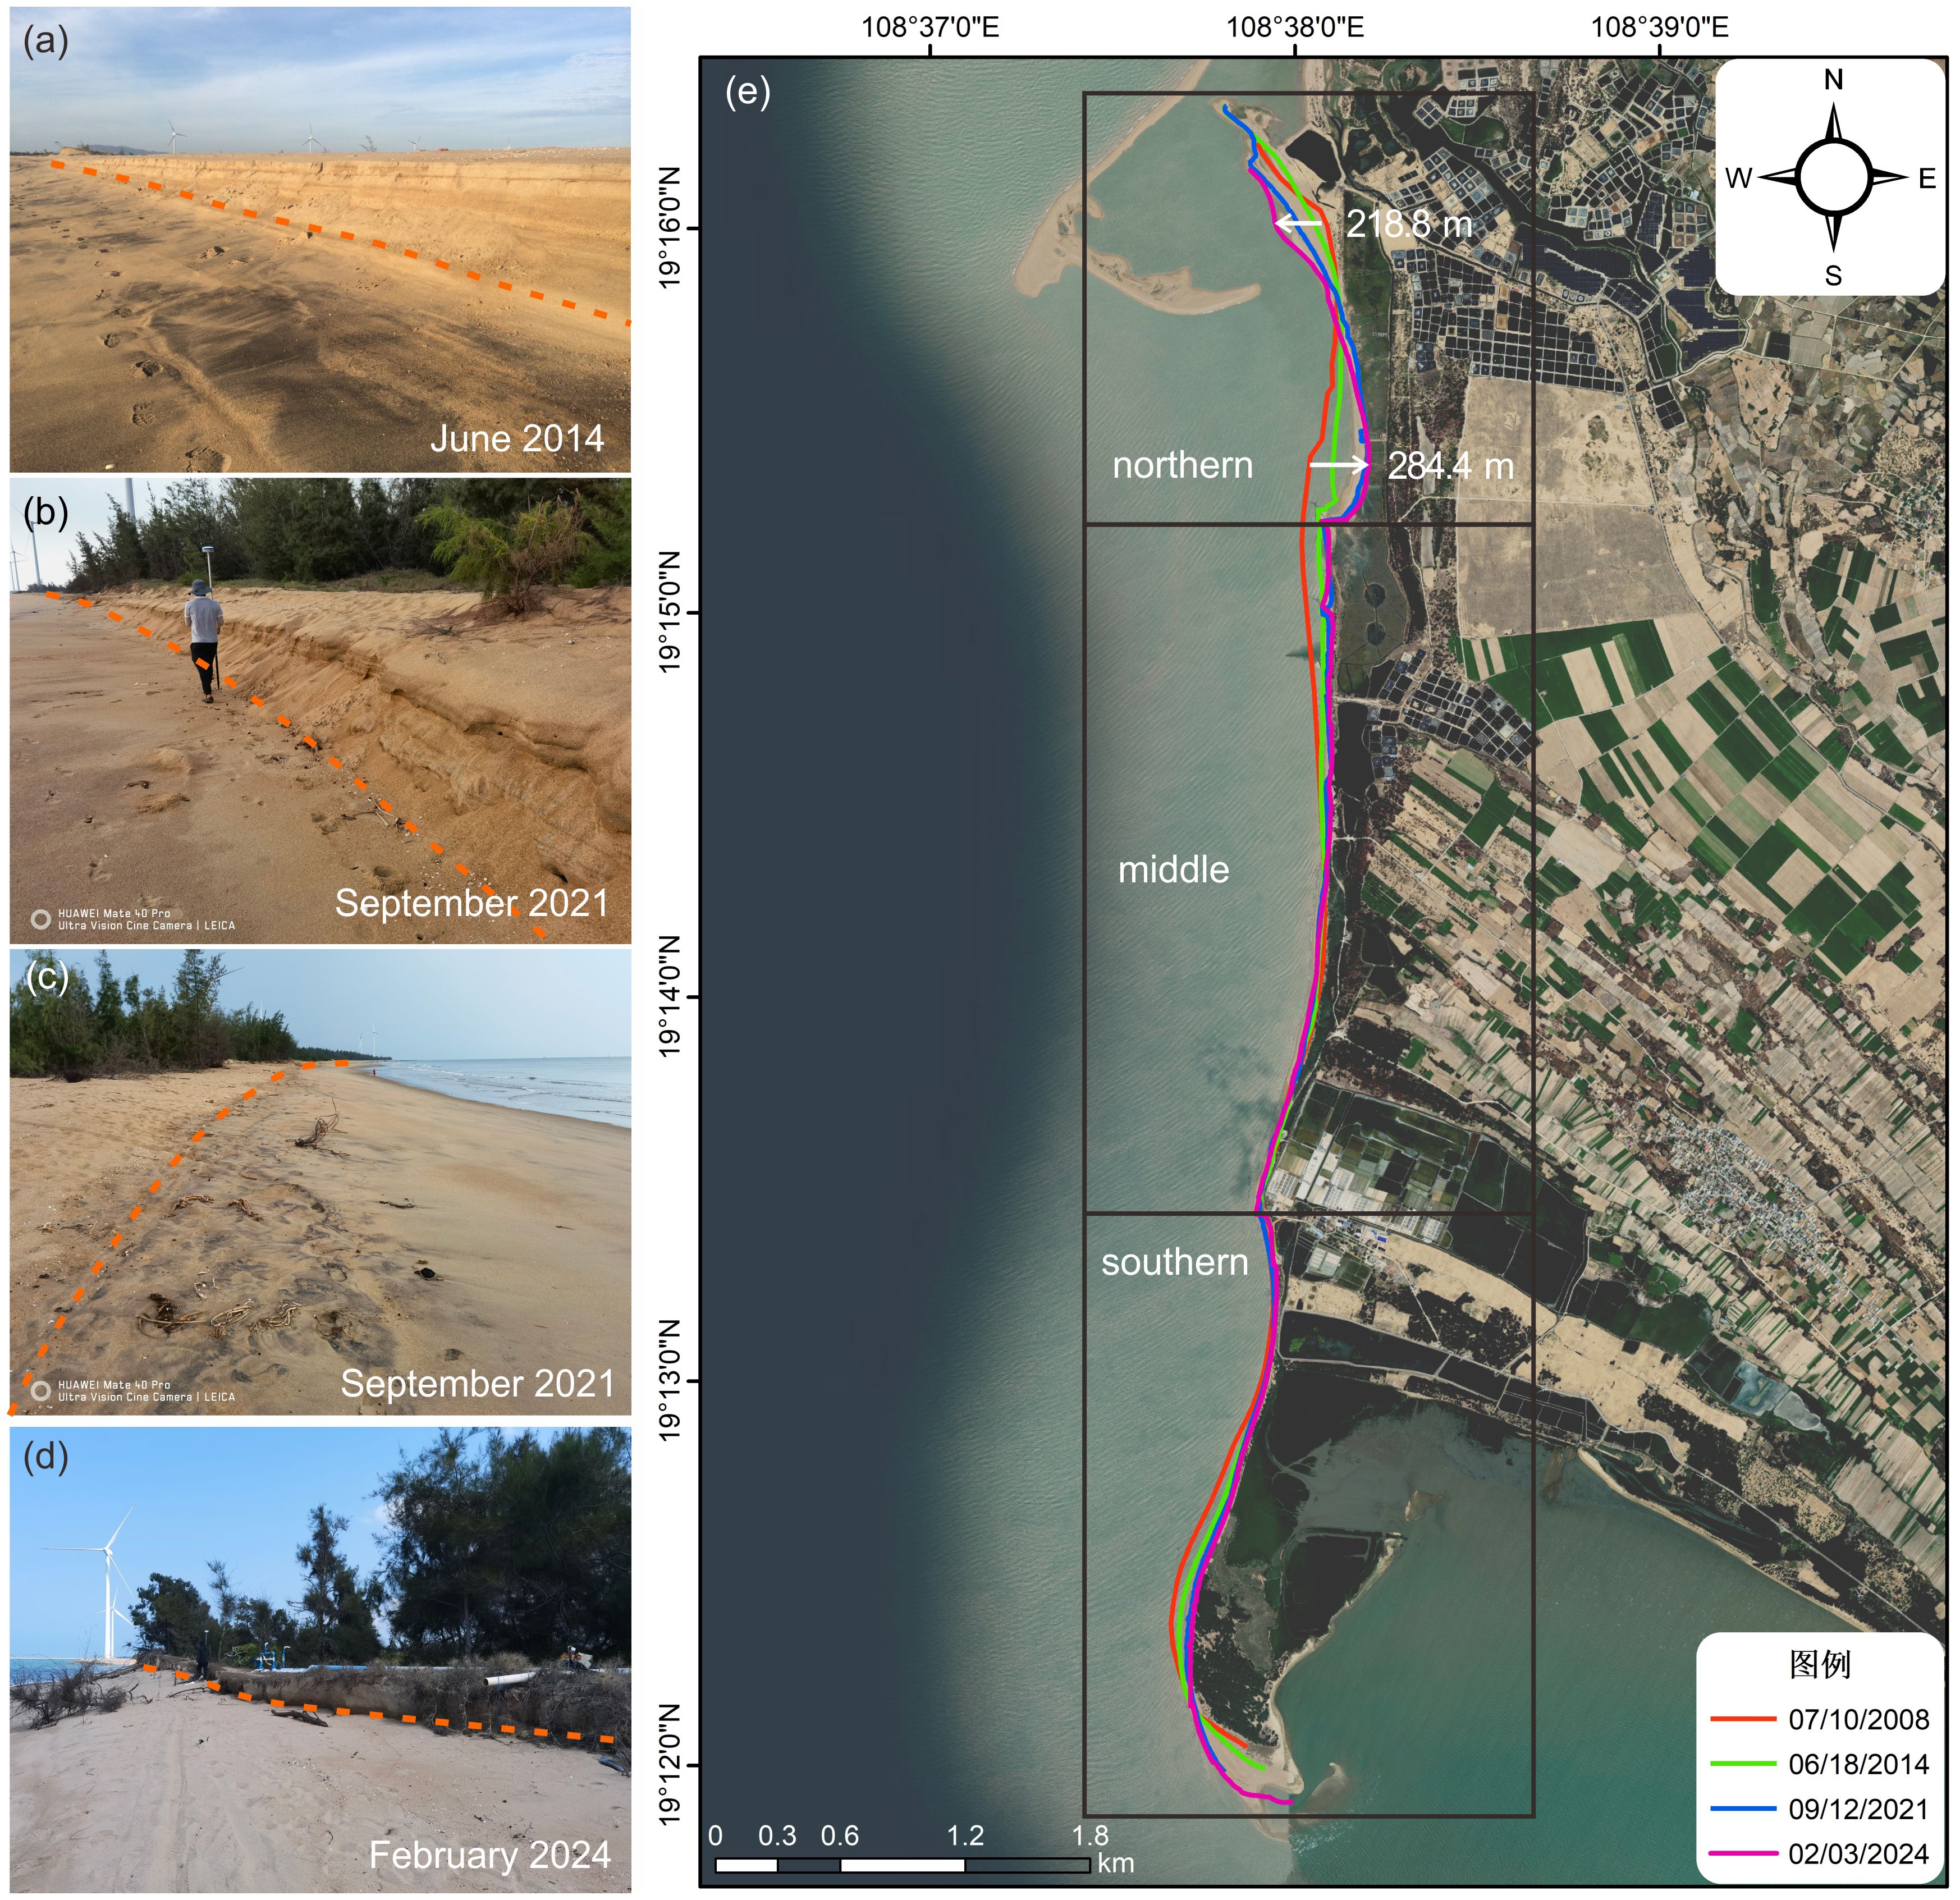
Figure 2 Shoreline position measured in field surveys. The orange dashed lines in (A-D) indicate the position of the measured beach shorelines. (E) shows the four measured shorelines in different periods, with the extremum of shoreline change to the sea and land highlighted.
In addition, eight beach profiles named P1 to P8 from north to south along Sigeng beach (as indicated in Figure 1C), with a profile spacing of 600 m to 1200 m, were monitored. Profile topography was surveyed repeatedly in June 2014, September 2021, and February 2024. These topographic surveys were implemented in calm weather and spring low tides in order to obtain a full topography of the subaerial beach. The surveys covered from the coastal forest or top of the dune to the depth of wading, and the distance between measurement points was less than 2 m. Both of the horizontal and vertical errors of the GNSS-RTK are less than 2 cm. All the elevations were referenced to the NVDC85. Changes in dry beach width and sand volume per width are two important indicators for assessing beach change patterns. In this paper, the dry beach width is defined as the horizontal distance between the shoreline position (the intersection of the approximately 2.4 m contour line and the actual beach profile) and the starting point of the beach profile. The net change in sand volume per width is defined as the net closed area of the two profiles (Figure 3).
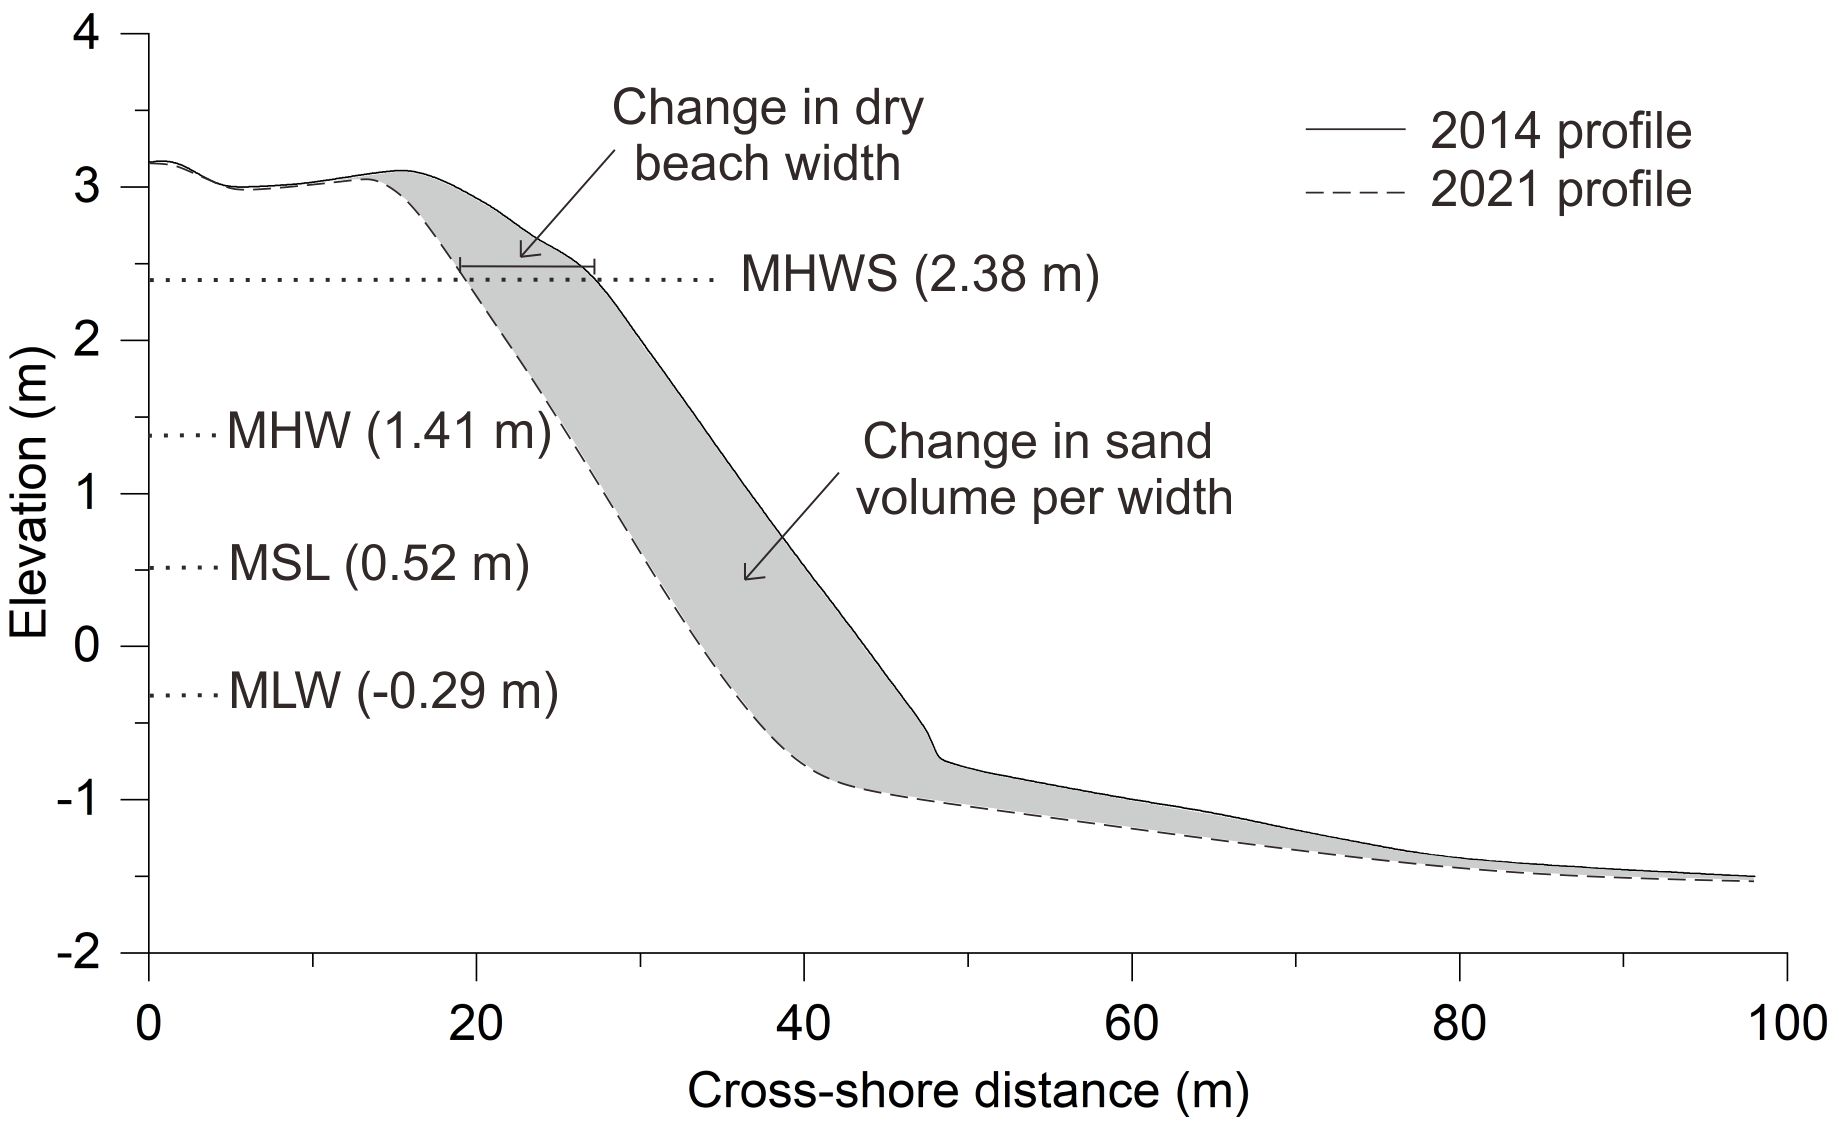
Figure 3 The schematic diagram of a typical beach profile, showing the changes in dry beach width and sand volume per width between two successive beach profiles. Some significant contour lines are also indicated.
2.3 Shoreline change analysis and future shoreline forecast
In order to quantify the shoreline change rates, the Digital Shoreline Analysis System (DSAS, version 5.1) developed by the U.S. Geological Survey was used (Himmelstoss et al., 2021a). DSAS is an add-in to Esri ArcGIS Desktop that enables a user to calculate rate-of-change statistics from a time series of vector shoreline positions by establishing baseline, inputting shorelines, generating transects and computing rate-of-change calculations (Himmelstoss et al., 2021b). This application has been widely used to evaluate shoreline changes (Anthony et al., 2019; Liu et al., 2022b). In this study, the transect distance was set as 20 m, and a total of approximately 400 transects were generated along this beach. To track the shoreline change in different periods, the shoreline change rates during three periods 2008–2014, 2014–2021, and 2021–2024 were calculated by the endpoint rate (EPR) method, and the respective confidences were estimated at 0.47 m/yr, 0.39 m/yr, and 1.18 m/yr following the method of Himmelstoss et al. (2021b). Moreover, the shoreline change rates during the full period 2008–2024 were quantified by the linear regression rate (LRR) method.
The shoreline position movement in 10 years ahead was projected by the DSAS forecasting tool based on historical shoreline position data (Himmelstoss et al., 2021a). The shoreline forecasting calculation is done by using the Kalman filter (Kalman, 1960), as developed by Long and Plant (2012), to forecast future shoreline positions by combining observed shoreline positions with model-derived positions. The methodology assumes that a linear regression thorough past shoreline positions is a good approximation for future shoreline positions (Himmelstoss et al., 2021a). The Kalman filter model in DSAS has been used to forecast the future movement of the shoreline of the various areas (Awad and El-Sayed, 2021; Nicu, 2021; Nijamir et al., 2023; Akdeniz and İnam, 2023).
2.4 Wave modeling
Numerical simulation was carried out to study the nearshore wave features prevailing along the coast. In this study, MIKE 21 Spectral Wave (SW) was used to simulate the wave propagation and transformation from offshore to nearshore region. MIKE 21 SW, as a third generation spectral wind-wave model based on unstructured meshes, simulates the growth, decay, propagation and transformation of wind-generated waves and swells in offshore and coastal areas (DHI, 2024). It has been widely used for the generation and transformation of wind waves in coastal areas (Moeini and Etemad-Shahidi, 2007; Nativí-Merchán et al., 2021; Joensen and Bingham, 2023). Nested grid technology was applied in this study, with coarser grids at the offshore area and refined ones nearshore. The total number of elements of the wave model is 23287 (Figure 4B). The bathymetry was obtained from measured and chart data (Figure 4A). The offshore wave data was derived from the ERA5 hourly data, developed by the European Centre for Medium-Range Weather Forecasts (ECMWF) and downloaded through the online climate data store (https://cds.climate.copernicus.eu). ERA5 wave data has been validated and assessed by extensive studies (Shi et al., 2021a; Liu et al., 2022a; Wang and Wang, 2022; Shi et al., 2024), and shows skillful capability to reproduce global wave fields (Hersbach et al., 2020). In this study, a whole year of time-series hourly wave data (Hs, Tp, Dir) from July 1st 2008 to June 30th 2009 at a simulation point (19.25N, 108.5E), which is located around 13 km offshore of the study area, close to the 30 m bathymetry, was used to force the simulation. This wave model has been validated by TIO (2023). The nearshore wave fields in summer monsoon period (June to August) and winter monsoon period (December to February) were simulated to reveal the seasonal changes in wave forces that drive sediment movement and beach morphology change.
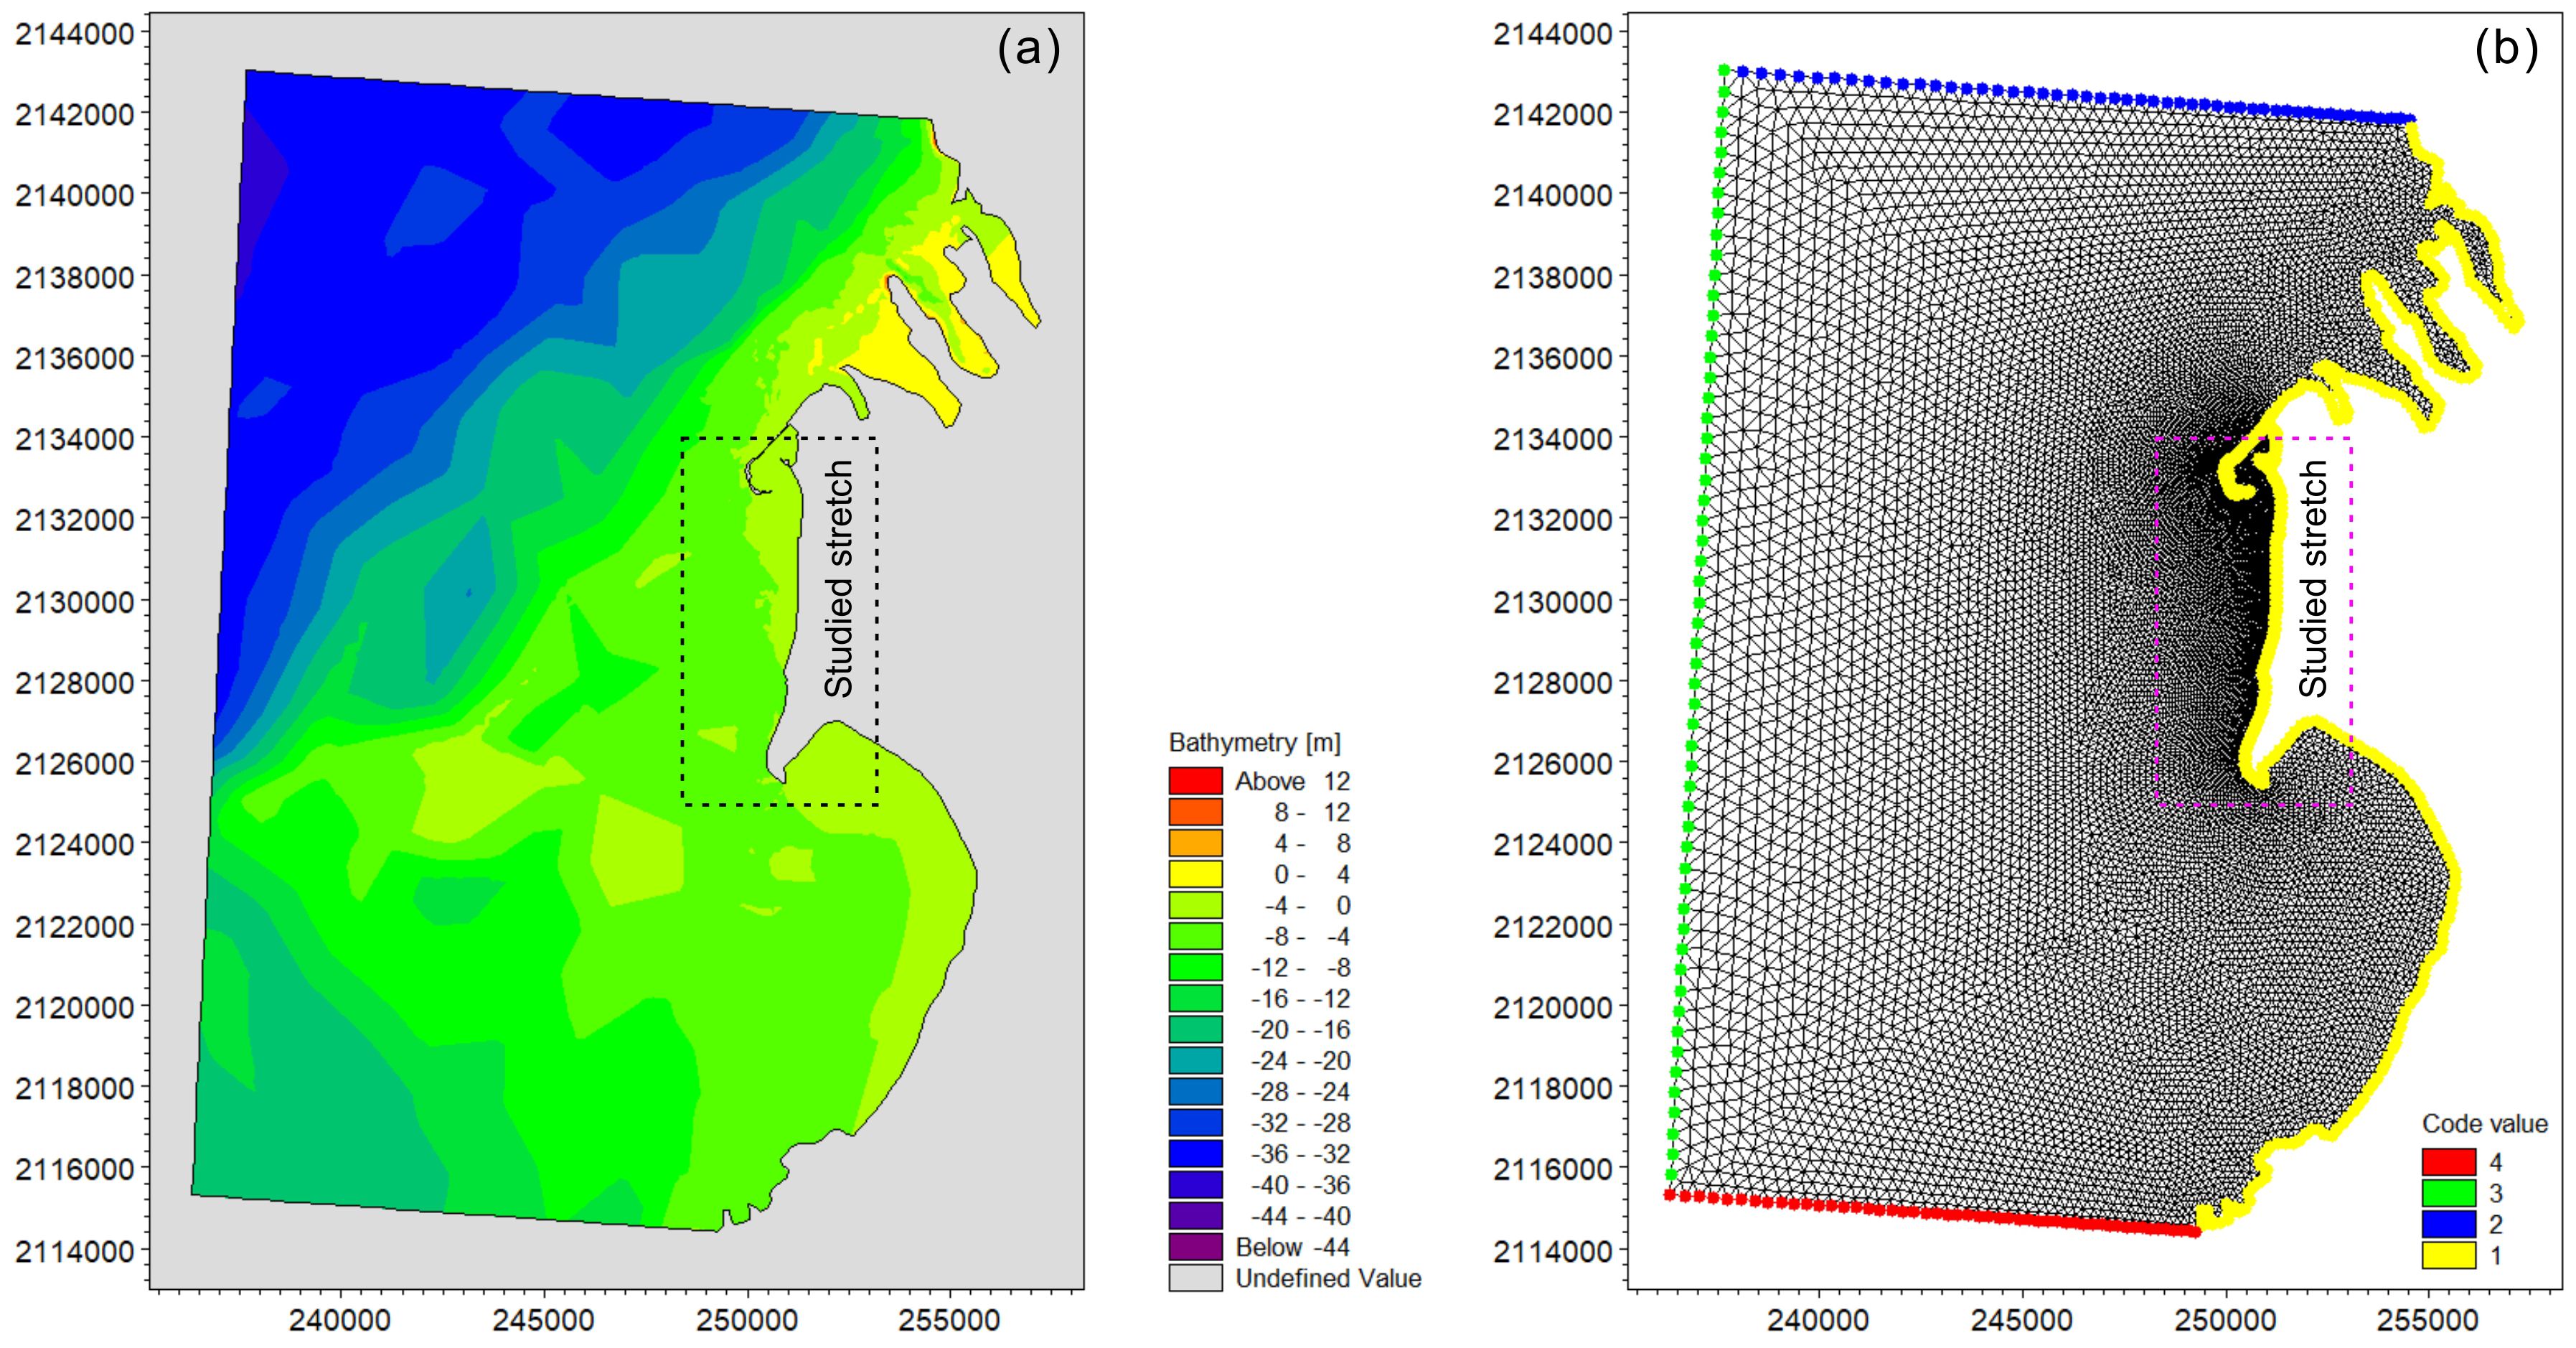
Figure 4 Regional wave model domain bathymetry (A) and mesh distribution (B).
2.5 Estimating the LST rate
In order to estimate the net LST rate along Sigeng beach, the method combining the cross-shore (profile) and longshore (shoreline) changes was used. Firstly, the LST direction pattern along the beach should be determined from the wave modelling or morphological changes or related studies. Secondly, the linear relationship (coefficient) between sand volume changes per width and shoreline changes in each beach profile was quantified based on the repeated beach profile data. Subsequently, the sand volume change rate per width along each transect (derived in the DSAS process) was obtained by multiplying the EPR shoreline change rate by the coefficient. Thirdly, the sand volume change rate at different locations alongshore could be derived by summing a certain amount of the sand volume change rates per width along transects as needed. In this study, we define 400-m distance (20 transects) alongshore as a unit considering that the transect space was 20 m. Therefore, we need to sum the successive 20 transects of sand volume change rates to obtain the sand volume change rates of each unit. Finally, the net LST rates at each unit from the most updrift to downdrift could be deduced successively based on the net LST rates of previous unit.
3 Results
3.1 Beach profile change
Figure 5 illustrated the topography changes of eight typical profiles at Sigeng beach between 2014 and 2024. The beach profile mainly showed a low-tide terrace type, with the upper foreshore demonstrating a steeper slope (reflective) and the lower a gentler slope (dissipative). Only at profile P5 and P8, the profile displayed a sandbar at the lower intertidal zone. In terms of topography changes, P1 in the north, P5 in the middle, and P8 in the south showed continuous foreshore accretion from 2014 to 2024, while P2, P3, and P4 in the north and P7 in the south presented a continuous foreshore erosion pattern (Figure 5). P6 displayed a completely different evolution pattern, with accretion from 2014 to 2021, followed by erosion between 2021 and 2024.
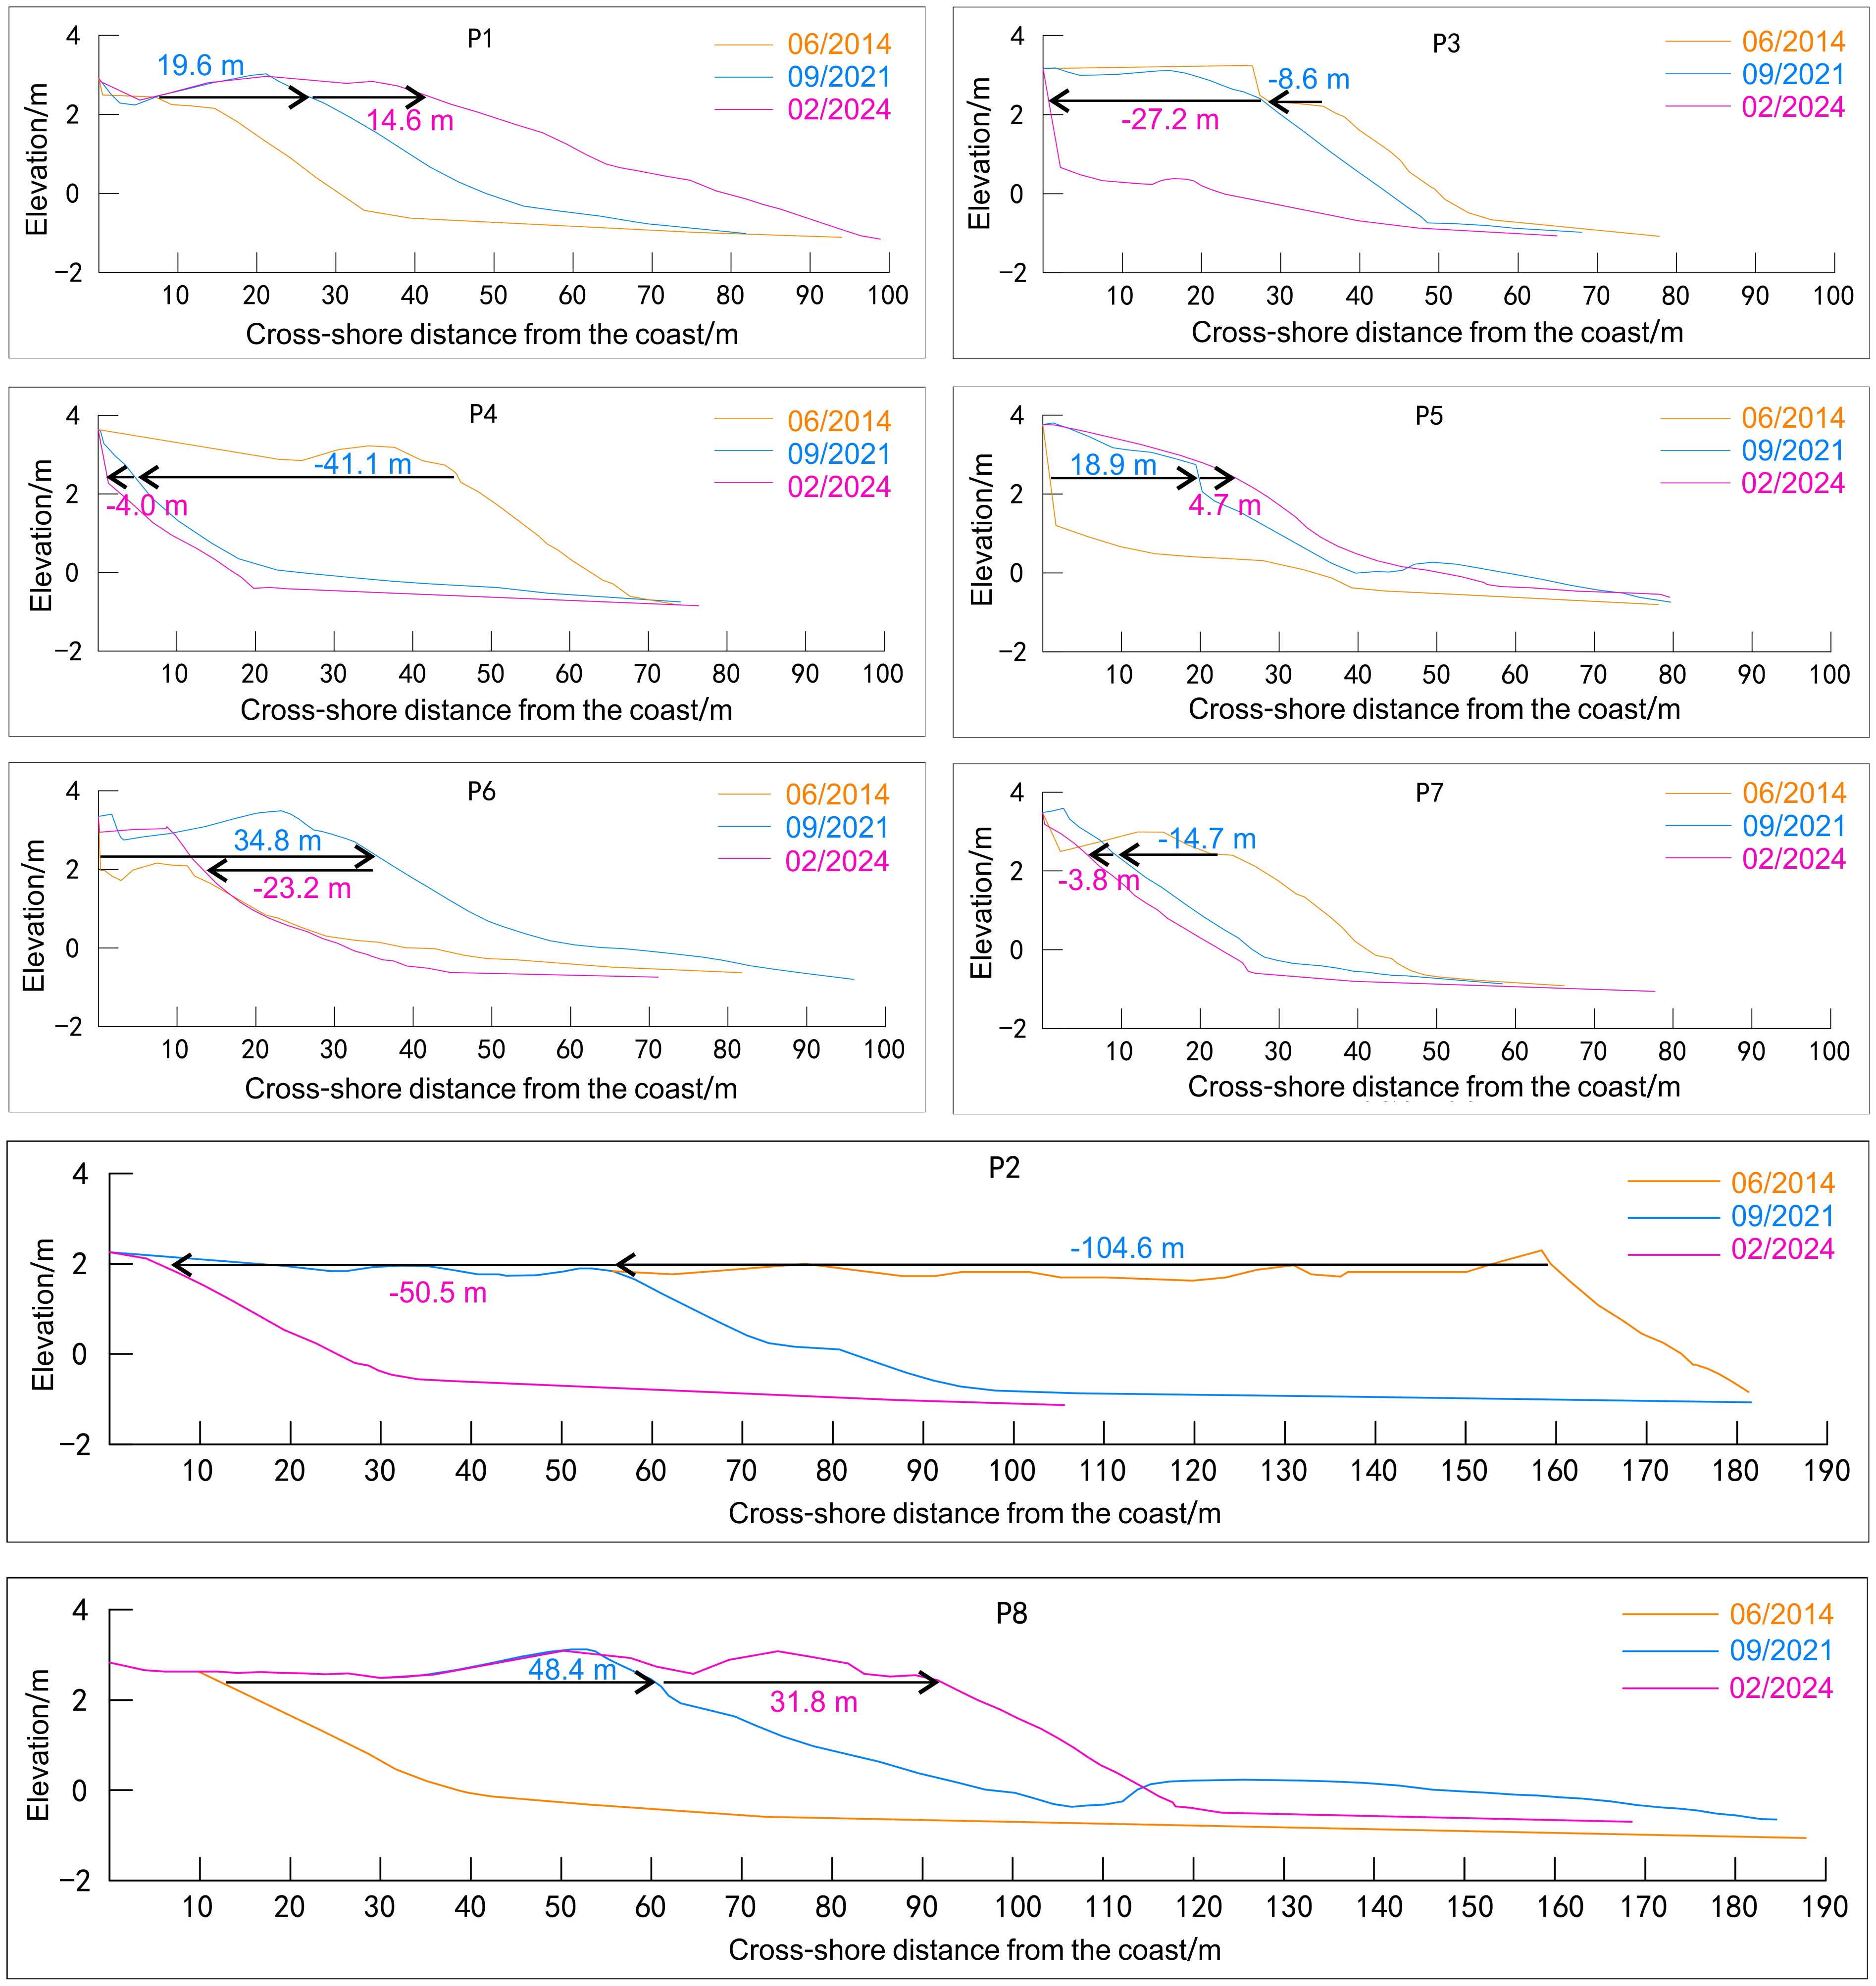
Figure 5 Topographical changes of the eight beach profiles in July 2014, September 2021, and February 2024. See the position of the profiles on Figure 1C. The black arrows indicate the shoreline contour change direction and the corresponding numbers (the blue for period 2014–2021 and the magenta for period 2021–2024) indicate the distance of it.
The changes in the dry beach width (i.e. changes in shoreline position) of the eight typical profiles were consistent with the profile changes. The dry beach width of P1, P5, and P8 increased continuously from 2014 to 2024, while that of P2, P3, P4 and P7 decreased (Figure 5). Among them, the dry beach width decreased largest at P2 between 2014 and 2024, reaching 155.1 m, followed by P4 with 45.1 m. In contrast, the dry beach increased largest at P8 with 80.2 m, followed by P1 with 34.2 m (Table 1).
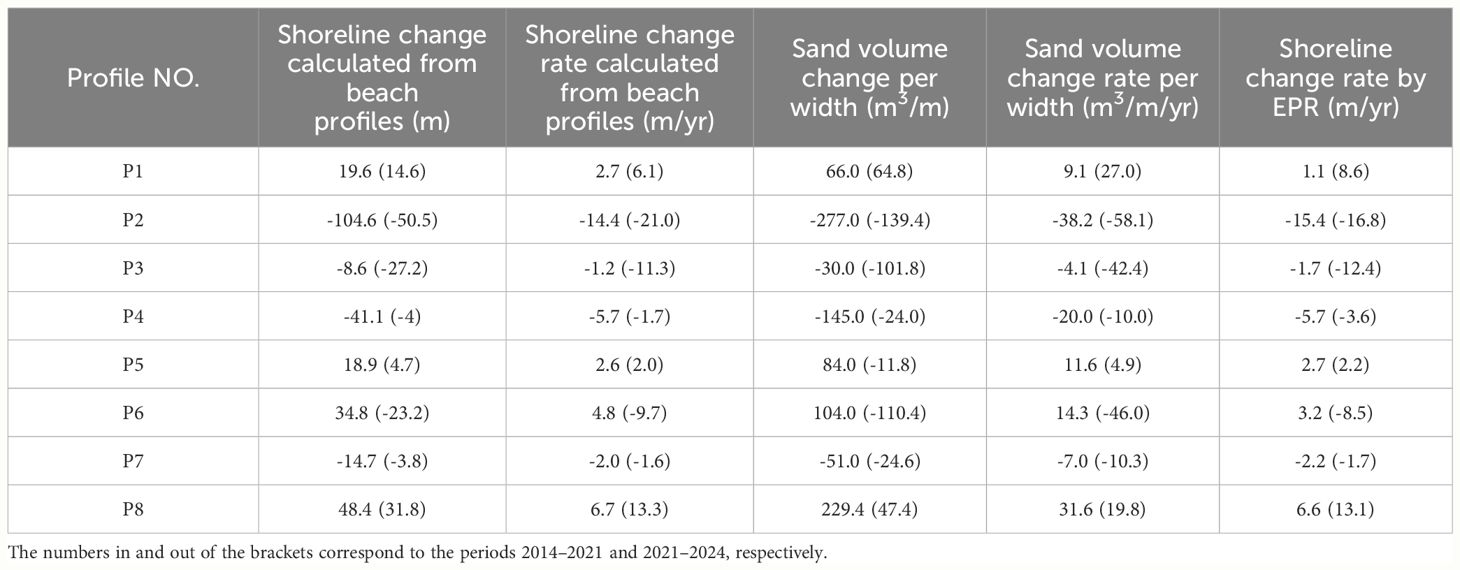
Table 1 Parameters of beach change for each profile.
The changes in sand volume per width were similar to the change in dry beach width. Specifically, P2 presented the largest reduction with -416.4 m3/m between 2014 and 2024 among the eight profiles, followed by P4 with -169.0 m3/m. In contrast, P8 demonstrated the largest growth with 276.8 m3/m between 2014 and 2024, followed by P1 with 130.8 m3/m (Table 1).
3.2 Decadal shoreline change
The shoreline comparison between July 2008 and February 2024 showed that Sigeng beach undergo remarkable changes, especially the northern and the southern segment (Figure 2E). The maximum shoreline change to the sea was 218.8 m, located at the northernmost. By contrast, the maximum shoreline change to the land was 284.4 m, located near P2 profile (Figure 2E). Figure 6 presented the spatial EPR shoreline changes for the three intermediate periods [2008–2014 (Figure 6A), 2014–2021 (Figure 6B), and 2021–2024 (Figure 6C)]. The descriptive statistics of different EPR classes in each period were also summarized in Table 2. During the period 2008–2014, sections between P1–P4 and P6–P8 showed significant retreat, while other sections showed advance. In the following period (2014–2021), the beach showed similar shoreline change pattern to the period 2008–2014, except for the section between P6 and P7, which exhibited minor advance. During the recent period (2021–2024), the shoreline change results were in accordance with the first period (2008–2014). On the whole, the studied beach showed consistent spatial pattern in erosion and accretion during the three periods, except for the section between P6 and P7 in period 2014–2021.
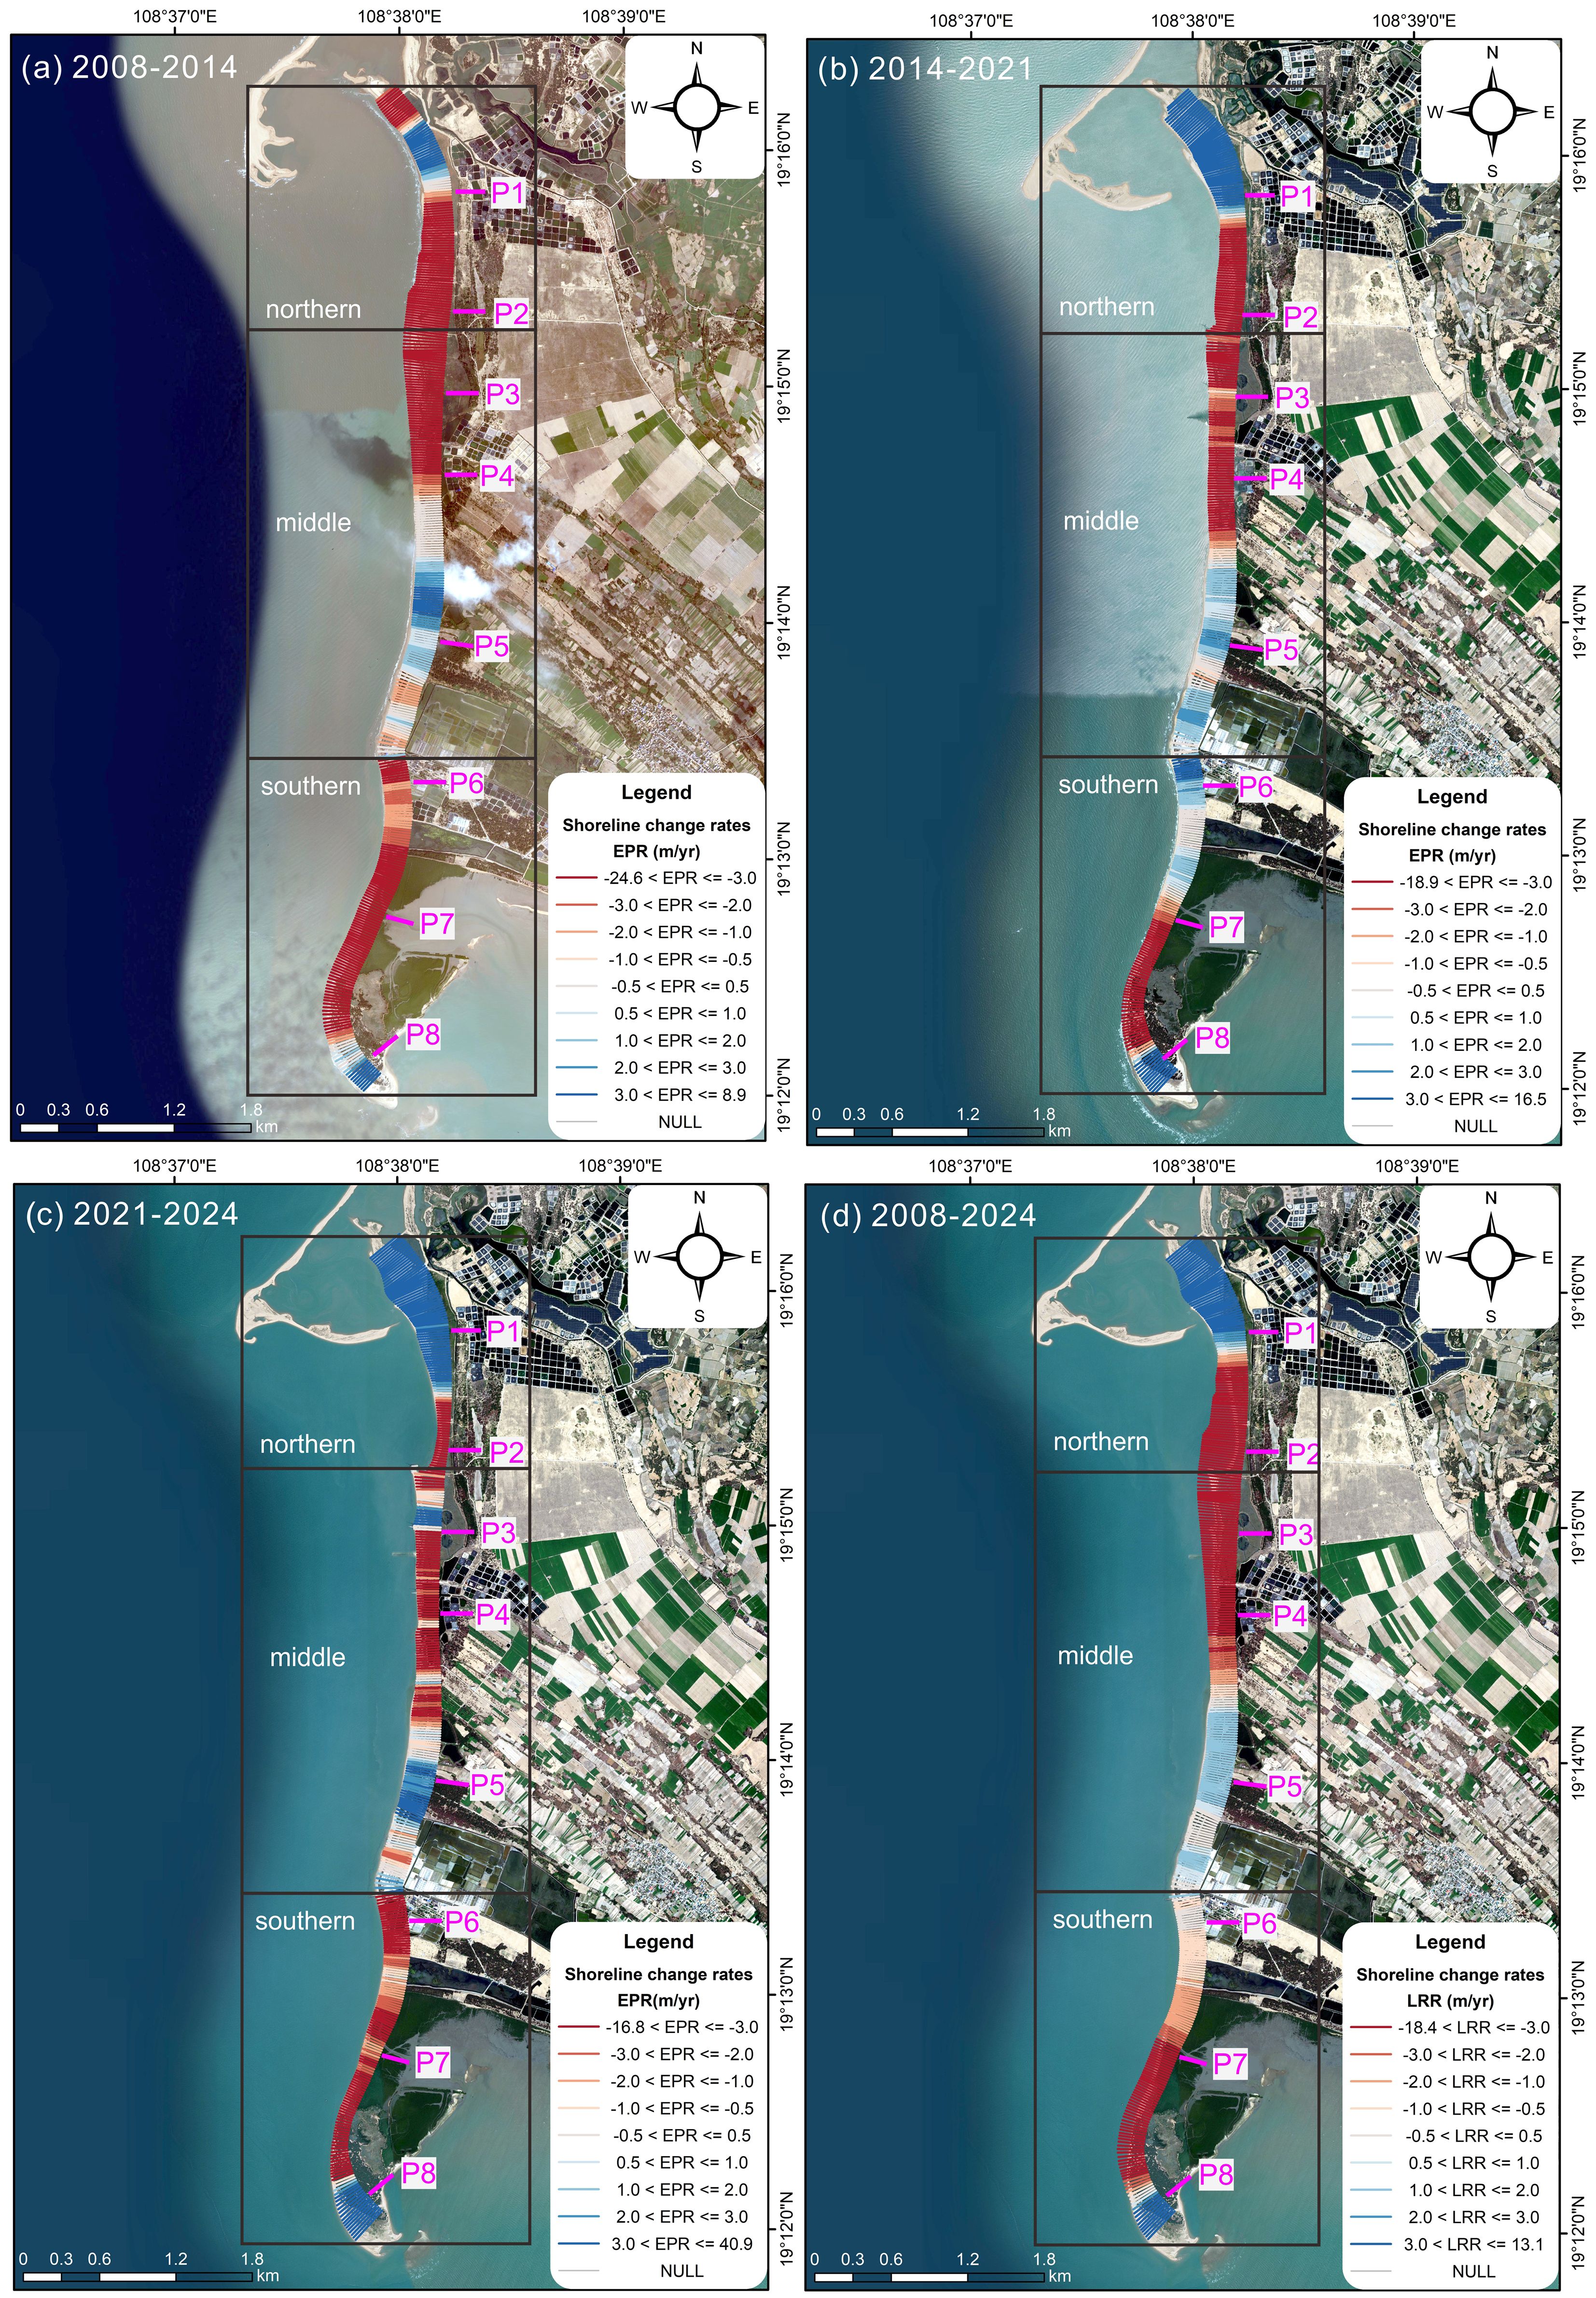
Figure 6 Spatial distribution of shoreline change rates in different periods by DSAS, in which the red implies erosion while the blue accretion. (A) EPR shoreline changes between July 2008 and June 2014. (B) EPR shoreline changes between June 2014 and September 2021. (C) EPR shoreline changes between September 2021 and February 2024. (D) LRR shoreline changes between July 2008 and February 2024.
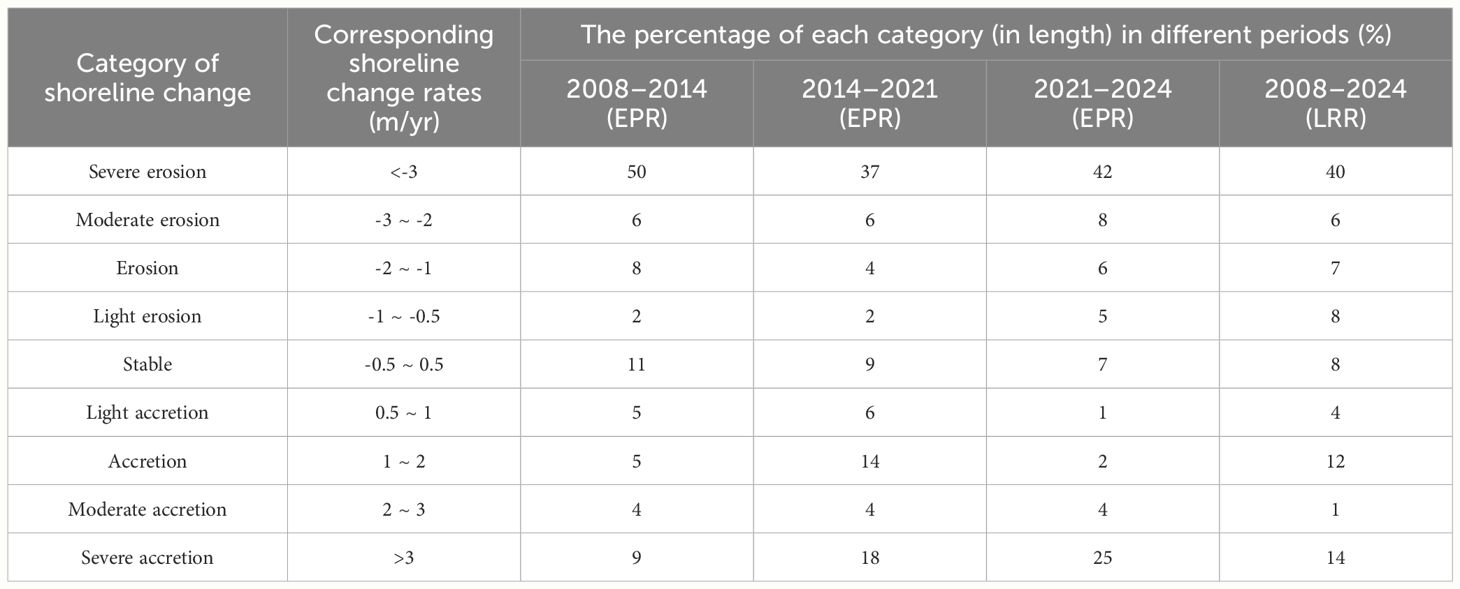
Table 2 Statistics of shoreline change rates with different classes in different periods.
The LRR result showed that the shoreline change rates between July 2008 and February 2024 ranged from -18.4 m/yr to 13.0 m/yr, with the average LRR rate of -1.9 m/yr, indicating that Sigeng beach was generally in erosion (Figure 6D). Specifically, in the total of 8100 m shorelines, 61% of shorelines m showed a rate less than -0.5 m/yr, indicating erosion. Among the eroded shorelines, 40% of them m demonstrated a rate less than -3.0 m/yr, exhibiting severe erosion (Table 2). The notable shoreline retreat occurred at sections from 1200 m to 3700 m and from 6600 m to 7700 m, with the largest erosion rate position located at 1840 m (Figure 7). In contrast, 31% of shorelines m displayed a rate greater than 0.5 m/yr, indicating accretion. Among the accreted shorelines, 14% of the shorelines m showed a rate greater than 3.0 m/yr, exhibiting severe accretion (Table 2). The notable shoreline advance occurred at sections from 0 m to 1050 m and from 7800 m to 8100 m, with the largest erosion rate position located at 560 m (Figure 7). In addition, approximately 8% of shorelines m revealed a rate between -0.5 and 0.5 m/yr, indicating relatively stable. In spatial scale, the middle and southern section presented erosion at the updrift and accretion at the downdrift while the situation reversed for the northern section due to the effect of the long sand spit. Generally, the shoreline change results were in accordance with the above beach profile change results.
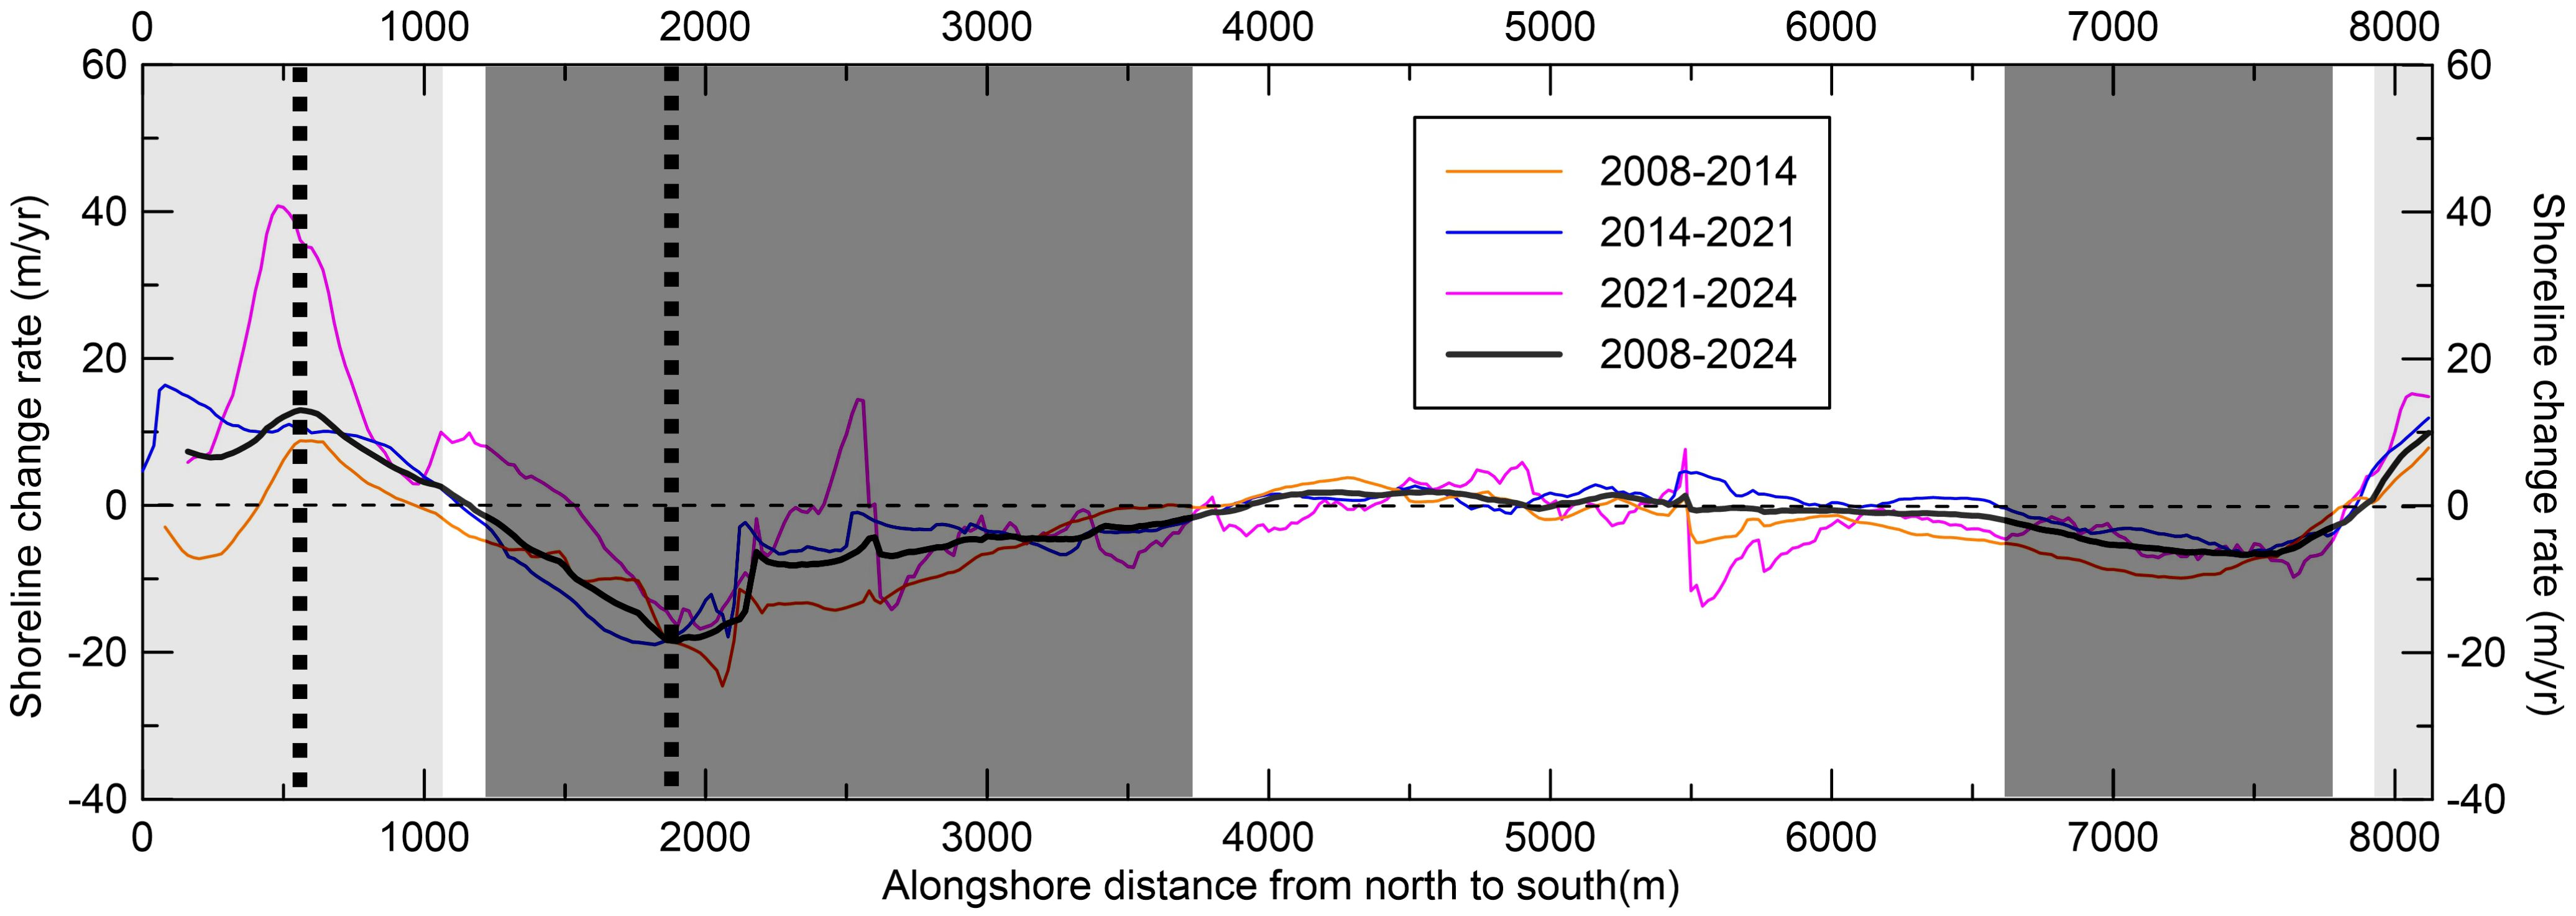
Figure 7 Alongshore variation in shoreline change rates in different periods. The vertical dark shadows indicate the notable shoreline retreat while the light shadows indicate the notable shoreline advance. The vertical dashed lines highlight the extremum of shoreline retreat and advance.
3.3 Future forecasting of the shorelines for the year 2034
If the current conditions that occurred in the last 16 years continue with similar effects, the morphological erosion-accretion evolution trends of Sigeng beach are likely to continue. Using the Kalman filter model, the future shift of the shoreline was forecasted for the year 2034, as displayed in Figure 8 Accordingly, increased progradation and advancement of the shoreline in the northern and southernmost areas have been forecasted within the study area. The displayed prediction demonstrates that the future shoreline near P2 shows the most significant retreat along the whole beach, with 195 m towards the land (Figure 8B). It was predicted that the shoreline between P2 and P4 shows retreat towards the land. Notingly, four wind generator bases will be in the sea as forecasted (Figure 8C). The shoreline between P7 and P8 also shows shoreline retreat towards the land, which can be understood as the flattening of the convex shoreline (Figure 8D). It should be noted that this forecasting produces the future scenario with uncertainty due to the complicated processes driving shoreline change patterns, the limitations of input data, and the assumption that may not always be valid (Himmelstoss et al., 2021a).
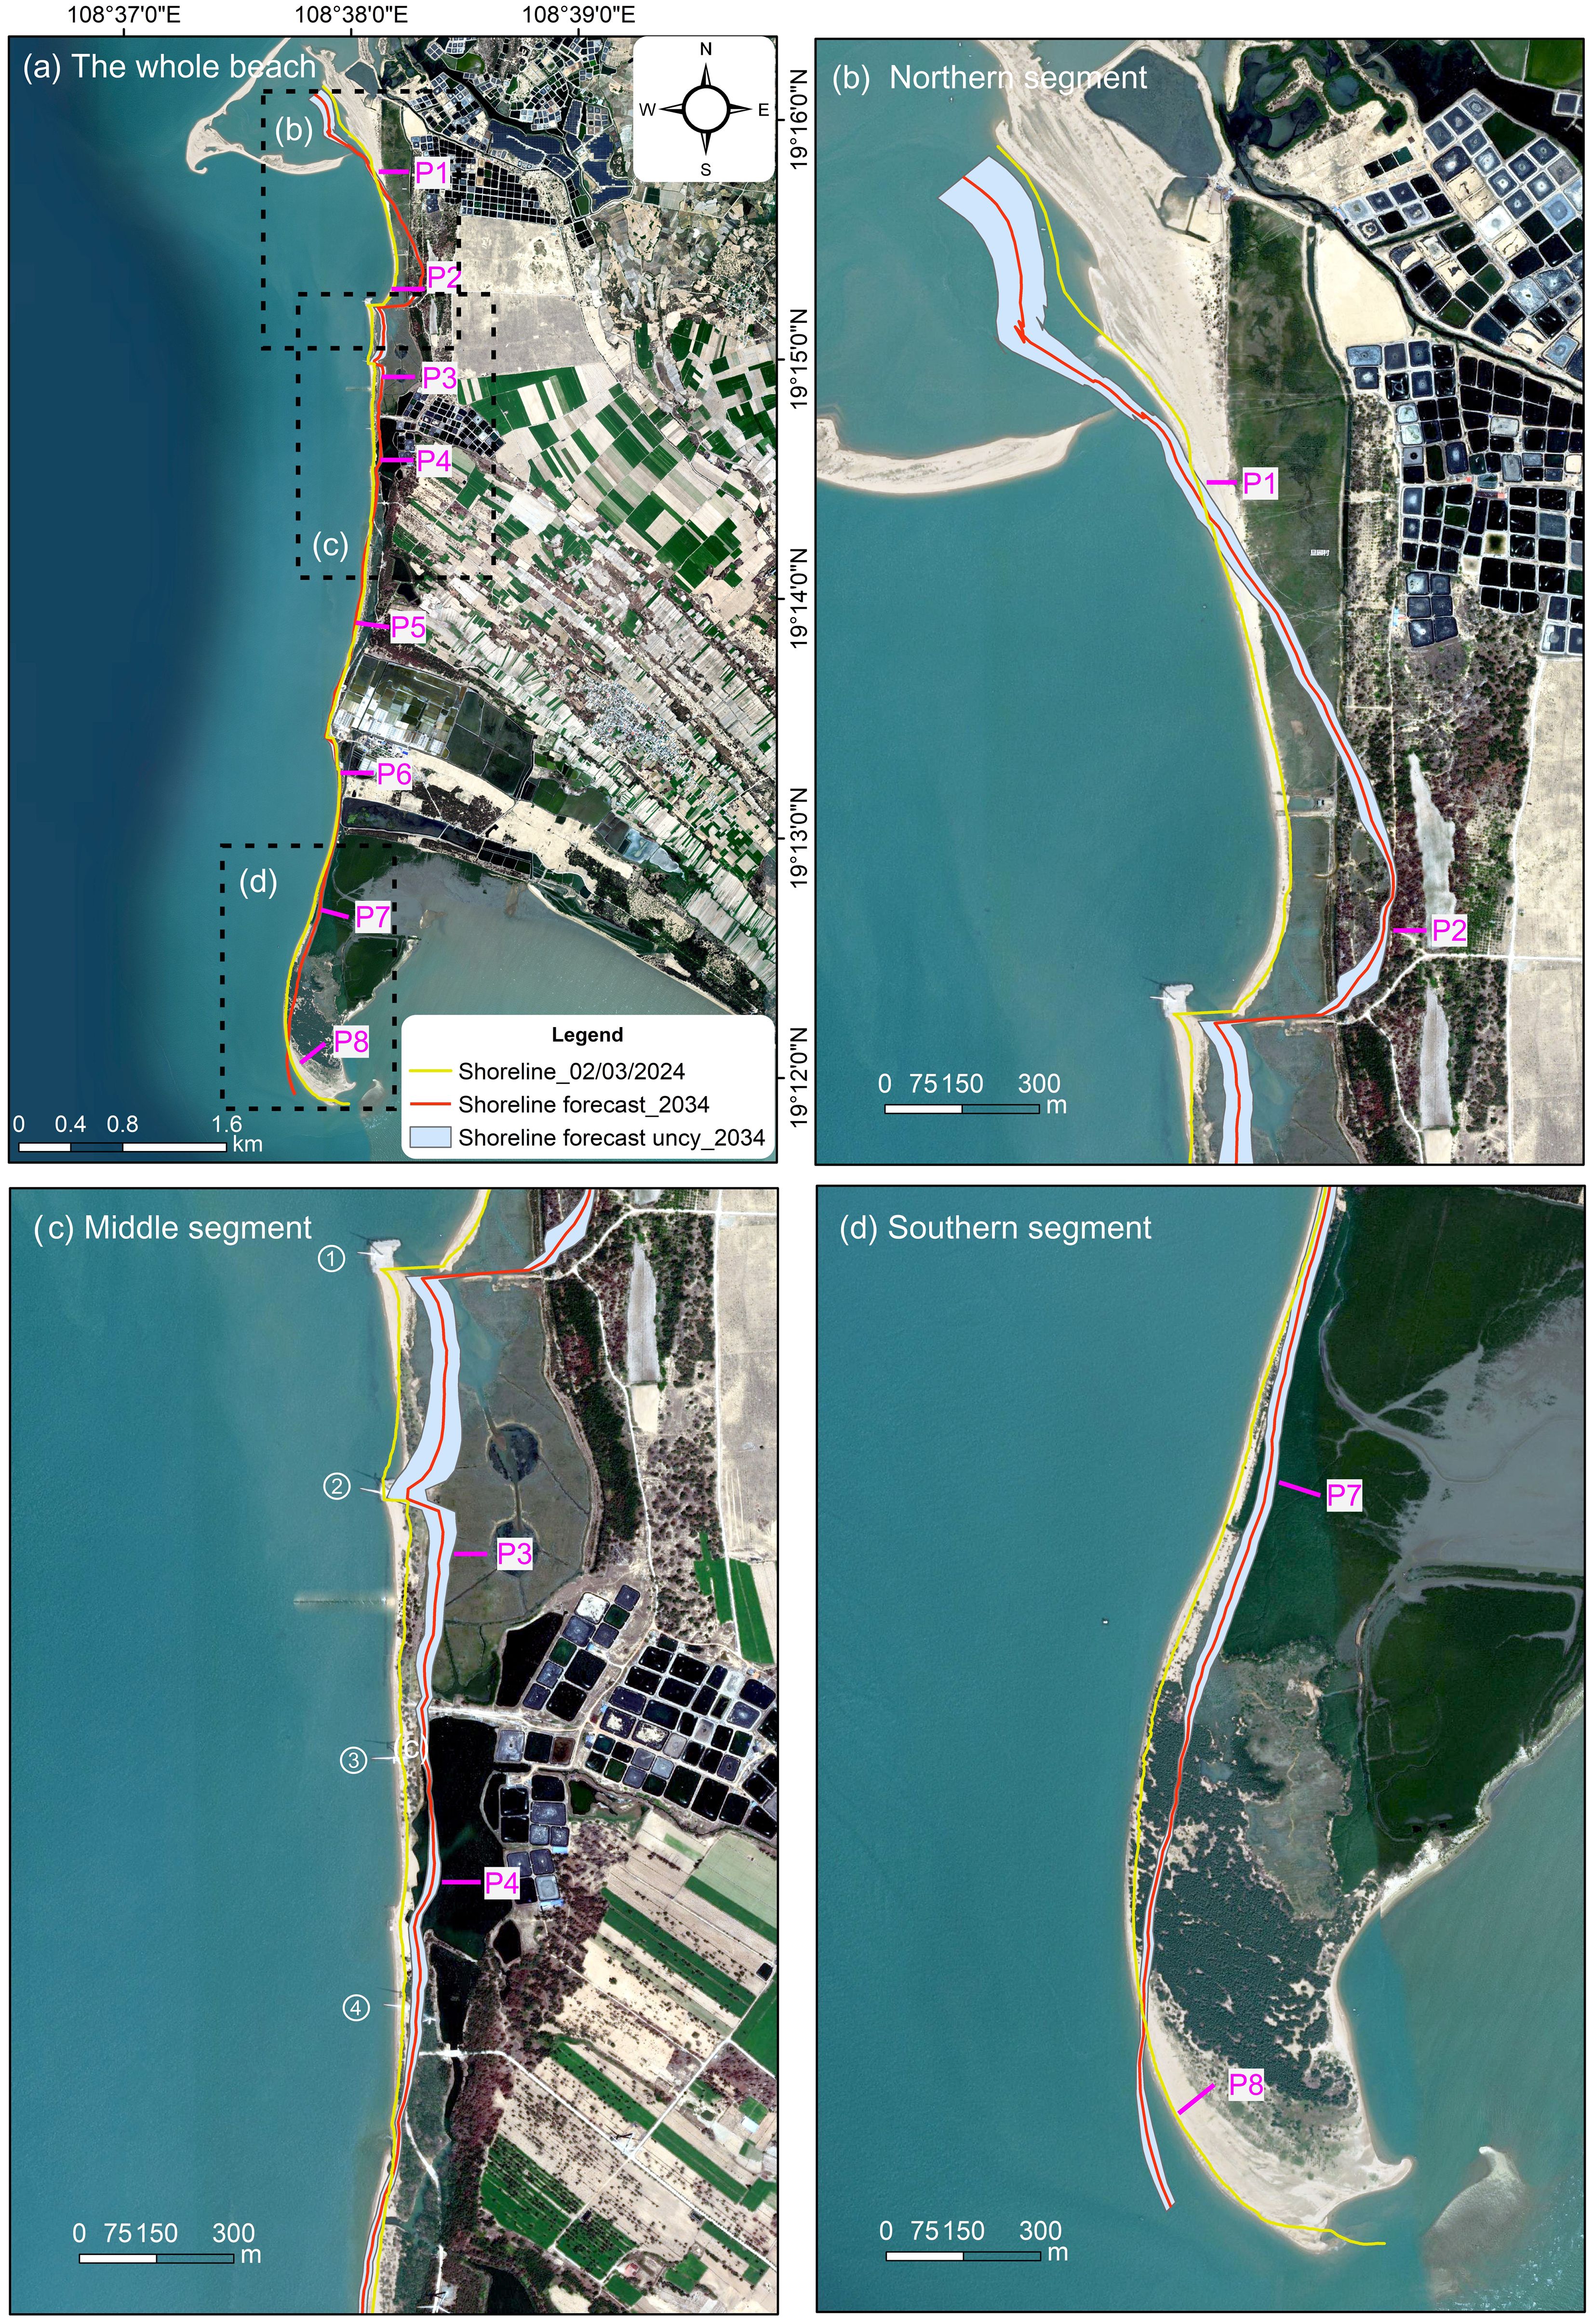
Figure 8 Forecasted shoreline in 2034 and associated uncertainty. (A) shows the forecast shoreline in 10 years later of the whole beach, while (B), (C), and (D) are the enlarged details of the northern, middle, and southern segment, respectively. The forecast shoreline after the next 10 years is in a solid red line, and the uncertainty band is a transparent blue polygon extending on both sides of the forecast shoreline. The present (in 2024) shoreline is also displayed with solid yellow lines. Note that four wind generator bases will be in the sea as forecasted in (C).
3.4 Nearshore wave forces
The numerical simulation results showed seasonal changes in nearshore wave field (Figure 9). During summer months, waves mainly came from SW, transporting longshore sediment towards the north. The nearshore significant wave height ranged from 0.35 m to 0.55 m. When waves reached the beach, the mean wave height decreased due to the shoaling, varying from 0.15 m to 0.35 m ranged (Figure 9A). By contrast, during winter monsoon period, the dominant waves came from NE, transporting sediment from north to south. The nearshore significant wave height ranged from 0.30 m to 0.75 m, slightly higher than that in summer. However, when waves reached the beach, the NE waves were highly diffracted by the long spit to the northernmost, resulting in the mean significant wave height along the beach in winter (varying from 0.10 m to 0.25 m) slightly lower than that in summer (Figure 9B).
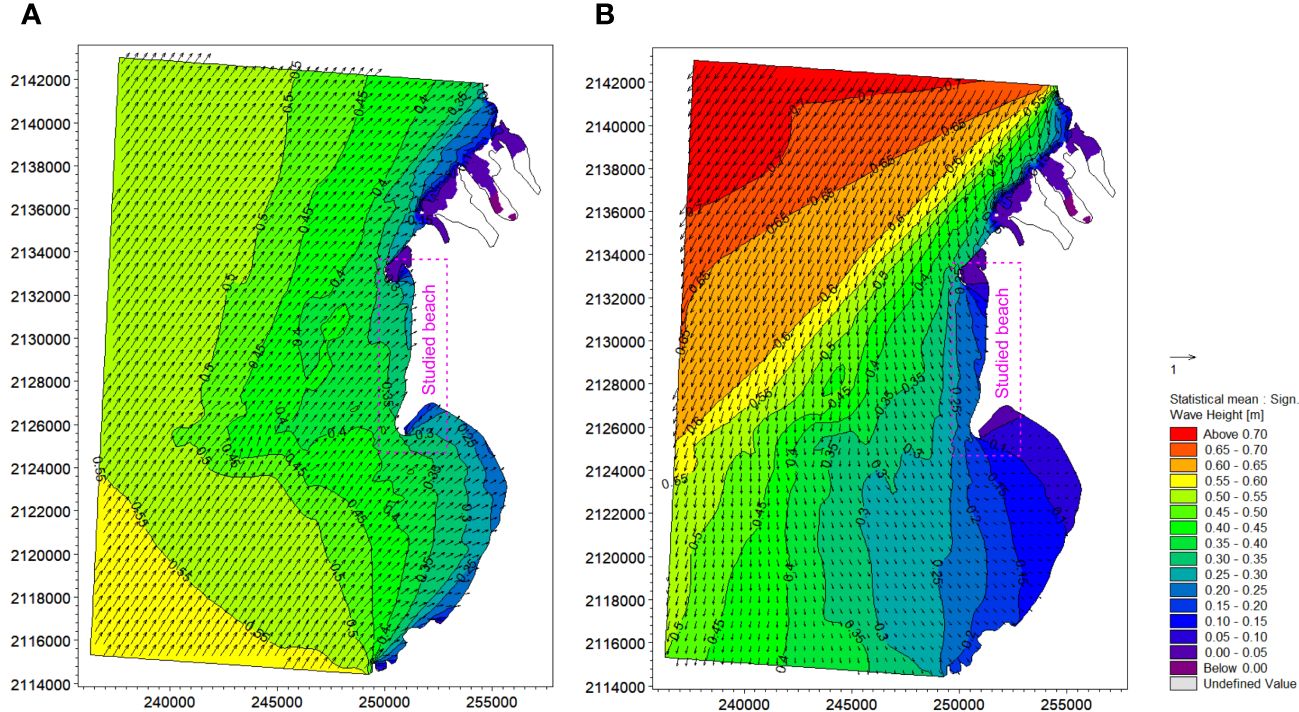
Figure 9 Simulated nearshore wave features prevailing along the coast in summer season (A) and winter season (B).
3.5 LST pattern
The change rates of sand volume per width and shoreline of the eight profiles calculated from the repeated surveys between 2014 and 2024 were presented in Table 1, together with the corresponding shoreline change rates calculated by EPR. The correlation between the shoreline change rates calculated by EPR and the shoreline change rates calculated from beach profiles showed that they were almost equal, with the linear regression slope of 0.94 and the Pearson correlation coefficient (r) of 0.98 (Figure 10A). Furthermore, the result indicated that there was a significant positive correlation between the sand volume change rates per width and shoreline change rates calculated from beach profiles (r=0.95), and the former was 2.99 times the latter (Figure 10B). Based on this correlation, the sand volume change rate per width along each transect was derived from the shoreline change rate.
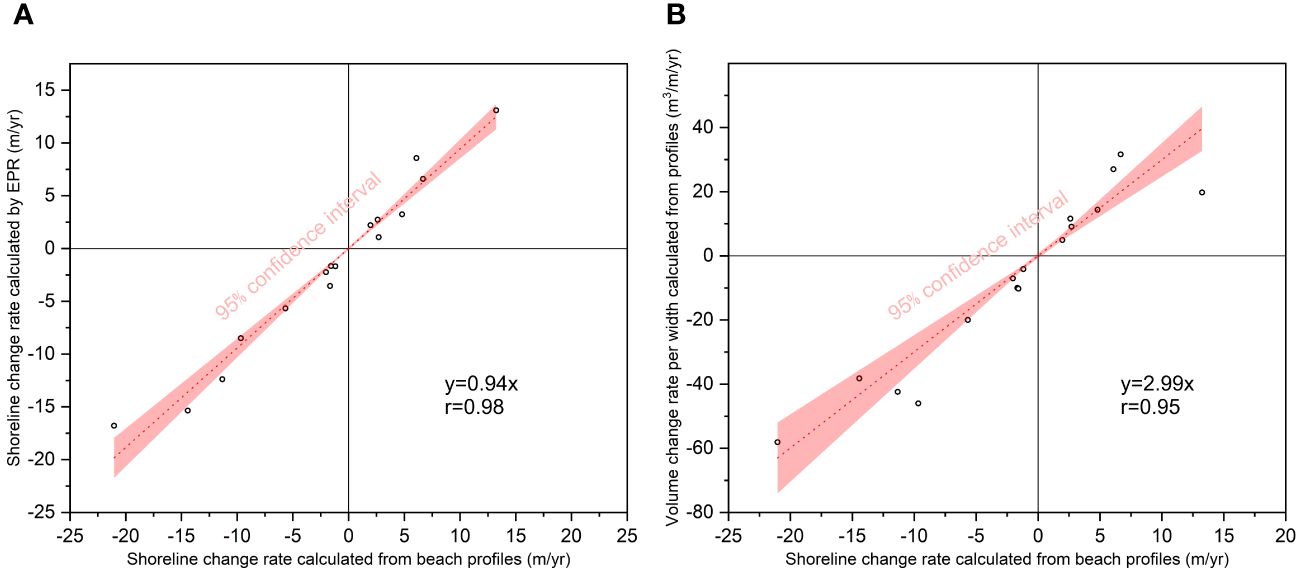
Figure 10 Correlation between different parameters. (A) Correlation between shoreline change rate calculated by EPR and shoreline change rate calculated from beach profiles. (B) Correlation between volume density change rate and shoreline change rate calculated from beach profiles.
Previous studies have showed that the direction of net LST in this local area was southward (Gao, 2014; Zhou, 2016; Lv, 2021; Qi et al., 2021). For Sigeng beach, the net LST direction in the middle and southern segment were southward, while that in the northern segment was northward due to the diffraction of NE waves by the long sand spit at the northernmost. Subsequently, based on the LST direction pattern, the net LST rates at different locations along Sigeng beach was estimated and demonstrated in Figure 11B, in which only the rates at each profile were presented. The seasonal LST direction was also demonstrated in Figure 11A based on the wave simulation. The result showed that the net LST rates at P1 was relatively large with 3.5×10⁴ m3/yr, followed by P2 and P8, with both of 2.2×10⁴ m3/yr. The net LST rates at other profiles ranged from 0.8×10⁴ m3/yr to 1.6×10⁴ m3/yr.
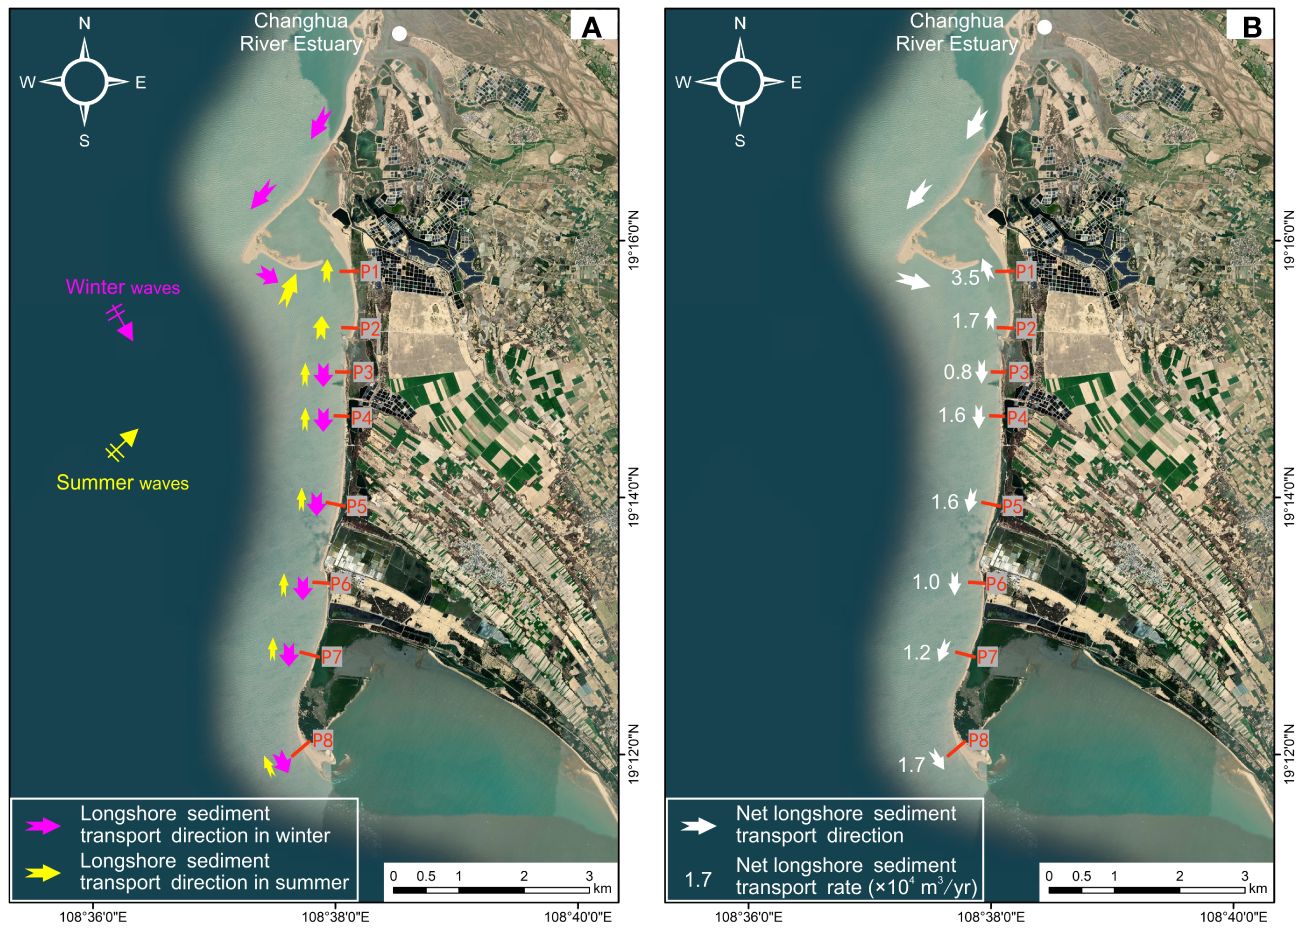
Figure 11 Net LST pattern induced by seasonally varied waves at Sigeng beach (The direction is modified from Zhou (2016) and Qi et al. (2021)). Note the divergence of the net LST direction at the wind generator base between profile P2 and P3.
4 Discussion
4.1 Factors controlling beach evolution
Based on field surveys and previous studies (HAOFS, 2014; Zhou, 2016), the main factors controlling Sigeng beach evolution include wave action and reduction in fluvial sediment load, followed by sand spit and coastal structures, typhoon events, aeolian erosion, and sea level rise.
4.1.1 Seasonal wave action
Longshore transport of sand by waves propagating at an angle to the shore is crucial in causing beach erosion or sedimentation. The offshore of Sigeng beach was dominated by Eastern Asia monsoonal regime, resulting in seasonal variation in wave climate (Figure 9). Seasonal changes in wave direction cause bidirectional sediment transport pattern along the beach. During winter monsoon period, the dominant NE waves transported coastal sediment from north to south, leading to the erosion of Sigeng beach (Figure 9B). The southward transported sediment provided sufficient sources for the development and continuous expansion of Sigeng Spit at the southernmost (Wang et al., 2006; Zhou, 2016). During summer seasons, under the action of northward waves (SW direction) coastal sediment moved northward, causing accumulation at the northernmost of Sigeng beach (Figure 9A). Across a whole year, the net LST direction at Sigeng beach was southward except the northern section, as depicted in Figure 11B. The role of seasonal wave action in driving coastal beach changes was also confirmed by Zhou (2016) and Qi et al. (2021). The former presented the seasonal changes of Sigeng beach by seasonal profile monitoring. The latter concluded the controlling role of seasonal variation in local wave climate in the evolution of spit system at the Changhua River mouth by 34-year satellite-derived shoreline data.
4.1.2 Reduction in fluvial sediment load
In wave-dominated estuaries, beach evolution is strongly influenced by the fluvial sediment discharge in addition to wave action (Anthony, 2015; Qi et al., 2021). Changhua River is the second largest river in Hainan Island, with a catchment area of 5070 km2 and a length of 230 km (Wang et al., 2006). The majority of fluvial sediment from Changhua River was transported southward by the longshore currents, which is the main sediment source of Sigeng beach (Zhou, 2016; Qi et al., 2021). Based on the historical hydrological data from 1957 to 2021 at Baoqiao station (the location indicated in Figure 1B), the annual average water discharge was basically constant. However, the annual average fluvial sediment load had decreased from approximately 100 × 104 to 30 ×104 t/yr since the buildup of Daguang dam reservoir in 1993 (Figure 12; Qi et al., 2021). Additionally, the actual amount of sediment entering into the sea was much less, considering the frequent sand mining activities in the lower reaches and estuary of Changhua River in recent years. Aggregate sands have been long mined from Changhua River for construction. As reported in 2019, approximately 12.4 million m3 of sands would be mined from Changhua River Estuary in the following five years. Due to the reduction of fluvial sand supply, the sediment budget of Sigeng beach was in deficit, which directly induced beach erosion.
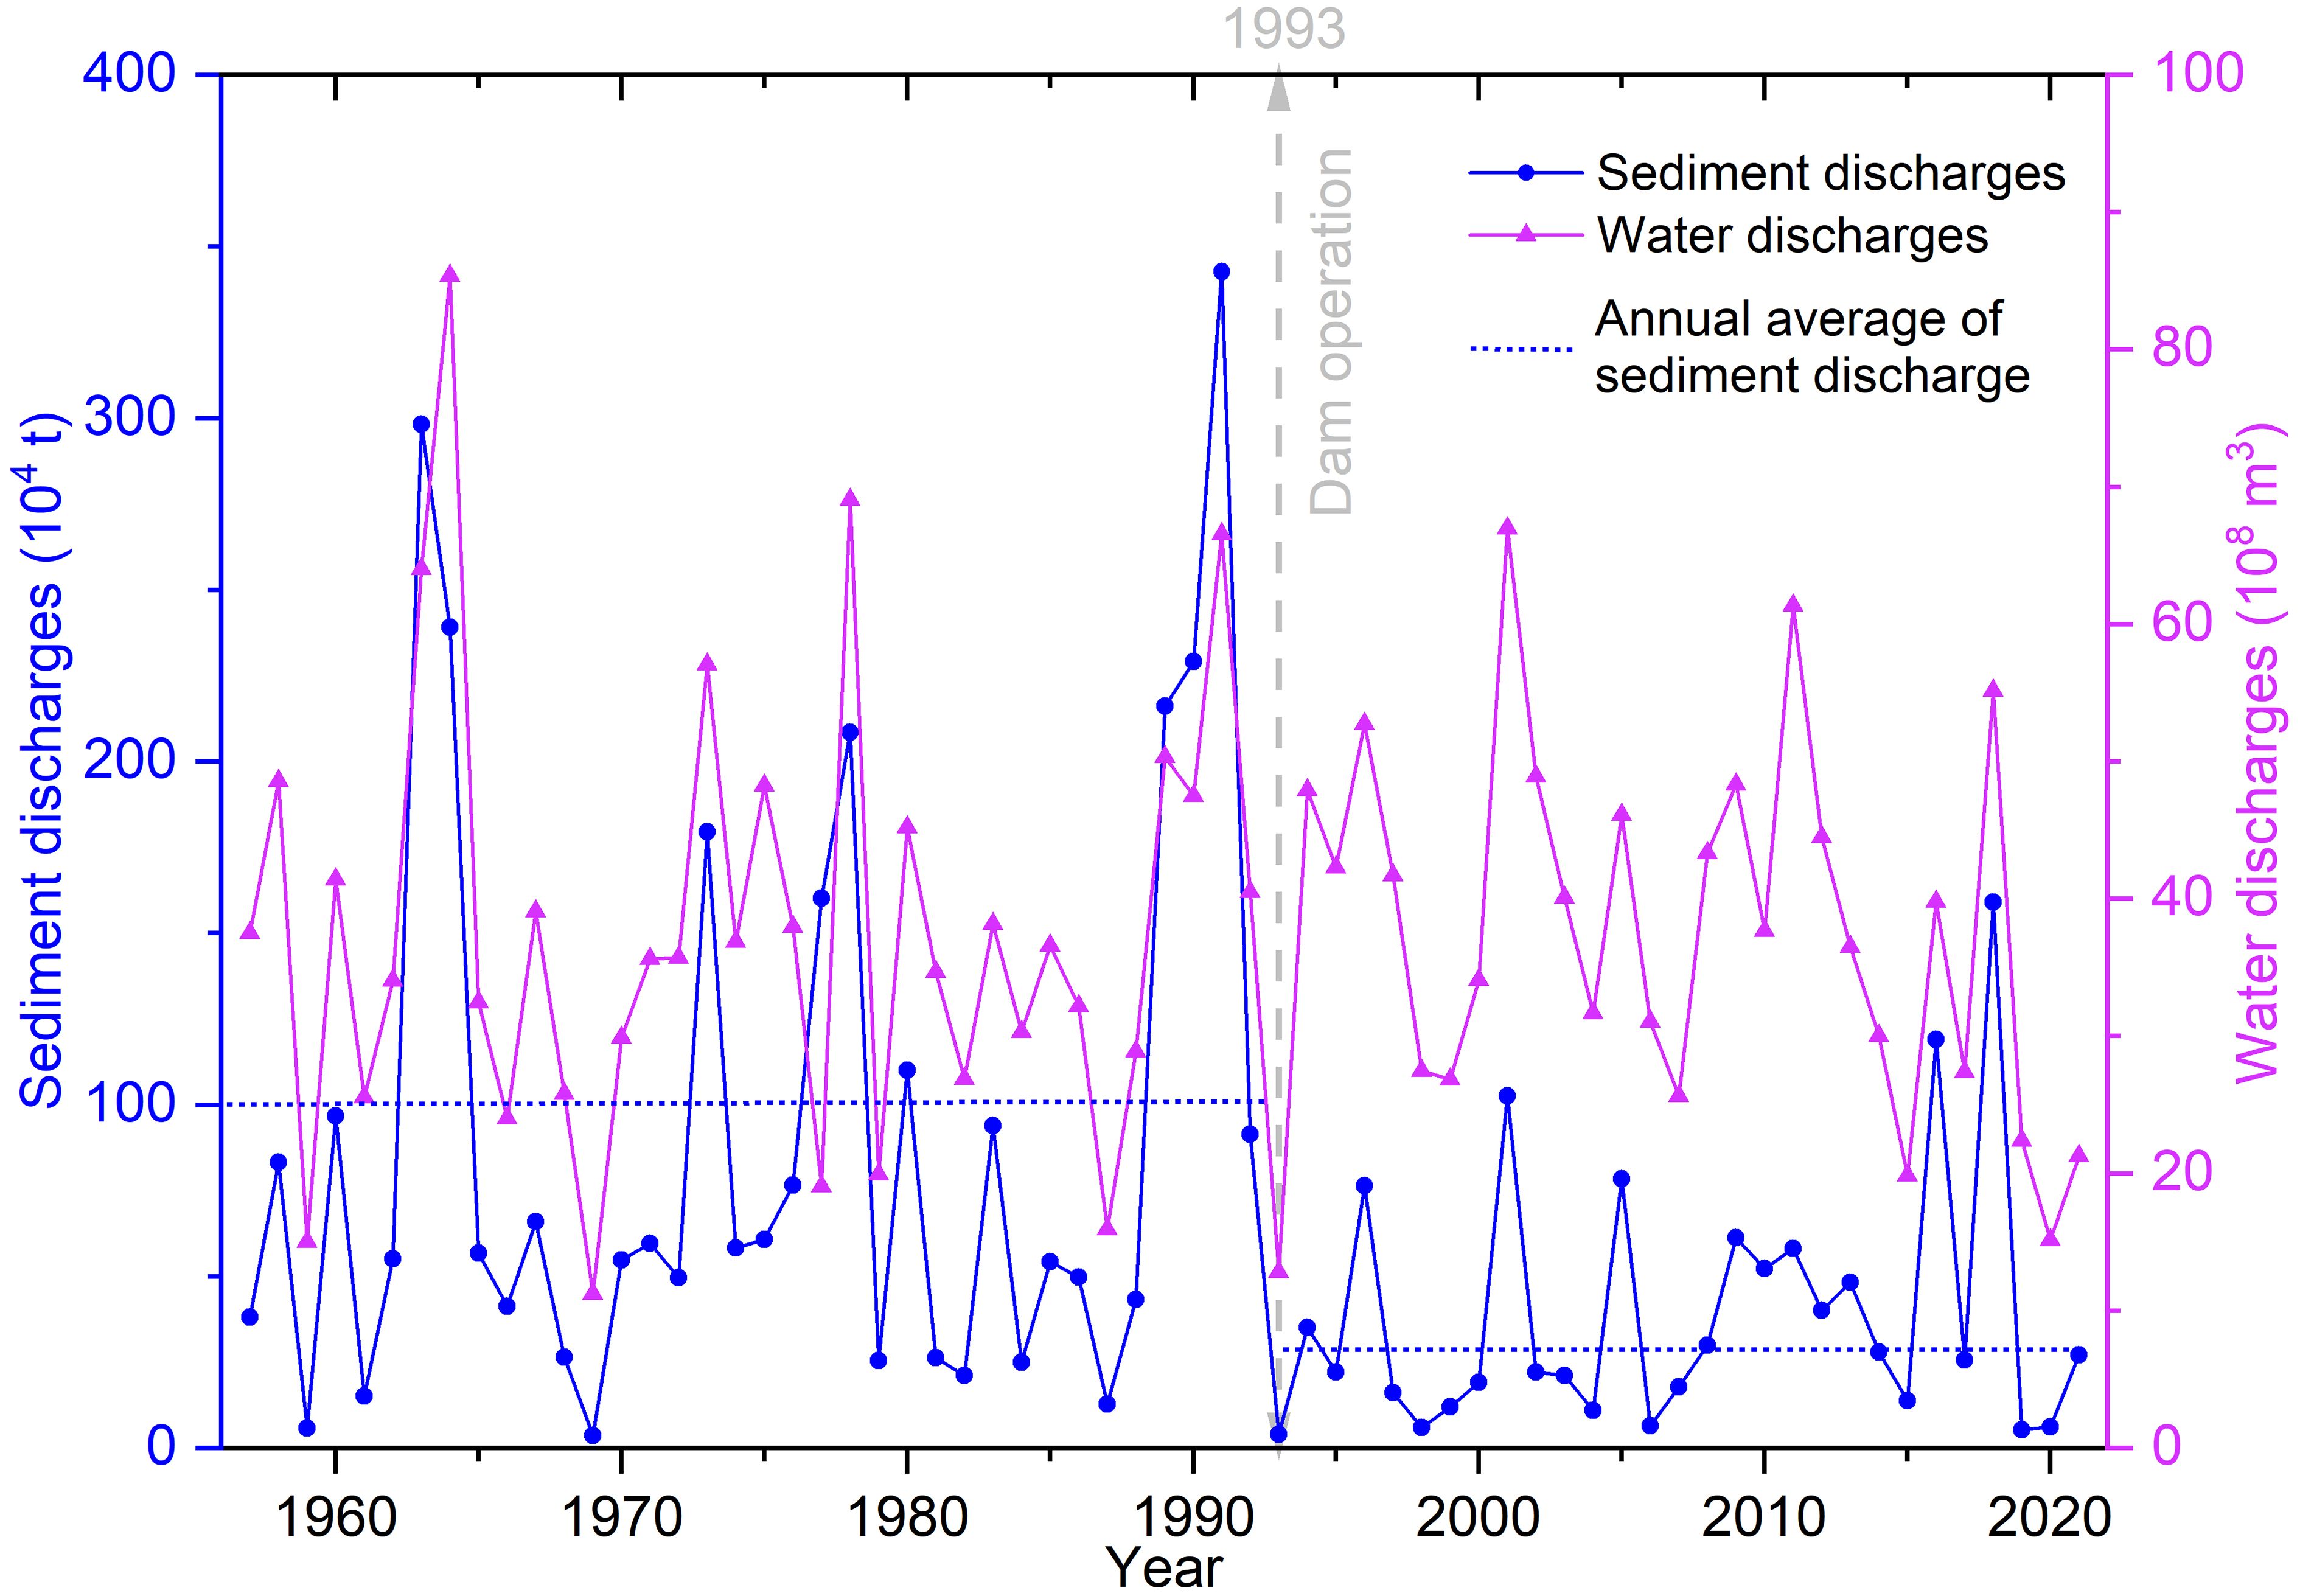
Figure 12 Annual suspended sediment and water discharges of Changhua River from 1957 to 2021, derived from Baoqiao hydrologic station (Partial data is from Yang et al. (2013) and Qi et al. (2021)). The horizonal dashed lines indicate the average value of the annual suspended sediment. Note that the sediment discharge reduced significantly before and after Daguang dam built in 1993.
Previous studies also supported the impact of the reduction of sediment from the Changhua River into the sea on coastal erosion in the area. Huang and Luo (2003) and Ji et al. (2007) pointed out that intense accumulation occurred historically in the Changhua River delta, forming a broad ridge plain protruding toward the sea and offshore sand bars due to the abundant sand from the Changhua River. However, nowadays the coast is suffering from intense erosion. The old sea wall built in 1972 was destroyed and disappeared into the sea by 1990. During that period, the coastal retreat rate was estimated at 4.8 m/yr (Huang and Luo, 2003; Ji et al., 2007).
4.1.3 Sand spit and coastal structures
Characteristic coastal morphology could also exert influence on the evolution of sandy beaches. In this study, the long sand spit to the northernmost of Sigeng beach, the wind generator base in the northern section, and the groin in the southern section showed their influence on Sigeng beach evolution. For the northern section of Sigeng beach, when northeasterly waves prevailed, the incident waves were diffracted by the long sand spit and then reached the nearshore with almost perpendicular to the shoreline. The long sand spit provided shelter for the coastal embayment behind the spit (Qi et al., 2021). The northern wind generator base, which was originally located on the land, is now sited on the seaward of the shoreline due to coastal erosion and retreat. Its impact on the adjacent beach was similar to that of an artificial headland. When southwesterly waves prevailed in summer, the obliquely incident waves transported sediment towards the north, leading to the severe erosion at P2 and notable accumulation at P1 (Figure 5, Figure 6). The groin in the southern section blocked most of the sand transported alongshore, leading to a certain degree of accretion at the updrift (P5) and erosion at the downdrift (P6), as indicated in Figure 5 and Figure 6.
4.1.4 Typhoon events
Previous studies showed that the strong winds, huge waves and storm surges caused by tropical cyclones (i.e. typhoons) were one of the most significant driving factors causing coastal erosion (Qi et al., 2010; Burvingt et al., 2017). Hainan Island was one of the areas that are frequently affected by storms. With global climate change, the frequency and intensity of storms landing in the northwest Pacific and South China Sea increased significantly (Knutson et al., 2010; Bacmeister et al., 2018). In this study, Sigeng beach (19.239°N, 108.635°E) was taken as the center and a buffer distance of 60 nautical miles (approximately 111 km) was considered as the criterion for judging whether a typhoon had an impact on Sigeng beach. The statistical results showed that there were 21 energetic typhoons affecting the beach, with an average of 1.5 typhoons per year from 2008 to 2022 (Figure 13A). Nearly all of these typhoons generated rough waves with significant wave height larger than 3.5 m in the offshore of the studied beach (as indicated by magenta circles in Figure 13B). Intense wave energy concentrated and dissipated on a limited stretch of coastal space in a relatively short period of time, causing a mass of sediment loss and significant beach erosion. The erosion caused by a strong typhoon often exceeded the changes in normal weather for a whole year, and some of the severe consequences continued for several years (Scott et al., 2016; Konstantinou et al., 2021).
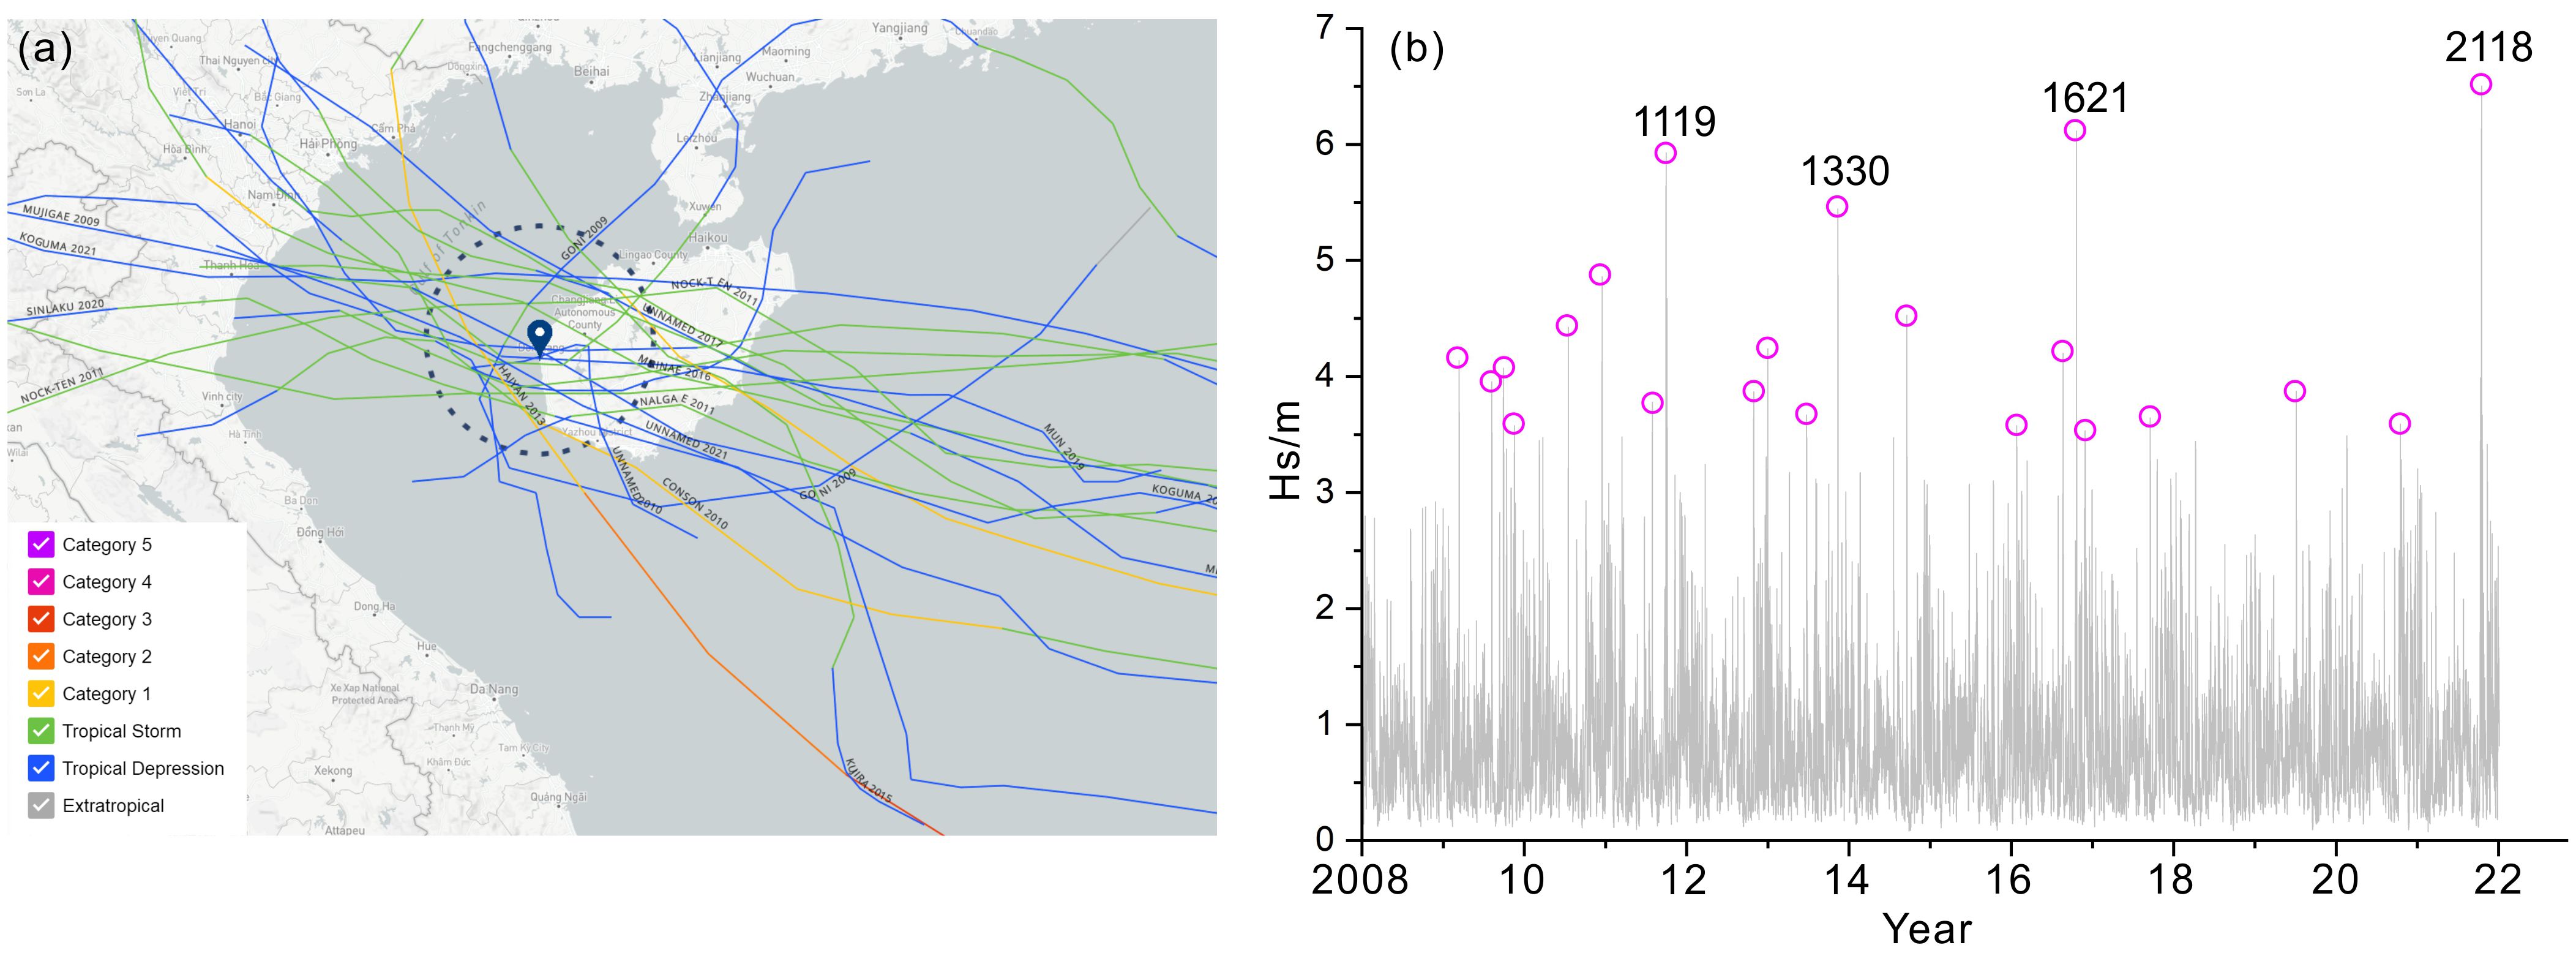
Figure 13 Recorded storms that have potential effect on Sigeng beach during 2008–2022. (A) Map of tracks of storms that have directly impacted Sigeng beach with a buffer distance of 60 nautical miles during the study period. Data is derived from NOAA (https://coast.noaa.gov/hurricanes/). (B) Offshore hourly significant wave height and identified energetic storms during the study period. Data is derived from ERA5 (https://cds.climate.copernicus.eu).
4.1.5 Aeolian transport
The southwest of Hainan Island was dry all year round, and the wind speed in the study area was relatively high. The wind could easily blow up the loose sediments on the beach berm. The aforementioned particle size analysis of beach surface sediments at the beach berm revealed that the median size ranged from 0.2 mm to 0.6 mm. Based on the commonly used empirical sand transport formula proposed by Bagnold (Bagnold, 1935 and Bagnold, 1937), the associated critical wind speed of the above sediment was approximately 5.5–8.8 m/s. Obviously, the wind speed in the study area exceeded the critical wind speed during part of the year, especially in winter seasons. Landward strong wind transported sediments from the berm to the backshore, causing beach sediment loss. Therefore, wind erosion is also a cause of coastal erosion for Sigeng beach.
4.1.6 Sea level rise
It is well known that sea level rise can also induce coastal erosion (Bruun, 1962; Hinkel et al., 2013; Luo et al., 2013; Ranasinghe, 2016). According to the theory proposed by Bruun (1962), when the sea level rises, the upper beach sediments will be eroded, and the eroded sediments will accumulate offshore. The beach profile is displaced shoreward, consistent with the extent of sea level rise. Bruun (1962) proposed a formula between the shoreline retreat rate (R) and the sea level rise rate (S):
in which, L is the horizontal distance between the beach berm and the closure depth, B is the height of the beach berm, and h is the closure depth.
According to the 2022 China Sea Level Bulletin issued by the Ministry of Natural Resources (MNR), the sea level rise rate along the western coast of Hainan Island was approximately 3.6 mm/year (S) between 1980 and 2022, and it was expected that the sea level would rise by 90 to 195 mm in the next 30 years (MEWMD, 2023). From the field survey at Sigeng beach, the beach berm height (B), the closure depth (h), and the horizontal distance between the beach berm and the closure depth (L) were approximately 3 m, 7 m, and 1000 m, respectively. It was estimated that the shoreline would retreat by an average of 0.36 m per year based on Bruun’s rule. Although the amount of shoreline erosion induced by sea level rise on the annual scale was small, the cumulative amount on a decade or centenary scales could be considerable. It can be seen that in the medium and long term, sea level rise is an important factor causing large-scale shoreline erosion.
4.2 Implications for coastal erosion management
The spatial analysis of the erosion and accretion rates and the future shoreline forecasting is of prime importance for the study area, as there are multiple wind generators built along the coastline. The aforementioned results indicate that several shoreline sections exhibit severe erosion, threatened the safety of the generator bases. The most serious section is the shoreline between 1400 m and 3500 m along the beach, where four wind generator bases are concentrated. The future forecast trend indicates the continuous retreat of this section and the complete loss of massive land by 2034 (Figure 8C). The beach retreat would ultimately jeopardize the safety of the above four wind generator bases. Therefore, urgent and appropriate protective measures are required to combat with beach erosion.
The above discussion indicated that the most important factors causing the erosion of Sigeng beach are the sediment supply reduction and LST induced by the oblique incidence of waves. Therefore, beach erosion count measures should focus on the two aspects. Considering the hydrodynamics, landform, sediment transport and erosion characteristics of the Sigeng coast, integrating beach nourishment together with physical barriers could be a potential solution. First, beach nourishment will replenish a huge amount of external sand sources for the severe erosion section to widen the beach and increase the coastal buffer zone. Second, considering that Sigeng beach erosion is primarily attributed to a net LST, a groin can be built at the downdrift of each wind generator base to stabilize the stretch of beach against erosion. Then a groin system (series of groins) can be built will result in a saw-tooth-shaped shoreline within the groin field and a differential in beach level on either side of the groins. Groins function well only when longshore transport occurs. However, the length of a single groin should be appropriate to not only intercept part of the sediment transport, but also allow part of the sediment to migrate downdrift. The distance between two adjacent groins should also be optimum to improve the efficiency of groin field in sand control and to ensure a certain beach width between adjacent groins. Third, multiple detached breakwaters could also be an alternative. A detached breakwater can be built at the frontage of each wind generator base to provide protection from waves. Each breakwater reflects and dissipates some of the incoming wave energy, thus reducing wave heights in the lee of the structure, interrupting transport along the shore, and reducing shore erosion. Sand transported along the beach moves into the sheltered area behind the breakwater, where it is deposited in the lower wave energy region. The nearshore wave pattern strongly influenced by the diffraction of breakwaters will cause salients or tombolos to be formed. The length of the breakwater and its distance to the shoreline primarily control the extent of sediment accumulation in the lee of the breakwater. For multiple detached breakwaters, the gaps between them are in most cases on the same order of magnitude as the length of one individual structure.
Anyway, the adopted coastal protection of the study area should be assessed carefully with the long-term observation-led numerical models, physical experiments and state-of-the-art techniques.
5 Conclusions
This research reveals the spatio-temporal morphological changes and decadel evolution of Sigeng beach adjacent to Changhua River Mouth in Hainan Island, China through repeated monitoring of shoreline and profile topography between 2008 and 2024. The results showed that Sigeng beach undergone significant changes over the years, with notable accretion at the northernmost and southernmost and general erosion at other locations. The shoreline change rates ranged from –18.4 m/yr to 13.0 m/yr, with the average rate of –1.9 m/yr, indicating overall erosion. Furthermore, the beach showed consistent spatial pattern in erosion and accretion during the three periods (2008–2014, 2014–2021, and 2021–2024).
The result demonstrated that there was a significant positive correlation between the change rates of sand volume per width and shoreline calculated from beach profiles, and the sand volume change rate per width was 2.99 times the shoreline change rate. The net LST rates along Sigeng beach was estimated through the combination of the cross-shore (profile) and longshore (shoreline) changes. The overall direction of net LST along the beach were southward, except for the northern section where the direction was northward due to the diffraction of NE waves by the long sand spit at the northernmost. The net LST rates at each profile varied from 0.8×10⁴ m3/yr to 3.5×10⁴ m3/yr.
Based on field surveys and previous studies, the major factors controlling Sigeng beach evolution were seasonal wave action and reduction in fluvial sediment load. Other factors included sand spit and coastal structures, typhoon events, aeolian transport, and sea level rise.
If the current conditions that occurred in the last 16 years continue with similar effects, the morphological erosion-accretion evolution trends of Sigeng beach are likely to continue. The beach retreat would ultimately jeopardize the safety of coastal wind generator bases. Subsequently, adaptive protection measures, including beach nourishment, accompanied with groin system or multiple detached breakwaters were proposed to combat with beach erosion.
Data availability statement
The original contributions presented in the study are included in the article/supplementary material. Further inquiries can be directed to the corresponding author.
Author contributions
GL: Funding acquisition, Conceptualization, Writing – original draft. FC: Funding acquisition, Conceptualization, Writing – review & editing. HQ: Supervision, Writing – review & editing. JL: Supervision, Writing – review & editing. CC: Investigation, Writing – review & editing. SZ: Visualization, Writing – review & editing. YH: Visualization, Writing – review & editing. JZ: Investigation, Writing – review & editing. CY: Data curation, Writing – review & editing. WM: Data curation, Writing – review & editing.
Funding
The author(s) declare financial support was received for the research, authorship, and/or publication of this article. This research is supported by the National Key Research and Development Program of China (No. 2022YFC3106100), the Scientific Research Foundation of the Third Institute of Oceanography, Ministry of Natural Resources (No. 2023011), and the Natural Science Foundation of Fujian Province (No. 2023J05071), the Open Foundation of Hainan Key Laboratory of Marine Geological Resources and Environment (22-HNHYDZZYHJKF024), and the Open Foundation of Observation and Research Station of East China Coastal Zone, Ministry of Natural Resources (ORSECCZ2022203). Fund of Key Laboratory of Marine Ecological Conservation and Restoration, Ministry of Natural Resources (EPR2023007).
Acknowledgments
The authors would like to thank Wei Feng, Zhirong Luo, Zijian Mao and Zhiyong Zhang for their hard work in field surveys, and Jixiang Zheng for his assistance in numerical simulation. Five reviewers are deeply appreciated for their very constructive comments, which have helped improve this paper substantially.
Conflict of interest
The authors declare that the research was conducted in the absence of any commercial or financial relationships that could be construed as a potential conflict of interest.
Publisher’s note
All claims expressed in this article are solely those of the authors and do not necessarily represent those of their affiliated organizations, or those of the publisher, the editors and the reviewers. Any product that may be evaluated in this article, or claim that may be made by its manufacturer, is not guaranteed or endorsed by the publisher.
References
Akdeniz H. B., İnam Ş. (2023). Spatio-temporal analysis of shoreline changes and future forecasting: the case of Küçük Menderes Delta, Türkiye. J. Coast. Conserv. 27, 34. doi: 10.1007/s11852-023-00966-8
Almar R., Boucharel J., Graffin M., Abessolo G. O., Thoumyre G., Papa F., et al. (2023). Influence of El Niño on the variability of global shoreline position. Nat. Commun. 14, 3133. doi: 10.1038/s41467-023-38742-9
Anthony E. J. (2015). Wave influence in the construction, shaping and destruction of river deltas: a review. Mar. Geol. 361, 53–78. doi: 10.1016/j.margeo.2014.12.004
Anthony E. J., Almar R., Besset M., Reyns J., Laibi R., Ranasinghe R., et al. (2019). Response of the Bight of Benin (Gulf of Guinea, West Africa) coastline to anthropogenic and natural forcing, Part 2: Sources and patterns of sediment supply, sediment cells, and recent shoreline change. Continent. Shelf Res. 173, 93–103. doi: 10.1016/j.csr.2018.12.006
Awad M., El-Sayed H. M. (2021). The analysis of shoreline change dynamics and future predictions using automated spatial techniques: Case of El-Omayed on the Mediterranean coast of Egypt. Ocean Coast. Manage. 205, 105568. doi: 10.1016/j.ocecoaman.2021.105568
Bacmeister J. T., Reed K. A., Hannay C., Lawrence P., Bates S., Truesdale J. E. (2018). Projected changes in tropical cyclone activity under future warming scenarios using a high-resolution climate model. Clim. Change. 146, 547–560. doi: 10.1007/s10584-016-1750-x
Barnard P. L., Short A. D., Harley M. D., Splinter K. D., Vitousek S., Turner I. L., et al. (2015). Coastal vulnerability across the Pacific dominated by El Nino/Southern oscillation. Nat. Geosci. 8, 801–807. doi: 10.1038/ngeo2539
Bayram A., Larson M., Hanson H. (2007). A new formula for the total longshore sediment transport rate. Coast. Eng. 54, 700–710. doi: 10.1016/j.coastaleng.2007.04.001
Beck M. W., Losada I. J., Menéndez P., Reguero B. G., Díaz-Simal P., Fernández F. (2018). The global flood protection savings provided by coral reefs. Nat. Commun. 9, 2186. doi: 10.1038/s41467-018-04568-z
Bendixen M., Best J., Hackney C., Iversen L. L. (2019). Time is running out for sand. Nature 571, 29–31. doi: 10.1038/d41586-019-02042-4
Bertin X., Castelle B., Chaumillon E., Butel R., Quique R. (2008). Longshore transport estimation and inter-annual variability at a high-energy dissipative beach: St. Trojan beach, SW Oléron Island, France. Continent. Shelf Res. 28, 1316–1332. doi: 10.1016/j.csr.2008.03.005
Boak E. H., Turner I. L. (2005). Shoreline definition and detection: A review. J. Coast. Res. 21, 688–703. doi: 10.2112/03-0071.1
Bowen A. J., Inman D. L. (1966). Budget of littoral sands in the vicinity of Point Arguello, California (Fort Belvoir: US Army Coastal Engineering Research Center).
Bozzeda F., Ortega L., Costa L. L., Fanini L., Barboza C. A. M., McLachlan A., et al. (2023). Global patterns in sandy beach erosion: unraveling the roles of anthropogenic, climatic and morphodynamic factors. Front. Mar. Sci. 10. doi: 10.3389/fmars.2023.1270490
Bruun P. (1962). Sea-level rise as a cause of shore erosion. J. Waterways Harbors Divisions. 88, 117–130. doi: 10.1061/JWHEAU.0000252
Burvingt O., Masselink G., Russell P., Scott T. (2017). Classification of beach response to extreme storms. Geomorphology 295, 722–737. doi: 10.1016/j.geomorph.2017.07.022
Cai F., Su X. Z., Liu J. H., Li B., Lei G. (2009). Coastal erosion in China under the condition of global climate change and measures for its prevention. Prog. Natural Sci. 19, 415–426. doi: 10.1016/j.pnsc.2008.05.034
CERC (Coastal Engineering Research Center) (1984). Shore protection manual (Vicksburg, MS: Army Engineer Waterways Experiment Station).
Chen J. Y., Xia D. X., Yu Z. Y. (2010). A brief introduction of coastal erosion in China (China Ocean Press: Beijing).
Dean R. G., Galvin C. J. Jr. (1976). Beach erosion: Causes, processes, and remedial measures. Crit. Rev. Environ. Sci. Technol. 6, 259–296. doi: 10.1080/10643387609381643
de Schipper M. A., Ludka B. C., Raubenheimer B., Luijendijk A. P., Schlaucher T. A. (2021). Beach nourishment has complex implications for the future of sandy shores. Nat. Rev. Earth Environ. 2, 70–84. doi: 10.1038/s43017-020-00109-9
de Vries S., Wengrove M., Bosboom J. (2020). “Marine sediment transport,” in Sandy Beach Morphodynamics. Eds. Jackson D. W. T., Short A. D. (Elsevier, Amsterdam), 187–212. doi: 10.1016/B978–0-08–102927–5.00009–6
DHI (2024). MIKE 21 Spectral Wave Module, Scientific Documentation (Hørsholm, Denmark: DHI Water Environment Health). 66p.
Gao J. (2014). Research on the sediment transport model of Changhua river estuary in Hainan province based on the analysis of remote sensing. China University of Geosciences Beijing, Beijing (China.
Gong H., Chen S. L., Zhong X. J., Chen Q., Hu J., Cheng W. F. (2017). Complicated responses of beach erosion and restoration to consecutive typhoons along northeastern Hainan Island. Hai Yang Xue Bao. 39, 68–77. doi: 10.3969/j.issn.0253-4193.2017.05.007
HAOFS (Hainan Academy of Ocean and Fisheries Sciences) (2014). Study on causes and evaluation of coastal erosion in Sigeng (Haikou: HAOFS). 59p.
He Y. Y., Zhu J., Qi H. S., Liu G., Lei G., Zhao S. H., et al. (2021). Beach restoration strategy influenced by artificial island: a case study on the west coast of Haikou. J. Appl. Oceanogr. 40, 2–11. doi: 10.3969/J.ISSN.2095-4972.2021.01.001
Hersbach H., Bell B., Berrisford P., Hirahara S., Horányi A., Muñoz-Sabater J., et al. (2020). The ERA5 global reanalysis. Q. J. R. Meteorol. Soc. 146, 1999–2049. doi: 10.1002/qj.3803
Himmelstoss E. A., Farris A. S., Henderson R. E., Kratzmann M. G., Ergul A., Zhang O., et al. (2021b). Digital Shoreline Analysis System version 5.1 (Woods Hole, MA: U.S. Geological Survey software release). Available at: https://code.usgs.gov/cch/dsas.
Himmelstoss E., Henderson R. E., Kratzmann M. G., Farris A. S. (2021a). Digital shoreline analysis system (DSAS) version 5.1 user guide (No. 2021–1091) (Woods Hole, MA: US Geological Survey). doi: 10.3133/ofr20211091
Hinkel J., Nicholls R. J., Tol R. S. J., Wang Z. B., Hamilton J. M., Boot G., et al. (2013). A global analysis of erosion of sandy beaches and sea-level rise: an application of DIVA. Global Planet. change. 111, 150–158. doi: 10.1016/j.gloplacha.2013.09.002
HODPDI (Hainan Ocean Development Planning and Design Institute) (2013). Research report on coastal morphodynamics and sediment transport of Changhua fishing port renovation project (Haikou: HODPDI). 226p.
Hou X. Y., Wu T., Hou W., Chen Q., Wang Y. D., Yu L. J. (2016). Characteristics of coastline changes in mainland China since the early 1940s. Sci. China-Earth Sci. 59, 1791–1802. doi: 10.1007/s11430-016-5317-5
Huang S. M., Luo Z. R. (2003). Research on sandy coast erosion in Hainan Island. J. Guangzhou Univ. (Natural Sci. Edition). 2, 449–454. doi: 10.3969/j.issn.1671-4229.2003.05.012
Inman D. L., Bagnold R. A. (1963). “Beach and Nearshore Processes; Part II: Littoral Processes,” in The Sea. Ed. Hill M. N., (New York: Wiley‐Interscience) 529–553.
Ji R. Y., Luo X. L., Lu Y. J., Luo Z. R. (2007). “Characteristics and main causes of coastal erosion in Hainan Island,” in Proceedings of the 13th China Ocean (Shore) Engineering Symposium. (Nanjing, China: Chinese Society of Ocean Engineering). 378–381.
Joensen B., Bingham H. B. (2023). Comparison of a spectral wave model with a fully nonlinear potential flow wave model. Ocean Eng. 287, 115842. doi: 10.1016/j.oceaneng.2023.115842
Kalman R. E. (1960). A new approach to linear filtering and prediction problems. J. Basic Eng. 82 (1), 35–45. doi: 10.1115/1.3662552
Kamphuis J. W. (1991). Alongshore sediment transport rate. J. Waterw. Port Coast. Ocean Eng. 117, 624–640. doi: 10.1061/(ASCE)0733-950X(1991)117:6(624)
Kamphuis J. W., Readshaw J. S. (1978). “A model study of alongshore sediment transport rate,” in Proceedings of the Sixteenth Conference on Coastal Engineering (ASCE, Hamburg, Germany), 1656–1674. doi: 10.1061/9780872621909.101
Knutson T. R., McBride J. L., Chan J., Emanuel K., Holland G., Landsea C. (2010). Tropical cyclones and climate change. Nat. geosci. 3, 157–163. doi: 10.1038/ngeo779
Komar P. D. (1998). Beach Processes and Sedimentation. 2nd ed. (New Jersey: Prentice-Hall, Englewood Cliffs). doi: 10.1029/98EO00170
Komar P. D., Inman D. L. (1970). Longshore sand transport on beaches. J. Geophys. Res. 75, 5914–5927. doi: 10.1029/JC075i030p05914
Konstantinou A., Stokes C., Masselink G., Scott T. (2021). The extreme 2013/14 winter storms: Regional patterns in multi-annual beach recovery. Geomorphology 389, 107828. doi: 10.1016/j.geomorph.2021.107828
Li S. Z. (2021). Study on the influence of artificial island on dynamic sediment environment and beach erosion and deposition evolution of sandy coast. Ocean Eng. 39, 144–153. doi: 10.16483/j.issn.1005-9865.2021.04.016
Li H. Y., Zhang H. Y., Wang X., Yu H. B., Xu Y. F., Liu X. J., et al. (2019). Influence on the sandy coast evolution of the ocean engineering—A case study of artificial Riyue island, Wanning. Mar. Environ. Sci. 38, 17–23.
Li Y., Zhang C., Zhao S. H., Qi H. S., Cai F., Zheng J. H. (2024). Equilibrium configurations of sandy-muddy transitional beaches on south China coasts: role of waves in formation of sand-mud transition boundary. Coast. Eng. 187, 104401. doi: 10.1016/j.coastaleng.2023.104401
Liu J., Li B., Chen W., Li J., Yan J. (2022a). Evaluation of ERA5 wave parameters with in situ data in the South China sea. Atmosphere 13, 935. doi: 10.3390/atmos13060935
Liu G., Qi H. S., Cai F., Zhu J., Zhao S. H., Liu J. H., et al. (2022b). Initial morphological responses of coastal beaches to a mega offshore artificial island. Earth Surf. Process. Landforms. 47, 1355–1370. doi: 10.1002/esp.5320
Long J. W., Plant N. G. (2012). Extended Kalman Filter framework for forecasting shoreline evolution. Geophys. Res. Lett. 39, L13603. doi: 10.1029/2012GL052180
Longuet-Higgins M. S. (1970). Longshore currents generated by obliquely incident waves. J. Geophys. Res. 75, 6778–6789. doi: 10.1029/JC075i033p06778
Luijendijk A., Hagenaars G., Ranasinghe R., Baart F., Donchyts G., Aarninkhof S. (2018). The state of the world’s beaches. Sci. Rep. 8, 1–11. doi: 10.1038/s41598-018-24630-6
Luo S. L., Cai F., Wang H. J. (2013). Development of coastal erosion and management. Adv. In Earth Sci. 28, 1239–1247. doi: 10.11867/j.issn.1001-8166.2013.11.1239
Luo Z. R., Luo X. L. (1995). “Human activities and sandy beach erosion in Hainan Island,” in Sea level Change and Coastal erosion album (Nanjing University Press, Nanjing), 205–212.
Lv L. (2021). Research of modern sediment transport model of Changhua river estuary in Hainan province. China University of Geosciences Beijing, Beijing (China.
Masselink G., Castelle B., Scott T., Dodet G., Suanez S., Jackson D., et al. (2016). Extreme wave activity during 2013/2014 winter and morphological impacts along the Atlantic coast of Europe. Geophys. Res. Lettl 43, 2135–2143. doi: 10.1002/2015GL067492
Mentaschi L., Vousdoukas M. I., Pekel J. F., Voukouvalas E., Feyen L. (2018). Global long-term observations of coastal erosion and accretion. Sci. Rep. 8, 12876. doi: 10.1038/s41598–018-30904-w
MEWMD (Marine Early Warning and Monitoring Division, Ministry of Natural Resources) (2023). 2022 China Sea Level Bulletin (Beijing: Ministry of Natural Resources). 50p.
Mil-Homens J., Ranasinghe R., van Thiel de Vries J. S. M., Stive M. J. F. (2013). Re-evaluation and improvement of three commonly used bulk longshore sediment transport formulas. Coast. Eng. 75, 29–39. doi: 10.1016/j.coastaleng.2013.01.004
Moeini M. H., Etemad-Shahidi A. (2007). Application of two numerical models for wave hindcasting in Lake Erie. Appl. Ocean Res. 29, 137–145. doi: 10.1016/j.apor.2007.10.001
Nativí-Merchán S., Caiza-Quinga R., Saltos-Andrade I., Martillo-Bustamante C., Andrade-García G., Quiñonez M., et al. (2021). Coastal erosion assessment using remote sensing and computational numerical model. Case of study: Libertador Bolivar, Ecuador. Ocean Coast. Manage. 214, 105894. doi: 10.1016/j.ocecoaman.2021.105894
Nicu I. C. (2021). Is digital shoreline analysis system “fit” for gully erosion assessment? Catena 203, 105307. doi: 10.1016/j.catena.2021.105307
Nijamir K., Ameer F., Thennakoon S., Herath J., Iyoob A. L., Zahir I. L. M., et al. (2023). Geoinformatics application for estimating and forecasting of periodic shoreline changes in the east coast of Ampara District, Sri Lanka. Ocean Coast. Manage. 232, 106425. doi: 10.1016/j.ocecoaman.2022.106425
Passeri D. L., Bilskie M. V., Plant N. G., Long J. W., Hagen S. C. (2018). Dynamic modeling of barrier island response to hurricane storm surge under future sea level rise. Clim. Change. 149, 413–425. doi: 10.1007/s10584-018-2245-8
PCZECL (Power China Zhongnan Engineering Corporation Limited) (2008). Feasibility study report on Sigeng wind farm in Dongfang, Hainan Province (Changsha: PCZECL). 315p.
Peduzzi P. (2014). Sand, rarer than one thinks. Environ. Dev. 11, 208–218. doi: 10.1016/j.envdev.2014.04.001
Pranzini E., Wetzel L., Williams A. T. (2015). Aspects of coastal erosion and protection in Europe. J. Coast. Conserv. Coast. 19, 445–459. doi: 10.1007/s11852-015-0399-3
Qi H. S., Cai F., Lei G., Cao H. M., Shi F. Y. (2010). The response of three main beach types to tropical storms in South China. Mar. geol. 275, 244–254. doi: 10.1016/j.margeo.2010.06.005
Qi Y. L., Yu Q., Gao S., Li Z. Q., Fang X., Guo Y. H. (2021). Morphological evolution of river mouth spits: wave effects and self-organization patterns. Estuarine Coast. Shelf Sci. 262, 107567. doi: 10.1016/j.ecss.2021.107567
Ran J., Wang Y. X., Li X. Y. (2017). Analysis on changes of sandy coast and ecological environment at Longmu bay in Hainan. Environ. Sci. Manage. 42, 154–157.
Ranasinghe R. (2016). Assessing climate change impacts on open sandy coasts: a review. Earth-sci. Rev. 160, 320–332. doi: 10.1016/j.earscirev.2016.07.011
Rangel-Buitrago N., Neal W., Pilkey O., Longo N. (2023). The global impact of sand mining on beaches and dunes. Ocean Coast. Manage. 235, 106492. doi: 10.1016/j.ocecoaman.2023.106492
Rosati J. D. (2005). Concepts in sediment budgets. J. Coast. Res. 21, 307–322. doi: 10.2112/02-475A.1
Scott T., Masselink G., O’Hare T., Saulter A., Poate T., Russell P. (2016). The extreme 2013/2014 winter storms: Beach recovery along the southwest coast of England. Mar. Geol. 382, 224–241. doi: 10.1016/j.margeo.2016.10.011
Shi H., Cao X., Li Q., Li D., Sun J., You Z., et al. (2021a). Evaluating the accuracy of ERA5 wave reanalysis in the water around China. J. Ocean Univ. China 20, 1–9. doi: 10.1007/s11802-021-4496-7
Shi H. Y., Chen Z., Lv Y. B. (2021b). Monitoring and evaluation of coastal erosion of sandy beach in Yalong Bay. Ocean Dev. Manage. 38, 80–84.
Shi J., Feng X., Toumi R., Zhang C., Hodges K. I., Tao A., et al. (2024). Global increase in tropical cyclone ocean surface waves. Nat. Commun. 15, 174. doi: 10.1038/s41467-023-43532-4
Short A. D., Jackson D. W. T. (2022). “Beach morphodynamics,” in Treatise on Geomorphology, vol. 10 . Eds. Shroder J., Sherman D. J. (Academic Press, San Diego (CA), 106–129. doi: 10.1016/B978–0-12–818234–5.00052–3
Syvitski J., Ángel J. R., Saito Y., Overeem I., Vörösmarty C. J., Wang H. J., et al. (2022). Earth’s sediment cycle during the Anthropocene. Nat. Rev. Earth Environ. 3, 179–196. doi: 10.1038/s43017-021-00253-w
Syvitski J. P. M., Vörösmarty C. J., Kettner A. J., Green P. (2005). Impact of humans on the flux of terrestrial sediment to the global coastal ocean. Science 308, 376–380. doi: 10.1126/science.1109454
Temmerman S., Meire P., Bouma T. J., Herman P. M. J., Ysebaert T., De Vriend H. J. (2013). Ecosystem-based coastal defense in the face of global change. Nature 504, 79–83. doi: 10.1038/nature12859
Thom B. G., Eliot I., Eliot M., Harvey N., Rissik D., Sharples C., et al. (2018). National sediment compartment framework for Australian coastal management. Ocean Coast. Manage. 154, 103–120. doi: 10.1016/j.ocecoaman.2018.01.001
Tian H. B., Yin P., Yang F. L. (2018). An analysis of erosional characteristics of the sandy coast in the eastern part of Wanning, Hainan. Mar. Geol. Quater. Geol. 38, 44–55.
TIO (Third Institute of Oceanography, Ministry of Natural Resources) (2023). Research on the evolution and regulation scheme of Xiaojiao beach in Qizi Bay (Xiamen: TIO). 138p.
UNEP (2022). Sand and sustainability: 10 strategic recommendations to avert a crisis (Geneva (Switzerland: GRID-Geneva, United Nations Environment Program). Available at: https://unepgrid.ch/en/resource/2022SAND.
Van Rijn L. C. (2011). Coastal erosion and control. Ocean Coast. Manage. 54, 867–887. doi: 10.1016/j.ocecoaman.2011.05.004
Vousdoukas M. I., Ranasinghe R., Mentaschi L., Plomaritis T. A., Athanasiou T., Luijendijk A., et al. (2020). Sandy coastlines under threat of erosion. Nat. Climate change. 10, 260–263. doi: 10.1038/s41558-020-0697-0
Wang B. C., Chen S. L., Gong W. P. (2006). Formation and evolution of the estuarine coast of Hainan Island (Beijing: China Ocean Press), 32–11.
Wang J., Wang Y. (2022). Evaluation of the ERA5 significant wave height against NDBC buoy data from 1979 to 2019. Mar. Geodesy 45, 151–165. doi: 10.1080/01490419.2021.2011502
Woodroffe C. D. (2002). Coasts: Form, Process and Evolution (Cambridge: Cambridge University Press). doi: 10.1017/CBO9781316036518
Yang Z. H., Jia J. J., Wang X. K., Gao J. H. (2013). Characteristics and variations of water and sediment fluxes into the sea of the top three rivers of Hainan in recent 50 years. Mar. Sci. Bull. 32 (01), 92–99.
Zhong X. J. (2017). Morphodynamics of the beaches around Hainan Island: The normal processes, the influence of extreme events and artificial island construction. East China Normal University, Shanghai (China.
Keywords: DSAS, longshore sediment transport, Hainan Island, coastal erosion, fluvial sediment
Citation: Liu G, Cai F, Qi H, Liu J, Cao C, Zhao S, He Y, Zhu J, Yin C and Mo W (2024) Decadal evolution of a sandy beach adjacent to a river mouth under natural drivers and human impacts. Front. Mar. Sci. 11:1384780. doi: 10.3389/fmars.2024.1384780
Received: 10 February 2024; Accepted: 15 May 2024;
Published: 30 May 2024.
Edited by:
Giandomenico Foti, Mediterranean University of Reggio Calabria, ItalyReviewed by:
Shenliang Chen, East China Normal University, ChinaGuoxiang Wu, Ocean University of China, China
Liang Zhou, Jiangsu Normal University, China
Copyright © 2024 Liu, Cai, Qi, Liu, Cao, Zhao, He, Zhu, Yin and Mo. This is an open-access article distributed under the terms of the Creative Commons Attribution License (CC BY). The use, distribution or reproduction in other forums is permitted, provided the original author(s) and the copyright owner(s) are credited and that the original publication in this journal is cited, in accordance with accepted academic practice. No use, distribution or reproduction is permitted which does not comply with these terms.
*Correspondence: Feng Cai, Y2FpZmVuZ0B0aW8ub3JnLmNu