
94% of researchers rate our articles as excellent or good
Learn more about the work of our research integrity team to safeguard the quality of each article we publish.
Find out more
ORIGINAL RESEARCH article
Front. Mar. Sci., 14 May 2024
Sec. Marine Biogeochemistry
Volume 11 - 2024 | https://doi.org/10.3389/fmars.2024.1384334
This article is part of the Research TopicBiogeochemical Responses to Physical Processes in the North Pacific and Its Adjacent Marginal SeasView all 9 articles
 Jiawei Gao1,2†
 Shulan Xu1,2†
 Rong Bi1,2*
 Yaoyao Wang3
 Yang Ding1,2
 Hong Che4
 Jing Zhang1,5
 Peng Yao1,2
 Jie Shi2,6
 Meixun Zhao1,2*
Lipid biomarkers are amongst the most widely used proxies in studies of the structure and functioning of marine food webs. However, vertical distributions of lipid biomarkers and their controlling mechanisms remain unclear, especially in highly dynamic coastal ecosystems. Here we tested vertical profiles of key lipid biomarkers (sterols and fatty acids) in suspended particles and their correlations with water masses in spring of 2017 and summer of 2018 in the Zhejiang coasts of the East China Sea. The Changjiang Diluted Water, the Taiwan Strait Water and the Kuroshio Subsurface Water showed strong contributions in the surface layer in spring, the surface layer in summer, and the deep layer in both seasons, respectively. Accordingly, lipid biomarker composition also varied between different water layers. Overall, lipid biomarker concentrations in the surface layer were around 2 ~ 7 times higher than those in the deep layer, indicating high phytoplankton biomass in the surface layer. The ratio of docosahexaenoic acid to eicosapentaenoic acid was also higher in the surface layer, especially in the south of our study region, suggesting high nutritional quality of particulate organic matters in the surface layer. Significant correlations between the depth profiles of lipid biomarkers and water masses suggested the control of water masses on lipid biomarker production. The distribution patterns of lipid biomarkers in our study are consistent with previous findings on zooplankton grazing and fish larvae, highlighting the significance of lipid biomarkers as trophic markers to study food web structure and functioning in highly dynamic coasts.
Coastal ecosystems, located at the land-open ocean interaction zone, possess rich biological and commercial resources, and they are influenced by complex climate forcing and anthropogenic activities (Lotze et al., 2006; Dai et al., 2023). The East China Sea (ECS) coastal region along the Zhejiang Province nourishes a fast-growing and high-density population. The hydrography in this region is strongly affected by not only large riverine inputs from the adjacent rivers such as the Changjiang River, but also the western boundary current, the Kuroshio. Thus, riverine inputs and oceanic water masses jointly regulate the ecosystems in the Zhejiang coast (Peng et al., 2023).
Phytoplankton dynamics show strong spatiotemporal variations in the Zhejiang coast, which further governs the structure and functioning of marine food webs (Bai et al., 2015; Zheng et al., 2015). Diatoms and dinoflagellates are dominant phytoplankton groups in the Changjiang River Estuary (CRE) and adjacent areas in the ECS. Diatoms are especially important in summer influenced by the Changjiang River plume, while dinoflagellates are important during spring blooms with a mid-range salinity optimum and more pronounced temperature effects (Liu et al., 2016; Li et al., 2023). The upwelling of Kuroshio Subsurface Water (KSSW) has been also considered as a main factor regulating diatom flourishing in the ECS coasts (Xu et al., 2020). It has been reported that the variations in phytoplankton growth closely coupled with zooplankton grazing, and both showed significantly higher values in the surface water than in the deep water (Zheng et al., 2015). Fish larvae assemblages also showed regional characteristics, which fit perfectly with water masses (Lin et al., 2016). Altogether, bottom-up processes have been shown to control the trophic structure in the ECS (Bai et al., 2015). Food chain effects of phytoplankton nutritional quality have been widely observed, and phytoplankton chemical composition (e.g., essential fatty acids (FAs) and sterols) determines nutritional quality of phytoplankton as food for herbivores (Ruess and Müller-Navarra, 2019; Straile and Martin-Creuzburg, 2022). Thus, the shifts in nutritional quality of phytoplankton should be considered for a more complete understanding of food web dynamics in the changing coastal ecosystems in the ECS.
Fatty acids and sterols are crucial components in all eukaryotic cells, while in marine ecosystems, essential FAs and sterols are mainly produced by phytoplankton (Dalsgaard et al., 2003; Volkman, 2003). Besides being applied as nutritional quality indicators, FAs and sterols can be also used as phytoplankton chemotaxonomic biomarkers, as the presence and combinations of certain FAs and sterols are characteristic of particular phytoplankton classes (Dalsgaard et al., 2003; Cao et al., 2023). Previous studies have reported the distributions of FAs and sterols in suspended particles in the ECS (Sicre et al., 1994; Shin et al., 2003; Nakanishi et al., 2012; Wu et al., 2016; Cao et al., 2022), as well as other coastal regions in the world oceans (e.g., Tolosa et al., 2003; Mayzaud et al., 2014; McLaskey et al., 2024). For example, the concentration of a major polyunsaturated fatty acid (PUFA) component, DHA [docosahexaenoic acid (22:6n-3)], was highest at 5 ~ 20 m and decreased with depth at the contact zone between the Kuroshio water and the Changjiang Diluted Water (CDW)/Yellow Sea central cold-water masses in the ECS in spring 2008 (Nakanishi et al., 2012). Bi et al. (2018) observed that lipid biomarkers (sterols and C37 alkenones) in surface suspended particles can reflect phytoplankton biomass and community structure, and the variations of phytoplankton biomass and community structure can be well elucidated by water masses in the northeastern ECS and adjacent areas. To date, the distribution of lipid biomarkers and its controlling mechanisms have been mostly illustrated in the surface water, while our understanding of vertical distributions of multiple lipid biomarkers and their correlations with water masses is still limited in the ECS.
In this study, we assess vertical distribution patterns of lipid biomarkers (FAs and sterols) and their correlations with water masses in spring 2017 and summer 2018 in the Zhejiang coasts of the ECS. Based on our previous studies in the ECS (Wu et al., 2016; Bi et al., 2018), brassicasterol and dinosterol have been validated as proxies of the biomass of diatoms and dinoflagellates, respectively. As mentioned above, diatoms and dinoflagellates are dominant phytoplankton groups in our study region, we thus also use brassicasterol and dinosterol as proxies of diatom-dinoflagellate community structure, with their sum (ΣPB) as a proxy of total phytoplankton biomass and their proportion (% of ΣPB) denoting the contribution of each phytoplankton group to total phytoplankton biomass. The ratio of DHA to EPA [eicosapentaenoic acid (20:5n-3)] (DHA/EPA) is applied as an indicator of food quality, with the ratios of ~1 being considered sufficient for most fish species (Copeman and Laurel, 2010). We address the following questions: (1) Do lipid biomarkers show clear vertical profiles? (2) Are there significant correlations between the distributions of lipid biomarkers and water masses in the ECS coasts?
The study area is located at the edge of the coastal zone along the coast of Zhejiang Province, with a water depth of about 50 m and an offshore distance of about 100 km (Figure 1). This region is the interface between land and sea in the western ECS. The CDW, the Taiwan Strait Water (TSW) and the KSSW are the three most important water masses and regulate the hydrophysical and chemical properties, nutrients and ecological environments in this region (Zhang et al., 2019; Luo et al., 2023). Among them, the CDW, the diluted water of the largest river of China (Changjiang River) which flows over 6300 km, is characterized by high nutrient concentrations and high ratios of nitrogen to phosphorus (N:P), caused by human activities such as fertilization (Zhang et al., 2021). Both the TSW and the KSSW invade the ECS shelf under the effect of monsoon. The TSW has high temperature, high salinity and relatively low nutrient concentrations, while the KSSW characteristically carries a high proportion of phosphorus (Chen, 1996; Zhang et al., 2021).
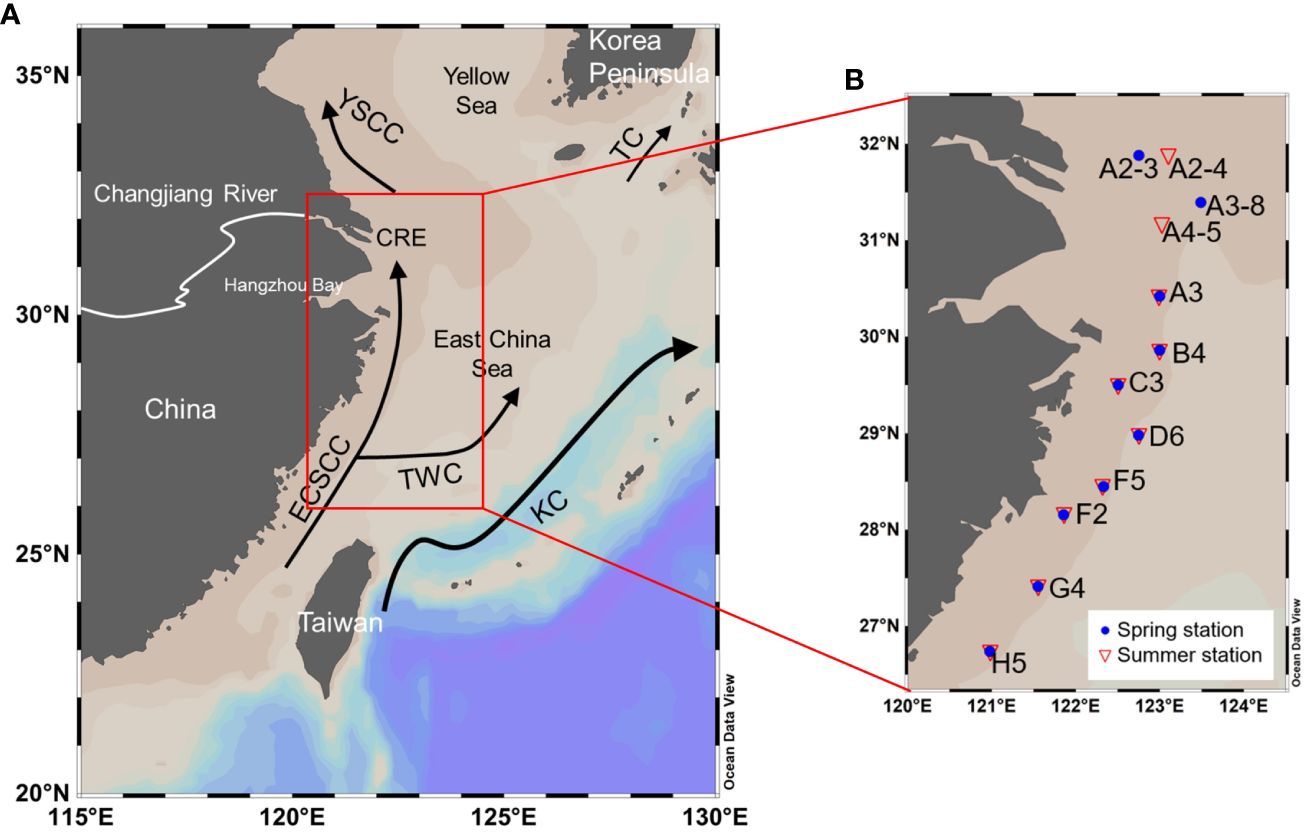
Figure 1 Maps of current systems in the East China Sea in summer (A) and sampling stations (B) along the Zhejiang coast in spring of 2017 (blue dots) and summer of 2018 (red triangles). KC, TC, TWC, ECSCC and YSCC represent the Kuroshio Current, the Tsushima Current, the Taiwan Warm Current, the East China Sea Coastal Current and the Yellow Sea Coastal Current, respectively. The Changjiang Diluted Water (CDW), the Taiwan Strait Water (TSW) and the Kuroshio Subsurface Water (KSSW) are the three most important water masses in the study area, regulated by ECSCC, KC and TWC. The figure is based on data from Bian et al. (2013) and Wu et al. (2016).
Our cruises were carried out during April to May in spring of 2017 (cruises: MZ17SP during April 22 ~ May 13, and NORC2017–03 during May 5 ~ 19) and August in summer of 2018 (cruise: MZ18SU during August 4 ~ 21), with the study area spanning between 27 ~ 32°N and 121 ~ 123.5°E. Analysis of temperature, salinity, chlorophyll a (Chl a), dissolved oxygen (DO) concentrations, nutrient concentrations and suspended particles were conducted at a total of 20 stations. For samples of suspended particles, sampling layers included the surface layer at 20 stations, the middle layer at 13 stations and the bottom layer at 17 stations, with the sampling depth shown in the Supplementary Table S1. Temperature, salinity, and the concentrations of DO and Chl a were measured in situ using CTD instruments (SBE 25 for the cruise NORC2017–03, RBR concerto logger for the cruise MZ17SP, and RBR XR–620 for the cruise MZ18SU). Sensors for the above parameters were all calibrated before the cruises and Chl a based on CTD in the summer cruise was calibrated with the solvent-extracted ones. Parts of the data for temperature, salinity, Chl a concentrations and nutrient concentrations were obtained from previous studies: (Wei et al., 2021; Che et al., 2022).
Samples for lipid biomarker analyses and particulate organic carbon (POC) were collected by filtration on Whatman GF/F filters (150 mm diameter, 0.7 µm). 10 ~ 100 L water was filtered for suspended particles analysis (Supplementary Table S1). Analysis of sterols (brassicasterol and dinosterol) and FAs were carried out following the methods in Galy et al. (2011) and Zhao et al. (2000). Briefly, freeze-dried samples were firstly extracted using organic solvent (methanol/dichloromethane = 1:3, v:v), then hydrolyzed with 6% KOH in methanol and separated into the “neutral” fraction and the “acid” fraction. The polar fraction (including sterols) in the “neutral” fraction was subsequently separated using silica gel column chromatography. Sterols were then derivatized by N,O-bis(trimethylsily)-trifluoroacetamide at 70°C for 1 h. The “acid” fraction, which was adjusted to the pH = 1, was extracted with hexane and then derivatized at 70°C, with a mixture of HCl and methanol (95:5, v:v). C19-alkanol and 19:0 were added as internal standards. Sterols and FAs were analyzed by gas chromatography (Agilent 7890 N and 8890A, respectively) with a HP-1 capillary column (50 m × 0.32 mm × 0.17 μm) and a SP-2560 capillary column (100 m × 0.25 mm × 0.20 μm), respectively. Individual FAs were identified with reference to Supelco 37 component FAME mixture. The recovery rate of the extraction based on the spiked surrogate standard was 79 ± 11%. The detection limits for sterols and FAs analysis were 5 ng L-1. POC was analyzed using an Elemental Analyzer (Thermo Flash 2000), with the precision of 0.02% (wt%, n = 6). Before POC analysis, PIC was removed from samples using HCl. For nutrient analysis, samples were collected at 6 and 10 stations in spring and summer, respectively. For samples collected in spring, the concentrations of NOx (NO2–+NO3–), DIP (dissolved inorganic phosphorus) and DSi (dissolved silicon) were measured with a SAN Plus continuous-flow analyzer and 4802 UV/VIS Double Beam Spectrophotometer for the cruise NORC2017–03, and an AA3 continuous-flow analyzer for the cruise MZ17SP. For samples collected in summer, the concentrations of NOx, NH4+, DIP and DSi were analyzed with a QUAATRO continuous-flow analyzer for the cruise MZ18SU. The detection limits for nutrients are shown in Supplementary Table S2.
A MATLAB package, using a Bayesian Markov chain Monte Carlo method (Bosch et al., 2015), was applied to test the relative contributions of the three water masses (the CDW, the TSW and the KSSW) in a three end-member mixing model based on mass conservation of temperature and salinity. The end-members of the CDW, the TSW and the KSSW were obtained based on the sample locations, T-S properties and previous studies (Zhou et al., 2018; Che et al., 2022) (Supplementary Figure S1; Supplementary Table S3). The CDW was identified based on low salinity and low temperature in spring, and low salinity and high temperature in summer (Zhou et al., 2018; Chen et al., 2021). In both seasons, the TSW was characterized by high temperature and high salinity, while the KSSW was characterized by high salinity and a temperature of ~ 19°C (Chen, 1996; Qi et al., 2017). The mean SD for the calculated proportions of CDW, TSW and KSSW water was 1%, 3% and 3% in spring, and 3%, 5% and 3% in summer, respectively.
To elucidate a common vertical distribution patterns, we defined the surface and deep layers in data and statistical analysis. The surface layer was defined as the depth < 5 m, consistent with our previous work (Wu et al., 2016; Bi et al., 2018). The middle layer (sampling depth: 12 ~ 30 m) was determined according to the depth of deep chlorophyll maximum layer, and middle layer with high Chl a concentrations or low DO concentrations. Water mass proportions showed no significant difference between the middle layer and bottom layer according to Mann-Whitney U test (Supplementary Table S4), thus, the middle layer and bottom layer were grouped as the deep layer and their values of lipid biomarkers (and water mass proportions) were averaged.
Cluster analysis was utilized to explore the similarity of water mass composition between the surface and deep layers using Origin (version: Origin 2021). Subsequently, principal component analysis (PCA) was performed based on water mass proportions to explore the contributions of water masses to the surface and deep layers in spring and summer. The same analysis was implemented based on sterol proportions (as % of ΣPB) and FA composition [as % of total fatty acids (TFAs)] to distinguish the differences at each station in the surface and deep layer in both seasons. PCA was also conducted based on the proportions of lipid biomarkers under the dominance of different water masses in the surface and deep layer in both seasons. PCA analysis was conducted in R studio (version 4.3.0).
Spearman correlations were conducted using Origin (version: Origin 2021) to explore the correlations between lipid biomarkers (concentrations and proportions) and environmental variables (water masses, hydrological parameters and nutrients). Correlations were considered to be significant with p value < 0.05.
In spring, temperature ranged between 18.1 ~ 22.0°C and showed higher values in the southern region of our study area (Figure 2A). Salinity (range: 26 ~ 34.6) showed a clear increasing trend from the surface layer in the north to the south (Figure 2B). DO in the surface layer was 4.9 ~ 12.3 mg L-1, and it decreased with depth (Figure 2C). NOx (0.1 ~ 27.6 μmol L-1) showed higher concentrations north of 28.5°N, while DIP (0 ~ 0.5 μmol L-1) and DSi (1.7 ~ 27.4 μmol L-1) showed high concentrations in the deep layer and the whole water column, respectively, at 28 ~ 31°N (Figures 2D–F). The concentration of Chl a (0.1 ~ 18.9 μg L-1) had high values in the surface layer at 29.5°N (Figure 2G).
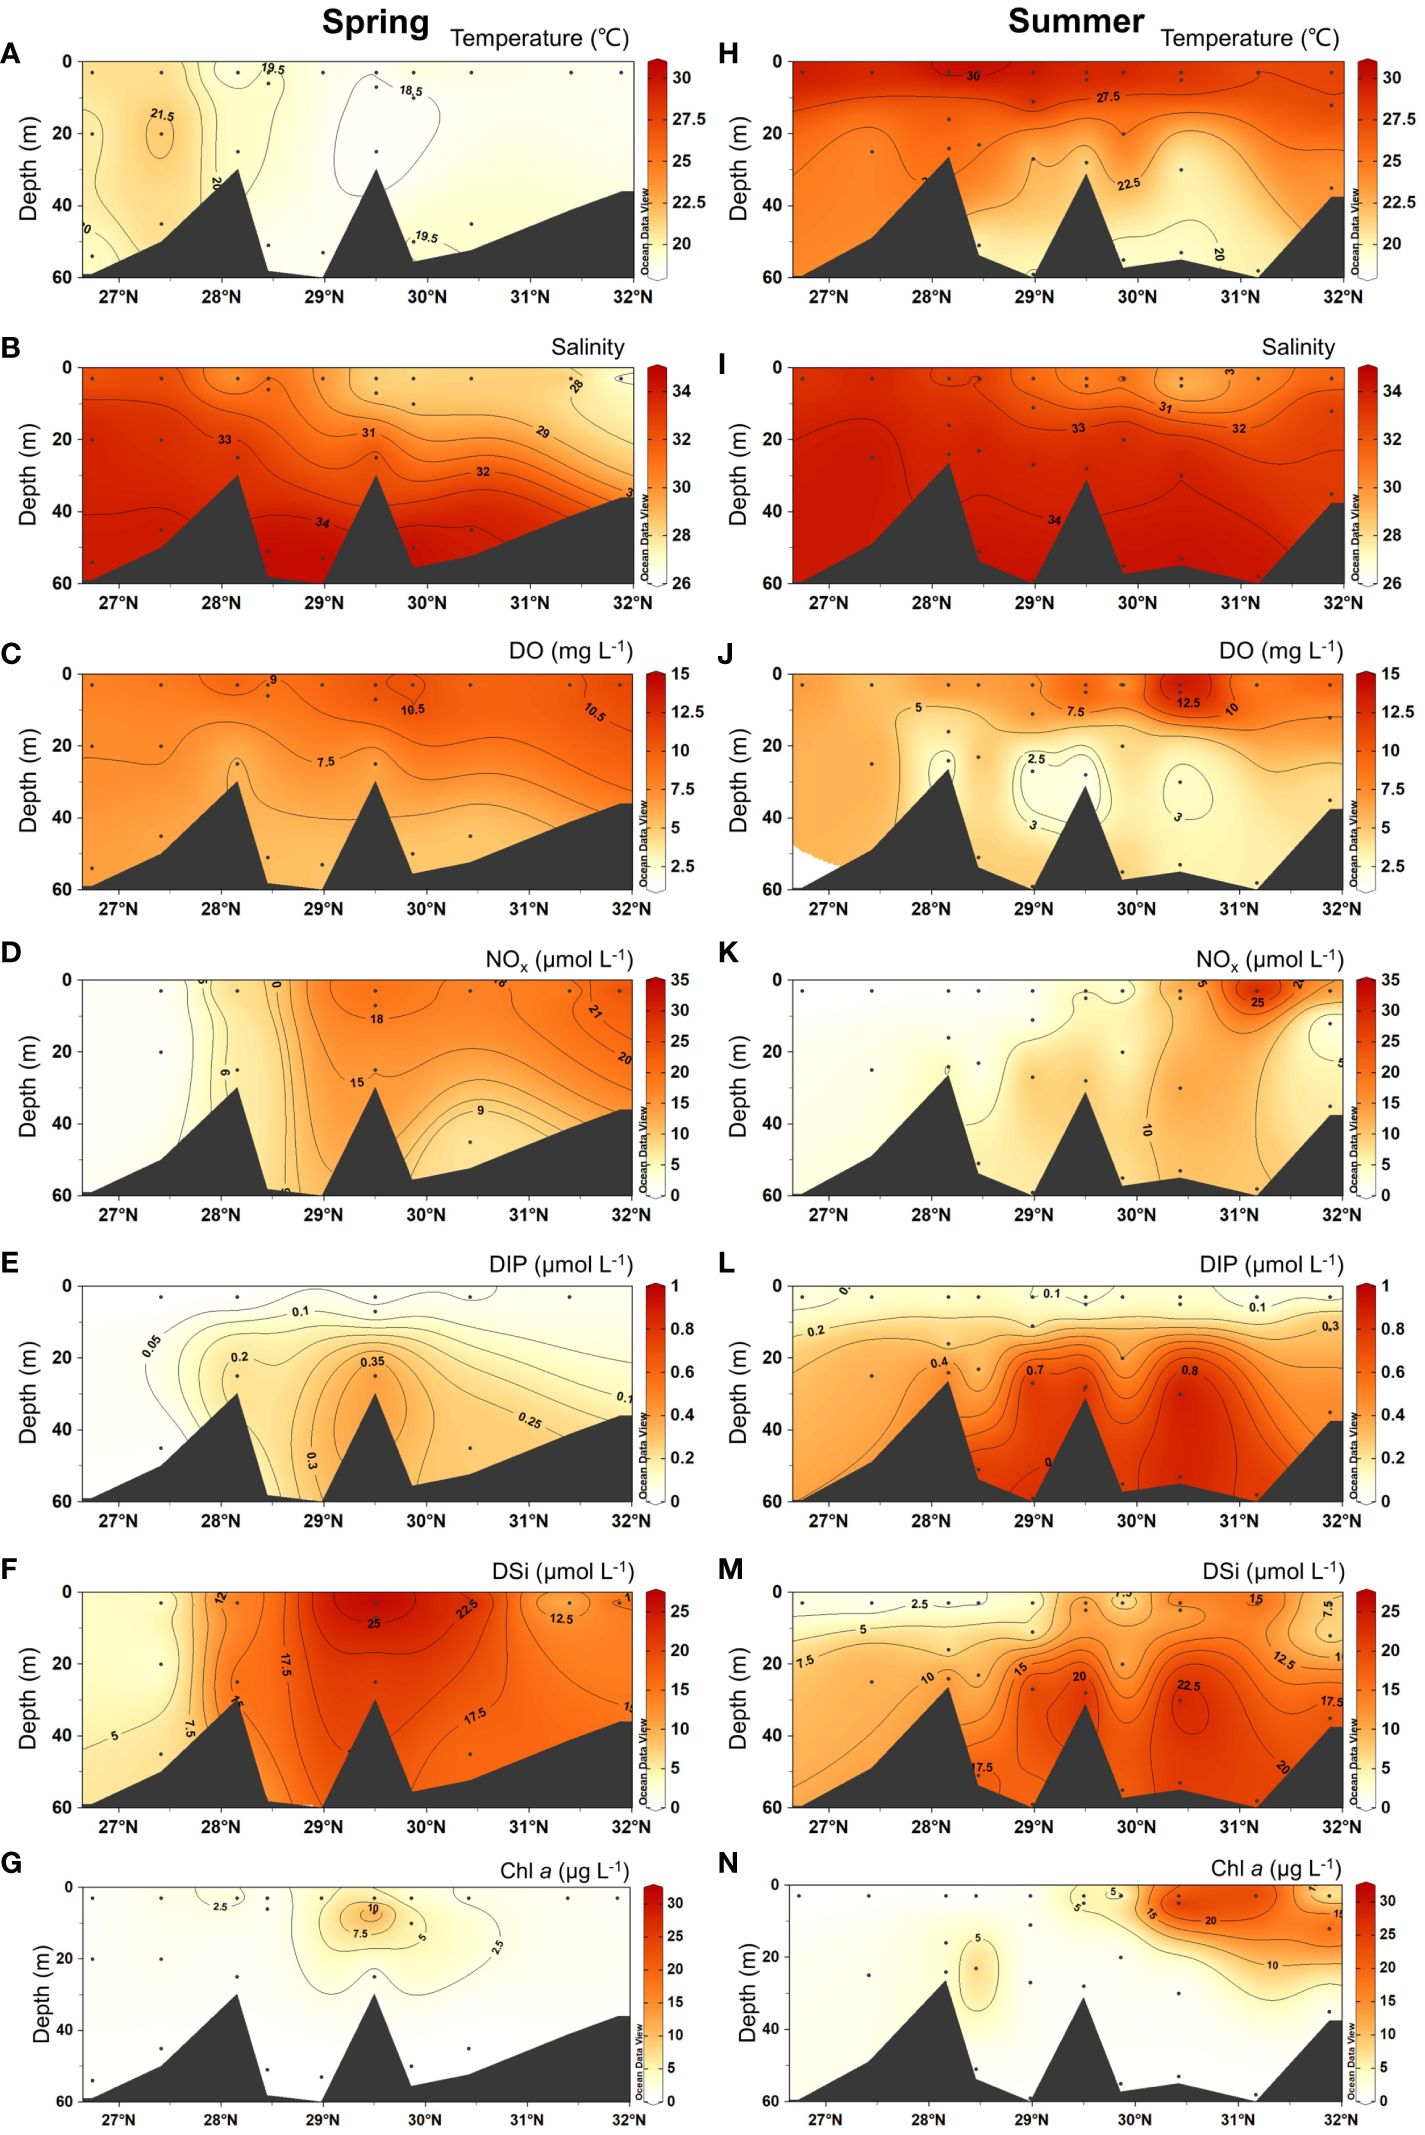
Figure 2 Vertical distributions of temperature (°C), salinity, DO (dissolved oxygen; mg L-1), NOx (NO2–+NO3–, μmol L–1), DIP (dissolved phosphate; μmol L–1), DSi (dissolved silicate; μmol L–1) and Chl a (Chlorophyll a; μg L–1) in spring 2017 (A–G) and summer 2018 (H–N).
In summer, we observed warmer and fresher water in the upper layers (temperature > 27.5°C; salinity < 31), and colder and saltier water in the deep layer (temperature < 22.5°C; salinity > 33) (Figures 2H, I). However, surface salinity in the south also reached 33. Overall, surface DO was higher than 5 mg L-1, with the formation of hypoxia found at the deep layer at 28 ~ 29.5°N (Figure 2J). NOx (0.1 ~ 32.9 μmol L-1) showed the highest concentrations in the surface layer in the north, and it decreased southward (Figure 2K). The concentrations of both DIP (0.1 ~ 1 μmol L-1) and DSi (1.4 ~ 26.5 μmol L-1) showed higher values in the deep layer (Figures 2L, M). The Chl a concentration (0.1 ~ 31.7 μg L-1) showed high values in the surface layer north of 30°N (Figure 2N).
In spring, the CDW (proportion: 0.8 ~ 100%) spread southward from the CRE, with the highest proportions (100%) in the surface layer in the north and the lowest one in the bottom layer (Figure 3A). In contrast, the KSSW (proportion: 0 ~ 98%) had high proportions (up to 98%) in the deep layer across the study region (Figure 3B). The TSW (proportion: 0 ~ 83%) showed high proportions (up to 83%) in the south (Figure 3C). In summer, the CDW (proportion: 0.7 ~ 68%) covered a smaller area compared to that in spring (Figure 3D). In contrast, the TSW (proportion: 1.4 ~ 93%) covered a larger area compared to that in spring (Figure 3F). For the KSSW (proportion: 0 ~ 95%), the distribution of high-proportion area in summer was similar to that in spring and occurred in the deep layer (Figure 3E).
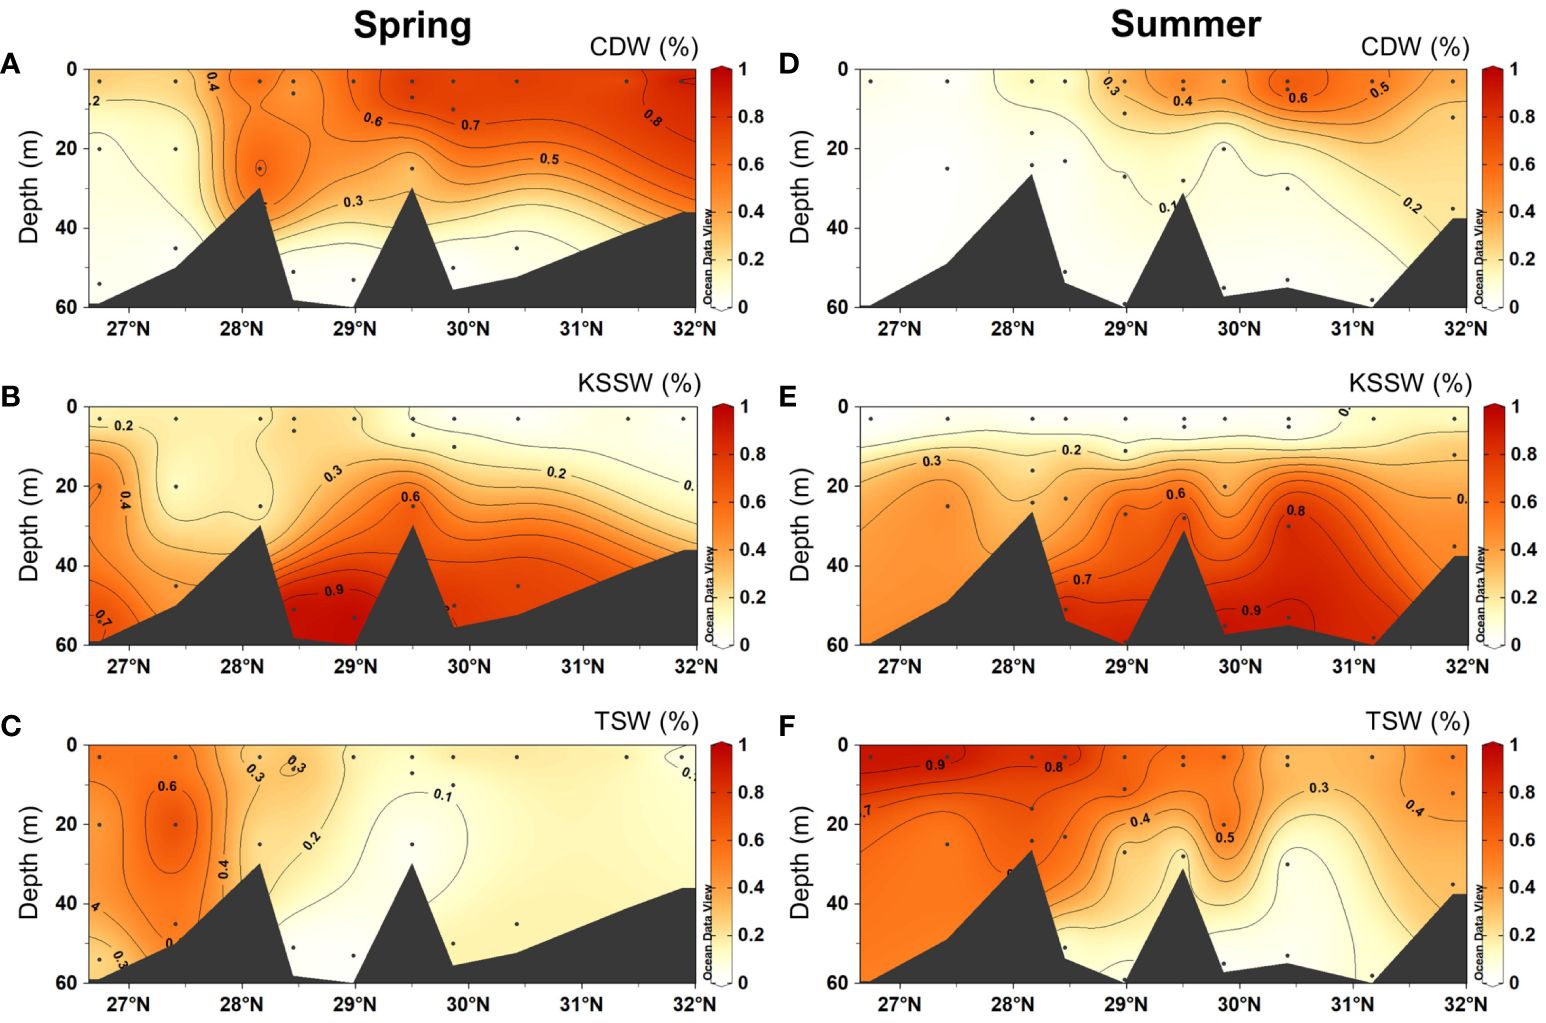
Figure 3 Vertical distributions of the proportions (%) of the three water masses in spring 2017 (A–C) and summer 2018 (D–F). The CDW (Changjiang Diluted Water), the KSSW (Kuroshio Subsurface Water) and the TSW (Taiwan Strait Water) are shown in in (A, D), (B, E) and (C, F), respectively.
The results of cluster analysis show that sampling seasons and layers could be classified into three groups (surface layer in spring, surface layer in summer, and deep layers in spring and summer) at the 70% Bray-Curtis similarity level (Figure 4A). PCA on the contribution of water masses shows a clear separation of the three groups along the first two dimensions (Figure 4B). PC1 and PC2 explained 56.9% and 43.1% of the total variance, respectively. Deep layers clearly separated from surface layers in both seasons along the PC1, and the KSSW explained most of the PC1 pattern (PCA loadings: -0.558 ~ 0.994; Supplementary Table S5). Surface layers in spring and summer separated from each other along the PC2, with the CDW and in the opposite direction the TSW explaining most of the PC2 pattern (PCA loadings: -1.012 ~ 1.202; Supplementary Table S5).
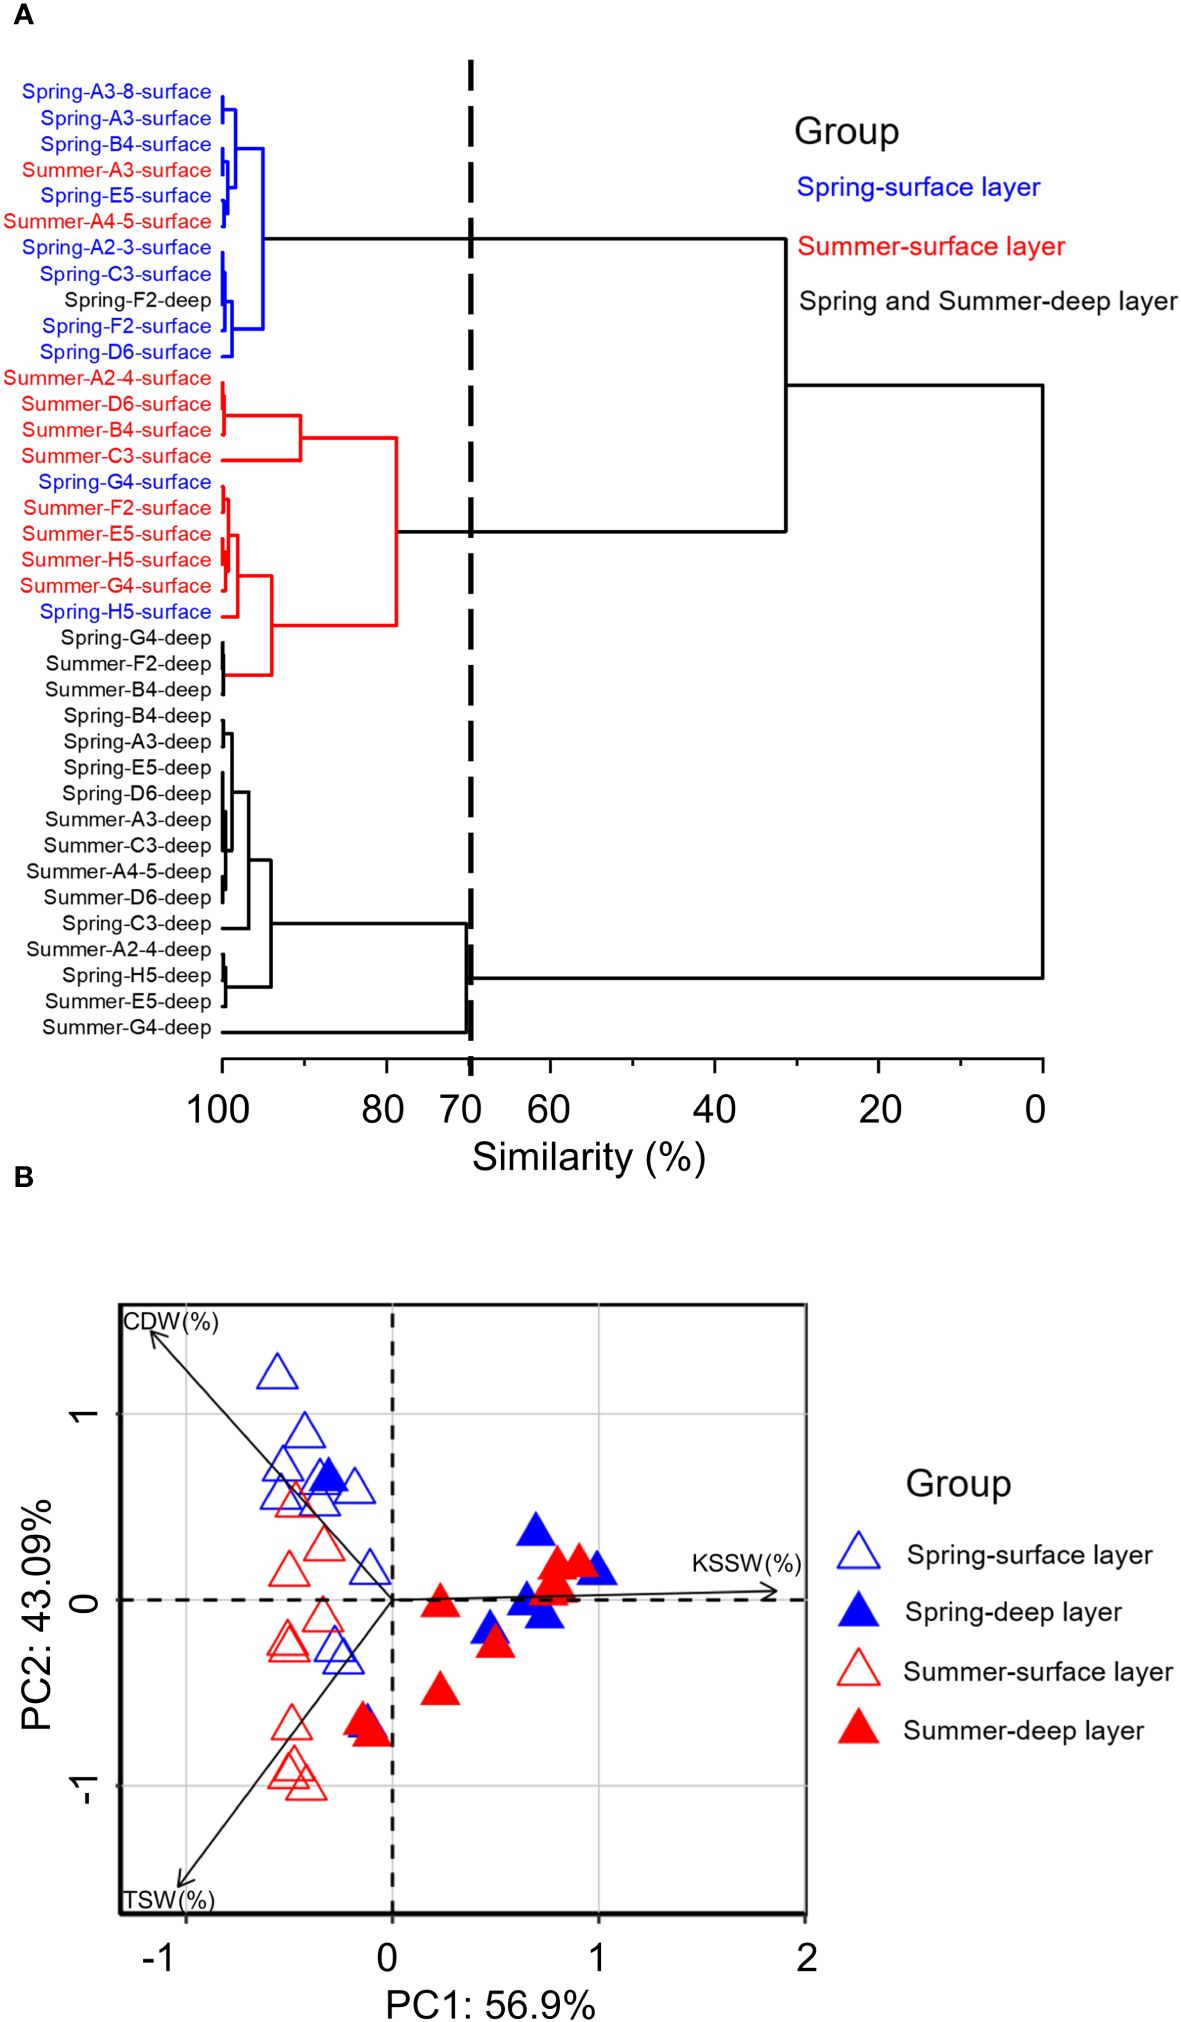
Figure 4 Cluster analysis (A) among the sampling stations and PCA biplot (B) based on the proportions of water masses (CDW, Changjiang Diluted Water; KSSW, Kuroshio Subsurface Water; TSW, Taiwan Strait Water) at each station in the surface and deep layer in spring 2017 and summer 2018.
In spring, total sterol concentrations (ΣPB) ranged from 49 to 1738 ng L−1, showing high values in surface waters in the south (Figure 5A). The proportions of brassicasterol ranged from 50.2% to 98.4%, with high values in the south (> 90%; Figure 5B). In contrast, dinosterol proportions (range: 1.6 ~ 49.8%) were relatively high in the northern region (Figure 5C). The concentrations of TFAs (range: 4.2 ~ 70.7 μg L−1) were higher in surface waters in the south (Figure 6A). The proportions of saturated fatty acids (SFAs) (range: 56.9 ~ 95.8%) showed lower values in surface waters where those of monounsaturated fatty acids (MUFAs) (range: 3.2 ~ 41.1%) were higher (Figures 6B, C). PUFA proportions areas were higher in the north, respectively (Figure 6D). DHA/EPA (range: 0 ~ 1.8) was higher in upper layers in the south (> 1; Figure 6E). The organic carbon-normalized concentrations of both ΣPB (range: 0.03 ~ 2.32 μg mg-1 C-1) and brassicasterol (range: 0.02 ~ 2.26 μg mg-1 C-1) showed high values in surface waters in the south and in the north at around 30.5°N (Supplementary Figures S2B, C), while high carbon-normalized concentrations of dinosterol (range: 0.01 ~ 0.45 μg mg-1 C-1) were only observed in surface waters in the north (Supplementary Figure S2D). The organic carbon-normalized concentrations of TFAs (range: 1.32 ~ 180.98 μg mg-1 C-1), SFAs (range: 1.08 ~ 159.39 μg mg-1 C-1) and PUFAs (range: 0.04 ~ 2.22 μg mg-1 C-1) showed two high-value areas in the south and north, respectively (Supplementary Figures S3A, B, D), while MUFAs (range: 0.11 ~ 19.38 μg mg-1 C-1) had another high-value area at ~29°N (Supplementary Figure S3C). Note that the large ranges of organic carbon-normalized concentrations of lipids were due to the extremely low concentration of lipids at certain stations. For example, at station A2–3 there was the lowest organic carbon-normalized concentrations of ΣPB of (0.03 μg mg-1 C-1), among all stations, resulting in the large range of ΣPB (μg mg-1 C-1) (Supplementary Table S6).
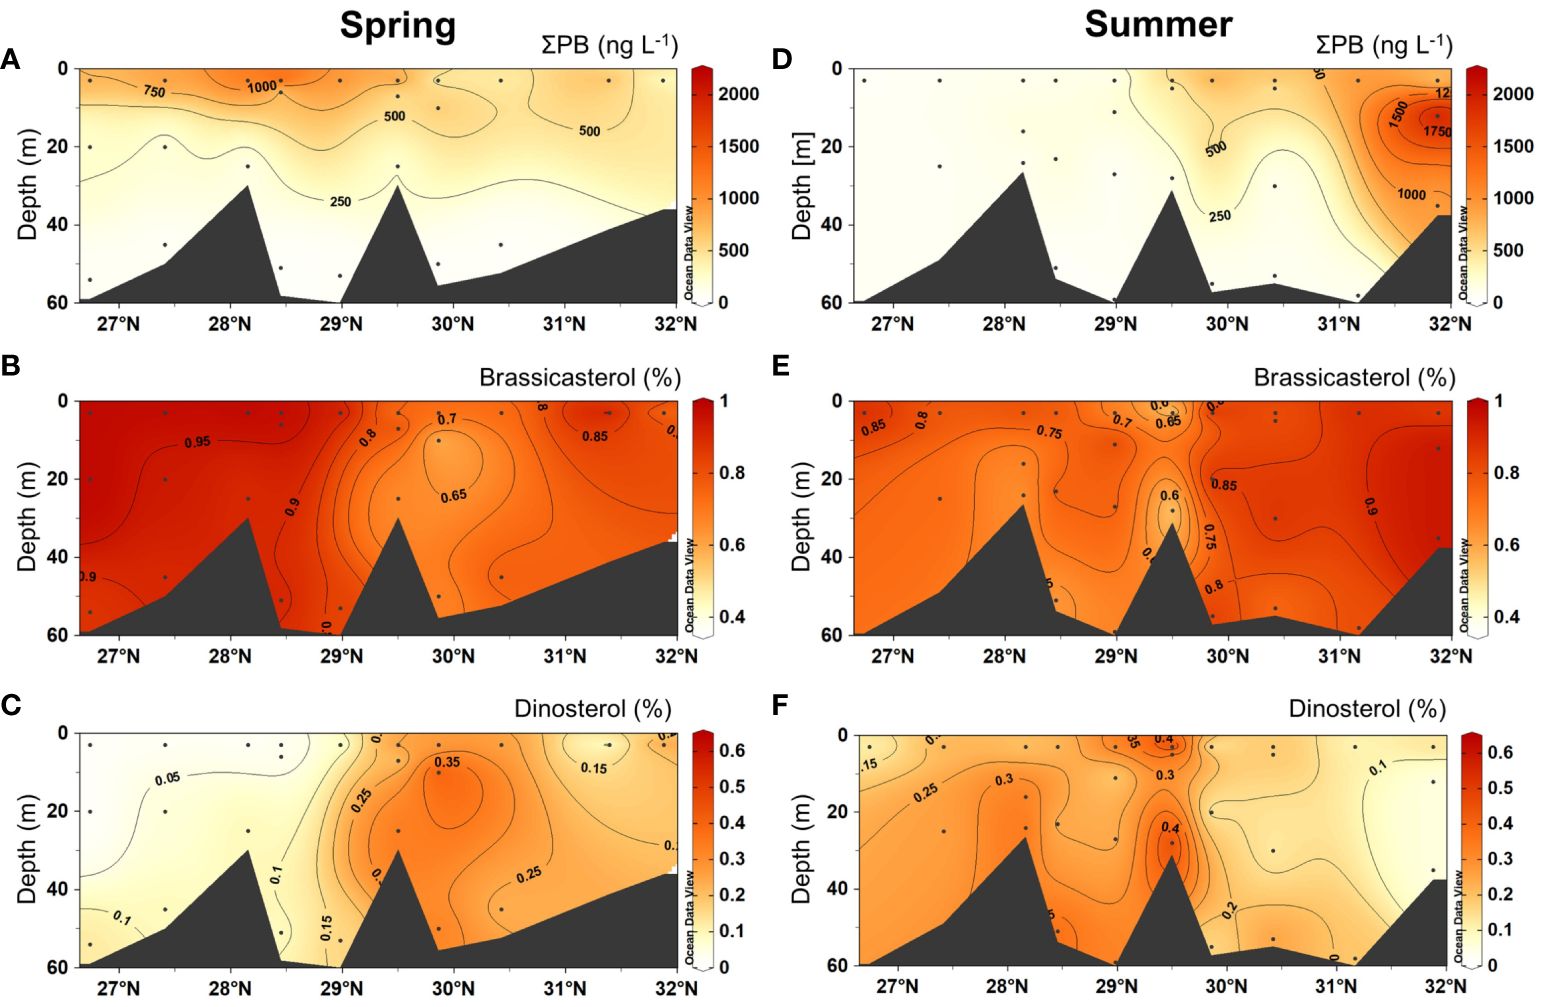
Figure 5 Vertical distributions of total sterol concentrations (ΣPB, the sum of brassicasterol and dinosterol, ng L–1) and the proportions of each sterol in spring 2017 (A–C) and summer 2018 (D–F).
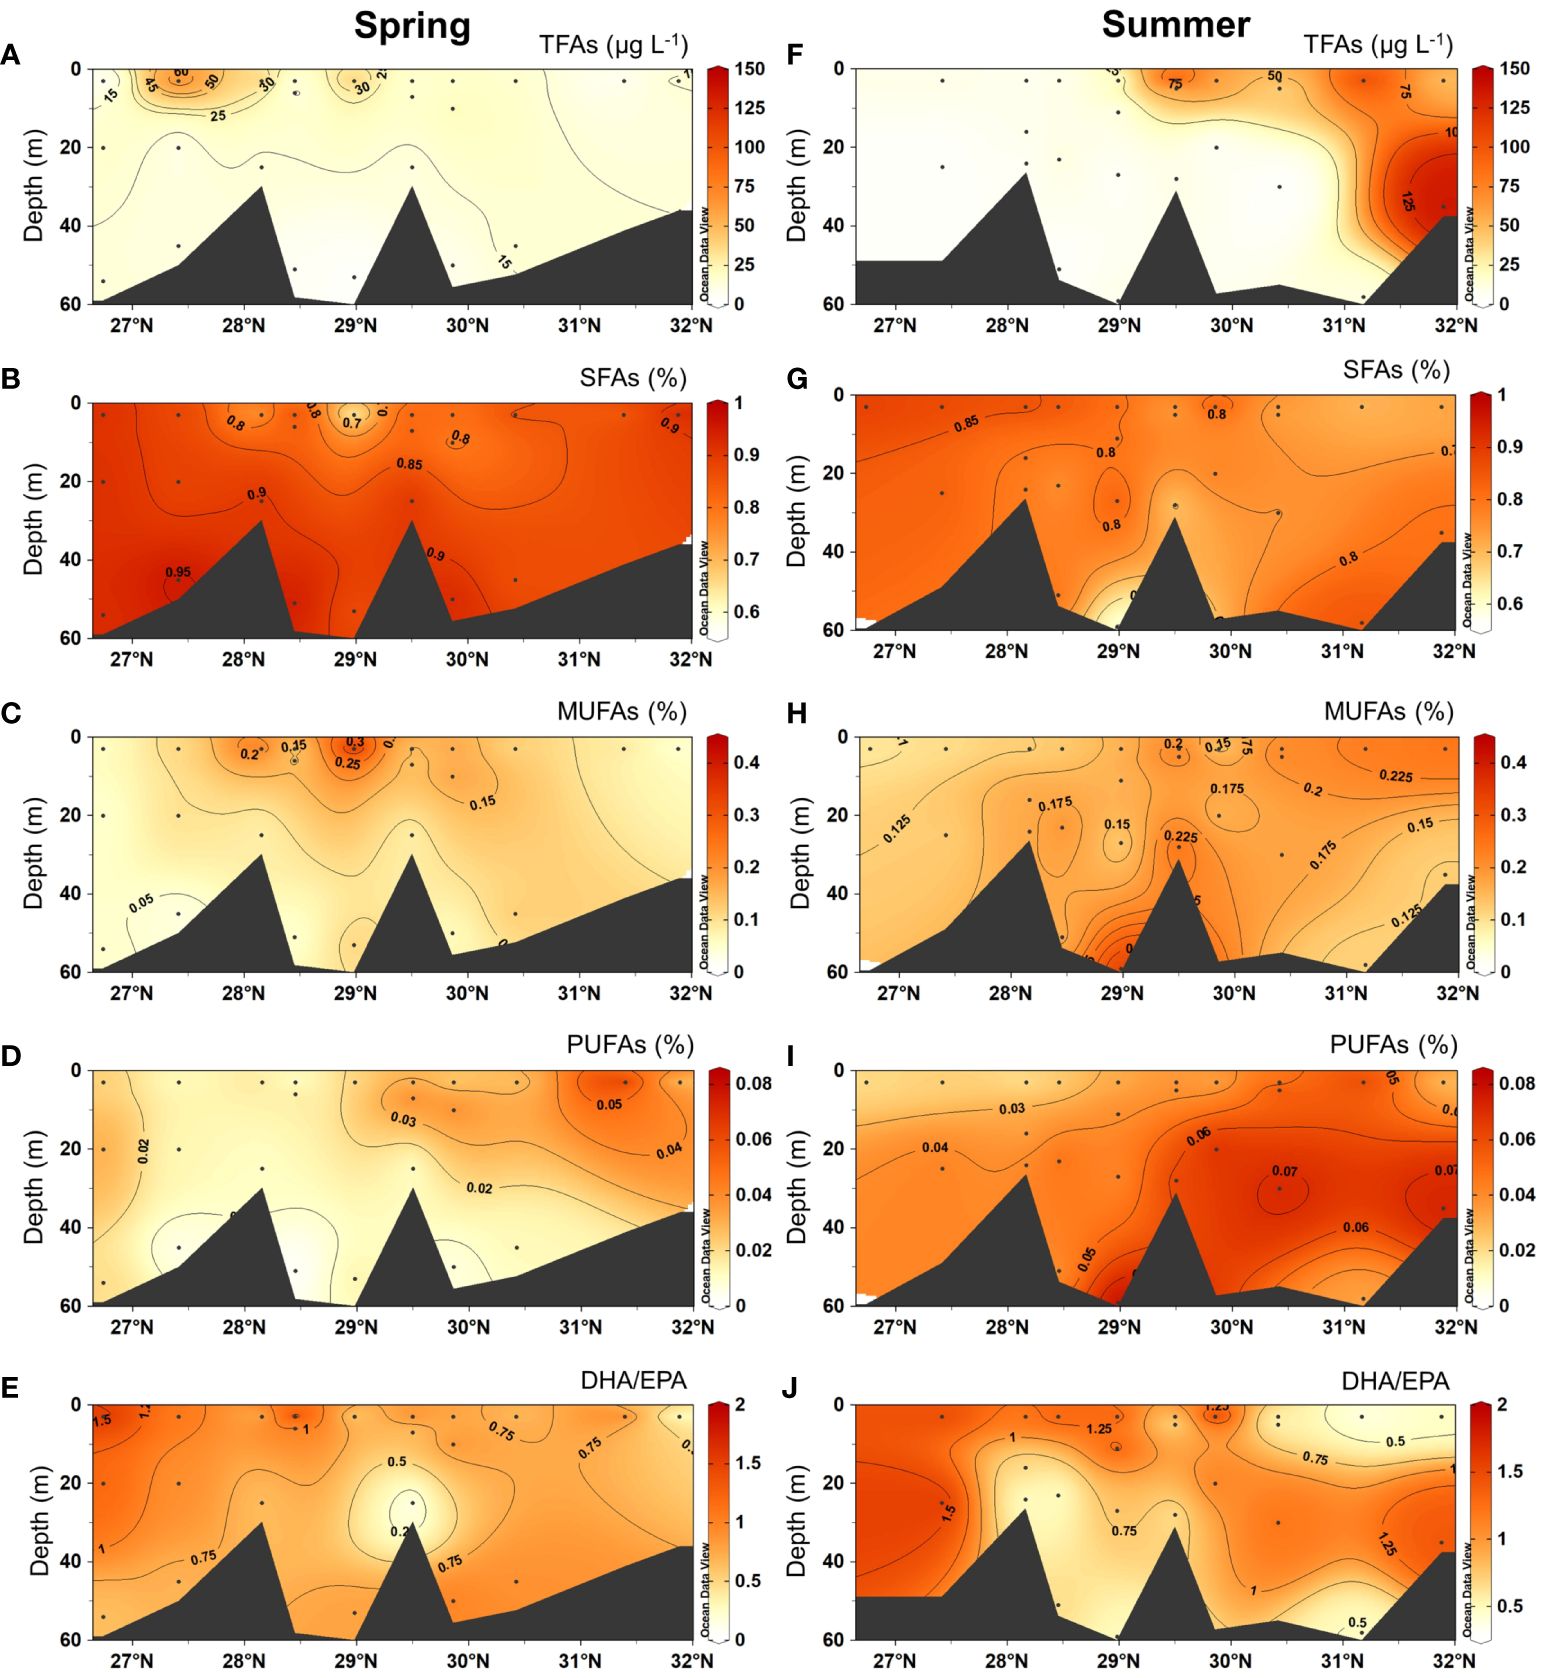
Figure 6 Vertical distributions of the concentrations of total fatty acids (TFAs, μg L–1), the proportions of saturated fatty acids (SFAs), monounsaturated fatty acids (MUFAs) and polyunsaturated fatty acids (PUFAs), and the ratios of DHA to EPA (DHA/EPA; C22:6n-3/C20:5n-3) in spring 2017 (A–E) and summer 2018 (F–J).
In summer, the concentrations of ΣPB (range: 53 ~ 2125 ng L−1) were markedly high in the north (Figure 5D). Brassicasterol proportions (range: 36.6 ~ 97.4%) were higher in the north (> 90%; Figure 5E) and those of dinosterol (range: 2.6 ~ 63.4%) were higher in the south (Figure 5F). Similar to ΣPB, TFA concentrations were also clearly high in the north (Figure 6F). The proportions of SFAs (range: 56.9 ~ 91.2%) were generally higher in the upper layers in the south and deeper layers in the north (Figure 6G). The proportions of MUFAs (range: 6.1 ~ 34.8%) were higher in deep layers at around 29°N and in surface waters in the north (Figure 6H), while PUFAs (range: 1.7 ~ 8.3%) were higher in deep layers across the study region (Figure 6I). DHA/EPA (range: 0.4 ~ 1.9) was higher in upper layers in the south and deep layers in the north (> 1; Figure 6J). For organic carbon-normalized concentrations, ΣPB (range: 0.19 ~ 2.00 μg mg-1 C-1) and brassicasterol (range: 0.08 ~ 1.95 μg mg-1 C-1) had similar distribution patterns, showing the highest values in the surface layer in the north at around 30°N (Supplementary Figures S2E, F), while dinosterol (range: 0.03 ~ 0.36 μg mg-1 C-1) showed high values in the south (Supplementary Figure S2G). The organic carbon-normalized concentrations of all FA groups showed similar distribution patterns, with higher values observed in the middle layer at around 28.5°N and in the surface layer north of 29.5°N (Supplementary Figures S3E–H).
The results of PCA on the proportions of lipid biomarkers show that the deep layer in spring was clearly separated from surface layers in both seasons and the deep layer in summer along the PC1, with PC1 and PC2 explaining 24.8% and 21.1% of the total variance, respectively (Figure 7). The characteristic lipid biomarker profile for the deep layer in spring was high proportions of 16:0 and 18:0 (PCA loadings along the PC1: -2.478 to 1.105; Supplementary Tables S7, S8).
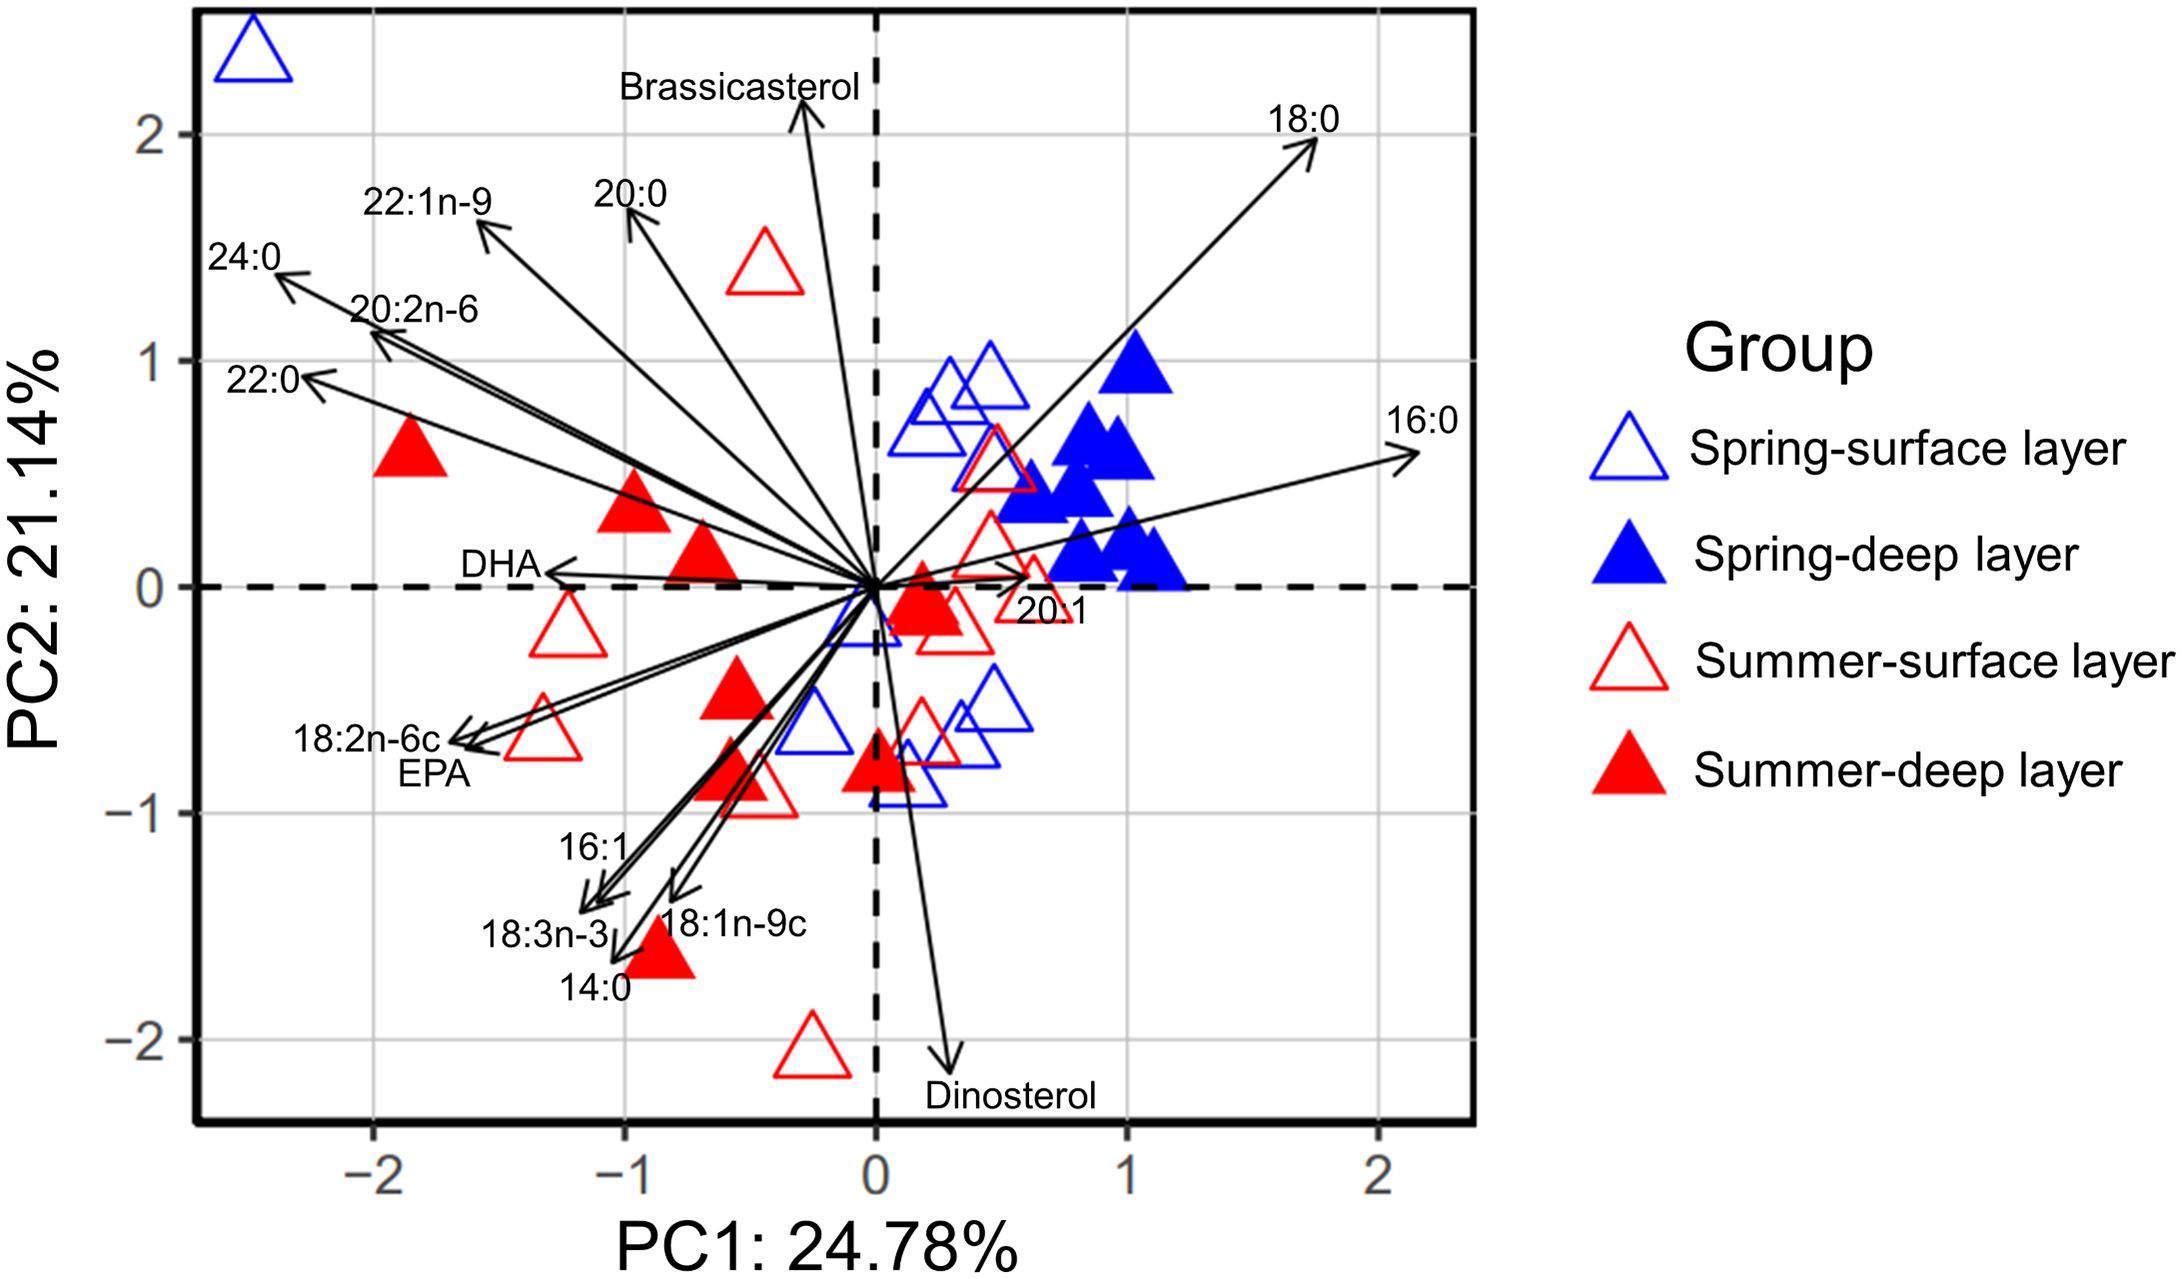
Figure 7 PCA biplot based on the proportions (%) of lipid biomarkers at each station in the surface and deep layer in spring 2017 and summer 2018.
In spring in the surface layer, significant correlations were found between the proportions of brassicasterol (and dinosterol) and most environmental parameters (Figure 8A). Significant positive correlations were also observed between MUFA proportions (and DHA proportions) and N:P, and between DHA/EPA and the TSW (and temperature). DHA/EPA correlated negatively with DO. In spring in the deep layer, most lipid biomarkers showed significant correlations with nutrient parameters (Figure 8B).
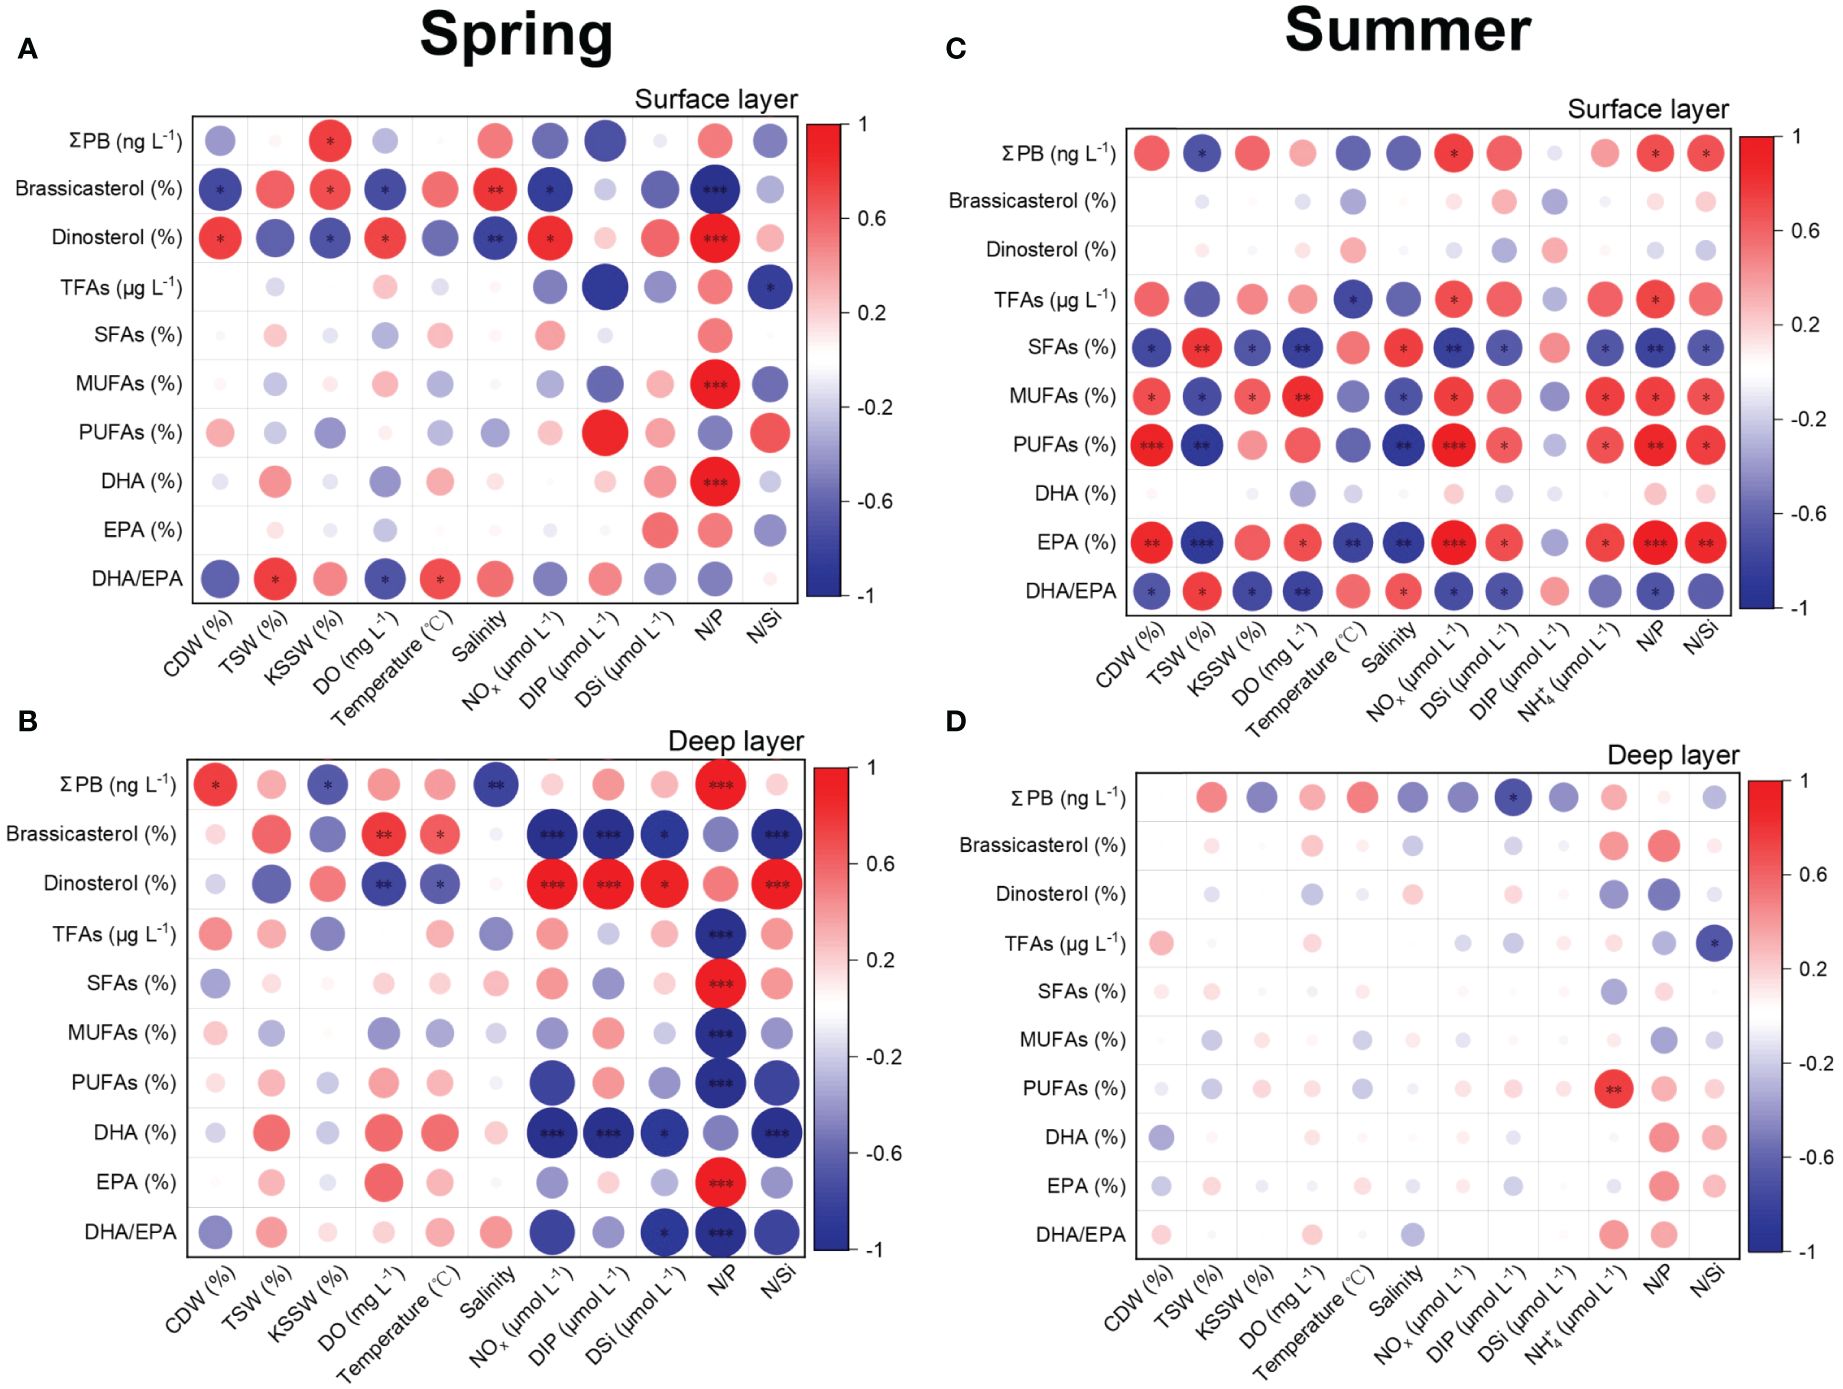
Figure 8 Spearman’s rank correlation coefficients between lipid biomarkers and environmental factors in the surface and deep layer in spring 2017 (A, B) and summer 2018 (C, D). TFAs, total fatty acids; SFAs, saturated fatty acids; MUFAs, monounsaturated fatty acids; PUFAs, polyunsaturated fatty acids; DHA, C22,6n-3; EPA, C20,5n-3; CDW, the Changjiang Diluted Water; TSW, the Taiwan Strait Water; KSSW, the Kuroshio Subsurface Water; DO, dissolved oxygen; NOx, NO2– + NO3–; DIP, dissolved phosphate; DSi, dissolved silicate. Red and blue solid circles refer to positive and negative correlations, respectively. The size and shade of the circles represent correlation coefficients, with a larger size and deeper color referring a higher coefficient. *Significant correlation at p < 0.05; **significant correlation at p ≤ 0.01; ***significant correlation at p ≤ 0.001.
In summer in the surface layer, significant correlations were observed between most lipid biomarkers and environmental factors, except for the proportions of brassicasterol, dinosterol and DHA (Figure 8C). However, in the deep layer significant correlations were only observed between total sterol concentrations and DIP, and between TFA concentrations and N:Si (Figure 8D).
In both seasons, the concentrations of ΣPB and Chl a showed significant positive correlations in the deep layer in spring (r = 0.90; p = 0.0003) and the surface layer in summer (r = 0.76; p = 0.01), while they showed non-significant correlations in the surface layer in spring or the deep layer in summer.
Our study shows that the three primary water masses (the CDW, the TSW and the KSSW) had clear vertical distribution patterns in our study region (Figures 3, 4). Lipid biomarker concentrations and composition also varied throughout the water column (Figure 9; Supplementary Figures S4, S5). As the high-values areas of organic carbon-normalized concentrations were similar between lipid biomarkers (Supplementary Figures S2, S3, S6), our discussion will focus on lipid biomarker proportions. Our results showed that the effects of water masses on lipid biomarker composition varied among different depth and different seasons (Supplementary Figure S4; Supplementary Tables S7, S9). As the presence and combinations of certain lipid biomarkers can be applied as phytoplankton chemotaxonomic biomarkers, the relationship between lipid biomarkers and water masses indicates the regulation of water masses in phytoplankton distribution. The influence of water masses on plankton and fishes has been also observed in the ECS (Bi et al., 2018; Sun et al., 2021; Shin et al., 2022), the Faroe Shelf in the northeast Atlantic (Eliasen et al., 2017), and the western tropical South Atlantic (Giachini Tosetto et al., 2022). These findings suggest that the influence of water masses should be considered in elucidating the mechanisms controlling vertical distribution of phytoplankton and higher trophic levels.
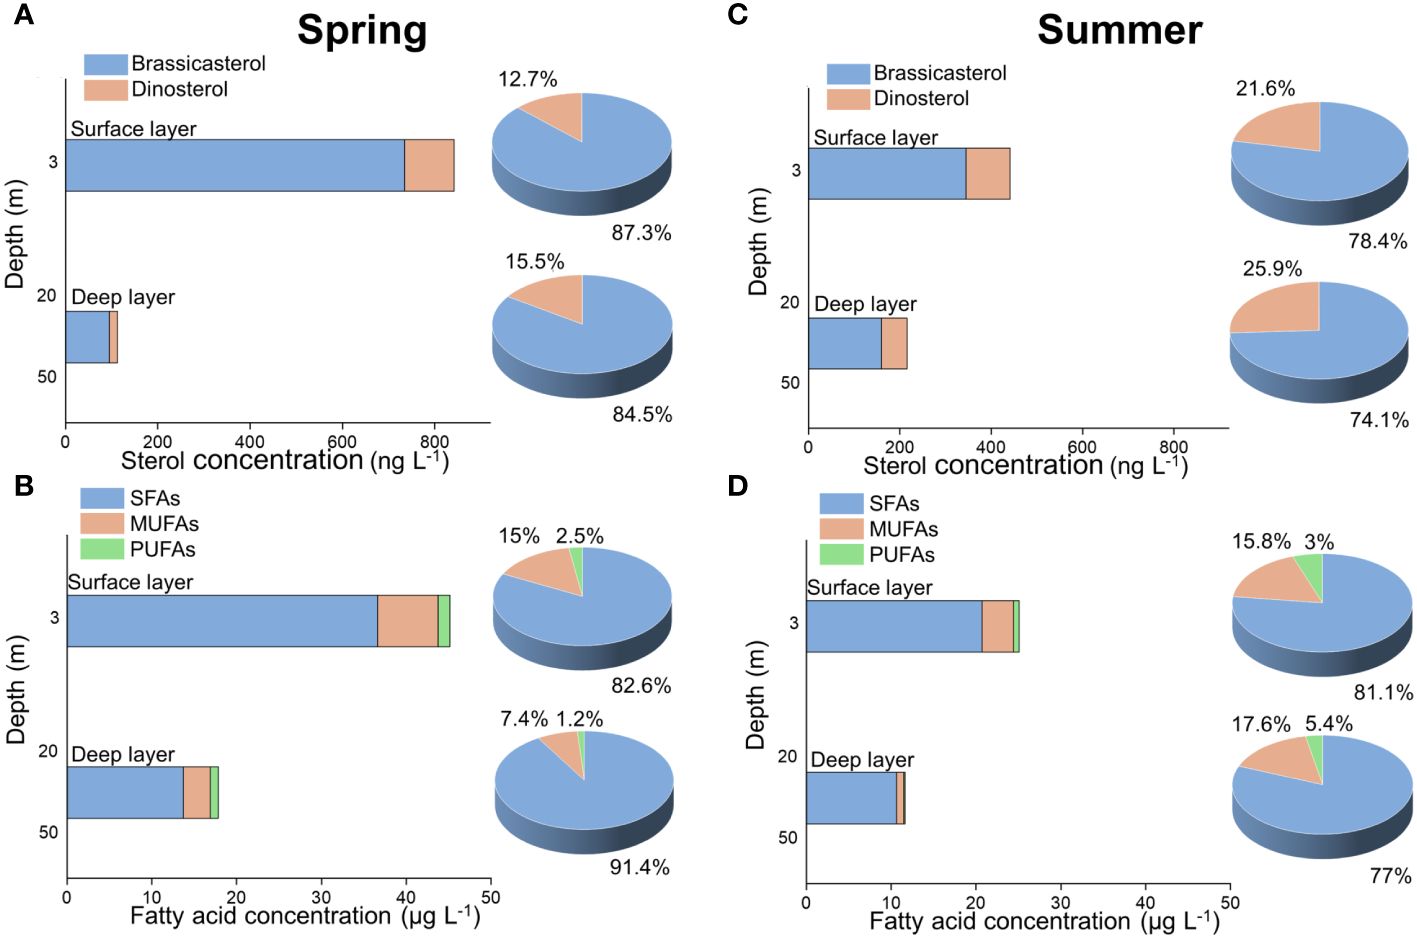
Figure 9 The concentrations and proportions of sterols (A, C) and fatty acids (B, D) in the surface and deep layer in spring 2017 (A, B) and summer 2018 (C, D).
We observed that among the three water masses studied, the CDW and the TSW showed highest contributions in the surface layer in spring and summer, respectively (Figures 3, 4B). Similarly, previous studies also found that water masses varied seasonally in our study region (Che and Zhang, 2018; Zhou et al., 2018; Che et al., 2022). This seasonal variation can be attributed to the changes in wind and riverine discharge. From spring to summer, the southerly winds and riverine discharge become stronger. As a result, the main body of CDW occurred further northeast of the CRE (Qi et al., 2014) and the influence area of TSW became larger in our study region.
Simultaneously, the proportions of lipid biomarkers in the surface layer also varied between spring and summer and showed significant correlations with water masses in certain conditions (Supplementary Figures S4A, C; Figures 8A, C). For example, we observed that the proportions of dinosterol showed significant positive correlation with the CDW in the surface layer during spring (Figure 8A). In contrast, the proportions of brassicasterol showed a significant negative correlation with the CDW in the surface layer during spring (Figure 8A). Previous results of phytoplankton enumerations showed high abundance of dinoflagellates outside the CRE and that of diatoms further seaward in the surface layer in spring (20 April ~ 9 May of 2017, the same period with our cruise) (Guo et al., 2020). Thus, our lipid biomarker results are comparable with that of phytoplankton enumerations, indicating the applicability of brassicasterol and dinosterol as proxies of diatom and dinoflagellate biomass, respectively, in our study region.
For FAs, we observed significant positive correlations between DHA/EPA and TSW proportions in both seasons (Figures 8A, C). While neither DHA nor EPA proportions showed significant correlations with water masses in spring, we found significant negative correlations between EPA and TSW proportions and non-significant correlations between DHA and TSW proportions in summer, which can explain significant positive correlations between DHA/EPA and TSW proportions. A high level of EPA is a characteristic FA pattern in diatoms (Kelly and Scheibling, 2012; Bi et al., 2014; Cao et al., 2023). The TSW is derived from the South China Sea Warm Current Water (Bian et al., 2013) and characterized by low nutrient concentrations (Chen, 1996; Zhang et al., 2019). A recent laboratory study reported significant positive effects of nutrient concentrations on carbon-normalized concentrations of EPA in marine diatom Phaeodactylum tricornutum (Cao et al., 2023). Thus, EPA production in diatoms may reduce in low-nutrient regions where TSW proportions were high, resulting in high DHA/EPA in the surface layer in these regions in summer. It should be noted that as a high ratio of EPA/DHA has been considered as biomarkers for diatom-dominated phytoplankton communities (Kelly and Scheibling, 2012), a positive correlation between the CDW and DHA/EPA should be expected, because the CDW showed significant positive correlations with dinosterol proportions and negative ones with brassicasterol in surface water in spring (Figure 8A). However, the opposite was observed in surface water of both seasons (non-significant negative correlations in spring, and significant negative correlations in summer) (Figures 8A, C). As discussed above, the distribution of DHA/EPA correlated significantly with TSW proportions surface water in both seasons (Figures 8A, C). Thus, the effects of multiple water masses should be considered in explaining the distribution of lipid biomarkers.
We observed clearly different FA composition between spring and summer in the deep layer, with the spring samples characterized by high proportions of 16:0 and 18:0, and the summer samples characterized by high proportions of PUFAs such as EPA and DHA (Figure 7). The proportions of SFAs decreased from 86 ~ 95% in spring to 64 ~ 85% in summer, while the proportions of MUFAs and PUFAs in increased from 5 ~ 13% in spring to 15 ~ 36% in summer (Supplementary Figures S5B, D). Connelly et al. (2016) also observed seasonal patterns of FA proportions in the Beaufort Sea shelf, showing higher proportions of 18:0 in winter/spring and deeper water samples, and higher EPA proportions in summer and autumn. High proportions of SFAs typify detrital and degrading materials, indicating poor quality of particulate organic matters (Leu et al., 2006; Connelly et al., 2016). However, high proportions of PUFAs are essential for many animals and maintain their high food conversion efficiency, growth and reproduction (Brett and Müller-Navarra, 1997; McLaskey et al., 2022). Indeed, it has been reported that zooplankton abundance in summer was higher than that in spring during the 1960s ~ 2020 in the CRE and adjacent areas (Du et al., 2022). More recently, Wang et al. (2023) observed significant positive correlations between the abundance of dominant zooplankton species and Chl a concentrations in the summer of 2019 in the CRE and adjacent areas, suggesting that high food availability and favorable environment supported high abundance of zooplankton. Our results show that the mean PUFA concentrations were clearly higher in summer (4.66 μg L-1) than that in spring (0.34 μg L-1) in the north of our study region, i.e., adjacent areas of the CRE (stations A2–3 and A3–8 in spring, and stations A2–4 and A4–5 in summer; Supplementary Figures S7B, D), indicating that higher nutritional quality of food may also play important roles in supporting higher zooplankton abundance in summer than in spring in the north of our study region.
Overall, we found that lipid biomarker concentrations (ng L-1) in the surface layer were around 2 ~ 7 times higher than those in the deep layer, with the largest difference between the surface and deep layers observed for sterol concentrations in spring (Figure 9A). Similar results were reported in the South East Pacific, showing that the concentrations of the sum of 24-methylcholesta-5,24(28)dien-3β-ol and dinosterol decreased with depth at most stations (Tolosa et al., 2008). Also in the northern Sargasso Sea off Bermuda, higher sterol concentrations (carbon-normalized) were observed in the surface layer within the depth < 100 m during April and November 2015 (Pedrosa-Pamies et al., 2018). These depth profiles of phytoplankton-derived lipids within the epipelagic layer clearly reflected vertical variation in phytoplankton abundance (Pedrosa-Pamies et al., 2018). In our study, high concentrations of lipid biomarkers in suspended particles in the surface layer are consistent with previous observations in phytoplankton abundance, which was generally higher in the surface layer than the deep layer (Jiang et al., 2015; Guo et al., 2020). Our study thus provides the first evidence for the applicability of lipid biomarkers as proxies of vertical variations in phytoplankton abundance in highly dynamic coastal regions.
Moreover, DHA/EPA in the surface layer was overall higher than that in the deep layer, especially in the southern part of our study region, in both seasons (Figures 6E, J; Supplementary Figure S8). As mentioned above, significant correlations between DHA/EPA (and EPA proportions) between TSW proportions suggest the important roles of TSW in regulating the production of EPA in diatoms, i.e. high temperature at the high TSW-proportion regions resulting in low production of EPA in diatoms (Figures 8A, C). Also, we found high total sterol concentrations (ΣPB) in the surface layer in the southern region, indicating high phytoplankton biomass (Figure 5A). Both food quantity and quality regulate zooplankton nutrition and thus the trophic interaction across the phytoplankton-zooplankton interface (Sterner and Schulz, 1998; Boersma and Kreutzer, 2002; Bi and Sommer, 2020). In our study, high food quantity (as revealed by total sterol concentrations) and quality (as revealed by DHA/EPA) in the surface layer in the southern region were in agreement with the significantly higher microzooplankton grazing rates in the surface water than in the deep water in summer in the ECS (Zheng et al., 2015). For fishes at high trophic levels, it has been observed that mixed-shore and northern-offshore assemblages of fish larvae are present in the southern and northern parts of our study region, respectively (Lin et al., 2016). This distribution pattern of fish larvae may be influenced by the adult fishes, currents and feeding behavior of the larvae (Lin et al., 2016). The consistent distributions between lipid biomarkers in our study and zooplankton grazing/fish larvae in previous work highlight the important roles of nutritional quality of phytoplankton in regulating trophic dynamics in coastal food webs.
In summary, our results show that the effect of water mass on lipid biomarkers varied with conditions, i.e., between different depths and between different seasons. For example, in both seasons the correlations between the KSSW proportions and ΣPB concentrations were positive in the surface layer and negative in the deep layer (Figure 8). This depth-dependent effect of water masses was associated with differential proportions of KSSW between depths, i.e., lower proportions in the surface layer (mixing with the CDW and TSW) and higher ones in the deep layer. The above results suggest that the increase in the KSSW would enhance ΣPB in the surface layer but not in the deep layer. Moreover, the seasonal dependence of water mass effects was also observed, e.g., significant negative correlations between TSW and PUFA proportions in summer but not in spring (Figure 8). This seasonal pattern may be related to the increasing proportion of TSW from spring to summer, with high proportions of TSW occurred only in the southern region (stations G4 and H5) in spring and throughout the study region in summer (Figure 3). In addition, laboratory experiments showed that characteristic FA profiles of phytoplankton classes underlie fluctuations according to culture conditions (Bi et al., 2014; Cao et al., 2023). Environmental changes can alter the production of lipid biomarkers, e.g., up to ca. 103% increase observed in carbon-normalized concentrations of EPA in the diatom P. tricornutum under high nutrient conditions (Cao et al., 2023). Thus, the variations in water mass distribution and proportions, as well as associated environmental drivers (e.g., nutrient concentrations), should be systematically considered when applying lipids as proxies of phytoplankton community, particularly in highly dynamic coastal regions.
This study first illustrates the vertical distribution of lipid biomarkers and its correlations with water masses in spring and summer in the Zhejiang coast of the ECS. The three major water masses, CDW, TSW and KSSW, showed a clear vertical profiles and seasonal variations, strongly contributing to the surface layer in spring, the surface layer in summer, and the deep layer in both seasons, respectively. Accordingly, the distribution patterns and composition of lipid biomarkers were also depth dependent and varied between spring and summer. Specifically, the deep layer in spring was characterized by high proportions of 16:0 and 18:0, and the surface layer in spring and the two layers in summer were characterized by high proportions of PUFAs such as EPA and DHA. Overall, the concentrations (ng L-1) of lipid biomarkers were 2 ~ 7 times higher in the surface layer than in the deep layer. The nutritional quality indicator DHA/EPA was also higher in the surface layer than in the deep layer in both seasons. These distribution patterns of lipid biomarker concentrations and composition are consistent with those of zooplankton grazing and fish larvae in previous work, revealing the important roles of lipid biomarkers in energy flow of food webs and the applicability of lipid biomarkers as proxies for marine ecosystem changes.
The raw data supporting the conclusions of this article will be made available by the authors, without undue reservation.
JG: Formal Analysis, Validation, Writing – original draft, Data curation, Investigation, Visualization. SX: Data curation, Formal Analysis, Investigation, Validation, Visualization, Writing – original draft. RB: Formal Analysis, Validation, Writing – original draft, Conceptualization, Funding acquisition, Methodology, Resources, Supervision. YW: Investigation, Resources, Writing – review & editing. YD: Formal Analysis, Methodology, Writing – review & editing. HC: Resources, Writing – review & editing. JZ: Resources, Writing – review & editing. PY: Resources, Writing – review & editing. JS: Methodology, Resources, Writing – review & editing. MZ: Conceptualization, Methodology, Resources, Supervision, Validation, Writing – review & editing.
The author(s) declare that financial support was received for the research, authorship, and/or publication of this article. This study was supported by Laoshan Laboratory (grant number LSKJ202204005).
We thank Hailong Zhang, Li Li, and Gui’e Jin for technical assistance. We also thank Xinyan Mao and Peng Peng for beneficial discussion. We thank the captains, the crew members along with the scientific staff on the cruises MZ17SP, MZ18SU and NORC2017–03 for help with on-board samplings. We sincerely appreciate instructive comments from the two reviewers. Data and samples were collected onboard of R/V “Runjiang1” and R/V “yanping 2” implementing the open research cruises NORC2017–03 and NORC2018–04 supported by NSFC Shiptime Sharing Projects (No. 41649903 and 41749904), respectively.
The authors declare that the research was conducted in the absence of any commercial or financial relationships that could be construed as a potential conflict of interest.
All claims expressed in this article are solely those of the authors and do not necessarily represent those of their affiliated organizations, or those of the publisher, the editors and the reviewers. Any product that may be evaluated in this article, or claim that may be made by its manufacturer, is not guaranteed or endorsed by the publisher.
The Supplementary Material for this article can be found online at: https://www.frontiersin.org/articles/10.3389/fmars.2024.1384334/full#supplementary-material
Bai M.-L., Lin F.-S., Lee Y.-C., Gong G.-C., Hsieh C.-h. (2015). Trophic structure of the pelagic food web in the East China Sea. Zool. Stud. 54, 7. doi: 10.1186/s40555-014-0089-0
Bi R., Arndt C., Sommer U. (2014). Linking elements to biochemicals: effects of nutrient supply ratios and growth rates on fatty acid composition of phytoplankton species. J. Phycol. 50, 117–130. doi: 10.1111/jpy.12140
Bi R., Chen X., Zhang J., Ishizaka J., Zhuang Y., Jin H., et al. (2018). Water mass control on phytoplankton spatiotemporal variations in the northeastern East China Sea and the western Tsushima Strait revealed by lipid biomarkers. J. Geophys. Res.-Biogeo. 123, 1318–1332. doi: 10.1002/2017JG004340
Bi R., Sommer U. (2020). Food quantity and quality interactions at phytoplankton–zooplankton interface: chemical and reproductive responses in a calanoid copepod. Front. Mar. Sci. 7. doi: 10.3389/fmars.2020.00274
Bian C., Jiang W., Greatbatch R. J. (2013). An exploratory model study of sediment transport sources and deposits in the Bohai Sea, Yellow Sea, and East China Sea. J. Geophys. Res.-Oceans 118, 5908–5923. doi: 10.1002/2013JC009116
Boersma M., Kreutzer C. (2002). Life at the edge: is food quality really of minor importance at low quantities? Ecology 83, 2552–2561. doi: 10.1890/0012–9658(2002)083[2552:LATEIF]2.0.CO;2
Bosch C., Andersson A., Kruså M., Bandh C., Hovorková I., Klánová J., et al. (2015). Source apportionment of polycyclic aromatic hydrocarbons in central European soils with compound-specific triple isotopes (δ13C, Δ14C, and δ2H). Environ. Sci. Technol. 49, 7657–7665. doi: 10.1021/acs.est.5b01190
Brett M., Müller-Navarra D. C. (1997). The role of highly unsaturated fatty acids in aquatic foodweb processes. Freshw. Biol. 38, 483–499. doi: 10.1046/j.1365-2427.1997.00220.x
Cao Y., Bi R., Wang X., Chen X., Hu J., Wang Y., et al. (2022). The sources and burial of marine organic carbon in the eastern China Marginal Seas. Front. Mar. Sci. 9. doi: 10.3389/fmars.2022.824181
Cao Z., Bi R., Zhang C., Cui J., Li L., Ding Y., et al. (2023). Quantification of multiple environmental controls on lipid biomarkers in common marine diatoms and dinoflagellates. Mar. Biol. 170, 136. doi: 10.1007/s00227-023-04284-3
Che H., Zhang J. (2018). Water mass analysis and end-member mixing contribution using coupled radiogenic nd isotopes and nd concentrations: interaction between marginal seas and the Northwestern Pacific. Geophys. Res. Lett. 45, 2388–2395. doi: 10.1002/2017GL076978
Che H., Zhang J., Liu Q., Zhao M. (2022). A driving factor for harmful algal blooms in the East China Sea coastal marine ecosystems — Implications of Kuroshio subsurface water invasion. Mar. pollut. Bull. 181, 113871. doi: 10.1016/j.marpolbul.2022.113871
Chen C. T. A. (1996). The Kuroshio intermediate water is the major source of nutrients on the East China Sea continental shelf. Oceanol. Acta 19, 523–527. doi: 10.1016/S0399-1784(99)80027-9
Chen C.-T. A., Bai Y., Huang T.-H., He X., Chen H.-W., Yu S. (2021). Southward spreading of the Changjiang Diluted Water in the La Nina spring of 2008. Sci. Rep.- UK 11, 307. doi: 10.1038/s41598–020-79634-y
Connelly T. L., Businski T. N., Deibel D., Parrish C. C., Trela P. (2016). Annual cycle and spatial trends in fatty acid composition of suspended particulate organic matter across the Beaufort Sea shelf. Estuar. Coast. Shelf Sci. 181, 170–181. doi: 10.1016/j.ecss.2016.08.016
Copeman L. A., Laurel B. J. (2010). Experimental evidence of fatty acid limited growth and survival in Pacific cod larvae. Mar. Ecol. Prog. Ser. 412, 259–272. doi: 10.3354/meps08661
Dai M., Zhao Y., Chai F., Chen M., Chen N., Chen Y., et al. (2023). Persistent eutrophication and hypoxia in the coastal ocean. Cambridge Prisms: Coast. Futures 1, e19. doi: 10.1017/cft.2023.7
Dalsgaard J., St. John M., Kattner G., Müller-Navarra D., Hagen W. (2003). Fatty acid trophic markers in the pelagic marine environment. Adv. Mar. Biol. 46, 225–340. doi: 10.1016/S0065-2881(03)46005-7
Du P., Ye W. J., Deng B. P., Mao M., Zhu Y. L., Cheng F. P., et al. (2022). Long-term changes in zooplankton in the Changjiang estuary from the 1960s to 2020. Front. Mar. Sci. 9. doi: 10.3389/fmars.2022.961591
Eliasen S. K., Hatun H., Larsen K. M. H., Hansen B., Rasmussen T. A. S. (2017). Phenologically distinct phytoplankton regions on the Faroe Shelf-identified by satellite data, in-situ observations and model. J. Mar. Syst. 169, 99–110. doi: 10.1016/j.jmarsys.2017.01.015
Galy V., Eglinton T., France-Lanord C., Sylya S. (2011). The provenance of vegetation and environmental signatures encoded in vascular plant biomarkers carried by the Ganges-Brahmaputra rivers. Earth Planet. Sci. Lett. 304, 1–12. doi: 10.1016/j.epsl.2011.02.003
Giachini Tosetto E., Bertrand A., Neumann-Leitão S., Costa da Silva A., Nogueira Júnior M. (2022). Planktonic cnidarian responses to contrasting thermohaline and circulation seasonal scenarios in a tropical western boundary current system. Ocean Sci. 18, 1763–1779. doi: 10.5194/os-18-1763-2022
Guo S., Yao Q., Wei C., Sun X. (2020). Phytoplankton community structure in the southern Yellow Sea and East China Sea and its relationship with environmental factors (in Chinese with English abstract). Adv. Mar. Sci. 38, 476–492. doi: 10.3969/j.issn.1671-6647.2020.03.010
Jiang Z., Chen J., Zhou F., Shou L., Chen Q., Tao B., et al. (2015). Controlling factors of summer phytoplankton community in the Changjiang (Yangtze River) Estuary and adjacent East China Sea shelf. Cont. Shelf Res. 101, 71–84. doi: 10.1016/j.csr.2015.04.009
Kelly J. R., Scheibling R. E. (2012). Fatty acids as dietary tracers in benthic food webs. Mar. Ecol. Prog. Ser. 446, 1–22. doi: 10.3354/meps09559
Leu E., Falk-Petersen S., Kwaśniewski S., Wulff A., Edvardsen K., Hessen D. O. (2006). Fatty acid dynamics during the spring bloom in a High Arctic fjord: importance of abiotic factors versus community changes. Can. J. Fish. Aquat. Sci. 63, 2760–2779. doi: 10.1139/f06-159
Li Z., Zhang Y., Song S., Li C. (2023). Impacts of algal blooms on sinking carbon flux and hypoxia off the Changjiang River estuary. J. Oceanol. Limnol. 41, 2180–2196. doi: 10.1007/s00343-022-2278-8
Lin H.-Y., Chiu M.-Y., Shih Y.-M., Chen I.-S., Lee M.-A., Shao K.-T. (2016). Species composition and assemblages of ichthyoplankton during summer in the East China Sea. Cont. Shelf Res. 126, 64–78. doi: 10.1016/j.csr.2016.07.016
Liu X., Xiao W., Landry M. R., Chiang K.-P., Wang L., Huang B. (2016). Responses of phytoplankton communities to environmental variability in the East China Sea. Ecosystems 19, 832–849. doi: 10.1007/s10021-016-9970-5
Lotze H. K., Lenihan H. S., Bourque B. J., Bradbury R. H., Cooke R. G., Kay M. C., et al. (2006). Depletion, degradation, and recovery potential of estuaries and coastal seas. Science 312, 1806–1809. doi: 10.1126/science.1128035
Luo Y., Shi J., Guo X., Mao X., Yao P., Zhao B., et al. (2023). Yearly variations in nutrient supply in the east China sea due to the Zhejiang coastal upwelling and kuroshio intrusion. J. Geophys. Res.-Oceans 128 (4), 18. doi: 10.1029/2022JC019216
Mayzaud P., Boutoute M., Gasparini S., Mousseau L. (2014). Lipids and fatty acid composition of particulate matter in the North Atlantic: importance of spatial heterogeneity, season and community structure. Mar. Biol. 161, 1951–1971. doi: 10.1007/s00227-014-2476-9
McLaskey A. K., Forster I., Belluz J. D., Hunt B. P. V. (2022). A high-resolution time series of particulate matter fatty acids reveals temporal dynamics of the composition and quality available to zooplankton in a temperate coastal ocean. Prog. Oceanogr. 206, 1–19. doi: 10.1016/j.pocean.2022.102843
McLaskey A. K., Forster I., Hunt B. P. V. (2024). Distinct trophic ecologies of zooplankton size classes are maintained throughout the seasonal cycle. Oecologia 204, 1–19. doi: 10.1007/s00442-023-05501-y
Nakanishi T., Yamamoto M., Irino T., Tada R. (2012). Distribution of glycerol dialkyl glycerol tetraethers, alkenones and polyunsaturated fatty acids in suspended particulate organic matter in the East China Sea. J. Oceanogr. 68, 959–970. doi: 10.1007/s10872-012-0146-4
Pedrosa-Pamies R., Conte M. H., Weber J. C., Johnson R. (2018). Carbon cycling in the Sargasso Sea water column: Insights from lipid biomarkers in suspended particles. Prog. Oceanogr. 168, 248–278. doi: 10.1016/j.pocean.2018.08.005
Peng P., Bi R., Sachs J. P., Shi J., Luo Y., Chen W., et al. (2023). Phytoplankton community changes in a coastal upwelling system during the last century. Global Planet. Change 224, 104101. doi: 10.1016/j.gloplacha.2023.104101
Qi J., Yin B., Zhang Q., Yang D., Xu Z. (2014). Analysis of seasonal variation of water masses in East China Sea. Chin. J. Oceanol. Limn. 32, 958–971. doi: 10.1007/s00343-014-3269-1
Qi J., Yin B., Zhang Q., Yang D., Xu Z. (2017). Seasonal variation of the Taiwan Warm Current Water and its underlying mechanism. Chin. J. Oceanol. Limn. 35, 1045–1060. doi: 10.1007/s00343-017-6018-4
Ruess L., Müller-Navarra D. C. (2019). Essential biomolecules in food webs. Front. Ecol. Evol. 7. doi: 10.3389/fevo.2019.00269
Shin S. S., Choi S. Y., Seo M. H., Lee S. J., Soh H. Y., Youn S. H. (2022). Spatiotemporal distribution characteristics of copepods in the water masses of the Northeastern east China sea. J. Mar. Sci. Eng. 10, 754. doi: 10.3390/jmse10060754
Shin K.-H., Hama T., Handa N. (2003). Effect of nutrient conditions on the composition of photosynthetic products in the East China Sea and surrounding waters. Deep-Sea Res. Part II Top. Stud. Oceanogr. 50, 389–401. doi: 10.1016/S0967-0645(02)00463-0
Sicre M. A., Tian R. C., Saliot A. (1994). Distribution of sterols in the suspended particles of the Chang Jiang Estuary and adjacent East China Sea. Org. Geochem. 21, 1–10. doi: 10.1016/0146-6380(94)90083-3
Sterner R. W., Schulz K. (1998). Zooplankton nutrition: recent progress and a reality check. Aquat. Ecol. 32, 261–279. doi: 10.1023/A:1009949400573
Straile D., Martin-Creuzburg D. (2022). “Nutritional Constraints on Zooplankton,” in Encyclopedia of Inland Waters, 2nd ed. Eds. Mehner T., Tockner K. (Elsevier, Oxford), 184–195. doi: 10.1016/B978–0-12–819166–8.00160–2
Sun D., Chen Y., Feng Y., Liu Z., Peng X., Cai Y., et al. (2021). Seasonal variation in size diversity: Explaining the spatial mismatch between phytoplankton and mesozooplankton in fishing grounds of the East China Sea. Ecol. Indic. 131, 108201. doi: 10.1016/j.ecolind.2021.108201
Tolosa I., LeBlond N., Copin-Montégut C., Marty J.-C., de Mora S., Prieur L. (2003). Distribution of sterol and fatty alcohol biomarkers in particulate matter from the frontal structure of the Alboran Sea (SW Mediterranean Sea). Mar. Chem. 82, 161–183. doi: 10.1016/S0304-4203(03)00051-3
Tolosa I., Miquel J.-C., Gasser B., Raimbault P., Goyet C., Claustre H. (2008). Distribution of lipid biomarkers and carbon isotope fractionation in contrasting trophic environments of the South East Pacific. Biogeosciences 5, 949–968. doi: 10.5194/bg-5-949-2008
Volkman J. K. (2003). Sterols in microorganisms. Appl. Microbiol. Biotechnol. 60, 495–506. doi: 10.1007/s00253-002-1172-8
Wang X., Zhuang Y., Zheng Z., Chen H., Ge R., Liu G. (2023). Zooplankton assemblages and indicator species in the Changjiang river estuary and its adjacent waters. Cont. Shelf Res. 260, 105000. doi: 10.1016/j.csr.2023.105000
Wei Q., Yao P., Xu B., Zhao B., Ran X., Zhao Y., et al. (2021). Coastal upwelling combined with the river plume regulates hypoxia in the changjiang estuary and adjacent inner east China sea shelf. J. Geophys. Res.-Oceans 126, e2021JC017740. doi: 10.1029/2021JC017740
Wu P., Bi R., Duan S., Jin H., Chen J., Hao Q., et al. (2016). Spatiotemporal variations of phytoplankton in the East China Sea and the Yellow Sea revealed by lipid biomarkers. J. Geophys. Res.-Biogeo. 121, 109–125. doi: 10.1002/2015JG003167
Xu L., Yang D., Greenwood J., Feng X., Gao G., Qi J., et al. (2020). Riverine and oceanic nutrients govern different algal bloom domain near the Changjiang estuary in summer. J. Geophys. Res.-Biogeo. 125 (10), 26. doi: 10.1029/2020JG005727
Zhang J., Du Y. N., Zhang G. S., Chang Y., Zhou Y. C., Zhang Z. F., et al. (2021). Increases in the seaward river flux of nutrients driven by human migration and land-use changes in the tide-influenced delta. Sci. Total. Environ. 761, 144501. doi: 10.1016/j.scitotenv.2020.144501
Zhang J., Guo X., Zhao L. (2019). Tracing external sources of nutrients in the East China Sea and evaluating their contributions to primary production. Prog. Oceanogr. 176, 102122. doi: 10.1016/j.pocean.2019.102122
Zhao M. X., Eglinton G., Haslett S. K., Jordan R. W., Sarnthein M., Zhang Z. H. (2000). Marine and terrestrial biomarker records for the last 35,000 years at ODP site 658C off NW Africa. Organic Geochem. 31, 919–930. doi: 10.1016/S0146-6380(00)00027-9
Zheng L., Chen B., Liu X., Huang B., Liu H., Song S. (2015). Seasonal variations in the effect of microzooplankton grazing on phytoplankton in the East China Sea. Cont. Shelf Res. 111, 304–315. doi: 10.1016/j.csr.2015.08.010
Keywords: sterol, fatty acids, phytoplankton, Changjiang diluted water, Kuroshio, East China Sea
Citation: Gao J, Xu S, Bi R, Wang Y, Ding Y, Che H, Zhang J, Yao P, Shi J and Zhao M (2024) Vertical distributions of lipid biomarkers in spring and summer in coastal regions of the East China Sea. Front. Mar. Sci. 11:1384334. doi: 10.3389/fmars.2024.1384334
Received: 09 February 2024; Accepted: 30 April 2024;
Published: 14 May 2024.
Edited by:
Hongjie Wang, University of Rhode Island, United StatesReviewed by:
Jiaxing Liu, Chinese Academy of Sciences (CAS), ChinaCopyright © 2024 Gao, Xu, Bi, Wang, Ding, Che, Zhang, Yao, Shi and Zhao. This is an open-access article distributed under the terms of the Creative Commons Attribution License (CC BY). The use, distribution or reproduction in other forums is permitted, provided the original author(s) and the copyright owner(s) are credited and that the original publication in this journal is cited, in accordance with accepted academic practice. No use, distribution or reproduction is permitted which does not comply with these terms.
*Correspondence: Rong Bi, cm9uZ2JpQG91Yy5lZHUuY24=; Meixun Zhao, bWF4emhhb0BvdWMuZWR1LmNu; bWF4emhhbzA0QHlhaG9vLmNvbQ==
†These authors have contributed equally to this work
Disclaimer: All claims expressed in this article are solely those of the authors and do not necessarily represent those of their affiliated organizations, or those of the publisher, the editors and the reviewers. Any product that may be evaluated in this article or claim that may be made by its manufacturer is not guaranteed or endorsed by the publisher.
Research integrity at Frontiers
Learn more about the work of our research integrity team to safeguard the quality of each article we publish.