 Shuyi Fei
 Yonghui Gao
 Ji Li
Ji Li Lingzhi Cao4
- 1School of Oceanography, Shanghai Jiao Tong University, Shanghai, China
- 2Shanghai Key Laboratory of Polar Life and Environment Sciences, Shanghai Jiao Tong University, Shanghai, China
- 3Key Laboratory of Polar Ecosystem and Climate Change, Ministry of Education, Shanghai, China
- 4School of Environmental Science and Engineering, Shanghai Jiao Tong University, Shanghai, China
Variable fluorescence measurements provide automatic and rapid estimates of electron-based photosynthesis. However, electron transport rates (ETR) to phytoplankton production vary greatly due to biological physiology and environmental stress along the Changjiang River to the adjacent seawater, where the turbid riverside, nutrient-rich river plume, and seawater are divided by the sediment front and plume front. We assessed the light responses of ETR, 18O-labeled gross primary production (GPP), and O2-based net community production (NCP) during the bloom season at the Changjiang River Estuary. The distribution of phytoplankton and potential photosynthesis efficiency were positively correlated, exhibiting offshore decreasing trends and peaking around the upwelling areas. The conversion factors of ΦGPP (mol e- per mol O2 production) ranged from 0.8 to 31.8, and ΦNCP ranged from 0.9 to 36.9, respectively. Φe: O increased from the nutrient-rich Changjiang diluted water (CDW) to the nutrient-poor seawater. Although ΦGPP and ΦNCP were linearly related to non-photochemical quenching (R2 > 0.5) in the CDW, this relationship was decoupled in offshore seawater due to P-limitation, light stress, and shifts in the phytoplankton community. A better relationship between ΦGPP and ΦNCP was quantified using multiple linear analyses with the light attenuation coefficient (Kd), euphotic depth (Zeu), salinity, nutrients, and temperature (p< 0.001). This improvement in accuracy represents a major step forward for widespread and accurate fluorometry-based GPP and NCP applications at high temporal and spatial resolutions in the future.
1 Introduction
Phytoplankton account for half of the global photosynthetic carbon fixation (Field et al., 1998) and play a key role as the biological carbon pump, regulating oxygen production, carbon sequestration, and climate change (Le Quéré et al., 2018). Photosynthesis is initiated by a light reaction in photosystem II (PSII) photo-electrochemistry that extracts four electrons from two H2O molecules to produce oxygen (O2) and four H+ ions. The electrons are then simultaneously transported to photosystem I (PSI), producing NADP+, which supplies the energy (ATP) and reductant (NADPH) needed to fuel the Calvin cycle for C-fixation, the Mehler reaction, and alternative oxidation reactions (Zhang and Reisner, 2019). When phytoplankton are exposed to increasing irradiance, their photosynthetic rate initially increases with light until reaching saturation. Gross primary production (GPP) is tightly linked to electron transportation rates (ETR) in PSII and total oxygen evolution (O2-based GPP). Net community production (NCP), the difference between GPP and respiration, is often linearly related to carbon fixation in biochemical processes (Suggett et al., 2006a; González et al., 2008; Tanaka et al., 2013). However, oxygen consumption in phytoplankton is often complicated by a series of reactions, such as ordinary respiration through the cytochrome oxidase pathway, respiration by the alternative oxidase pathway, the Mehler reaction, and photorespiration (Estapa and Mayer, 2010; Suggett et al., 2010). Understanding the biological mechanisms underlying photosynthesis is of utmost relevance to advancing our understanding of regional variability and controls on phytoplankton productivity (Burlacot et al., 2020).
The estimation of phytoplankton photosynthetic rates has long been a limitation in our understanding of the significance of phytoplankton in the global carbon cycle, despite the availability of regional data on phytoplankton primary productivity. Traditional incubation experiments estimate the photosynthetic intake of CO2, and the production of O2 and carbohydrates along the photosynthetic pathway. However, these estimates can be altered by changes in nutrient availability, microbial activity, grazing pressure, and bottle effects during the time-consuming incubation process (Hamme et al., 2019). The recent development of active chlorophyll-a fluorometers provides fast, non-invasive, accurate, and accessible platforms to assess phytoplankton physiology, particularly the maximum potential photochemical efficiency (Fv/Fm) (Kolber and Falkowski, 1993). Rapid photosynthesis-irradiance (P-I) responses provide a convenient method to obtain electron-based production, allowing for the monitoring of electron transport in PSII light reactions. These reactions are closely linked to carbon uptake and oxygen production (Suggett et al., 2009a; Petrou et al., 2016; Ryan-Keogh et al., 2018).
According to the different “currencies” (O2 or C) for mass transfer production, the conversion factors can be classified as Φe: O (mol e- per mol O2 production) and Φe: C (mol e per mol C production) for the ratio of electron-based production to oxygen- and carbon-based production, respectively. The theoretical value of Φe: O is approximately 4 mol e- per mol O2 production. However, electron-based GPP varies significantly from oxygen evolution and carbon fixation (Macintyre et al., 2002; Lawrenz et al., 2013; Robinson et al., 2014; Hughes et al., 2018b). This uncertainty in converting electrons to oxygen production (or carbon fixation) hinders the widespread application of variable fluorescence. Numerous studies have estimated the conversion factors needed to address this problem in recent years. Fourteen different regional studies, from polar seas to temperate estuaries, revealed that Φe: C exhibits a 50-fold variation, ranging from 1.15 mol e- to 54.2 mol e- per mol C production, with a mean of 10.9 ± 6.91 mol e- per mol C production (Lawrenz et al., 2013). In response to environmental stress, Φe: C often exceeds the theoretical value, changing from 13 mol e- to 28 mol e- per mol C production in the dim water of the Arctic Ocean. Φe: C increases (up to ~18 mol e- per mol C production) in iron-depleted conditions than in iron-replete waters (~15 mol e- per mol C production) (Schuback et al., 2015). Differences in taxa and their metabolism change Φe: C from 4.5 mol e- to 25.4 mol e- per mol C production and Φe:O from 1.6 mol e- to 9.6 mol e- per mol O2 production in nutrient-replete conditions (Suggett et al., 2009a). Therefore, the interplay of physical–chemical changes and phytoplankton community composition likely leads to variations in Φ values (Macintyre et al., 2002; Robinson et al., 2014). Understanding phytoplankton photosynthesis response to environmental changes would objectively improve the evaluation of Φ, facilitate productivity estimation at high spatial-temporal resolution, and provide better insight into ocean production and carbon cycles.
The Changjiang River (Yangtze River), the largest river in China and the fifth largest in the world, delivers substantial amounts of nutrients into the East China Sea (ESC), supporting massive phytoplankton blooms. After the 1980s, the frequency, duration, and coverage of algal blooms have increased dramatically (Zhao et al., 2021). Annual primary production (PP) from the Changjiang River to the East China Sea is 222.99 Tg C a-1 per year, ranging from 65.15 Tg C a-1 per year to 821.32 Tg per year C a-1 (Jiao et al., 2018). This annual PP is 12 times higher than the riverine carbon flux into the sea, which includes particulate organic carbon (POC) at 1.51 Tg C a−1 ± 0.80 Tg C a−1, dissolved organic carbon (DOC) at 1.62 Tg C a−1, and dissolved inorganic carbon (DIC) at 14.60 Tg C a−1 per year (Jiao et al., 2018). There is no doubt that biological activity plays an important role in biogeochemical cycles, making this region a net carbon sink (6.92 Tg C a-1–23.30 Tg C a-1, CO2 air-sea flux) (Zhang et al., 2014; Jiao et al., 2018). Additionally, there are large spatial gradients of nutrients, POC concentrations, phytoplankton Chl a, and biomass in the dynamic shelf ecosystems of the East China Sea. Seasonal variations of Chl a and PP are similar in coastal waters but opposite in off-shelf waters due to variations in C: Chl a ratios driven by the combined influences of light, temperature, and nutrients (Liu et al., 2019). The complexity of physical and biogeochemical processes (Figure 1) not only poses a challenge for understanding biological carbon fixation and changes in carbon budgets but also complicates the application of variable fluorescence. In this study, we conducted a comprehensive survey of hydrology, bioavailable nutrients, and phytoplankton production (Figure 1). To address the gap in understanding the mechanisms of phytoplankton physiological activity, we performed light–dark incubation experiments at representative stations to measure GPP and NCP using the H218O dilution method and the ETR light curve with fast repetition rate fluorometry (FRRf). Furthermore, we analyzed the conversion factor (Φe: O, mol e- per mol O2 production) between electron transport and oxygen production using two main analysis methods: (1) the linkage of Φe: O to NPQNSV (Ryan-Keogh et al., 2018; Hughes et al., 2018c; Schuback and Tortell, 2019) and (2) the multiple linear regression of Φe: O with environmental factors (Lawrenz et al., 2013) to identify rational relationships in this complex ecosystem. These efforts aim to enhance the possibility and reliability of FRRf-based production measurements on a high-resolution temporal scale in this region.
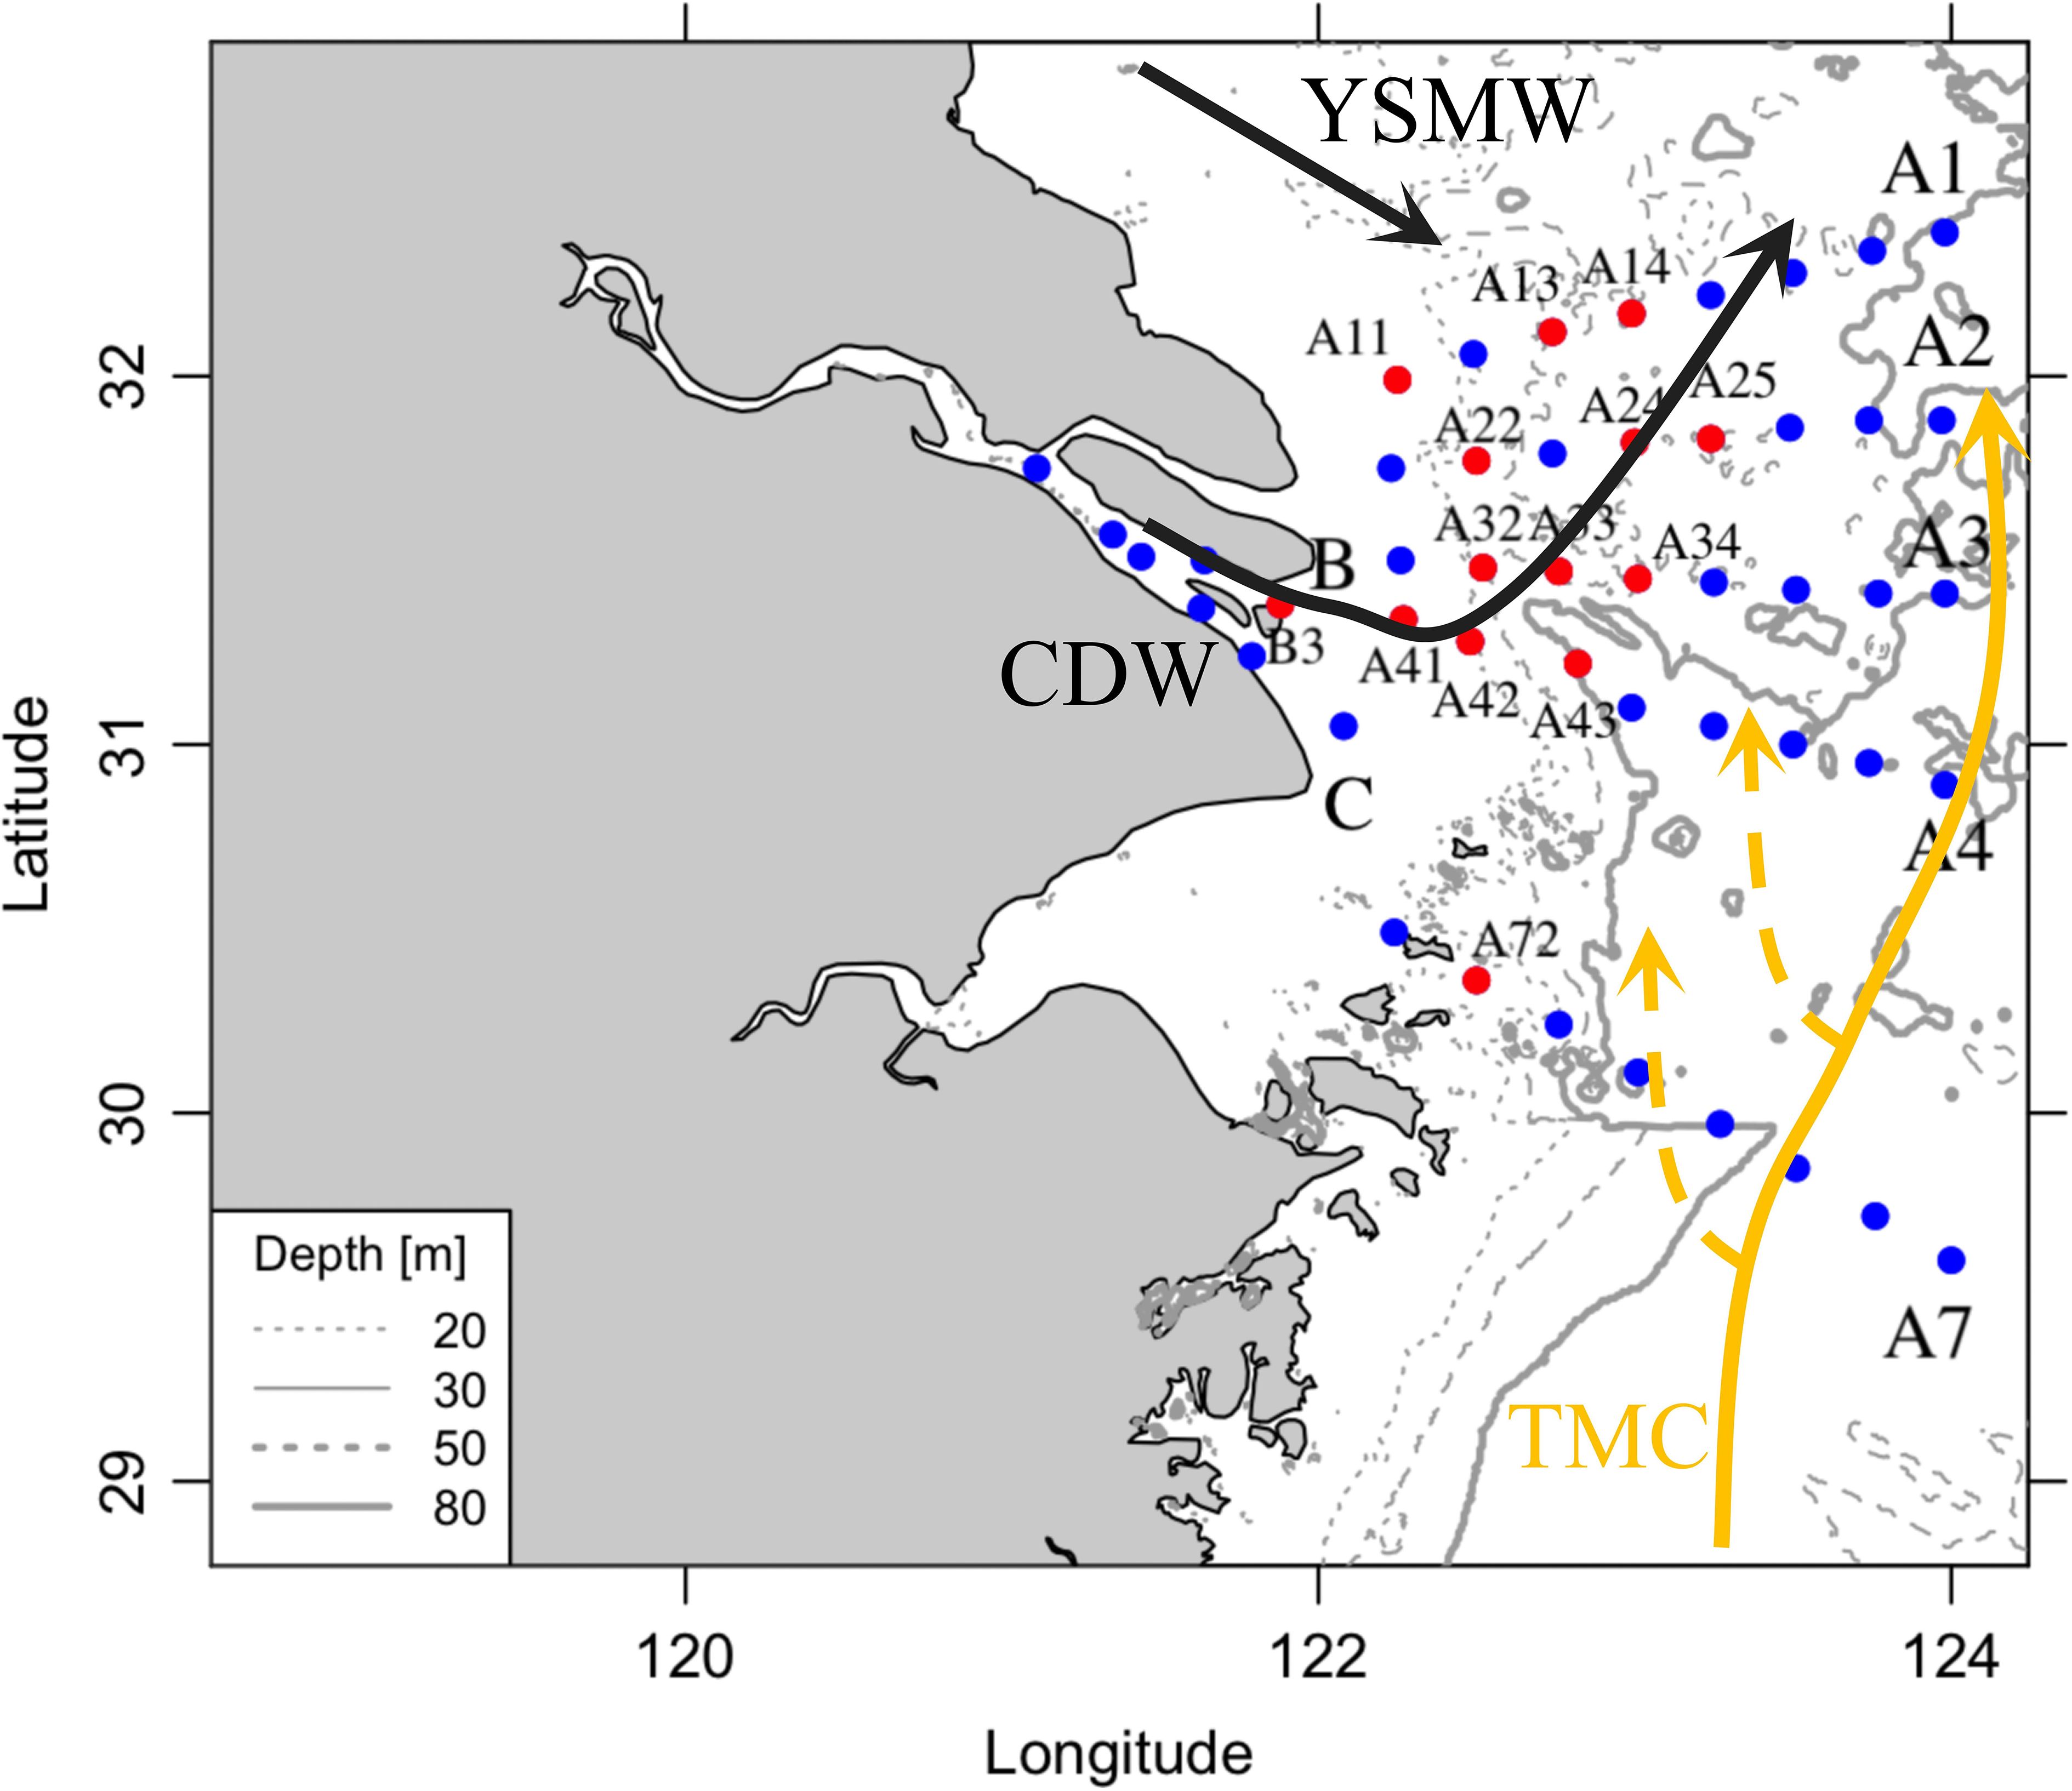
Figure 1 Sampling stations and hydrology schemes. This region is under the influence of different water masses, including Yellow Sea Mixing Water (YSMW), Changjiang Diluted Water (CDW), and Taiwan Warm Current (TWC). The vertical profiles of hydrography and nutrients were taken at all stations, and incubation was selected at 14 stations (red dots).
2 Materials and methods
2.1 Study sites
The study region, a long-term monitoring ecosystem, covers the mouth of the Changjiang River to the marginal East China Sea (Figure 1). This area has been affected by anthropogenic riverine discharge, summer stratification, upwelling, and the intrusion of Kuroshio currents. The riverine plume (changing diluted river, CDW) extends to the northeast in summer and is strongly influenced by river discharge, the East Asia monsoon, tidal mixing, coastal currents, and continental shelf circulation. After the plume moves off the sediment maximum zone, massive but patchy phytoplankton blooms often occur in the neritic and oceanic waters.
2.2 Sampling strategy and hydrographic properties
Our field investigation along the five transects (Figure 1) was conducted from 12 to 18 July 2021. Incubations were performed at stations where the Chl a in the maximum chlorophyll layer exceeded 2 mg m-3, ranging from tidal freshwater to seawater. To estimate the photosynthesis-irradiance curve, ETR was determined from the rapid light curve (RLC) of variable fluorescence (Suggett et al., 2006b; Zhang and Reisner, 2019). Oxygen-based GPP and NCP were measured using the 18O-diluted method (Bender, 1987).
The physical and biogeochemical structures were measured vertically using sensors for salinity, temperature, turbidity, and photosynthetically active radiation (PAR) on a CTD-911 (Sea-Bird Inc., United States). The euphotic layer depth (Zeu) was defined as the depth where the irradiance (Ez) is 1% of the surface irradiance (E0). The mixing layer’s (Zmix) depth was determined as the depth of maximum buoyancy. Light limitation was considered when the ratio of Zeu to Zmix was below 0.2 (Cloern, 1987). The depth profile of PAR was used to calculate the optical attenuation coefficient using the formula Kd = ln (E0/Ez)/z.
2.3 Biochemistry properties
The vertical changes in chlorophyll a (Chl a) and nutrient concentrations were measured at the surface, middle, and bottom layers (Figure 1). Water samples were filtered through GF/F filters (pore size 0.7 μm, Whatman, United Kingdom) and frozen at -20°C. The concentrations of ammonia (NH4+), dissolved inorganic phosphate (DIP), and dissolved silicate (DSi) were measured with a semi-continuous UV-VIS spectrophotometer (Cary Series, Agilent Technologies®, United States) (Parsons et al., 1984). The detection limits were 0.3 µmol of NH4+ L-1 using the indophenol blue method, 0.5 µmol of Si L-1 with the silico-molybdenum blue method, and 0.001 µmol of P L-1 using the molybdenum blue method. Nitrate (NO3-) and nitrite (NO2-) concentrations were analyzed with a nutrient analyzer (AQ400, Seal Analytical®, China) with detection limits of 0.2 µmol of NO3- L-1 and 0.01 μmol of NO2- L-1, respectively. Subsamples for Chl a were filtered on GF/F filters and then frozen until analysis. Filters were extracted with 10 mL of 90% acetone overnight in the dark and measured with a trilogy fluorometer (Turner Designs, Inc., United States).
2.4 In situ measurement of fast repetition rate fluorometry
Fast repetition rate fluorometry (FRRf) was used to record the maximum photochemical efficiency of PSII (Fv/Fm). Water samples, either from underway water or incubation experiments, were automatically filled with a built-in peristaltic pump into a temperature-controlled chamber and adapted in the dark for 15 min. By stimulating reaction centers to close and open, phytoplankton produced the minimum fluorescence (F0) in the dark and reached the maximum fluorescence (Fm) when the photosynthetic light reactions became saturated under a light pulse. The saturating light pulse was set to 50–100 single turnover (ST) saturation flashes with a duration of 0.2 ms and an interval of 2.4 ms (Suggett et al., 2009a). After baseline correction (Fb) with the filtered seawater, the ratio of variable fluorescence to maximum fluorescence was calculated as Fv/Fm = (Fm-F0)/(Fm-Fb).
The electron transfer rates were simulated with RLC curves at stations for GPP and NCP estimation. In situ actinic light was set from dark to saturation level (1,000 μmol photons m-2 s-1–1,500 μmol photons m-2 s-1) in ten steps. At each light level, the minimum fluorescence F0’ and maximum fluorescence Fm’ were obtained to calculate the variable fluorescence (Fv’ = Fm’ - F0’). Between 40 and 60 sequential induction curves were averaged per acquisition to increase the signal-to-noise ratio (Lawrenz et al., 2013). Non-photochemical quenching (NPQ) was used to measure excess energy dissipation, where the NPQNSV (normalized Stern-Volmer quenching coefficient) is calculated as F0’/Fv’ (Ryan-Keogh et al., 2018).
The electron transfer rates are closely linked to photosynthetic activity. Data from the RLC were processed to derive fluorescence parameters by fitting Equations 3 and 4 with ActRun software. Three parameters can be obtained from the RLC: the initial slope (αETR), which represents the ability of phytoplankton to capture light when the radiation intensity is limited; the half-saturation intensity (EkETR, µmol photons m-2 s-1); and the maximum relative electron transport rate (ETRmax, mmol e- per mg Chl a per hour).
Chlorophyll a normalized ETR (mmol e- per mg Chl a per hour) can be calculated as (Equations 1, 2) (Hughes et al., 2018b; Oxborough, 2022):
where E (µmol photons m-2 s-1) is the actinic irradiance at each light level, Ka is the manufactural setting of 11,800 m-1, 3,600/103 converts µmol electrons to mmol electrons, and s-1 to h-1. Fq’/Fm’ is the quantum efficiency of energy conversion in PSII at a given light intensity. When in situ light < Ek, we calculate it as follows:
Although the light inhibition barely occurred in the field observation, Equation 4 is applied once in situ light > Ek:
2.5 The18O-based gross primary production and net community production
The dilution of H218O method allows for measuring GPP by tracing 18O16O (m/z = 34) from the water split in PSII and measuring NCP by 16O16O (m/z = 32) accumulation over time using a membrane inlet mass spectrometer (Ferron et al., 2016). Briefly, 350 mL samples were well-mixed with H218O at the final δ18Owater of 1,200‰ and then filled into a set of 12 mL dark gastight tubing and light bottles that were covered with half-shield meshes to maintain 12.5%, 25%, 50%, and 100% of in situ irradiance. The incubation was carried out for 4 h to 6 h in a circulating temperature-controlled water bath. Samples were fixed with a saturated mercuric chloride solution (~ 0.1% of the total sample volume) at the end of incubation to inhibit biological activity, then stored in the dark at 4°C to avoid degassing.
Water samples were passed through a semipermeable microbore silicone membrane ( 0.8 mm, SilasticVR, DuPont, United States) at a fixed flow rate of 2 mL min-1. Dissolved gases in seawater diffused via the membrane into the vacuum line and then passed through a liquid-N2 trapper, which removed water vapor and CO2 and allowed the rest of the gases into a quadrupole mass spectrometer (QMS) (Ferron et al., 2016). Mass currents (18O16O, 16O16O, and 40Ar) and their ratios were recorded (Piffer Vacuum, Inc., Germany). To correct instrument drift, calibration was applied with equilibrium water, which was stirred overnight in the temperature-controlled chamber.
Considering that water splitting only produces 16O16O (the natural abundance of 16O being 99.8%, O2 is produced from H2O at 99.6% as 16O2) and neglecting isotopic discrimination between 18O16O and 16O16O by uptake mechanisms, the following equations modified from Radmer and Kok (1976) and Peltier and Thibault (1985) can be used. The oxygen isotope ratio (18R) is determined as follows (Equation 5):
Oxygen isotopic composition (δ18O, ‰), which indicates the abundance of 18O in the water relative to its abundance in a reference standard (SMOW), which was analyzed in the SJTU analysis center (Equation 6):
GPP (mmol O2 m-3 h-1) was obtained through the change in the isotope ratio of dissolved O2 over the incubation period (Equation 7):
where 18R(O2) represents the initial (t1) and final (t2) isotope ratios of dissolved O2, respectively. 18Rwater refers to the isotope ratios of incubation water and [O2]t1 is the initial concentration of dissolved oxygen.
NCP (mmol O2 m-3 h-1) over the incubation interval can be determined from the net change in O2/Ar (Equation 8), simultaneously:
where (O2/Ar)t1 and (O2/Ar)t2 represent the initial and final O2/Ar ratios. (O2/Ar) reference is the O2/Ar ratio in the equilibrium water, which is stirred overnight in the temperature-controlled chamber.
Chlorophyll normalized rates of O2 production (P, mmol O2 per mg Chl a per hour) at each light level were used to simulate the light curve (Equation 9) to estimate the maximal light-saturated Chl a specific GPP (GPPmax, mmol O2 per mg Chl a per hour) and NCP (NCPmax, mmol O2 per mg Chl a per hour), the initial slope in the light limit situation (αGPP, αNCP), and the half-saturation light intensity (EkGPP, EkNCP, µmol photons m-2 s-1). The light inhibition stage was expressed with β and Ekβ. Photoinhibition barely occurred in this study, so the second term can be negligible.
Gross photosynthesis from variable fluorescence can be quantified in absolute units of O2 from the knowledge of the quantum yield of charge separation in PSII (Petrou et al., 2016) and the electron requirement for O2 production, respectively. The conversion factor between electron transport and oxygen production was then calculated for ΦGPP (Equation 9) and ΦNCP (Equations 10) as follows:
2.6 Data processing and statistical analysis
Box plots were used to determine the regional range of photosynthetic parameters and conversion factors. Data analysis among environmental and photosynthetic parameters was conducted using the R program. Linear correlations aimed to identify the potential linear relationship between Φe: O and NPQNSV. Pearson analysis was also applied to find the correlation among environmental factors Fv/Fm, α, Ek, ETRmax, GPPmax, NCPmax, and conversion factors Φe: O. Multiple linear regressions were used to establish the statistical models for evaluating conversion factors in relation to environmental factors.
3 Results
3.1 Hydrographic properties
The study region is under the strong influence of the eutrophic Changjiang River and seawater from the Taiwan Warm Current (TWC), Kuroshio Current, and Subei Coastal Current (Figure 1). The sea surface temperature and salinity exhibited large spatial variations (Figure 2; Table 1). Similar to previous studies (Yao et al., 2007; Wu et al., 2014), the discharge of warmer and fresh river water (T > 27°C, S< 5) flowed northeastward and mixed with seawater, thus forming CDW (S< 26). The surrounding high -salinity seawater either came from the cold Yellow Sea Mixed Water (T< 25°C, S > 26) in the north or the warm Taiwan Warm Current (T > 27°C, S > 26) in the south. On the sea surface, an obvious salinity and temperature gradient existed between CDW and seawater. Vertically, the upwelling above the river valley (31.5°N, 122.3°E) brought colder and saline bottom water near the surface (Supplementary Figure 3) and simultaneously led to a surface temperature decrease and salinity increase relative to the surrounding water (T< 25°C, S of 25–28, Figure 2).
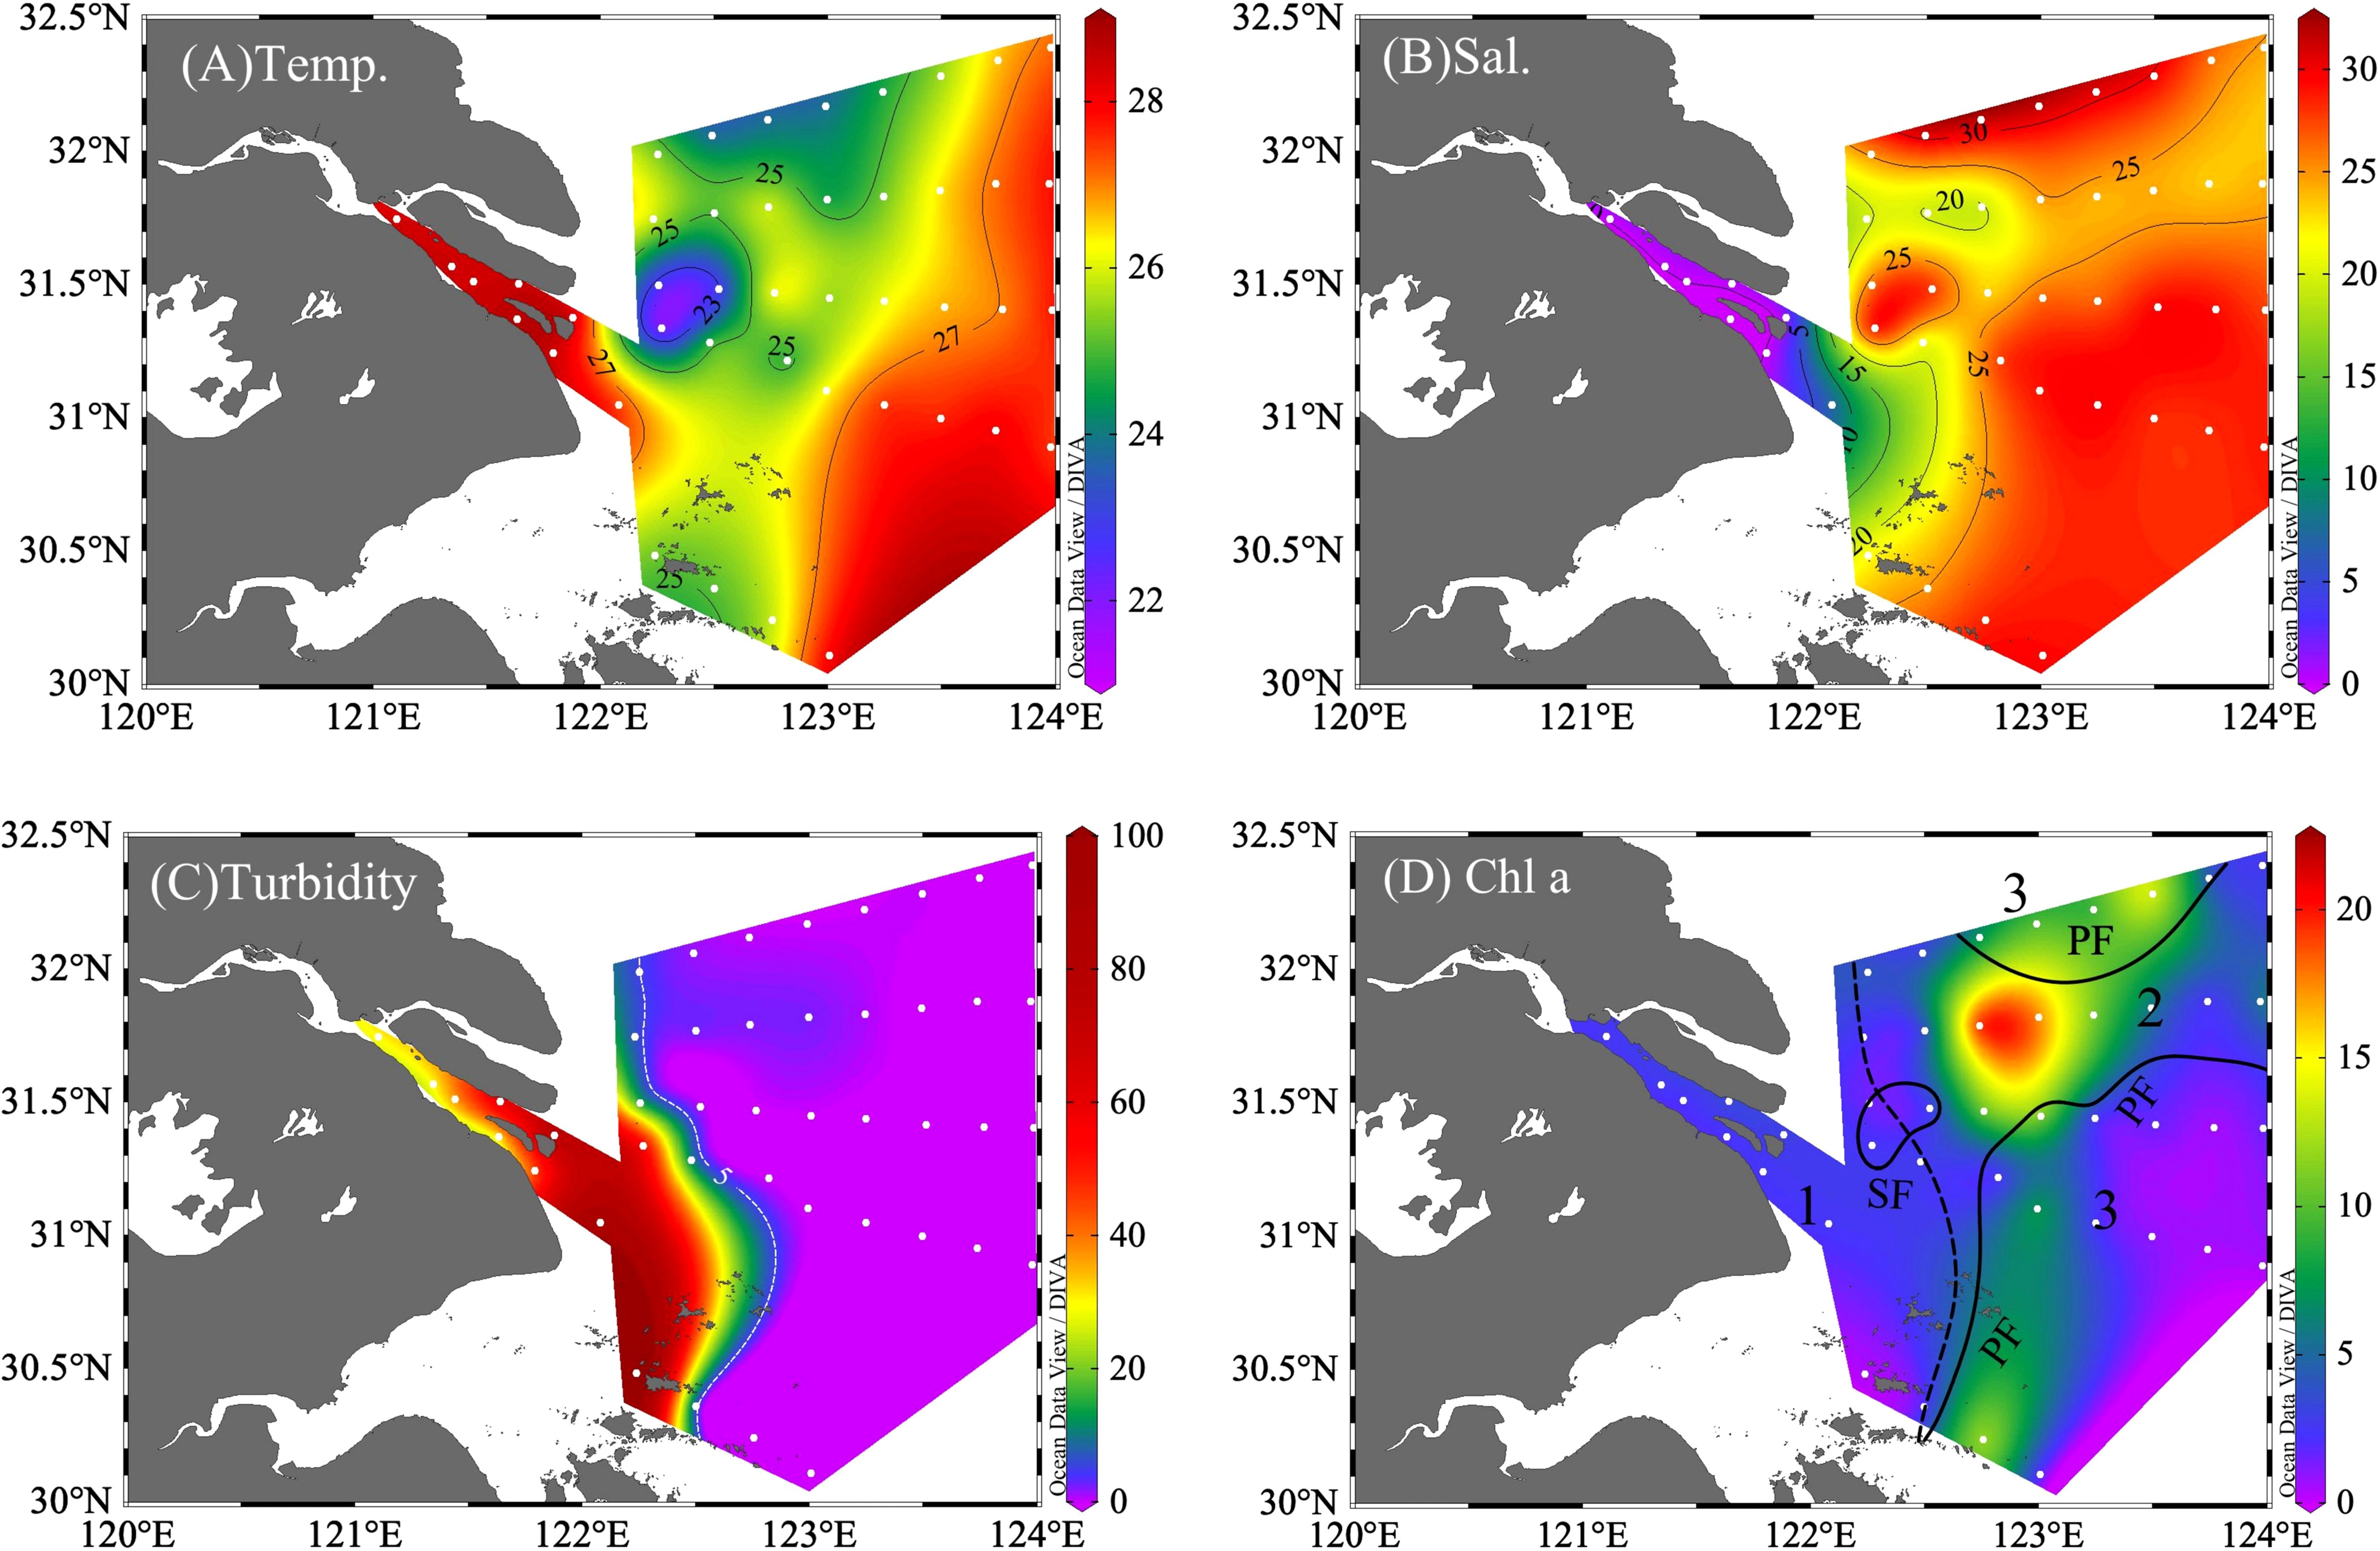
Figure 2 Distribution of (A) temperature (Temp., °C), (B) salinity (Sal.), (C) turbidity (NTU), and (D) chlorophyll (Chl a, mg m-3). In (D), the study region was divided into the river region (Zone 1, with stations of A41, A42, and B3), with sediment front (SF, the dashed line) and plume front (PF, solid lines); the plume region (Zone 2: A11, A22, A24, A25, A32, A33, and A72); and the oceanic region (Zone 3: A13, A14, A34, and A43).

Table 1 Multiple linear regression of Φe:O and environmental factors: temperature (T), attenuation coefficient (Kd), euphotic layer depth (Zeu), phosphate (P), and the N/P ratio (N/P) in the study region.
The turbid water flowed downstream, forming the turbidity maximum zone (TMZ) near the river mouth, and then decreased sharply offshore. Turbidity was negatively related to Kd and PAR, which increased from the river to the offshore region correspondingly (Supplementary Table 1). Although the river to TMZ was heavily inhibited by light, the incubation sampling stations were taken from the surface, where the ratios of Zeu and Zmix were > 0.2.
Traditionally, the sediment front (SF) and plume front (PF) were used to classify the physical and biological properties of the Changjiang River estuary and the adjacent water (Li et al., 2021, 2023). Therefore, the study area was divided into three zones by the outer boundary of TMZ as SF and the boundary of CDW core-water as PF: Zone 1 (Changjiang River mouth, turbidity > 5, salinity< 20, n = 3), Zone 2 (plume water, turbidity< 5; 20< salinity< 26, n = 7), and Zone 3 (seawater, salinity > 26, n = 4).
3.2 Distribution of Chl a and nutrient
The average of Chl a in Zone 2 (7.61 mg·m-3) > Zone 3 (4.13 mg·m-3) > Zone 1(2.42 mg·m-3, Table 1). Concentrations of Chl a (Figure 2D) were low in the turbid Zone 1 and increased immediately off the SF as a “green belt” at Zone 2. The peak of phytoplankton bloom was observed at the east end of upwelling (station A2–4, Chl a up to 17.35 mg·m-3). In the further offshore region, Chl a reduced as salinity increased in seawater.
Nutrient distribution (Figure 3) was closely related to physical processes (e.g., river delivery, upwelling) and biological nutrient removal. Both NO3-+NO2- and DSi decreased from the river (>100 μmol L-1) downstream, with a sharp reduction from the SF along CDW, and then reduced to below 20 μmol L-1 in seawater (Supplementary Table 1). Although DIP exhibited a decreasing offshore pattern, the highest value of 0.74 μmol L-1 was observed near the upwelling and the lowest in the seawater (Figure 3 and Supplementary Table 1), with 89% of stations in Zone 3 below the absolute limitation threshold of 0.1 μmol L-1 (Yang et al., 2005). Except for upwelling, which brought NH4+ upward to reach up to 3.07 μmol L-1 in Zone 2, NH4+ was lower in the phytoplankton blooming area relative to other waters.
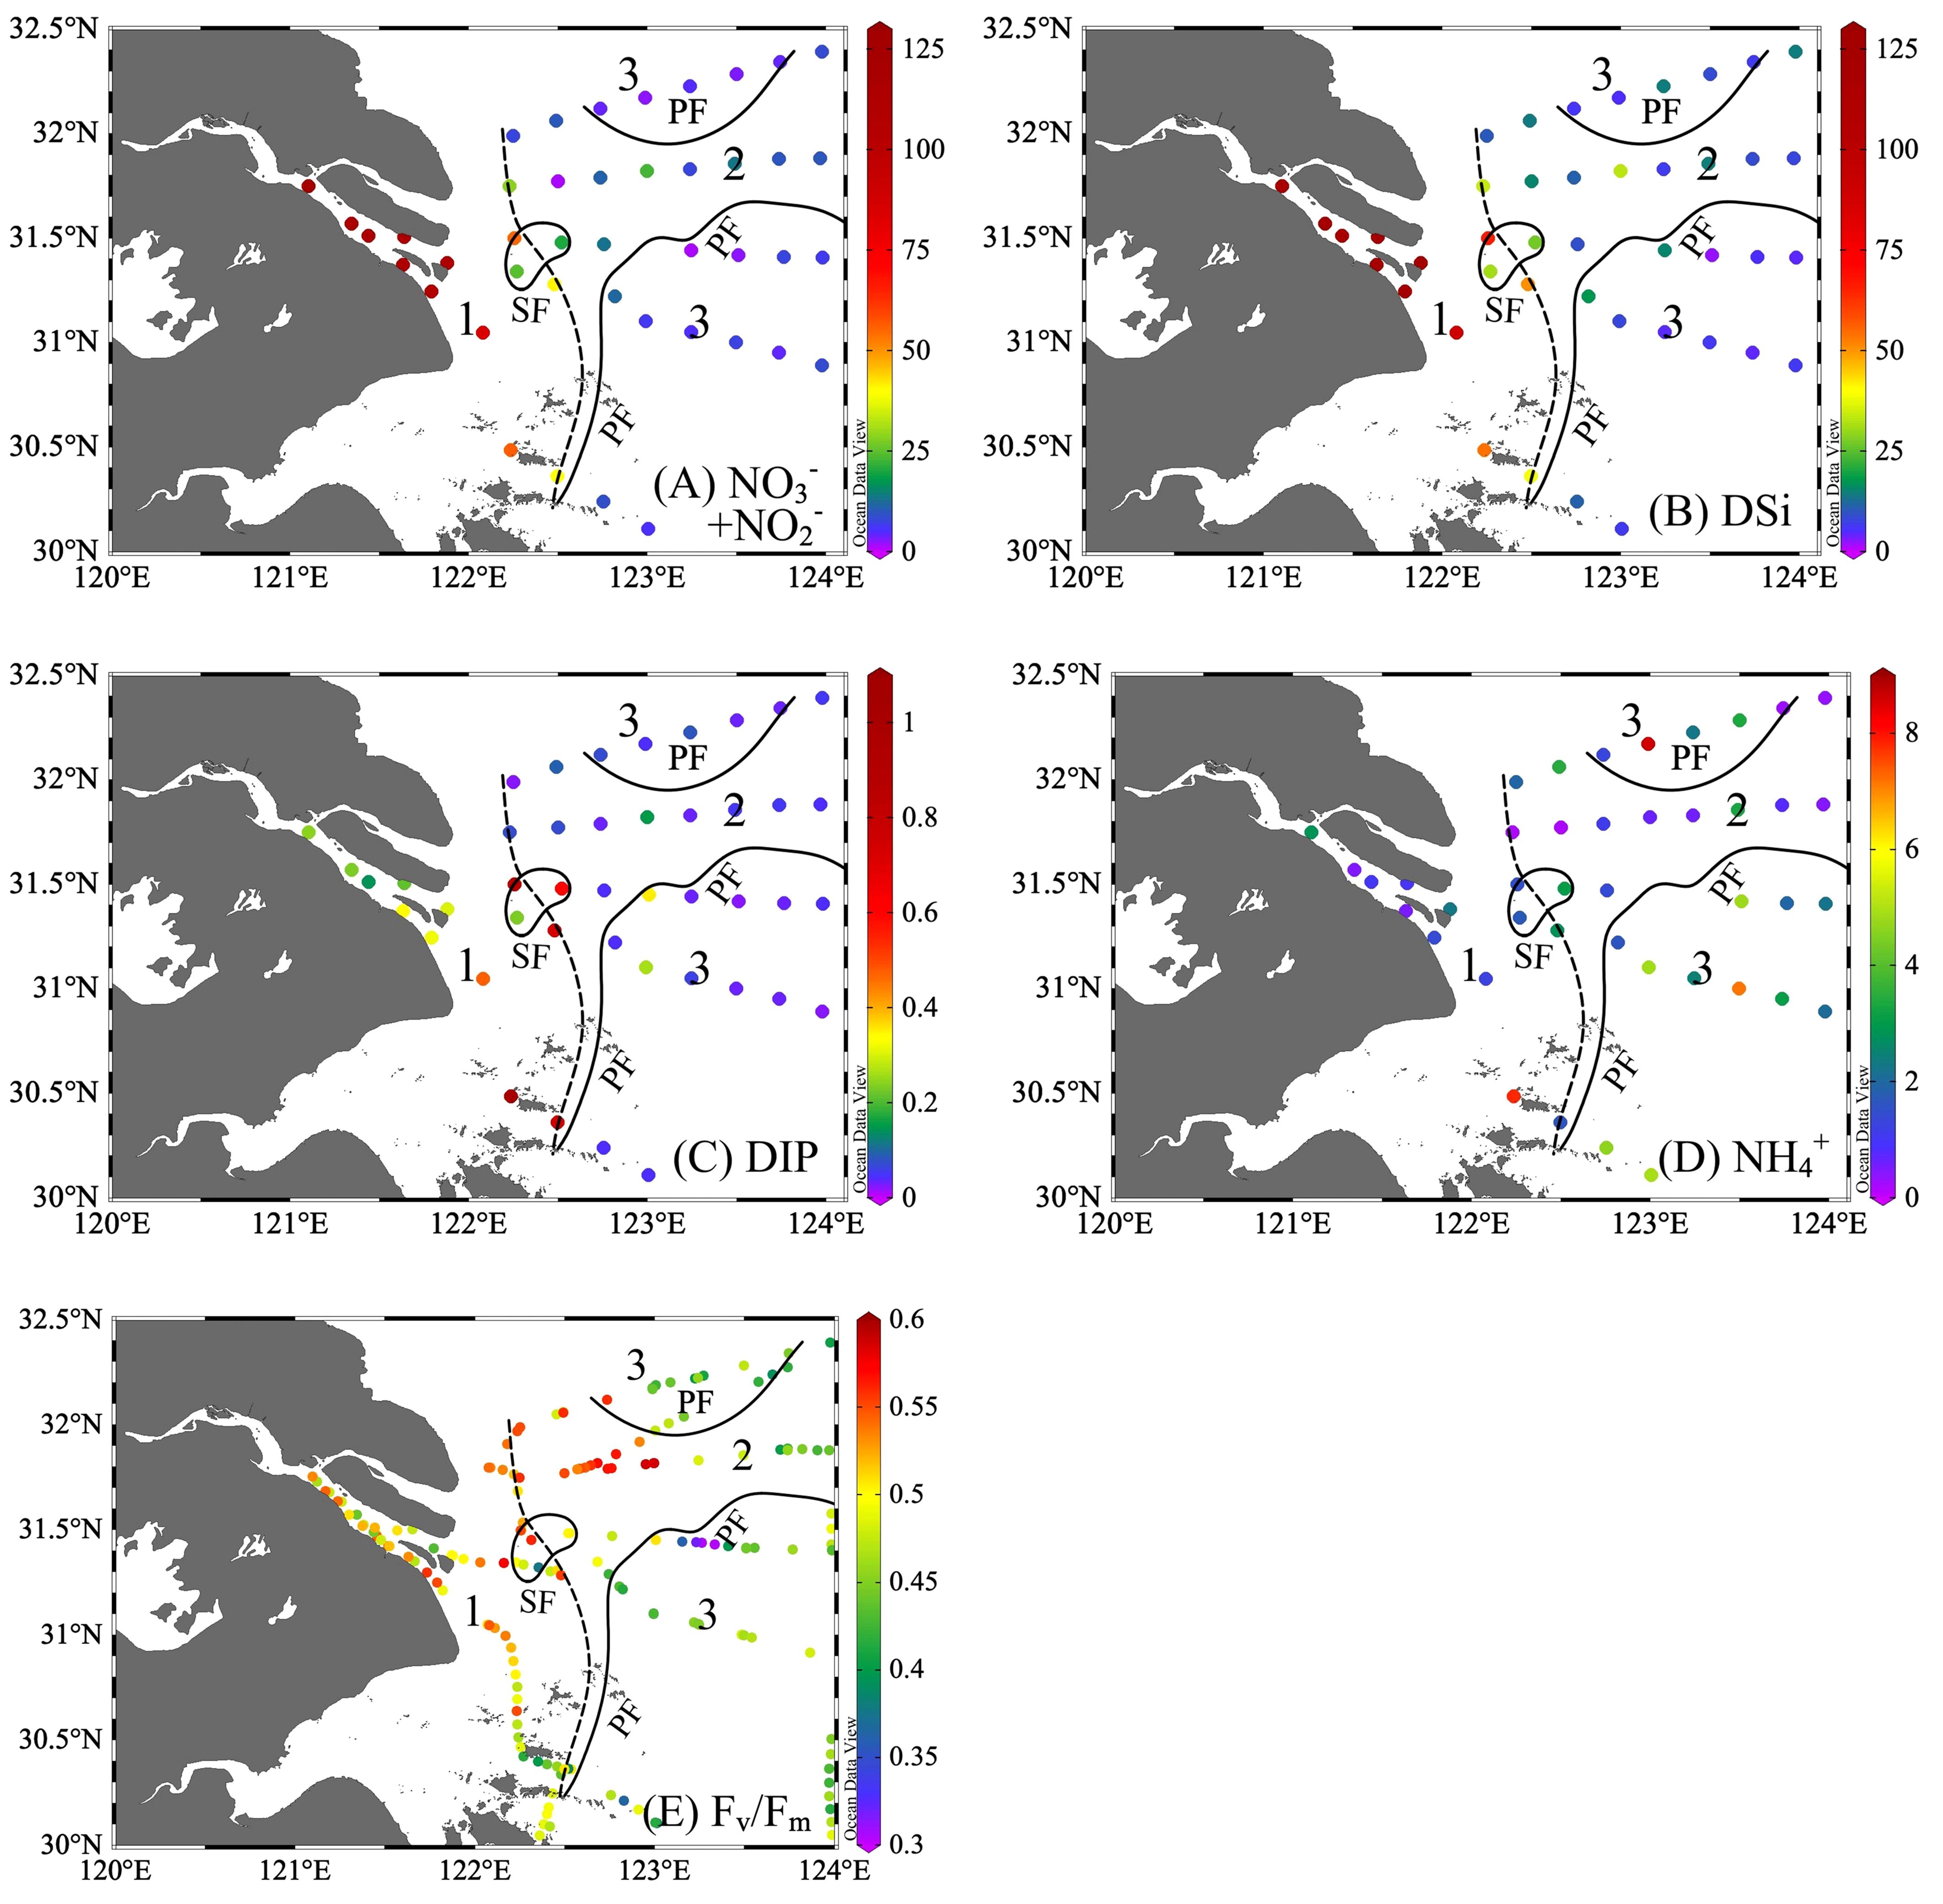
Figure 3 Distribution of (A) NO3-+NO2- (µmol L-1), (B) silicate (Si, µmol L-1), (C) dissolved inorganic phosphate (DIP, µmol L-1), (D) NH4+ (µmol L-1), and (E) the potential maximum photosynthesis efficiency (Fv/Fm). The study region was divided into three zones with sediment front (SF, the dashed line) and plume front (PF, solid lines).
3.3 Photosynthetic response
The physiological activity indicators of phytoplankton, Fv/Fm, exhibited large spatial variation (Figure 3E), ranging from 0.30 to 0.59 (average = 0.48, n = 193). Fv/Fm was well-correlated with Chl a (Pearson coefficient r = 0.83, p< 0.01). As the river plume flowed northeastward and passed through SF offshore, Fv/Fm increased with Chl a, light, and nutrient availability in Zone 2, with latitudinal increase in the north region and peaking at 0.5–0.6 around the upwelling (122.5°E–123°E, 31.8°N). In further offshore seawater, Fv/Fm generally decreased in the nutrient-poor seawater.
NPQNSV indicates the portion of light energy absorbed into PSII that is dissipated in the form of heat rather than used for photosynthetic electron transport. The average NPQNSV value at each station ranged from 0.66 to 1.44. NPQNSV increased with light at the sampling depth (r = 0.561, p< 0.05).
3.4 Photosynthetic parameters of ETR, GPP, and NCP
The productivity (ETR, GPP, and NCP) was fitted with the photosynthesis-irradiance curve for the initial slope (αETR, αETR, and αETR), half-saturation light intensity (EkETR, EkGPP, and EkNCP), and maximum production (ETRmax, GPPmax, and NCPmax). A higher initial slope (α) indicates higher phytoplankton productivity at a given light. The range of αETR was 0.74 ×10⁻²–3.94×10⁻², with a significantly higher value in Zone 3 than in the rest of the area (p< 0.05, Figures 4 and 5). Relative to αETR, the changes of αGPP and αNCP were in narrower ranges of 0.17 to 1.94 and 0.16 to 1.29 (×10−²), respectively. The observed αGPP in Zone 2 was 30% higher than that in Zone 1 and 1.8 times higher than that in Zone 3 (Supplementary Table 2). In addition, αNCP in the river-influenced water (Zones 1 and 2) was more than double that of Zone 3.
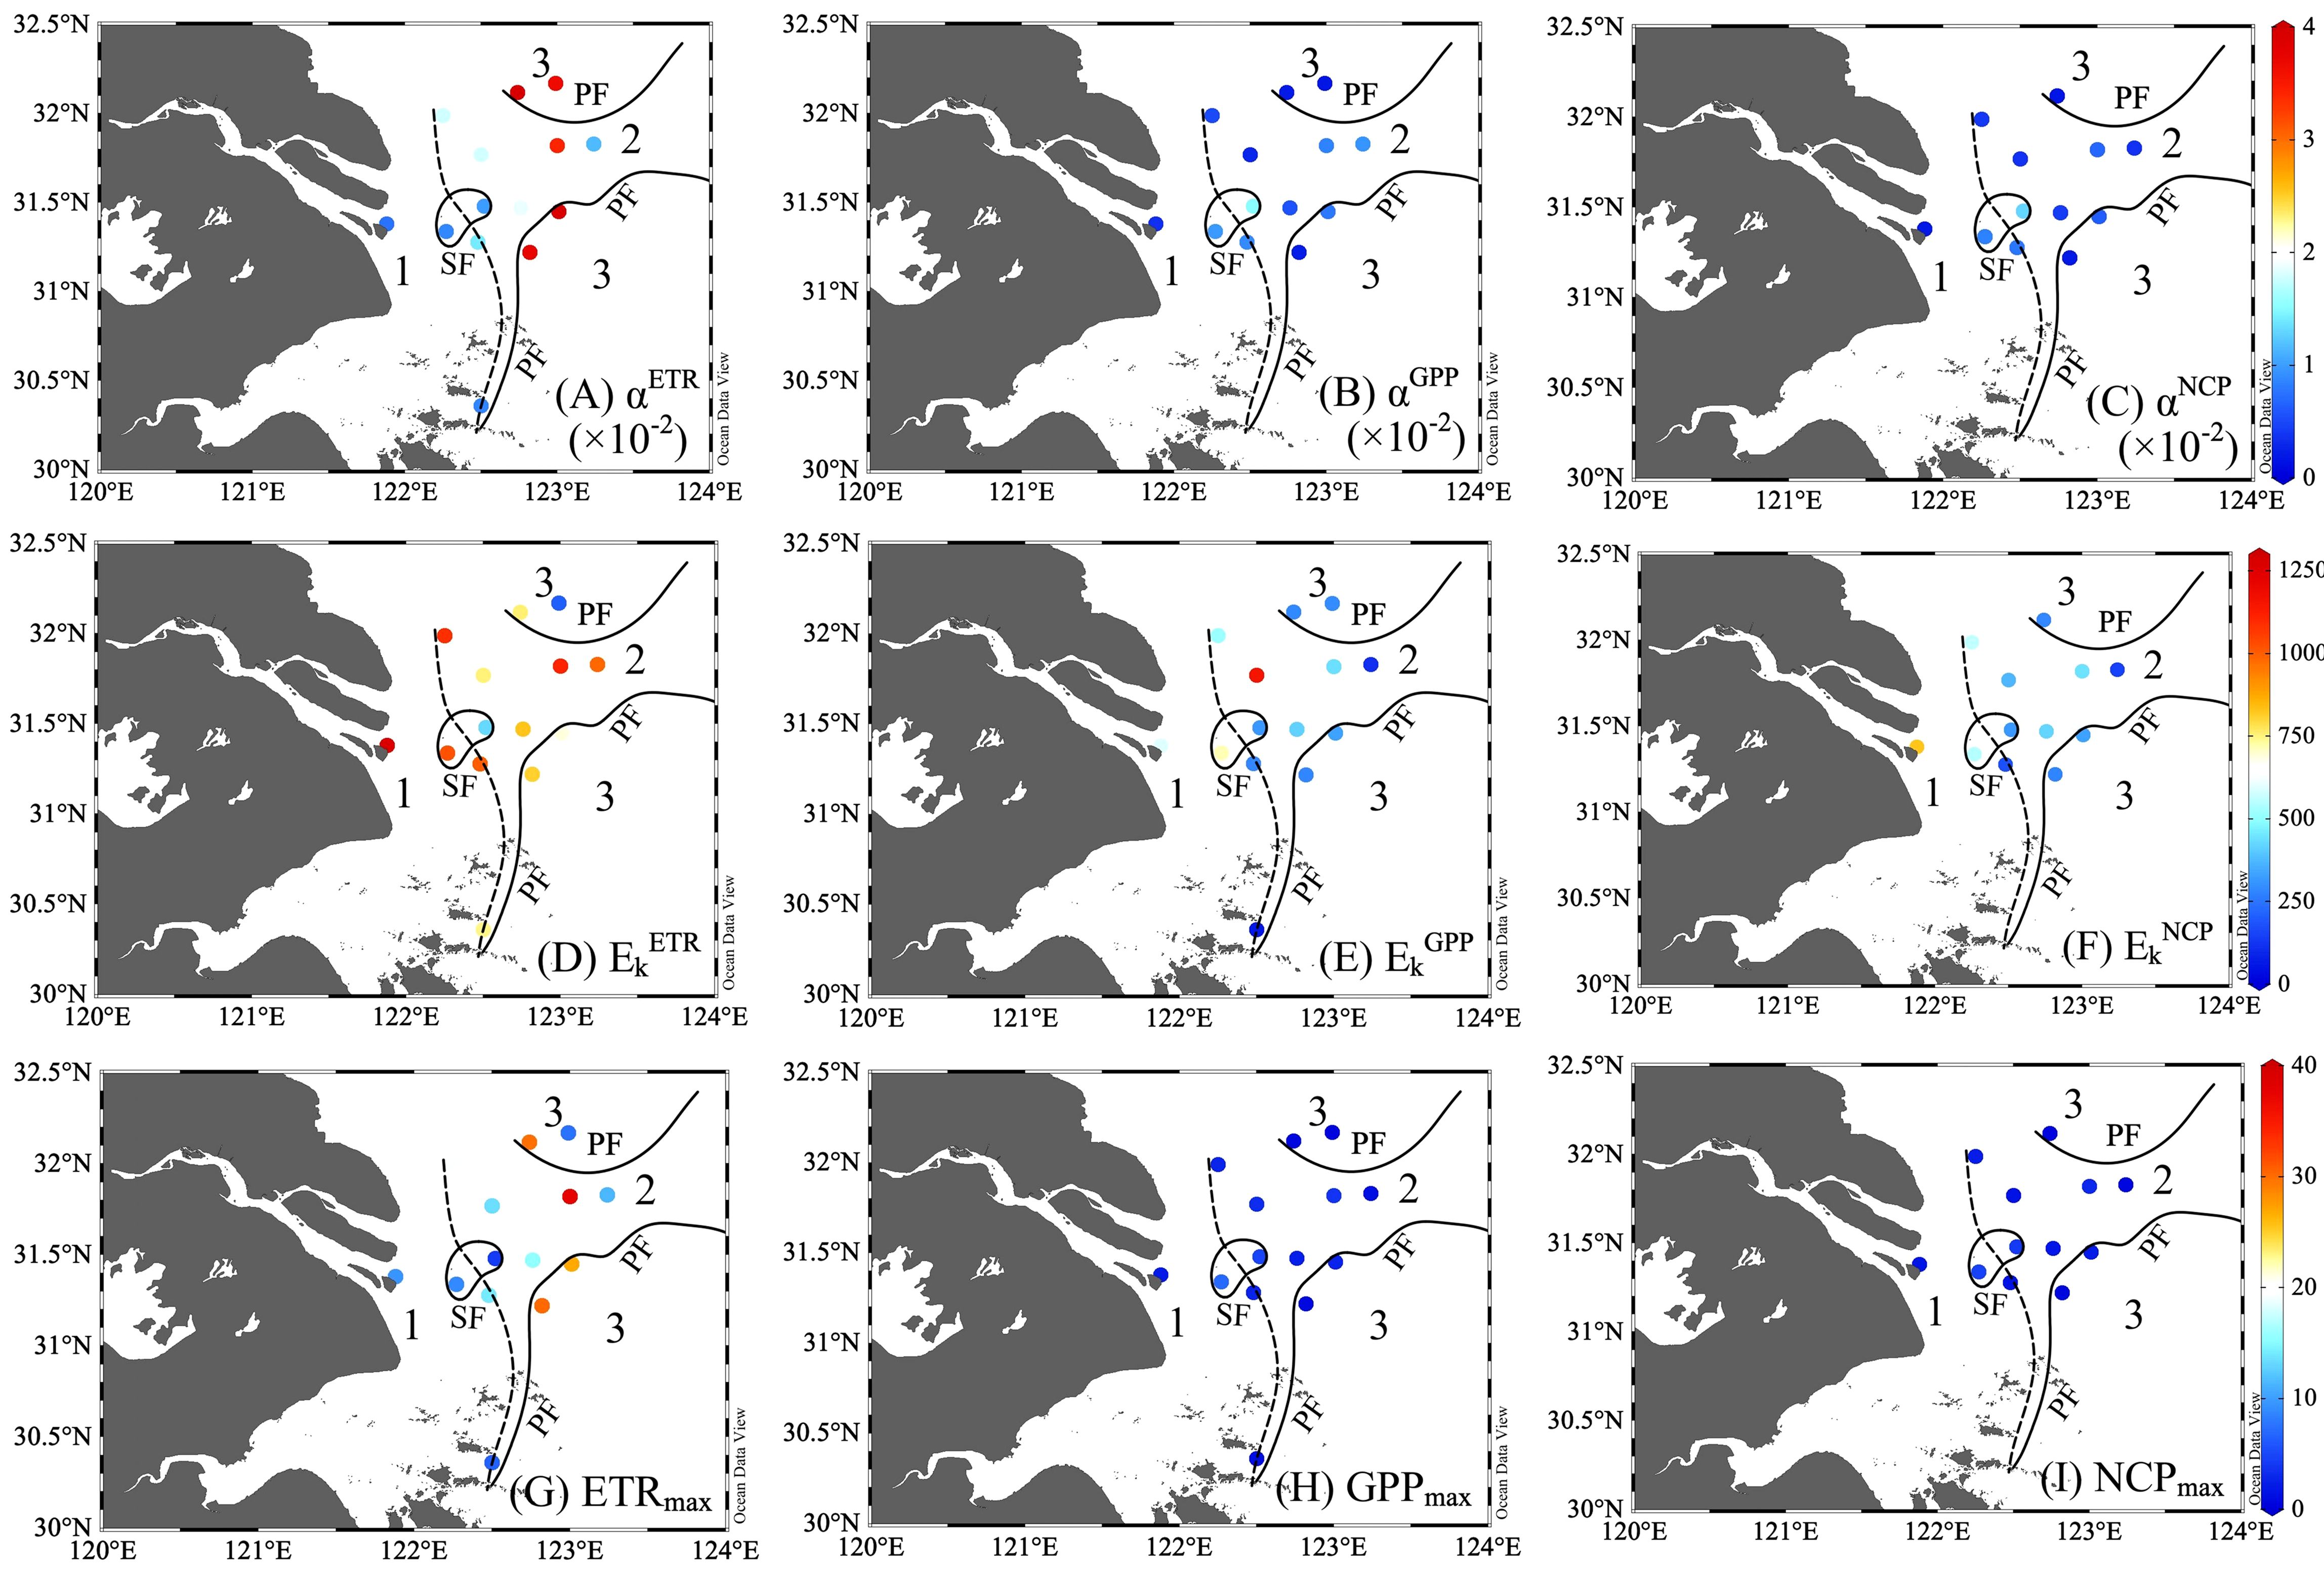
Figure 4 The photosynthetic parameters reflect the light-driven changes in productivity, including electron transport rates (ETR), gross primary production (GPP), and net community production (NCP). The upper panels are the initial slopes for ETR [αETR, mmol e- mg Chl a-1 h-1 (μmol photons m-2 s-1)-1, (A)], GPP [(αGPP, mmol O2 mg Chl a-1 h-1 (μmol photons m-2 s-1)-1, (B)], and NCP [αNCP, mmol O2 mg Chl a-1 h-1 (μmol photons m-2 s-1)-1, (C)]. The middle panel exhibited the light saturation irradiation of parameters ETR [EkETR, μmol photons m-2 s-1, (D)], GPP [EkGPP, μmol photons m-2 s-1, (E)], and NCP [EkNCP, μmol photons m-2 s-1, (F)]. The lower panels refer to the maximum of chlorophyll -normalized ETR [ETRmax, mmol e- mg Chl a-1 h-1, (G)], GPP [GPPmax, mmol O2 mg Chl a-1 h-1, (H)], and NCP [NCPmax, mmol O2 mg Chl a-1 h-1, (I)] at the light-saturated level. The study region was divided into three zones with sediment front (SF, the dashed line) and plume front (PF, solid lines).
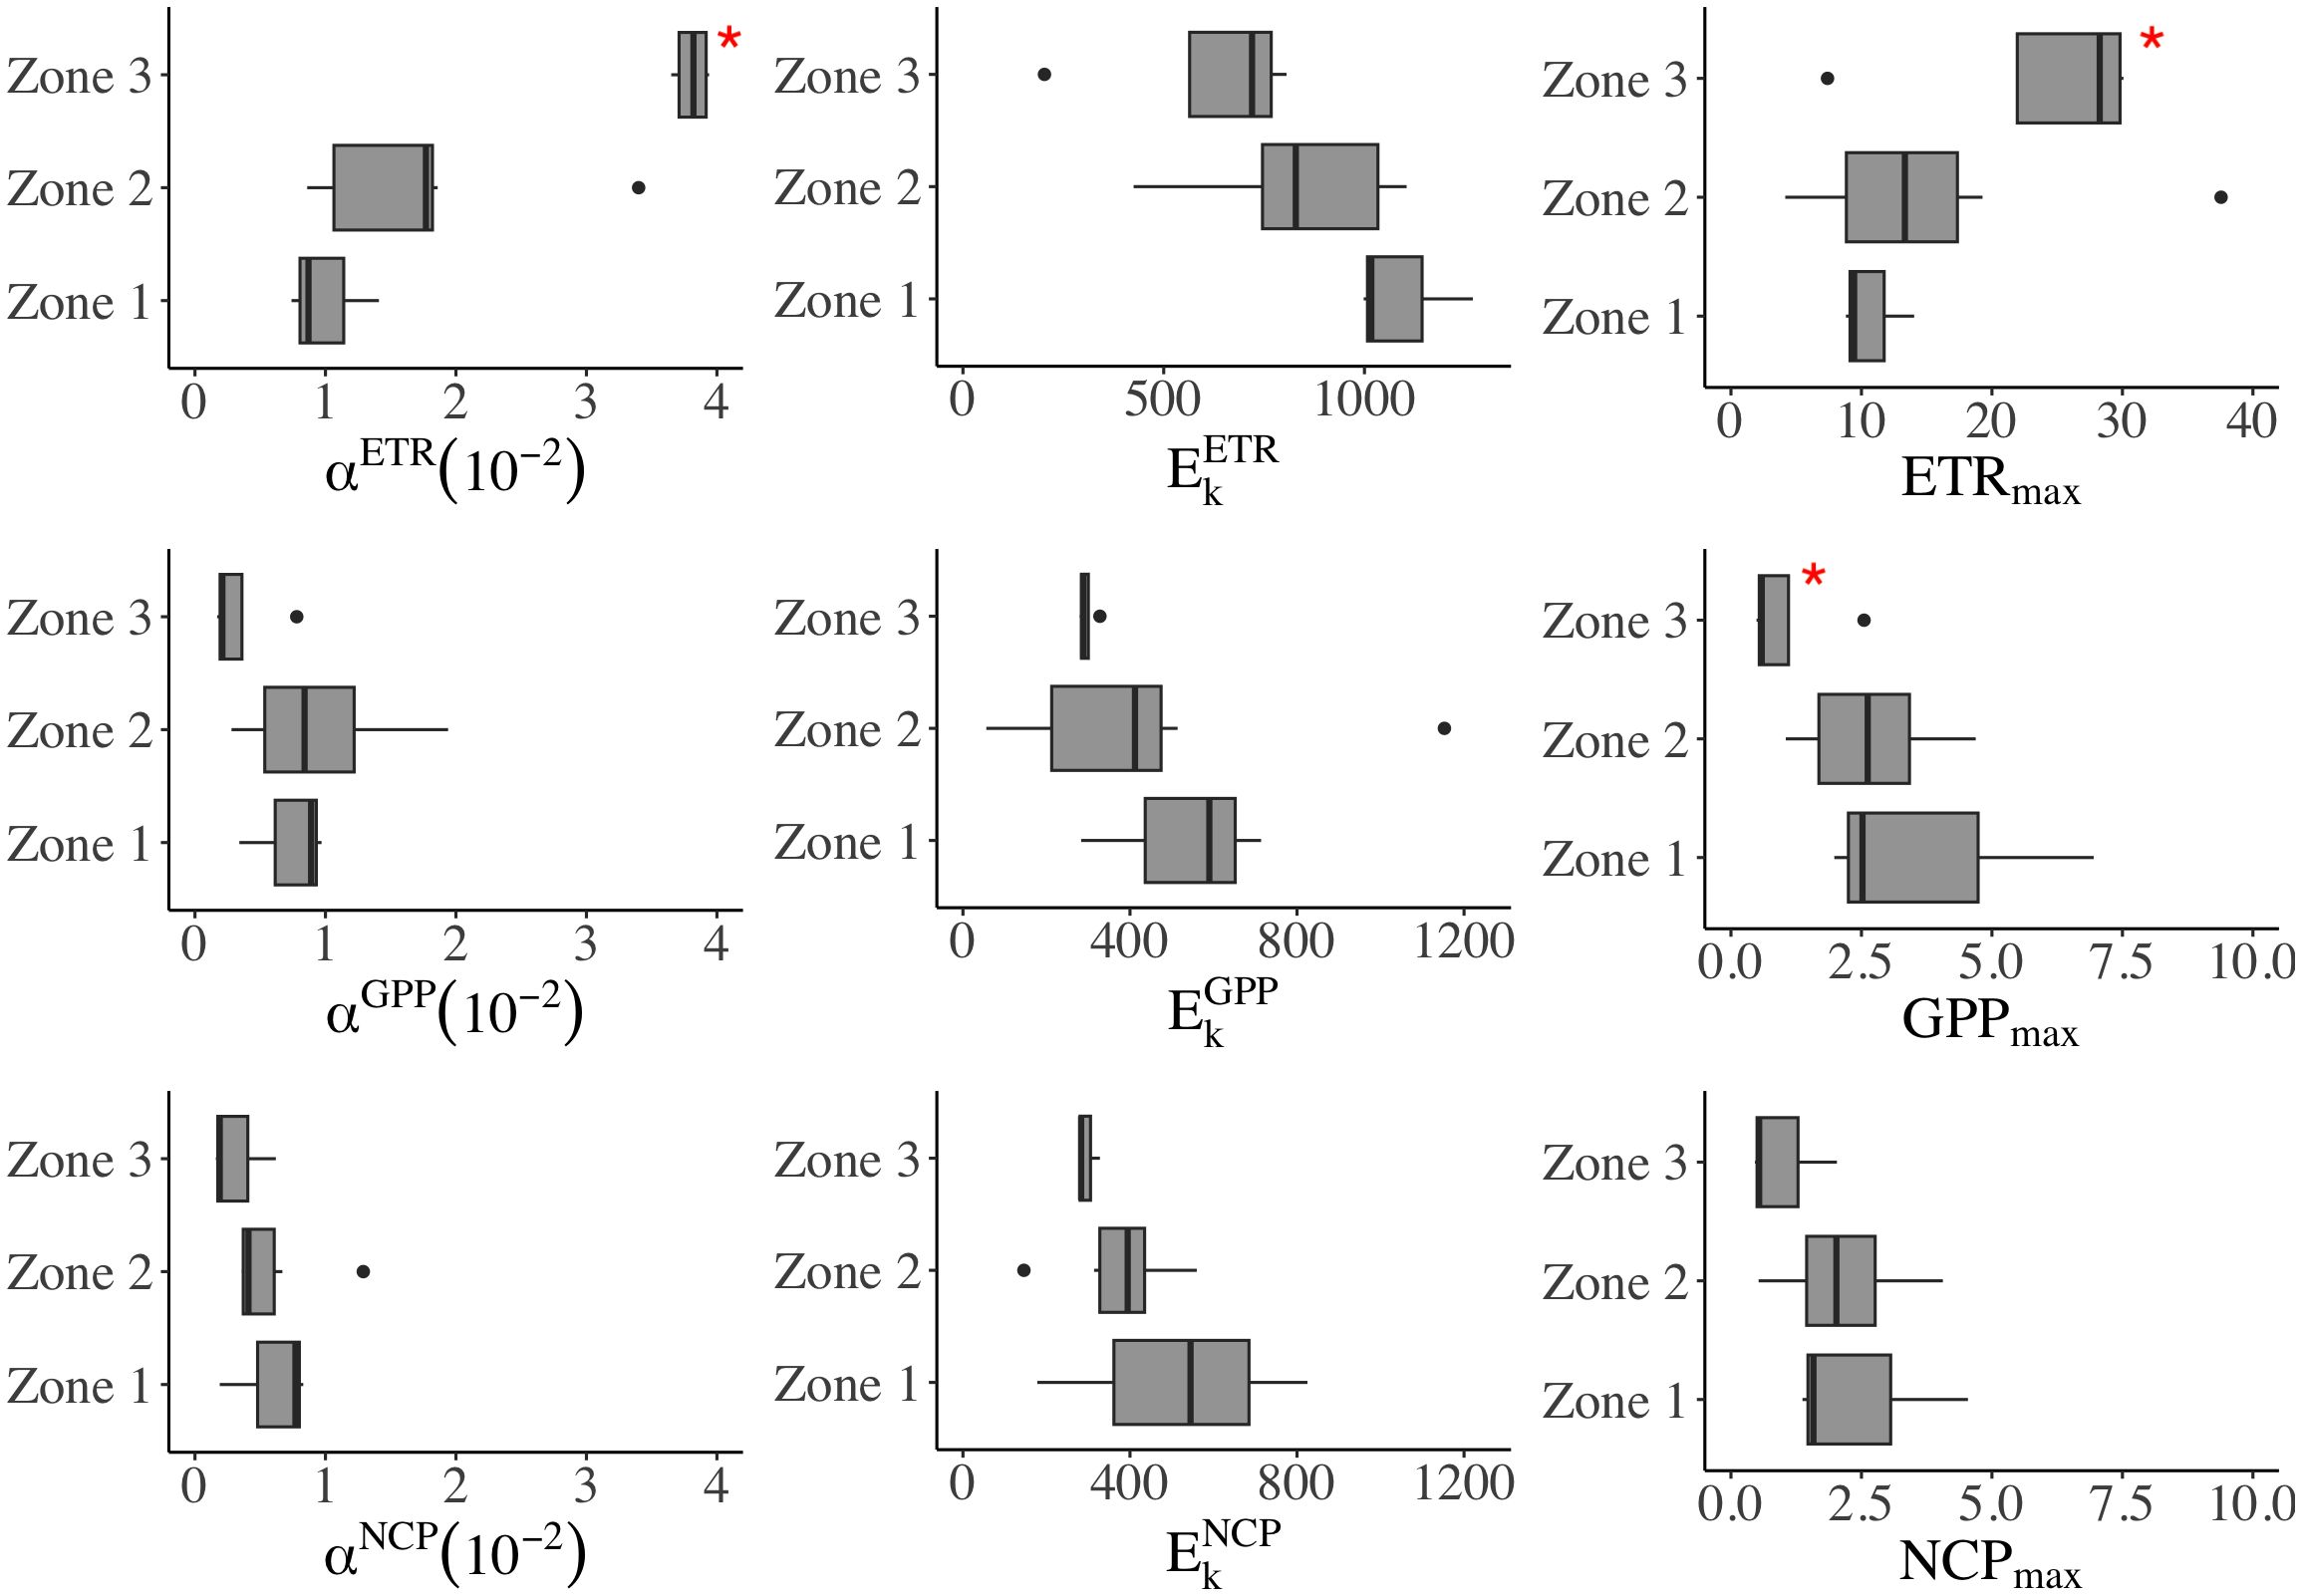
Figure 5 The regional difference of P-E parameters in three zones. In each boxplot, the central line represents the median, with the box extending to the 25th and 75th percentiles, respectively. The discrete points are outside the 95% confidence interval. *significant difference (p< 0.05, t-test).
The half-saturation Ek (μmol photons m-2 s-1) exhibited an offshore decreasing pattern (Zone 1>2>3, Supplementary Table 2). We found the maximum EkETR (1270) and EkNCP (825) at station B3 in TMZ, and the average lowest EkGPP (56) and EkNCP (146) in the river plume. However, in situ light increased offshore; thus, in Zone 3, we found E0 (276 μmol–351 μmol photons m−² s−¹) exceeded Ek (average: 296 ± 27 μmol photons m-2 s-1).
In contrast, Chl a-normalized ETRmax (mmol e− per mg Chl a per hour) increased offshore, with the highest observations in the sea and the lowest in light-limited water (Supplementary Table 2). ETRmax changed with Chl a (r = 0.73, p< 0.05); for example, the highest ETRmax (37.56) was observed at the Chl a maximum station of A2–4. The ETRmax was often enhanced with the increase of Chl a in plume water. Although GPPmax and NCPmax were lower than ETRmax, both exhibited similar spatial changes. The average GPPmax is highest in Zone 1 (3.81), followed by Zone 2 (2.65), and lowest in Zone 3 (1.06). NCPmax decreased from Zone 1 (2.50) to Zone 2 (2.15), and further dropped in Zone 3 (1.01).
3.5 The conversion factor
In the study region, the distribution of Chl a is well-correlated with ETR (R2 > 0.8), GPP (R2 > 0.7), and NCP (R2 > 0.7) (Supplementary Figure 1). Ratios of NCP/GPP ranged from 0.49 to 0.94, with an average of 0.77.
The positive correlations of ETR vs. GPP (r = 0.88) and ETR vs. NCP (r = 0.91) suggest the likelihood of establishing conversion factors—a connection between total electron production and oxygen production. Conversion factors (mol e- per mol O2 production) varied within a range of 0.8–31.8 for ΦGPP and 0.9–36.9 for ΦNCP (Figures 6, 7 and Supplementary Table 2). From the river mouth to the CDW (Zones 1 and 2), the ranges of ΦGPP and ΦNCP were 0.8 mol e–6.6 mol e- per mol O2 production and 0.9 mol e–12.7 mol e- per mol O2 production, with averages of 3.9 mol e- and 5.6 mol e- per mol O2 production, respectively. In Zone 3, ΦGPP (6.9 mol e–31.8 mol e- per mol O2 production) and ΦNCP (8.7 mol e–36.9 mol e- per mol O2 production) were significantly higher (p< 0.05) and more variable than the rest of the area. The lowest ΦGPP and ΦNCP were both located in the surrounding upwelling.
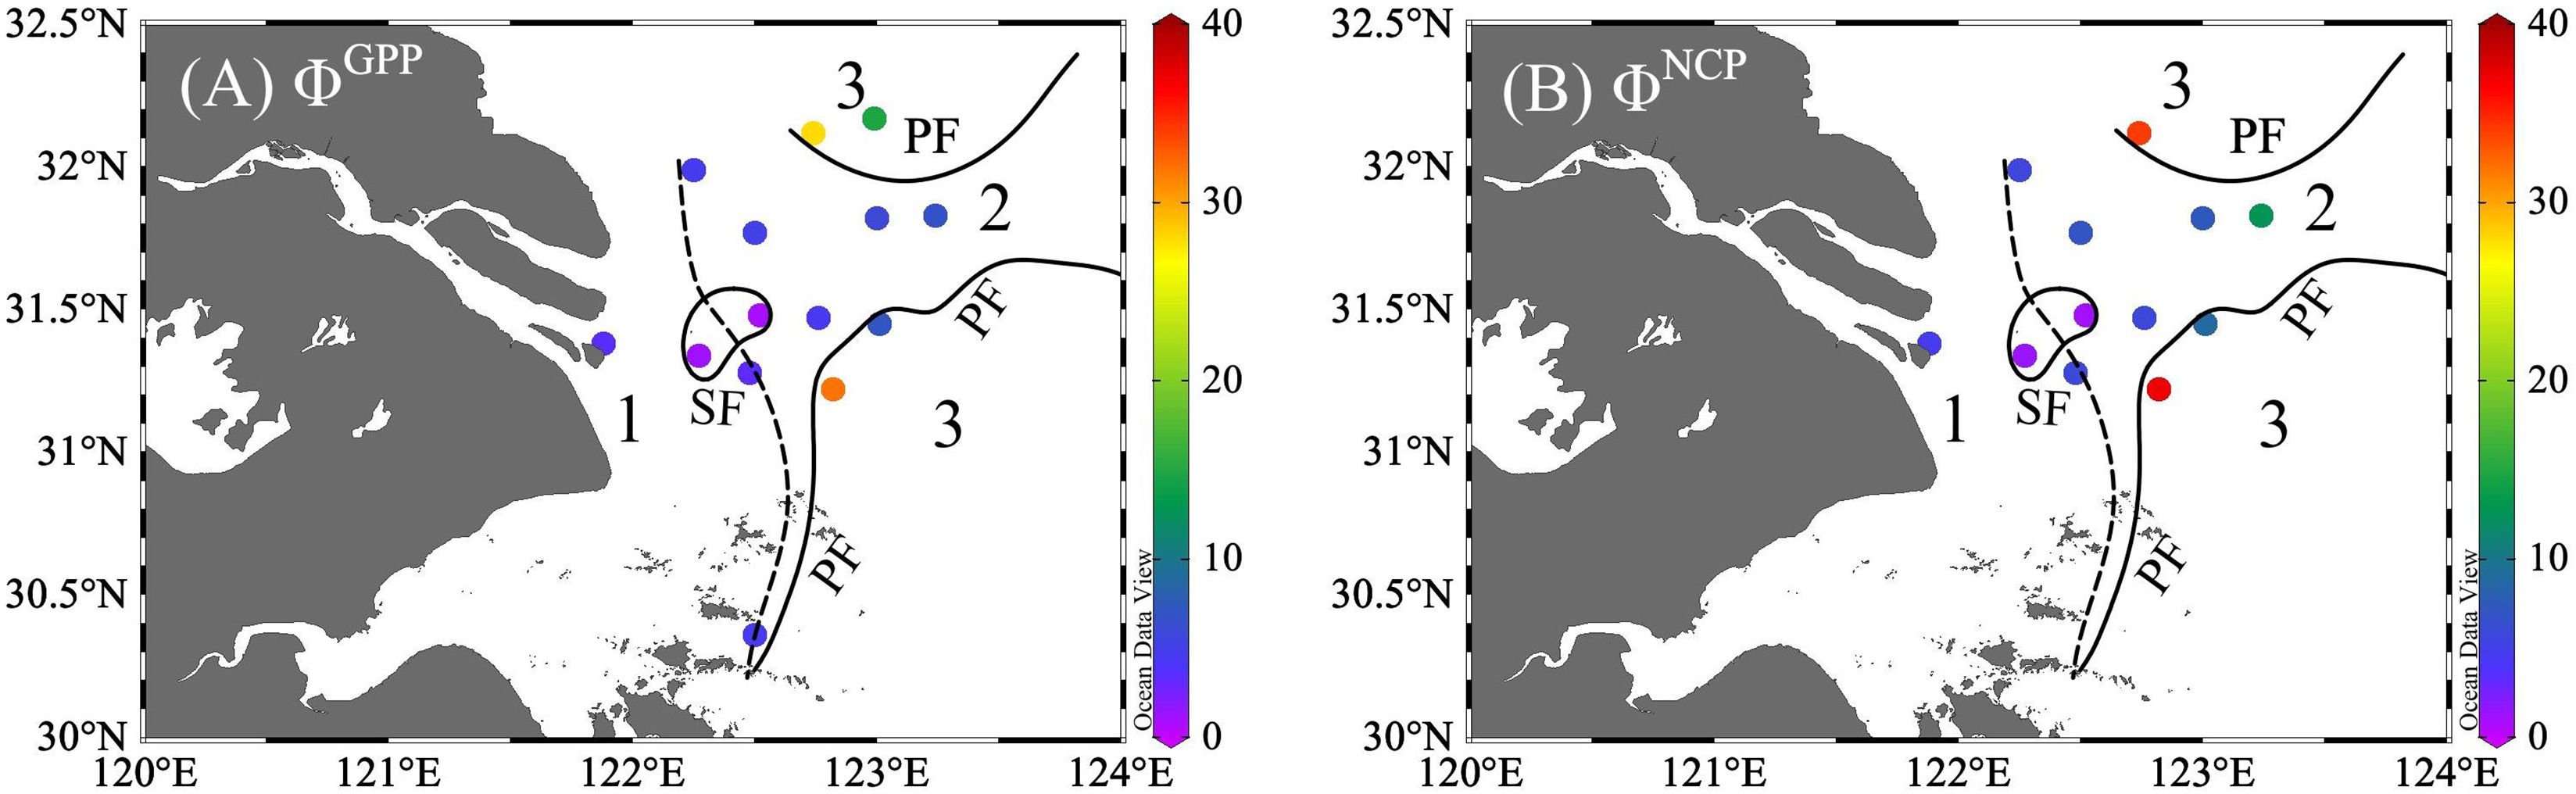
Figure 6 Distribution of the photosynthetic conversion factors of ETR vs. GPP (ΦGPP, A) and ETR vs. NCP (ΦNCP, B). unit: mol e- per mol O2 production. The study region was divided into three zones with sediment front (SF, the dashed line) and plume front (PF, solid lines).
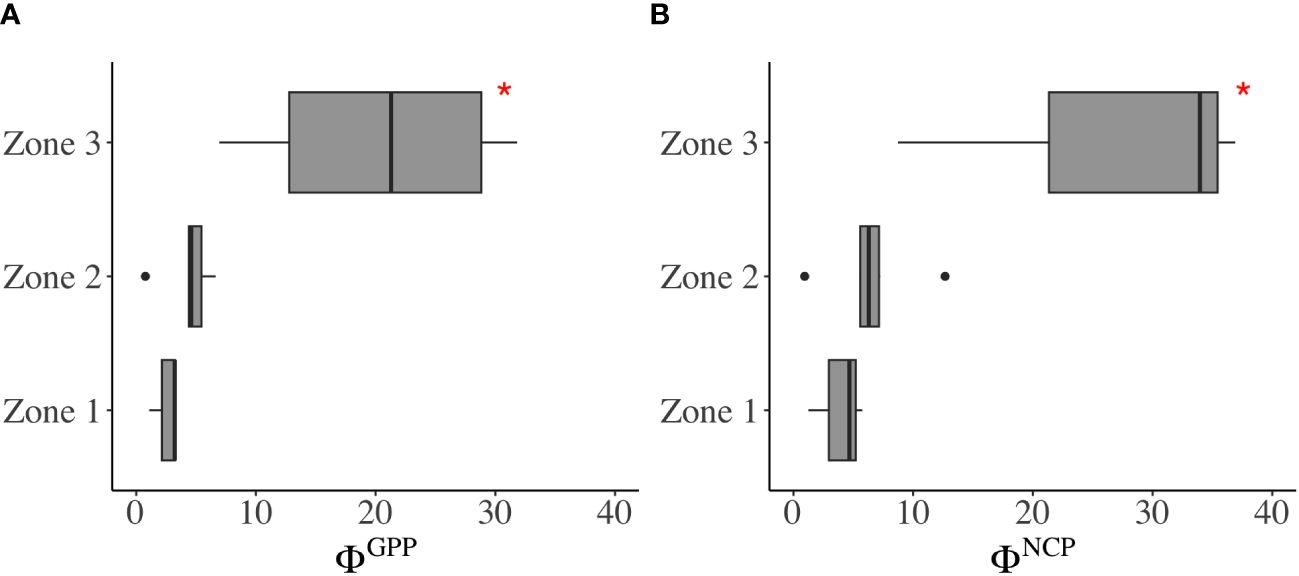
Figure 7 Variability of the photosynthetic conversion factors (A) ΦGPP and (B) ΦNCP in Zones 1, 2, and 3. In each boxplot, the central line represents the median, with the box extending to the 25th and 75th percentiles, respectively. The discrete points are outside the 95% confidence interval. *significant difference (p< 0.05, t-test).
Conversion factors changed tightly with the photosynthetic parameters (Supplementary Figure 2). ΦGPP was well-correlated with ΦNCP (r = 0.99, p< 0.01), and both had positive relationships with αETR (r > 0.6) and ETRmax (r > 0.5), respectively. αGPP, αNCP, GPPmax, and NCPmax were negatively correlated with the conversion factors. However, Ek played a smaller role in regulating ΦGPP and ΦNCP. Additionally, the light responses of photosynthesis metabolism were tightly associated, as evidenced by the correlation coefficients of αGPP vs. αNCP (r = 0.91) and GPPmax vs. NCPmax (r = 0.94, p< 0.01), and both α and Pmax increased with nutrient availability (r > 0.3).
The assessment of the correlation between ΦGPP, ΦNCP, and NPQNSV revealed electron acquisition for production and alternative electron pathways. Positive regressions were observed between ΦGPP and NPQNSV (ΦGPP = 9.52 NPQNSV – 3.28, R2 = 0.575, p< 0.01, Figure 8A) and also between ΦNCP and NPQNSV (ΦNCP = 38.3 NPQNSV – 25.3, R2 = 0.711, p< 0.01, Figure 8B). However, these correlations presented a form of discrete points in saline Zone 3 with high Φ values (S > 26; approximately 40% of the data in Zone 3 were in a discrete state).
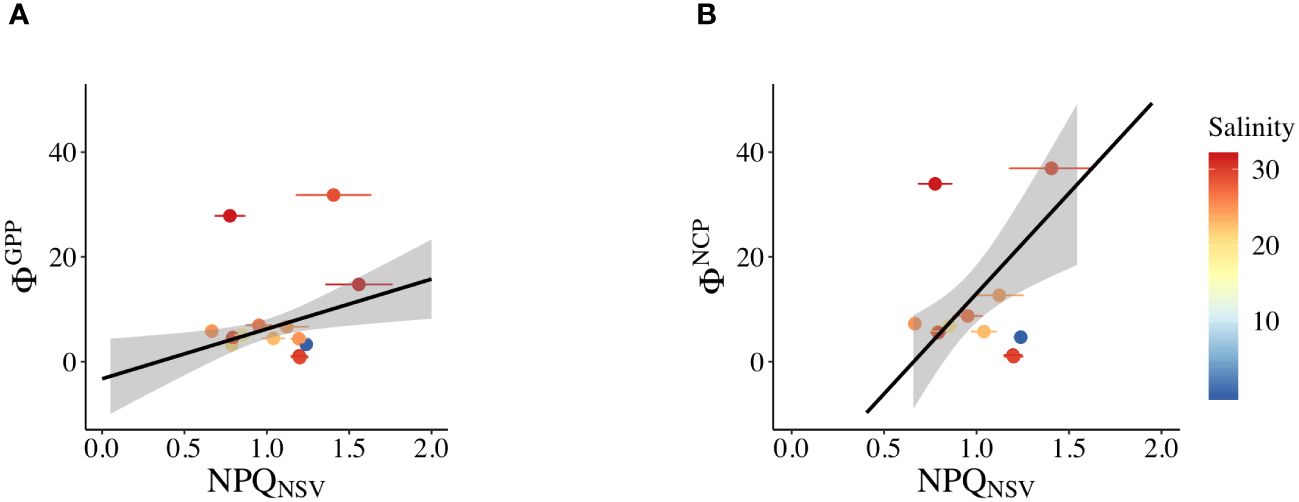
Figure 8 Linear relationship in the study regions of (A) NPQNSV and ΦGPP and (B) NPQNSV and ΦNCP. Salinity values are indicated in each area: Zone 1: S< 15; Zone 2: 15< S< 26; and Zone 3: S > 26.
3.6 Environmental regulation on conversion factors
In this highly dynamic ecosystem, water properties, nutrient availability, and light limitations may induce different photosynthetic responses in oxygen production and electron requirements. In the Pearson correlation heatmap for the linkage of conversion coefficients with environmental factors (Figure 9), ΦGPP and ΦNCP were positively related to Zeu (r > 0.4) and salinity (S, r > 0.3), while they negatively correlated with nutrients (N, P, Si, r< -0.3), optical attenuation coefficient (Kd, r< -0.4), and surface light intensity (E0, r< -0.1). Although temperature is not significantly related to ΦGPP, temperature increases photosynthesis efficiency Fv/Fm (r = 0.72, p< 0.01). To quantify the linkages of ΦGPP and ΦNCP with environmental dependency, multiple linear regression was applied to find the environmental dependency of ΦGPP (=194.4–13.5Kd+3.5Zeu-7.8T-156.7P+3.5N/P, R2 = 0.90) and ΦNCP (=224.3–17.6Kd +3.7Zeu-8.8T-184.5P+4.2N/P, R2 = 0.87) (Table 1).
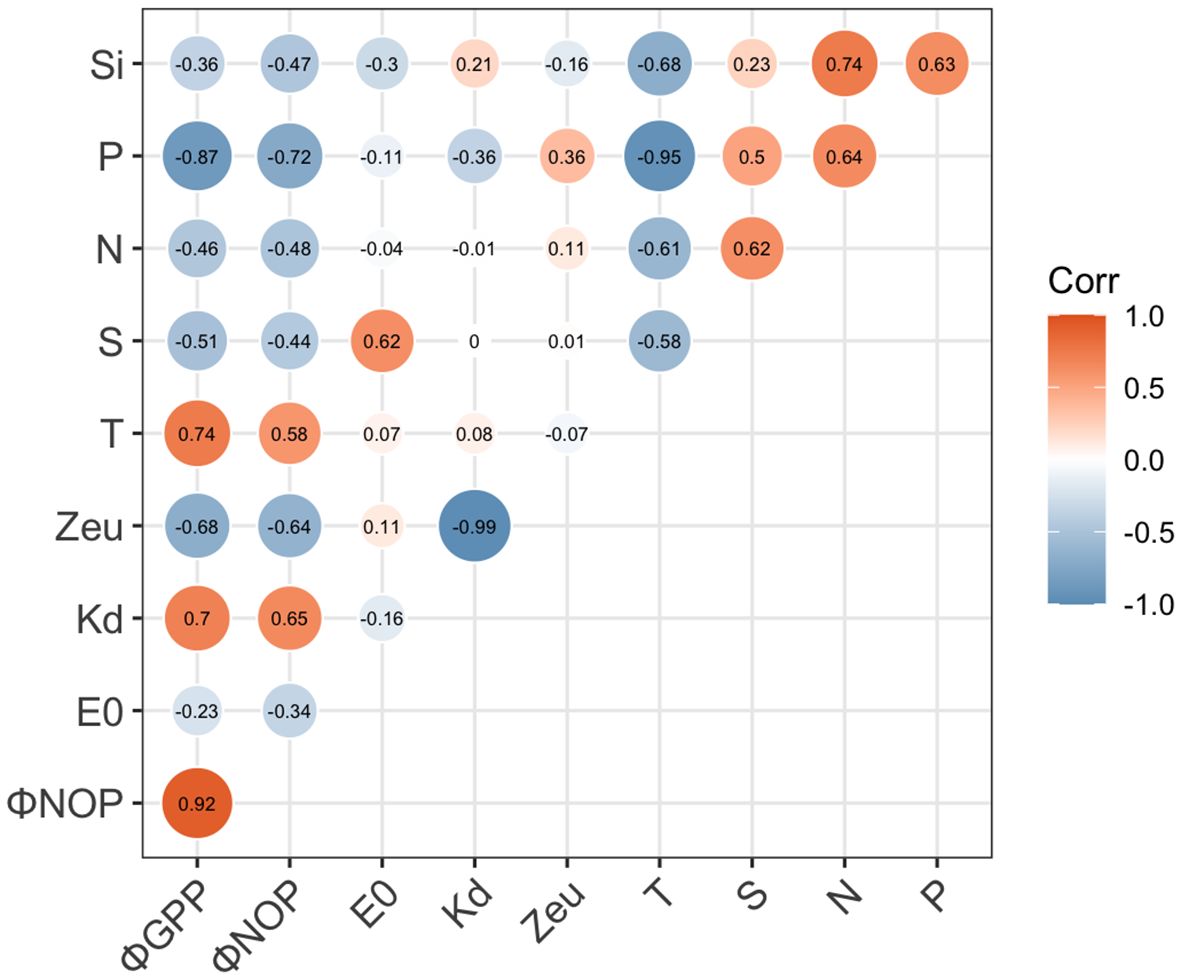
Figure 9 Matrix of Pearson’s linear correlation among ΦGPP, ΦNCP, and in situ environmental factors. In situ environmental factors include surface irradiance (E0), attenuation coefficient (Kd), euphotic layer depth (Zeu), temperature (T), salinity (S), and nutrients (N, P, and Si). The strength of the linear relationship between each pair of variables is indicated by the color of the square, with significant relationships (p< 0.05) denoted by “1” or “-1” for significant positive and negative relationships, respectively.
4 Discussion
Nutrients, suspended particles, and light availability ultimately create a diversity of ecological habitats and affect the spatial distribution and physiological status of phytoplankton (Li et al., 2021, 2023). As an indicator of physiological status, Fv/Fm is sensitive to nutrient availability and phytoplankton community (Suggett et al., 2009b; Arrigo et al., 2010; Tan et al., 2019; Singh et al., 2022). Our Fv/Fm measurements taken at the surface generally reflected regional differences. In turn, the physical and biogeochemical status regulated phytoplankton physiology and production, as evidenced by the positive relationship between our Fv/Fm, Chl a, and productivity of ETR, GPP, and NCP (r > 0.65, Supplementary Figure 2). According to the average in situ irradiance during incubation, GPP (0.367 mmol O· m−³ h−¹–3.381 mmol O· m−³ h−¹) and NCP (0.348 mmol O· m−³ h−¹–2.926 mmol O· m−³ h−¹, Supplementary Figure 1) fell within the range of previous production rates of C-fixation, oxygen mass balance, and nutrient removal from the Changjiang River to the East China Sea (Gong et al., 2006; Hung et al., 2013; Wang et al., 2014; Jiao et al., 2018; Wang et al., 2019).
4.1 Phytoplankton responses to regional features
4.1.1 Tidal freshwater river mouth (Zone 1)
Dissolved inorganic nutrients were abundant in the tidal freshwater of the Changjiang River estuary due to riverine delivery, which was particularly enhanced by increased discharge during the wet summer season (Chen et al., 2009). Moreover, internal nutrient cycles, such as the remineralization of organic matter and desorption of DIP from particles, improved nutrient availability for phytoplankton growth (Shen, 2008). However, suspended particles and sediment resuspension under tidal influence created light limitations in the sediment maximum zone. Phytoplankton abundance was low, and photosynthetic activities (Fv/Fm) as well as production (GPP, NCP, and ETR) were constrained.
4.1.2 Plume region with upwelling impacts (Zone 2)
After passing through the sediment front, phytoplankton production of GPP, NCP, and ETR increased along the expansion of CDW (Zone 2), where light limitation was alleviated. Although the high N:P and Si:P ratios (>18) suggested potential P limitation (Wu et al., 2014; Wang et al., 2018), the relatively P-rich bottom water might be lifted by upwelling to the euphotic zone, thus easing P limitation. This is consistent with the Ekman transport of CDW during the summer monsoon and the intrusion of the TWC upwelling along the Changjiang submarine river valley (Li et al., 2023). The upwelling might persistently replenish NH4 in the euphotic layer from the bottom water, leading to high [NH4+] >30 μmol L−¹) penetrating into the surface (Supplementary Figure 3).
The greenbelt of phytoplankton along the east side of the upwelling grew in suitable light and nutrients (Yang et al., 2005), where Chl a, Fv/Fm, and productivity reached their maximum. The elevated Fv/Fm values (> 0.45) indicated favorable conditions regarding light and nutrient supply. These Fv/Fm observations were similar to previous reports of 0.48–0.62, where diatoms bloomed in the CDW during the summer of 2020 (Li et al., 2023).
The NCP/GPP ratios reflect the turnover of gross primary production to net autotrophic production (Palevsky et al., 2016). Our NCP/GPP ratios in the plume region (average: 0.78 in Zone 2) were the highest among offshore seawater and turbid river mouths, suggesting high efficiency of oxygen turnover rates in these optimal habitats.
4.1.3 The ocean side (Zone 3)
The nutrient levels further decreased in the seawater, particularly in samples taken from stations with relatively high Chl a), where nutrient assimilation likely further reduced dissolved nutrient concentrations in the water column. Although the concentrations of N and Si were above the thresholds for N limitation (1µmol L-1) and Si limitation (2 µmol L-1) (Nelson and Brzezinski, 1990; Yang et al., 2005) the ratios of N:P (> 16) and P concentration (< 0.1 µmol L-1) indicated absolute P limitation (Nelson and Brzezinski, 1990).
Irradiance in Zone 3 (317 μmol photons m-2 s-1) was generally close to or even higher than the saturation levels for EkGPP and EkNCP (296 μmol photons m-2 s-1) (Supplementary Table 2). This absolute P limitation, associated with light oversaturation, might have a negative effect on photosynthesis efficiency (Fv/Fm< 0.40), suppress electron supply, restrict oxygen production, and reduce phytoplankton abundance.
4.2 Physical and biological drivers on ΦGPP and ΦNCP
When applying the O2: CO2 stoichiometry of 1.4 given by Laws (Laws, 1991), the ETR to CO2 fixation ratios [electron requirement for carbon fixation (Φe: C)] ranged from 0.6 to 22.7 mol e- per mol C production for GPP and from 0.6 to 26.4 for NCP. These observations were similar to the previous results (Table 2).
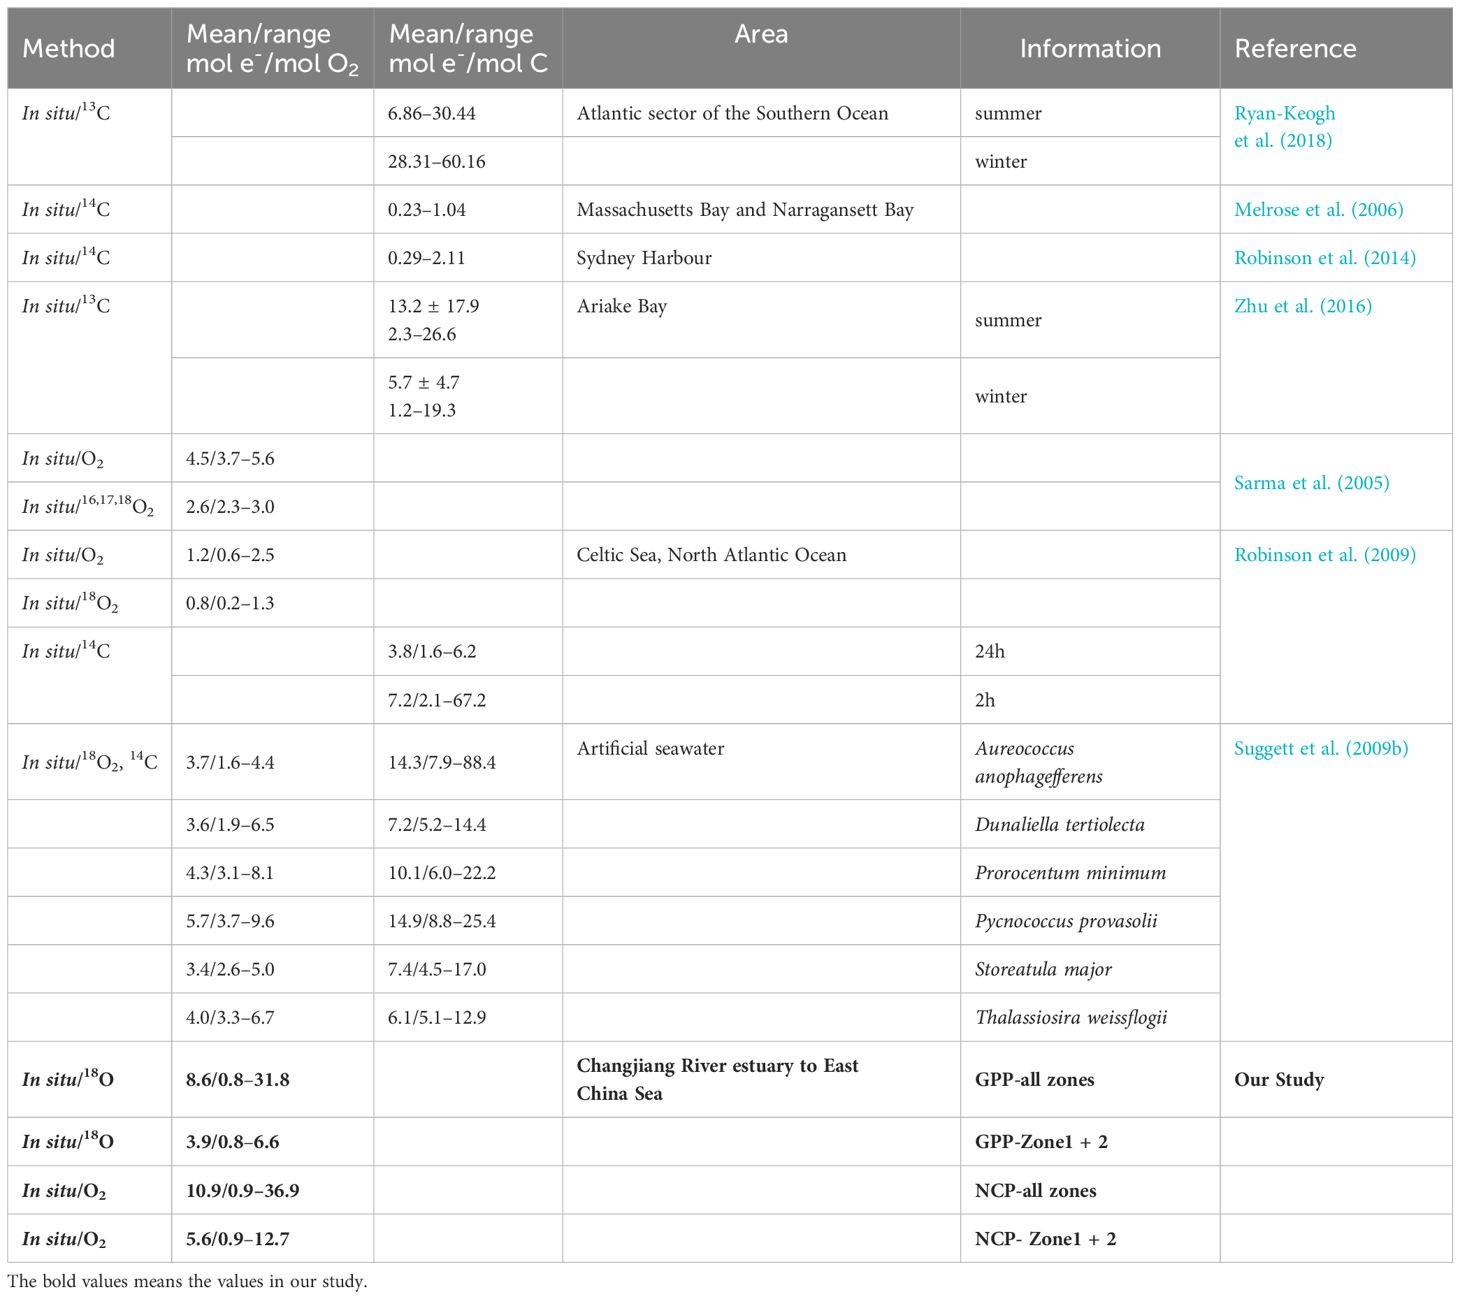
Table 2 Summary of mean values or ranges in previous research and our study.
It is well accepted that there is a tight linkage between ETR and biological oxygen production, whether calculated from GPP or NCP (Genty et al., 1989) Photosynthetic electron transfer begins with light absorption, which splits water in PSII reaction centers (RCIIs), requiring a minimum of 4 electrons per molecule of O2 (Kolber and Falkowski, 1993; Suggett et al., 2010). However, a portion of electrons is consumed in subsequent physiological processes, such as chlororespiration, the Mehler ascorbate peroxidase reaction, the nitrogen reductase cycle, and photorespiration (Suggett et al., 2009a).
In the studied regions, diatoms dominated the phytoplankton community from the river mouth to the plume region, while the proportion of dinoflagellates gradually increased in the offshore seawater. Cyanobacteria accounted for only 8%–10% at the river-end station and< 12% in the offshore seawater station influenced by the Kuroshio current (Li et al., 2023). During the 1960s–2000s, within the core upwelling area, diatom proportions increased by 40% and dinoflagellate proportions decreased by 17%, often leading to diatom dominance (Peng et al., 2023). Therefore, the deviation of Φ from the theoretical ratio raised questions about how physical and biological drivers modulate phytoplankton production and how to quantify the relationship between electron turnover and oxygen production along the estuary. Here, we discussed the impacts of nutrient availability, light, and phytoplankton community structure on Φ in the nutrient-rich CDW, NH4+-rich upwelling region, and P-limited seawater, respectively.
In nutrient-replete CDW (Zones 1 and 2; Shi et al., 2014; Li et al., 2023), Fv/Fm values indicated healthy growing conditions. Except for the upwelling region, the average ΦGPP (3.9 mol e− per mol O2 production, n = 10) was near the theoretical ratio. This result was slightly higher than the reported range of 2.3 mol e−–3.0 mol e− per mol O· production in Sagami Bay, where diatoms grew in silicate -sufficient water (Sarma et al., 2005) ΦGPP values are also close to the range of 3.4 mol e−–5.7 mol e− per mol O· production observed in six microalgal classes (Chlorophyceae, Prasihyceae, Cryptophyceae, Pelagophyceae, Bacillariophyceae, and Dihyceae) under nutrient-replete conditions (Suggett et al., 2009a). Similarly, the average ΦNCP (5.6 mol e− per mol O· production) approached the summer field observation (average: 4.5 mol e- per mol O2 production) in Sagami Bay (Sarma et al., 2005). The optimal conversion factor in this case may benefit from sufficient riverine nutrients.
In the upwelling region, the lowest ΦGPP value (0.8 mol e− per mol O· production) and ΦNCP (0.9 mol e− per mol O2 production) were found at station A3–2 (Melrose et al., 2006; Robinson et al., 2009, 2014). This was similar to the low observation of 0.8 mol e− per mol O2 production during diatom-dominant blooms in the Celtic Sea, North Atlantic Ocean (Robinson et al., 2009). These low Φ values might be attributed to diatom dominance and NH4+ enrichment from upwelling (Raateoja et al., 2004; Estevez-Blanco et al., 2006; Suggett et al., 2006a; Suggett et al., 2009a; Hughes et al., 2021). Hughes et al. (2021) found a lower Φe: C in diatoms than the theoretical value during the nutrient-replete state, and Suggett et al. (2009a) found that diatoms usually have relatively lower Φe: O compared to dinoflagellates. Diatoms express a higher NPQ ability through an energy-dependent mechanism (qE) that diverts excess excitation energy away from PSII before it enters the electron transport chain (Hughes et al., 2018a), which could lower Φ values.
Additionally, phytoplankton only consume 2 mol electrons to assimilate 1 mol NH4+, while the assimilation of NO4− requires an additional 8 mol electrons to be converted to NH4+ (Hughes et al., 2018a). As illustrated in Figure 10, upwelling continuously delivers NH4+ from the bottom water to the surface, and this NH4-N enrichment reduces the electron requirement and Φe: O (Melrose et al., 2006).
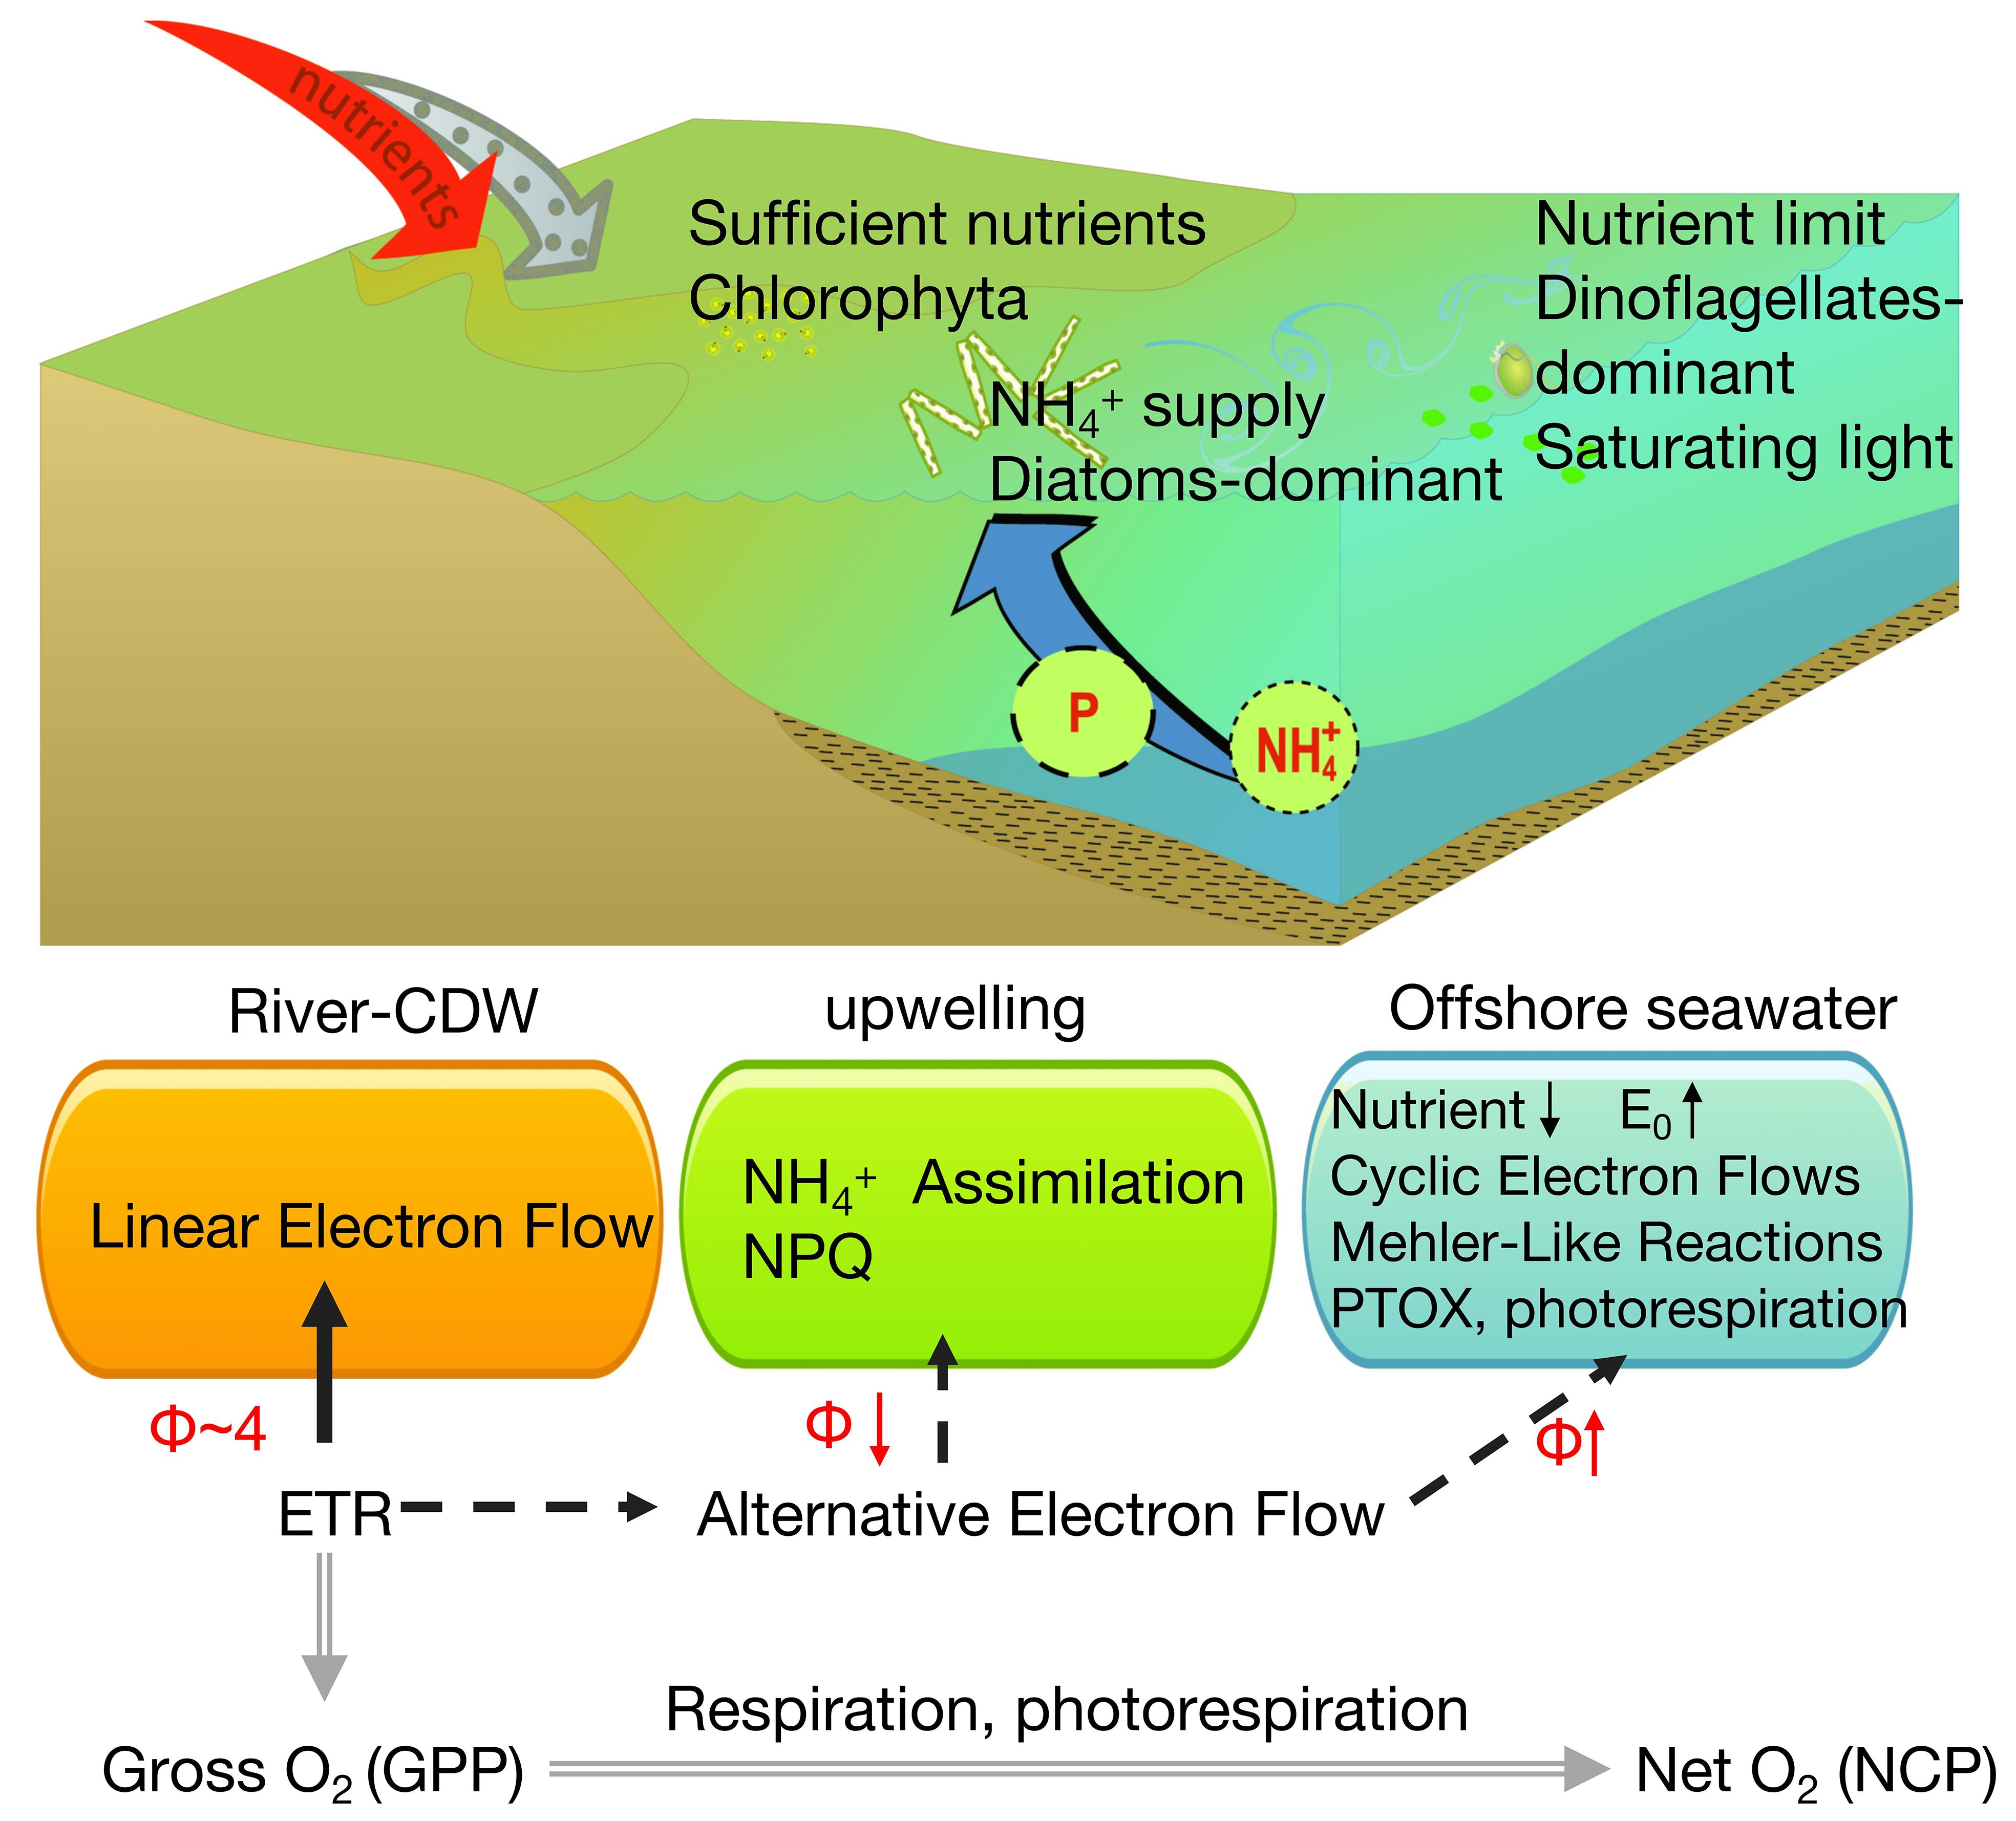
Figure 10 Conceptual summary highlighting the fluxes of the two major photosynthetic currencies in this study: electrons (ETRPSII − black lines) and oxygen (double gray lines). Major and minor electron pathways are indicated by solid and dashed lines, respectively.
In the offshore seawater (Zone 3), ΦGPP (6.9 mol e−–31.8 mol e− per mol O2 production) and ΦNCP (8.7 mol e−–36.9 mol e− per mol O2 production) were significantly higher than in the rest of the region (p< 0.05). High conversion factors for ETR and carbon fixation rates have been reported in nutrient-limited regions such as the North Pacific (Lawrenz et al., 2013) and the summer Southern Ocean (Ryan-Keogh et al., 2018), attributed to a combination of nutrient limitation and high-light stress in surface waters. Similarly, high ΦGPP values were observed under photoinhibition (up to 20 mol e− per mol O2 production) in the Gulf of Thailand, with ΦGPP increasing with irradiance from 130 μmol photons m-2 s-1 to 1,000 μmol photons m-2 s-1 (Mino et al., 2013).
The observed P limitation, coupled with reductions in N and Si, restricted the physiological activity of phytoplankton and increased ΦGPP and ΦNCP (Supplementary Figure 4). These changes reduced the efficiency of electron utilization via photorespiration, chlororespiration through a plastid terminal oxidase (PTOX), and the Mehler reaction (Lawrenz et al., 2013) (Figure 10). Additionally, the increase in Φ is due to the regulation of photoprotection mechanisms that prevent the accumulation of photoelectrons. Electrons are dissipated through alternative electron flows, such as the Mehler reaction and terminal oxidases (Mehler, 1957; Badger et al., 2000; Bailey et al., 2008; Cardol et al., 2008; Ryan-Keogh et al., 2018). Moreover, dinoflagellates, the dominant phytoplankton group in Zone 3, were often characterized by higher conversion factors, with Φe: O ranging from 3.1 mol e− to 8.1 mol e− per mol O2−1 (Suggett et al., 2009a) and Φe: C up to 10.7 mol e− per mol C (Hughes et al., 2021). Although cyanobacteria accounted for only 8%–10% at the river-end station and< 12% at the offshore seawater station influenced by the Kuroshio Current (Li et al., 2023), flavoprotein-mediated pseudocyclic flows within cells can facilitate electron flow and increase Φe: O as well (Hughes et al., 2018a).
4.3 The relationship between Φ and NPQ: limited predictive capability
The NPQNSV is mechanistically linked to energy-dependent non-photochemical quenching processes. These processes consume excess electrons, serve as high-light protectors, and induce alternative electron pathways, all of which increase electron demands in oxygen production. Thus, NPQNSV is typically positively related to Φe: C, sometimes normalized by nRCII (chlorophyll-normalized number of reaction centers) as Φe: C/nRCII (Schuback et al., 2015, 2017; Ryan-Keogh et al., 2018; Hughes et al., 2018c). For example, linear regressions have been reported as Φe: C= 1.19 NPQ + 0.22 (R2 = 0.2, p< 0.001) or Φe: C/nRCII =5932.31 NPQNSV – 13070.25 (R2 = 0.7, p< 0.001) in the austral summer of the Southern Ocean (Ryan-Keogh et al., 2018). Hughes et al. (2018c) confirmed the feasibility of using NPQNSV as a predictor of Φe: C in Australian coastal waters from December to February, though the relationship varied with monthly examinations due to the seasonal differences in phytoplankton communities and their physiological responses to environmental changes. Additionally, a large spatial variation in slopes (2.34–12.2) was reported (2.34–12.2) in the coastal subarctic Northeast Pacific Ocean (Schuback and Tortell, 2019). Our predictions of Φ derived from NPQ had a significant degree of uncertainty. These quantitative relationships (ΦGPP = 9.52 NPQNSV – 3.28, R2 = 0.58; ΦNCP = 38.3 NPQNSV – 25.3, R2 = 0.71, Figure 8) explained 58% and 71% of the production variation, respectively, in the CDW water (Zone 1 and 2). The larger slope of ΦNCP compared to ΦGPP in the linear regression model was attributed to the extra oxygen consumption via respiration and photorespiration, as well as electron consumption after PSII reactions. Owing to nutrient limitation and photoinhibition (Lavaud et al., 2004; Lavaud and Kroth, 2006), however, the large discrepancies in Φ in Zone 3 weakened these relationships across the entire study region (ΦGPP = 7.21 NPQNSV +1.01, R2 = 0.64; ΦNCP = 6.99 NPQNSV +3.85, R2 = 0.67).
4.4 The relationship of Φe: O with environmental factors: improved regression analysis
The spatial variations in water properties from large rivers to seawater influence the community structure and physiology of plankton. Consequently, the responses of phytoplankton acclimation and structural differences in the photosynthetic apparatus often exhibit consistent fluorescence “signatures” related to PSII reactions and the electron requirements for carbon fixation or oxygen production (Schuback et al., 2015, 2017). In the Gulf of Finland, temperature, salinity, Kd, and Zeu were the best predictors of Φe: C (R2 = 0.561, p< 0.01) due to seasonal changes in vertical mixing and the depth of the surface mixed layer. In the Bedford Basin, the combination of low nutrient levels and sudden high light availability caused by elevated freshwater discharge after snowmelt and ice breakup resulted in Φe: C being highly correlated with temperature and salinity. Our multiple linear regression analysis of Φe: O with environmental factors (temperature, Kd, Zeu, P, and N/P ratio) performed better than the relationship between Φe: O and NPQNSV. This improved performance indicates that Φe: O is influenced by light, temperature, nutrient availability stoichiometric demands, and changes in the phytoplankton community across salinity gradients.
5 Conclusion
The application of underway FRRf becomes an alternative way to obtain photosynthetic characteristic parameters and measure productivity. This study optimized the method for estimating productivity by electron transport rates. Although NPQNSV indicated that the conversion factors ΦGPP (0.8 mol e- to 31.8 mol e- per mol O2 production) and ΦNCP (0.9 mol e- to 36.9 mol e- per mol O2 production) work well (R2 > 0.57, p< 0.01) from the river mouth to the plume area (Zones 1–2), the Φ values in offshore nutrient-limited seawater (Zone 3) form discrete points away from this regression due to saturated light, nutrient limitation, and potential changes in the phytoplankton community. Due to phytoplankton metabolism being regulated by changes from river plume to offshore seawater, the relationship between Φe: O and various environmental factors can better explain their spatial distribution in the Changjiang River Estuary. This improvement provides a major step forward for the widespread and accurate fluorometry-based GPP and NCP applications in high spatiotemporal resolution for future research.
Data availability statement
The original contributions presented in the study are included in the article/Supplementary Material. Further inquiries can be directed to the corresponding author.
Author contributions
SF: Conceptualization, Data curation, Formal analysis, Investigation, Methodology, Validation, Visualization, Writing – original draft. YG: Conceptualization, Data curation, Formal analysis, Funding acquisition, Investigation, Methodology, Project administration, Resources, Software, Supervision, Validation, Visualization, Writing – original draft, Writing – review & editing. JL: Conceptualization, Investigation, Methodology, Project administration, Resources, Supervision, Validation, Writing – review & editing. LC: Investigation, Methodology, Writing – review & editing. YB:.
Funding
The author(s) declare financial support was received for the research, authorship, and/or publication of this article. This work was funded by the National Science Foundation of China (Grant Nos. 41530960 and 41861134040) and Shanghai Jiao Tong University (Grant No. 2019QYB03).
Acknowledgments
We are grateful to all the individuals involved in these projects, including those from the Ocean University of China for providing nutrient and chlorophyll data; the Zhejiang Ocean University for sharing hydrological information via CTD; and the Research Vessel Zheyu Ke for their support during the cruise.
Conflict of interest
The authors declare that the research was conducted in the absence of any commercial or financial relationships that could be construed as a potential conflict of interest.
Publisher’s note
All claims expressed in this article are solely those of the authors and do not necessarily represent those of their affiliated organizations, or those of the publisher, the editors and the reviewers. Any product that may be evaluated in this article, or claim that may be made by its manufacturer, is not guaranteed or endorsed by the publisher.
Supplementary material
The Supplementary Material for this article can be found online at: https://www.frontiersin.org/articles/10.3389/fmars.2024.1383988/full#supplementary-material
References
Arrigo K. R., Mills M. M., Kropuenske L. R., Van Dijken G. L., Alderkamp A. C., Robinson D. H. (2010). Photophysiology in two major southern ocean phytoplankton taxa: photosynthesis and growth of and under different irradiance levels. Integr. Comp. Biol. 50, 950–966. doi: 10.1093/icb/icq021
Badger M. R., Von Caemmerer S., Ruuska S., Nakano. H. (2000). Electron flow to oxygen in higher plants and algae: Rates and control of direct photoreduction (Mehler reaction) and rubisco oxygenase. Philos. Trans. R. Soc B Biol. Sci. 355, 1433–1446. doi: 10.1098/rstb.2000.0704
Bailey S., Melis A., Mackey K. R. M., Cardol P., Finazzi G., Van Dijken G., et al. (2008). Alternative photosynthetic electron flow to oxygen in marine Synechococcus. Biochim. Et Biophys. Acta Bioenergetics 1777, 269–276. doi: 10.1016/j.bbabio.2008.01.002
Bender M. L. (1987). A comparison of four methods for determining planktonic community production. Limn. Oceanog. 32, 1085–1098. doi: 10.4319/lo.1987.32.5.1085
Burlacot A., Burlacot F., Li-Beisson Y., Peltier G. (2020). Membrane inlet mass spectrometry: A powerful tool for algal research (vol 11, 1302, 2020). Front. Plant Sci. 11. doi: 10.3389/fpls.2020.631667
Cardol P., Bailleul B., Rappaport F., Derelle E., Beal D., Breyton C., et al. (2008). An original adaptation of photosynthesis in the marine green alga Ostreococcus. Proc. Natl. Acad. Sci. United States America 105, 7881–7886. doi: 10.1073/pnas.0802762105
Chen C. C., Shiah F. K., Chiang K. P., Gong G. C., Kemp W. M. (2009). Effects of the Changjiang (Yangtze) River discharge on planktonic community respiration in the East China Sea. J. Geophys. Res. Oceans 114. doi: 10.1029/2008JC004891
Cloern J. E. (1987). Turbidity as a control on phytoplankton biomass and productivity in estuaries. Continental Shelf Res. 7, 1367–1381. doi: 10.1016/0278-4343(87)90042-2
Estapa M. L., Mayer L. M. (2010). Photooxidation of particulate organic matter, carbon/oxygen stoichiometry, and related photoreactions. Mar. Chem. 122, 138–147. doi: 10.1016/j.marchem.2010.06.003
Estevez-Blanco P., Cermeno P., Espineira M., Fernandez E. (2006). Phytoplankton photosynthetic efficiency and primary production rates estimated from fast repetition rate fluorometry at coastal embayments affected by upwelling (Rias Baixas, NW of Spain). J. Plankton Res. 28, 1153–1165. doi: 10.1093/plankt/fbl046
Ferron S., Del Valle D. A., Bjorkman K. M., Quay P. D., Church M. J., Karl D. M. (2016). Application of membrane inlet mass spectrometry to measure aquatic gross primary production by the O-18 in vitro method. Limnol. Oceanogr. Methods 14, 610–622. doi: 10.1002/lom3.10116
Field C. B., Behrenfeld M. J., Randerson J. T., Falkowski P. (1998). Primary production of the biosphere: Integrating terrestrial and oceanic components. Science 281, 237–240. doi: 10.1126/science.281.5374.237
Genty B., Briantais J. M., Baker N. R. (1989). The relationship between the quantum yield of photosynthetic electron-transport and quenching of chlorophyll fluorescence. Biochim. Et Biophys. Acta 990, 87–92. doi: 10.1016/S0304-4165(89)80016-9
Gong G. C., Chang J., Chiang K. P., Hsiung T. M., Hung C. C., Duan S. W., et al. (2006). Reduction of primary production and changing of nutrient ratio in the East China Sea: effect of the Three Gorges Dam? Geophys. Res. Lett. 33, 2–5. doi: 10.1029/2006GL025800
González N., Gattuso J. P., Middelburg J. J. (2008). Oxygen production and carbon fixation in oligotrophic coastal bays and the relationship with gross and net primary production. Aquat. Microb. Ecol. 52, 119–130. doi: 10.3354/ame01208
Hamme R. C., Nicholson D. P., Jenkins W. J., Emerson S. R. (2019). “Using noble gases to assess the ocean’s carbon pumps,” in Annual Review of Marine Science, vol. Vol 11 . Eds. Carlson C. A., Giovannoni S. J., 75–103.
Hughes D. J., Campbell D. A., Doblin M. A., Kromkamp J. C., Lawrenz E., Moore C. M., et al. (2018a). Roadmaps and detours: active chlorophyll-assessments of primary productivity across marine and freshwater systems. Environ. Sci. Technol. 52, 12039–12054. doi: 10.1021/acs.est.8b03488
Hughes D. J., Campbell D. A., Doblin M. A., Kromkamp J. C., Lawrenz E., Moore C. M., et al. (2018b). Roadmaps and detours: active chlorophyll-a assessments of primary productivity across marine and freshwater systems. Environ. Sci. Technol. 52, 12039–12054. doi: 10.1021/acs.est.8b03488
Hughes D. J., Giannini F. C., Ciotti A. M., Doblin M. A., Ralph P. J., Varkey D., et al. (2021). Taxonomic variability in the electron requirement for carbon fixation across marine phytoplankton. J. Phycol. 57, 111–127. doi: 10.1111/jpy.13068
Hughes D. J., Varkey D., Doblin M. A., Ingleton T., Mcinnes A., Ralph P. J., et al. (2018c). Impact of nitrogen availability upon the electron requirement for carbon fixation in Australian coastal phytoplankton communities. Limnol. Oceanogr. 63, 1891–1910. doi: 10.1002/lno.10814
Hung C. C., Tseng C. W., Gong G. C., Chen K. S., Chen M. H., Hsu S. C. (2013). Fluxes of particulate organic carbon in the East China Sea in summer. Biogeosciences 10, 6469–6484. doi: 10.5194/bg-10-6469-2013
Jiao N., Liang Y., Zhang Y., Liu J., Zhang Y., Zhang R., et al. (2018). Carbon pools and fluxes in the China Seas and adjacent oceans. Sci. China Earth Sci. 61, 1535–1563. doi: 10.1007/s11430-018-9190-x
Kolber Z., Falkowski P. G. (1993). Use of active fluorescence to estimate phytoplankton photosynthesis in-situ. Limnol. Oceanogr. 38, 1646–1665. doi: 10.4319/lo.1993.38.8.1646
Lavaud J., Kroth P. G. (2006). In diatoms, the transthylakoid proton gradient regulates the photoprotective non-photochemical fluorescence quenching beyond its control on the xanthophyll cycle. Plant Cell Physiol. 47, 1010–1016. doi: 10.1093/pcp/pcj058
Lavaud J., Rousseau B., Etienne A. L. (2004). General features of photoprotection by energy dissipation in planktonic diatoms (Bacillariophyceae). J. Phycol. 40, 130–137. doi: 10.1046/j.1529-8817.2004.03026.x
Lawrenz E., Silsbe G., Capuzzo E., Ylostalo P., Forster R. M., Simis S. G. H., et al. (2013). Predicting the electron requirement for carbon fixation in seas and oceans. PloS One 8. doi: 10.1371/journal.pone.0058137
Laws E. A. (1991). Photosynthetic quotients, new production and net community production in the open ocean. Deep-Sea Res. Part a-Oceanogr. Res. Papers 38, 143–167. doi: 10.1016/0198-0149(91)90059-O
Le Quéré C., Andrew R. M., Friedlingstein P., Sitch S., Pongratz J., Manning A. C., et al. (2018). Global carbon budget 2017. Earth Syst. Sci. Data 10, 405–448. doi: 10.5194/essd-10-405-2018
Li J., Gao Y., Bao Y., Gao X., Glibert P. M. (2023). Summer phytoplankton photosynthetic characteristics in the Changjiang River Estuary and the adjacent East China Sea. Front. Mar. Sci. 10. doi: 10.3389/fmars.2023.1111557
Li W. Q., Ge J. Z., Ding P. X., Ma J. F., Glibert P. M., Liu D. Y. (2021). Effects of dual fronts on the spatial pattern of chlorophyll-a concentrations in and off the Changjiang river estuary. Estuar. Coasts 44, 1408–1418. doi: 10.1007/s12237-020-00893-z
Liu X., Laws E. A., Xie Y. Y., Wang L., Lin L. Z., Huang B. Q. (2019). Uncoupling of seasonal variations between phytoplankton chlorophyll a and production in the East China Sea. J. Geophys. Res. Biogeosci. 124, 2400–2415. doi: 10.1029/2018JG004924
Macintyre H. L., Kana T. M., Anning T., Geider R. J. (2002). Photoacclimation of photosynthesis irradiance response curves and photosynthetic pigments in microalgae and cyanobacteria. J. Phycol. 38, 17–38. doi: 10.1046/j.1529-8817.2002.00094.x
Mehler A. H. (1957). Studies on reactions of illuminated chloroplasts: I. Mechanism of the reduction of oxygen and other hill reagents. Arch. Biochem. Biophys. 33, 65–77. doi: 10.1016/0003-9861(51)90082-3
Melrose D. C., Oviatt C. A., O’Reilly J. E., Berman M. S. (2006). Comparisons of fast repetition rate fluorescence estimated primary production and C uptake by phytoplankton. Mar. Ecol. Prog. Ser. 311, 37–46. doi: 10.3354/meps311037
Mino Y., Matsumura S., Lirdwitayaprasit T., Fujiki T., Yanagi T., Saino T. (2013). Variations in phytoplankton photo-physiology and productivity in a dynamic eutrophic ecosystem: a fast repetition rate fluorometer-based study. J. Plankton Res. 36, 398–411. doi: 10.1093/plankt/fbt118
Nelson D. M., Brzezinski M. A. (1990). Kinetics of silicic acid uptake by natural diatom assemblages in two Gulf Stream warm-core rings. Mar. Ecol. Prog. Ser. 62, 283–292. doi: 10.3354/meps062283
Palevsky H. I., Quay P. D., Lockwood D. E., Nicholson D. P. (2016). The annual cycle of gross primary production, net community production, and export efficiency across the North Pacific Ocean. Global Biogeochem. Cycles 30, 361–380. doi: 10.1002/2015GB005318
Parsons T. R., Maita Y., Lalli C. M. (1984). A manual of chemical and biological methods for seawater analysis (New York, USA: Pergamon Press).
Peltier G., Thibault P. (1985). O2 uptake in the light in chlamydomonas - evidence for persistent mitochondrial respiration. Plant Physiol. 79, 225–230. doi: 10.1104/pp.79.1.225
Peng P., Bi R., Sachs J. P., Shi J., Luo Y. F., Chen W. F., et al. (2023). Phytoplankton community changes in a coastal upwelling system during the last century. Global Planet. Change 224. doi: 10.1016/j.gloplacha.2023.104101
Petrou K., Kranz S. A., Trimborn S., Hassler C. S., Ameijeiras S. B., Sackett O., et al. (2016). Southern Ocean phytoplankton physiology in a changing climate. J. Plant Physiol. 203, 135–150. doi: 10.1016/j.jplph.2016.05.004
Raateoja M., Seppala J., Kuosa H. (2004). Bio-optical modelling of primary production in the SW Finnish coastal zone, Baltic Sea: fast repetition rate fluorometry in Case 2 waters. Mar. Ecol. Prog. Ser. 267, 9–26. doi: 10.3354/meps267009
Radmer R. J., Kok B. (1976). Photoreduction of O2 primes and replaces CO2 assimilation. Plant Physiol. 58, 336–340. doi: 10.1104/pp.58.3.336
Robinson C., Suggett D. J., Cherukuru N., Ralph P. J., Doblin M. A. (2014). Performance of Fast Repetition Rate fluorometry based estimates of primary productivity in coastal waters. J. Mar. Syst. 139, 299–310. doi: 10.1016/j.jmarsys.2014.07.016
Robinson C., Tilstone G. H., Rees A. P., Smyth T. J., Fishwick J. R., Tarran G. A., et al. (2009). Comparison of in vitro and in situ plankton production determinations. Aquat. Microb. Ecol. 54, 13–34. doi: 10.3354/ame01250
Ryan-Keogh T. J., Thomalla S. J., Little H., Melanson J. R. (2018). Seasonal regulation of the coupling between photosynthetic electron transport and carbon fixation in the Southern Ocean. Limnol. Oceanogr. 63, 1856–1876. doi: 10.1002/lno.10812
Sarma V. V. S. S., Abe O., Hashimoto S., Hinuma A., Saino T. (2005). Seasonal variations in triple oxygen isotopes and gross oxygen production in the Sagami Bay, central Japan. Limnol. Oceanogr. 50, 544–552. doi: 10.4319/lo.2005.50.2.0544
Schuback N., Hoppe C. J. M., Tremblay J. E., Maldonado M. T., Tortell P. D. (2017). Primary productivity and the coupling of photosynthetic electron transport and carbon fixation in the Arctic Ocean. Limnol. Oceanogr. 62, 898–921. doi: 10.1002/lno.10475
Schuback N., Schallenberg C., Duckham C., Maldonado M. T., Tortell P. D. (2015). Interacting effects of light and iron availability on the coupling of photosynthetic electron transport and CO2-assimilation in marine phytoplankton. PloS One 10. doi: 10.1371/journal.pone.0133235
Schuback N., Tortell P. D. (2019). Diurnal regulation of photosynthetic light absorption, electron transport and carbon fixation in two contrasting oceanic environments. Biogeosciences 16, 1381–1399. doi: 10.5194/bg-16-1381-2019
Shen Z. L. (2008). Transfer and transport of phosphorus and silica in turbidity maximum zone of the Changjiang Estuary. stuarine Coast. Shelf Sci. 78, 481–492. doi: 10.1016/j.ecss.2008.01.010
Shi X. Y., Li H. M., Wang H. (2014). Nutrient structure of the Taiwan warm current and estimation of vertical nutrient fluxes in upwelling areas in the East China Sea in summer. J. Ocean Univ. China 13, 613–620. doi: 10.1007/s11802-014-2481-0
Singh A., Thomalla S. J., Fietz S., Ryan-Keogh T. J. (2022). Spatial and temporal variability of phytoplankton photophysiology in the Atlantic Southern Ocean. Front. Mar. Sci. 9. doi: 10.3389/fmars.2022.912856
Suggett D. J., Maberly S. C., Geider R. J. (2006a). Gross photosynthesis and lake community metabolism during the spring phytoplankton bloom. Limnol. Oceanogr. 51, 2064–2076. doi: 10.4319/lo.2006.51.5.2064
Suggett D. J., Macintyre H. L., Kana T. M., Geider R. J. (2009a). Comparing electron transport with gas exchange: parameterising exchange rates between alternative photosynthetic currencies for eukaryotic phytoplankton. Aquat. Microb. Ecol. 56, 147–162. doi: 10.3354/ame01303
Suggett D. J., Moore C. M., Hickman A. E., Geider R. J. (2009b). Interpretation of fast repetition rate (FRR) fluorescence: signatures of phytoplankton community structure versus physiological state. Mar. Ecol. Prog. Ser. 376, 1–19. doi: 10.3354/meps07830
Suggett D. J., Moore C. M., Maranon E., Omachi C., Varela R. A., Aiken J., et al. (2006b). Photosynthetic electron turnover in the tropical and subtropical Atlantic Ocean. Deep-Sea Res. Part Ii-Topical Stud. Oceanogr. 53, 1573–1592. doi: 10.1016/j.dsr2.2006.05.014
Suggett D. J., Prasil O., Borowitzka M. A. (2010). Chlorophyll a Fluorescence in Aquatic Sciences: Methods and Applications. doi: 10.1007/978-90-481-9268-7
Tan L. J., Xu W. J., He X. L., Wang J. T. (2019). The feasibility of Fv/Fm on judging nutrient limitation of marine algae through indoor simulation and experiment. Estuar. Coast. Shelf Sci. 229. doi: 10.1016/j.ecss.2019.106411
Tanaka T., Alliouane S., Bellerby R. G. B., Czerny J., De Kluijver A., Riebesell U., et al. (2013). Effect of increased pCO2 on the planktonic metabolic balance during a mesocosm experiment in an Arctic fjord. Biogeosciences 10, 315–325. doi: 10.5194/bg-10-315-2013
Wang J., Si G., Yu F. (2018). Progress in studies of the characteristics and mechanisms of variations in the Taiwan Warm Current. Mar. Sci. 44, 141–148. doi: 10.11759/hykx20181019002
Wang K., Chen J. F., Jin H. Y., Li H. L., Gao S. Q., Xu J., et al. (2014). Summer nutrient dynamics and biological carbon uptake rate in the Changjiang River plume inferred using a three end-member mixing model. Continental Shelf Res. 91, 192–200. doi: 10.1016/j.csr.2014.09.013
Wang Y. H., Wu H., Lin J., Zhu J. R., Zhang W. X., Li C. (2019). Phytoplankton blooms off a high turbidity estuary: A case study in the Changjiang river estuary. J. Geophys. Res. Oceans 124, 8036–8059. doi: 10.1029/2019JC015343
Wu X., Song J., Li X. (2014). Seasonal variation of water mass characteristic and influence area in the Yangtze Estuary and its adjacent waters. Mar. Sci. 38, 110–119. doi: 10.11759/hykx20140305001
Yang D., Wang F., Gao Z. Y. (2005). Study on the effects of physical and chemical factors on primary productivity in the Yangtze River Estuary I. Application of the judgment method and rule of nutrient salt limit in the Yangtze River Estuary waters. Adv. Mar. Sci. 23, 368–373.
Yao Q. Z., Zhang J., Wu Y., Xiong H. (2007). Hydrochemical processes controlling arsenic and selenium in the Changjiang River (Yangtze River) system. Sci. Total Environ. 377, 93–104. doi: 10.1016/j.scitotenv.2007.01.088
Zhang J. Z., Reisner E. (2019). Advancing photosystem II photoelectrochemistry for semi-artificial photosynthesis. Nat. Rev. Chem 4 (7), 381–381. doi: 10.1038/s41570-019-0149-4
Zhang J., Wu Y., Zhang G. L., Zhu Z. Y. (2014). Carbon biogeochemistry in the continuum of the Changjiang (Yangtze) River watersheds across the East China Sea.
Zhao Y., Qin Y., L. Z., Qiao F., Ma Y. (2021). Temporal and spatial distribution of red tides in the Changjiang estuary and in adjacent waters from 1989 to 2019. Mar. Sci. 45, 39–46. doi: 10.11759/hykx20210220001
Keywords: electron transport rates, gross primary production, net community production, conversion factor, Changjiang River, East China Sea
Citation: Fei S, Gao Y, Li J and Cao L (2024) The linkage between phytoplankton productivity and photosynthetic electron transport in the summer from the Changjiang River to the East China Sea. Front. Mar. Sci. 11:1383988. doi: 10.3389/fmars.2024.1383988
Received: 08 February 2024; Accepted: 03 June 2024;
Published: 01 August 2024.
Edited by:
Wei-dong Zhai, Southern Marine Science and Engineering Guangdong Laboratory (Zhuhai), ChinaReviewed by:
Shaofeng Pei, Qingdao Institute of Marine Geology (QIMG), ChinaYuqiu Wei, Chinese Academy of Fishery Sciences (CAFS), China
Copyright © 2024 Fei, Gao, Li and Cao. This is an open-access article distributed under the terms of the Creative Commons Attribution License (CC BY). The use, distribution or reproduction in other forums is permitted, provided the original author(s) and the copyright owner(s) are credited and that the original publication in this journal is cited, in accordance with accepted academic practice. No use, distribution or reproduction is permitted which does not comply with these terms.
*Correspondence: Yonghui Gao, eWdhbzgwQHNqdHUuZWR1LmNu