 Elena Terzić
 Monika Zabłocka
 Alexandra N. Loginova
 Karolina Borzycka
 Piotr Kowalczuk
- Institute of Oceanology of the Polish Academy of Sciences, Sopot, Poland
This study aimed to detect non-conservative processes that affect the distribution of fluorescent dissolved organic matter (FDOM) in the Baltic Sea. An extensive data set comprised of 408 FDOM data, optical and physical profiles, and the development of a water masses balance model allowed us to ascertain the sources of mixing anomalies. These were seen as second-order deviations in the FDOM distribution as a function of salinity in three layers: surface water, Baltic Sea Winter Water, and deep water. The difference between modeled and measured FDOM values at three different excitation/emission wavelengths allowed to show the strength of non-conservative processes, such as photochemical and microbial decomposition (negative residual values) or extracellular release of dissolved organic matter from phytoplankton, heterotrophic uptake and release from anoxic sediments (positive residual values). Humic-like FDOM fractions displayed positive residuals in all seasons for intermediate and deep layers and negative residuals in surface waters. Largest accumulation rates of humic-like fractions were reached in the Gulf of Gdańsk during summer in intermediate and deep layers, while the greatest removal in surface waters was observed during spring in the Bornholm and Gotland Basins and during summer in the Gulf of Gdańsk, probably due to photodegradation. Positive residuals of the protein-like fraction were observed at the surface in summer and autumn in the Gulf of Gdańsk, probably linked to the abundance of phytoplankton and also due to the low molecular weight by-products of photodegradation of humic-like components. Spatial transects revealed an increase in humic-like residuals with depth and a strong correlation with apparent oxygen utilization, increasing with higher fluorescence and exhibiting an asymptotic trend. A relationship was found between the protein-like fractions and phytoplankton biomass proxies. A generalized concept for FDOM cycling in the Baltic Sea was proposed, highlighting photobleaching as the dominant non-linear process determining the efficiency of humic-like FDOM removal. The protein-like component was found to be more efficiently taken up by aerobic prokaryotes at the surface. Microbial utilization and reworking of organic matter, release from sediments, and a decade-long stagnation of bottom water masses, all contribute to the observed accumulation of FDOM in mesohaline deep waters below the permanent pycnocline in the Baltic Sea.
Introduction
Dissolved organic matter (DOM) is an active and dynamic component in marine biogeochemical cycles and plays a crucial role as a source of energy for microbial metabolism, in addition to binding the majority of the metals that are relevant for phytoplankton growth (Morel and Price, 2003) and absorbing UV radiation (Repeta, 2015) that can be harmful to marine organisms. DOM is one of the largest exchangeable reservoirs of carbon in the ocean, comparable to the amount of carbon in the atmosphere in the form of CO2 (Hansell and Carlson, 2015). Moreover, DOC represents the largest fraction of the dissolved pool small perturbations in the DOM biogeochemical cycle could, in turn, result in the alteration of carbon exchange between the ocean and the atmosphere and therefore impact the warming or cooling of the Earth’s surface over longer geological time scales (Lønborg et al., 2020). Increasing temperature and stratification due to climate change may enhance the microbial pump (Jiao et al., 2011), which in the long run could favor heterotrophic bacteria in competition with phytoplankton for mineral nutrients by increasing the supply of labile carbon (Stedmon and Cory, 2014). In order to assess possible consequences of the changing environment, it is therefore essential to first quantify and characterize DOM dynamics and the ultimate remineralization of organic carbon (Stedmon and Cory, 2014).
Optically active fractions of DOM can be utilized to address some of these questions due to their relative ease of measurement and lower cost of analysis. The light-absorbing fraction, or chromophoric/colored DOM (CDOM), is one of the major determinants of the aquatic optical properties, affecting both the availability and the spectral quality of light in the water column (Nelson and Siegel, 2013; Stedmon and Nelson, 2015), while a fraction of it also fluoresces (FDOM (Stedmon and Nelson, 2015)). FDOM has been used to estimate CDOM levels in marine waters, as the CDOM absorption coefficient is linearly related to the fluorescence intensity (Ferrari and Dowell, 1998; Ferrari, 2000; Kowalczuk et al., 2010b). Strong correlations were observed between the optical properties of CDOM/FDOM and DOC concentration in marginal seas and coastal waters close to riverine discharges (Vodacek et al., 1997; Ferrari, 2000; Kowalczuk et al., 2010a; Kowalczuk et al., 2010b; Massicotte et al., 2017). However, such links have not been seen in the open surface pelagic ocean (in subtropical gyres) due to photodegradation caused by high solar irradiance intensity and long exposure time that decouples the link between carbon concentration and color (high DOC concentration and low CDOM absorption (Nelson and Siegel, 2013)). In situ optical instruments, mainly fluorometers and spectrophotometers mounted on various platforms (research vessels, Lagrangian drifters, and underwater autonomous vehicles), allow studying the optical properties of DOM and its distribution in marine environments with high temporal and spatial resolution in both horizontal and vertical domains (Xing et al., 2012; Dall’Olmo et al., 2017; Organelli et al., 2017; Organelli and Claustre, 2019; Xing et al., 2019).
The Baltic Sea is a shallow and young semi-enclosed sea with a large drainage area, which results in high freshwater runoff from the catchment and dominating outflow conditions (Feistel et al., 2016). This results in a permanently stratified sea with two vertically distinct water masses separated by the halocline at 60–80 m, which suppresses vertical mixing between the oxygenated brackish surface layers (salinity of approximately 7–8) and the less oxygenated and saltier deeper waters (ranging from 22 in the Arkona Basin to 10 in northern Gotland, Schmidt et al., 2021). The shallow connection through the Danish Straits between the Baltic Sea and the North Sea further reduces the exchange of water. Deep-water ventilation is driven by gale-forced barotropic or baroclinic saltwater inflows (Meier et al., 2006; Matthäus et al., 2008). Since the mid-1970s, the frequency and intensity of large barotropic winter inflows have decreased (Matthäus et al., 2008), which in turn has caused the development of decade-long stagnation periods in the deep waters of the Baltic Sea, leading to hypoxia (O2< 2 mg/l) and anoxia (O2< 0 mg/l). The occurrence of hypoxia has increased in the last two decades, reaching 85% of the bottom area in Bornholm and Gdańsk basins (Schmidt et al., 2021). The limited exchange of water masses between the North Sea and the Baltic, along with strong anthropogenic pressures on the Baltic Sea environment, can therefore cause persistent and prolonged anoxic periods in deeper layers (Conley et al., 2009; Conley et al., 2011), thus creating an adequate environment for DOM release from bottom sediments (Loginova et al., 2020; Lengier et al., 2021). For instance, anoxic conditions can induce hydrogen sulfide to gradually increase, thereby causing the formation of bottom dead zones (Meier et al., 2006; Feistel et al., 2016).
The carbon biogeochemical cycle in the Baltic Sea is well understood and described (Kuliński and Pempkowiak, 2008; Kuliński and Pempkowiak, 2011; Seidel et al., 2017), but the influence of DOM release from bottom sediments to overlying waters is the least known and characterized part (Hoikkala et al., 2015). The main aim of this work was therefore to better constrain the hypothesis placed by (Kowalczuk et al., 2015) that the return flux of DOM from anoxic sediments in the deep Baltic Sea is the main source of the documented mixing anomaly in the form of DOM accumulation. This was made possible by extensive optical observations conducted since 2014. The three-channel fluorometer allowed us to observe the temporal evolution of FDOM due to its ability to discriminate distinct FDOM fractions based on their excitation/emission spectra. Mixing anomalies were assessed with the use of a multi-end member mixing model to estimate the composition of the water masses in this region. Numerous studies have already used the optical properties of CDOM to track water masses and thus provide more information on their dynamics and possibly identify non-conservative processes, such as in situ production or (photo)degradation (Stedmon and Markager, 2003; Stedmon et al., 2010). The primary scope of this study was to obtain fractions for the three end-members (i.e., freshwater, Baltic Proper, and North Sea) as a function of salinity. This in turn provided the opportunity to model FDOM values and analyze residuals (i.e., the difference between measured and modeled values) for each of the three channels. Positive or negative values would indicate the strength of non-conservative processes in the CDOM/FDOM cycle in the regions and water masses considered. Negative values (measurements < model) would indicate that non-linear processes (most likely photochemical or microbial decomposition) took place, whereas positive values (measurements > model) would be an indicator of CDOM/FDOM accumulation due to local production (e.g., extracellular DOM release from phytoplankton) or from an additional source that was not considered by the model. Regional and seasonal residuals at different depths were examined to understand the spatio-temporal behavior of FDOM. Anomalies in FDOM fractions were then compared to other parameters, such as depth or oxygen. This was done in order to infer the potential input of sediment release to overlying waters, or for the assessment of autochthonous production in surface waters by using the phytoplankton biomass proxy. Finally, DOC concentrations were obtained through a statistically significant relationship with CDOM absorption at 350 nm, in order to quantify the net accumulation or losses in each of the examined regions. A presumed change in DOM aromaticity in deep waters has also been addressed with the use of carbon-specific CDOM absorption at 254 nm, caused by the last major Baltic Sea inflow of saline and oxygenated water from the North Sea during winter 2014/2015.
Materials and methods
Study site
The current study is based on field observations made during 26 optical survey cruises from winter 2014 to winter 2020 in the Baltic Sea and the Danish Straits. All cruises were conducted by the Department of Marine Physics at the Institute of Oceanology in Poland. The research cruises covered the eastern part of the Bornholm Basin, the southern part of the Gotland Basin, and the Gdańsk Basin in the Baltic Proper (Figure 1), which represent the open marine waters end member in the current study. The Gulf of Gdańsk and the Pomeranian Bay with the shallow Szczecin Lagoon represent the freshwater end members, as the water bodies are influenced by discharges from the Vistula and Odra Rivers. In June 2014 and 2016, water samples were additionally collected in the Sound and Kattegat during the cruise from Gdańsk to Tromsø to gain a representative description of optical parameters for the North Sea end member in the salinity range of 30–33. Measurements collected in the Kattegat and Skagerrak at salinity less than 33.2 and greater than 30 represent the North Sea end member in the mixing model. At shallow stations (<50 m), water samples were collected with Niskin bottles at the surface, at the subsurface chlorophyll-a (chl a) maximum, and at the bottom of the seasonal thermocline. At deep stations, additional samples were collected at the core of the Baltic Sea Winter Water (salinity (S) 7.3–7.8, temperature (T) 3.5–5°C), at the pycnocline (the depth of which was determined from T-S profiles), at several depths below the pycnocline (usually 3–5 spaced every 10 m), and 1 m above the bottom sediments. Hereafter, the basin names used in the study will be abbreviated to Bornholm, Gotland, and Gdańsk.
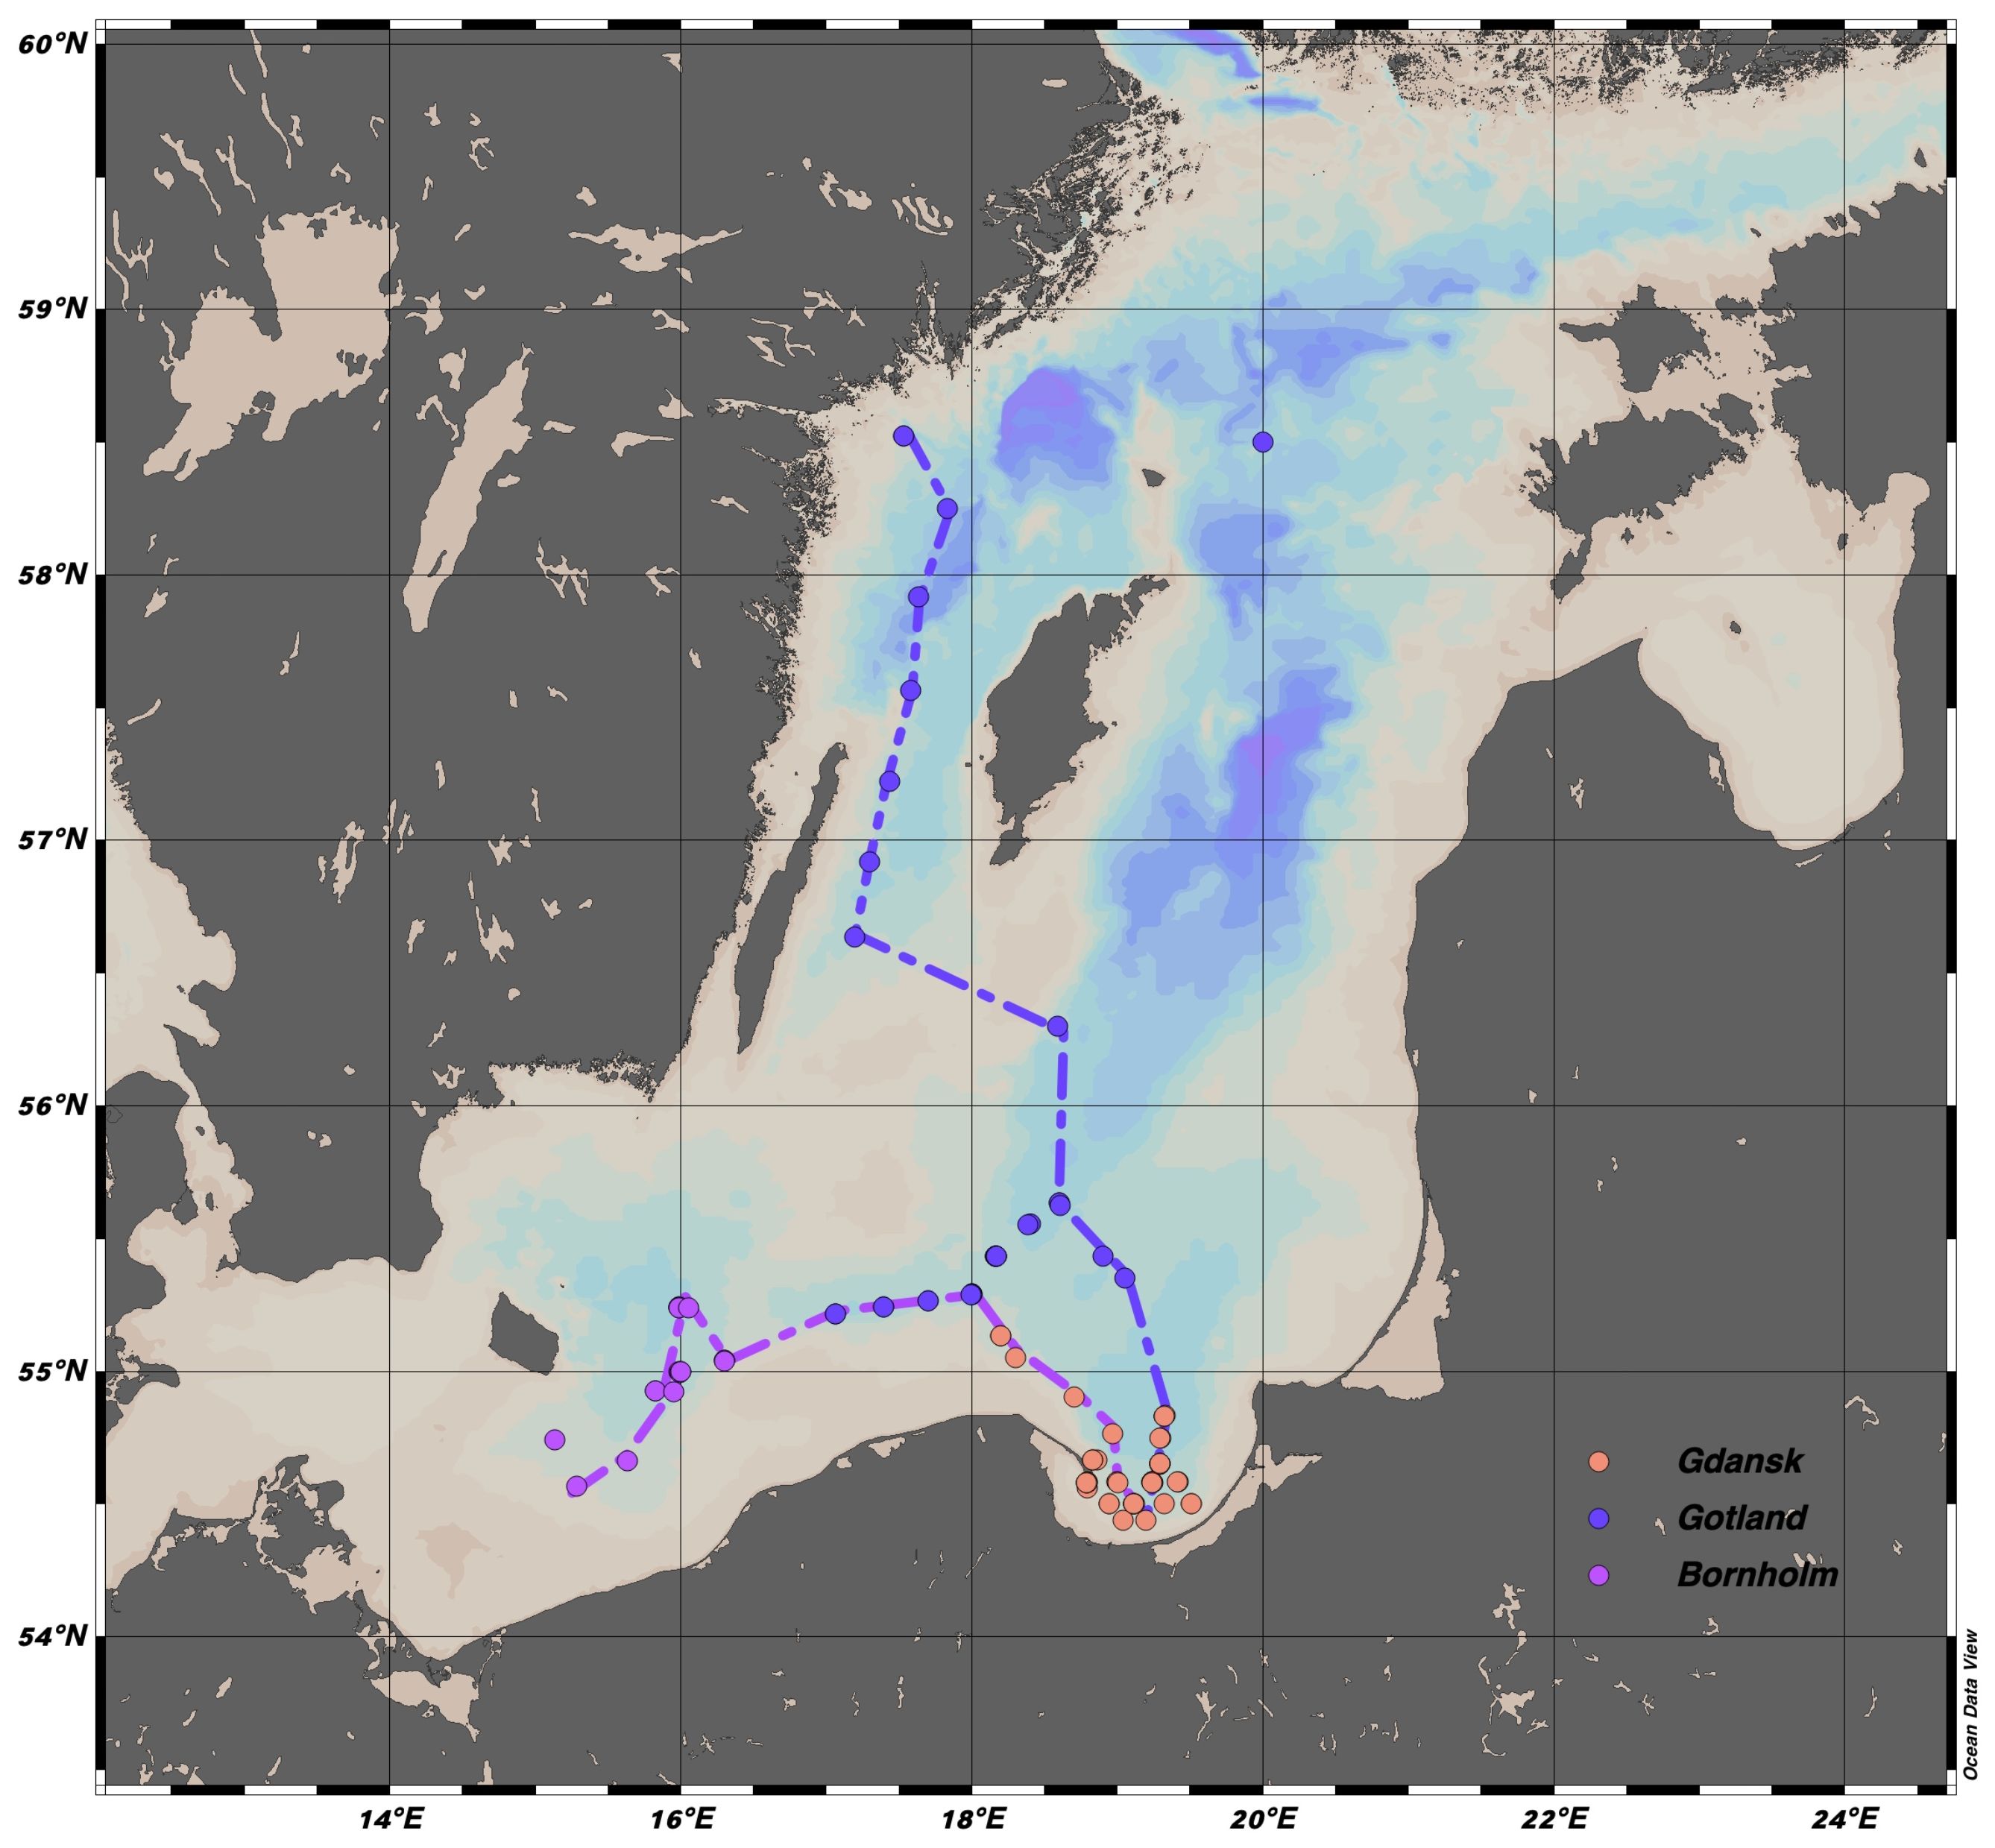
Figure 1 Spatial distribution of measured profiles in three different regions: Bornholm, Gulf of Gdańsk, and Gotland. The colored dashed-dotted lines show the trajectories used to build the section plots.
Water sample processing
Water samples for CDOM, FDOM, and DOC determinations were filtered directly from Niskin bottles with an Opticap XL4 Durapore filter cartridge with a nominal pore size of 0.2 μm. Samples were stored in acid-washed 200-ml amber glass bottles. Subsamples for DOC determination were placed in the pre-cleaned 40-ml glass vials (certified pre-cleaned sample vials, Sigma-Aldrich) and acidified with a drop of concentrated 38% HCl. The filter cartridge was kept in a 10% HCl solution between sampling stations and rinsed with ultrapure MilliQ and sample water before collecting samples. All samples were stored at +4°C in the dark aboard research vessels until spectroscopic and chemical analyses were carried out in the onshore laboratory. Water samples for the determination of chl a concentrations were filtered immediately after collection under low vacuum on Whatman (GE Healthcare, Little Chalfont, UK) 25mm GF/F filters. Filter pads with retained particulate material were immediately snap-frozen in liquid nitrogen and then stored at -80°C prior to analysis in the onshore laboratory.
Spectroscopic measurements of DOM absorption and chlorophyll-a concentration
The absorbance of CDOM was measured in the spectral range 250–700 nm with 1 nm increments using a Perkin Elmer Lambda 650 spectrometer and 100 mm quartz cells with Ultrapure Milli-Q as the reference (Kowalczuk et al., 2006). The measured absorbance spectra were baseline corrected and the CDOM absorption coefficient, aCDOM(λ), was obtained by using Equation 1:
where: A(λ) is the absorbance, L is the optical path length [m], and the factor 2.303 is the natural logarithm of 10.
DOC measurements were performed with a HyPerTOC analyzer (Thermo Electron Corp., The Netherlands) using UV and persulfate for organic carbon oxidation and non-dispersive infrared for CO2 detection (Sharp, 2002). Each sample was measured in triplicate with a known amount of potassium hydrogen phthalate added as an internal standard. The DOC quality control was performed with the certified reference material (CRM) supplied by the Hansell Laboratory, University of Miami. The methodology ensured satisfactory accuracy (average recovery 95%; n = 5; CRM = 44 − 46 μM C; our results = 42 − 43 μM C) and precision characterized by a relative standard deviation (RSD) of 2%.
The Carbon-specific CDOM absorption at 254 nm, known as the SUVA aromaticity proxy (Weishaar et al., 2003), was calculated by dividing the aCDOM(254) in m−1 by the DOC concentration in g m−3 and is reported in m2 g−1.
Pigments contained in suspended particles retained on filter pads were extracted in 96% ethanol at room temperature for 24 hours (Wintermans and de Mots, 1965; Marker et al., 1980). chl a was determined using a Perkin Elmer Lambda 650 spectrophotometer as follows in Equation 2 according to (Lorenzen, 1967):
where Vextr is the volume of the 96% ethanol for pigment extraction [cm3], Vfiltr is the volume of the water sample [dm3], A(665) and A(750) are the absorbances measured at 665 and 750 nm, respectively, L is the cuvette length [cm], and 83 is the chl a specific absorption in ethanol (Sartory and Grobbelaar, 1984). The chl a concentration is given in [mg m-3].
In situ measurements of inherent optical properties, oxygen, and FDOM
At all stations, optical properties were measured directly after the water samples had been collected with an in situ instrument package consisting of an ac-9 Plus attenuation and absorption meter (WET Labs Inc.), a WetStar 3-channel CDOM fluorometer (WET Labs Inc.), a MicroFlu-Chl chlorophyll fluorometer (TrioS GmbH), and a Seabird SBE 49 FastCAT Conductivity-Temperature-Depth (CTD) probe (Seabird Electronics). The instrumental package was deployed in the profiling and flow-through along ship track modes (for more details see (Kowalczuk et al., 2010b; Granskog et al., 2015; Makarewicz et al., 2018)). Potential density anomaly was calculated with the Gibbs SeaWater Oceanographic Toolbox for Python, i.e., with a reference pressure of 0 bar and by using conservative temperature and absolute salinity data (both obtained with the same library). Dissolved oxygen O2, DO, was read using the SeaBird SBE19 CTD – DO probe. The Apparent Oxygen Utilization (AOU) was obtained as the difference between the O2 gas solubility and the measured O2 concentrations [μ mol kg-1]. The former is a function of in situ T, S and one atmosphere of total pressure, calculated using equations from Garcia and Gordon (1992) based on values derived in Benson and Krause (1984). CTD and DO sensors were calibrated periodically at the manufacturer’s laboratory (once every two years).
ac-9 measures the total absorption a and beam attenuation coefficient c at nine wavelengths (412, 440, 488, 510, 532, 555, 650, 676, and 715 nm). The ac-9 and CTD water intakes were installed on the same horizontal plane. The data were recorded at a frequency of 6 Hz and averaged over 10 records (1.6 s). The package was lowered at a vertical speed of 0.3 m/s, resulting in a vertical resolution of ~50 cm. The data from the instruments were synchronized using time stamps with the WET Labs Archive Processing software (version 4.25). A time lag was applied according to the positioning of the instruments along the tubing and the measured flow rates. ac9 measurements were corrected for T and S (Sullivan et al., 2006) and for scattering assuming zero absorption at 715 nm. The absorption line height of phytoplankton pigments at 676 nm, aLH(676), was calculated in order to test the application of this optical proxy for the estimation of chl a concentration (Roesler and Barnard, 2013). Small contributions of CDOM and detrital absorption in the red part of the spectrum were subtracted from the measured total non-water absorption at 650 and 715 nm. The residual signal at 676 nm, adg(676), was then estimated with a linear interpolation of the values at 650 and 715 nm.
FDOM was measured using the 3-channel fluorometer with distinct excitation/emission features in specific peak areas (Coble, 1996): Channel 1 (Ch1), excitation/emission (ex./em.) 310/450 nm, was previously referred to as the area between the humic–like peak C and the marine humic–like peak M; Channel 2 (Ch2), ex./em. 280/450 nm, represents the UV-C terrestrial humic–like peak A; and Channel 3 (Ch3), ex./em. 280/350 nm, represents the protein–like tryptophan peak T. The values were calibrated in Raman Units [R.U.] using a sum signal of the corresponding excitation and emission areas centered at the ex./em. positions of specific channels ± 5 nm from the central wavelengths in Excitation Emission Matrix spectra measured with the Aqualog spectrofluorometer in collected discrete water samples. Calibration curves were derived individually for each cruise and the time drift correction was applied (Stedmon et al., 2021).
Water mass balance mixing model
The configuration of the water mass balance mixing model is based on the assumption that both salinity S and aCDOM(λ) exhibit a conservative behavior during the mixing of three major water masses (Stedmon et al., 2010), in this case, freshwater, North Sea (NS) and Baltic Proper (BP). In order to configure and test the mixing model, a calibration dataset was used, comprised of a subset of the entire database. Almost every profile is represented by at least one point, usually at the surface, but many stations also include samples taken at depths below the halocline. In order to have a better representation of the freshwater end member, the calibration data set included additional measurements in the Szczecin Lagoon (Odra River discharge) and from the vicinity of the Vistula River outlet.
S and CDOM absorption at 350 nm aCDOM(350) in a given water sample from the region can be expected to follow the Equations 3-5:
where fi represents the fraction of each water mass in the sample (i=[fresh, NS, BP]).
These three equations with three unknowns can be solved after having determined the adequate end member values for aCDOM(350) and S for each of the three water masses. The freshwater end member for riverine water mixing with open Baltic Sea water was characterized by the following means and standard deviations(N=30): Sfresh = 0.918 ± 0.546 and = 8.705 ± 2.842 m-1; and for open Baltic Sea water or BP at the surface (N=673): SBP = 7.381 ± 0.209 and =1.617 ± 0.233 m-1 (Kowalczuk et al., 2015). The oceanic end member in the North Sea was characterized by the data set used in Stedmon et al. (2010) with a slightly modified range of SNS values considered (30<S<33.2, N=57): = 0.734 ± 0.135 m-1. The relative proportion of each water mass could be then assessed for a given sample from the region by solving the linear equations algebraically. The mixing model was run with a few constraints in order to remove some numerical artifacts: the freshwater fraction was set to 0 for S > 7.381 + 0.209, while the North Sea water fraction was set to 0 for S < 7.381–0.209, which is the range of salinity values that are expected for the Baltic Proper end member.
Fractions fi for the three end-members were obtained in order to further calculate modeled FDOM values for a given salinity from the mixing model. The Equations 3–5 could then be rewritten by substituting aCDOM(350) with FDOM in Equation 6, with the same constraints regarding salinity:
for each of the i=[fresh, NS, BP] water masses and j=[1,2,3] channels.
For the fresh water and BP FDOM end member characterization, the calibration dataset was used, while the NS FDOM end member was obtained from the along-track measurements between 2014 and 2016 (for latitudes below 59.2°, as higher latitudes were influenced by the local freshwater outflows in Norwegian fjords (Højerslev et al., 1996; Højerslev and Aas, 2001; Stedmon et al., 2010)). Mean and standard deviation values for each of the three channels and end members were obtained (in Raman Units - R.U.) as follows: for the freshwater end member 82.14 ± 10.51 R.U., 67.52 ± 8.53 R.U. and 14.32 ± 1.00 R.U. for channels 1 to 3, respectively; for the Baltic Proper: 16.01 ± 2.72 R.U., 14.48 ± 2.42 R.U., 5.72 ± 0.83 R.U. and for the North Sea: 4.82 ± 0.34 R.U., 3.64 ± 0.32 R.U. and 2.52 ± 0.32 for channels 1 to 3.
Data aggregation in space and time
The statistical characterization of physical and biogeochemical variables was analyzed through a seasonal division for each of the basins and three water masses, as defined by (Leppäranta and Myrberg, 2009). Depth ranges of the three water masses were selected based on the seasonal density profiles (not shown here) and mixed layer depth estimates from hydrodynamic models (Cahill et al., 2023): Surface Water (SW), delineated by the seasonal thermocline depth, Baltic Sea Winter Water (BSWW) at an intermediate depth range, below the seasonal thermocline and above the pycnocline, and Deep Water (DW) below the halocline. The depth ranges were chosen as follows: for Gdańsk: SW at 0–25 m range, BSWW at 35–55 m and DW at 70–80 m; Gotland: SW at 0–25 m, BSWW at 40–55 m and DW at 60–85 m; Bornholm: SW at 0–35 m, BSWW at 40–55 m and DW at 65–80 m. Seasons were defined as follows: winter from January to March, spring from April to June, summer from July to August, and autumn from September to December. The majority of the profiles were located in Gdańsk (N=[40, 181, 15, 86] for seasons from winter to autumn), only winter and spring profiles were available for Bornholm (N=[12, 30]) and Gotland (N=[8, 36]). The depth ranges were up to 80, 110, and 100 m for Bornholm, Gotland, and Gdańsk, respectively. To better visualize the spatial distribution of FDOM in the Baltic Sea, composite sections were plotted along two transects in the spring months from Bornholm to the Gulf of Gdańsk and from Gotland to Gdańsk, Figure 1. The transect from Bornholm to the Gulf of Gdańsk was built with data from cruises in March and May 2015, April 2016, March and May 2019, and May 2020, with a total of 129 profiles. The section from Gotland to the Gulf of Gdańsk had, on the other hand, fewer profiles (31 in total) from cruises in May 2015 and 2016. The transects represent typical spring conditions in both basins when several processes relevant to the DOM cycle occur simultaneously: the formation of a seasonal thermocline that traps CDOM/FDOM in the surface layer and makes it susceptible to photobleaching, as high solar irradiance intensity and low cloud coverage in spring lead to high energy doses accumulated in the surface layer (Dera and Woz´niak, 2010); the highest biological production associated with spring blooms; and the highest lateral transport of terrestrial DOM to the Baltic Sea. Below the pycnocline, however, stagnation and an increase in optical DOM properties with increasing salinity could be observed. Measurements for the Bornholm transect were taken in April during the peak of the spring bloom, while observations in the Gotland Basin were taken in late May, during a declining phase of the spring bloom.
Results
Hydrographic and biogeochemical conditions
Results are hereby presented as median values with an interquartile range (IQR) unless indicated otherwise. The temperature cycle in surface waters was regulated by the annual cycle of warming and cooling, Figure 2. Bornholm displayed the highest T values during spring (no data available during summer) in SW (T=8.6 ± 3.4°C) and the lowest during winter. In the intermediate layer, T was quite uniform with small seasonal variations, median T: 4.2–5.1°C. The variability below the halocline was excluded from the regular seasonal cycles and was shaped by the irregular baroclinic inflow of salty and usually warmer water from the Kattegat, which effectively increased T in DW to over 7.5°C. A similar pattern of water mass T distribution was repeated in Gdańsk and Gotland with some noticeable regional differences: median T values in BSSW and DW decreased with increasing distance from Bornholm. There were also some irregularities linked with mixed layer deepening in late summer and autumn, which reached up to 40 m (Cahill et al., 2023), effectively increasing T above 5.5°C in the BSSW layer in these two regions. Seasonal cycles regulated the salinity distribution the least, with hydrodynamic forcing controlling inflow. It increased with depth, with a sharp gradient below the halocline in DW. Regional differences in median S values were more pronounced between the Bornholm Basin and Gdańsk and Gotland Basins. Highest S median values, especially in DW, were observed in Bornholm Basin (winter median S=16.1, interquartile range (IQR)=3.7; spring median S=15.6, IQR=1.1), and decreased toward Gdańsk Basin, reaching lowest values in Gotland (Figure 2).
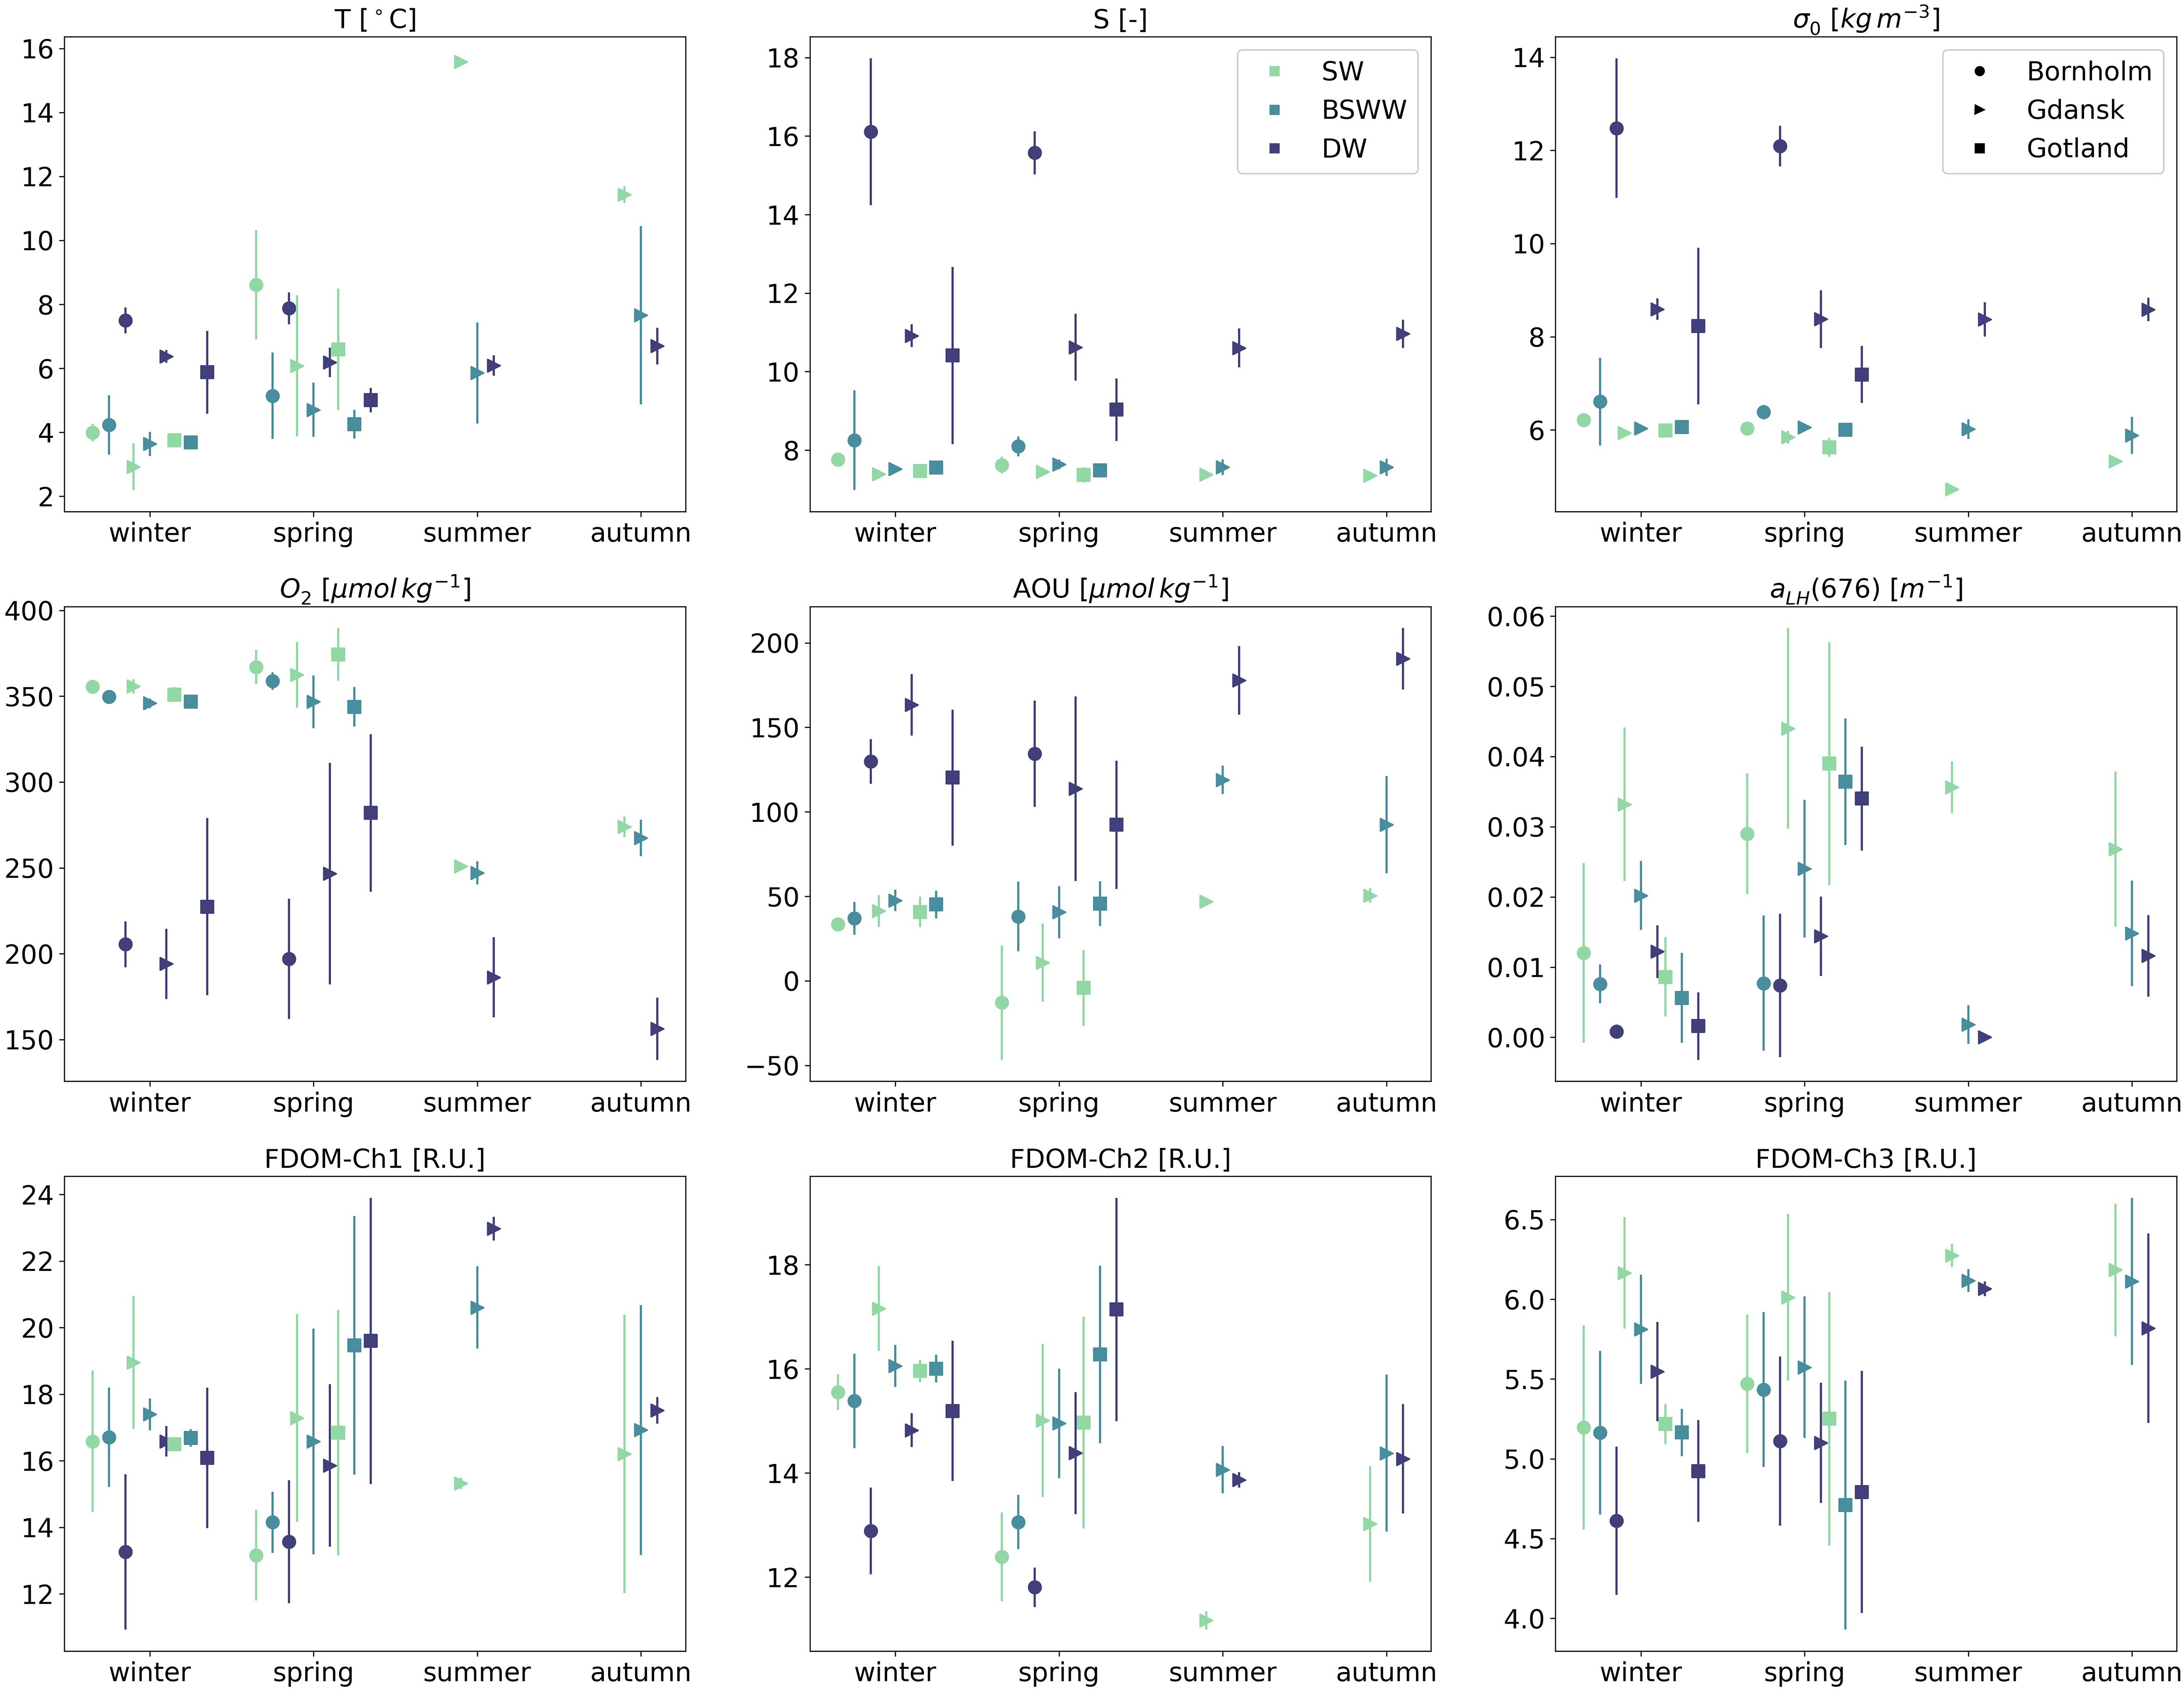
Figure 2 Seasonal median values and interquartile ranges of thermohaline, biochemical, and optical properties for three water masses (SW, BSWW, and DW - different colors) and three different regions: Bornholm, Gulf of Gdańsk and Gotland (different markers).
Seasonal values of potential density anomalies, σ0, were well aligned with S values. The highest densities were seen in DW during winter and spring in Bornholm (winter σ0 = 12.4 ± 3.0 kg m-3; spring σ0 = 12.1 ± 0.9 kg m-3). The lowest values were observed in Gdańsk during summer in SW (σ0 = 4.7 ± 0.002 kg m-3).
The highest O2 values in SW were seen in spring (median ranging between 362 and 374 μmol kg-1 for all three basins), with a smaller difference between SW and BSWW and a noticeable drop in DW below the halocline (between 197 and 281 μmol kg-1 from Bornholm to Gotland). The lowest O2 values, for all depth layers, were seen during summer (SW: 250.9 ± 4.3 μmol kg-1; DW: 186.3 ± 46.6 μmol kg-1) and autumn (SW: 273.9 ± 11.7 μmol kg-1; DW: 156.3 ± 36.1 μmol kg-1) in Gdańsk. Overall, the values of AOU increased with depth for all seasons and regions, with minimum values in SW and maximum values in DW. The smallest differences between SW and BSWW were seen in winter. The lowest values of AOU were observed in spring SW (median between -12.9 μmol kg-1 Bornholm and 10.85 in Gdańsk), and the highest values were seen in DW in autumn in Gdańsk (190.6 ± 36.3 μmol kg-1). In Bornholm and Gotland, the highest values were found in DW during spring (134.4 ± 363 μmol kg-1) and winter (120.3 ± 380.4 μmol kg-1), respectively. Negative median AOU values in SW during spring (AOU=-12.9 ± 67.6 μmol kg-1 in Bornholm) indicated an oversaturation of the mixed layer, which is in line with the highest values of aLH(676) during spring (aLH(676)=0.029 ± 0.017 m-1).
aLH(676) is a parameter defined as a proxy for chl a concentration (Nardelli and Twardowski, 2016) and is thus also strongly correlated with phytoplankton biomass (Supplementary Figure S1 in the Supplementary). Maximum median aLH(676) values were observed in SW during spring in all analyzed regions (0.039 m-1 in Gotland and 0.044 m-1 in Gdańsk) and minimum aLH(676) values were seen in the same water layer during winter (0.009 m-1 in Gotland and 0.012 m-1 in Bornholm). It should be noted that median values of aLH(676) in Gdańsk in SW were very high during all seasons, and even winter values exceeded SW winter values in other basins by a factor of 3. The aLH(676) variability below SW was small and elevated values in BSWW and DW could be an indicator of a flux of sinking particles or the resuspension of bottom sediments rich in organic matter.
Reported FDOM results
In Bornholm, maximum humic-like FDOM-Ch1 values were observed during winter in SW (16.6 ± 4.3 R.U.) and BSWW (16.7 ± 3.0 R.U.). The highest FDOM-Ch2 was seen during winter in both SW (15.6 ± 0.7 R.U.) and BSWW (15.4 ± 0.8 R.U.). Median FDOM-Ch1 and FDOM-Ch2 values decreased by ca. 3.5 R.U. below the halocline. In Gotland, seasonal differences in median FDOM-Ch1 and FDOM-Ch2 values were not significant and increased systematically with depth. FDOM-Ch1 had the highest values during spring in BSWW (19.5 ± 7.8 R.U.) and DW (19.6 ± 8.6 R.U.), while FDOM-Ch2 had the highest values during spring in DW (17.1 ± 4.3 R.U.). The lowest FDOM-Ch1 and FDOM-Ch2 values were observed in spring in SW compared to other seasons, with the lowest median of FDOM-Ch2 in SW in Gotland (15.0 R.U.). The Gulf of Gdańsk receives the highest inflow of freshwater compared to other regions considered. Therefore, both the hydrographic properties of the rivers discharging into the gulf and the seasonal stratification influence the formation of two seasonal regimes of FDOM-Ch1 and FDOM-Ch2 distribution. In winter and spring, when the river discharge is highest, the median values of FDOM-Ch1 and FDOM-Ch2 were highest in SW (19.0 R.U. and 17.3 R.U. in winter and 17.2 R.U. and 15.0 R.U. in spring for Ch1 and Ch2, respectively), steadily decreasing with depth. During summer, median FDOM-Ch1 and FDOM-Ch2 values in SW were lower compared to those measured in BSWW (the highest FDOM-Ch2 values were observed in this layer (14.1 ± 0.9 R.U.). Below the halocline in DW, the median of FDOM-Ch1, which is associated with marine humic-like material produced in situ, increased (23.0 ± 0.9 R.U.), while FDOM-Ch2 decreased. During autumn, the vertical dynamics of the median values of FDOM-Ch1 and FDOM-Ch2 were consistent with those observed in the summer. FDOM-Ch3 represents the protein-like FDOM fraction that could be linked to local production (Kowalczuk et al., 2005b) or could be a product of the photodegraded humic-like FDOM fraction (Makarewicz et al., 2018). In SW, strong and moderate power law relationships were observed between aLH(676) and chl a (r2 = 0.844, Supplementary Figure S1) and between aLH(676) and FDOM-Ch3 (r2 = 0.586, Supplementary Figure S2). The observed median FDOM-Ch3 values had a more uniform distribution among seasons and water masses in the considered regions. The FDOM-Ch3 median ranged between 6.3 (summer SW) and 6.0 R.U. (spring SW) in Gdańsk, with lower values in SW in Bornholm and Gotland during the spring seasonal maximum (5.5 ± 0.9 R.U.; 5.3 ± 1.6 R.U. in Bornholm and Gotland, respectively). The median FDOM-Ch3 values decreased systematically with depth in all considered regions during the respective seasons.
The beginning of the transects was located in the southern part of Bornholm and in the northwestern part of Gotland, while the end of both transects was near the Vistula River outlet in the Gulf of Gdańsk. Salinity isolines were overlaid on interpolated FDOM-Ch1 (Figures 3A, B top panels) and aLH(676) isolines were overlaid on interpolated FDOM-Ch3 intensity values (Figures 3A, B bottom panels). A distinct west-east gradient was seen in the FDOM-Ch1 data from Bornholm to the Gulf of Gdańsk, where terrestrial input caused elevated FDOM-Ch1 values (over 19 R.U.). The fluorescence intensity in SW decreased sharply at S>7.5, and remained stable (around 16 R.U.) until the western part of Bornholm, where S increased to over 8, and FDOM-Ch1 decreased to below 13 R.U. The S-N gradient in the distribution of FDOM-Ch1 was displayed at the Gulf of Gdańsk to Gotland transect. The highest FDOM-Ch1 intensity was seen in the Gulf of Gdańsk, decreasing toward the southern reach of Gotland, where the lowest FDOM-Ch1 intensity was observed in SW (around 15 R.U.). The northern part of Gotland, where S is less than 7, resulted in a slow increase of FDOM-Ch1. The intensity of FDOM-Ch1 decreased with depth, especially below the halocline, reaching its lowest values in the bottom water of Bornholm (Figure 3A, top panel), where the S was highest (S>17). In the northern part of Gotland, FDOM-Ch1 showed a tendency to increase slowly with depth. The spatial distribution of the protein-like FDOM fraction, FDOM-Ch3, was least dependent on S, except in the Gulf of Gdańsk, which is impacted by the Vistula River plumes. This resulted in the highest FDOM-Ch3 intensity, approximately 7–8 R.U., which could be observed in both transects (Figures 3A, B bottom panels). The local FDOM-Ch3 intensity maxima in SW were aligned with phytoplankton bloom patches marked by elevated aLH(676) values. The FDOM-Ch3 intensity showed a clear tendency to decrease with depth, with the lowest values observed in DW in the center of the Bornholm and Gotland Basins, 3–5 R.U. (Figures 3A, B, bottom panels).
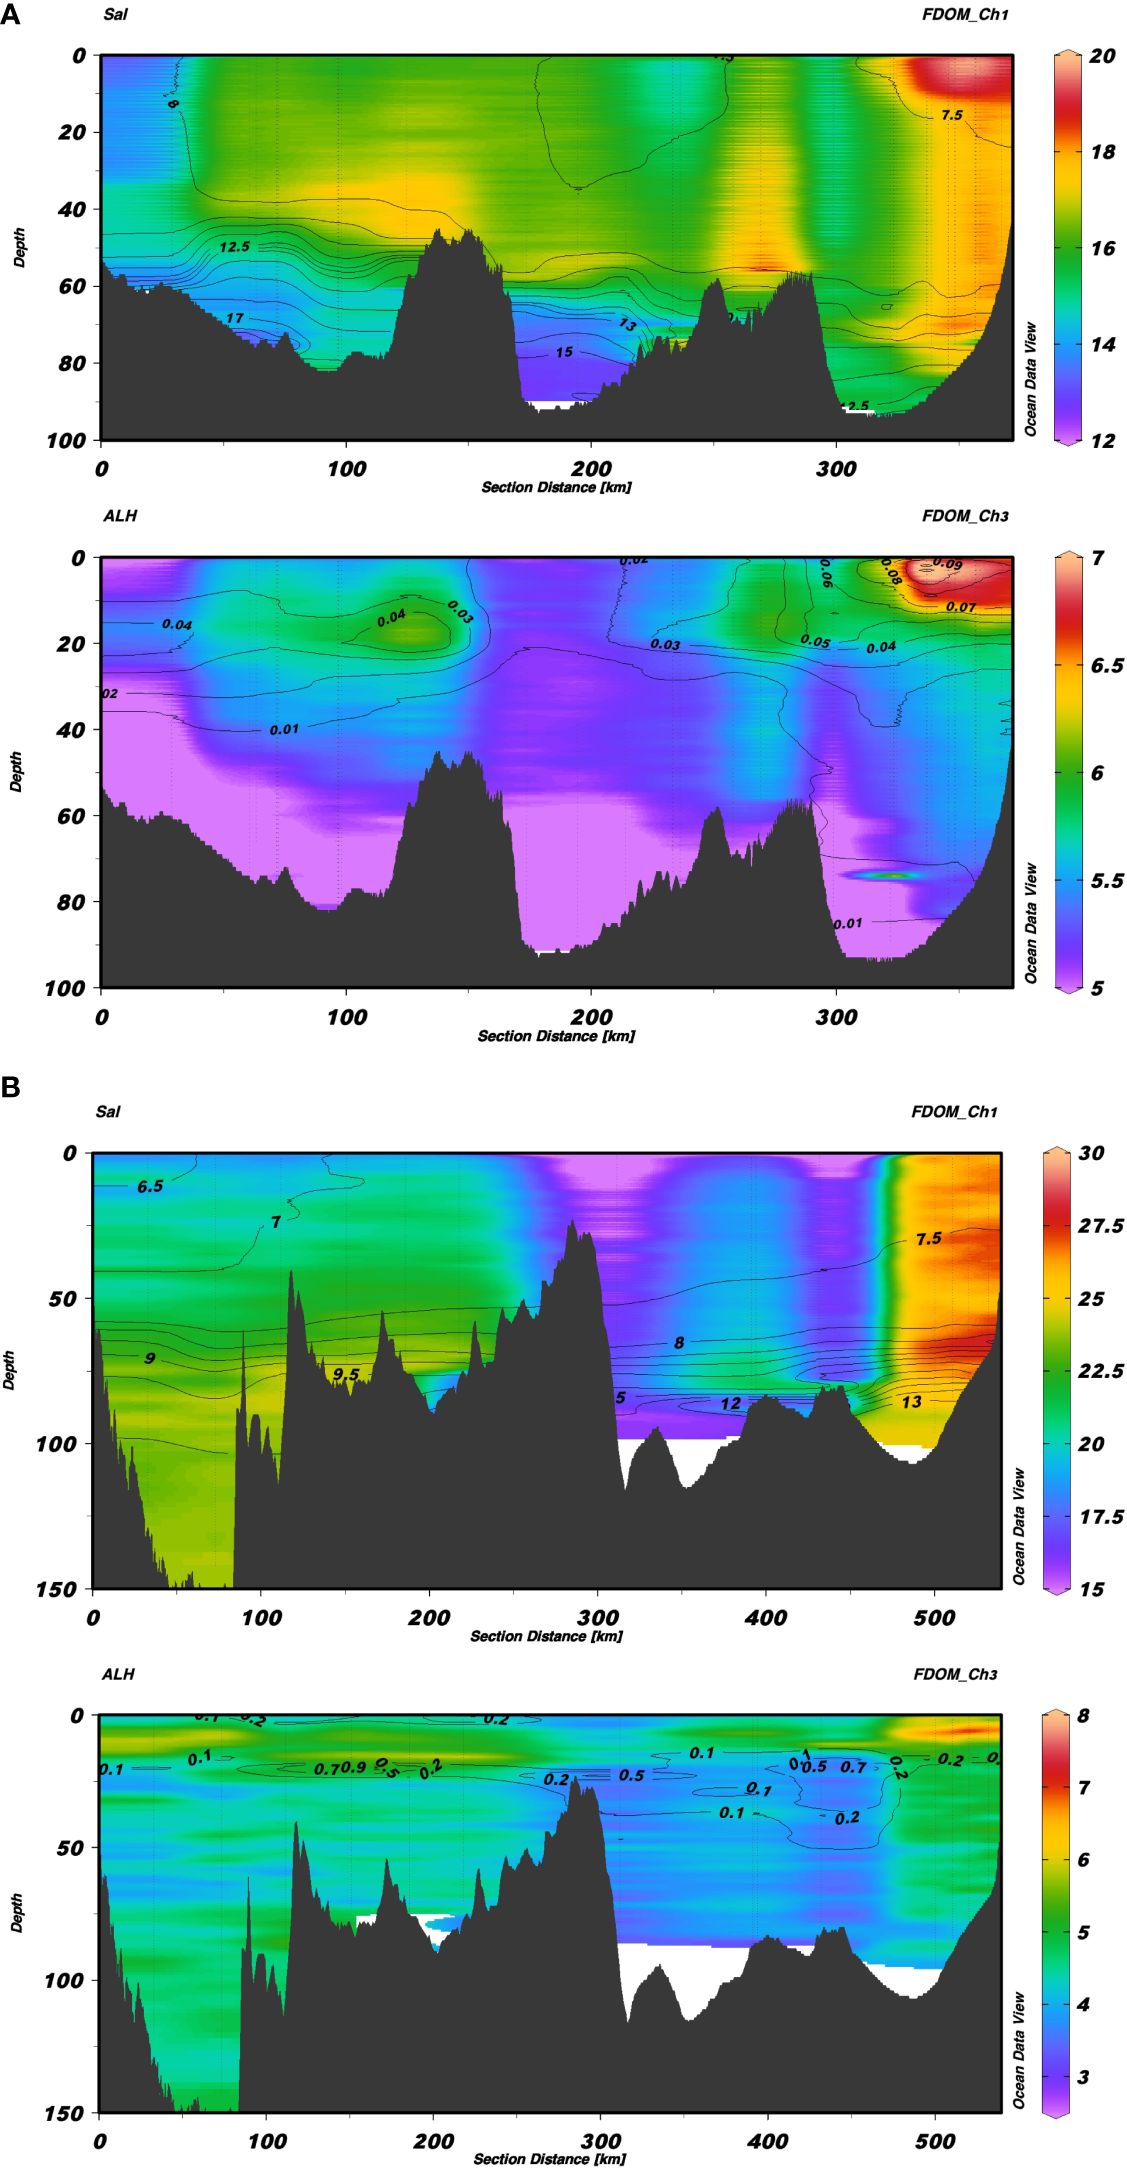
Figure 3 Section plots from Bornholm to the Gulf of Gdańsk (A) and from Gotland to the Gulf of Gdańsk (B). In each of the images, the top figure shows FDOM-Ch1 values with contour lines of salinity, while the bottom plot shows values of FDOM-Ch3 with contour lines of aLH(676).
In 2014, the monthly median values of SUVA254 in spring in deep waters varied between 2.97 and 4.0 m2 g-1. The optical survey repeated in the same area in 2015 revealed a decrease of SUVA254: from 2.97 to 2.78 m2 g-1 in Bornholm Deep waters, from 4.00 to 3.12 in Gdańsk and from 3.49 to 2.86 in Gotland Deep. Later in 2015, the values increased again (Supplementary Figure S3 in the Supplementary Material).
Water mass balance model results
Based on the results of the three end-member mixing models from the testing data subset (N=1194), a high correlation was observed between the calculated fractions fi and S for three different water masses, Figure 4. The Baltic Proper was split into two regimes, i.e., for S<7.5 and equal or greater than 7.5 (f2a and f2b), representing mixing of freshwater with the Baltic Proper (regression lines f1 and f2a) and of the Baltic Proper with the North Sea (regression lines f2b and f3). The coefficient of determination (r2) was lowest for the Baltic Proper at S<7.5 (f2a, r2 = 0.862) and highest for the North Sea end member (f3, r2 = 0.997). This demonstrates a very strong relationship between S and modeled fractions from the mixing model and can further serve as a solid basis to estimate water fractions per point based on S values for the entire data set.
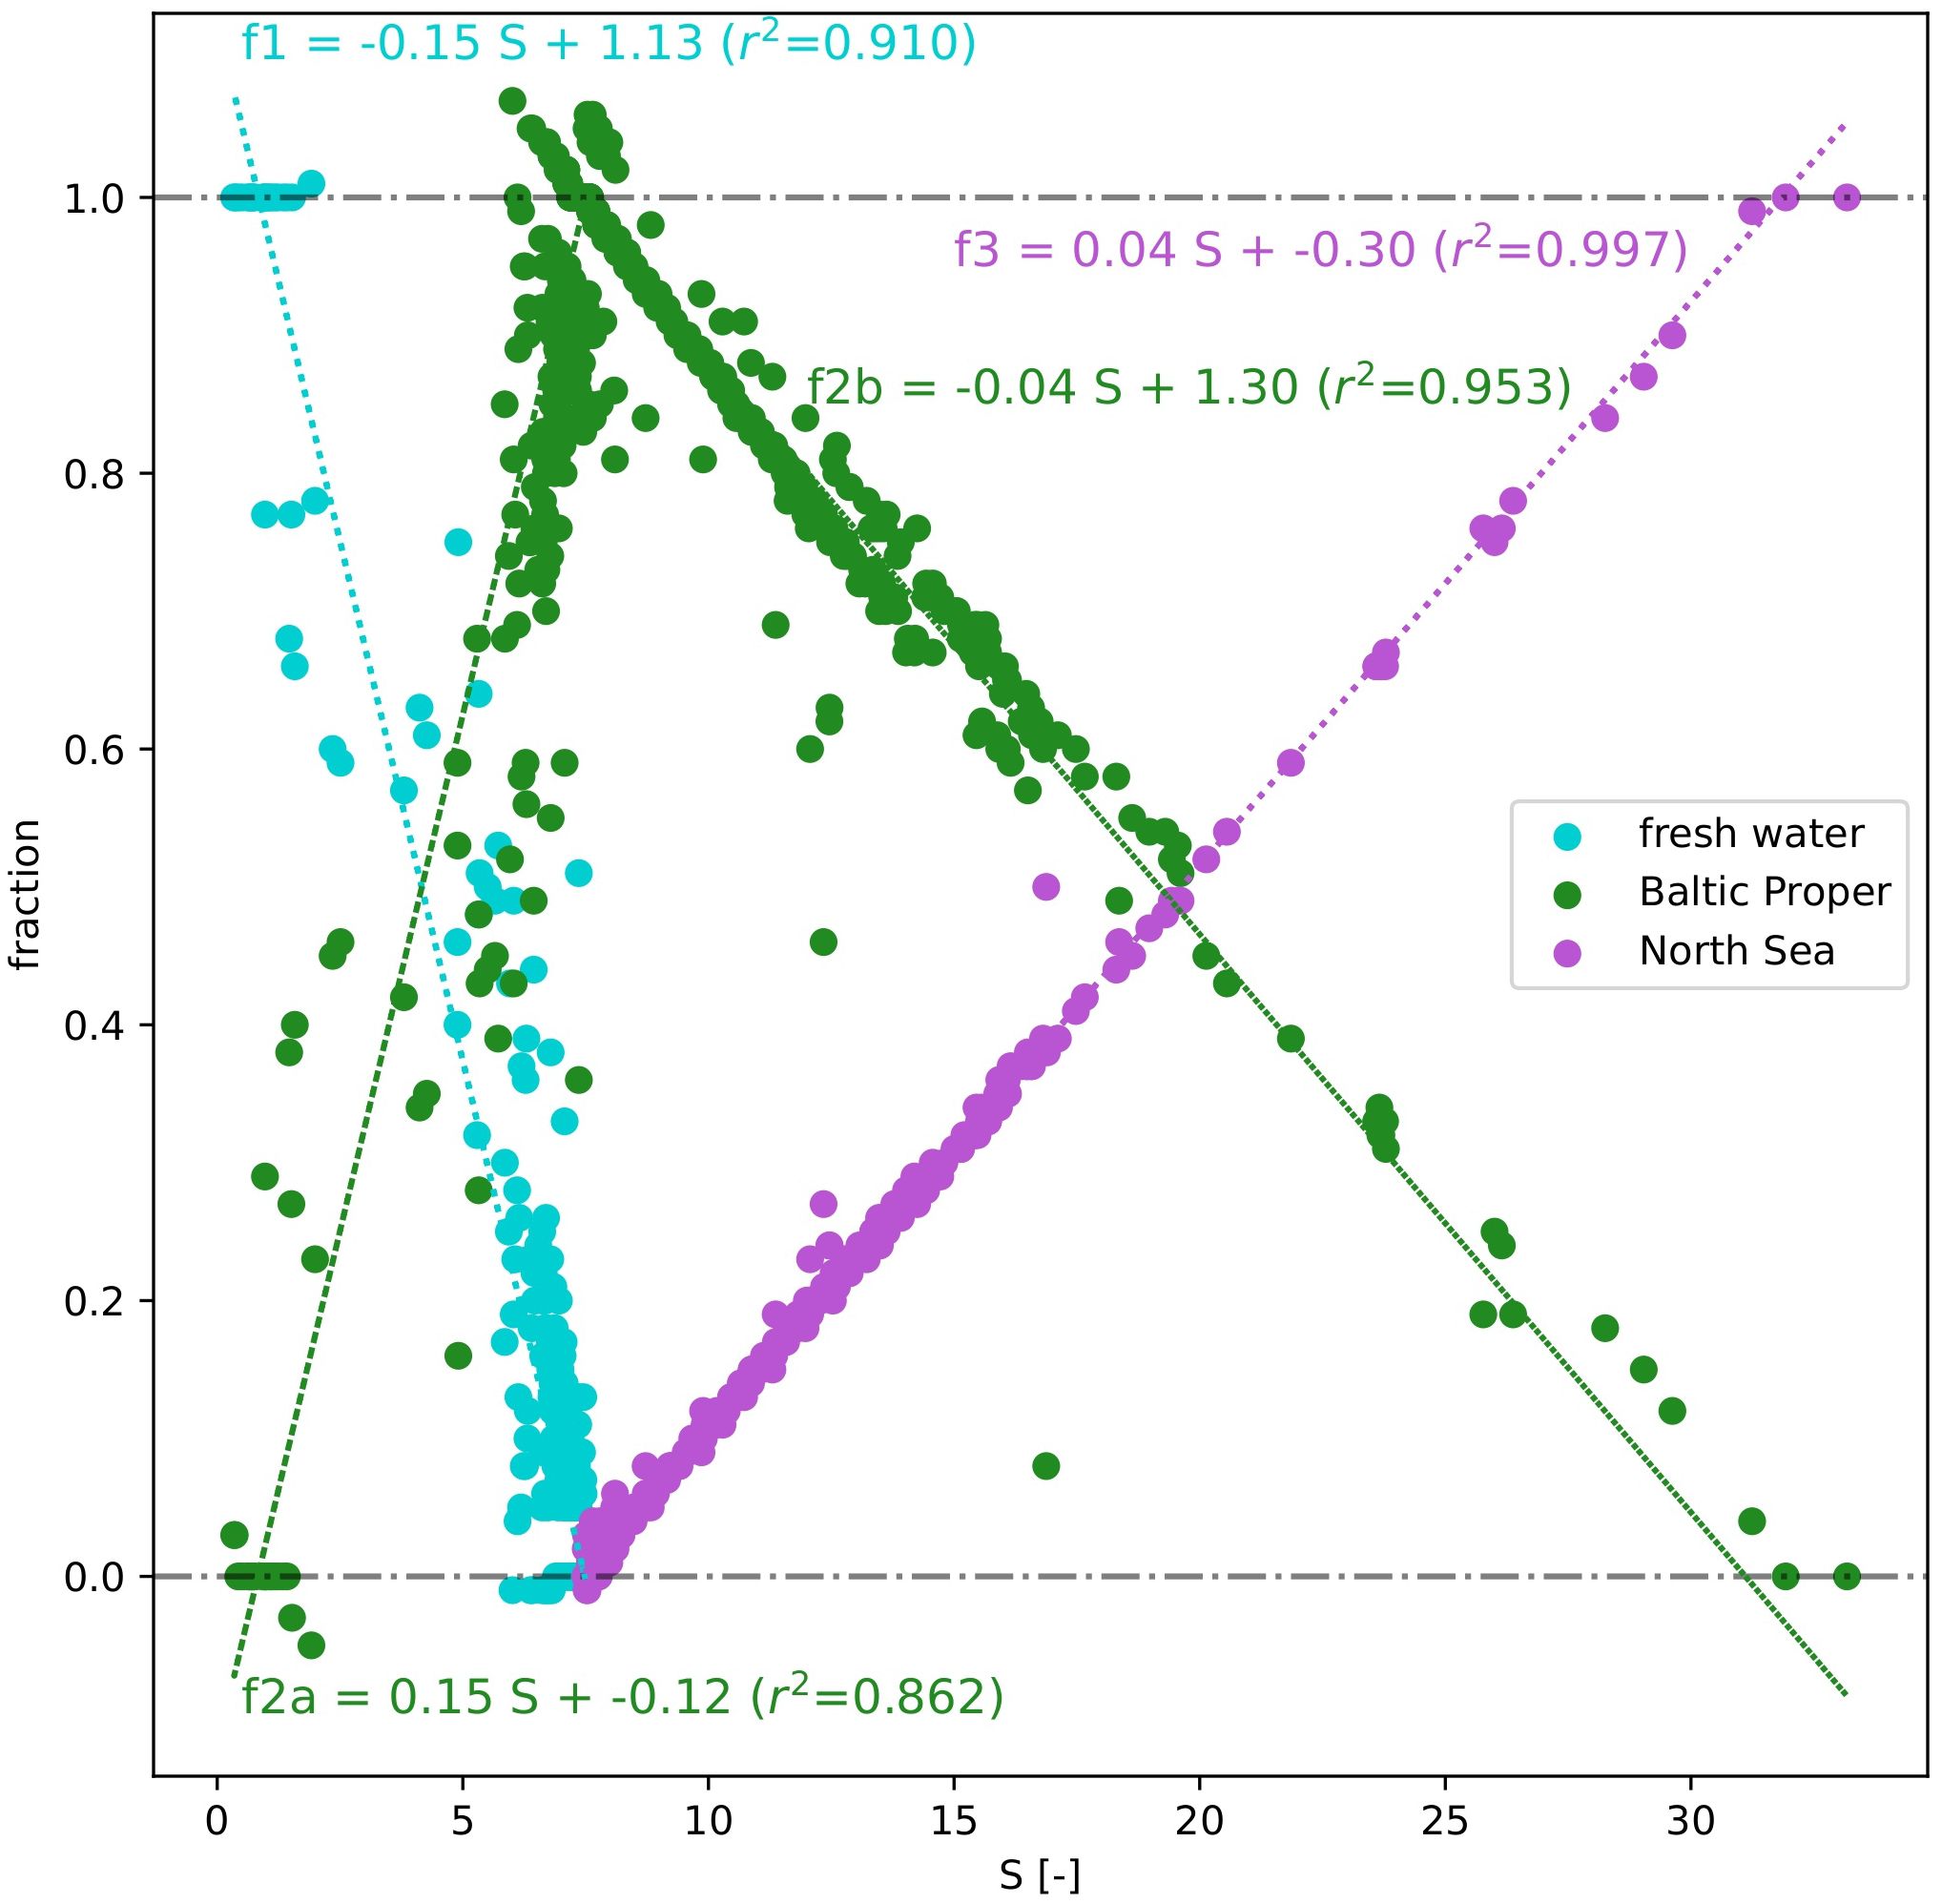
Figure 4 Regression analysis between salinity and calculated fractions f1, f2, and f3 (freshwater, Baltic Proper, and North Sea). The Baltic Proper is divided into two components: S<7.5 (f2a) and S>=7.5 (f2b).
The seasonal variability of the calculated fluorescence intensity residuals has revealed some repeating patterns in the Bornholm and Gotland basins, Figure 5. During winter, Bornholm showed positive residuals for the entire water column for FDOM-Ch1 and FDOM-Ch2, indicating accumulation, with median values increasing with depth in the majority of cases. Winter residuals of the protein-like fraction, FDOM-Ch3, in the same region indicated negative median values in SW and BSWW, implying DOM removal, and positive values in DW, suggesting accumulation. During spring, the median values of FDOM-Ch1 and FDOM-Ch2 residuals at SW and BSWW were negative and positive in DW. For the same season, median values of FDOM-Ch3 residuals revealed a similar depth distribution pattern as in winter. However, the values were up to two times higher, suggesting that DOM loss is compensated to some extent by local in situ production of protein-like FDOM during a spring phytoplankton bloom. The winter median of the FDOM-Ch1 residual in the Gotland Basin was negative in SW and showed positive values down along the water column. FDOM-Ch2 values for the same season were positive throughout the entire water column, while for FDOM-Ch3 they were negative. During spring, the depth distribution of the derived median residual values in the respective channels was similar to the one observed in the Bornholm Basin for the same season. In the surface mixed layer, the median residual values were negative for all channels, while in BSSW the median values were positive for FDOM-Ch1 and FDOM-Ch3 residuals, and negative for FDOM-Ch2. In DW, accumulation prevailed for FDOM-Ch1 and FDOM-Ch2 (positive residual values), while the opposite trend emerged for FDOM-Ch3, implying DOM loss (negative residuals).
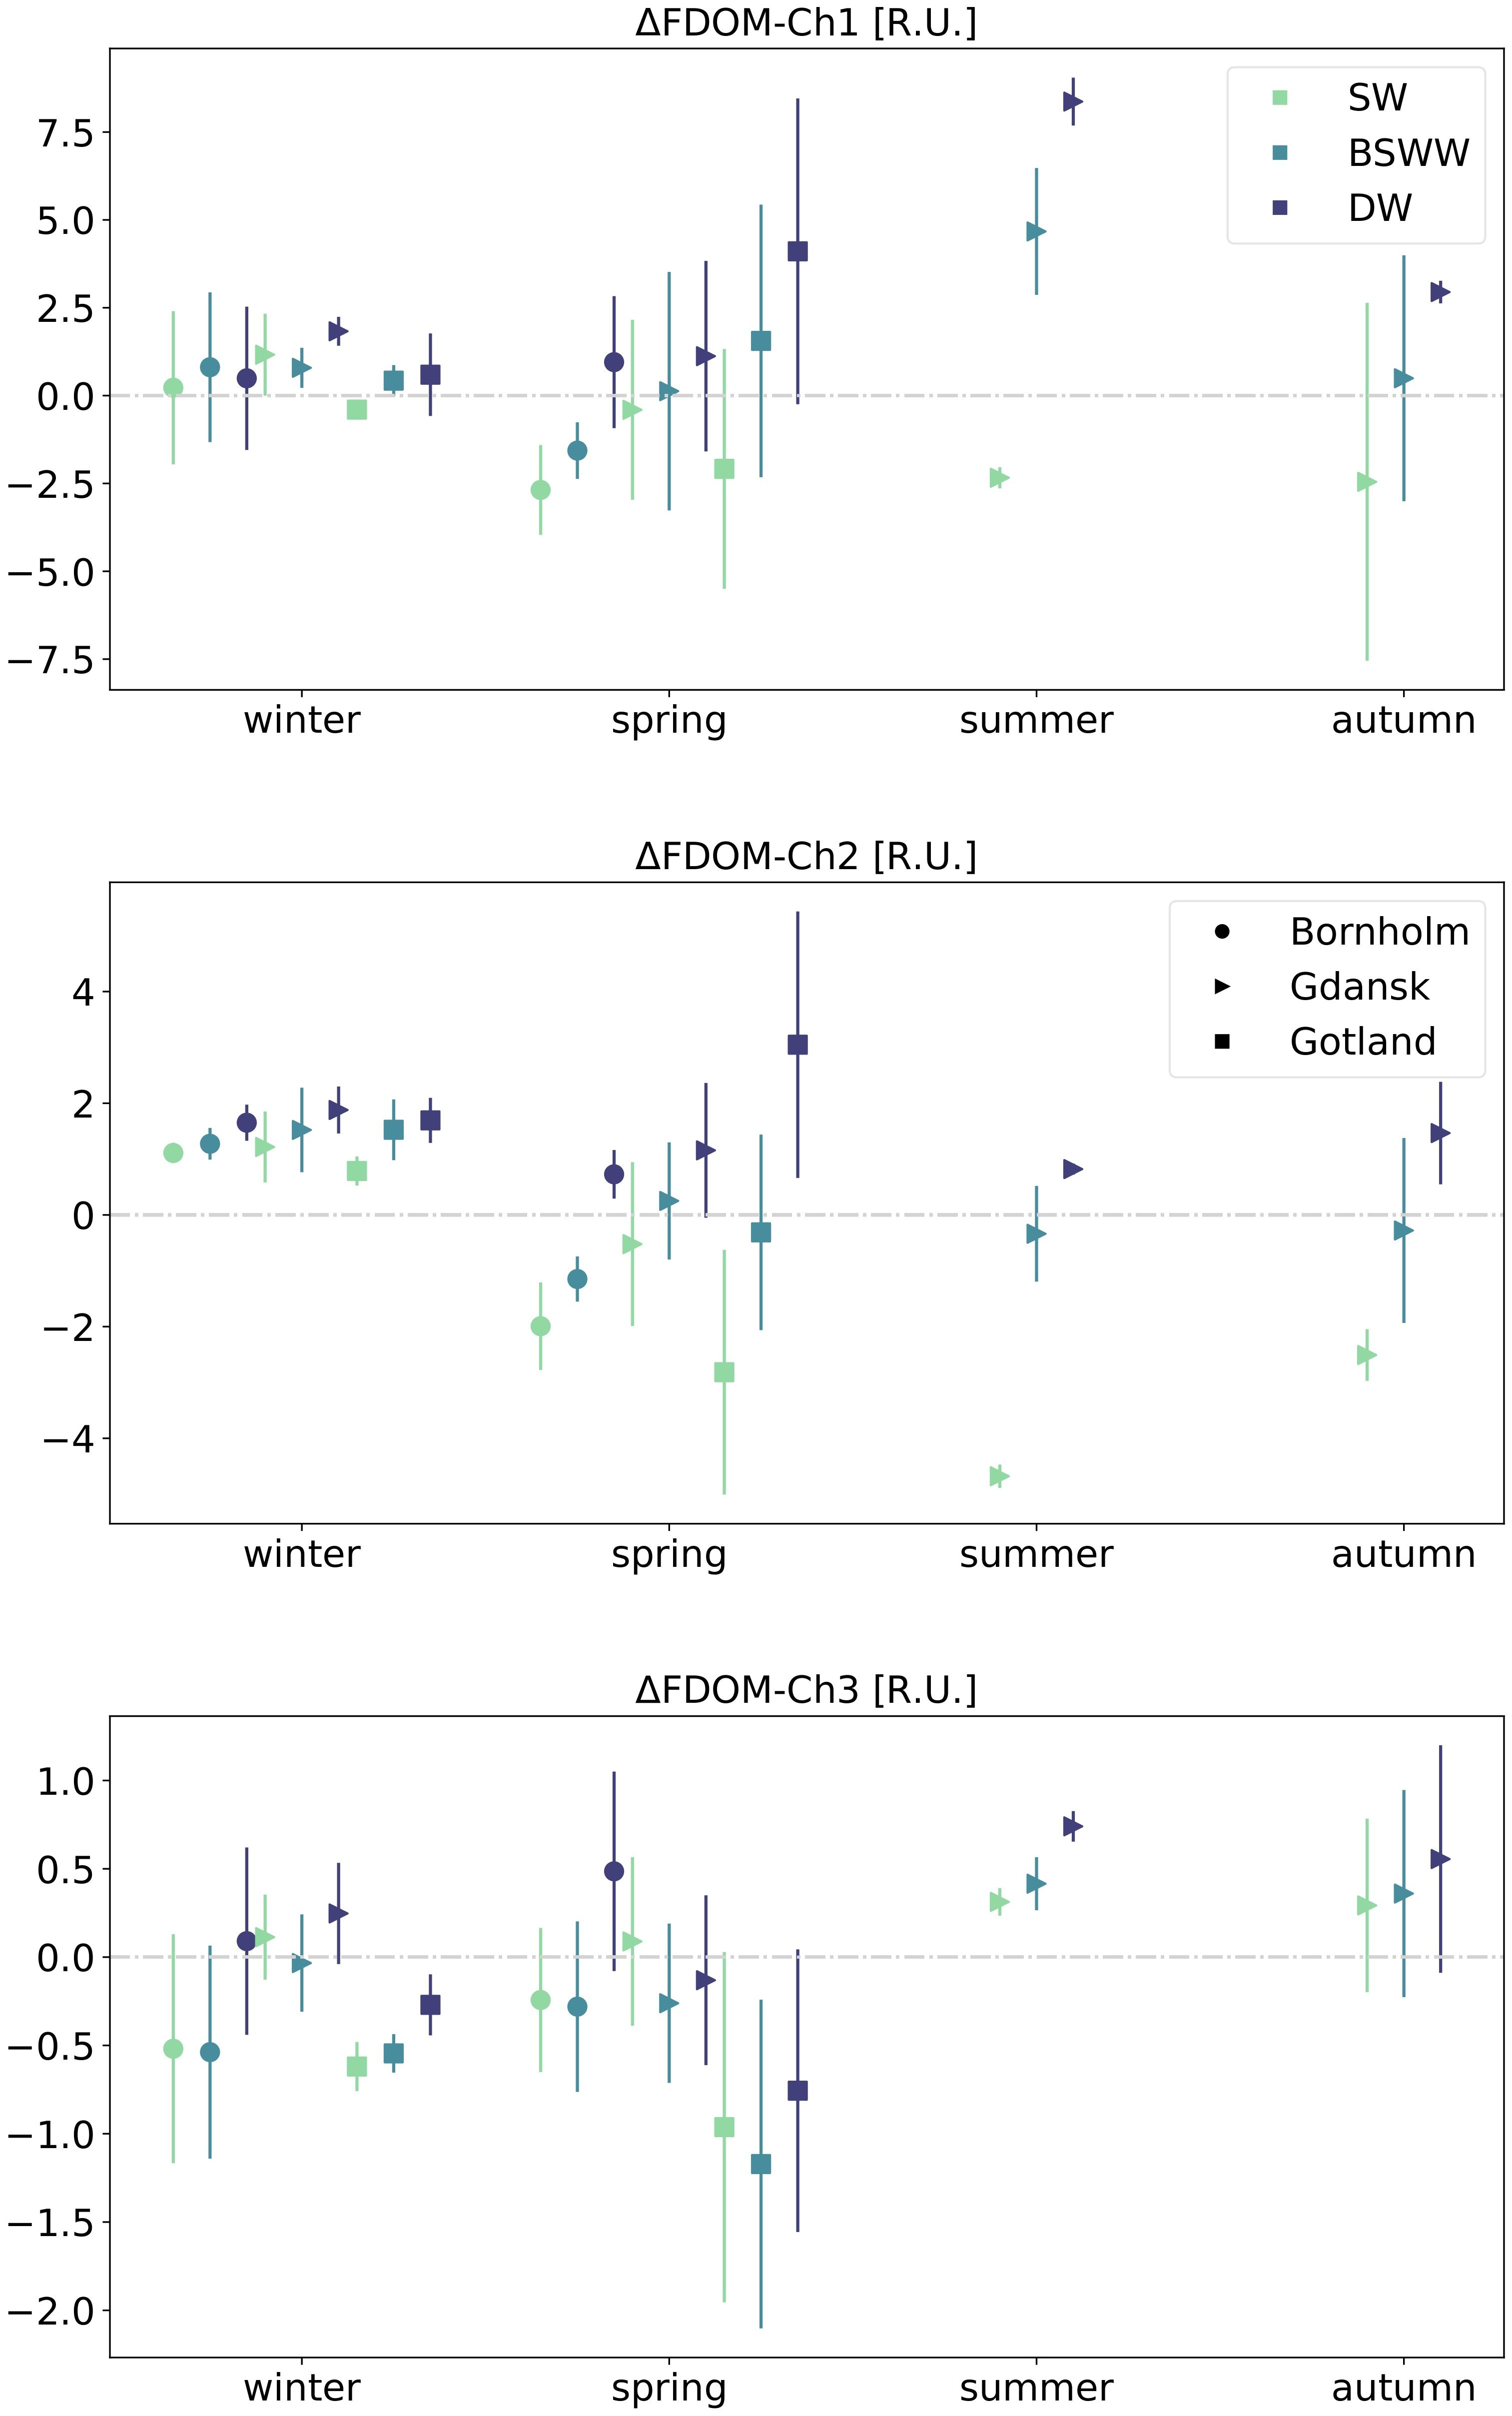
Figure 5 Seasonal median values and interquartile ranges of FDOM residuals for three water masses (SW, BSWW, and DW) and three different regions: Bornholm, Gulf of Gdańsk, and Gotland. The grey dash-dot line denotes the 0 line between positive and negative residuals.
Full seasonal cycles could be observed only in Gdańsk. During winter, the calculated median values of FDOM-Ch1 and FDOM-Ch2 residuals were positive for all water masses, and the values were generally higher for FDOM-Ch2. The median FDOM-Ch3 residual was positive in SW and DW and slightly below zero in BSSW. During spring, FDOM-Ch1 and FDOM-Ch2 residuals became negative in SW, were around zero in BSWW, and were positive in DW. This pattern was also consistent during summer and autumn for FDOM-Ch1, however, the negative values of the residuals were larger compared to spring, indicating a more efficient loss of the marine humic-like FDOM fraction and accumulation in BSSW. In summer and autumn, FDOM-Ch2 median residuals were negative in SW and BSSW, with higher values in BSSW that were closer to zero. During summer and autumn, the calculated median values of FDOM-Ch3 residuals were positive in all three depth layers.
Aggregated FDOM-Chi residual values were plotted as a function of AOU in the respective Baltic Sea basins, Figure 6. Median and quartile values of FDOM–Chi residuals were obtained as a function of 50 μmol kg-1 binned intervals of AOU. There is a clear trend of increasing FDOM–Chi values with increasing AOU, except for FDOM-Ch3 in Gotland. Increasing trends of FDOM-Chi as a function of AOU resemble an asymptotic curve, with residual values tending to saturate at region-specific ranges, i.e., 250, 300, and 300 μmol kg-1 for Bornholm, Gdańsk, and Gotland, respectively. The plots are specific for each region considered and are driven by the O2 concentration in DW, which is highest in Bornholm and lowest in Gotland. The asymptotic curve is purely an effect of the AOU calculation definition, with the maximum value obtained for anoxic conditions for O2 concentration approaching 0 value. However, anoxia does not limit DOM mineralization or transformation, as anaerobic bacteria are able to metabolize DOM using sulfur dioxide reduction reactions to hydrogen sulfide and sulfur as an energy source. These reactions result in a linear increase in the observed CDOM absorption and FDOM in anoxic sediments (Luek et al., 2017). At negative and low AOU values, indicating O2 oversaturation due to intensive production during phytoplankton blooms, FDOM-Chi residuals were negative in the majority of cases, therefore suggesting DOM decomposition under oxic conditions and possible photodegradation, coinciding with the strongest blooms during spring in surface waters.
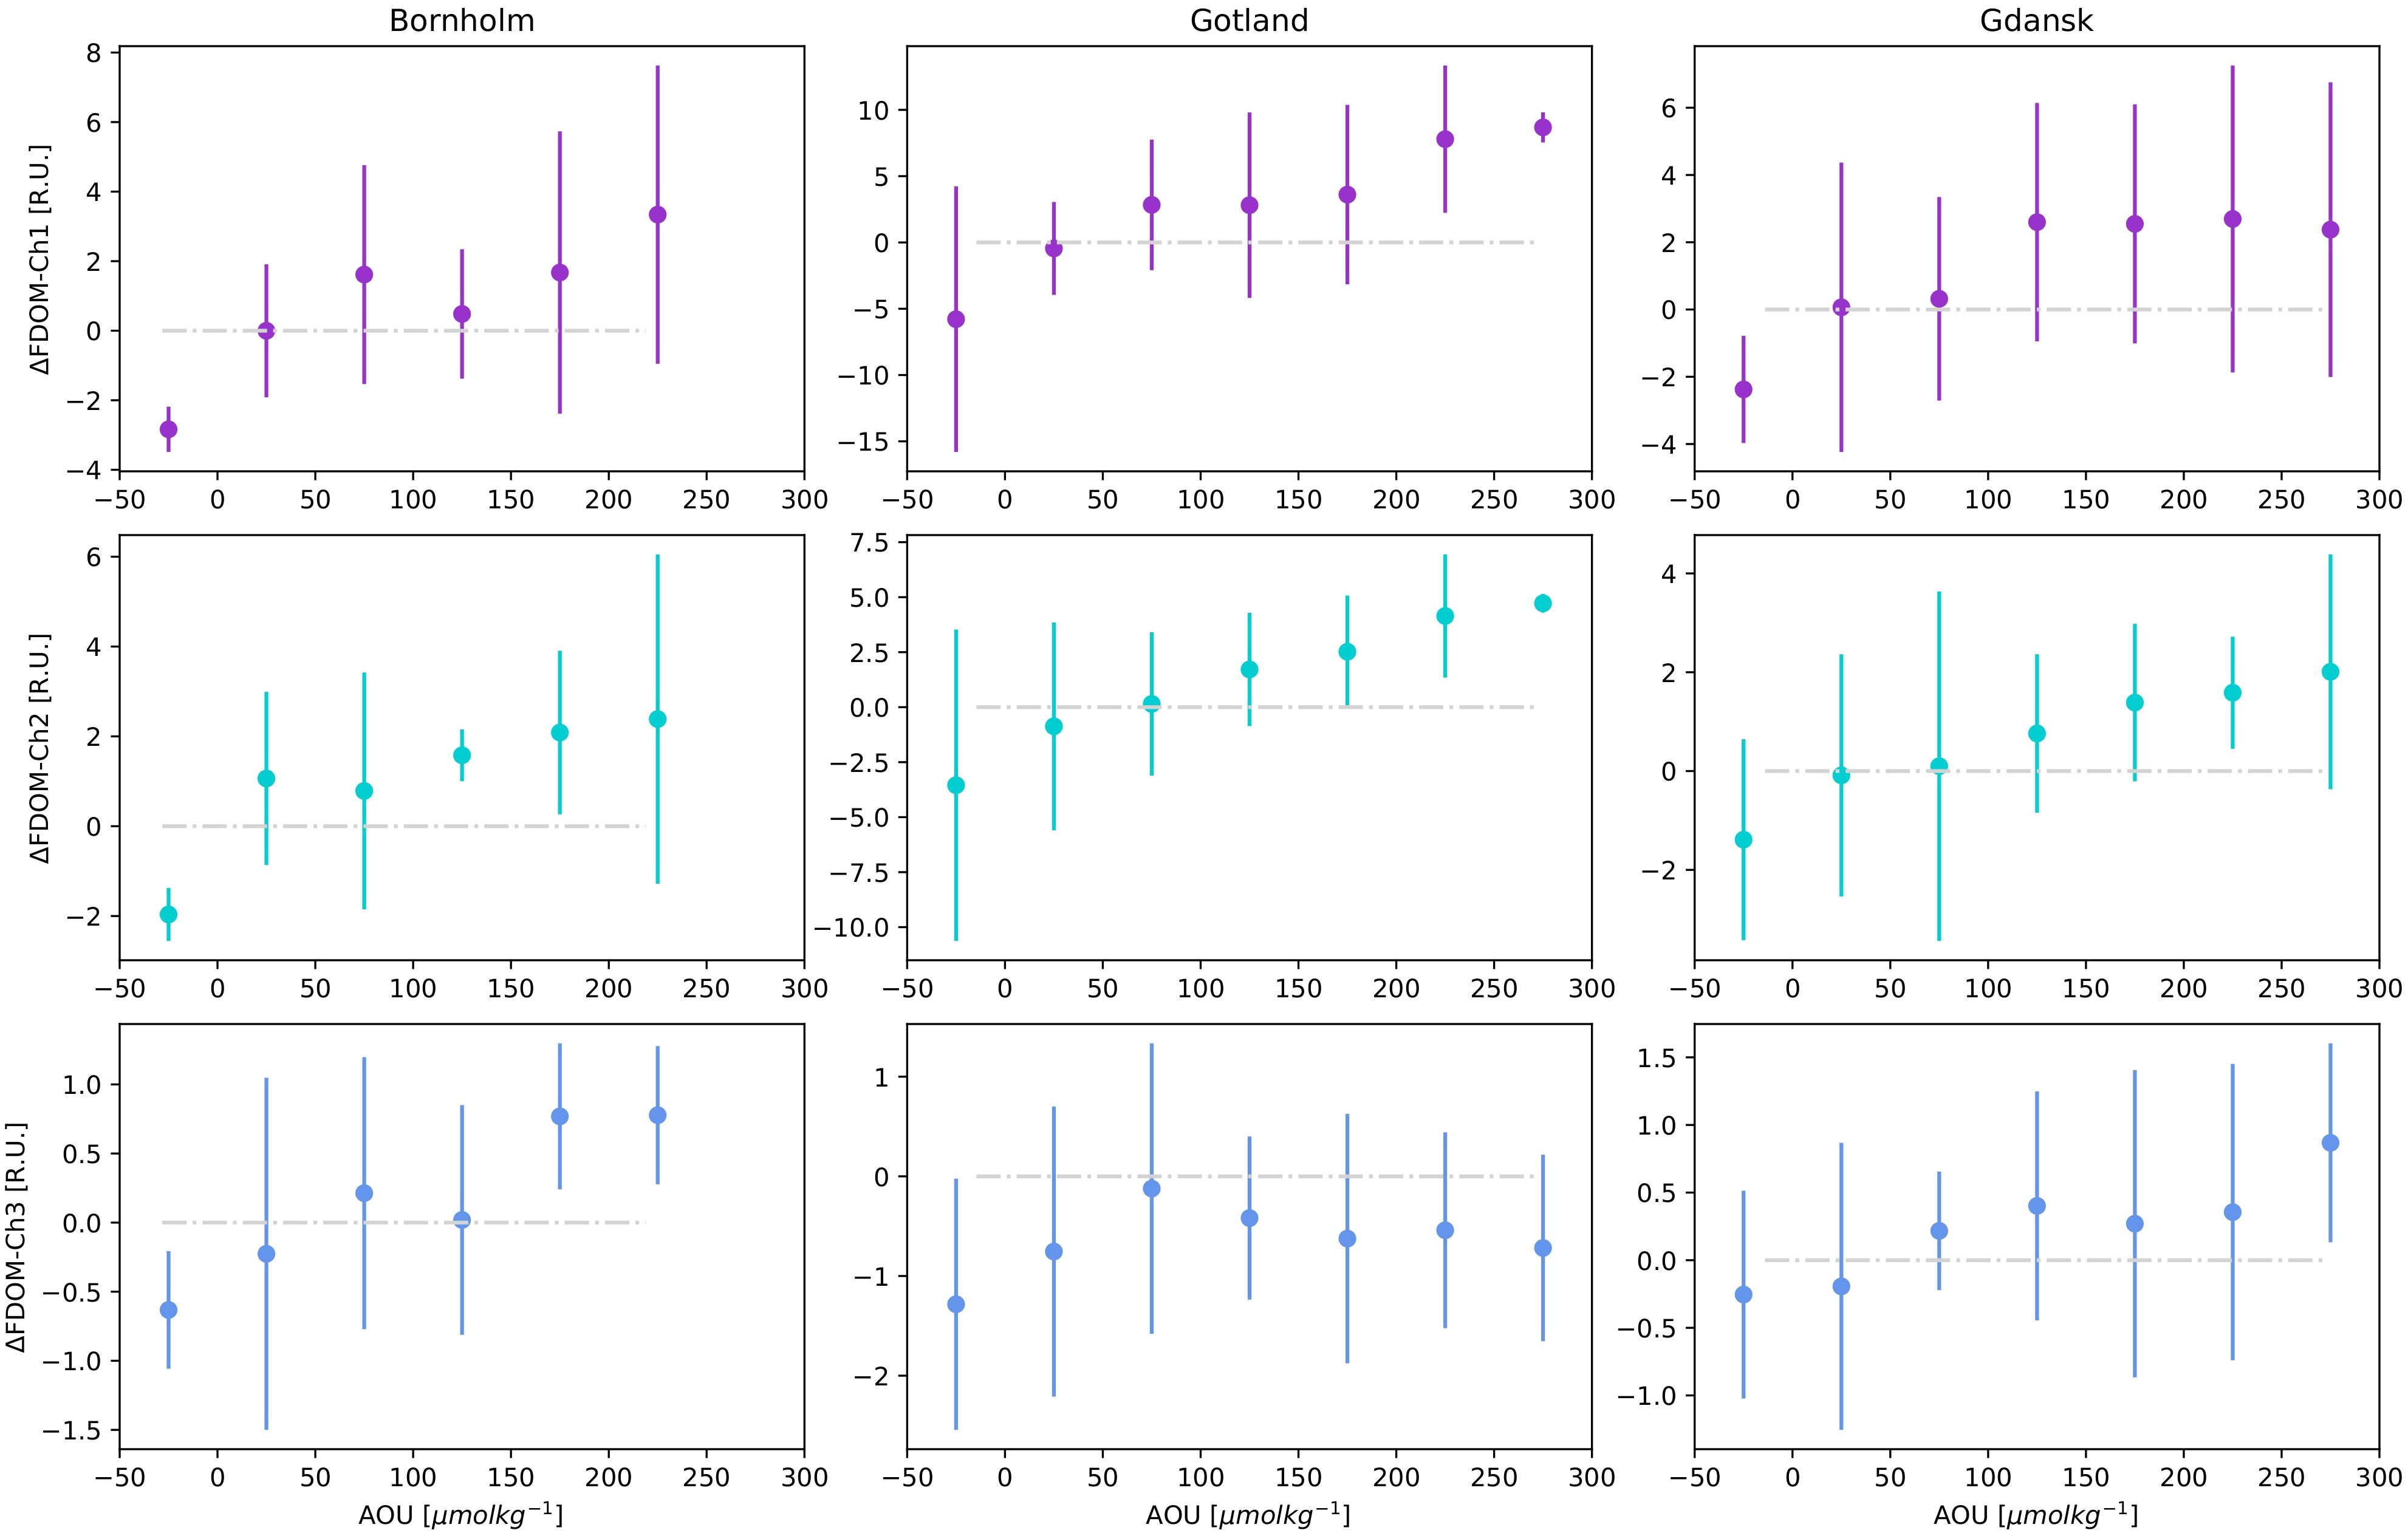
Figure 6 FDOM-Ch1,2,3 residuals median and IQR for AOU data binned in 50 μmol kg-1 intervals for three different regions: Bornholm, Gulf of Gdańsk and Gotland. The gray dashed-dotted line denotes the 0 line between positive and negative residuals.
For a more visual representation of the spatial distribution of the residuals, composite sections of the FDOM-Ch1 and FDOM-Ch3 residuals were plotted for the transects shown in Figure 1: from Bornholm to the Gulf of Gdańsk (Figure 7A) and from Gotland to Gdańsk (Figure 7B). Additional contour lines of AOU (Figures 7A, B, top panels) and aLH(676) (Figures 7A, B, bottom panels) were added for FDOM-Ch1 and FDOM-Ch3, respectively. For the transect from Bornholm to the Gulf of Gdańsk, FDOM-Ch1 residuals increased with depth, with values accumulating in the bottom layers (Figure 7A, top panel) and were well correlated with the highest values of AOU. Patches of negative residuals followed negative AOU lines. For FDOM-Ch3, positive residuals were well aligned with the highest values of aLH(676) at the surface patch in the Gulf of Gdańsk and the subsurface positive residual value following the subsurface chl a maximum around 150 km from the starting station in Bornholm (Figure 7A, bottom panel). For the Gotland-Gulf of Gdańsk transect, the FDOM-Ch1 residuals were negative at the surface in Gotland, with zero values around 50 m, followed by positive residuals toward the bottom (Figure 7B, top panel). In contrast to the Bornholm-Gdańsk transect, the AOU isolines were observed to be horizontal, indicating water column stability, especially in deep water in the northern part of Gotland (0 – 100 km). This feature could indicate prolonged stagnation and FDOM accumulation due to the dissolution of particulate organic matter (POM) or its microbial degradation. In the central part of the transect, in the depth range 0–80 m (southern edge of Gotland Basin - around 300 km), FDOM-Ch1 residuals were found to be lower, for both positive and negative values, which could indicate a partial renewal of the water column due to convective mixing during winter. FDOM-Ch1 residuals increased again toward the Gulf of Gdańsk, where FDOM-Ch1 residual values were positive along the entire water column, denoting accumulation due to the lateral transport of terrestrial inputs from the Vistula river and release of FDOM from sediments below the pycnocline (at depths>70 m). Values of FDOM-Ch3 were negative throughout the entire section with a few exceptions in patches that correlated with the highest values of aLH(676), Figure 7B, bottom panel. This could be attributed to a quick heterotrophic uptake of the protein-like FDOM fraction produced by autotrophic protists. This is in line with the generally lower productivity of the Gotland Basin compared to the Gdańsk and Bornholm Basins. Moreover, it also coincides with a declining phase of the spring bloom (May), which was confirmed by lower aLH(676) values measured in the Gotland and Gdańsk Basins during this period.
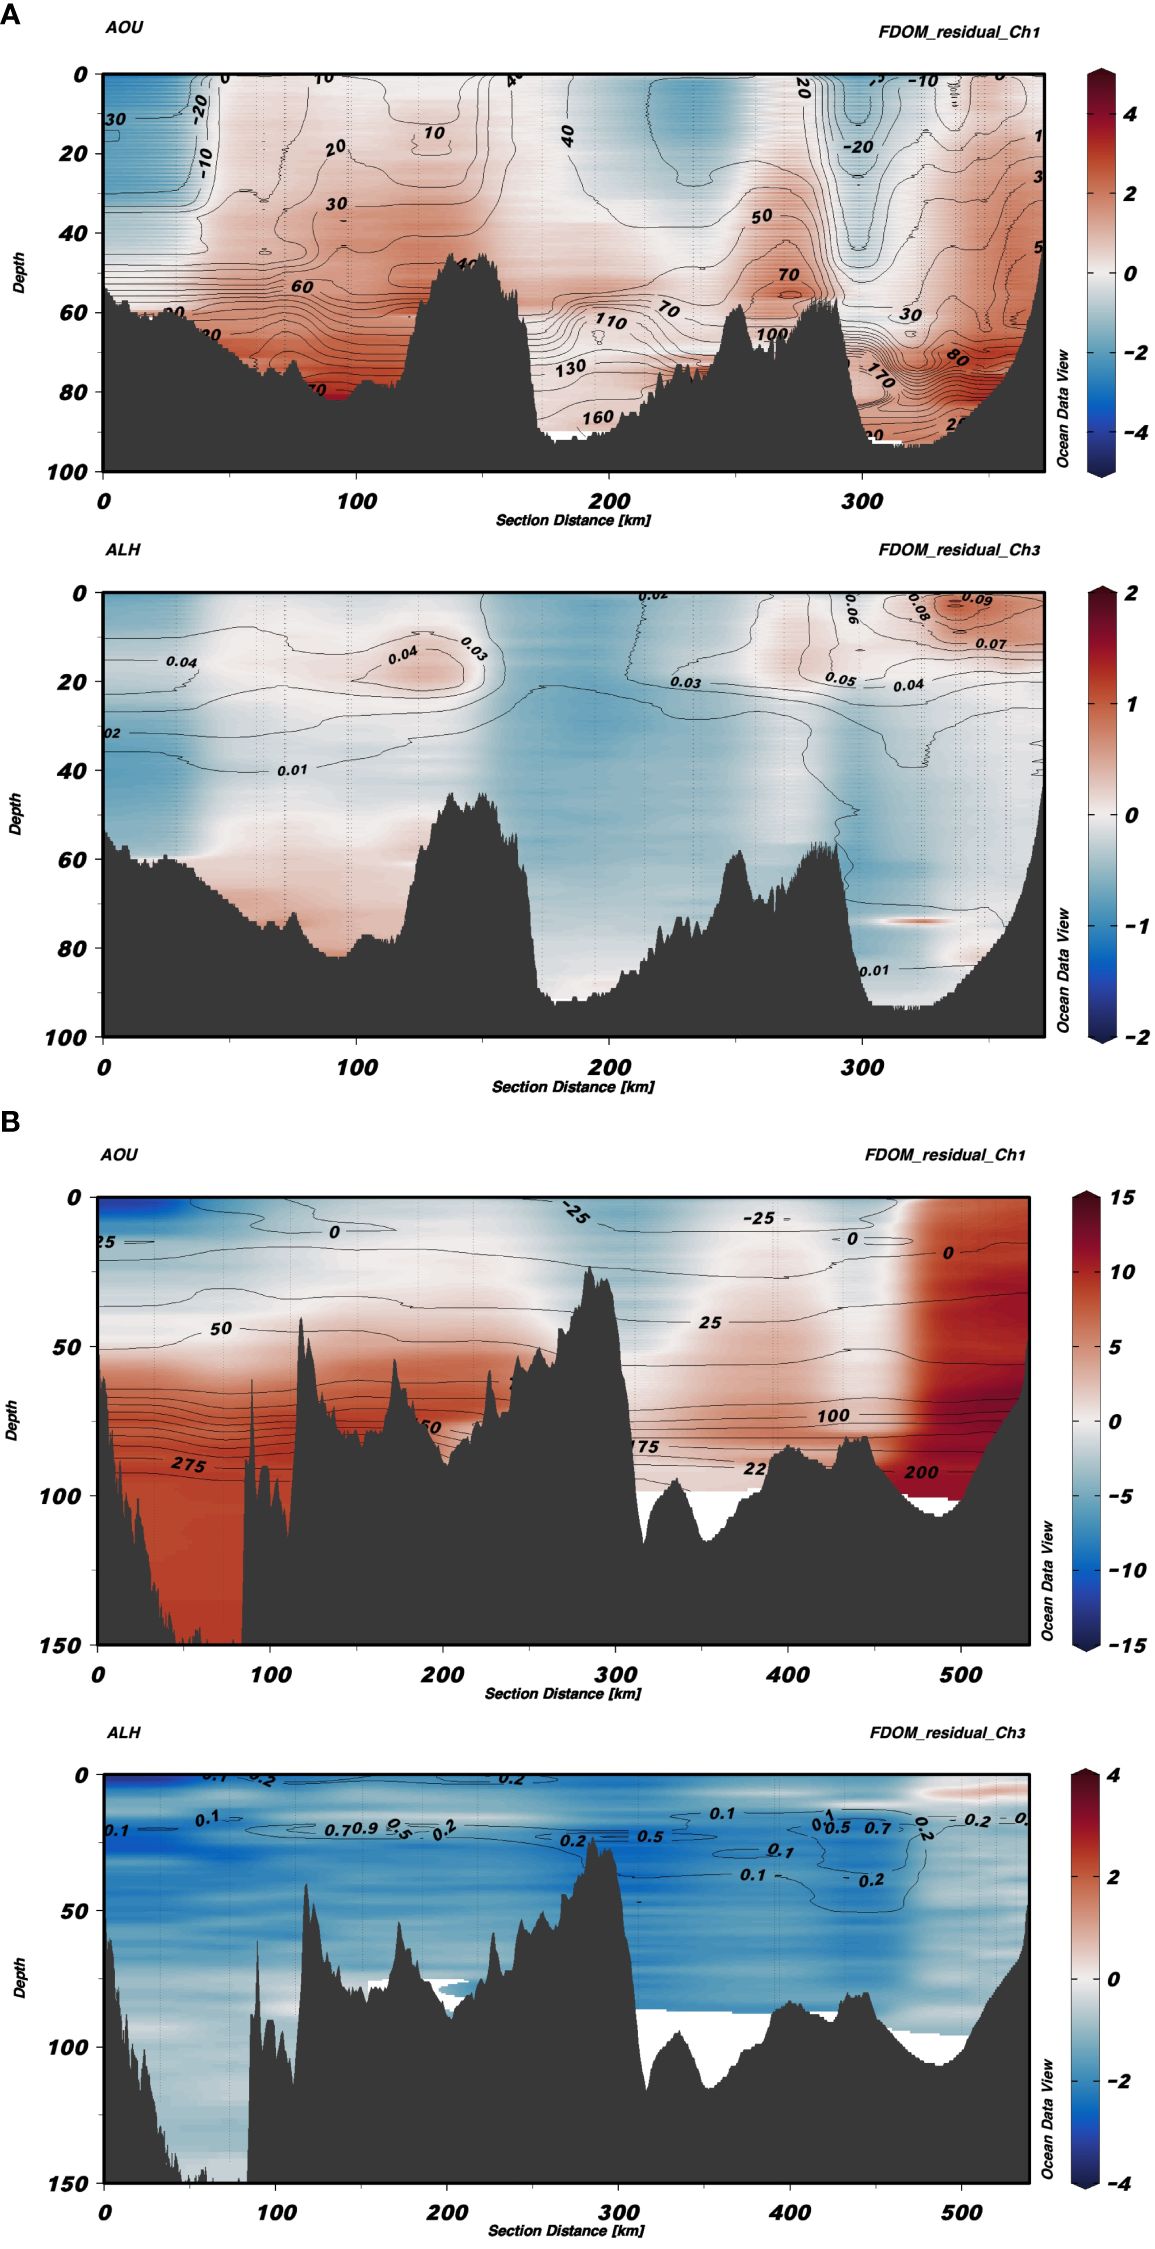
Figure 7 Section plots from Bornholm to the Gulf of Gdańsk (A) and from Gotland to the Gulf of Gdańsk (B). In each of the images, the top figure shows FDOM-Ch1 residuals with contour lines of AOU, whereas the bottom figure shows residuals for FDOM-Ch3 with contour lines of aLH(676).
In order to obtain DOC concentrations, a linear regression between FDOM-Ch1 measurements and aCDOM(350) was obtained from the testing dataset, from which fractions of different water masses fi were derived, resulting in an overall strong correlation (r2 = 0.891, Supplementary Figure S3 in the Supplementary Material). This in turn allowed the calculation of aCDOM(350) from the absolute value of the median FDOM-Ch1 residuals based on the entire dataset at 1 m vertical resolution. DOC was then retrieved from the power law regression formula, using the dataset described in the Methods section, taking into consideration N=1365 measurements in the Baltic Sea between 0 and 30 m (Supplementary Figure S4 in the Supplementary Material). Surface aCDOM(350) and DOC values covered a full range of variability of both parameters observed in the Baltic Sea: aCDOM(350): 1 – 10 m-1, DOC: 200 – 1000 μmol l-1. The inclusion of an additional 300 samples collected at depths >30 m neither improved nor worsened the goodness of the regression (r2) and had a negligible impact on the uncertainty of the DOC estimations (data not shown). The obtained coefficient of determination (r2) is consistent with the findings in Figure 4 in (Massicotte et al., 2017), which obtained similar values for the coastal and oceanic environments (r2 = 0.49 and 0.44, respectively). However, their relationship between DOC and aCDOM(350) was tested in a wider range of different ecosystems. For each of the three regions, a vertically integrated value of DOC was then calculated for the regions of net accumulation/removal of FDOM-Ch1 median residuals, Figure 8. This indicates how much carbon is stored below the halocline and how much is lost above it. Gotland appears to be the region with the highest DOC concentration as a carbon source from 44 to 110 m (228.3 g m-2), followed by Gdańsk (198.78 g m-2) from 38 to 100 m and Bornholm between 46 and 80 m (135.73 g m-2). Bornholm is also the basin with the highest DOC losses (139.60 g m-2), closely followed by Gotland (138.18 g m-2), while the lowest values are in Gdańsk (118.52 g m-2), the latter being consistent with the constant replenishment of surface waters by riverine discharges.
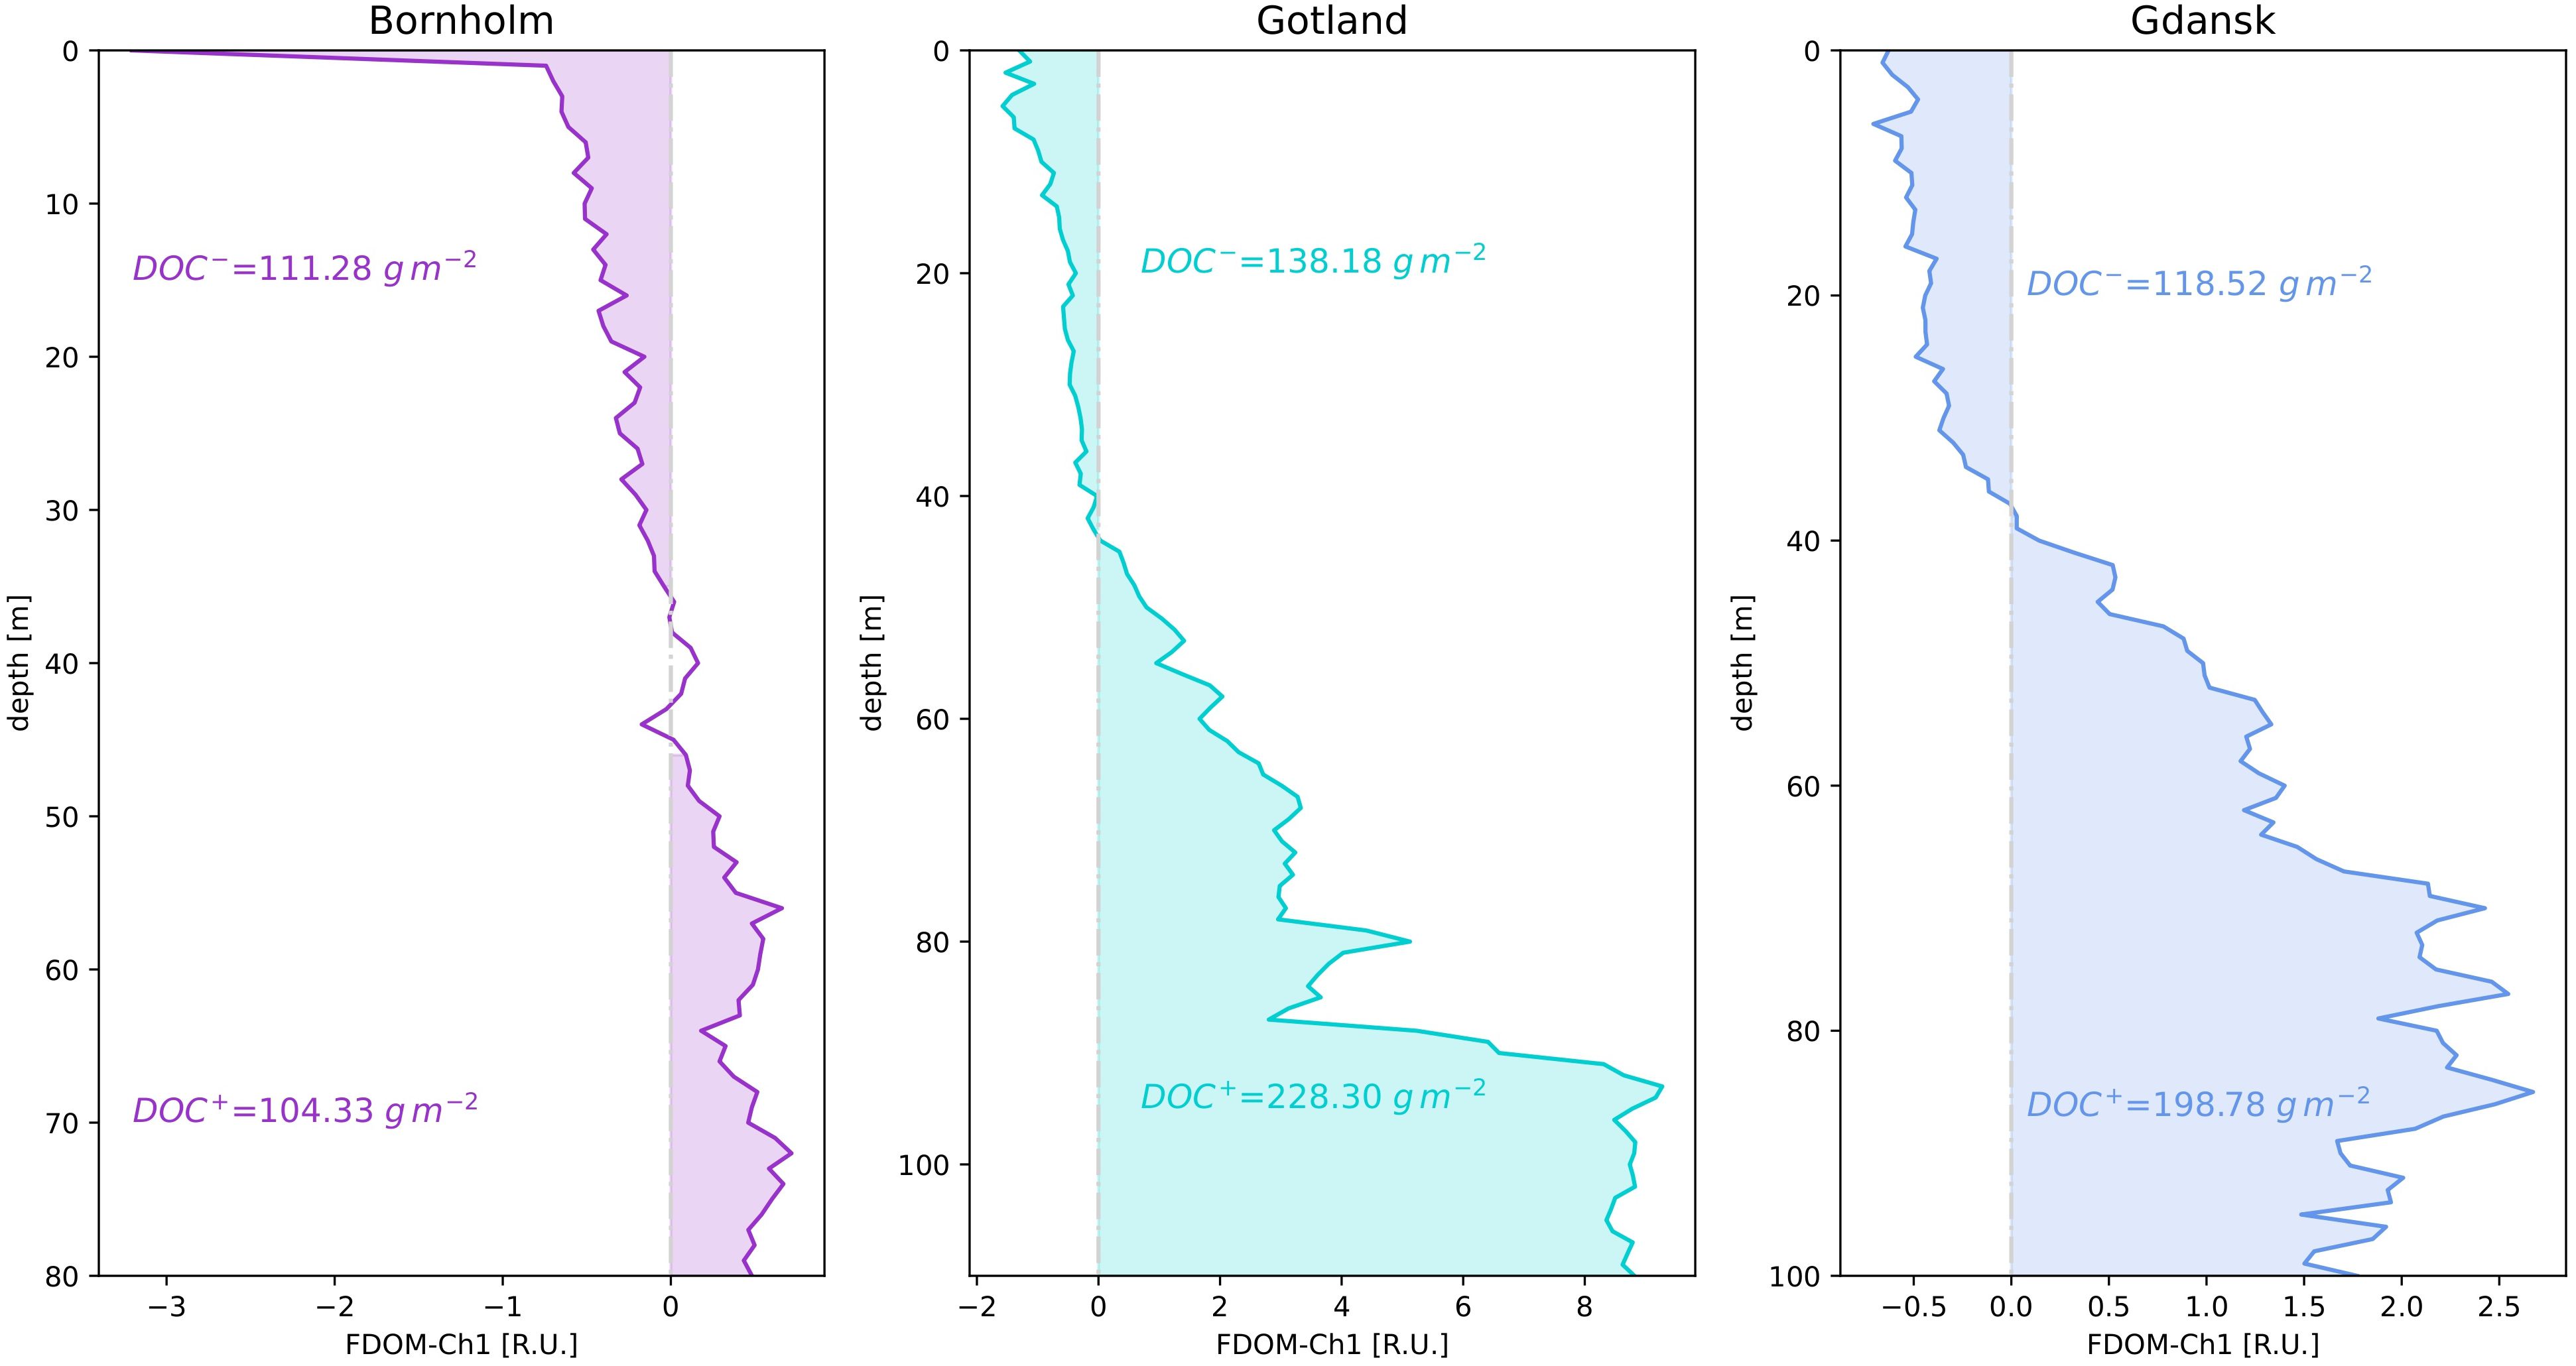
Figure 8 Vertically integrated values of DOC concentration [gm-2] for each of the three examined regions for the areas of net accumulation (FDOM-Ch1 median residual > 0) and decomposition (FDOM-Ch1 median residual< 0).
Discussion
Spatio-temporal variability of FDOM measurements
The seasonal and spatial variability of the optical properties of DOM has been the subject of numerous studies in the Baltic Sea (Kowalczuk, 1999; Kowalczuk et al., 2005a; Kowalczuk et al., 2010b; Stedmon et al., 2010; Kowalczuk et al., 2015; Ylöstalo et al., 2016; Kratzer and Moore, 2018). The seasonal and spatial distribution of fluorescence intensities at three different channels with distinct excitation and emission characteristics aligned well with already published studies on the optical properties of DOM in the Baltic Sea. The continuous discharge of terrestrial DOM into the Baltic Sea coastal zone has a very significant impact on the optical properties of the Baltic Sea (Kowalczuk et al., 2005a; Simis et al., 2017; Kratzer and Moore, 2018). The well-established seasonal cycle controls the freshwater discharge to the Baltic Sea and thus determines the seasonal variability of CDOM/FDOM (Kowalczuk, 1999). The dispersion of the riverine plumes and their mixing with marine water is a primary controlling mechanism for the CDOM/FDOM variability in the SW and BSWW, which was confirmed by the strong correlation between DOM optical parameters (CDOM and FDOM) and salinity. Therefore, the highest values of FDOM-Ch1 and FDOM-Ch2 were always found near the coast, especially in the Gulf of Gdańsk (Figure 3). The increase in salinity was usually associated with a decrease in FDOM-Ch1 and FDOM-Ch2 values with depth, as shown in Figure 3. The exception proved to be the northernmost part of the western Gotland Basin, where the impact of inflows is less pronounced. Non-linear processes, such as photodegradation and bacterial reworking, could also be observed in the measured FDOM values, especially in regions where physical mixing has had the least impact, such as the central Gotland Basin (Dera and Woz´niak, 2010). Summer creates favorable conditions for effective photodegradation of DOM in the Bornholm and Gotland basins, especially for FDOM-Ch1 and FDOM-Ch2, which are most susceptible to photodegradation. Lower FDOM-Ch1 and FDOM-Ch2 values are present in spring in SW compared to other seasons, with the lowest median of FDOM-Ch2 in SW in Gotland. The fluorescence intensity of humic-like FDOM fractions tended to increase with depth. This could be partially explained by the seasonal deepening of the thermocline and the associated vertical transport of DOM into the Baltic Sea with terrestrial discharge. The microbial decomposition of POM from sinking phytoplankton cells and marine snow after the bloom is another factor causing FDOM-Ch1 and FDOM-Ch2 values to increase in BSWW, as observed in the northernmost part of the western Gotland Basin.
The available literature poorly describes the protein-like fluorophores cycle in the Baltic Sea (Stedmon et al., 2007). It has been previously shown that the content of these fluorophores (quantified by fluorescence intensity) increases disproportionately with salinity, most likely due to the input from autochthonous production or as a product of photodegradation of humic-like components (Kowalczuk et al., 2005b; Stedmon et al., 2007). The impact of these processes was effectively worsening the relationship between FDOM-Ch3 intensity and salinity, which was characterized by the lowest correlation (data not shown). Although the highest FDOM-Ch3 intensity was observed in the Gulf of Gdańsk (Figure 3), it could be the effect of the protein-like DOM fraction inflow, embedded in a vast array of organic compounds carried by freshwater (Kowalczuk et al., 2009). Another factor could be related to the loading of significant amounts of inorganic nutrients (Pastuszak et al., 2012), which stimulate phytoplankton growth and primary production in the region (Zdun et al., 2021; Ostrowska et al., 2022). Both the input of terrestrial DOM and the enhanced local production therefore significantly impact the seasonal distribution of FDOM-Ch3, especially in surface waters, as shown in Figure 2. This study demonstrated a quantitative dependence between FDOM-Ch3 intensity and the optical proxy of phytoplankton biomass (Supplementary Figure S1 and Supplementary Figure S2). The weaker regression significance could be caused by a lag between phytoplankton bloom development and DOM dynamics, as the highest chl a does not coincide with the peak of FDOM-Ch3 intensity (Nelson et al., 1998; Loginova et al., 2015). The intensity of the protein-like FDOM fraction decreased with depth (Figure 3) most likely due to microbial decomposition. FDOM-Ch3 is regarded as being the most bioavailable and susceptible to microbial reworking as it is enriched in nitrogen (Stubbins et al., 2014) and could act as an organic nutrient stimulating the microbial community (Stedmon and Markager, 2005; Stedmon and Cory, 2014).
Conceptual model of the cycling of humic-like and protein-like DOM fractions in the Baltic Sea
The results of the mixing model and residual analysis allowed us to discriminate between linear processes associated with the dilution of terrestrial DOM, and the mixing of different water masses from non-linear processes affecting the spatial and seasonal distribution of the majority of the different DOM fractions. This allowed us to propose a generalized model of DOM cycling in the Baltic Sea using FDOM intensity residuals for humic and protein-like fluorophores, Figure 9. The dominant non-linear process impacting DOM in surface waters is photobleaching, which decomposes the humic fraction, which is most susceptible to photodegradation (Vecchio and Blough, 2002). This process is most effective in the UV-C waveband (350–380 nm) (Vecchio and Blough, 2002) and contributes to the direct mineralization of CDOM/FDOM to CO and CO2 (Miller and Zepp, 1995; Moran and Zepp, 1997). Photodegradation has already been observed in the Baltic Sea, both in field studies (Kowalczuk et al., 2005b; Stedmon et al., 2007) and in dedicated experiments (Grzybowski, 2000). Another product of CDOM photodegradation consists of low molecular weight (LMW) DOM (Stedmon and Markager, 2005; Stedmon et al., 2007), which may contribute to an increase of protein-like FDOM in marine surface waters (Jørgensen et al., 2011; Kowalczuk et al., 2013; Catalá et al., 2016). This process could additionally contribute to the observed seasonal accumulation of the protein-like FDOM fraction in Gdańsk surface waters, as indicated by the positive values of FDOM-Ch3 residuals in summer and autumn, Figure 5. Seasonal accumulation of humic-like FDOM fraction was observed in the surface waters of the Gulf of Gdańsk only in autumn and winter (Figure 5). It is most likely associated with increased river inflow and low solar irradiance intensity, both of which cause photodegradation to be ineffective. Humic-like FDOM accumulated in the surface layers was then quickly decomposed in spring and summer even in the Gulf of Gdańsk, despite the continuous terrestrial DOM input, as seen in the section plots (Figure 7).
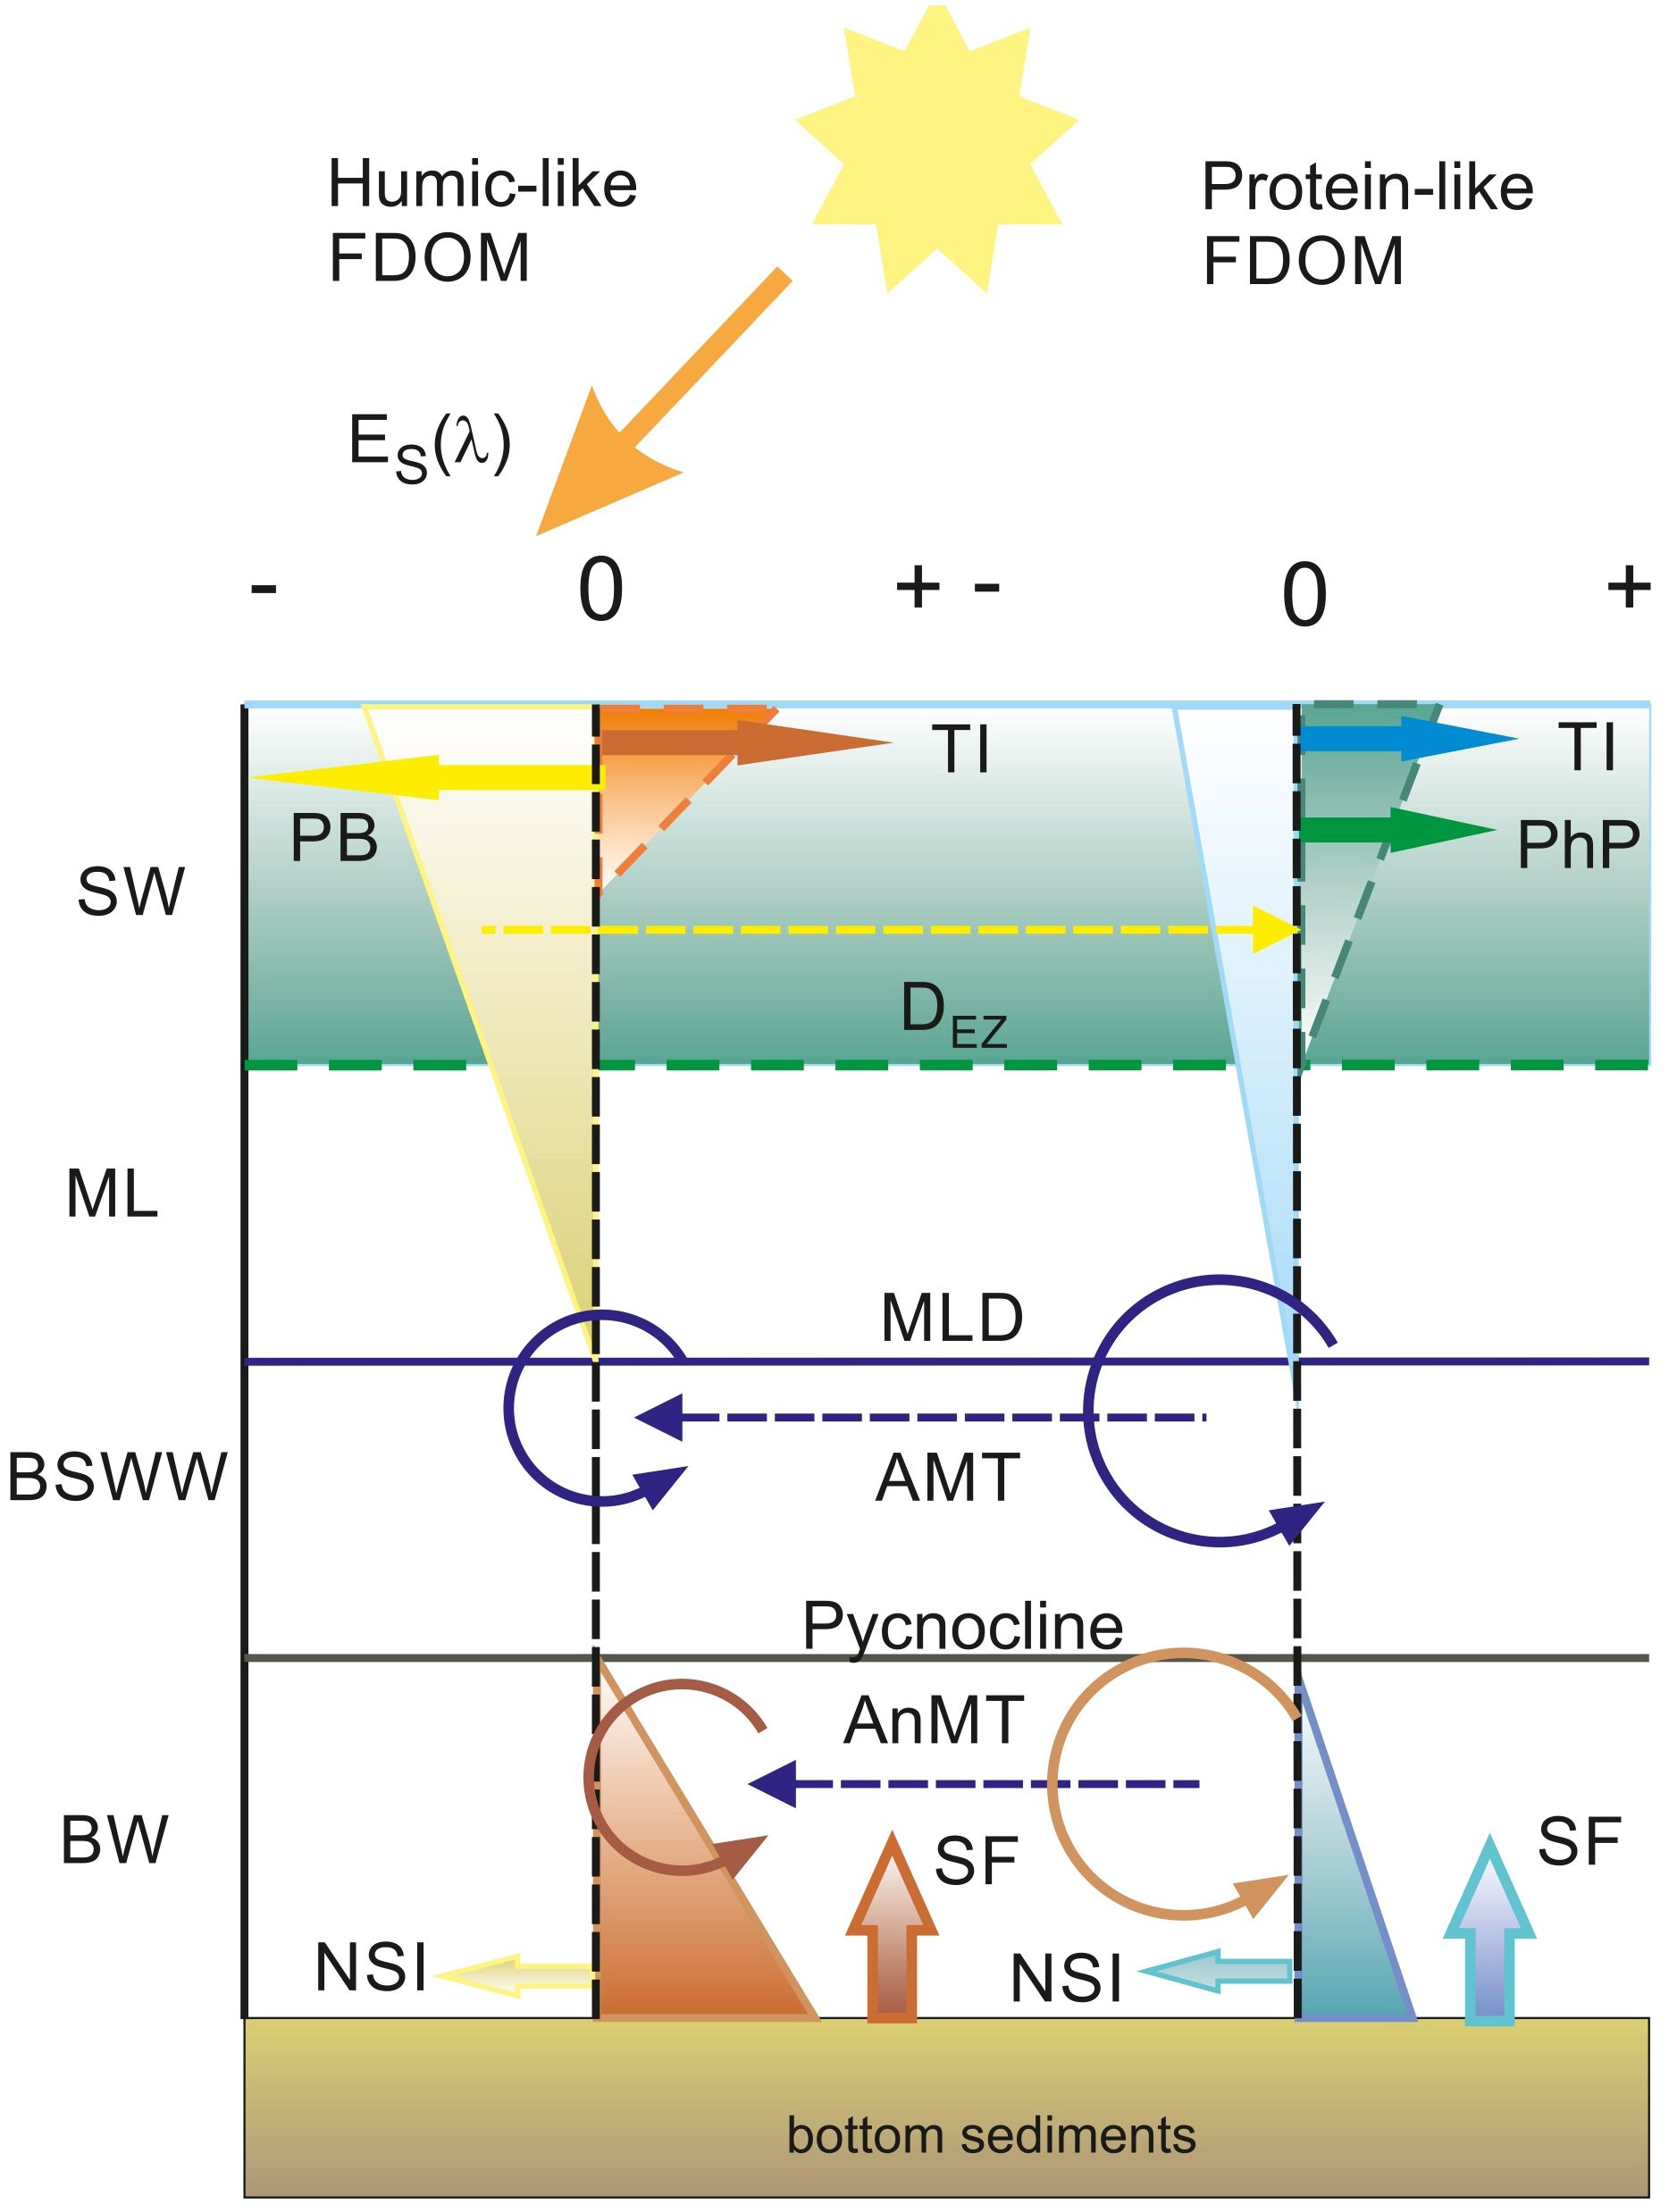
Figure 9 Schematic of DOM accumulation and decomposition zones in the Baltic Sea and contributing processes. The dashed vertical line marking 0 residual values for humic-like and protein-like FDOM fractions denotes the equilibrium between decomposition (negative residual values) and accumulation processes (positive residual values). Surface water (SW) is the layer where there is measurable phytoplankton production (PhP) limited by the euphotic depth (DEZ). The seasonal thermocline maximum limit is constrained by the mixed layer depth (MLD). Below the MLD and above the permanent pycnocline, there is a layer of Baltic Sea Winter Water (BSWW). Below the pycnocline, there is the deoxygenated bottom water (BW). Vectors illustrate processes – negative for decomposition: photobleaching (PB) and North Sea Inflow (NSI). Accumulation processes are illustrated by positive vectors: terrestrial inflow (TI), phytoplankton production (PhP), and sediment flux (SF). Recirculation of DOM through aerobic microbial transformation (AMT), and anaerobic microbial transformation (AnMT), illustrated by a circular dash and dashed vectors, mark presumed pathways of material flow between humic-like and protein-like FDOM fractions.
The protein-like FDOM fraction is embedded in a vast array of organic compounds from different sources: it can be of terrestrial origin, reaching waters through river discharges to coastal waters (Kowalczuk et al., 2003; Kowalczuk et al., 2005b) or it can be attributed to local production by phytoplankton (Stedmon and Markager, 2005; Castillo et al., 2010). There is a moderate correlation between FDOM-Ch3 intensity and aLH (676) and between the latter and chl a concentration (Supplementary Figure S2 and Supplementary Figure S1 in the Supplementary Material, respectively). This relationship is only valid within the euphotic zone, as samples measured below 30 m depart significantly from the general trend. Although the spatial distribution of the presented examples, especially outside the Gulf of Gdańsk, clearly showed that measured and residual values of FDOM-Ch3 intensity are aligned with areas of elevated values of the chl a proxy (Figure 7), there was no significant correlation between FDOM-Ch3 residuals and aLH(676) or chl a in the examined data set. This could be related to the time lag between phytoplankton bloom and DOM production, as phytoplankton starts to produce DOM after nutrient depletion, during the bloom decay phase (Loginova et al., 2015). A moderate correlation between FDOM-Ch3 residual and aLH(676) was observed only in the surface waters of the Gulf of Gdańsk when an aLH(676) minimum threshold value of 0.03 m-1 was applied (not shown). This indicates that phytoplankton production can only outweigh microbial uptake and dilution during an intense and long-lasting bloom. This is the case in the Gulf of Gdańsk, where phytoplankton growth is unlimited by a continuous supply of nutrients from terrestrial discharge. These processes effectively contribute to the seasonal accumulation of protein-like FDOM in the surface waters of the Gulf of Gdańsk in summer and fall, Figure 9. The protein-like FDOM fraction absorbs light below 300 nm. These fluorophores are therefore not very sensitive to photodegradation under natural conditions, as solar irradiance below 300 nm is almost completely absorbed in the atmosphere. The main decomposition pathway of protein-like FDOM is therefore likely to be microbial decomposition, which appears to be dominant over phytoplankton production in the open Baltic Sea, as negative values of FDOM-Ch3 residuals are observed in the mixed layer.
Products of photodegradation and autochthonous production are usually retained within the seasonal mixed layer of the Baltic Sea, which can reach up to 40 m (Cahill et al., 2023). Cold, dense, and oxygenated water, left over from the previous winter’s convective mixing, usually persists below the seasonal thermocline. DOM entrained from the overlying mixed surface layer and POM contained in sinking particles are in turn constantly modified and recirculated by aerobic prokaryotic communities (Stedmon et al., 2021) that are very efficient at CDOM/FDOM transformation. Prokaryotes are estimated to produce an order of magnitude higher content of FDOM compared to eukaryotes (Romera-Castillo et al., 2011). Low molecular DOM originating from autochthonous and photodegradation products is more bioavailable to bacterial communities than more complex and condensed compounds assigned to humic-like DOM fractions (Benner and Biddanda, 1998; Stedmon and Cory, 2014; Middelburg, 2019). Moreover, it has been shown that some types of marine bacteria have adapted to metabolize specific DOM fractions, characterized by optical properties and molecular weight (Amaral et al., 2016).
A strong linear relationship of FDOM components with AOU, especially below the pycnocline (not shown), suggests that microbial respiration serves as a primary mechanism for protein-like DOM removal and accumulation of humic-like DOM compounds at depth. Furthermore, as O2 becomes limited, DOM cycling becomes dependent on oxidation with other electron acceptors, such as nitrogen oxides and sulfates. Therefore, negative anomalies (residuals) at maximum AOU found in this study may be due to anaerobic processes, such as denitrification (Goering, 1968), anammox (Kalvelage et al., 2011), sulfate, manganese, or iron reduction (Middelburg, 2019). As the FDOM residual values for Ch1 were higher compared to FDOM-Ch3, we referred to the protein-like FDOM fraction as a primary substrate for heterotrophic metabolism. Furthermore, in bottom waters, DOM release from sediments may also play an important role in the accumulation of humic substances (Winogradow and Pempkowiak, 2014; Chen et al., 2016; Loginova et al., 2016; Loginova et al., 2020), which is enhanced under oxygen-limited conditions (Lengier et al., 2021). This is consistent with the higher residuals of humic-like FDOM at the DW layer found in this study.
In the mesopelagic layer of the Pacific and Indian Oceans, a direct link was observed between increased CDOM absorption/DOM fluorescence intensity and microbial activity, quantified by apparent oxygen utilization AOU (Swan et al., 2009; Jørgensen et al., 2011; Nelson and Siegel, 2013). In contrast, due to the high ventilation rate and advection of oxygenated water containing a high concentration of CDOM/FDOM from the Arctic Ocean, such a correlation was absent in the Atlantic Ocean (Nelson and Siegel, 2013). However, the separation of nonlinear processes from linear mixing of water masses allowed to establish a relationship between AOU and humic-like FDOM also for the Atlantic Ocean (De La Fuente et al., 2014). Following this approach, the relationship between FDOM-Chi residuals and AOU confirmed an overall accumulation of DOM below the seasonal thermocline and its increase with depth. The only process that could lead to the periodic removal of FDOM in the deep waters of the Baltic can be attributed to large inflows from the North Sea. Saltier waters can reduce the FDOM signal in two ways: by dilution of the accumulated FDOM and by its partial oxidation, as the inflowing water contains a higher oxygen concentration than the stagnant deoxygenated bottom water. The strong spatial gradient in FDOM-Ch1 residuals and AOU between Bornholm (lower FDOM-Ch1 residuals and low AOU) and Gotland Basin (higher FDOM-Ch1 and high AOU) deep waters could support this conclusion (Figure 7). However, the effects of such periodic inflows are, short-lived: Gotland returned to anoxic conditions six months after the major inflow event in December 2014. The input of fresh oxygen quickly declined due to a strong dilution effect and high microbial consumption underway during the passage of the inflowing water from Arkona to the Gotland basin (Mohrholz et al., 2015; Neumann et al., 2017).
This effect, as well as the overall consequence of microbial DOM transformation, could be observed in the SUVA254 data available for 2014 and 2015 (Supplementary Figure S5 in the Supplementary Material). SUVA254, which was high at the end of the stagnation period in the autumn of 2014, decreased sharply in Bornholm DW in the spring of 2015, shortly after the winter inflow. Later in 2015, the values increased again. As SUVA254 is a proxy for DOM aromaticity, its increasing values indicated a higher number of aromatic rings in the DOM molecular structure. Therefore, in 2014, marking the tenth year of bottom water stagnation, higher SUVA254 values indicated a high degree of DOM transformation by the bacterial community and enrichment of DOM with aromatic rings. After the inflow, the fresh oxygen supply presumably changed the bacterial communities in the deep water and caused a partial oxidation of DOC, in addition to a change of its molecular structures to more aliphatic forms.
Conclusions
The analysis of a significant database of vertical fluorescence intensity profiles in three specific spectral excitation and emission bands, inferring specific FDOM fractions, provided insight into the DOM cycles in distinct thermohaline conditions. The resolution of the tri-linear mixing model allowed the separation of the FDOM variability associated with the mixing of water masses from the non-linear physical and biochemical processes linked to the accumulation and removal of organic matter.
The measured values of the humic-like and protein-like FDOM fractions, FDOM-Ch1 and FDOM-Ch3, both exhibited noticeable west-east and north-south gradients for the Bornholm-Gdańsk and Gotland-Gdańsk transects, respectively, with values increasing toward the Gulf of Gdańsk, especially at the surface. It was confirmed that the spatial distribution of the humic-like FDOM fraction is controlled by the salinity gradient, as the contours of the lowest salinities were well aligned with the highest FDOM-Ch1 values and vice versa. FDOM-Ch3 values are highly dependent on the phytoplankton life cycle in the surface waters. The highest FDOM-Ch3 intensity values corresponded to the maximum absorption line height at 676 nm. The mixing model results conveyed a very strong relationship between salinity and modeled fractions for different water masses, underscoring the potential to robustly separate non-conservative processes from water mass mixing. Seasonal patterns revealed positive residuals for humic-like fractions in intermediate and deep waters in all regions examined, indicating persistent accumulation of DOM. All basins resulted in humic-like fractions increasing with depth in all seasons, with deeper layers displaying the highest residual values.
Binned AOU data yielded increasing trends in FDOM-Chi except for Ch3 in Gotland Deep, with the relationship resembling an asymptotic curve, therefore suggesting a saturation tendency at the highest AOU values. Spatial transects from Bornholm or Gotland to the Gulf of Gdańsk showed an increase in FDOM-Ch1 residuals and a good correlation between FDOM-Ch1 and AOU. A solid alignment between FDOM-Ch3 and the absorption line height at 676 nm was seen for the Bornholm-Gdańsk transect, which also follows the subsurface maximum, which in turn represents the phytoplankton biomass maximum. Protein-like residuals were negative between Gotland and Gdańsk throughout the entire section and water column, with slightly positive values only close to the Gulf of Gdańsk shores.
The extensive data set and its spatio-temporal variability allowed us to propose a more generalized concept of the dissolved organic matter cycle, conveying that the most important process determining the removal of humic-like organic matter is photobleaching. Bacterial recycling of the protein-like fraction by aerobic prokaryotes is more efficient compared to humic-like fractions, as evidenced by the greater accumulation of FDOM-Ch1 and removal of FDOM-Ch3. The bottom FDOM signal can be reduced in two ways: by dilution and oxidation with water flowing from the North Sea, which is supported by the strong spatial gradient between Bornholm (low FDOM-Ch1 residuals and low AOU) and Gotland (higher FDOM-Ch1 and high AOU) deep waters. This was further corroborated by the SUVA254 signal, which is a proxy for aromaticity. Following the large inflow of saline water in winter 2014, aromaticity values decreased, suggesting a change in molecular structure due to partial DOC oxidation. Vertically integrated values of DOC were obtained to infer the net accumulation and removal areas from the FDOM-Ch1 residuals. The Gotland Basin appears to be the region with the highest DOC accumulation and acting as a carbon source, followed by Gdańsk and Bornholm. Bornholm is also the basin with the highest DOC removal, closely matched with Gotland. The lowest DOC removal was calculated for the Gulf of Gdańsk, which can be explained by the constant inflow of DOC from riverine discharges.
This study has demonstrated that the observed accumulation of dissolved organic matter in mesohaline deep waters is impacted by multiple factors: from microbial uptake and recirculation of organic matter to the emission from anoxic sediments and decades-long stagnation of bottom water masses.
Data availability statement
The datasets presented in this study can be found in online repositories. The names of the repository/repositories and accession number(s) can be found below: https://doi.org/10.48457/iopan-2024-197.
Author contributions
ET: Conceptualization, Formal analysis, Methodology, Software, Visualization, Writing – original draft, Writing – review & editing. MZ: Data curation, Formal analysis, Investigation, Methodology, Writing – original draft, Writing – review & editing. AL: Formal analysis, Investigation, Methodology, Writing – original draft, Writing – review & editing. KB: Data curation, Investigation, Software, Writing – original draft, Writing – review & editing. PK: Conceptualization, Formal analysis, Funding acquisition, Investigation, Methodology, Project administration, Resources, Supervision, Validation, Visualization, Writing – original draft, Writing – review & editing.
Funding
The author(s) declare financial support was received for the research, authorship, and/or publication of this article. This study was supported by the National Science Centre of the Republic of Poland, project (NCN) OPUS17, project DiSeDOM contract no. UMO-2019/33/B/ST10/01232, awarded to PK. These contracts supported ET and MZ. This work was partially financed from the Norwegian Financial Mechanism 2014–2021 funding, awarded to AL, project contract no. 2020/37/K/ST10/03018 - DOMUSe. KB was supported by the Statutory Research Programme No. II.5 at the Institute of Oceanology, Polish Academy of Sciences, Sopot, Poland.
Acknowledgments
The authors thank the technical staff, officers, and crew of r/v Oceania for providing logistical support and assistance during the fieldwork.
Conflict of interest
The authors declare that the research was conducted in the absence of any commercial or financial relationships that could be construed as a potential conflict of interest.
Publisher’s note
All claims expressed in this article are solely those of the authors and do not necessarily represent those of their affiliated organizations, or those of the publisher, the editors and the reviewers. Any product that may be evaluated in this article, or claim that may be made by its manufacturer, is not guaranteed or endorsed by the publisher.
Supplementary material
The Supplementary Material for this article can be found online at: https://www.frontiersin.org/articles/10.3389/fmars.2024.1379604/full#supplementary-material
References
Amaral V., Graeber D., Calliari D., Alonso C. (2016). Strong linkages between DOM optical properties and main clades of aquatic bacteria. Limnol. Oceanogr. 61, 906–918. doi: 10.1002/lno.10258
Benner R., Biddanda B. A. (1998). Photochemical transformations of surface and deep marine dissolved organic matter: Effects on bacterial growth. Limnol. Oceanogr. 43:1373–1378. doi: 10.4319/lo.1998.43.6.1373
Benson B. B., Krause D. (1984). The concentration and isotopic fractionation of oxygen dissolved in freshwater and seawater in equilibrium with the atmosphere1: Oxygen solubility in seawater. Limnol. Oceanogr. 29, 620–632. doi: 10.4319/lo.1984.29.3.0620
Cahill B. E., Kowalczuk P., Kritten L., Gräwe U., Wilkin J., Fischer J. (2023). Estimating the seasonal impact of optically significant water constituents on surface heating rates in the western Baltic Sea. Biogeosciences 20, 2743–2768. doi: 10.5194/bg-20-2743-2023
Castillo C. R., Sarmento H., Álvarez Salgado X. A., Gasol J. M., Marraséa C. (2010). Production of chromophoric dissolved organic matter by marine phytoplankton. Limnol. Oceanogr. 55, 446–454. doi: 10.4319/lo.2010.55.1.0446
Catalá T. S., Álvarez Salgado X. A., Otero J., Iuculano F., Companys B., Horstkotte B., et al. (2016). Drivers of fluorescent dissolved organic matter in the global epipelagic ocean: Drivers of FDOM in the epipelagic ocean. Limnol. Oceanogr. 61, 1101–1119. doi: 10.1002/lno.10281
Chen M., Kim J., Nam S., Niessen F., Hong W. L., Kang M. H., et al. (2016). Production of fluorescent dissolved organic matter in arctic ocean sediments. Sci. Rep. 6, 39213. doi: 10.1038/srep39213
Coble P. G. (1996). Characterization of marine and terrestrial DOM in seawater using excitation-emission matrix spectroscopy. Mar. Chem. 51, 325–346. doi: 10.1016/0304-4203(95)00062-3
Conley D. J., Björck S., Bonsdorff E., Carstensen J., Destouni G., Gustafsson B. G., et al. (2009). Hypoxia-related processes in the Baltic sea. Environ. Sci. Technol. 43, 3412–3420. doi: 10.1021/es802762a
Conley D. J., Carstensen J., Aigars J., Axe P., Bonsdorff E., Eremina T., et al. (2011). Hypoxia is increasing in the coastal zone of the Baltic Sea. Environ. Sci. Technol. 45, 6777–6783. doi: 10.1021/es201212r
Dall’Olmo G., Brewin R. J. W., Nencioli F., Organelli E., Lefering I., McKee D., et al. (2017). Determination of the absorption coefficient of chromophoric dissolved organic matter from underway spectrophotometry. Optics express 25 24, A1079–A1095. doi: 10.1364/OE.25.0A1079
De La Fuente P., Marrasé C., Canepa A., Antón Álvarez Salgado X., Gasser M., Fajar N. M., et al. (2014). Does a general relationship exist between fluorescent dissolved organic matter and microbial respiration?—The case of the dark equatorial Atlantic Ocean. Deep Sea Res. Part I: Oceanographic Res. Pap. 89, 44–55. doi: 10.1016/j.dsr.2014.03.007
Dera J., Woz´niak B. (2010). Solar radiation in the Baltic sea. Oceanologia 52, 533–582. doi: 10.5697/oc.52-4.533
Feistel S., Feistel R., Nehring D., Matthäus W., Nausch G., Naumann M. (2016). Hypoxic and anoxic regions in the Baltic Sea, 1969 - 2015. Meereswissenschaftliche Berichte No 100 2016. doi: 10.12754/MSR-2016–0100
Ferrari G. M. (2000). The relationship between chromophoric dissolved organic matter and dissolved organic carbon in the European Atlantic coastal area and in the West Mediterranean Sea (Gulf of Lions). Mar. Chem. 70, 339–357. doi: 10.1016/S0304-4203(00)00036-0
Ferrari G. M., Dowell M. (1998). CDOM absorption characteristics with relation to fluorescence and salinity in coastal areas of the Southern Baltic Sea. Estuar. Coast. Shelf Sci. 47, 91–105. doi: 10.1006/ecss.1997.0309
Garcia H. E., Gordon L. I. (1992). Oxygen solubility in seawater: Better fitting equations. Limnol. Oceanogr. 37, 1307–1312. doi: 10.4319/lo.1992.37.6.1307
Goering J. J. (1968). Denitrification in the oxygen minimum layer of the eastern tropical pacific ocean. Deep Sea Res. Oceanographic Abstracts 15, 157–164. doi: 10.1016/0011-7471(68)90037-5
Granskog M. A., Pavlov A. K., Sagan S., Kowalczuk P., Raczkowska A., Stedmon C. A. (2015). Effect of sea-ice melt on inherent optical properties and vertical distribution of solar radiant heating in Arctic surface waters. J. Geophysical Res.: Oceans 120, 7028–7039. doi: 10.1002/2015JC011087
Grzybowski W. (2000). Effect of short-term sunlight irradiation on absorbance spectra of chromophoric organic matter dissolved in coastal and riverine water. Chemosphere 40 12, 1313–1318. doi: 10.1016/S0045-6535(99)00266-0
Hansell D. A., Carlson C. A. (2015). “Preface,” in Biogeochemistry of Marine Dissolved Organic Matter, 2nd ed. Eds. Hansell D. A., Carlson C. A. (Academic Press, Boston), xvii–xviii. doi: 10.1016/B978–0-12–405940–5.09990–8
Hoikkala L., Kortelainen P., Soinne H., Kuosa H. (2015). Dissolved organic matter in the Baltic Sea. J. Mar. Syst. 142, 47–61. doi: 10.1016/j.jmarsys.2014.10.005
Højerslev N. K., Aas E. (2001). Spectral light absorption by yellow substance in the kattegat-skagerrak area. Oceanologia 43, 39–60.
Højerslev N. K., Holt N., Aarup T. (1996). Optical measurements in the north sea-baltic sea transition zone. I. on the origin of the deep water in the kattegat. Continental Shelf Res. 16:1329–1331. doi: 10.1016/0278–4343%2895%2900075–5
Jiao N., Herndl G. J., Hansell D. A., Benner R., Kattner G., Wilhelm S. W., et al. (2011). The microbial carbon pump and the oceanic recalcitrant dissolved organic matter pool. Nat. Rev. Microbiol. 9, 555–555. doi: 10.1038/nrmicro2386-c5
Jørgensen L., Stedmon C. A., Kragh T., Markager S., Middelboe M., Søndergaard M. (2011). Global trends in the fluorescence characteristics and distribution of marine dissolved organic matter. Mar. Chem. 126, 139–148. doi: 10.1016/j.marchem.2011.05.002
Kalvelage T., Jensen M. M., Contreras S., Revsbech N. P., Lam P., Günter M., et al. (2011). Oxygen sensitivity of anammox and coupled n-cycle processes in oxygen minimum zones. PloS One 6(12):e29299. doi: 10.1371/journal.pone.0029299
Kowalczuk P. (1999). Seasonal variability of yellow substance absorption in the surface layer of the baltic sea. J. Geophysical Res. 104, 30047–30058. doi: 10.1029/1999JC900198
Kowalczuk P., Cooper W. J., Durako M. J., Kahn A. E., Gonsior M., Young H. (2010a). Characterization of dissolved organic matter fluorescence in the South Atlantic Bight with use of PARAFAC model: Relationships between fluorescence and its components, absorption coefficients and organic carbon concentrations. Mar. Chem. 118, 22–36. doi: 10.1016/j.marchem.2009.10.002
Kowalczuk P., Cooper W. J., Whitehead R. F., Durako M. J., Sheldon W. (2003). Characterization of CDOM in an organic-rich river and surrounding coastal ocean in the South Atlantic Bight. Aquat. Sci. 65, 384–401. doi: 10.1007/s00027-003-0678-1
Kowalczuk P., Durako M. J., Young H., Kahn A. E., Cooper W. J., Gonsior M. (2009). Characterization of dissolved organic matter fluorescence in the south atlantic bight with use of parafac model: Interannual variability. Mar. Chem. 113, 182–196. doi: 10.1016/j.marchem.2009.01.015
Kowalczuk P., Olszewski J., Darecki M., Kaczmarek S. (2005a). Empirical relationships between coloured dissolved organic matter (cdom) absorption and apparent optical properties in baltic sea waters. Int. J. Remote Sens. 26, 345–370. doi: 10.1080/01431160410001720270
Kowalczuk P., Sagan S., Zabłocka M., Borzycka K. (2015). Mixing anomaly in deoxygenated Baltic Sea deeps indicates benthic flux and microbial transformation of chromophoric and fluorescent dissolved organic matter. Estuarine Coast. Shelf Sci. 163, 206–217. doi: 10.1016/j.ecss.2015.06.027
Kowalczuk P., Stedmon C. A., Markager S. (2006). Modeling absorption by CDOM in the Baltic Sea from season, salinity and chlorophyll. Mar. Chem. 101, 1–11. doi: 10.1016/j.marchem.2005.12.005
Kowalczuk P., Ston-Egiert´ J., Cooper W. J., Whitehead R. F., Durako M. J. (2005b). Characterization of chromophoric dissolved organic matter (CDOM) in the Baltic Sea by excitation emission matrix fluorescence spectroscopy. Mar. Chem. 96, 273–292. doi: 10.1016/j.marchem.2005.03.002
Kowalczuk P., Tilstone G. H., Zabłocka M., Röttgers R., Thomas R. (2013). Composition of dissolved organic matter along an Atlantic Meridional Transect from fluorescence spectroscopy and Parallel Factor Analysis. Mar. Chem. 157, 170–184. doi: 10.1016/j.marchem.2013.10.004
Kowalczuk P., Zabłocka M., Sagan S., Kuliński K. (2010b). Fluorescence measured in situ as a proxy of CDOM absorption and DOC concentration in the Baltic Sea. Oceanologia 52, 431–471. doi: 10.5697/oc.52-3.431
Kratzer S., Moore G. (2018). Inherent optical properties of the baltic sea in comparison to other seas and oceans. Remote Sens 10, 418. doi: 10.3390/rs10030418
Kuliński K., Pempkowiak J. (2008). Dissolved organic carbon in the southern Baltic Sea: Quantification of factors affecting its distribution. Estuar. Coast. Shelf Sci. 78, 38–44. doi: 10.1016/j.ecss.2007.11.017
Kuliński K., Pempkowiak J. (2011). The carbon budget of the Baltic Sea. Biogeosciences 8, 3219–3230. doi: 10.5194/bg-8-3219-2011
Lengier M., Szymczycha B., Brodecka-Goluch A., Kłostowska Z., Kuliński K. (2021). Benthic diffusive fluxes of organic and inorganic carbon, ammonium and phosphates from deep water sediments of the baltic sea. Oceanologia. 63(3):370–384. doi: 10.1016/j.oceano.2021.04.002
Leppäranta M., Myrberg K. (2009). Physical oceanography of the Baltic Sea. (New York: Springer, Berlin, Heidelberg) pp 422. doi: 10.1007/978-3-540-79703-6
Loginova A. N., Borchard C., Meyer J., Hauss H., Kiko R., Engel A. (2015). Effects of nitrate and phosphate supply on chromophoric and fluorescent dissolved organic matter in the eastern tropical north atlantic: a mesocosm study. Biogeosciences 12, 6897–6914. doi: 10.5194/bg-12-6897-2015
Loginova A. N., Dale A. W., Le Moigne F. A. C., Thomsen S., Sommer S., Clemens D., et al. (2020). Sediment release of dissolved organic matter to the oxygen minimum zone off Peru. Biogeosciences 17, 4663–4679. doi: 10.5194/bg-17-4663-2020
Loginova A. N., Thomsen S., Engel A. (2016). Chromophoric and fluorescent dissolved organic matter in and above the oxygen minimum zone off Peru. J. Geophysical Res.: Oceans 121, 7973–7990. doi: 10.1002/jgrc.v121.11
Lønborg C., Carreira C., Jickells T., Álvarez Salgado X. A. (2020). Impacts of global change on ocean dissolved organic carbon (DOC) cycling. Front. Mar. Sci. 7. doi: 10.3389/fmars.2020.00466
Lorenzen C. J. (1967). Determination of chlorophyll and pheo-pigments: spectrophotometric equations. Limnol. Oceanogr. 12, 343–346. doi: 10.4319/lo.1967.12.2.0343
Luek J. L., Thompson K. E., Larsen R. K., Heyes A., Gonsior M. (2017). Sulfate reduction in sediments produces high levels of chromophoric dissolved organic matter. Sci. Rep. 7:8829. doi: 10.1038/s41598–017-09223-z
Makarewicz A., Kowalczuk P., Sagan S., Granskog M. A., Pavlov A. K., Zdun A., et al. (2018). Characteristics of chromophoric and fluorescent dissolved organic matter in the Nordic Seas. Ocean Sci. 14, 543–562. doi: 10.5194/os-14-543-2018
Marker A. F. H., Nusch E. A., Rai H., Riemann B. (1980). “The measurement of photosynthetic pigments in freshwaters and standardisation of methods. Conclusions and recommendations,“ in The Measurement of photosynthetic pigments in freshwater and standardization of methods. ed. Hakumai Rai (Stuttgart: Ergebnisse der Limnologie 14, E. Schweizerbart'sche Verlagbuchhandlung) 1980, pp. 91–106.
Massicotte P., Asmala E., Stedmon C., Markager S. (2017). Global distribution of dissolved organic matter along the aquatic continuum: Across rivers, lakes and oceans. Sci. Total Environ. 609, 180–191. doi: 10.1016/j.scitotenv.2017.07.076
Matthäus W., Nehring D., Feistel R., Nausch G., Mohrholz V., Lass H. (2008). “The inflow of highly saline water into the Baltic Sea,” in State and Evolution of the Baltic Sea, 1952–2005. Eds. Feistel R., Nausch G., Wasmund N. (Wiley), 265–309. doi: 10.1002/9780470283134.ch10
Meier M., Feistel R., Piechura J., Arneborg L., Burchard H., Fiekas V., et al. (2006). Ventilation of the Baltic Sea deep water: A brief review of present knowledge from observations and models. Oceanologia 48, 133–164.
Middelburg J. J. (2019). Marine carbon biogeochemistry: A primer for earth system scientists. Mar. Carbon Biogeochem, 118.doi: 10.1007/978-3-030-10822-9
Miller W. L., Zepp R. G. (1995). Photochemical production of dissolved inorganic carbon from terrestrial organic matter: significance to the oceanic organic carbon cycle. Oceanographic Literature Rev. 10, 842. doi: 10.1029/94GL03344
Mohrholz V., Naumann M., Nausch G., Krüger S., Gräwe U. (2015). Fresh oxygen for the Baltic Sea — an exceptional saline inflow after a decade of stagnation. J. Mar. Syst. 148, 152–166. doi: 10.1016/j.jmarsys.2015.03.005
Moran M. A., Zepp R. G. (1997). Role of photoreactions in the formation of biologically labile compounds from dissolved organic matter. Limnol. Oceanogr. 42, 1307–1316. doi: 10.4319/lo.1997.42.6.1307
Morel F. M. M., Price N. M. (2003). The biogeochemical cycles of trace metals in the oceans. Science 300, 944–947. doi: 10.1126/science.1083545
Nardelli S. C., Twardowski M. S. (2016). Assessing the link between chlorophyll concentration and absorption line height at 676 nm over a broad range of water types. Opt. Express 24, A1374–A1389. doi: 10.1364/OE.24.0A1374
Nelson N. B., Siegel D. A. (2013). The global distribution and dynamics of chromophoric dissolved organic matter. Annu. Rev. Mar. Sci. 5, 447–476. doi: 10.1146/annurev-marine-120710-100751
Nelson N., Siegel D., Michaels A. (1998). Seasonal dynamics of colored dissolved material in the sargasso sea. Deep Sea Res. Part I: Oceanographic Res. Pap. 45, 931–957. doi: 10.1016/S0967–0637(97)00106–4
Neumann T. A., Radtke H., Seifert T. (2017). On the importance of Major Baltic Inflows for oxygenation of the central Baltic Sea. J. Geophysical Res. 122, 1090–1101. doi: 10.1002/2016JC012525
Organelli E., Barbieux M., Claustre H., Schmechtig C., Poteau A., Bricaud A., et al. (2017). Two databases derived from BGC-Argo float measurements for marine biogeochemical and bio-optical applications. Earth System Sci. Data 9, 861–880. doi: 10.5194/essd-9-861-2017
Organelli E., Claustre H. (2019). Small phytoplankton shapes colored dissolved organic matter dynamics in the North Atlantic subtropical gyre. Geophysical Res. Lett. 46, 12183–12191. doi: 10.1029/2019GL084699
Ostrowska M., Ficek D., Stoltmann D., Ston-Egiert´ J., Zdun A., Kowalewski M., et al. (2022). Ten years of remote sensing and analyses of the Baltic Sea primary production (2010–2019). Remote Sens. Applications: Soc. Environ. 26, 100715. doi: 10.1016/j.rsase.2022.100715
Pastuszak M., Stålnacke P., Pawlikowski K., Witek Z. (2012). Response of Polish rivers (vistula, oder) to reduced pressure from point sources and agriculture during the transition period (1988–2008). J. Mar. Syst. 94, 157–173. doi: 10.1016/j.jmarsys.2011.11.017
Repeta D. J. (2015). “Chapter 2 - Chemical characterization and cycling of dissolved organic matter,” in Biogeochemistry of Marine Dissolved Organic Matter, 2nd ed. Eds. Hansell D. A., Carlson C. A. (Academic Press, Boston), 21–63. doi: 10.1016/B978–0-12–405940–5.00002–9
Roesler C. S., Barnard A. (2013). Optical proxy for phytoplankton biomass in the absence of photophysiology: Rethinking the absorption line height. Methods Oceanogr. 7, 79–94. doi: 10.1016/j.mio.2013.12.003
Romera-Castillo C., Sarmento H., Álvarez Salgado X. A., Gasol J. M., Marrasé C. (2011). Net production and consumption of fluorescent colored dissolved organic matter by natural bacterial assemblages growing on marine phytoplankton exudates. Appl. Environ. Microbiol. 77, 7490–7498. doi: 10.1128/AEM.00200-11
Sartory D., Grobbelaar J. U. (1984). Extraction of chlorophyll a from freshwater phytoplankton for spectrophotometric analysis. Hydrobiologia 114, 177–187. doi: 10.1007/BF00031869
Schmidt B., Wodzinowski T., Bulczak A. I. (2021). Long-term variability of near-bottom oxygen, temperature, and salinity in the Southern Baltic. J. Mar. Syst. 213, 103462. doi: 10.1016/j.jmarsys.2020.103462
Seidel M., Manecki M., Herlemann D. P. R., Deutsch B., Schulz-Bull D. E., Jürgens K., et al. (2017). Composition and transformation of dissolved organic matter in the Baltic Sea. Front. Earth Sci. 5. doi: 10.3389/feart.2017.00031
Sharp J. H. (2002). “Chapter 2 - analytical methods for total DOM pools,” in Biogeochemistry of Marine Dissolved Organic Matter. Eds. Hansell D. A., Carlson C. A. (Academic Press, San Diego), 35–58. doi: 10.1016/B978–012323841–2/50004-X
Simis S. G. H., Ylöstalo P., Kallio K. Y., Spilling K., Kutser T. (2017). Contrasting seasonality in opticalbiogeochemical properties of the baltic sea. PloS One 12(4):e0173357. doi: 10.1371/journal.pone.0173357
Stedmon C. A., Amon R. M. W., Bauch D., Bracher A., Gonçalves-Araujo R., Hoppmann M., et al (2021). Insights into water mass origins in the central arctic ocean from in-situ dissolved organic matter fluorescence. J. Geophysical Res.: Oceans 126, e2021JC017407. doi: 10.1029/2021JC017407
Stedmon C. A., Cory R. M. (2014). “Biological origins and fate of fluorescent dissolved organic matter in aquatic environments,” in Aquatic Organic Matter Fluorescence. Eds. Coble P. G., Lead J., Baker A., Reynolds D. M., Spencer R. G. M. (Cambridge University Press), 278–300. doi: 10.1017/CBO9781139045452.013
Stedmon C., Markager S. (2003). Behaviour of the optical properties of coloured dissolved organic matter under conservative mixing. Estuarine Coast. Shelf Sci. 57, 973–979. doi: 10.1016/S0272-7714(03)00003-9
Stedmon C. A., Markager S. (2005). Tracing the production and degradation of autochthonous fractions of dissolved organic matter by fluorescence analysis. Limnol. Oceanogr. 50, 1415–1426. doi: 10.4319/lo.2005.50.5.1415
Stedmon C. A., Markager S., Tranvik L. J., Kronberg L., Slätis T., Martinsen W. (2007). Photochemical production of ammonium and transformation of dissolved organic matter in the Baltic Sea. Mar. Chem. 104, 227–240. doi: 10.1016/j.marchem.2006.11.005
Stedmon C. A., Nelson N. B. (2015). “Chapter 10 - The optical properties of DOM in the ocean,” in Biogeochemistry of Marine Dissolved Organic Matter, 2nd ed. Eds. Hansell D. A., Carlson C. A. (Academic Press, Boston), 481–508. doi: 10.1016/B978–0-12–405940–5.00010–8
Stedmon C. A., Osburn C. L., Kragh T. (2010). Tracing water mass mixing in the Baltic–North Sea transition zone using the optical properties of coloured dissolved organic matter. Estuarine Coast. Shelf Sci. 87, 156–162. doi: 10.1016/j.ecss.2009.12.022
Stubbins A., Lapierre J., Berggren M., Prairie Y. T., Dittmar T., del Giorgio P. A. (2014). What’s in an eem? molecular signatures associated with dissolved organic fluorescence in boreal Canada. Environ. Sci. Technol. 48 18, 10598–10606. doi: 10.1021/es502086e
Sullivan J. M., Twardowski M. S., Zaneveld J. R. V., Moore C. M., Barnard A. H., Donaghay P. L., et al. (2006). Hyperspectral temperature and salt dependencies of absorption by water and heavy water in the 400–750 nm spectral range. Appl. Optics 45, 5294. doi: 10.1364/AO.45.005294
Swan C. M., Siegel D. A., Nelson N. B., Carlson C. A., Nasir E. (2009). Biogeochemical and hydrographic controls on chromophoric dissolved organic matter distribution in the Pacific Ocean. Deep Sea Res. Part I: Oceanographic Res. Pap. 56, 2175–2192. doi: 10.1016/j.dsr.2009.09.002
Vecchio R. D., Blough N. V. (2002). Photobleaching of chromophoric dissolved organic matter in natural waters: kinetics and modeling. Mar. Chem. 78, 231–253. doi: 10.1016/S0304–4203%2802%2900036–1
Vodacek A., Blough N. V., DeGrandpre M. D., Nelson R. K. (1997). Seasonal variation of CDOM and DOC in the Middle Atlantic Bight: Terrestrial inputs and photooxidation. Limnol. Oceanogr. 42(4):674–686. doi: 10.4319/lo.1997.42.4.0674
Weishaar J. L., Aiken G. R., Bergamaschi B. A., Fram M. S., Fujii R., Mopper K. W. (2003). Evaluation of specific ultraviolet absorbance as an indicator of the chemical composition and reactivity of dissolved organic carbon. Environ. Sci. Technol. 37 20, 4702–4708. doi: 10.1021/ES030360X
Winogradow A., Pempkowiak J. (2014). Organic carbon burial rates in the Baltic sea sediments. Estuar. Coast. Shelf Sci. 138, 27–36. doi: 10.1016/J.ECSS.2013.12.001
Wintermans J. F., de Mots A. (1965). Spectrophotometric characteristics of chlorophylls a and b and their pheophytins in ethanol. Biochim. Biophys. Acta 109 2, 448–453. doi: 10.1016/0926–6585%2865%2990170–6
Xing X., Morel A., Claustre H., D’Ortenzio F., Poteau A. (2012). Combined processing and mutual interpretation of radiometry and fluorometry from autonomous profiling Bio-Argo floats: 2. Colored dissolved organic matter absorption retrieval. J. Geophysical Res.: Oceans 117, 2011JC007632. doi: 10.1029/2011JC007632
Xing X., Qiu G., Boss E., Wang H. (2019). Temporal and vertical variations of particulate and dissolved optical properties in the South China Sea. J. Geophysical Res.: Oceans 124, 3779–3795. doi: 10.1029/2018JC014880
Ylöstalo P., Seppälä J. V., Kaitala S., Maunula P., Simis S. G. H. (2016). Loadings of dissolved organic matter and nutrients from the neva river into the gulf of Finland – biogeochemical composition and spatial distribution within the salinity gradient. Mar. Chem. 186, 58–71. doi: 10.1016/J.MARCHEM.2016.07.004
Keywords: chromophoric dissolved organic matter, fluorescence, absorption, Baltic Sea, conservative mixing model, apparent oxygen utilization, dissolved organic carbon
Citation: Terzić E, Zabłocka M, Loginova AN, Borzycka K and Kowalczuk P (2024) Estimation of net accumulation and removal of fluorescent dissolved organic matter in different Baltic Sea water masses. Front. Mar. Sci. 11:1379604. doi: 10.3389/fmars.2024.1379604
Received: 31 January 2024; Accepted: 23 April 2024;
Published: 19 June 2024.
Edited by:
Liyang Yang, Fuzhou University, ChinaReviewed by:
Guisheng Song, Tianjin University, ChinaJeonghyun Kim, Jeju National University, Republic of Korea
Copyright © 2024 Terzić, Zabłocka, Loginova, Borzycka and Kowalczuk. This is an open-access article distributed under the terms of the Creative Commons Attribution License (CC BY). The use, distribution or reproduction in other forums is permitted, provided the original author(s) and the copyright owner(s) are credited and that the original publication in this journal is cited, in accordance with accepted academic practice. No use, distribution or reproduction is permitted which does not comply with these terms.
*Correspondence: Elena Terzić, ZXRlcnppY0Bpb3Bhbi5wbA==