 Lars Chresten Lund-Hansen
 Emil Kobberup
 Lasse Z. Jensen
 Brian Sorrell
 Dorte Haubjerg Søgaard
- 1Arctic Research Center, Biological Department, Aarhus University, Aarhus, Denmark
- 2Microbiology, Biological Department, Aarhus University, Aarhus, Denmark
- 3Climate Research Center, Greenland Institute of Natural Resources, Nuuk, Greenland
The sea ice spring bloom is crucial for sustaining Arctic marine food webs, with sea ice algae serving as primary carbon sources for higher trophic levels. Despite the prevailing dominance of diatom species in sea ice spring blooms, our study highlights a notable deviation, showcasing a bloom driven by dinoflagellates. Through field sampling of first-year sea ice cores and subsequent analysis of physical and biogeochemical parameters, combined with amplicon sequencing of the 18S rRNA gene, we investigated the occurrence and implications of this significant dinoflagellate bloom, with a particular focus on Polarella glacialis. Our findings reveal that high irradiances at the top of the ice core, coupled with elevated nutrient availability and warm ice conditions, are key drivers of this phenomenon, as elucidated by redundancy analysis. Moreover, our results suggest a potential climate-driven decline in snow cover on sea ice, increased open leads, and thinner sea ice, which may favor the proliferation of dinoflagellates over diatoms. This alternative dinoflagellate-dominated bloom could have profound ecological consequences, given the enriched omega-3 fatty acid content of dinoflagellates, thereby influencing energy transfer within the Arctic marine food web. Furthermore, our study identifies the presence of not only Polarella glacialis but also Chytridinium, an ectoparasite on copepod eggs, and the green algae Ulothrix in relatively high abundances within the sea ice. These findings shed light on the intricate interplay between environmental factors and microbial community dynamics within Arctic sea ice ecosystems.
1 Introduction
Arctic sea ice may cover, at its maximum areal extent, the entire Arctic Ocean, the Canadian archipelago, extended parts of Hudson and Baffin Bay (Wratten et al., 2022), together with coastal and shelf areas around Greenland (Karami et al., 2021). By March, it reaches an annual median 15.9 × 10⁶ km2 winter maximum coverage (Francis and Wu, 2020). The areal minimum extent of the summer sea ice in September has been decreasing in the Arctic Ocean since late 1970, from 12.5 × 10⁶ km2 in 1980 to 10.6 × 10⁶ km2 in 2022, equivalent to a summer sea ice loss of 2.0 × 10⁶ km2 (Parkinson, 2014; Francis and Wu, 2020; Jeong et al., 2022). Winter sea ice extent in March reaches an annual median 15.9 × 10⁶ km2 of coverage, but winter sea ice extent is also decreasing, but at a slower rate compared to summer sea ice (Francis and Wu, 2020; Lund-Hansen et al., 2020).The thickness of the sea ice in the Arctic Ocean has also decreased (Sumata et al., 2023), from an average of 2.7 m (1990–2006) to an average of 1.7 m (2007–2019). This decrease in summer sea ice extent and sea ice thickness is largely a function of increasing air temperatures in the Arctic (Steiner et al., 2021), and inflows of warm Atlantic waters to the Arctic Ocean (Polyakov et al., 2023).
From an ecological perspective, sea ice is an ecosystem with clear and well-defined pathways of matter and energy comprising microorganisms, zooplankton, fish, seals and polar bears (Lund-Hansen et al., 2020), all of which rely on the sea ice for sustaining their life cycles (Kohlbach et al., 2017). Microorganisms living in sea ice include bacteria (Kaartokallio et al., 2013), viruses (Luhtanen et al., 2017), fungi (Gunde-Cimerman et al., 2003; Hassett et al., 2017), and heterotrophic and autotrophic protists (Bluhm et al., 2017). Autotrophic microalgae are adapted to the extreme low light conditions in sea ice, where photosynthesis below a snow and ice package has been observed at photon fluxes as low as 0.17 μmol photons m-2 s-1 (Hancke et al., 2018). Sea ice algae are estimated to contribute about 10% of total marine-produced carbon in the Arctic Ocean (Arrigo, 2017), and the biomass of ice algae expressed as chlorophyll a (Chl a) can reach values 50 to 100 times higher than those for pelagic phytoplankton (Arrigo, 2017). The most important ecological function of sea ice algae is to establish an early carbon source for planktonic grazers at the bottom of the food chain during the ice-covered winter and early spring (Michel et al., 2002; Terrado et al., 2008; Søreide et al., 2010). Colonization of the sea ice in winter follows a clear taxonomic succession where flagellates, ciliates and dinoflagellates inhabit the ice in very early spring (Kauko et al., 2018; Hegseth and Quillfeldt, 2022), followed by a spring bloom dominated by diatoms (Leu et al., 2015). Later, ice algae are released from the melting ice and can seed the water column below the sea ice and trigger the pelagic primary production (Michel et al., 1993; Olsen et al., 2017; Søgaard et al., 2021). The released algae form aggregates, which sink to the bottom of the ocean and establish a valuable food source for the benthos (Boetius et al., 2013).
In the present study we closely followed the succession in algal community composition from late February to early April in a first-year sea ice. We observed a dramatic ice algae spring bloom dominated by dinoflagellates in contrast to the more typical diatom-dominated spring blooms (Leu et al., 2015; Hegseth and Quillfeldt, 2022). The questions addressed are accordingly: 1) Which specific physical and/or biological parameters triggered this dinoflagellate bloom rather than a bloom of diatoms, 2) does dinoflagellate photobiology and biomass differ from that of a diatom-dominated bloom, 3) are dinoflagellate ice algae blooms likely to become more prevalent in a future Arctic sea ice, and 4) what are the implications for the sympagic food web and under-ice organisms following a change from a diatom-dominated to a dinoflagellate-dominated spring bloom?
2 Materials and methods
2.1 Study area
The study site was Malene Bight (64.179 N, 51.706 W) near the Greenland capital of Nuuk, southwest Greenland (Figure 1). First-year sea ice covers the bight from about mid-January and lasts until about mid-April, reaching a thickness of 30 to 40 cm, with snow periodically covering the ice in depths of 10 to 20 cm (Søgaard et al., 2010). Air temperatures vary from an average of −14°C in February to −5°C in the beginning of April (www.asiaq-greenlandsurvey.gl). As part of a teaching program we (LCLH, BS, and DHS) have carried out sea ice studies in the area every year since 2015 and sea ice and snow conditions have not changed.
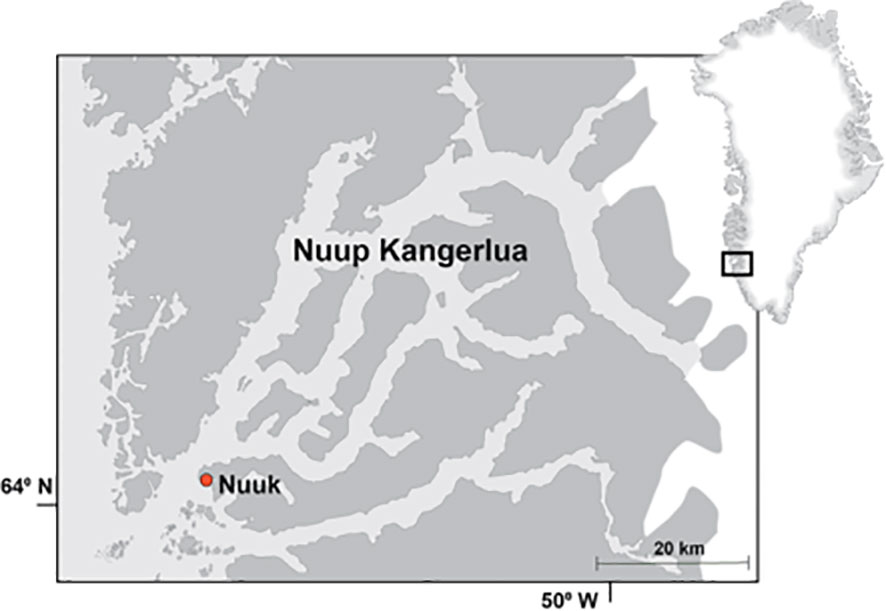
Figure 1 Map of southwest Greenland showing the study area of Malene Bight at Nuuk.
2.2 Sampling
An area of 100 × 100 m was marked with wooden stakes on the ice in February 2022, and sampling was carried out between 26 February and 4 April 2022. Snow depths were first measured (n = 10) with a ruler at sampling sites within a square area of 1 m2, which were then cleared of snow. Ice cores were extracted within the 1 m2 area using a Kovacs Mark II 90 mm diameter ice auger, to secure minimum horizontal and vertical variability in sea ice parameters between cores (Lund-Hansen et al., 2021). Ten cores were collected during each sampling event with triplicate cores for sea ice physics, triplicates for nutrients and Chl a, triplicates for algal photobiology, and one core for DNA extraction. DNA sampling for species composition commenced on 15 March 2022 and continued after Chl a concentrations began to increase. Cores were immediately placed in a cradle and shielded from light using a photographer’s black cloth to prevent any photodamage of the ice algae. Ice thickness (core length) was measured with a ruler to the nearest cm, and ice core temperatures were measured in the physics cores by drilling a 3 mm hole to the center of the ice core and inserting a temperature sensor (Testo 110 Thermometer).
All cores were cut into 3 cm thick sections using a stainless-steel saw except the DNA core. It was placed in a separate sterilized polyethylene bag in a darkened and insulated cooler. All ice sections from the other cores were placed in separate polyethylene containers and immediately transferred to a second darkened and insulated cooler and brought to the laboratory for analysis. Under-ice water samples were collected at 1 m depth below the bottom of the sea ice through one of the core holes and kept in brown glass bottles placed in a third darkened and insulated cooler. Water salinity below the bottom of the sea ice was measured in situ with a YSI Pro30 CTD. All samples were returned to the laboratory cold room (4°C) within 1 h, and ice samples were thawed overnight at 4°C and processed the following day. Cores for DNA extraction were stored at −20°C and kept frozen during transport back to Denmark until sample processing.
2.3 Air temperature, PAR, brine volume and brine salinity
Continuous (5 min) recordings of photosynthetically active radiation (PAR) and air temperature (30 min) were obtained from a permanent climate station in Nuuk, maintained and administered by ASIAQ-Greenland Survey (www.asiaq-greenlandsurvey.gl). Surface PAR, PAR albedo, and under-ice PAR were measured during sampling on the ice with Li-Cor LI-192 PAR sensors. The under-ice PAR sensor was mounted on a stick with an L-arm and lowered through a hole drilled in the ice, which was filled with ice and snow to prevent false light from above reaching the sensor. Bulk salinity of thawed sea ice samples was measured with a YSI Pro30 CTD. Brine volumes, based on bulk salinity and temperature of the ice, were calculated following Cox and Weeks (1983) for ice temperatures < −2°C and the Leppäranta and Manninen (1988) relations for ice temperatures > −2°C. Brine salinity was derived following Cox and Weeks (1983).
2.4 Chl a and nutrients
Samples for Chl a and nutrients were determined using standard methods described in detail by Søgaard et al. (2010). In brief, Chl a analyses were carried out at 3 cm vertical resolution and nutrients at 6 cm vertical resolution in the ice cores. Sea ice and under-ice water samples were analyzed for concentrations of NH4+ (ammonium), NO3- (nitrate), NO2- (nitrite), PO43- (phosphate) and Si(OH)4 (silicate) by filtering the thawed sea ice and water samples through 0.45 µm Q-Max CA syringe filters into 12 mL test tubes and freezing (−19°C) for further analysis. The concentrations were measured on a Seal QuAAtro autoanalyzer using standard colorimetric methods. Mean values of triplicate samples are reported.
2.5 Ice algae photobiology
Photobiological parameters were derived from variable chlorophyll fluorescence (Schreiber et al., 1986) using a Walz Phyto-PAM (Pulse Amplitude Modulated) variable fluorometer fitted with a Phyto-ED emitter-detector unit (Heinz Walz GmbH, Effeltrich, Germany) as described previously (Lund-Hansen et al., 2020a; Sorrell et al., 2021). The Phyto-PAM instrument was operated in a darkened and cooled laboratory, and thawed sea ice samples with ice algae were dark-acclimated (12 h) before measurements. The instrument provides ΦPSII_max (the maximum dark-acclimated quantum yield of Photosystem II), and its Rapid Light Curve (RLC) protocol (Schreiber, 2004; Ralph and Gademann, 2005) models the standard light response cardinal points, α (initial slope of the light response curve), Ek (onset of light saturation), and rETRmax (maximum light-saturated relative electron transport rate), using algorithms within the Phyto-PAM software. Differences in Chl a and photobiological parameters over time were tested with repeated measures analyses of variance after testing for, and if necessary, correcting, heterogeneity of variance, with differences between dates identified with post hoc Tukey tests. Isopleths of brine volume, temperature, ΦPSII_max, and Chl a were developed using SURFER ver. 2.3.4 (Golden Software).
2.6 Extraction, amplification, quantification and sequencing of eukaryotic 18S ribosomal DNA
The intact ice cores used for DNA extraction were washed with autoclaved, sterile 0.2 µm filtered Milli-Q water, before 5 cm sections were cut using a pre-sterilized stainless-steel saw. All 5 cm sections were transferred to sterile Whirl-Pak® sample bags and thawed at 4°C. Between 157–276 ml of sample was concentrated on 0.2 µm pre-sterilized polycarbonate filters (see Supplementary Table S1 for information on individual samples). Different sample sizes occurred as some filters became clogged due to high biomass accumulation; here it was decided that >150 mL samples were sufficient to describe the community structure. Sample processing was carried out in two rounds where the negative handling control (filter which was subjected to the same treatment without sample addition) was included in both rounds. Filters were immediately placed in sterile tubes and DNA was extracted directly from the filter, following the power soil pro kit protocol (Qiagen), including a DNA extraction negative control. 18S rRNA gene copies were quantified using primers Euk345F (5’- AAGGAAGGCAGCAGGCG-3’) and Euk499R (5’- CACCAGACTTGCCCTCYAAT-’3) (Zhu et al., 2005). The qPCR mixture contained 2 µL template DNA, 1 µL of each primer (10 pmol µL-1), 1 µL BSA (10 ng µL-1), 10 µL LightCycler Mastermix (Roche) and 4 µL dH2O to a final volume of 20 µL. Samples were run in triplicate including triplicate negative qPCR controls without addition of template DNA. Samples were run on a Stratagene Mx3005P (Agilent technologies) at the following temperatures: 95°C for 5 min, 40 cycles with denaturation at 95°C for 30 s, annealing at 60°C for 30 s, elongation at 72°C for 20 s, followed by fluorescent acquisition at 79°C for 15 s. A melting curve was produced using 1 cycle at 95°C for 30 s, and 55°C at 1 min and 95°C for 30 s. 18S rRNA library preparation of DNA was performed as follows: Primers TareukFWD1 (5’- CCAGCASCYGCGGTAATTCC-3’) and TAReukREV3 (5’- ACTTTCGTTCTTGATYRA-3’) were used to amplify the V4 RNA loop (Stoeck et al., 2010). The PCR mixture contained 4 µL template DNA. The thermal cycling was run with the touchdown PCR approach with an initial denaturation step at 95°C for 3 min, 10 cycles with denaturation at 95°C for 30 s, annealing at 57°C for 30 s, elongation at 72°C for 30 s, followed by 15 cycles with denaturation at 95°C for 30 s, annealing at 47°C for 30 s, elongation at 72°C and a final elongation at 72°C for 5 min. The PCR products were cleaned using 30 μL AMPure XP magnetic beads. The second round of PCR was run for 10 cycles to incorporate overhang adapters and was run with the same conditions as the previous PCR with an annealing temperature of 57°C. Products were cleaned, and the Nextera XT Index primers were incorporated in a third PCR reaction which was run for 8 cycles following the previous condition and an annealing temperature of 55°C. The PCR products were quantified using a Quant-iT™ dsDNA BR assay kit on a FLUOstar Omega fluorometric microplate reader (BMG LABTECH, Ortenberg, Germany), diluted and pooled together in equimolar ratios. The pool was quantified using the Quant-iT™ dsDNA BR assay kit on a Qubit fluorometer (Thermo Fisher Scientific, Waltham MA) and sequenced on the Illumina MiSeq platform (Illumina, San Diego, CA) which produces two 300-bp long paired-end reads.
2.7 Bioinformatic analysis
Bioinformatic analyses were performed in RStudio 4.3.1. Primer and adapter sequences were trimmed from the raw reads using cutadapt 0.0.1 (Martin, 2011). Forward and reverse read quality were plotted with the plotQualityProfile function from DADA2 1.21.0 (Callahan et al., 2017). Based on the read quality, a trimming of 280 bp and 200 bp were set for the forward and reverse reads respectively using FilterAndTrim, according to their quality (Callahan et al., 2017). The fastq files were randomly subsampled to the lowest read number using the ShortRead package 1.48.0 (Morgan et al., 2009), resulting in 51586 reads per sample. The subsampling allows for a more accurate comparison of the richness of the different samples. Error models were built for the forward and reverse reads, followed by dereplication and clustering into amplicon sequence variants (ASVs) (Callahan et al., 2017) with DADA2. The denoised forward and reverse reads were merged using the function mergePairs of default parameters with a minimum overlap of 12 nucleotides, allowing 0 mismatches. Sequence tables were made with the function makeSequenceTable. ASVs shorter than 360 and longer than 400 nucleotides were removed from the 18S dataset followed by chimeric sequence removal using the removeBimeraDenovo function (Supplementary Table S1). Taxonomic assignment was accomplished using the naive Bayesian classifier against the Protist Ribosomal Reference (PR2) database v5.0.1 (Guillou et al., 2013) with the assignTaxonomy function from DADA2. ASVs mapped to mitochondria, chloroplasts and metazoa were removed from the dataset. Samples were decontaminated using the prevalence method (Threshold = 0.1) from the Decontam package (Davis et al., 2018). One ASV (ASV593) classified to the genera Exobasidiomycetes (formerly Malassezia) was detected and removed from all samples as it is a known skin associated fungus (Spatz and Richard, 2020) which has been associated with contamination in microbiome sequencing dataset. Statistical tests and visualization of the data was performed with phyloseq (McMurdie and Holmes, 2013), Vegan (Oksanen et al., 2019) and microeco (Liu et al., 2021). Redundancy analysis (RDA) was performed using the following explanatory variables: under-ice PAR (Par.Under), sea ice temperature (Ice.Temperature), air temperature (Air.Temperature), nutrient concentrations (ammonium, nitrate, nitrite, phosphate and silicate) in the ice, and downwelling PAR (PAR.Down). Genera with a relative abundance of <0.5% were removed from the dataset before calculating the ordination.
3 Results
3.1 Ice, snow, PAR, air temperature, and nutrients
Ice thickness was effectively constant through the study period at an average of 36.9 ± 2.9 cm. Snow depths were also constant at an average of 15.1 cm during the first five sampling dates, but halved to 7.0 ± 0.8 cm on 4 April with the arrival of warmer air temperatures (Table 1). Last sampling was commenced on 4 April as the ice was broken a few days later by vessels. Albedo was high (0.85–0.90) during the beginning and middle of the study period, but lower (0.63–0.72) during the last two samplings. Downwelling PAR at the surface increased from 205 to 1506 µmol photons m-2 s-1 during the study period, and PAR below ice increased from 2.2 µmol photons m-2 s-1 on 10 March to 65.5 µmol photons m-2 s-1 on 4 April. Note that all PAR readings refer to readings at 12 noon for comparison. Under-ice Chl a was very low (< 0.5 µg Chl a L-1) except for the final sampling, with a concentration of 3.15 µg Chl a L-1. Sampling of water for nutrients below ice was not carried out at all ice sampling dates, from 10 March to 4 April nitrate decreased from 11.44 to 7.92 µmol L-1, silicate from 30.8 to 21.6 µmol L-1, and phosphate from 0.80 to 0.61 µmol L-1, whereas ammonium increased from 1.71 to 5.02 µmol L-1 (Table 1).
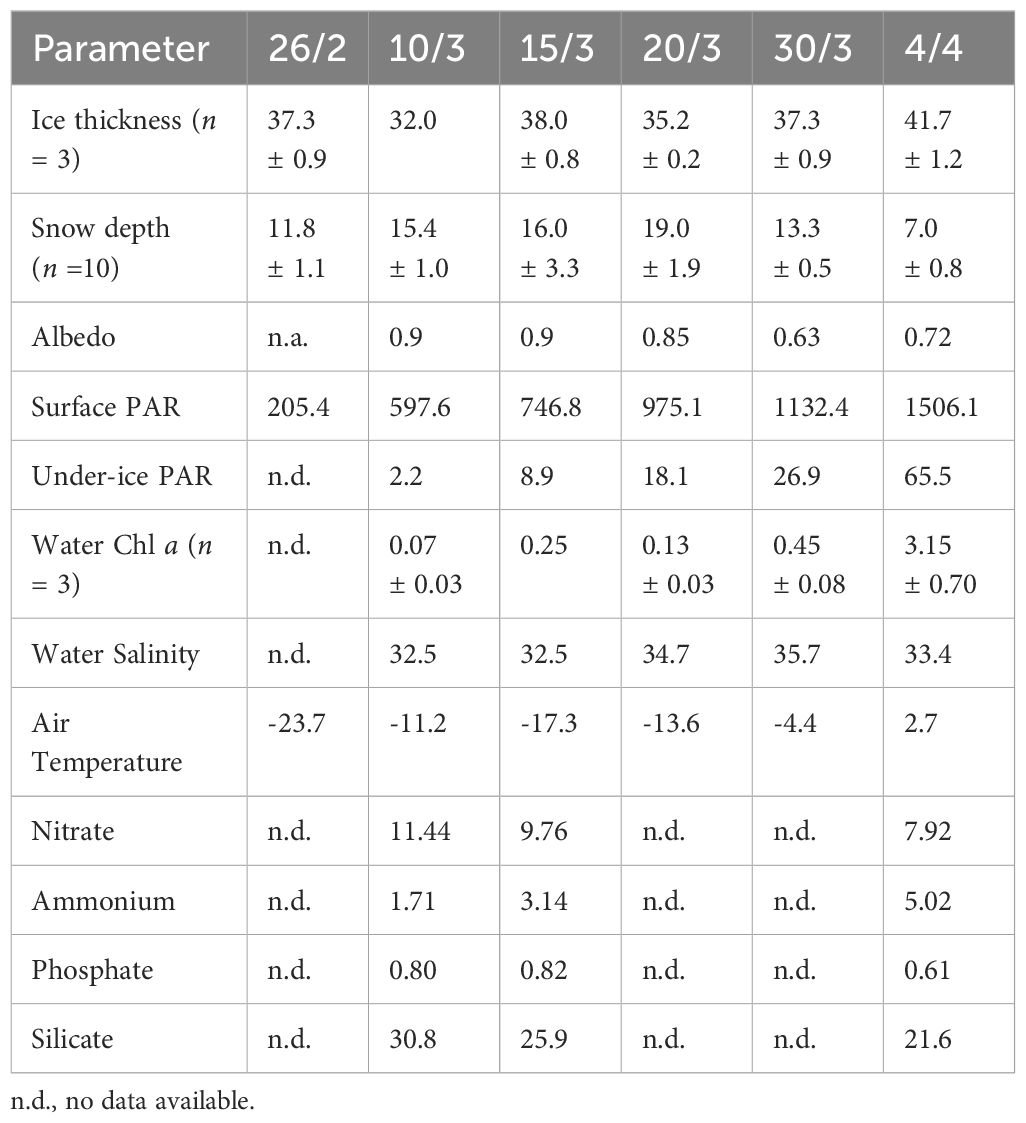
Table 1 Sea ice thickness (cm), snow depth (cm), albedo, downwelling and under-ice PAR at 12.00 h (µmol photons m-2 s-1), under-ice water Chl a (µg Chl a L-1), under-ice water salinity, air temperature (°C) at 12.00 h, and under-ice water concentrations of nitrate, ammonium, silicate and phosphate (µmol L-1).
3.2 Spatial and temporal patterns of ice temperature, brine volume, and ΦPSII_max
Sea ice temperatures were relatively low in the first part of the study period, but increased with the increasing air temperatures (Table 1) during the last three samplings to approx. −1 ˚C to −1.5°C (Figure 2B). This warm period was characterized by relatively high brine volumes (Figure 2A) of 15–20%, as brine volumes are positively related to both ice temperatures and bulk salinity. ΦPSII_max was relatively high (0.4 to 0.5) in the center of the ice but low (< 0.25) near the surface and bottom of the ice, except during the last two samplings (Figure 2C). Here, ΦPSII_max increased vertically in the ice, rising as high as 0.61 at 5 to 10 cm depth.
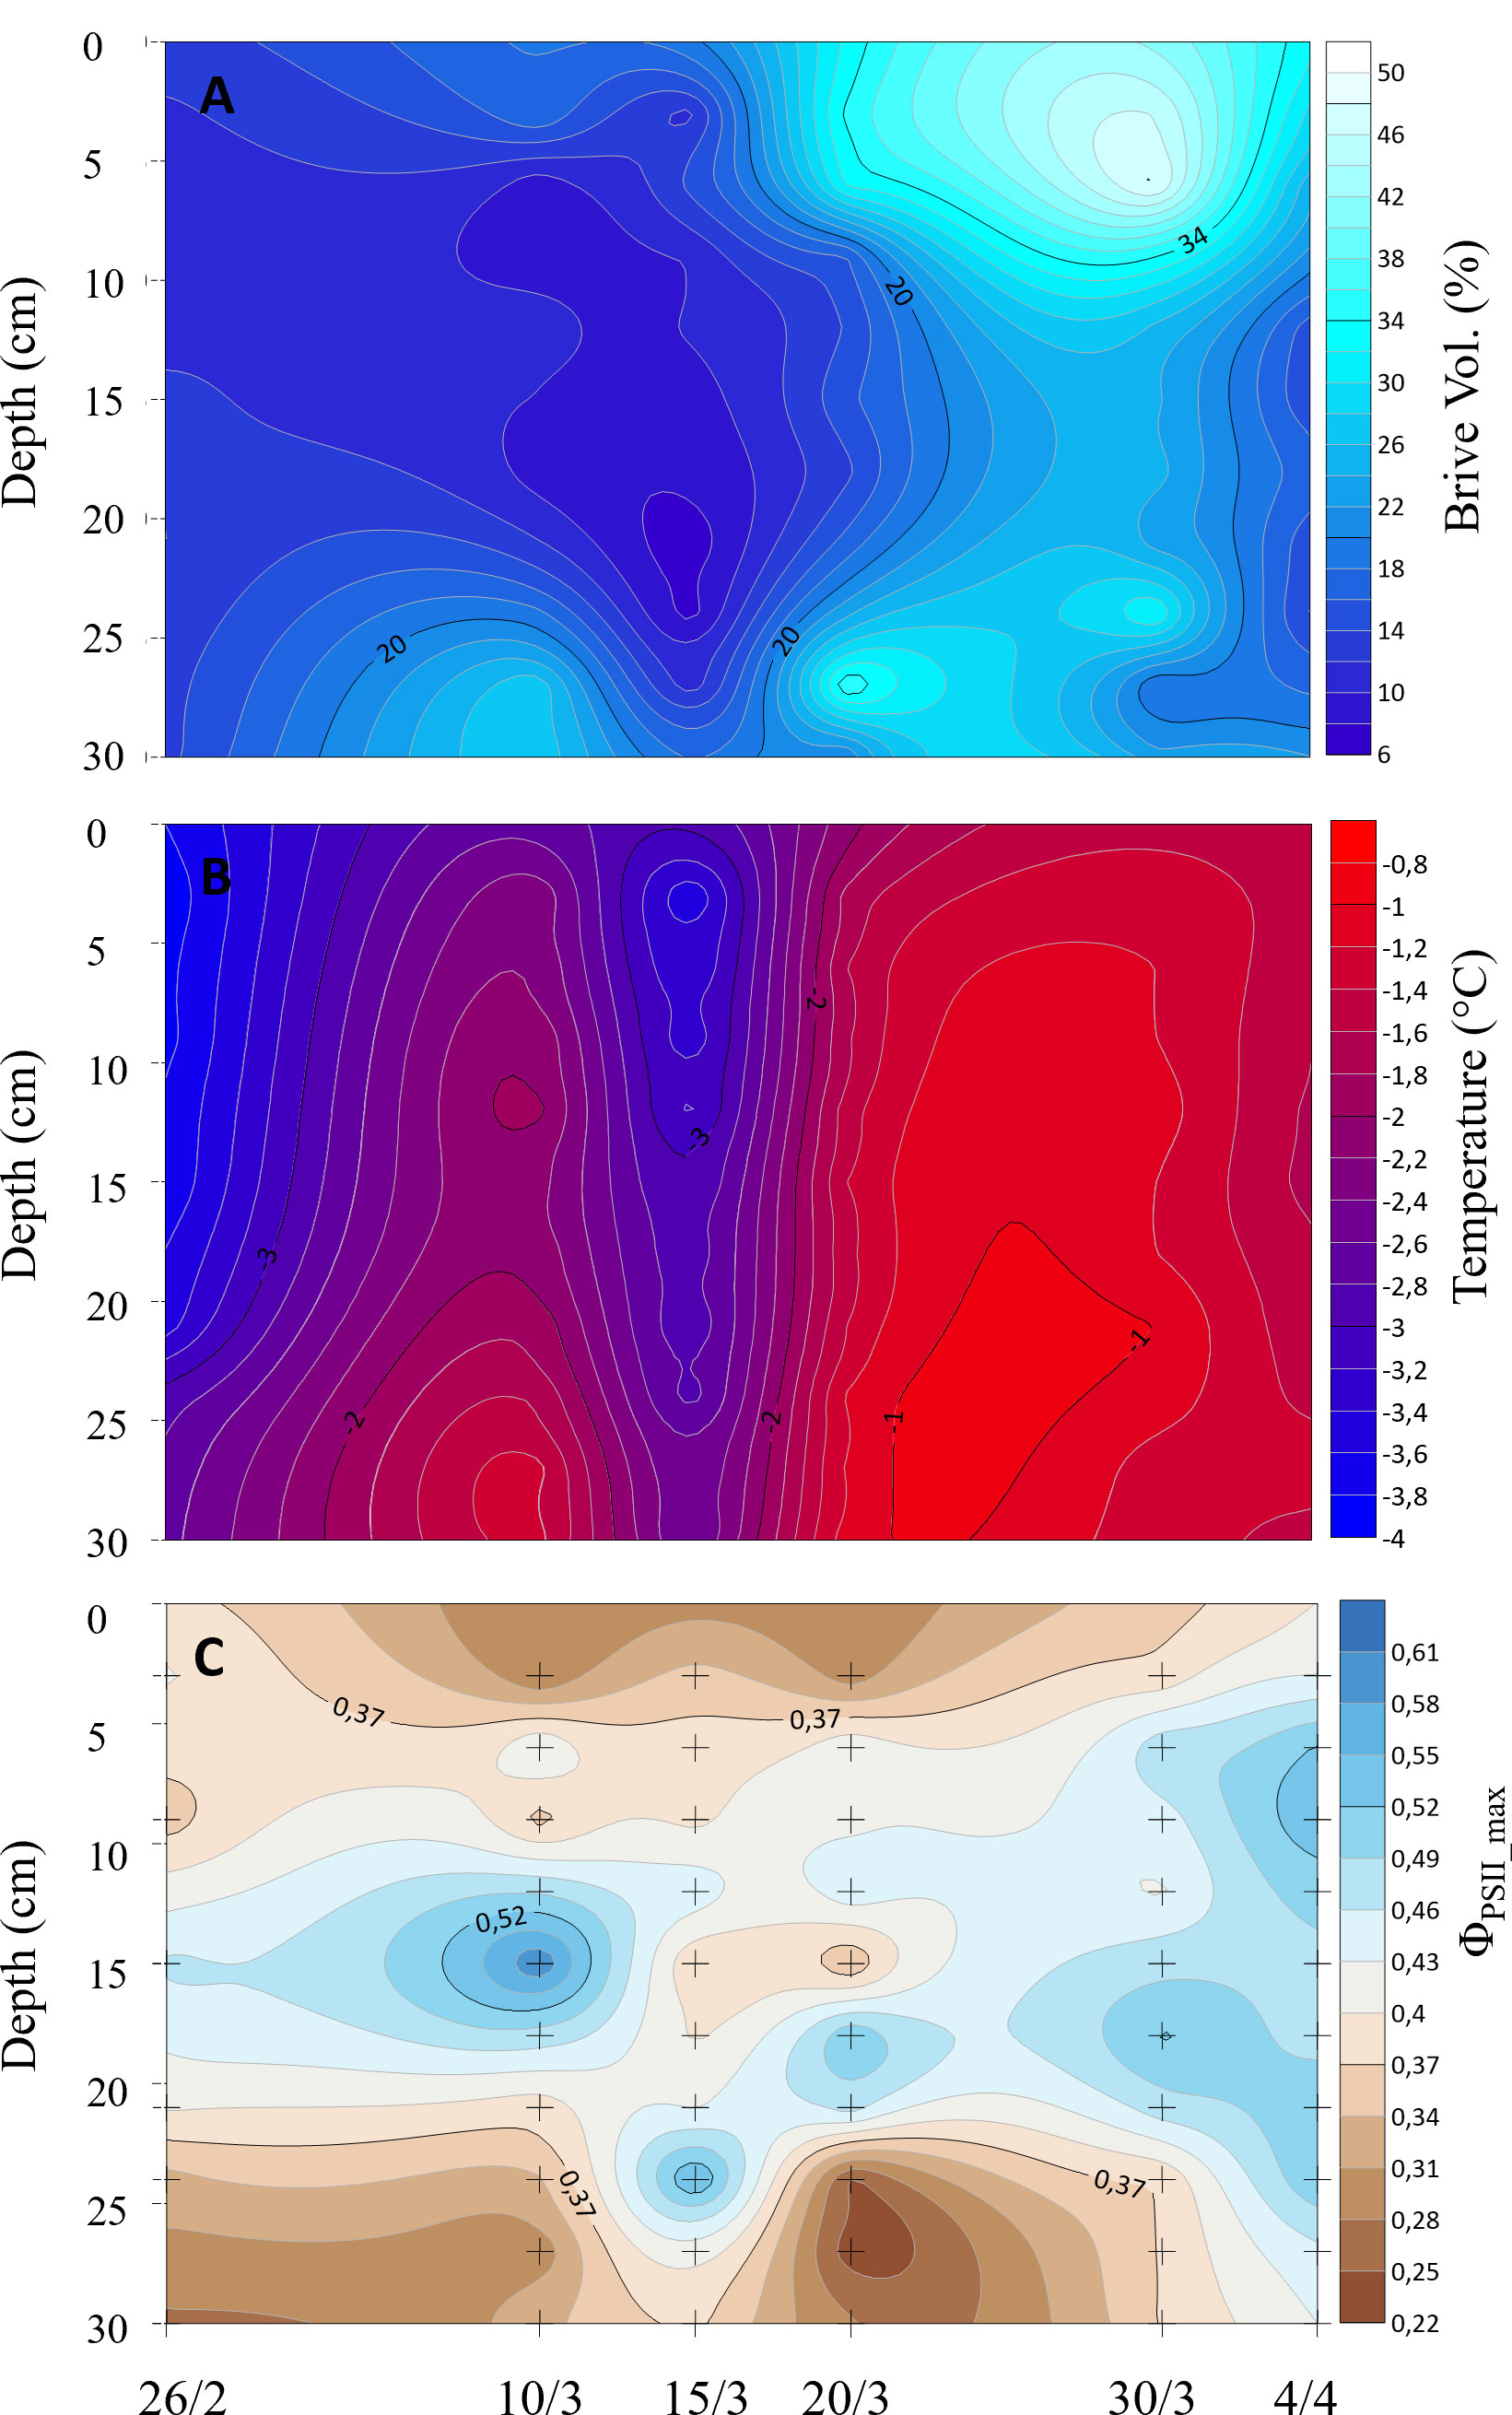
Figure 2 Sea ice temperature (A), brine volume (B), and ΦPSII_max (C), where + marks location in space and time of sampling.
3.3 Chl a, nutrients, and photobiological parameters
Chl a concentrations in the ice increased significantly through the study (F = 17.35, p < 0.001). They remained low (around 0.5 µg Chl a L-1) at first sampling (26 February), but increased to about 1.5 µg Chl a L-1 during the third sampling (20 March) (Figure 3A). Average Chl a concentration in the ice increased from 2.3 to 6.4 µg Chl a L-1 between 30 March and 4 April, with a maximum concentration of 13.4 µg Chl a L-1 in the surface (0–5 cm) layer.
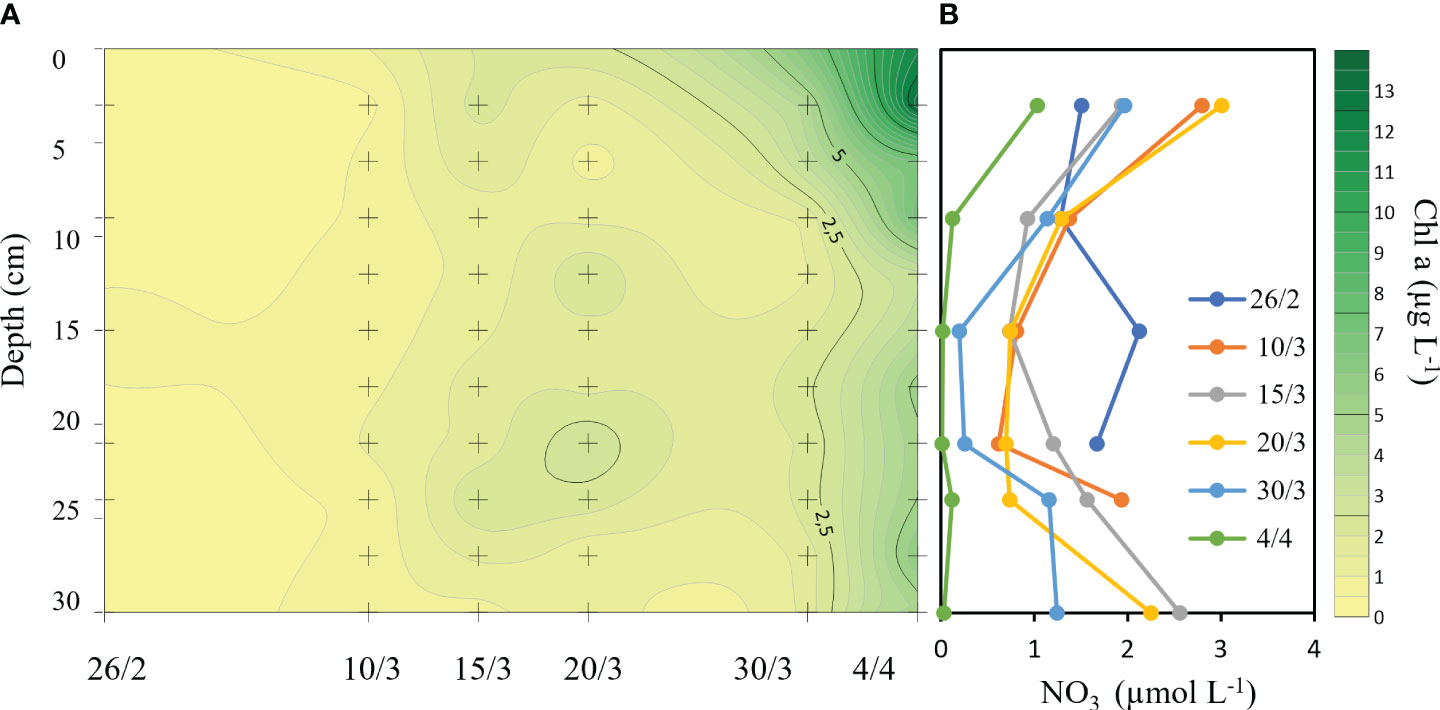
Figure 3 Chl a (A) and bulk nitrate (B) concentrations in the ice between 26 February and 4 April. + marks locations in space and time of sampling.
The bulk sea ice nitrate concentrations decreased from 2.0 to 0.05 µmol L-1 at 15 cm depth from the beginning of the sea ice season to just before sea ice break-up (Figure 3B). Uptake rate was estimated as the difference in concentration at specific dates divided by the time between dates, which reached 0.06 µmol L-1 d-1 for nitrate at 15 cm depth in the ice between 26 February and 4 April (38 days).The estimated uptake rates for phosphate (0.006 µmol L-1 d-1) and silicate (0.04 µmol L-1 d-1) were much lower. Supplementary Figures S1, S2 show phosphate and silicate concentrations over time. The N:P ratio at 15 cm depth decreased from 9.6 to 0.25 during the study period.
The photobiological data from Phyto-PAM analyses are shown in Figure 4. ΦPSII_max did not differ significantly during the study (Figure 4A). However, ANOVA (F = 3.36, p < 0.01) and the post hoc tests revealed two statistically distinct time periods for rETRmax (marked as Periods I and II in Figure 4B). During Period I, rETRmax remained constant and relatively low from 26 February to 20 March, but then suddenly increased, more than doubling, during the last two sampling dates (Period II in Figure 4B), just before sea ice break-up. ANOVA and post hoc tests revealed that EK also increased significantly (F = 7.19, p < 0.005) between these two periods, from 193.3 ± 79.6 µmol photons m-2 s-1 averaged over Period I, to 412.8 ± 181.7 µmol photons m-2 s-1 averaged over Period II, just before sea ice break-up. There were no significant differences in α over time, remaining constant from the beginning of the sea ice season (0.18 ± 0.04 µmol é mol-1 photons) to just before sea ice break-up (0.20 ± 0.04 µmol é mol-1 photons).
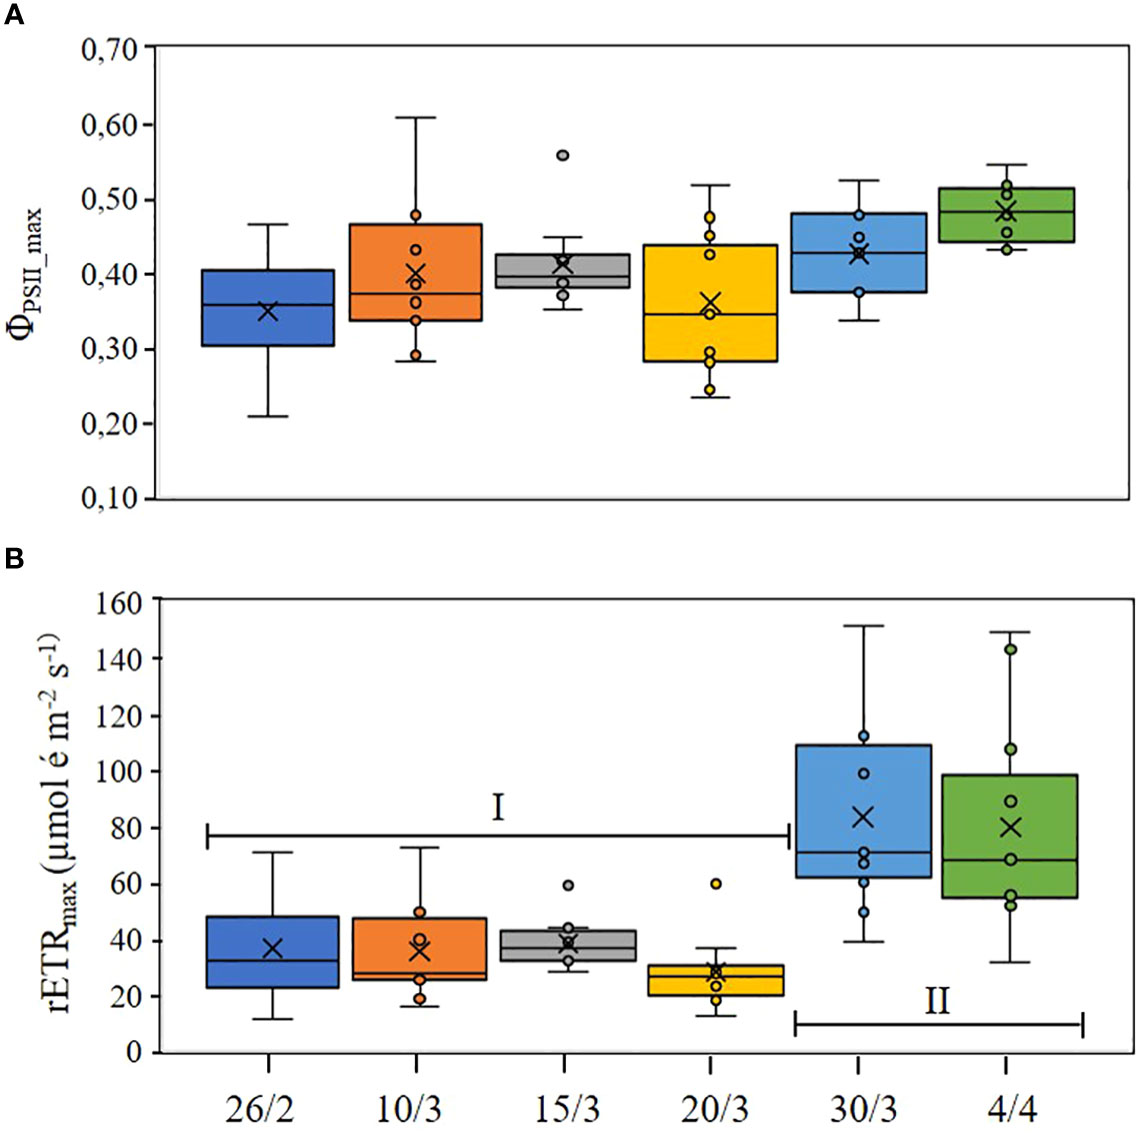
Figure 4 Time series of the photobiological parameters ΦPSII_max (maximum dark-acclimated quantum yield, (A) and rETRmax (maximum relative electron transport rate, (B), with the two statistically distinct phases identified by post hoc tests in (B) shown as periods I and II. Box and whisker plots show mean (×) and median (horizontal line).
3.4 Relative abundance of eukaryotic taxa in the sea ice
The relative abundance of taxa was similar across sampling dates and between the top and bottom of the ice and was clearly dominated by Dinophyceae and Ulvophyceae, with an average relative abundance of 31.2 ± 9.9% and 16.5 ± 12.7% for all depths and dates, respectively (Figure 5). Relative abundances of the other common taxa were: Cryptophyceae 9.0 ± 3.6%, Filosa-Thecofilosea 6.9 ± 2.4%, and the two classes of diatoms, Mediophyceae 5.2 ± 3.4% and Bacillariophyceae 4.3 ± 3.9%. Ulvophyceae became more abundant over time in the bottom section of the ice, while the diatoms (Mediophyceae and Bacillariophyceae) remained rather constant during the sampling period.
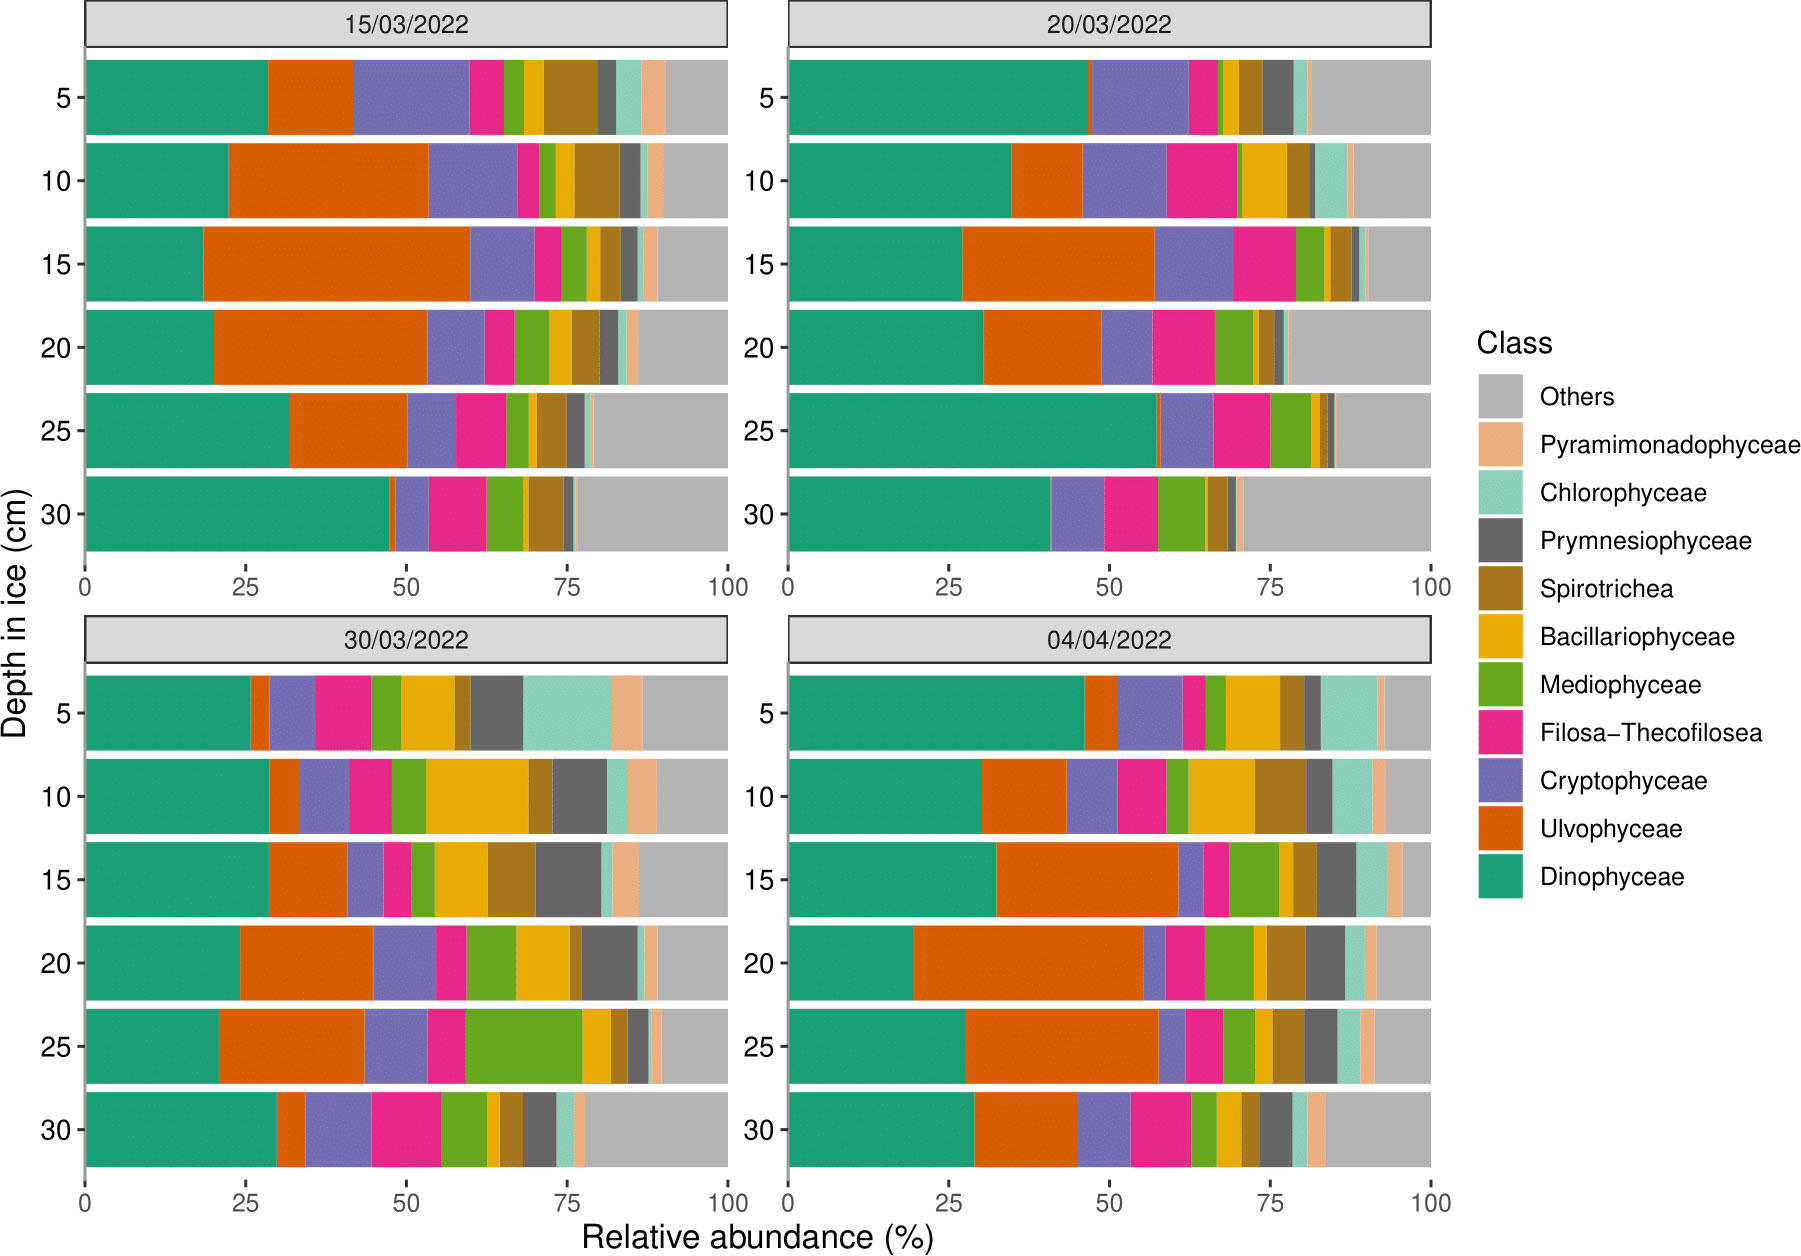
Figure 5 Relative abundances of the ten most abundant eukaryotic classes with depth in the sea ice from cores collected on 15 March (Top left), 20 March (Top right), 30 March (Bottom left), and 4 April (Bottom right). Classes which were not among the ten most abundant have been clustered into the “Others” group.
The relative abundance data (Figure 6) show that the most abundant genera were the two green algae Ulothrix and Chlamydomonas, the two dinoflagellates Chytriodinium and P. glacialis, together with taxa from the Protaspa-lineage_X. Overall we did not observe a large change in the dominant genera throughout the time-series. However, we did observe a 5.6-fold increase in the relative abundance of P. glacialis with a relative abundance of 1.8% on the 15/3 to 10.1% on the 4/4.
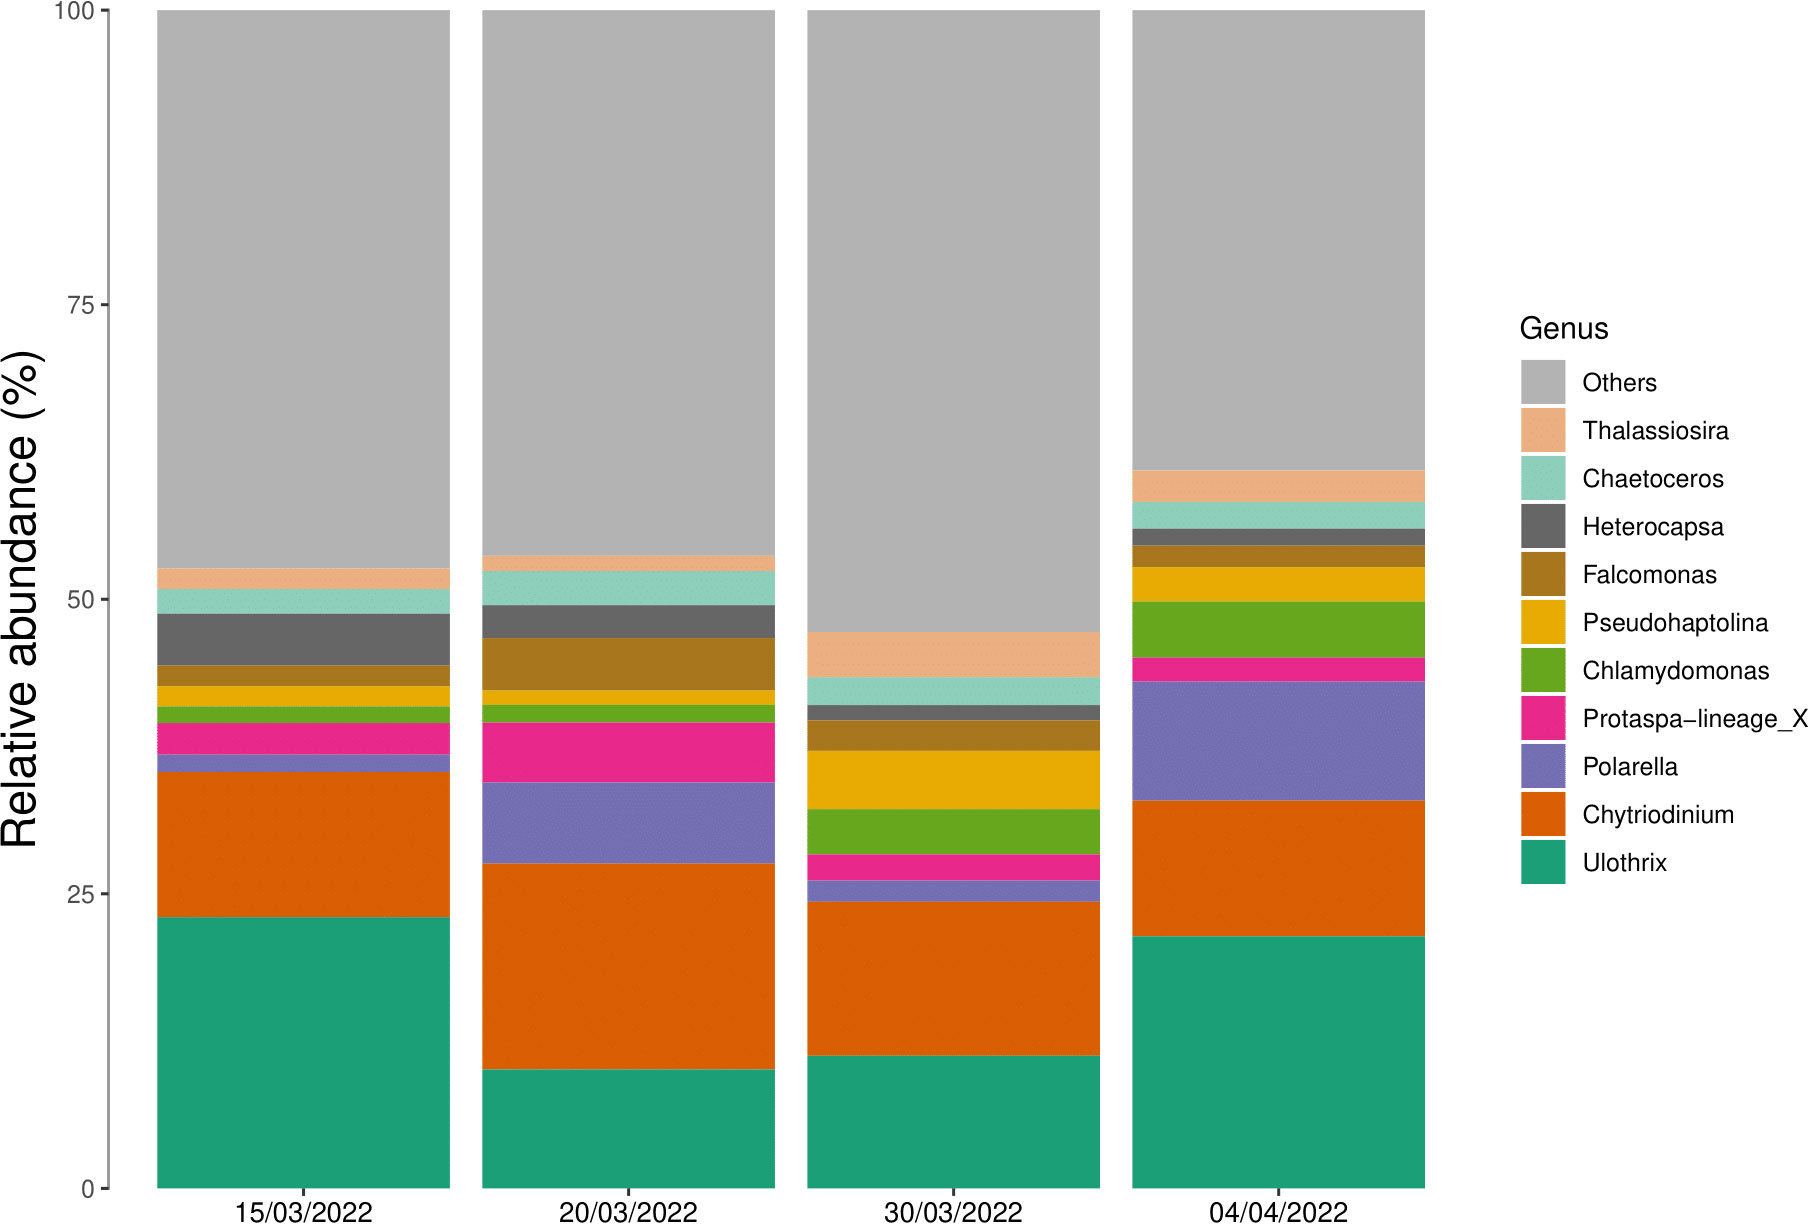
Figure 6 Relative abundances of the 10 most abundant eukaryotic genera averaged across entire ice cores collected on four sampling dates. Genera which were not within the top 10 most abundant has been clustered into the “others” group.
3.5 Redundancy analysis
The redundancy analysis shows that a total of 75.2% of the constrained variation in the data could be explained by the explanatory variables on the first two axes, with RDA1 explaining most of the constrained variation (52.9%) and the second axis explaining 22.3% of the constrained variation (Figure 7). The RDA analyses, comprising explanatory variables, show that the occurrence of the dinoflagellate genera Chytridinium was closely related to concentrations of nutrients (nitrate, silicate and phosphate). The green algae Ulothrix showed a negative correlation with the ice temperature and ammonium concentration. Additionally, the occurrence of Chlamydomonas Biecheleriopsis and P. glacialis was especially related to air temperature and downwelling PAR, together with the nitrite concentration on 20 March and 4 April, and specifically in the upper sections (5–10 cm) of the ice (Figure 7).
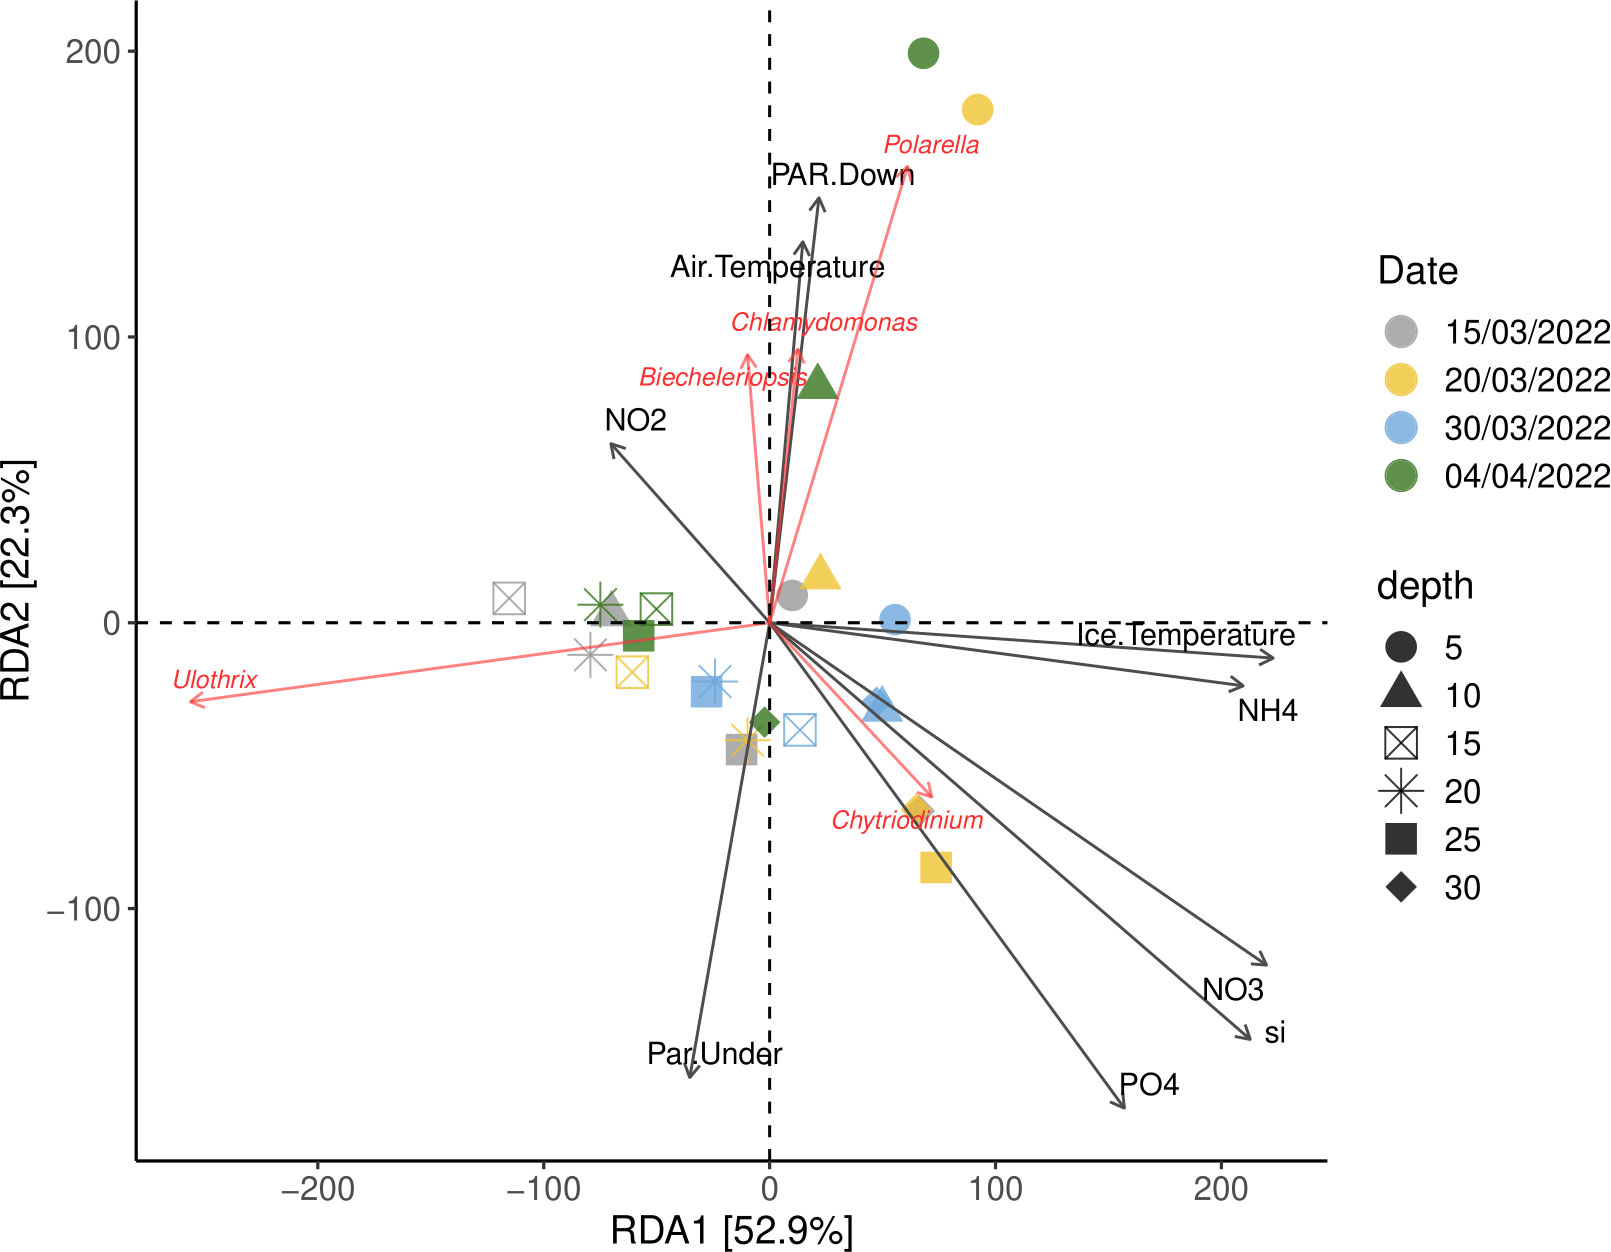
Figure 7 Redundancy analyses (RDA) of environmental factors and eukaryotic genera. Arrows indicate the direction and magnitude of environmental factors associated with the eukaryotic sea ice communities. The length of an arrow-line indicates the strength of the relationship between eukaryotic sea ice communities and environmental variables. Symbols of the same color represent the eukaryotic sea ice communities on the same date while the shape of the symbol represents the depth in the sea ice.
4 Discussion
In this study, we have shown the occurrence of a sea ice spring bloom driven by dinoflagellates, contrary to the common succession in sea ice where spring blooms are typically driven by diatom dominance (Leu et al., 2015; Hegseth and Quillfeldt, 2022). A study of the protist community at a comparable latitude (64 ˚N) in the Baltic Sea sea ice showed that 62% consisted of diatoms and 23% of autotrophic flagellates (Meiners et al., 2002). A switch from diatom to dinoflagellate dominated blooms may have important ecological consequences as dinoflagellates are relatively richer in omega-3 fatty acids (Peltomaa et al., 2019), but with lower sinking rates and thus delayed arrival of organic matter at the seabed. A Baltic Sea study showed that changing from a diatom- to a dinoflagellate-dominated pelagic spring bloom apparently reduced the degree of eutrophication (Spiling et al., 2018). The changing sea ice conditions and enhanced warming in the Arctic (Rantanen et al., 2022) involve an increasing extent of thinner first-year ice (FYI) compared to the extent of multi-year ice (MYI) (Kwok, 2018). Hop et al. (2020) have shown that significant changes in protist community composition occurs with the transition from MYI to FYI. Therefore, future sea ice conditions are likely to become more dynamic with more openings and refreezing of leads in the ice (Kauko et al., 2018), and therefore higher light and temperature conditions within the sea ice. We observed a positive association between the high abundance of dinoflagellates and the relatively high light and temperature conditions in the sea ice, which suggest that these climate-driven changes in sea ice conditions may promote the blooms of dinoflagellates. It can accordingly be hypothesized that these new sea ice conditions will further favor the occurrence and blooming of dinoflagellates will become more prevalent in the future. An improved insight into the extent and frequency of these blooms driven by dinoflagellates is therefore essential for understanding and modeling future changes of Arctic marine food webs.
4.1 Photobiology and productivity of the dinoflagellate bloom
The bloom of dinoflagellates was initiated during a period of decreasing snow depths and increased PAR in Malene Bight. We noted a continuous increase in under-ice PAR from 26.9 µmol photons m-2 s-1 pre-bloom to 65.5 µmol photons m-2 s-1 just before ice break-up, and this PAR increase (representing light availability for ice algae photosynthesis) was accompanied by an upregulation of photosynthetic activity (increased rETRmax) and higher photosynthetic light demand (increased Ek). This relation between increased PAR and upregulation of photosynthetic activity was also observed by Manes and Gradinger (2009) in a similar photobiological study at the Chukchi Sea, Alaska. However, a feature of our data is the already high ΦPSII_max in the pre-bloom population, which remained constant and high throughout the study. This shows that the pre-bloom community was already photosynthetically viable and active at the start of the study, consistent with previous studies showing maintenance and activation of photosystems in sea ice algae at extreme low light intensities in the polar night and early season (Hancke et al., 2018; Kennedy et al., 2019). Indeed, a PAR flux of 26.9 µmol photons m-2 s-1 is considerably higher than minimum PAR for growth of sea ice algae (Mock and Gradinger, 2000; Hancke et al., 2018), and of a similar magnitude to those observed during diatom-dominated blooms elsewhere (Hawes et al., 2012; Leu et al., 2015). Higher ice temperatures and thus higher metabolic rates in the latter part of the study period may also have contributed to the increase in rETRmax.
The upregulation of photosynthetic activity in this study was accompanied by higher algal biomass, which clearly indicates a photobiological and growth response to the higher sea ice light availability (Schreiber, 2004). Although we did not measure C fixation directly in this study, e.g., as 14C fixation (Stemann-Nielsen, 1952) photosynthetic activity as determined by PAM methods correlates broadly with C fixation rates in microalgae, including ice algae, in many studies (Glud et al., 2002; Hancke et al., 2015; Lund-Hansen et al., 2017), although this is species-specific, preferably involving conversion of rETR to absolute rates of electron transport (Hancke et al., 2015); see also Camargo et al. (2022) for other complications. Nevertheless, the observed increase in rETRmax strongly indicates corresponding increase in primary production, given the broad correspondence of 14C-based carbon uptake and rETRmax values (Barranguet and Kromkamp, 2000). During a previous ice algae spring bloom at the same site, primary production reached 12 mgC m-2 d-1 at a maximum biomass of 1.5 µg Chl a L-1 (Søgaard et al., 2010). Based on the maximum biomass of 13.0 µg Chl a L-1 in the present study, this would equate to a production rate of 80 to 90 mgC m-2 d-1, which is high compared to other studies in Greenland sea ice (García et al., 2023). This high production appears to have been reflected in steadily decreasing bulk nutrient concentrations in the ice over time. Assuming that nutrient uptake followed the standard Redfield-Brzezinski ratio of 106C:16N:15Si:1P, nitrate appears to have been depleted in the sea ice just before ice break-up. This strongly suggests that the observed gradual reduction in bulk nutrient concentrations was related to nutrient take up by the ice algal photosynthesis and growth inside the ice during the bloom. Theoretically, the relatively high (20–26%) brine volumes at the end of the study period could have allowed nutrient-rich under-ice water to enter the ice and reinforce the bloom (Golden et al., 2007). This was apparently not the case, given the very low (0.05 µmol L-1) nitrate concentrations in the lower sea ice. The sea ice broke in early April 2022. It can be speculated that a second bloom at the bottom of the ice would have followed the Dinoflagellate bloom, which, however, appears very unlikely as such a bloom would have required nitrate of which concentrations were close to detection limit beginning April in the bottom section of the ice. The under-ice bloom in Malene Bight described by Søgaard et al. (2010) extended 15–25 cm upwards into the ice and was not confined to the bottom per se as also observed in several other studies (Lund-Hansen et al., 2020).
4.2 Drivers of the dinoflagellate-dominated bloom
This study showed a distinct dinoflagellate-dominated bloom (18–57%), with a much lower contribution of the two diatom classes Mediophyceae (0.7–18%) and Bacillariophyceae (0.4–16%). All samples showed at all dates and all depths showed a consistent higher relative abundance of the Dinophyceae compared to the two classes of diatoms combined. Hence, our observations challenge the classical view that Arctic sea ice algae blooms reach a climax with large diatoms (e.g. Mikkelsen et al., 2008; Leeuwe et al., 2018), as we observed a very high peak dinoflagellate relative abundance (18–57%) during this sea ice spring bloom in April. We do note that dinoflagellates tend to have more 18S rRNA copies (Martin et al., 2022) compared with diatoms which potentially could skew our results towards a larger proportion of dinoflagellates compared to diatoms. However, we additionally note that both Dinoflagellates as well as diatom 18S rRNA copy number have been shown to be highly variable with standard deviations between 6.9 × 10⁻⁴ - 2.8 · 10-5 cell-1. The bloom is further supported by the increase in observed biomass which changed from 0.5 µg Chl a L-1 at the start of the campaign to 13 µg Chl a L-1 on the last day of the campaign. We did not find a remarkable increase in the relative abundance of either of the diatom classes during the increase in biomass, which likely shows that the bloom can be attributed to the community which was already present within the ice. The observed biomass at the end of the campaign was about five times higher than the sea ice biomasses of 2.8 µg Chl a L-1 previously observed in a diatom-dominated spring bloom in Malene Bight (Søgaard et al., 2010), and in the adjacent Kobbefjord with a diatom bloom biomass of 1.5 µg Chl a L-1 (Mikkelsen et al., 2008). We are aware that the sea ice was broken by vessels shortly after last sampling 4 April, and that a second diatom bloom could have taken place at a later stage. A diatom bloom was observed in May in Kobbefjord (Mikkelsen et al., 2008) for instance, but nutrients in the ice in the present study were fully exploited beginning April to support any potential new blooms.
The eukaryotic community composition data showed a clear dominance of genera from the green algae and the Dinoflagellata and with increased abundances of P. glacialis, the bipolar (i.e., occurring in both the Arctic and Antarctic) dinoflagellate (Montresor et al., 1999, 2003). A dominant, strong bloom of P. glacialis has previously been described from Antarctica (Stoecker et al., 2000; Thomson et al., 2004), whereas the present study is likely the first to document a similar dinoflagellate-dominated sea ice algae bloom involving P. glacialis in the Arctic. Our RDA analyses also demonstrated that the blooming of P. glacialis specifically occurred in the upper 5 to 10 cm of the ice during the later part of the sea ice season, with reduced snow cover, increased downwelling and high under-ice PAR, and higher air temperatures. Neeley et al. (2018) have previously demonstrated a significant positive relationship between P. glacialis and both light availability and temperature, and Kauko et al. (2018) have also observed that blooms of P. glacialis tend to be located in the upper, and accordingly more light-exposed, sections of the ice. The high affinity between sea ice and P. glacialis was recently demonstrated by Hardardottir et al. (2024) in the Arctic promoting the microalgae as candidate in reconstructing sea ice extent. The Chytriodinium, present in relatively high abundances (12–15%) at all samplings, is an ectoparasitic dinoflagellate of copepod and copepod eggs (Gomez et al., 2009). The occurrence of the Chytriodinium could reflect the relatively higher ice algae (Chl a L-1) concentrations measured in this study on which the zooplankton is grazing (Lund-Hansen et al., 2020a). On the other hand, being a parasite, the genus would likely not be observed in conventional analyses but only in molecular studies like ours. The genus occurs in both North and South Atlantic (Gomez and Skovgaard, 2015) but this is first record of this genus in sea ice, as to the best of the author’s knowledge. The green algae Ulothrix showed also high (10–25%) relative abundances. A study from the Canadian Basin observed the genus being attached to the bottom of the icebreaker (Melnikov et al., 2002), but in the present study the genus was detected in the entire sea ice core, and not limited to the bottom of the sea ice. It is a brackish-water green algae, though salinities in the water just below the ice were high (32.5–35.7) which calls for further studies. Anyway, this is to our best knowledge, the first record of this genus in sea ice.
4.3 Consequences of switching from diatom-dominated to dinoflagellate-dominated blooms
Based on our observations, the thinner sea ice and therefore higher PAR associated with climate change is likely to mediate a greater frequency of dinoflagellate-dominated ice algal blooms at the expense of the more shade-adapted diatoms. The question therefore is, what are the ecological implications of a shift from a diatom-dominated to a dinoflagellate-dominated sea ice bloom? This we have addressed in a conceptual model (Figure 8) that highlights the specific ecological conditions and consequences of diatom versus dinoflagellate blooms. In diatom-dominated ice algae blooms, most of the biomass is usually heavily concentrated at the bottom of the sea ice, but in dinoflagellate-driven blooms the biomass is more evenly distributed throughout the sea ice column. The shift that will therefore likely reduce the availability of the algal biomass for the grazing crustaceans and copepods (Bluhm et al., 2017). This could potentially imply a reduction in carbon available for higher trophic levels (Kohlbach et al., 2017). However, several studies have shown that fatty acid content, especially the nutritionally important omega-3 fatty acid, is significantly higher in dinoflagellates than diatoms (44.3 μg FA mg DW-1 compared to 7.6 μg FA mg DW-1, according to Peltomaa et al. (2019)). Hence, the nutritional quality of the algae will increase with a change to dinoflagellate dominance. Furthermore, diatoms are larger and often chain-forming in contrast to the smaller, unicellular dinoflagellates, giving diatoms a higher sinking velocity, proportional to the square of the cell size according to Stoke’s law (Laurenceau-Cornec et al., 2020). Miklasz and Denny (2010) determined diatom sinking rates from 4 to 7.6 m d-1 compared to 0.3 to 3.7 m d-1 for dinoflagellates (Kamykowski et al., 1992). The change from a diatom to a dinoflagellate dominated-bloom will therefore likely favor benthic organisms in terms of food quality, with a much higher nutritional quality of carbon reaching the sea floor. On the other hand, the rate of supply of this organic material to the benthos will be delayed by the slower sinking rates.
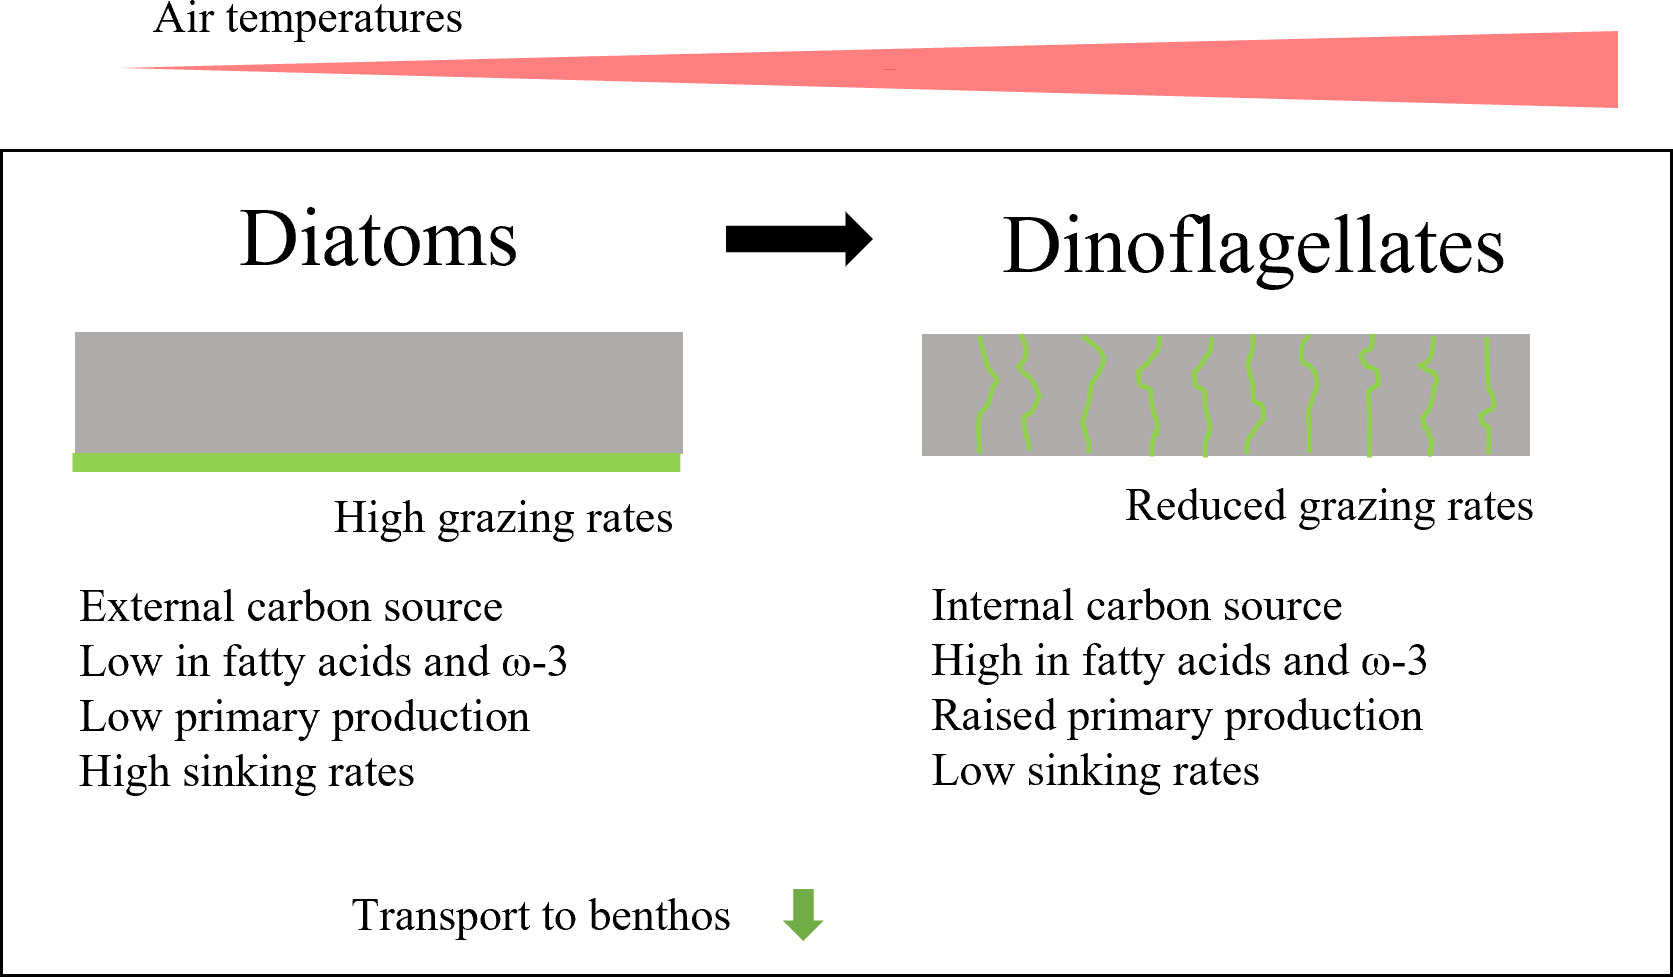
Figure 8 Conceptual model encompassing ecological consequences of a transition from a diatom-dominated to a dinoflagellate-dominated bloom in sea ice.
5 Conclusions
In this study, we observed a strong, extensive bloom of dinoflagellates including P. glacialis in a first-year sea ice. The bloom was driven by a combination of high PAR availability in a thin ice with high temperatures. We predict that such blooms will become more prevalent in the future climate-driven thinner sea ice with increased transmittances. The constant, relatively high ΦPSII_max throughout the study demonstrates photosynthetic competence of dinoflagellates before the onset of the bloom, allowing the observed rapid increase in photosynthetic activity and biomass as light and temperature increased. The Chl a concentrations were higher in this dinoflagellate bloom than in previously documented diatom ice algal blooms at the same site, suggesting increasing ice algal primary productivity when blooms are dominated by dinoflagellates. The ecological consequences of a shift from diatom-dominated to dinoflagellate-dominated sea ice spring blooms include a higher production of carbon with enhanced omega-3 fatty acid content, lower grazing rates, and delayed transport of organic material to the benthos. Our findings, facilitated by microbial community DNA analysis, emphasize the increasingly important role of dinoflagellates in shaping sea ice ecosystems. The significance of employing a multidisciplinary approach, incorporating diverse methodologies, and analyzing the entire sea ice core with respect to spatial variability, cannot be overstated. This difference from many previous studies, which often focus heavily on the bottom of the ice, provides a more comprehensive understanding of the microbial dynamics in the sea ice.
Data availability statement
The datasets presented in this study can be found in online repositories. The names of the repository/repositories and accession number(s) can be found here: https://www.ncbi.nlm.nih.gov/sra, PRJNA1066332.
Author contributions
LL-H: Methodology, Supervision, Visualization, Writing – original draft, Writing – review & editing. EK: Formal analysis, Investigation, Methodology, Writing – review & editing. LJ: Data curation, Formal analysis, Methodology, Writing – original draft, Writing – review & editing. BS: Formal analysis, Investigation, Methodology, Writing – review & editing. DS: Funding acquisition, Methodology, Resources, Supervision, Writing – review & editing.
Funding
The author(s) declare financial support was received for the research, authorship, and/or publication of this article. This work was supported by the The Danish Agency for Higher Education and Science for the A-MINERAL network (1113–00025B), The Greenland Climate Research Center, GINR, the Villum Fonden (research grants 23175 and 37435), the Novo Nordisk Foundation (NNF19OC0056963), and the Independent Research Fund Denmark (9145–00001B). The project was developed in the frame of the project FACE-IT (The future of Arctic Coastal Systems - Identifying Transitions in Fjord Systems and Adjacent Coastal Areas). FACE-IT has received funding from European Union’s Horizon 2020 research and innovation program under grant number agreement No 869154.
Acknowledgments
The Climate Research Center, GINR, Nuuk, is thanked for their logistical support during the field campaign.
Conflict of interest
The authors declare that the research was conducted in the absence of any commercial or financial relationships that could be construed as a potential conflict of interest.
Publisher’s note
All claims expressed in this article are solely those of the authors and do not necessarily represent those of their affiliated organizations, or those of the publisher, the editors and the reviewers. Any product that may be evaluated in this article, or claim that may be made by its manufacturer, is not guaranteed or endorsed by the publisher.
Supplementary material
The Supplementary Material for this article can be found online at: https://www.frontiersin.org/articles/10.3389/fmars.2024.1377819/full#supplementary-material
References
Arrigo K. (2017). “Sea ice as a habitat for primary producers,” in Sea ice, 3rd ed. Ed. Thomas D. N. (Wiley Blackwell, Oxford, UK). 652p.
Barranguet C., Kromkamp J. (2000). Estimating primary production rates from photosynthetic electron transport in estuarine microphytobenthos. Mar. Ecol. Prog. Ser. 204, 39–52. doi: 10.3354/meps204039
Bluhm B. A., Swadling K. M., Gradinger R. (2017). “Sea ice”, 3rd ed. Ed. Thomas D. N. (Wiley Blackwell, Oxford, UK). 652p. Available at: https://www.wiley.com/en-us/Sea+Ice%2C+3rd+Edition-p-9781118778388.
Boetius A., Albrecht S., Bakker K., Beinhold C., Felden J., Fernández-Méndez M., et al. (2013). Export of algal biomass from the melting Arctic sea ice. Science. 339 (6126), 1430–1432. doi: 10.1126/science.1231346
Callahan B. J., McMurdie P. J., Holmes S. P. (2017). Exact sequence variants should replace operational taxonomic units in marker-gene data analysis. ISME J. 11, 2639–2643. doi: 10.1038/ismej.2017.119
Camargo E. C., Rossi R. A., Silva J. C., Miwa A. C. P., Prasil O., do Carmo Calijuri M., et al. (2022). Comparing pulse amplitude modulated (PAM) fluorometry with radiocarbon technique for determinations of inorganic carbon fixation in chlorella vulgaris (Trebouxiophyceae, chlorophyta). Europ. Phycol. 57, 18–29. doi: 10.1080/09670262.2021.1885065
Cox G. F. N., Weeks W. F. (1983). Equations for determining the gas and brine volumes in sea-ice samples. J. Glaciol. 29, 306–316. doi: 10.3189/S0022143000008364
Davis N. M., Proctor D. M., Holmes S. P., Relman D. A., Callahan B. J. (2018). Simple statistical identification and removal of contaminant sequences in marker-gene and metagenomics data. Microbiome 6, 226. doi: 10.1186/s40168-018-0605-2
Francis J. A., Wu B. (2020). Why has no new record-minimum Arctic sea-ice extent occurred since September 2012? Environ. Res. Let. 15, 114034. doi: 10.1088/1748–9326/abc047
García L. M., Sorrell B., Søgaard D. H., Lund-Hansen L. C. (2023). Spatial Variability in the Primary Production Rates and Biomasses (Chl a) of Sea Ice Algae in theCanadian Arctic–Greenland Region: A Review. J. Mar. Sci. Eng. 11, 2063. doi: 10.3390/jmse11112063
Glud R., Rysgaard S., Kuhl M. (2002). A laboratory study on O2 dynamics and photosynthesis in ice algal communities: Quantification by microsensors O2 exchange rates, 14C incubations and a PAM fluorometer. A1quat. Microb. Ecol. 27, 301–311. doi: 10.3354/ame027301
Golden K. M., Eicken H., Heaton A. L., Miner J., Pringle D. J., Zhu J. (2007). Thermal evolution of permeability and microstructure in sea ice. Geophys. Res. Let. 34, L16501. doi: 10.1029/2007GL030447
Gomez F., Moreira D., L.-Garcia P. (2009). Life style and molecular phylogeny of the dinoflagellates Chytriodinium and Dissodinium, ectoparasites of copepod eggs. Eur. J. Protistol. 45, 260–270. doi: 10.1016/j.ejop.2009.05.004
Gomez F., Skovgaard A. (2015). Molecular phylogeny of the parasitic dinoflagellate Chytriodinium with the Gymnodinium clade (Gymnodiniales, Dinophyceae). Eukaryot. Microbiol. 62, 422–425. doi: 10.1111/jeu.12180
Guillou L., Bachar D., Audic S., Bass D., Berney C., Bittner L., et al. (2013). The Protist Ribosomal Reference database (PR2): a catalog of unicellular eukaryote Small Sub-Unit rRNA sequences with curated taxonomy. Nucleic Acids Res. 41, D597–D604. doi: 10.1093/nar/gks1160
Gunde-Cimerman N., Sonjak S., Zalar P., Frisvad J. C., Diderichsen B., Plemenitaš A. (2003). Extremophilic fungi in arctic ice: a relationship between adaptation to low temperature and water activity. Phys. Chem. Earth Parts A/B/C 28, 1273–1278. doi: 10.1016/j.pce.2003.08.056
Hancke K., Dalsgaard T., Sejr M. K., Markager S., Glud R. N. (2015). Phytoplankton productivity in an Arctic fjord (West Greenland): Estimating electron requirements for carbon fixation and oxygen production. PloS One 10, e0133275. doi: 10.1371/journal.pone.0133275
Hancke K., Lund-Hansen L. C., Lamare M. L., Pedersen S. H., King M. D., Andersen P., et al. (2018). Extreme low light requirement for algae growth underneath sea ice: A case study from Station Nord, NE Greenland. J. Geophys. Res. 123, 985–1000. doi: 10.1002/2017JC013263
Hardardottir S., Halle J. S., Ray J. L., Limoges A., Nieuwenhove N. V., Lalande C., et al. (2024). Millennial.scale variations in Arctic sea ice are recorded in sedimentary ancient DNA of the microalga Polarella glacialis. Commun. Earth Environ. 5, 25. doi: 10.1038/s43247–023-01179–5
Hassett B. T., Ducluzeau A. L., Collins R. E., Gradinger R. (2017). Spatial distribution of aquatic marine fungi across the western arctic and sub-arctic. Environ. Microbiol. 19, 475–484. doi: 10.1111/1462-2920.13371
Hawes I., Lund-Hansen L. C., Sorrell B. K., Nielsen M. H., Borzák R., Buss I. (2012). Photobiology of sea ice algae during spring growth in Kangerlussuaq, West Greenland: Insights from imaging variable fluorescence of ice cores. Photosyn. Res. 112, 103–115. doi: 10.1007/s11120-012-9736-7
Hegseth E. N., Quillfeldt C. (2022). The sub-ice algal communities of the Barents Sea pack ice: Temporal and spatial distribution of biomass and species. J. Mar. Sci. Eng. 10, 164. doi: 10.3390/jmse10020164
Hop H., Vihtakarim M., Bluhm B. A., Assmy P., Poulin M., Gradinger R., et al. (2020). Changes in sea ice protist diversity with declining sea ice in the Arctic Ocean from the 1980s to 2010s. Front. Mar. Sci. 67. doi: 10.3389/fmars.2020.00243
Jeong H., Park H.-S., Stuecker M. F., Yeh S.-W. (2022). Record low Arctic sea ice extent in 2012 linked to two-year La Niña-driven sea surface temperature pattern. Geophys. Res. Let. 49, e2022GL098385. doi: 10.1029/2022GL098385
Kaartokallio H., Søgaard D. H., Norman L., Rysgaard S., Tison J.-L., Delille B., et al. (2013). Short-term variability in bacterial abindance, cell properties, and incorporation of leucine and thymidine in subarctic ice. Aquat. Micro. Biol. 71, 57–73. doi: 10.3354/ame01667
Kamykowski D., Reed R. E., Kirkpatrick G. J. (1992). Comparison of sinking velocity, swimming velocity, rotation and path characteristics among six marine dinoflagellate species. Mar. Biol. 113, 319–328. doi: 10.1007/BF00347287
Karami M. P., Myers P. G., de Vernal A., Tremblay L. B., Hu X. (2021). The role of Arctic gateways on sea ice and circulation in the Arctic and North Atlantic Oceans: a sensitivity study with an ocean-sea-ice model. Clim. Dynam. 57, 2129–2151. doi: 10.1007/s00382-021-05798-6
Kauko H. M., Olsen L. M., Duarte P., Peeken I., Granskog M. A., Johnsen G., et al. (2018). Algal colonization of young arctic sea ice in spring. Front. Mar. Sci. 5. doi: 10.3389/fmars.2018.00199
Kennedy F., Martin A., Bowman J. P., Wilson R., McMinn A. (2019). Dark metabolism: a molecular insight into how the Antarctic sea-ice diatom Fragilariopsis cylindrus survives long-term darkness. New Phytol. 223, 675–691. doi: 10.1111/nph.15843
Kohlbach D., Lange B. A., Schaafsma F. L., David C., Vortkamp M., Graeve M., et al. (2017). Ice algae-produced carbon is critical for overwintering of Antarctic Krill Euphausia superba. Front. Mar. Sci. 4. doi: 10.3389/fmars.2017.00310
Kwok R. (2018). Arctic Sea ice thickness, volume, and multiyear ice coverage: Losses and coupled variability, (1958–2018). Environ. Res. Let. 13, 105005. doi: 10.1088/1748-9326/aae3ec
Laurenceau-Cornec E. C., Moignem F. A. C., Gallinari M., Moriceau B., Toullec J., Iversen M. H., et al. (2020). New guidelines for application of Stoke’s models to the sinking velocity of marine aggregates. Limnol. Oceano. 65, 1264–1274. doi: 10.1002/lno.11388
Leeuwe M. A., Tedesco L., Arrigo K. R., Assmy P., Campbell K., Meiners K. M., et al. (2018). Microalgal community structure and primary production in Arctic and Antarctic Sea ice: A synthesis. Elemen. Sci. Anthropo. 6, 1–25. doi: 10.1525/elementa.267
Leppäranta M., Manninen T. (1988). The brine and gas content of sea ice with attention to low salinities and high temperatures. Available online at: https://aquadocs.org/handle/1834/23905.
Leu E., Mundy C. J., Assmy P., Campbell K., Gabrielsen T. M., Gosselin M., et al. (2015). Arctic spring awakening–steering principles behind the phenology of vernal ice algal blooms. Prog. Oceanogr. 139, 151–170. doi: 10.1016/j.pocean.2015.07.012
Liu C., Cui Y., Li X., Yao M. (2021). Microeco: an R package for data mining in microbial community ecology. FEMS Microbiol. Ecol. 97, fiaa255. doi: 10.1093/femsec/fiaa255
Luhtanen A., E.-Rasimus E., Oksanen H. A., Tison J.-L., Delille B., Dieckmann G., et al. (2017). The first known virus isolates from Antarctic sea ice have complex infection patterns. FEMS Microbiol. Ecol. 94, 2018. doi: 10.1093/femsec/fiy028
Lund-Hansen L. C., Hawes I., Hancke K., Salmansen N., Nielsen J. R., Balslev L. (2020a). Effects of increased irradiance on biomass, photobiology, nutritional quality, and pigment composition of Arctic sea ice algae. Mar. Ecol. Prog. Ser. 648, 95–110. doi: 10.3354/meps13411
Lund-Hansen L. C., Hawes I., Nielsen M. H., Sorrell B. K. (2017). Is colonization of sea ice by diatoms facilitated by increased surface roughness in growing ice crystals? Polar Biol. 40, 593–602. doi: 10.1007/s00300–016-1981–3
Lund-Hansen L. C., Petersen C. M., Søgaard D. H., Sorrell B. K. (2021). A Comparison of decimeter scale variations of physical and photobiological parameters in a late winter first-year sea ice in southwest Greenland. J. Mar. Sci. Eng. 9, 60. doi: 10.3390/jmse9010060
Lund-Hansen L. C., Søgaard D. H., Sorrell B. K., Gradinger R., Meiners K. M. (2020). Arctic sea ice ecology (Berlin: Springer), 178. doi: 10.1007/978–3-030–37472-3
Manes S., Gradinger R. (2009). Small scale vertical gradients of Arctic ice algal photophysiological properties. Photosyn. Res. 102, 53–66. doi: 10.1007/s11120-009-9489-0
Martin J. L., Santi L., Pitta P., John U., Gypens N. (2022). Towards quantitative metabarcoding of eukaryotic plankton: an approach to improve 18S rRNA gene copy number bias. Metabarcoding Metagenomics 6, e85794. doi: 10.3897/mbmg.6.85794
Martin M. (2011). Citadapt removes adapter sequences from high-throughput sequencing reads. EMBnet J. 17, 10–12. doi: 10.14806/ej.17.1.200
McMurdie P. J., Holmes S. (2013). Phyloseq: An R Package for reproducible interactive analysis and graphics of microbiome census data. PloS One 8, e61217. doi: 10.1371/journal.pone.0061217
Meiners K., Fehling J., Granskog M. A., Spindler M. (2002). Abundance, biomass and composition of biota in Baltic sea ice and underlying water (March 2000). Pol. Biol. 25, 761–770. doi: 10.1007/s00300-002-0403-x
Melnikov I. A., Kolosova E. G., Welch H. E., Zhitina L. S. (2002). Sea ice biological communities and nutrient dynamics in the Canada Basin of the Arctic Ocean. Deep-Sea Res. 49, 1623–1649. doi: 10.1016/S0967-0637(02)00042-0
Michel C., Legendre L., Therriault J.-C., Demers S., Vandevelde T. (1993). Springtime coupling between ice algal and phytoplankton assemblages in southeastern Hudson Bay, Canadian Arctic. Pol. Biol. 13, 441–449. doi: 10.1007/BF00233135
Michel C., Nielsen T. G., Nozais C., Gosselin M. (2002). Significance of sedimentation and grazing by ice micro- and meiofauna for carbon cycling in annual sea ice (northern Baffin Bay). Aqua. Micro. Ecol. 30, 57–68. doi: 10.3354/ame030057
Mikkelsen D., Rysgaard S., Glud R. N. (2008). Microalgal composition and primary production in Arctic sea ice: a seasonal study from Kobbefjord (Kangerluarsunnguaq), West Greenland. Mar. Ecol. Prog. Ser. 368, 65–74. doi: 10.3354/meps07627
Miklasz K. A., Denny M. W. (2010). Diatom sinking speeds: Improved predictions and insight from a modified Stoke’s law. Limnol. Oceano. 55, 2513–2525. doi: 10.4319/lo.2010.55.6.2513
Mock T., Gradinger R. A. (2000). Changes in photosynthetic carbon allocation in algal assemblages of Arctic sea ice with decreasing nutrient concentrations and irradiance. Mar. Ecol. Prog. Ser. 202, 1–11. doi: 10.3354/meps202001
Montresor M., Lovejoy C., Orsini L. (2003). Bipolar distribution of the cyst-forming dinoflagellate Polarella glacialis. Pol. Biol. 26, 186–194. doi: 10.1007/s00300-002-0473-9
Montresor M., Procaccini G., Stoecker D. K. (1999). Polarella glacialis, gen. nov., sp. nov.(Dinophyceae): Suessiaceae are still alive! J. Phycol. 35, 186–197. doi: 10.1046/j.1529-8817.1999.3510186.x
Morgan M., Anders S., Lawrence M., Aboyoun P., Pages H., Gentleman R. (2009). ShortRead: a bioconductor package for input, quality assessment and exploration of high-throughput sequence data. Bioinfo. 25, 2607–2608. doi: 10.1093/bioinformatics/btp450
Neeley A. R., Harrism L. A., Frey K. E. (2018). Unraveling phytoplankton community dynamics in the northern Chukchi Sea under sea-ice-covered and sea-ice-free conditions. Geophys. Res. Let. 45, 7663–7671. doi: 10.1029/2018GL077684
Oksanen J., Blanchet F. G., Friendly M., Kindt R., Legendre P., McGlinn D., et al. (2019). Package “vegan”. Available online at: https://cran.r-hub.io/web/packages/vegan/vegan.pdf.
Olsen L. M., Laney S. M., Duarte P., Kauko H. M., Fernández-Méndez M., Mundy C. J., et al. (2017). The seeding of ice algal blooms in Arctic pack ice: The multiyear ice seed repository hypothesis. J. Geophys. Res. 122, 1529–1548. doi: 10.1002/jgrg.v122.7
Parkinson C. L. (2014). Spatially mapped reductions in the length of the Arctic sea ice season. Geophys. Res. Let. 41, 4316–4322. doi: 10.1002/2014GL060434
Peltomaa E., Hällfors H., Taipale S. J. (2019). Comparison of Diatoms and Dinoflagellates from different habitats as sources of PUFAs. Mar. Drug 17, 233. doi: 10.3390/md17040233
Polyakov I. V., Ingvaldsen R. B., Pnyushkov A. V., Bhatt U. S., Francis J. A., Janout M., et al. (2023). Fluctuating Atlantic inflows modulate Arctic atlantification. Science 382, 972–979. doi: 10.1126/science.adh5158
Ralph P., Gademann R. (2005). Rapid light curves: A powerful tool to assess photosynthetic activity. Aqua. Bot. 82, 3. doi: 10.1016/j.aquabot.2005.02.006
Rantanen M., Karpechko A. Y., Lipponen A., Nordling K., Ruosteenoja K., et al. (2022). The Arctic has warmed nearly four times faster than the globe since 1979. Commun. Earth Environ. 3, 168. doi: 10.1038/s43247-022-00498-3
Schreiber U. (2004). “Pulse-amplitude-modulation (PAM) fluorometry and saturation pulse method: an overview,” in Chlorophyll a fluorescence, vol. 19 . Eds. Papageorgiou G. C., Govindjee (Springer, Dordrecht). doi: 10.1007/978–1-4020–3218-9_11
Schreiber U., Schliwa U., Bilger W. (1986). Continuous recording of photochemical and non-photochemical chlorophyll fluorescence quenching with a new type of modulation fluorometer. Photosyn. Res. 10, 51–62. doi: 10.1007/BF00024185
Søgaard D. H., Kristensen M., Rysgaard S., Glud R. N., Hansen P. J., Hilligsøe K. M. (2010). Autotrophic and heterotrophic activity in Arctic first-year sea ice: Seasonal study from Malene bight, SW Greenland. Mar. Ecol. Prog. Ser. 419, 31–45. doi: 10.3354/meps08845
Søgaard D. H., Sorrell B. K., Sejr M. K., Andersen P., Rysgaard S., Hansen P. J., et al. (2021). An under-ice bloom of mixotrophic haptophytes in low nutrient and freshwater-influenced Arctic waters. Sci. Rep. 11, 2915. doi: 10.1038/s41598–021-82413-y
Søreide J. E., Leu E., Berge J., Graeve M., Falk-Petersen S. (2010). Timing of blooms, algal food quality and Calanus glacialis reproduction and growth in a changing Arctic. Glob. Chan. Biol. 6, 3154–3163. doi: 10.1111/j.1365-2486.2010.02175.x
Sorrell B. K., Hawes I., Stratmann T., Lund-Hansen L. C. (2021). Photobiological effects on ice algae of a rapid whole-fjord loss of snow cover during spring growth in Kangerlussuaq, a West Greenland Fjord. J. Mar. Sci. Eng. 9, 814–824. doi: 10.3390/jmse9080814
Spatz M., Richard M. L. (2020). Overview of the potential role of Malassezia in gut health and disease. Front. Cell. Infect. Microbiol. 10. doi: 10.3389/fcimb.2020.00201
Spiling K., Olli K., Lehtoranta J., Kremp A., Tedesco L., Tamelander T., et al. (2018). Shifting Diatom - Dinoflagellate dominance during spring bloom in the Baltic Sea and its potential effects on biogeochemical cycling. Front. Mar. Sci. 5. doi: 10.3389/fmars.2018.00327
Steemann-Nielsen E. S. (1952). The use of radio-active carbon (C14) for measuring organic production in the sea. ICES J. Mar. Sci. 18, 117–140. doi: 10.1093/icesjms/18.2.117
Steiner N. S., Bowman J., Campbell K., Chieirici M., Eronen-Rasimus E., Falardeau M., et al. (2021). Climate change impacts on sea-ice ecosystems and associated ecosystem services. Elem. Sci. Anthropo. 9, 7. doi: 10.1525/elementa.2021.00007
Stoeck T., Bass D., Nebel. M., Christen R., Jones M. D. M., Breiner H.-W., et al. (2010). Multiple marker parallel tag environmental DNA sequencing reveals a highly complex eukaryotic community in marine anoxic water. Mol. Ecol. 19, 21–31. doi: 10.1111/j.1365-294X.2009.04480.x
Stoecker D. K., Gustafson D. E., Baier C. T., Black M. M. D. (2000). Primary production in the upper sea ice. Aqua. Micro. Ecol. 21, 275–287. doi: 10.3354/ame021275
Sumata H., de Steur L., Divine D. V., Granskog M., Gerland S. (2023). Regime shift in Arctic Ocean sea ice thickness. Nature 615, 443–449. doi: 10.1038/s41586-022-05686-x
Terrado R., Lovejoy C., Massana R., Vincent W. F. (2008). Microbial food web responses to light and nutrients beneath the coastal Arctic Ocean sea ice during the winter–spring transition. J. Mar. Sys. 74, 964–977. doi: 10.1016/j.jmarsys.2007.11.001
Thomson P. G., Wright S. W., Bolch C. J. S., Nichols P. D., Skerrat J. H., McMinn A. (2004). Antarctic distribution, pigment and lipid composition, and molecular identification of the brine Dinoflagellate Polarella glacialis (Dinophyceae). J. Phycol. 40, 867–873. doi: 10.1111/j.1529-8817.2004.03169.x
Wratten E. E., Cooley S. W., Mann P. J., Whalen D., Fraser P., Lim M. (2022). Physiographic controls on landfast ice variability from 20 years of maximum extents across the Northwest Canadian Arctic. Remote Sens. 14, 9. doi: 10.3390/rs14092175
Keywords: dinoflagellate, sea ice spring bloom, Phyto-PAM photobiology, chlorophyll a, nutrients, microbial community composition
Citation: Lund-Hansen LC, Kobberup E, Jensen LZ, Sorrell B and Søgaard DH (2024) An Arctic sea ice spring bloom driven and dominated by Dinoflagellates - a harbinger of the future sea ice? Front. Mar. Sci. 11:1377819. doi: 10.3389/fmars.2024.1377819
Received: 28 January 2024; Accepted: 24 May 2024;
Published: 10 June 2024.
Edited by:
Alberto Basset, University of Salento, ItalyReviewed by:
Lasse Mork Olsen, University of Bergen, NorwayKasia Piwosz, National Marine Fisheries Research Institute, Poland
Copyright © 2024 Lund-Hansen, Kobberup, Jensen, Sorrell and Søgaard. This is an open-access article distributed under the terms of the Creative Commons Attribution License (CC BY). The use, distribution or reproduction in other forums is permitted, provided the original author(s) and the copyright owner(s) are credited and that the original publication in this journal is cited, in accordance with accepted academic practice. No use, distribution or reproduction is permitted which does not comply with these terms.
*Correspondence: Lars Chresten Lund-Hansen, bHVuZC1oYW5zZW5AYmlvLmF1LmRr