 Ping Sun
 Kai-Ming Sun
 Yuping Zhou
 Lu Liu
 Chao Yuan5
 Yan Li
 Xuelei Zhang
 Zongling Wang
- 1First Institute of Oceanography, Ministry of Natural Resources, Qingdao, China
- 2College of Environmental Science and Engineering, Ocean University of China, Qingdao, China
- 3Institute of Oceanographic Instrumentation, Qilu University of Technology (Shandong Academy of Sciences), Qingdao, China
- 4Key Laboratory of Sustainable Development of Polar Fisheries, Ministry of Agriculture and Rural Affairs, Yellow Sea Fisheries Research Institute, Chinese Academy of Fishery Science, Qingdao, China
- 5North China Sea Marine Forecasting and Hazard Mitigation Center, Ministry of Natural Resources, Qingdao, China
To clarify the changes in phytoplankton community and influencing factors in short-term nutrient-addition experiments in the Equatorial Eastern Indian Ocean, we conducted three experiments (one in situ-like experiment, one on-deck experiment with deep seawater, and one on-deck experiment with surface seawater). Our findings indicate that when nutrients were added, there was a more significant increase in the chlorophyll a (chl a) concentrations of microphytoplankton (>20 μm) compared to those of nanophytoplankton (2-20 μm) and picophytoplankton (<2 μm). The chl a concentrations for phytoplankton <20 μm only exhibited significant increases in the on-board incubation of surface seawater collected at 1300 hr when grazing stress have likely been weak. In picophytoplankton, occasional increases in the abundances of Synechococcus were found, while the abundances of Prochlorococcus and eukaryotic picophytoplankton (Peuk) did not increase significantly. It results likely from the preference of grazing effect by herbivores and bottle effects. Additionally, the Prochlorococcus from 75 m was more adapted to weak light, thus its abundance sharply decreased when incubated under high light. We suggest that the nutrient effects have greater influence on microphytoplankton, but other factors, such as grazing and light, might contribute more to <20 μm phytoplankton. Furthermore, bottle effects should be considered when conducting incubation experiments.
1 Introduction
The Equatorial Eastern Indian Ocean is characterized by extremely low levels of macronutrients (nitrate and phosphate) and micronutrients (iron) (Garcia et al., 2018; Zhou et al., 2018; Baer et al., 2019; Twining et al., 2019; Yuan et al., 2021). Previous studies have revealed the responses of phytoplankton in this region to nutrient disruption. For example, Twining et al. (2019) conducted 72-hour incubation experiments on deck and found that phytoplankton in the Equatorial Eastern Indian Ocean are mainly limited by nitrogen (N) and are likely structured by iron (Fe) and phosphate (P). Zhou et al. (2018) conducted a 12-day incubation on deck with a sampling frequency of 4 days and indicated that the N supply stimulated the community shift from picophytoplankton to microphytoplankton. These experiments have significantly contributed to our understanding of how phytoplankton respond to nutrient inputs in long-term incubations.
In fact, the initial response of phytoplankton to nutrient disturbance is considered important because it controls the subsequent shift of the phytoplankton community in long-term experiments. Short-term incubations can reveal these initial responses. The advantages of short-term experiments at least include: 1) high spatial resolution in cruise due to their shorter incubation period (Ryan-Keogh et al., 2013); 2) immediate reflection of physiological responses rather than growth (Behrenfeld et al., 2006). Based on these benefits, short-term incubation (typically lasting 21-36 h, according to Behrenfeld et al., 2006) has been extensively investigated in oceanic studies. However, previous research has shown limited responses in total chlorophyll a (chl a) concentration following nutrient addition, observed in various regions such as the trophic Pacific Oceans, the high-latitude north Atlantic Ocean, and the south Atlantic Oceans, etc. (e.g., Behrenfeld et al., 2006; Ryan-Keogh et al., 2013; Browning et al., 2014, Browning et al., 2017). These studies suggest that maximum quantum yield (Fv/Fm) serves as a robust indicator in short-term experiments, and is more sensitive to nutrient disturbance than the total chl a concentration.
The natural phytoplankton community consists of a diverse range of species. It can be hypothesized that some species within the phytoplankton community might have changed in short-term incubation; however, these changes would be masked when using total chl a concentration as an indicator. In contrast to the total chl a concentration, the abundance of picophytoplankton drastically changed in short-term experiments, especially in oligotrophic oceans. For instance, Worden and Binder (2003) found that the addition of ammonium and phosphate potentially suppressed the growth and increased the mortality rates of Prochlorococcus and Synechococcus in the Sargasso Sea. In contrast, Mouriño-Carballido et al. (2016) found that abundances of Synechococcus and eukaryotic picophytoplankton (Peuk) were enhanced with the elevation of nitrate and other nutrient concentrations in the northwestern Mediterranean Sea. Böttjer-Wilson et al. (2021) indicated that the insufficient phosphate levels led to a greater decrease in Prochlorococcus abundance in oligotrophic oceans near Hawai’i. These findings demonstrate that the short-term community dynamics of picophytoplankton are divergent in different regions and under different nutrient additions, which likely affects the long-term responses.
In the region we investigated, the initial responses of phytoplankton to nutrient disturbance remain poorly understood. To clarify the short-term responses of phytoplankton in the Equatorial Eastern Indian Ocean, we conducted three short-term (less than 40 h) nutrient-addition experiments (nitrate and phosphate, iron) focusing on changes in Fv/Fm, total chl a concentration, size-dependent chl a concentration of phytoplankton and picophytoplankton abundance. The first experiment was carried out at four depths (from the sea surface to 100 m) to investigate the short-term and in situ-like responses of phytoplankton to nutrient inputs. The second experiment utilized water samples from 75 m depth and conducted as an on-deck incubation under low and high light conditions to examine whether light influenced the responses of deep-sea phytoplankton to nutrient disturbance. The third experiment used surface water samples without light shielding on deck under identical nutrient conditions as the previous two experiments. Based on our aforementioned literature review, we hypothesized that during the incubation period there would be changes in Fv/Fm, size-dependent chl a concentration, and picophytoplankton abundance; however, no significant changes was expected for total chl a concentration.
2 Materials and methods
2.1 Nutrient-addition experiments
Nutrient-addition bioassay experiments were conducted in the Equatorial Eastern Indian Ocean at three stations in August 2016 (Figure 1). Three biological experiments were employed for each experiment. The transparent polyethylene terephthalate (PET) bottles used in three experiments were immersed in ca. 3% HCl for 48 h and then washed with ddH2O. At station A, seawater samples were collected at 2200 hr (local time, the same below) from four depths (0, 30, 75, 100 m) and cultured in 1.5 L PET bottles at corresponding depths (0, 30, 75, 100 m) for 24 hours during the period of continuous observation of the station. This experiment was considered an in situ-like experiment. Seawater samples were spiked with 15 μM nitrate and 0.5 μM phosphorus (NP treatment) or 200 nM ferrous sulfate (Fe(II)) (Fe treatment). Samples without nutrient addition were considered controls. In culture bottles, air above seawater was squeezed out to avoid the squashing of culture bottles when incubated in deep sea. The bottles were fixed on a polyethylene rope with plastic cable ties at each culture depth. Lead sinkers were tied on the polyethylene rope to keep it vertical. Every 5-7 hours, the rope was pulled out of sea. Seawater in bottles was poured out into a plastic beaker and stirred with a glass rod to avoid the lack of air in a closed system. The beaker was washed with both 75% EtOH and ddH2O before each use. All operations were conducted within a clean bench. The location of bottles at each culture depth on the polyethylene rope was also adjusted every 5-7 hours according to the inclination angle of the rope relative to sea level. The incubation experiments at Station A lasted for 24 h.
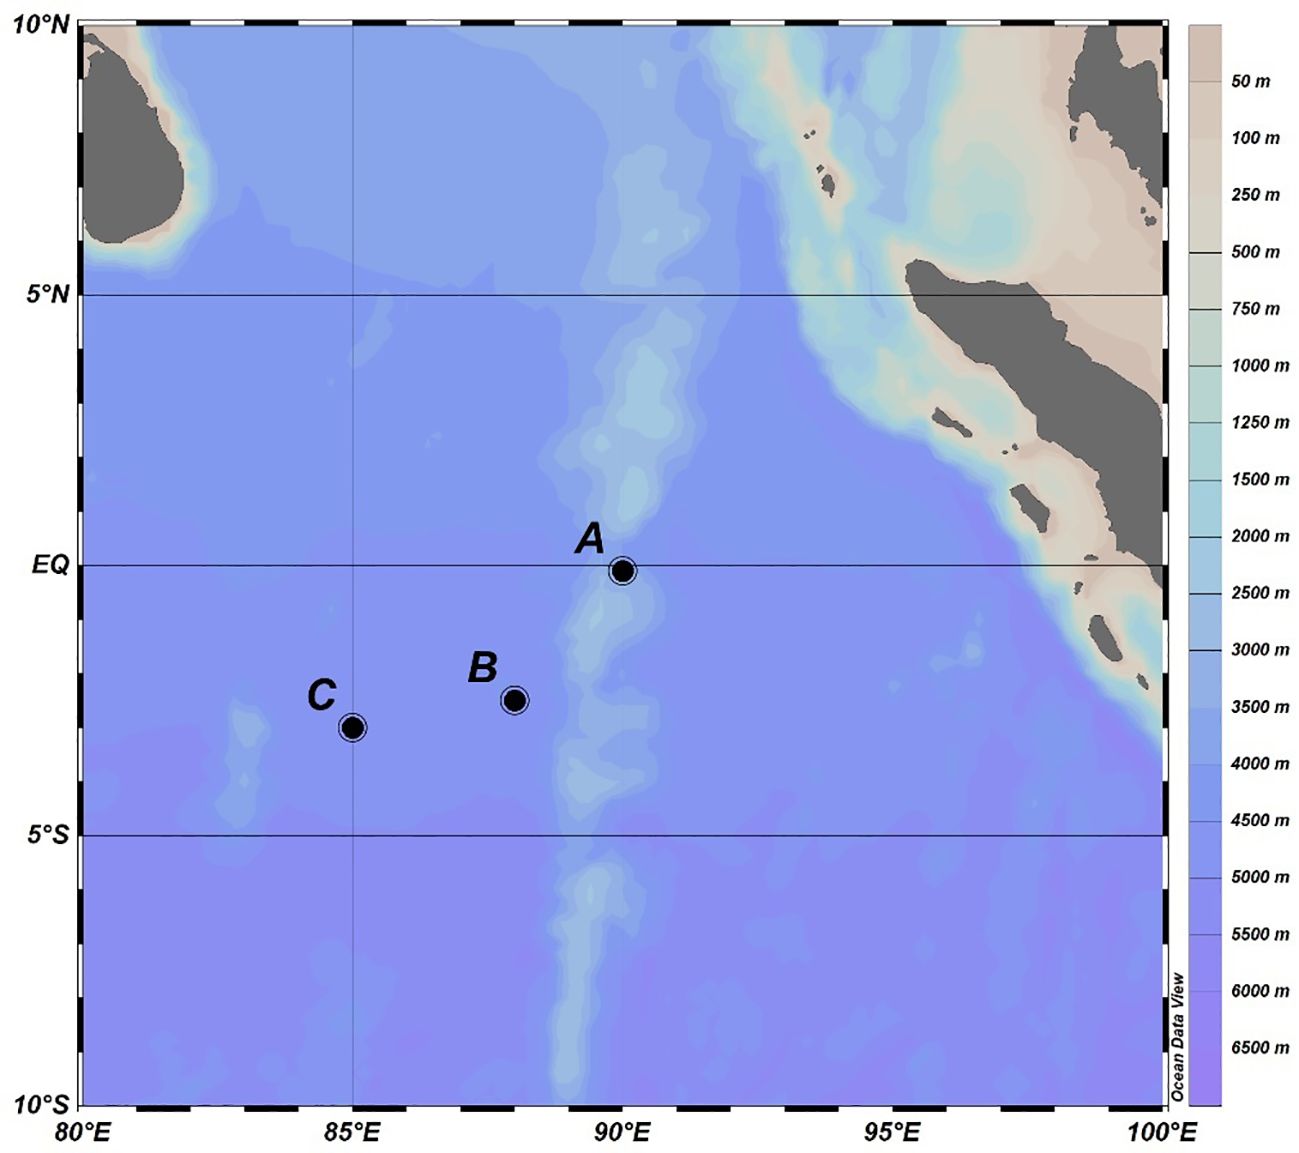
Figure 1 Stations in the Equatorial Eastern Indian Ocean.
For stations B and C, culture bottles were totally immersed 0.5 m underwater in a circulating-water container via a fixed-plastic frame and cultured on deck for 30-40 hours. We had to participate in some common tasks during the investigation and thus could not sample on time after 24 h incubation. At station B, water from a depth of 75 m was collected in the morning at approximately 1100 hr and divided into two groups. Water samples were cultured in PET bottles in group I [this group was labeled as high light (HL) in the figures], while culture bottles were covered by black bags to keep low light intensity in group II [approximately 7.5% of HL, this group was labeled as low light (LL) in the figures]. The light levels of HL treatment were the natural light intensity in a circulating-water container on deck. In each group, three treatments were established [control (HLC and LLC), NP treatment (HLNP and LLNP), Fe treatment (HLFe and LLFe)], and the concentrations of added nutrients were the same as those at station A. At station C, water from a depth of 0 m was collected in the afternoon at approximately 1300 hr. Other conditions were the same as those for the HL group of station B. Seawater in bottles of stations B and C was also poured out and stirred every 5-7 hours, just like we did at station A (Figure 2).
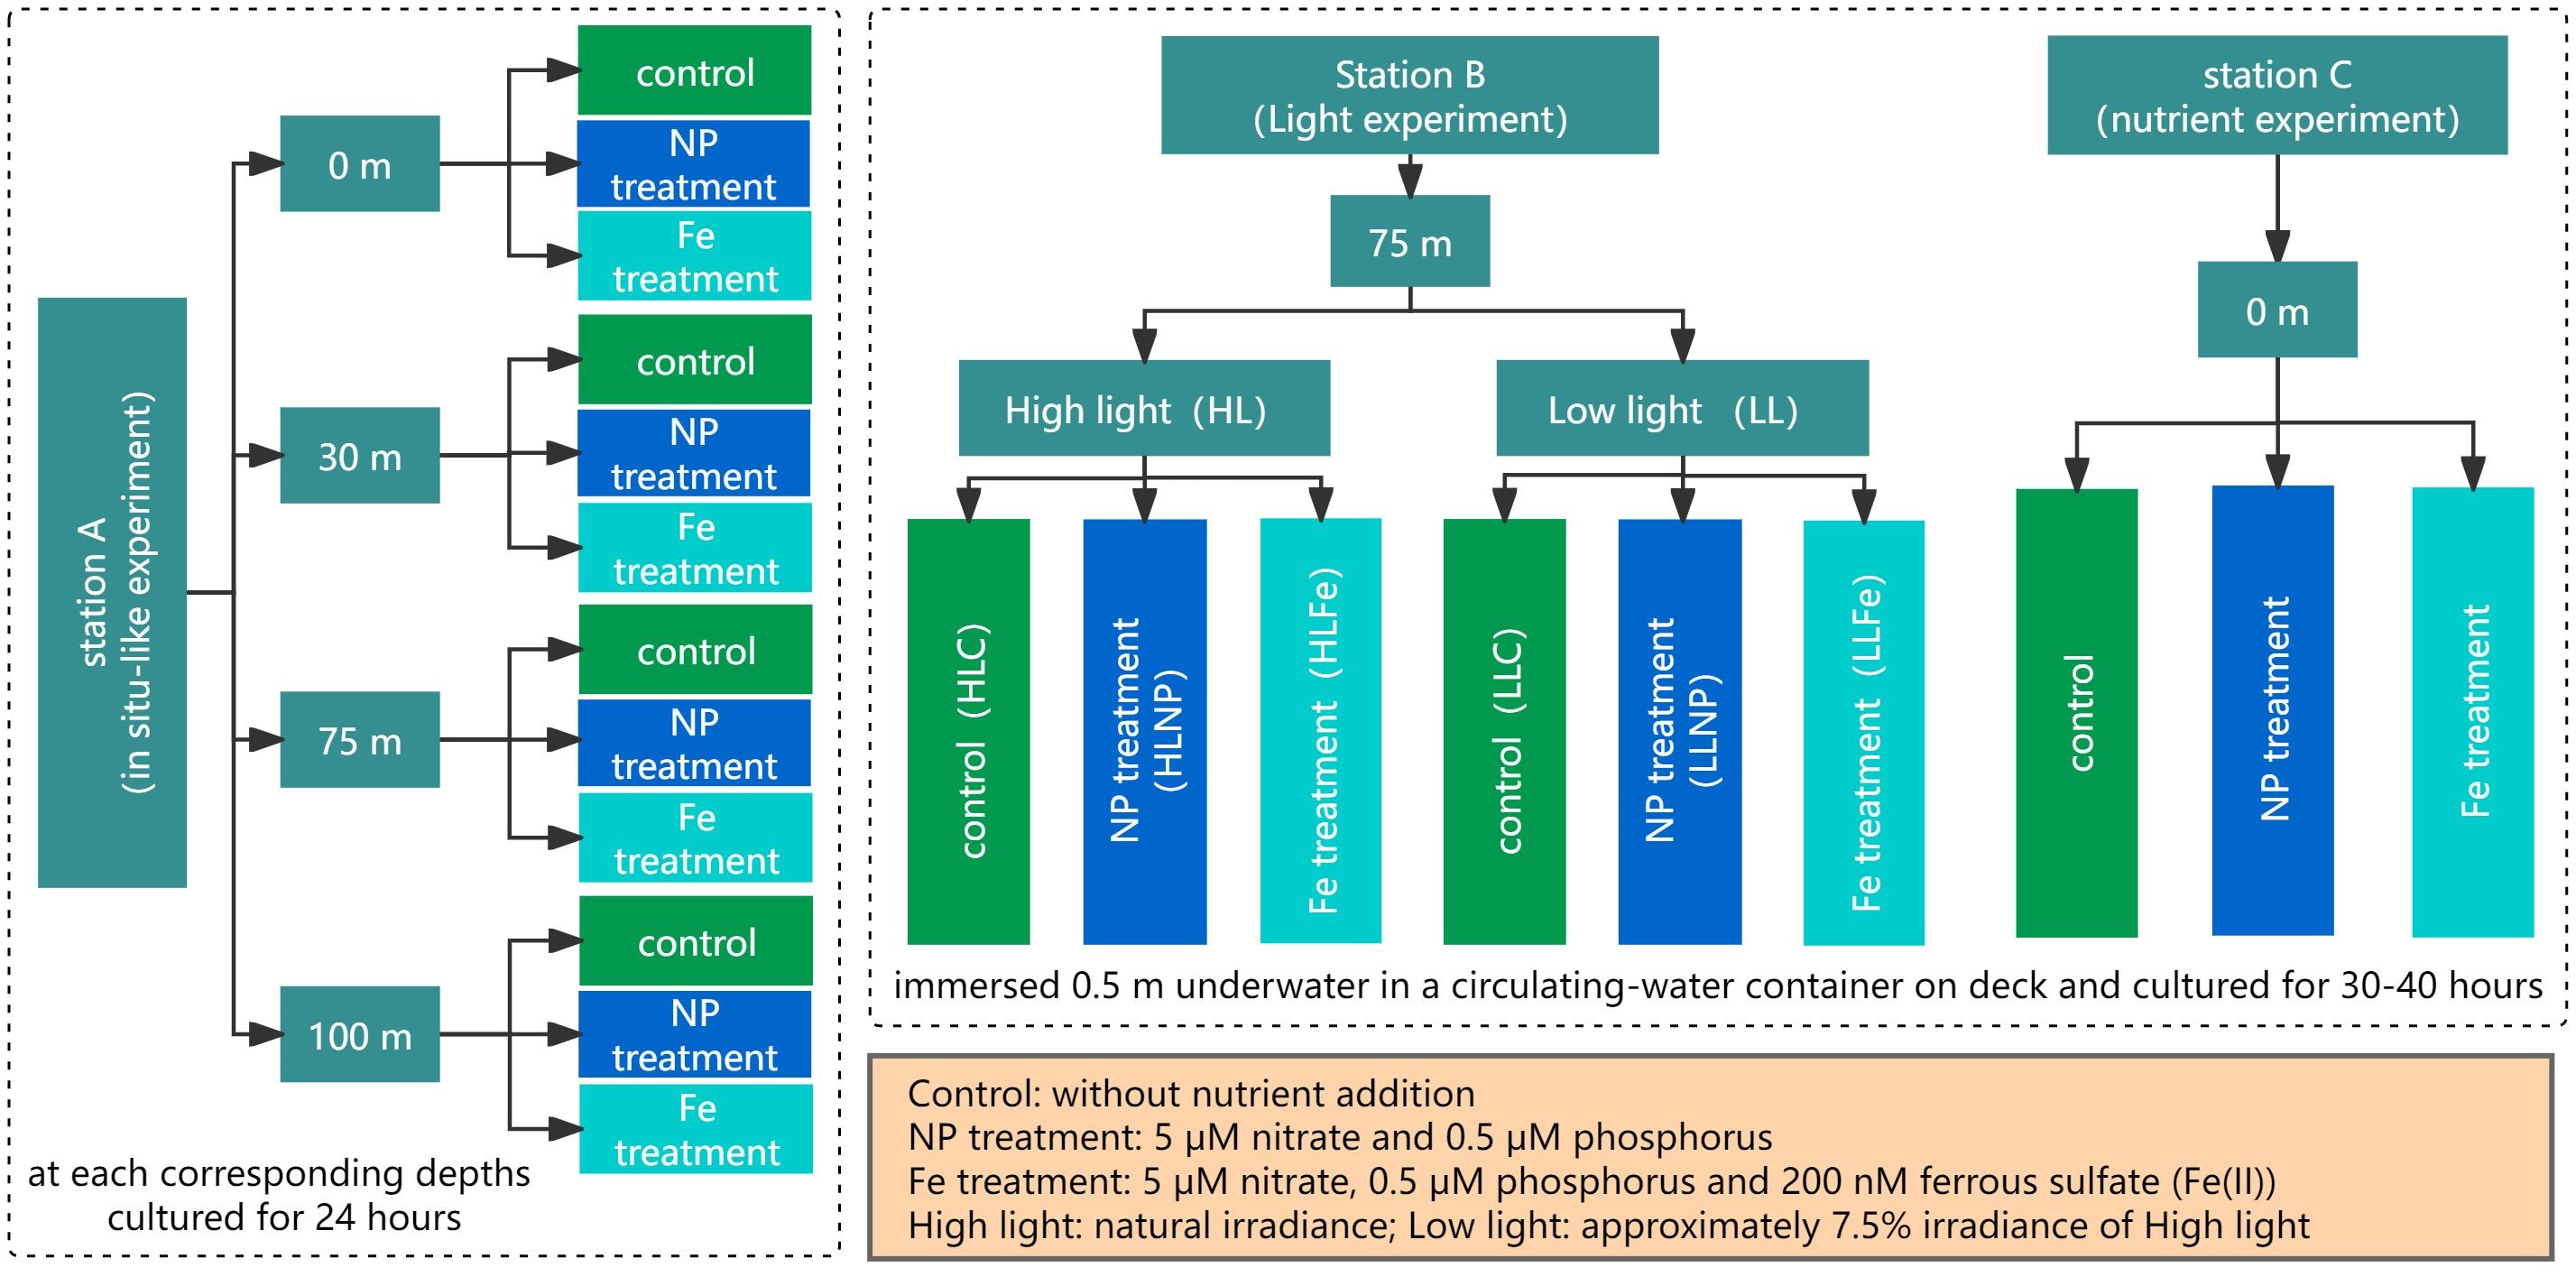
Figure 2 Flow chat of the experiments.
At station A, our primary focus was on investigating the size-dependent responses of phytoplankton to nutrient disturbance in situ. Given the limited number of in-situ incubation experiments conducted, we aimed to provide more realistic understanding of the short-term dynamics of phytoplankton in oligotrophic oceans by exploring their actual responses to nutrient disturbance. At station B, we sought to elucidate how light conditions influenced the impact of nutrients on phytoplankton with different sizes when it was not feasibly conducted in situ experiments at sampling depths. Therefore, we collected water samples from 75 m, and conducted on-deck experiments. At station C, we collected surface water at 1300 hr when herbivores are expected to migrate to deeper depths and grazing effects are minimal. We conducted an experiment aiming to examine whether the grazing had any short-term influence on the response of phytoplankton to nutrient availability.
For the three stations, water samples from 0 m were collected using plastic buckets, while Niskin bottles mounted on a Sea-Bird Electronics SBE 911 plus conductivity temperature depth system (Sea-Bird ELECTRONICS INC., USA) were used to collect water samples from other depths. Water samples filtered by 505 μm bolting silk were used in incubation experiments to eliminate large herbivores. Water temperature, salinity, nutrient concentration, and the dominant species of microphytoplankton (>20 μm) were measured before incubation (Table 1). Fv/Fm, total and size-dependent chl a concentration [microphytoplankton (>20 μm), nanophytoplankton (2-20 μm) and picophytoplankton (<2 μm)] and picophytoplankton abundance were measured both before and after incubation.
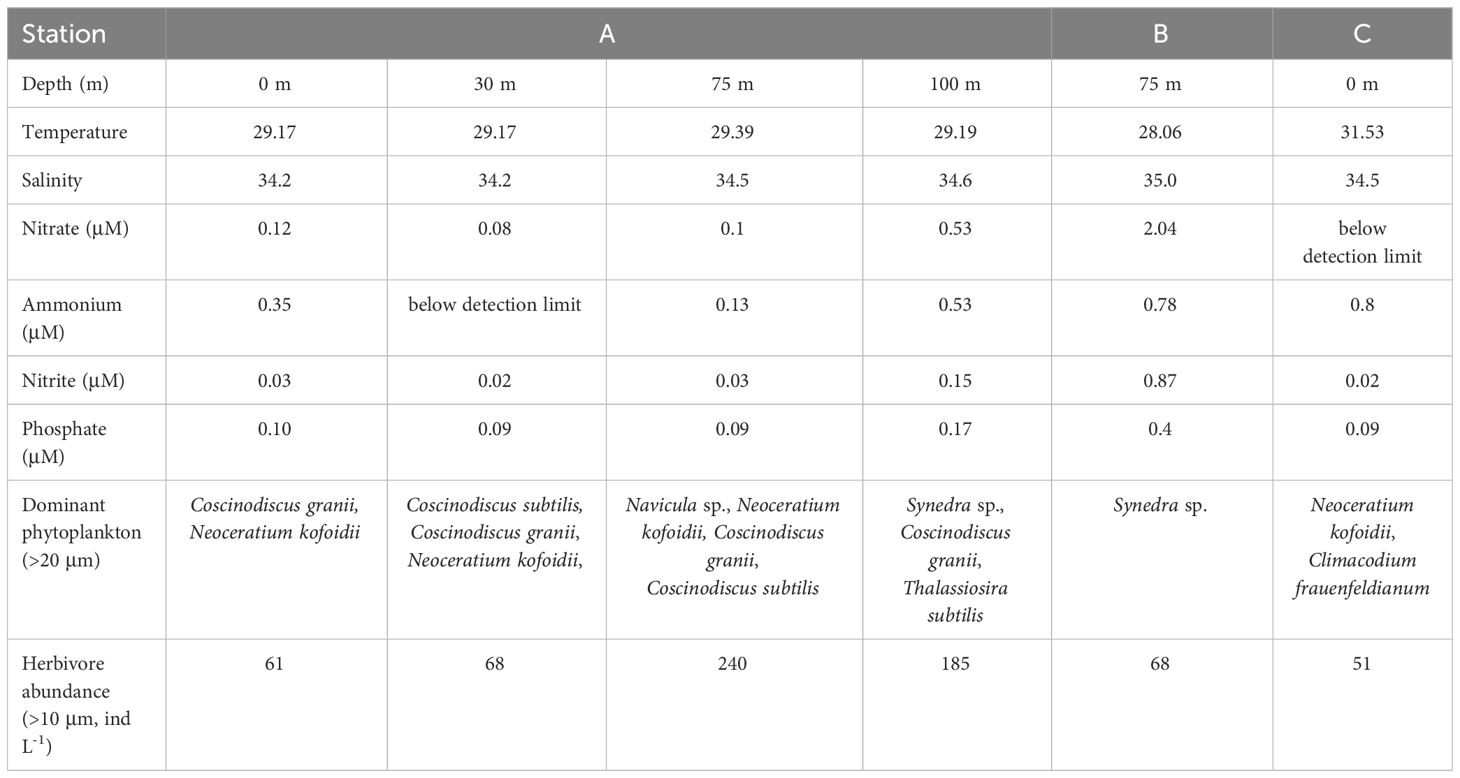
Table 1 Environmental factors and dominant species of >20 μm phytoplankton at the three stations.
2.2 Sample analysis
Water temperature and salinity were measured in situ using a Sea-Bird SBE 911+ CTD system. Fifty milliliters of 0.45-μm cellulose-acetate-membrane-filtered seawater was collected and stored at -20°C. Nutrient concentrations in these water samples were measured using a Bran and Luebbe 5 channel AAIII segmented flow colorimetric autoanalyzer (Bran+Luebbe GmbH, Germany) as described by Zhou et al. (2018). The detection limit for nitrate, nitrite, ammonium, and phosphate were 0.08, 0.02, 0.1, 0.05 μM, respectively. Five to six hundred milliliters of water samples were fixed with Lugol’s iodine solution and kept in darkness at room temperature. Water samples were concentrated to 10-20 mL by removing the supernatant using 10 μm bolting silk. Species of >20 μm phytoplankton were identified under a Nikon TE-2000U inverted microscope [Nikon Instruments (Shanghai) Co., Ltd, China] using a 0.5 mL plankton chamber. For the measurement of Fv/Fm, water samples from 0 m and 30 m were concentrated using 0.22-μm polycarbonate membranes under low pressure (<200 mmHg) to obtain steady and detectable fluorescence signals. Fv/Fm was measured by a Phyto-PAM fluorometer (Heinz Walz GmbH, Germany) after 20 min of dark adaptation, and background fluorescence was eliminated using in situ seawater filtered through a 0.22-μm cellulose acetate membrane. Water samples of 1-1.3 L were sequentially collected on membranes (20-μm bolting silk, 2-μm polycarbonate membrane and 0.7-μm GF/F membrane) and stored in liquid nitrogen for measuring size-dependent chl a concentration. Size-dependent chl a concentrations [microphytoplankton (>20 μm), nanophytoplankton (2-20 μm), picophytoplankton (<2 μm)] were measured by a TD 700 fluorometer (Turner Designs Hydrocarbon Instruments, Inc., USA) after extraction in 90% acetone overnight at -20°C and were calculated using the difference in chl a concentration before and after acidification. The total chl a concentration was calculated as the sum of the size-dependent chl a concentrations. Four milliliters of seawater was fixed with 1% paraformaldehyde buffer (final concentration) and stored in liquid nitrogen to measure picophytoplankton abundance. Picophytoplankton abundance (Prochlorococcus, Synechococcus and Peuk) was measured using a BD FACSCalibur flow cytometer with an argon laser of 488 nm (Becton, Dickinson and Company, USA), according to the picophytoplankton size scattering, orange fluorescence of phycoerythrin from Synechococcus and red chl a fluorescence from all picophytoplankton (Yuan et al., 2021). The abundance of Synechococcus was enumerated using the side scatter signal and orange fluorescence. The abundances of Prochlorococcus and Peuk were enumerated using orange and red fluorescence. Yellow-green fluorescence beads (1 μm and 2 μm in diameter) were added as an internal reference for each measurement. Three technical replicates were employed for picophytoplankton abundance, whereas only one measurement was employed for other analysis.
2.3 Statistical analysis
The station map was created using Ocean Data View v5.2.1 (Schlitzer, Reiner, Ocean Data View, https://odv.awi.de, 2020), and other figures were generated using Sigmaplot 12.5 (Systat Software Inc. USA). One-way ANOVA was used to test the significance of nutrient. Once the significance was detected, a Tukey’s HSD test was conducted to determine the significance of differences among treatments when homogeneity of variances was met. For variances that were not equal after data transformation, either the Game-Howell test or Mann-Whitney U test was performed. A significance level of p < 0.05 was considered statistically significant.
3 Results
At station A, the total chl a concentration and Fv/Fm decreased or did not significantly change after 24 h incubation (control, Fe, NP) compared to those before incubation (0 h) (Figures 3A, B). Water samples cultured at 100 m decreased the most in both total chl a concentration and Fv/Fm irrespective of nutrient treatment (control, Fe, NP) (Figures 3A, B). A similar decrease in the total chl a concentration was also found in water samples at 0 m after 24 h incubation (Figure 3A). However, the addition of Fe stimulated the increases in the chl a concentration of microphytoplankton at four depths with the highest increases (ca. 4-6-fold) at 75 m and 100 m (Figure 3C, Tukey’s HSD test for 75 m, Game-Howell test for 100 m, p < 0.05). The NP addition also significantly enhanced the chl a concentration of microphytoplankton at 30 m (Figure 3C, Tukey’s HSD test, p < 0.05). For nanophytoplankton, significant decreases in the chl a concentration occurred in both the control and NP treatments after 24 h incubation at 75 m (Figure 3D, Tukey’s HSD test, p < 0.05). The chl a concentration of picophytoplankton significantly decreased at 0 m and 100 m in all treatments and at 30 m in the NP treatment after incubation (Figure 3E, Tukey’s HSD test, p < 0.05). Similar decreases in Prochlorococcus abundances with chl a concentrations of picophytoplankton were also found (Figure 3F). Synechococcus abundance decreased at 0 m but increased at 30 m after incubation (control, NP, Fe) irrespective of nutrient treatments, and the addition of Fe also significantly increased Synechococcus abundances at 75 m relative to other treatments (Figure 3G, Tukey’s HSD test, p < 0.05). Peuk abundance at four depths showed significant decreases after incubation, with the highest decreases (approximately a five-fold decrease) being found at 100 m (Figure 3H, Tukey’s HSD test, p < 0.05).
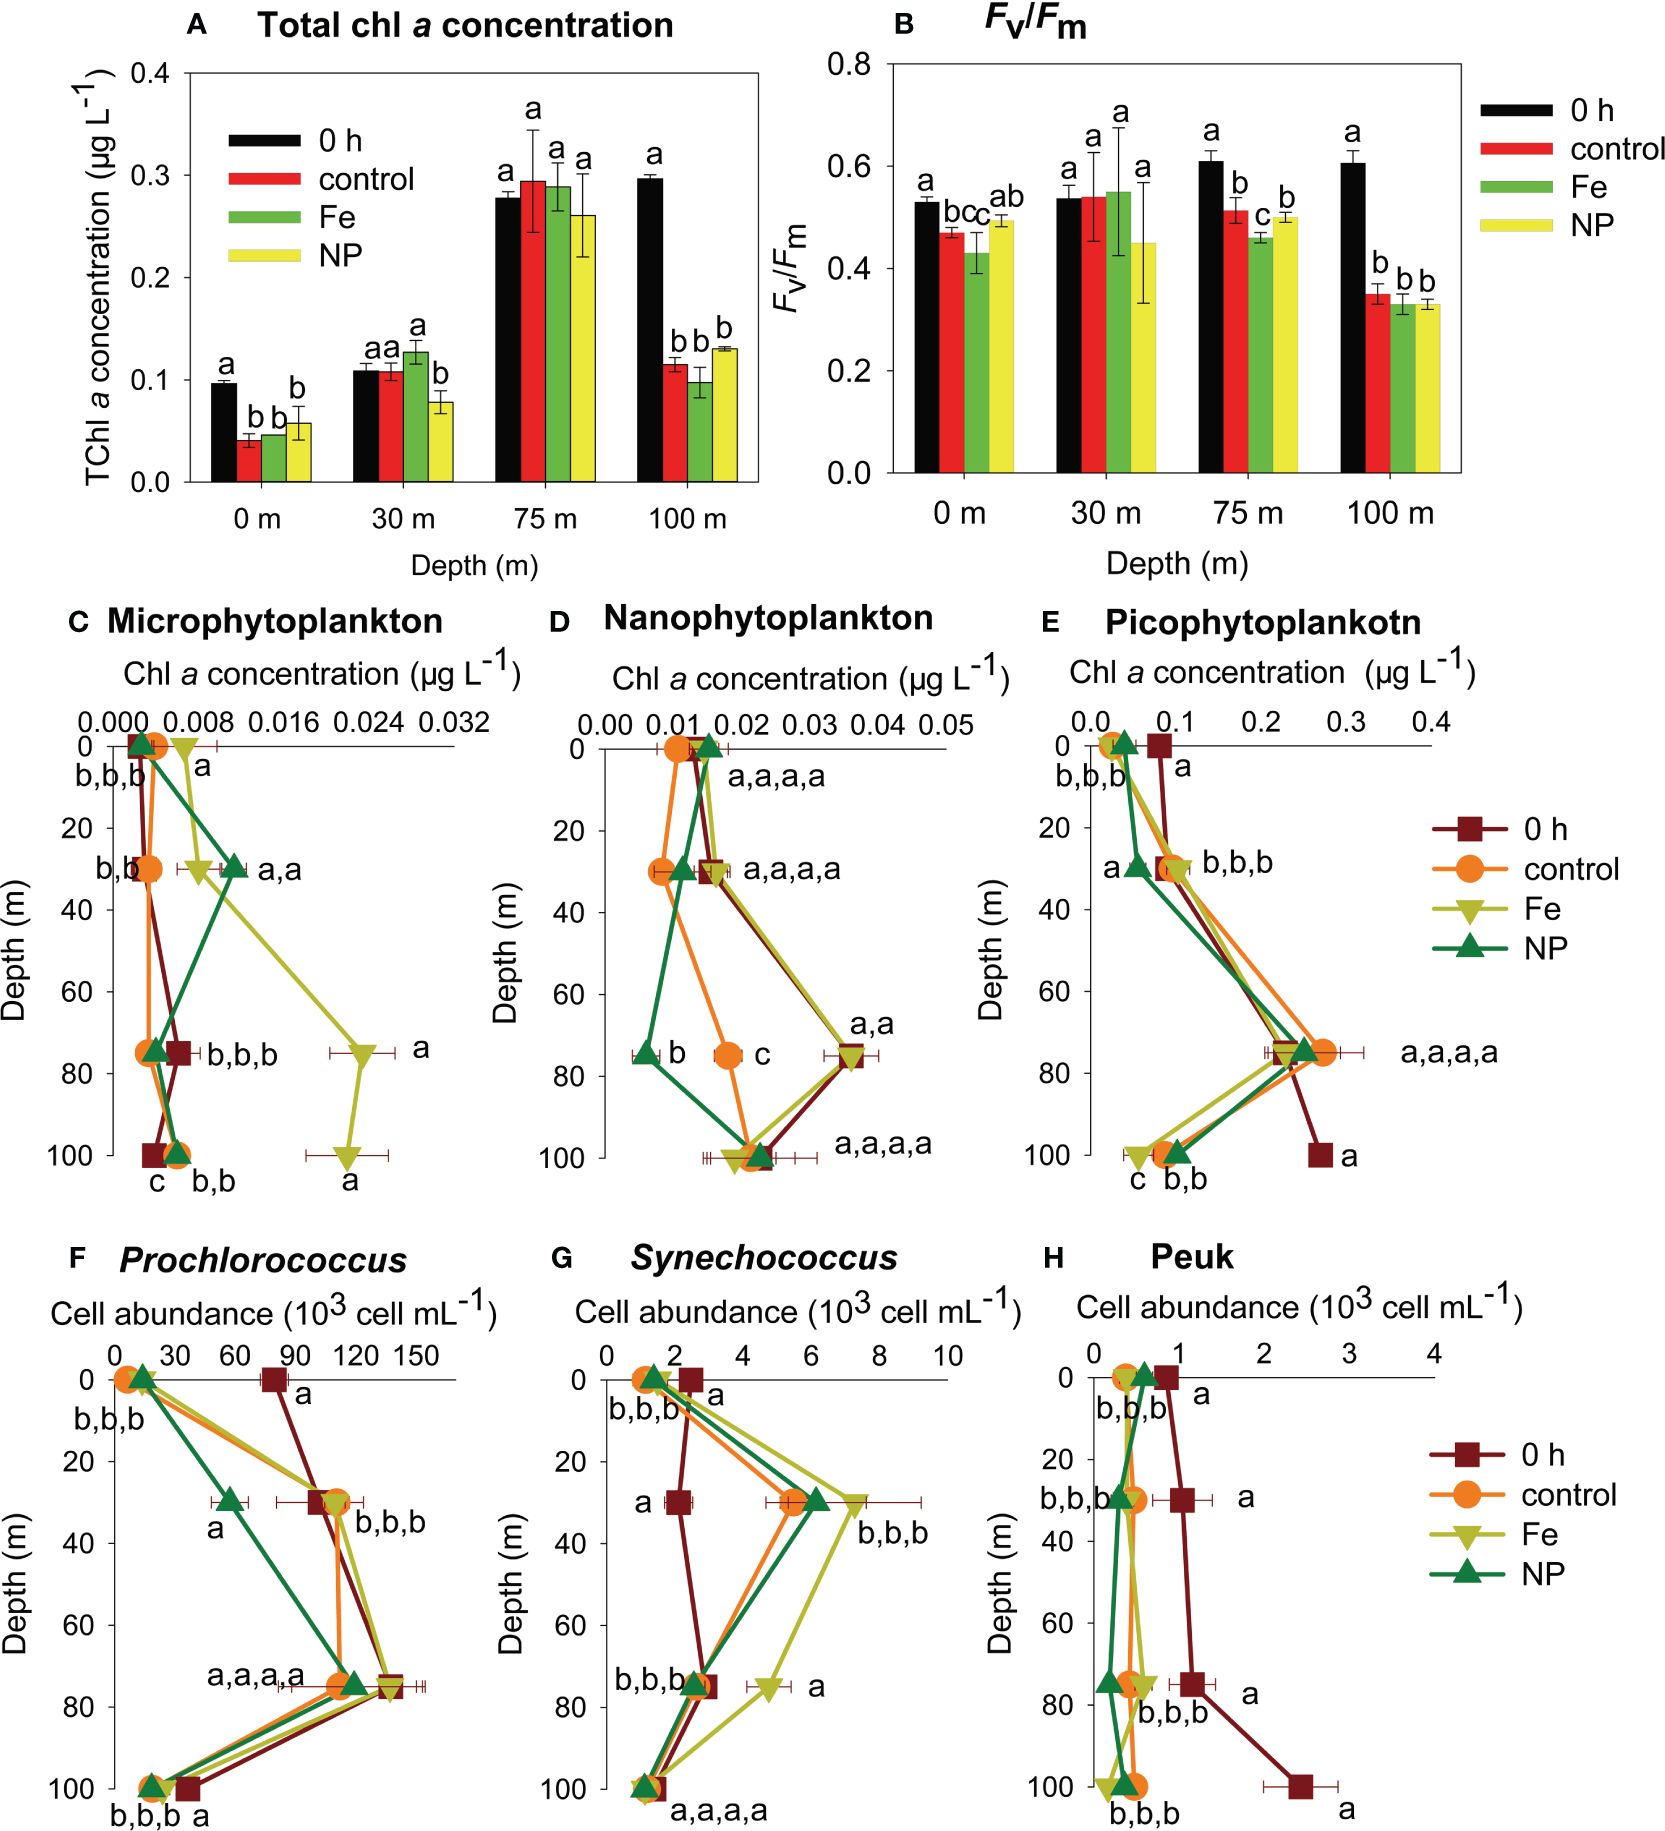
Figure 3 Total chlorophyll a (chl a) concentration (A), maximum quantum yield (Fv/Fm) (B), c. chl a concentration of microphytoplankton (C), chl a concentration of nanophytoplankton (D), chl a concentration of picophytoplankton (E), cell abundance of Prochlorococcus (F), cell abundance of Synechococcus (G), cell abundance of eukaryotic picophytoplankton (Peuk) (H) at station A. 0 h: before incubation; control: after incubation without nutrient addition; Fe: after incubation with Fe addition; NP: after incubation with the addition of nitrate and phosphate. Data are the mean ± sd; n=3; different lowercase letters on bars or around symbols indicate significant differences among nutrient treatments at a particular certain depth.
At station B, the total chl a concentration and Fv/Fm significantly decreased after incubation in both groups (HL and LL) (Figures 4A, B, Tukey’s HSD test for the total chl a concentration, Mann-Whitney U test for Fv/Fm, p < 0.05). The total chl a concentration in the LL group was approximately two times higher than that in the HL group irrespective of nutrient treatments (Figure 4A). Similarly, the chl a concentrations of picophytoplankton and Prochlorococcus abundances in the LL group were higher than those in the HL group irrespective of nutrient treatment (Figures 3C, E, Tukey’s HSD test, p < 0.05). Correspondingly, the relative abundance of picophytoplankton and Prochlorococcus in the LL group was also higher (Figures 4D, F). After incubation, the chl a concentration of microphytoplankton in the LLC and LLNP treatments was significantly higher than that at 0 h (Figure 4C, Tukey’s HSD test, p < 0.05). For nanophytoplankton, the chl a concentration dramatically decreased compared to that at 0 h (Figure 4C, Tukey’s HSD test, p < 0.05), with the exception of the Fe treatment (LLFe) in the LL group. Synechococcus abundances significantly increased in the control (HLC) and Fe treatment (HLFe) after incubation compared to 0 h, but Peuk abundance significantly decreased after incubation irrespective of treatment (Figure 4E, Tukey’s HSD test, p < 0.05).
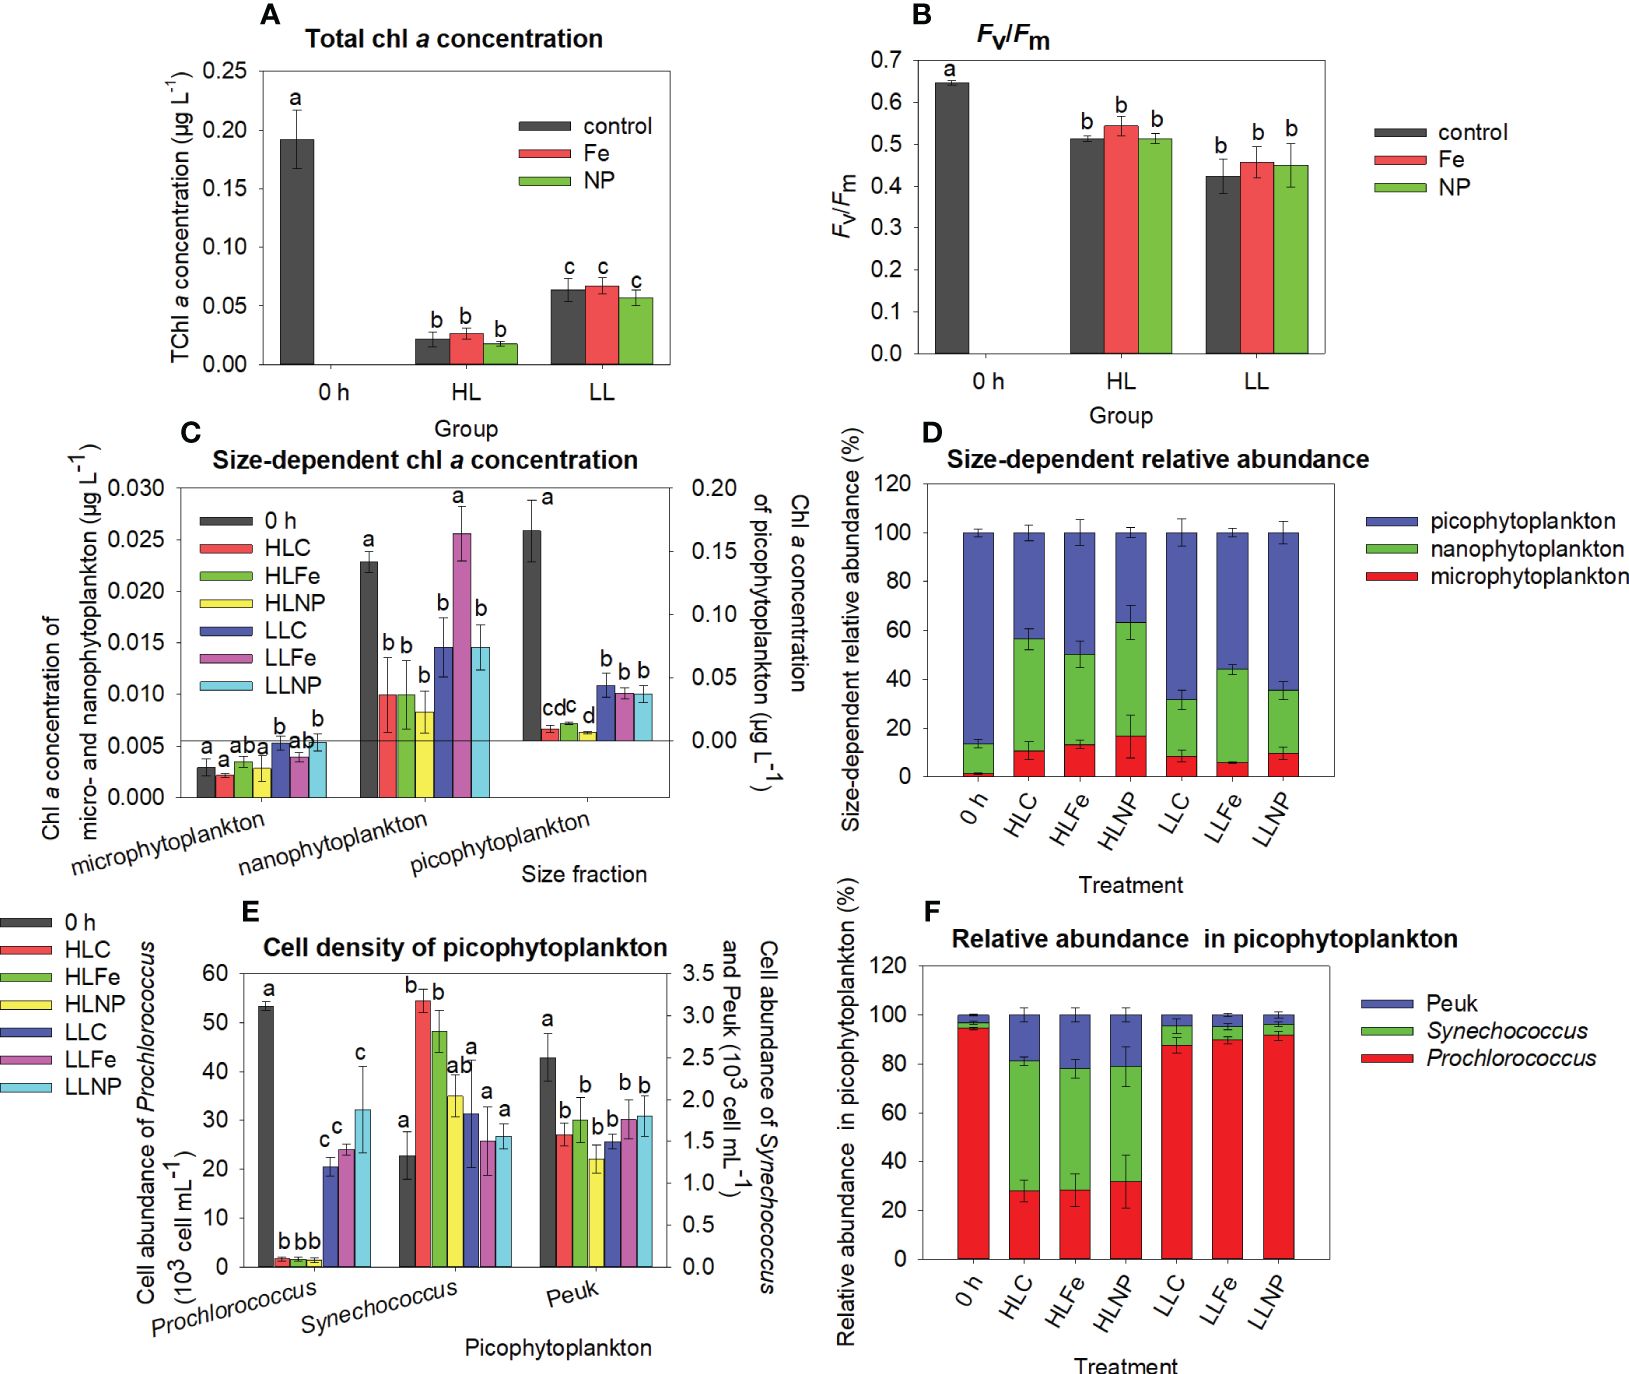
Figure 4 Total chlorophyll a (chl a) concentration (A), maximum quantum yield (Fv/Fm) (B), size-dependent chl a concentration (C), size-dependent relative abundance calculated from the chl a concentration (D), cell abundance of picophytoplankton (E), relative abundance of Prochlorococcus, Synechococcus and eukaryotic picophytoplankton (Peuk) calculated from their cell abundance (F) at station B. 0 h: before incubation; control: after incubation (except the bar of 0 h in A, B) without nutrient addition; Fe: after incubation with Fe addition; NP: after incubation with the addition of nitrate and phosphate. HL, high light; LL, low light; HLC or LLC: after incubation without nutrient addition under high or low light; HLFe or LLFe: after incubation with Fe addition under high or low light; HLNP or LLNP: after incubation with NP addition under high or low light. Data are the mean ± sd, n=3. Different lowercase letters on bars indicate significant differences among nutrient treatments.
At station C, except for the chl a concentration in the Fe treatment, the total chl a concentration and Fv/Fm significantly increased after incubation (Figures 5A, B, Mann-Whitney U test for the total chl a concentration, Tukey’s HSD test for Fv/Fm, p < 0.05). Similarly, the chl a concentration of the three sizes of phytoplankton showed significant increases in all three treatments after incubation (Figure 5C, Mann-Whitney U test for microphytoplankton and picophytoplankton, Tukey’s HSD test for nanophytoplankton, p < 0.05), with the highest increases of approximately 5-8 times being found in microphytoplankton. Picophytoplankton abundance showed an insignificant change after incubation except that Synechococcus abundance significantly increased in the Fe-added treatment (Figure 5E, Tukey’s HSD test, p < 0.05). The relative abundance patterns of size-dependent chl a concentration and picophytoplankton abundance were similar before and after incubation (Figures 5D, F).
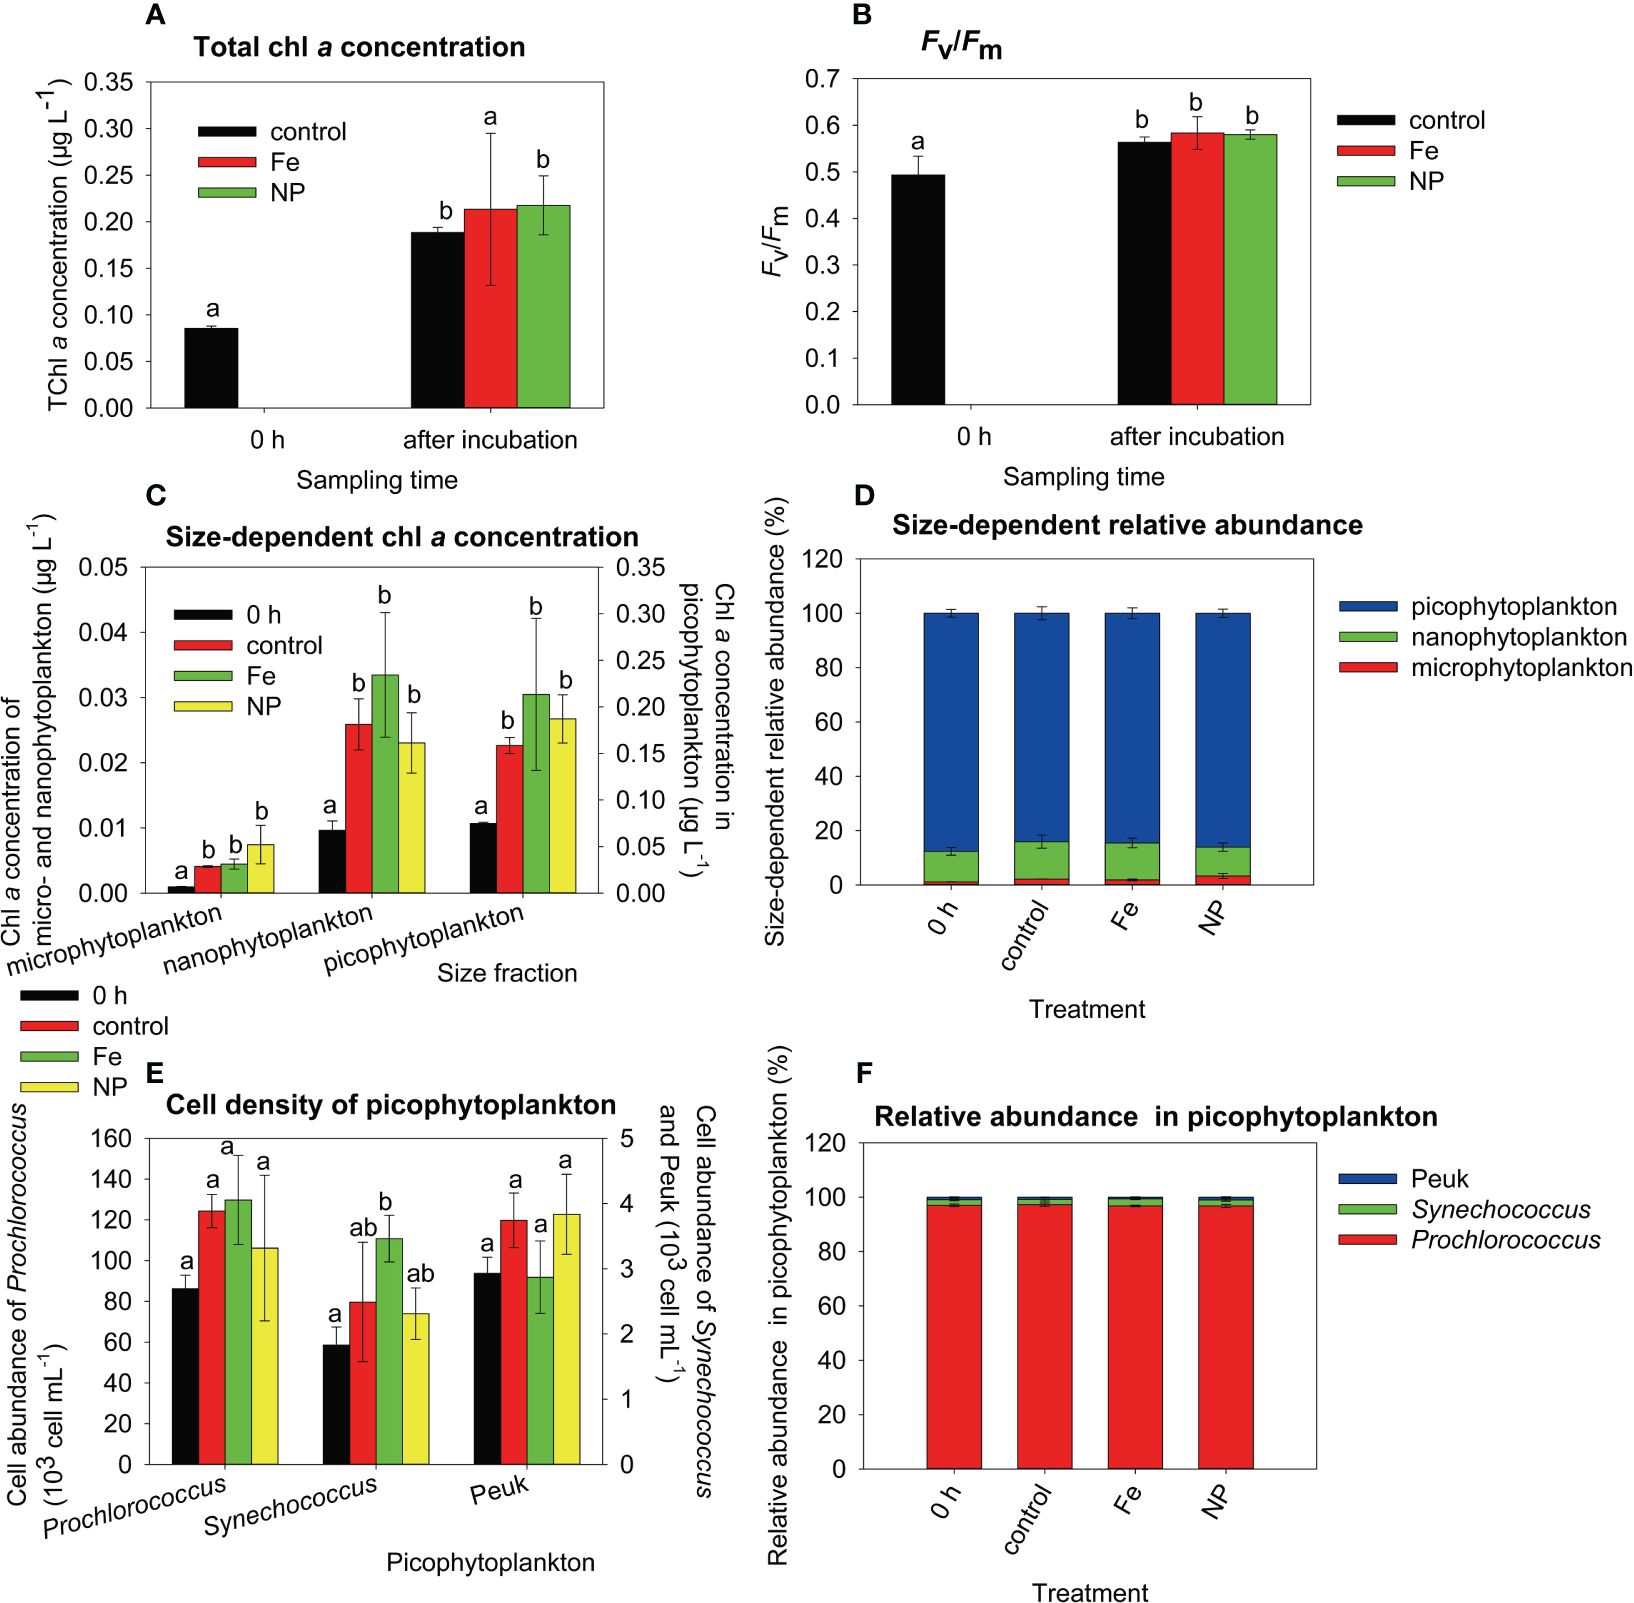
Figure 5 Total chlorophyll a (chl a) concentration (A), maximum quantum yield (Fv/Fm) (B), size-dependent chl a concentration (C), size-dependent relative abundance calculated from the chl a concentration (D), cell abundance of picophytoplankton (E), relative abundance of Prochlorococcus, Synechococcus and eukaryotic picophytoplankton (Peuk) calculated from their cell abundance (F) at station C. 0 h: before incubation; control: after incubation (except the bar of 0 h in A, B) without nutrient addition; Fe: after incubation with Fe addition; NP: after incubation with the addition of nitrate and phosphate. Data are the mean ± sd; n=3; different lowercase letters on bars indicate significant differences among nutrient treatments.
4 Discussion
In the present study, we conducted three experiments to elucidate the short-term responses of phytoplankton community to nutrient addition, and found that 1) in situ-like experiments, Fe was a significant stimulator for the growth of microphytoplankton, while the nutrient addition had limited stimulating effects on nano- and pico-phytoplankton. However, the addition of Fe did stimulate the increases in Synechococcus abundance at 30 and 75 m depths. Notably, a significant inhibition was found at 0 m and 100 m depths for Prochlorococcus, as well as across all four depths for Peuk regardless of nutrient addition. 2) for samples collected at 75 m depth, during the on-deck incubation, light exerted a greater influence on picophytoplankton compared to nutrient addition, particularly for Prochlorococcus. However, neither light nor nutrient addition affected Peuk abundance. Interestingly, identical decreases in Peuk abundance were observed across all treatments; 3) when surface water samples were collected at 1300 hr and cultured on deck, the chl a concentration from all three sizes of phytoplankton showed significant increases after incubation, however, nutrient addition had minimal effects.
4.1 Size-dependent changes in phytoplankton in short-term incubation
Large cells might experience greater iron limitation than small cells, thus responding more strongly to iron addition (Ryan-Keogh et al., 2013). Our results indicated an obvious stimulating effect of iron on microphytoplankton (mainly diatoms, Table 1) at station A under in situ-like incubation. Hoffmann et al. (2006) also indicated that diatoms >20 μm were the main beneficiaries of iron enrichment. Phytoplankton with greater surface area showed a higher uptake rate of Fe (Shaked et al., 2020). The high surface area of microphytoplankton may result in a high uptake rate of Fe, thereby contributing to the increase in the chl a concentration. However, similar stimulation did not occur at station B due to different environmental conditions resulting from incubation methods between stations A and B. The in situ-like incubation at station A ensured that environmental conditions, such as temperature and light, did not considerably change during incubation. At station B, however, the water temperature increased from 28 to 31°C during on-deck incubation. Gao et al. (2024) indicated that Phaeodactylum tricornutum could up-regulate the expression of genes in cryptochrome-photolyase family to enhance the uptake of Fe under 26°C. However, Strzepek and Price (2000) suggested that high temperature might hamper the utilization of Fe by diatoms (Strzepek and Price, 2000). We speculated that excessive temperature would suppress the expression of genes in cryptochrome-photolyase family and inhibit the utilization of Fe by diatom thereby resulting in an invariable chl a concentration of microphytoplankton in the Fe treatment. At station B, we also found different changes in the chl a concentration of microphytoplankton between the HL and LL groups without Fe addition. The dominant species of microphytoplankton was Synedra sp. at station B (Table 1). The alga Synedra can release dissolved organic nitrogen (DON) during the uptake of nitrate in light and reabsorb this DON for cell division in darkness (Collos et al., 1992). The increased chl a concentration in microphytoplankton in the LLC and LLNP treatments was probably due to the enhancement of chl a synthesis via the uptake of DON. In the HL group, irradiance was too high, and caused photodamage for the phytoplankton cells acclimating to the environment of 75 m depth (Alderkamp et al., 2010), which likely inhibited the accumulation of chl a.
In contrast to microphytoplankton, we found significant decreases in the chl a concentration of nano- and picophytoplankton at stations A and B. This might be due to size-dependent differences in grazing removal. Hulot et al. (2000) reported that small herbivores (50-200 μm) fed on small algae (length < 35 μm), and large herbivores (400-2000 μm) fed on both small and protected algae (length≥35 μm or protected by thick walls or gelatinous sheaths). In our study, most large herbivores were excluded by 505 μm bolting silk before incubation. Therefore, a significant herbivorous effect was mainly exerted on small algae, which caused decreases in the chl a concentrations of concentration of nano- and picophytoplankton. The nutrient addition likely improves the food quality of phytoplankton, thus increases their grazing removal in the presence of herbivores (Worden and Binder, 2003). The decreases in the abundances of picophytoplankton at station A at 0 m were probably due to light-dependent grazing by microzooplankton (Moeller et al., 2019). We also found the highest fold increase in the chl a concentration in microphytoplankton relative to nano- and picophytoplankton at station C. The results partially supported the deduction of size-dependent grazing control. In some circumstances at stations A and B, the chl a concentration of nano- and picophytoplankton did not change before and after incubation. The stock of phytoplankton was a result of division and the loss of phytoplankton (Arteaga et al., 2020). The population growth of phytoplankton might potentially compensate for grazing-induced losses, resulting in consistent chl a concentrations before and after incubation. For example, in the Fe-added treatment, chl a concentrations of nanophytplankton from 75 m of station A and LL group of station B remained unchanged before and after incubation. It might suggest that the Fe-stimulating growth likely compensated for the loss caused by herbivore’s grazing in nanophytoplankton. The elevated chl a concentration of nano- and picophytoplankton after incubation at station C was likely due to the higher net growth rate. We collected surface water samples from station C at 1300 hr. At that time, herbivore abundance was supposed to be relatively low (Table 1, 51 ind. L-1) due to diel vertical migration in a few tens of meters.
4.2 Divergent responses of different picophytoplankton in short-term incubation
Due to the small incubation volumes in our study, the potential “bottle effect” would affect the small phytoplankton, especially on picophytoplankton (Calvo-Díaz et al., 2011). When cultured water samples in small bottles, larger cells would be underestimated, the trophic interaction would be disturbed and exchange of nutrients and metabolites in bottles with surrounding waters would be prevented (Calvo-Díaz et al., 2011). Böttjer-Wilson et al. (2021) compared the results of mesocosm (60 m3) and microcosm (20 L) experiments, and found that the Prochlorococcus abundance in microcosm was only 60% of those in mesocosm after a two-day incubation. Their results suggested that small volume may cause greater bottle effects. In our study, the culture volumes were 1.5 L. The bottle volume, therefore, was one of important factor for the decreases in the abundance of picophytoplankton. Besides, the elevating temperature was also potential factors that suppressed the growth of picophytoplankton in the East Indian Ocean (Twining et al., 2019), which likely contributed to the loss of picophytoplankton at station B and at 0 m of station A due to the direct heating effect by sunlight irradiance. Similar decreases were also found in the experiment conducted in the oligotrophic Gulf of Aqada by Mackey et al. (2009).
For the most abundant component in picophytoplankton, although the genes for nitrate utilization have randomly occurred at an intermediate frequency in recently emerged clades (Berube et al., 2019), most Prochlorococcus cannot utilize nitrate for growth (Scanlan, 2012). In the northwestern Mediterranean Sea, Prochlorococcus abundance was low when nitrate supply was high (Mouriño-Carballido et al., 2016). In our study, the addition of nitrate drastically increased the nitrate concentration in bottles which may suppress the abundance of Prochlorococcus. Besides, most studies showed that Prochlorococcus might be a better prey for heterotrophic flagellates and other herbivores, as indicated by higher loss rates of Prochlorococcus (Guillou et al., 2001; Hirose et al., 2008; Jiang et al., 2021). Therefore, the decreases in Prochlorococcus abundance were also resulted from grazing removal. The third factor that affects the abundance of Prochlorococcus is light intensity. In the Equatorial Indian Ocean, high-light-adapted Prochlorococcus HL-II mainly occurred in shallower water (Fuller et al., 2006; Larkin et al., 2020), and low-light adapted Prochlorococcus LL-II existed in deeper water (Fuller et al., 2006). Our results from station B showed apparent high-light inhibition of Prochlorococcus from 75 m [assuming low-light-adapted Prochlorococcus according to Fuller et al. (2006)] and suggested that low-light-adapted Prochlorococcus was highly sensitive to high light.
Similar to Prochlorococcus, the Peuk abundance did not increase during the incubation period. The bottle effect also affected the Peuk abundance. A decrease of more than 50% in Peuk abundance has been found in subtropical Atlantic oligotrophic waters (Calvo-Díaz et al., 2011). In our study, the highest decrease in Peuk abundance was up to 90% at 100 m of station A. The sharp decreases can be contributed to the combination of bottle effects and grazing removal due to high abundance of herbivores (185 ind. L-1). In fact, nutrient addition is beneficial for Peuk in oligotrophic oceans when nitrate was added (e.g. Mouriño-Carballido et al., 2016). In our study, the stimulation of nutrient to Peuk was likely covered by both bottle effects and grazing removal.
According to the aforementioned studies, we tentatively attributed the lower loss of Synechococcus to its unsuitability for herbivore grazing. We also found that Synechococcus abundance increased in the controls at 30 m at station A and in the HL group at station B after incubation. These results reflect the lack of grazing pressure (Moore et al., 2008). Liu et al. (2012) found that Fe addition facilitated the population growth of both coastal and oceanic Synechococcus. Similar results were found at station C, at 30 m and 75 m at station A and in the HL group at stations B. Under these circumstances, the stimulation of Fe to Synechococcus likely outcompeted the removal caused by bottle effects and herbivore grazing. The significant increases in Synechococcus abundance in the control were likely due to the insufficient trace metal cleaning in our study. In addition, the loss rates of Peuk were also higher than those of Synechococcus, likely due to viral lysis and grazing (Fowler et al., 2020).
4.3 Implications for long-term responses of phytoplankton to nutrient disturbance
Considering the importance of phytoplankton, particularly picophytoplankton in oligotrophic waters, our findings concerning the short-term responses of phytoplankton to nutrient addition may provide key information for long-term responses of phytoplankton to nutrient disturbance in oligotrophic oceans. The bottom-up control is considered a strong driver in oligotrophic oceans, while the top-down control predominates in productive waters (Ward et al., 2012). We observed that both nutrient stimulation and rapid removal by bottle effect, as well as potential grazing, contributed to changes in the picophytoplankton abundance and size-dependent chl a concentration. This suggests that short-term triggers of both bottom-up and top-down controls likely further determine the long-term responses of phytoplankton. For instance, Zhou et al. (2018) observed a significant community shift within a 12-day incubation using microcosm experiments. The addition of nitrate in their study had divergent effects on microphytoplankton and Prochlorococcus in short term, inhibiting the growth of Prochlorococcus while stimulating the growth of microphytoplankton. According to our study and other previous studies (e.g., Worden and Binder, 2003; Calvo-Díaz et al., 2011), in addition, the bottle effects and herbivores’ grazing would rapid remove the picophytoplankton in short term, which was also identified as an important factor for the community shift in the study of Zhou et al. (2018). Therefore, we propose that both bottom-up and top-down controls should be considered as they contribute to the phytoplankton dynamics in oligotrophic oceans.
5 Conclusion
According to our findings, we have concluded that the impact of nutrient availability becomes predominant in the nutrient-added experiments only under weak grazing pressure and favorable conditions such as temperature and light. In our study, the removal grazers appeared to be a key factor influencing the responses of small phytoplankton (<20 μm) to nutrient disturbance, which probably masked the responses of these phytoplankton to nutrient disturbance. Divergent changes observed in the abundances of different picophytoplankton groups may also be attributed to the preferences of grazing removal, resulting in greater losses of Prochlorococcus and Peuk compared to Synechococcus. Our results implied that when conducting nutrient-added experiments, it is crucial to consider multiple factors and carefully interpret the results, which often indicate a shift from picophytoplankton dominance towards microphytoplankton.
Data availability statement
The raw data supporting the conclusions of this article will be made available by the authors, without undue reservation.
Author contributions
PS: Data curation, Writing – review & editing, Writing – original draft, Resources, Project administration, Methodology, Investigation. KS: Writing – review & editing, Writing – original draft, Methodology, Investigation, Data curation. YZ: Writing – review & editing, Data curation. LL: Data curation, Writing – review & editing. CY: Data curation, Writing – review & editing. ZX: Data curation, Writing – review & editing. YL: Data curation, Writing – review & editing. XZ: Resources, Conceptualization, Project administration, Writing – review & editing. ZW: Resources, Writing – review & editing.
Funding
The author(s) declare financial support was received for the research, authorship, and/or publication of this article. The study was supported by the National Key Research and Development Program of China (No. 2017YFC1404602), the Global Change and Air-Sea Interaction Program (GASI-02-IND-STSsum) and the National Natural Science Foundation of China (No. 41906139).
Acknowledgments
We thank the captain and crew of R/Vs Haice 3301. We appreciate Xiao Wang, Ming Xin, Qinzeng Xu, Xuejun Xiong, Long Yu, Yanliang Guo and Hongping Wang for their assistance during the cruise investigation and incubation experiments. The study was supported by the National Key Research and Development Program of China (No. 2017YFC1404602), the Global Change and Air-Sea Interaction Program (GASI-02-IND-STSsum) and the National Natural Science Foundation of China (No. 41906139).
Conflict of interest
The authors declare that the research was conducted in the absence of any commercial or financial relationships that could be construed as a potential conflict of interest.
Publisher’s note
All claims expressed in this article are solely those of the authors and do not necessarily represent those of their affiliated organizations, or those of the publisher, the editors and the reviewers. Any product that may be evaluated in this article, or claim that may be made by its manufacturer, is not guaranteed or endorsed by the publisher.
References
Alderkamp A.-C., de Baar H. J. W., Visser R. J. W., Arrigo K. R. (2010). Can photoinhibition control phytoplankton abundance in deeply mixed water columns of the Southern Ocean? Limnol Oceanogr 55, 1248–1264. doi: 10.4319/lo.2010.55.3.1248
Arteaga L. A., Boss E., Behrenfeld M. J., Westberry T. K., Sarmiento J. L. (2020). Seasonal modulation of phytoplankton biomass in the Southern Ocean. Nat. Commun. 11, 5364. doi: 10.1038/s41467-020-19157-2
Baer S. E., Rauschenberg S., Garcia C. A., Garcia N. S., Martiny A. C., Twining B. S., et al. (2019). Carbon and nitrogen productivity during spring in the oligotrophic Indian Ocean along the GO-SHIP IO9N transect. Deep Sea Res. Part II 161, 81–91. doi: 10.1016/j.dsr2.2018.11.008
Behrenfeld M. J., Worthington K., Sherrell R. M., Chavez F. P., Strutton P., McPhaden M., et al. (2006). Controls on tropical Pacific Ocean productivity revealed through nutrient stress diagnostics. Nature 442, 1025–1028. doi: 10.1038/nature05083
Berube P. M., Rasmussen A., Braakman R., Stepanauskas R., Chisholm S. W. (2019). Emergence of trait variability through the lens of nitrogen assimilation in Prochlorococcus. eLife 8, e41043. doi: 10.7554/eLife.41043
Böttjer-Wilson D., White A. E., Björkman K. M., Church M. J., Poulos S., Shimabukuro E., et al (2021). Effects of nutrient enrichments on oligotrophic phytoplankton communities: a mesocosm experiment nearHawai’i, USA. Aquat. Microb. Ecol. 87, 167–183.
Browning T. J., Achterberg E. P., Rapp I., Engel A., Bertrand E. M., Tagliabue A., et al. (2017). Nutrient co-limitation at the boundary of an oceanic gyre. Nature 551, 242–246. doi: 10.1038/nature24063
Browning T. J., Bouman H. A., Moore C. M., Schlosser C., Tarran G. A., Woodward E. M. S., et al. (2014). Nutrient regimes control phytoplankton ecophysiology in the South Atlantic. Biogeosciences 11, 463–479. doi: 10.5194/bg-11-463-2014
Calvo-Díaz A., Díaz-Pérez L., Suárez Luis Á, Morán Xosé Anxelu G., Teira E., Marañón E. (2011). Decrease in the autotrophic-to-heterotrophic biomass ratio of picoplankton in oligotrophic marine waters due to bottle enclosure. Appl. Environ. Microbiol. 77, 5739–5746. doi: 10.1128/AEM.00066-11
Collos Y., Döhler G., Biermann I. (1992). Production of dissolved organic nitrogen during uptake of nitrate by Synedra planctonica: implications for estimates of new production in the oceans. J. Plankton Res. 14, 1025–1029. doi: 10.1093/plankt/14.8.1025
Fowler B. L., Neubert M. G., Hunter-Cevera K. R., Olson R. J., Shalapyonok A., Solow A. R., et al. (2020). Dynamics and functional diversity of the smallest phytoplankton on the Northeast US Shelf. PNAS 117, 12215–12221. doi: 10.1073/pnas.1918439117
Fuller N. J., Tarran G. A., Yallop M., Orcutt K. M., Scanlan D. J. (2006). Molecular analysis of picocyanobacterial community structure along an Arabian Sea transect reveals distinct spatial separation of lineages. Limnol Oceanogr 51, 2515–2526. doi: 10.4319/lo.2006.51.6.2515
Gao S., Yang W., Li X., Zhou L., Liu X., Wu S., et al. (2024). Cryptochrome PtCPF1 regulates high temperature acclimation of marine diatoms through coordination of iron and phosphorus uptake. ISME J. 18, 1–14. doi: 10.1093/ismejo/wrad019
Garcia C. A., Baer S. E., Garcia N. S., Rauschenberg S., Twining B. S., Lomas M. W., et al. (2018). Nutrient supply controls particulate elemental concentrations and ratios in the low latitude eastern Indian Ocean. Nat. Commun. 9, 4868. doi: 10.1038/s41467-018-06892-w
Guillou L., Jacquet S., Chretiennot-Dinet M. J., Vaulot D. (2001). Grazing impact of two small heterotrophic flagellates on Prochlorococcus and Synechococcus. Aquat Microb. Ecol. 26, 201–207. doi: 10.3354/ame026201
Hirose M., Katano T., Nakano S.-I. (2008). Growth and grazing mortality rates of Prochlorococcus, Synechococcus and eukaryotic picophytoplankton in a bay of the Uwa Sea, Japan. J. Plankton Res. 30, 241–250. doi: 10.1093/plankt/fbm101
Hoffmann L. J., Peeken I., Lochte K., Assmy P., Veldhuis M. (2006). Different reactions of Southern Ocean phytoplankton size classes to iron fertilization. Limnol Oceanogr 51, 1217–1229. doi: 10.4319/lo.2006.51.3.1217
Hulot F. D., Lacroix G., Lescher-Moutoué F., Loreau M. (2000). Functional diversity governs ecosystem response to nutrient enrichment. Nature 405, 340–344. doi: 10.1038/35012591
Jiang S., Hashihama F., Saito H. (2021). Phytoplankton growth and grazing mortality through the oligotrophic subtropical North Pacific. J. Oceanogr. 77, 505–521. doi: 10.1007/s10872-020-00580-4
Larkin A. A., Garcia C. A., Ingoglia K. A., Garcia N. S., Baer S. E., Twining B. S., et al. (2020). Subtle biogeochemical regimes in the Indian Ocean revealed by spatial and diel frequency of Prochlorococcus haplotypes. Limnol Oceanogr 65, S220–S232. doi: 10.1002/lno.11251
Liu S., Juneau P., Qiu B. (2012). Effects of iron on the growth and minimal fluorescence yield of three marine Synechococcus strains (Cyanophyceae). Phycol Res. 60, 61–69. doi: 10.1111/j.1440-1835.2011.00636.x
Mackey K. R. M., Rivlin T., Grossman A. R., Post A. F., Paytan A. (2009). Picophytoplankton responses to changing nutrient and light regimes during a bloom. Mar. Biol. 156, 1531–1546. doi: 10.1007/s00227-009-1185-2
Moore C. M., Mills M. M., Langlois R., Milne A., Achterberg E. P., La Roche J., et al. (2008). Relative influence of nitrogen and phosphorous availability on phytoplankton physiology and productivity in the oligotrophic sub-tropical North Atlantic Ocean. Limnol Oceanogr 53, 291–305. doi: 10.4319/lo.2008.53.1.0291
Mouriño-Carballido B., Hojas E., Cermeño P., Chouciño P., Fernández-Castro B., Latasa M., et al. (2016). Nutrient supply controls picoplankton community structure during three contrasting seasons in the northwestern Mediterranean Sea. Mar. Ecol.:Prog. Ser. 543, 1–19. doi: 10.3354/meps11558
Ryan-Keogh T. J., Macey A. I., Nielsdóttir M. C., Lucas M. I., Steigenberger S. S., Stinchcombe M. C., et al. (2013). Spatial and temporal development of phytoplankton iron stress in relation to bloom dynamics in the high-latitude North Atlantic Ocean. Limnol Oceanogr 58, 533–545. doi: 10.4319/lo.2013.58.2.0533
Scanlan D. J. (2012). “Marine picocyanobacteria,” in Ecology of cyanobacteria II: Their Diversity in Space and Time. Ed. Whitton B. A. (Springer Netherlands, Dordrecht), 503–533.
Shaked Y., Buck K. N., Mellett T., Maldonado M. T. (2020). Insights into the bioavailability of oceanic dissolved Fe from phytoplankton uptake kinetics. ISME J. 14, 1182–1193. doi: 10.1038/s41396-020-0597-3
Strzepek R. F., Price N. M. (2000). Influence of irradiance and temperature on the iron content of the marine diatom Thalassiosira weissflogii (Bacillariophyceae). Mar. Ecol. Prog. Ser. 206, 107–117. doi: 10.3354/meps206107
Twining B. S., Rauschenberg S., Baer S. E., Lomas M. W., Martiny A. C., Antipova O. (2019). A nutrient limitation mosaic in the eastern tropical Indian Ocean. Deep Sea Res. Part II 166, 125–140. doi: 10.1016/j.dsr2.2019.05.001
Ward B. A., Dutkiewicz S., Jahn O., Follows M. J. (2012). A size-structured food-web model for the global ocean. Limnol. Oceanogr. 57, 1877–1891. doi: 10.4319/lo.2012.57.6.1877
Worden A. Z., Binder B. J. (2003). Application of dilution experiments for measuring growth and mortality rates among Prochlorococcus and Synechococcus populations in oligotrophic environments. Aquat. Microb. Ecol. 30, 159–174. doi: 10.3354/ame030159
Yuan C., Zhang X., Wang Z., Li Y., Xu Z., Wei Q., et al. (2021). Latitudinal distribution of the picoplankton community in the eastern equatorial Indian Ocean during the boreal fall intermonsoon period. Deep Sea Res. Part I 168, 103451. doi: 10.1016/j.dsr.2020.103451
Keywords: phytoplankton, chlorophyll a, size-dependent responses, incubation, nutrient, short-term disturbance, Indian ocean
Citation: Sun P, Sun K-M, Zhou Y, Liu L, Yuan C, Xu Z, Li Y, Zhang X and Wang Z (2024) Changes in size-dependent Chlorophyll a concentration and group-specific picophytoplankton abundance in short-term nutrient-addition experiments in the Equatorial Eastern Indian Ocean. Front. Mar. Sci. 11:1375669. doi: 10.3389/fmars.2024.1375669
Received: 24 January 2024; Accepted: 25 March 2024;
Published: 08 April 2024.
Edited by:
Feixue Fu, University of Southern California, United StatesReviewed by:
François Ribalet, University of Washington, United StatesYuanyuan Feng, Shanghai Jiao Tong University, China
Copyright © 2024 Sun, Sun, Zhou, Liu, Yuan, Xu, Li, Zhang and Wang. This is an open-access article distributed under the terms of the Creative Commons Attribution License (CC BY). The use, distribution or reproduction in other forums is permitted, provided the original author(s) and the copyright owner(s) are credited and that the original publication in this journal is cited, in accordance with accepted academic practice. No use, distribution or reproduction is permitted which does not comply with these terms.
*Correspondence: Ping Sun, c3VucGluZ0BmaW8ub3JnLmNu