
95% of researchers rate our articles as excellent or good
Learn more about the work of our research integrity team to safeguard the quality of each article we publish.
Find out more
ORIGINAL RESEARCH article
Front. Mar. Sci. , 03 June 2024
Sec. Marine Ecosystem Ecology
Volume 11 - 2024 | https://doi.org/10.3389/fmars.2024.1373716
This article is part of the Research Topic The Cycling of Biogenic Elements and Their Microbial Transformations in Marine Ecosystems View all 12 articles
 Haorui Liang1,2
 Junxiao Zhang1,2*
 Jibiao Zhang3*
 Peng Zhang3
 Xue Deng4
 Jiyu Chen1,2Zhiliang Wang1,2Chao Long5Chuqian Lu6,7Di Wang1,2Yuzhao Liang1,2
Coastal eutrophication is a major issue of marine pollution. The main factors controlling eutrophication must be identified to ensure effective marine environmental management according to the respective local conditions. Zhanjiang Bay (ZJB), located northwest of the South China Sea, is a semi-closed bay influenced by complex water flows and the development of surrounding cities. In this study, we investigated the development of nutrient concentrations and compositions in ZJB seawater over the past 20 years and the factors influencing eutrophication based on several field investigations from 2006 to 2022 and historical data. High concentrations of dissolved inorganic phosphorus (DIP) and dissolved inorganic nitrogen (DIN) were the main contributors to the severe long-term eutrophication in ZJB; however, light eutrophication was observed in the outer bay, primarily caused by chemical oxygen demand (COD) and DIP. The primary sources of COD and nutrients were riverine freshwater, sewage outfalls, mariculture and domestic effluents carried by rivers. Tidal effects diluted the nutrient concentrations in the bay with seawater from the outer bay, thereby playing a key role in nutrient redistribution. The DIN: DIP ratio of ZJB showed long-term nitrogen restriction and excess phosphorus, primarily owing to mariculture activities. Marine undertakings can exert various impacts on water quality. Eliminating illegal aquaculture and launching aquaculture tailwater treatment can improve water quality, whereas practices such as channel dredging may worsen it. This study demonstrates the intricate dynamics of the ZJB ecosystem and offers valuable insights for effective environmental management and conservation efforts.
Nutrients such as nitrogen (N), phosphorus (P), and silicon (Si) are crucial components of marine environments that help sustain the health and ecological balance of marine ecosystems. Appropriate concentrations of nutrients in seawater promote the growth, development, and reproduction of organisms while also sustaining primary productivity in the ocean; however, an imbalance in nutrient concentrations and composition may lead to marked changes in marine ecosystems. For example, dissolved inorganic P (DIP) and dissolved inorganic N (DIN) are the most effective forms for phytoplankton uptake (Cotner and Biddanda, 2002). An excess or deficiency of either element can result in N or P depletion, thereby impeding the development of phytoplankton and influencing primary productivity. Moreover, excessive nutrient levels may cause significant phytoplankton blooms and high primary productivity, resulting in eutrophication, red tides, algal blooms, water hypoxia, and acidification (Wang et al., 2021a; Zhang et al., 2023a, 2023b). These factors can degrade the affected environments, directly threaten biodiversity and habitats, and cause massive mortality of marine organisms, ultimately harming marine ecosystems and human society (Deegan et al., 2012; Maúre et al., 2021; He et al., 2023).
In recent decades, increasing terrestrial anthropogenic inputs have substantially altered the nutrient structures of coastal waters (Howarth and Marino, 2006; Caffrey et al., 2007; Lin et al., 2021; Wang et al., 2021c; Lin and Lin, 2022). Excess nutrients lead to eutrophication in freshwater (Conley et al., 2009; Jiang et al., 2023; Qin et al., 2023) and marine systems (Howarth and Marino, 2006; Deegan et al., 2012, 2012; Ke et al., 2022), which is particularly evident in coastal waters near areas experiencing rapid urbanization and population growth (Wang et al., 2021c). Nutrients accumulate because of urban development, including sewage from agriculture, industry, farming. Increased N loading is a key driver of eutrophication in most coastal waters (Sinha et al., 2017; Ke et al., 2022). From 1900 to 2000, N discharge from rivers to global nearshore marine ecosystems increased by up to 18 Tg N/year (Beusen et al., 2016). Furthermore, it is worth noting that global P loading increased by 40%–50% between 1980 and 2015 (Beusen et al., 2022). Although the increasing trend has slowed owing to the implementation of P emission control policies (Howarth and Marino, 2006), coastal phosphate concentrations have markedly increased in recent decades because of human activities (Zhang et al., 2009; He et al., 2023). This increase is expected to have a profound impact on N and P cycling in marine ecosystems, thus threatening biogeochemical cycles and exacerbating eutrophication in coastal ecosystems.
For decades, Zhanjiang Bay (ZJB), China, has been severely affected by rapid urban development, resulting in ecological degradation and increased eutrophication (Li et al., 2014, 2020; Zhang et al., 2021; Lao et al., 2022). The nutrient levels in ZJB have increased because of direct discharge from sewage outfalls along the coast, including agricultural, industrial and domestic effluents. Human activities reduce river discharge, increasing the intrusion of external seawater from the outer bay towards the north (Lao et al., 2022). ZJB is mainly connected to the external sea through a narrow channel in the southeastern region, resulting in low hydrodynamics and poor exchange of water masses and nutrients between the inside and outside of the bay, which has led to the deterioration of water quality in the bay (Zhang et al., 2021; Lao et al., 2022). Numerous studies have focused on the sources, distribution, and eutrophication levels of various nutrients in ZJB; however, comprehensive long-term studies on the drivers of eutrophication in ZJB are limited.
This study investigated the interannual variation in nutrients and eutrophication levels in ZJB based on 18 cruise surveys conducted from 2006 to 2022 and combined with historical data. Furthermore, this study examined the main contributors to eutrophication in different regions of ZJB. Additionally, the effects of tidal action, biochemical processes, and urban development in the ZJB over the past 20 years on nutrient structure and water quality were analyzed. This study presents long-term basic survey data and addresses critical issues related to the marine environment in ZJB, including (1) changes in nutrient structure and composition over an extended period; (2) differences between the various regions, such as the freshwater end-member and the seawater end-member, on nutrient composition in a typical semi-closed bay; and (3) identifications of the main factors contributing to seawater eutrophication in the various regions. Elucidating these aspects will provide theoretical and empirical support for ecological preservation and environmental management of ZJB as well as critical information for assessing and managing coastal ecosystems worldwide.
ZJB is a semi-closed bay in the northwest South China Sea, covering an area of approximately 300 km2, and is surrounded by Zhanjiang City, Nanshan Island, and Donghai Island on its west, east, and south boundaries, respectively. As an important mariculture area in the South China Sea, over 25% of the sea area of ZJB are covered by open mariculture (such as oysters and fish) to enclose the sea and cultivate (seafood species such as shrimp). The bay experiences a subtropical oceanic monsoon climate (Zhou et al., 2020) with a water retention time of approximately 10 days (Shi et al., 2020). ZJB is fed by several rivers; the northern Suixi River is the primary source of freshwater with a runoff of 7.9×10⁹ m3/yr, accounting for over 90% of the total river inflow in the bay (Li et al., 2021). Additionally, the discharge of land sewage is approximately 1.5×10⁸ m3/yr (Li et al., 2021), accounting for less than 2% of river runoff. The injection of sewage, mariculture, and river water introduces considerable amounts of nutrients and pollutants, leading to a substantial terrestrial pollution burden (Fu et al., 2020).
Based on geographical features, there have been three mouths around the bay historically (Figure 1). The first location is to the north, between Nansan Island and the Potou Zone, leading to the mouth of the Jian River. The narrowest part of the path on the side of the ZJB is approximately 500 m wide. The waters of the upper ZJB and the Jian River meet in this narrow and shallow waterway, named Shilonghai, resulting in minimal water exchange through this narrow bay mouth. The second location is situated to the southwest, between Zhanjiang City and Donghai Island, and connects to Leizhou Bay to the south; however, the construction of the Donghai Dam in the late 1960s halted the water exchange between the ZJB and Leizhou Bay. The third location is to the east, between the Nansan and Donghai Islands, and is directly connected to the South China Sea, which is the most critical water exchange channel between ZJB and the outer seawater.
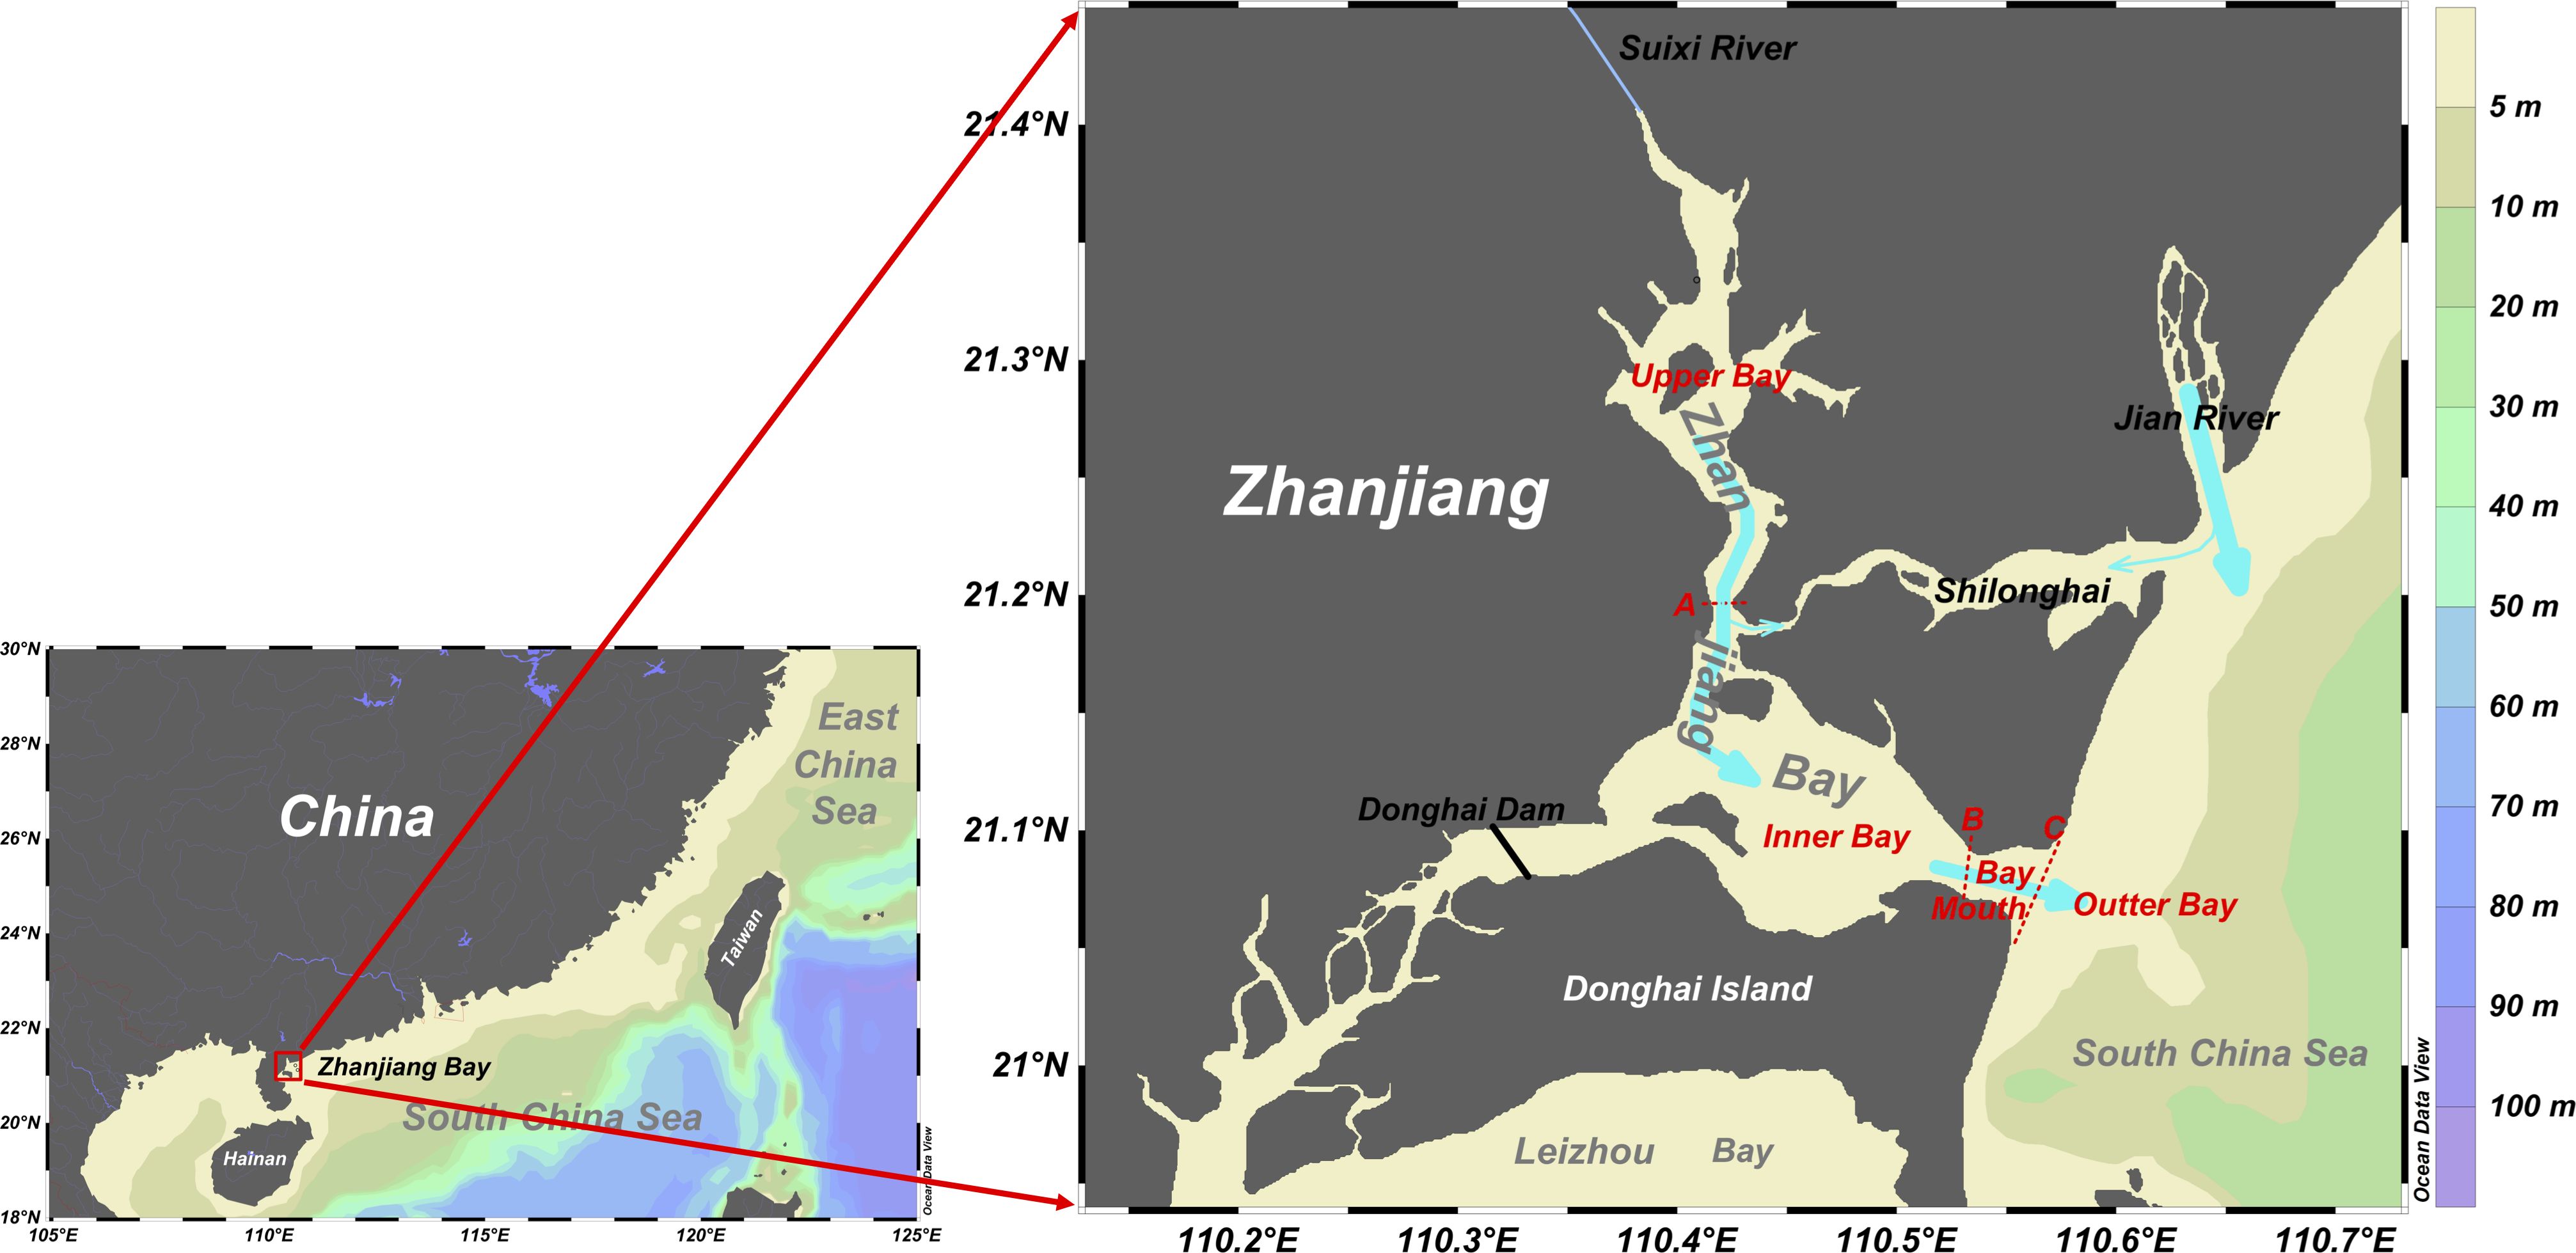
Figure 1 Map of ZJB and its geographical features. The red dashed lines with the red letters A, B, and C are the borders of the various sections in ZJB.
In ZJB, tides and tidal currents are primarily irregular semi-diurnal tides after the Pacific tidal waves enter the South China Sea (Zu et al., 2008). These tides are influenced by the ZJB terrain, resulting in complex variations in tidal rise and fall around the bay. Based on the mixing effect of upstream freshwater and outer seawater, as well as the nutrient distribution characteristics, ZJB is divided into four parts: the upper bay, inner bay, bay mouth, and the outer bay (Figure 1). The upper bay can be described as the “neck” of the ZJB, as the channels narrow upstream from south to north, concentrating the energy following tidal influx and increasing the upstream tidal range, hence increasing the tidal capacity (Wang et al., 2021b). Freshwater from Suixi River flows into the inner bay mostly through this narrow channel. The inner bay is markedly impacted by surrounding ports, fisheries, and aquaculture, resulting in complex physical and biochemical processes. The average water depth is approximately 10 m, except in the Zhanjiang Port Channel area, which has been dredged to over 20 m depth. During neap tide, some areas may be exposed to the lowest tidal level of approximately 4 cm. The bay mouth exhibits a narrow tube effect, resulting in exceptionally high flow velocity and flow rate during both ebb and flood tides, showing reciprocal motion (Zhang et al., 2017); however, the small width (only approximately 2 km) complicates the export of nutrients and pollutants from within ZJB through the bay mouth. The outer bay is a section of the South China Sea that interacts with the interior of the ZJB, primarily through tidal movement. During flood tide, external seawater intrudes into the bay, and mixed water flows out of the bay during ebb tide.
The average yearly hydrological, nutrient, and other parameter data for ZJB were obtained from Lu et al. (2002) for 1998 to 2001 and from Zhang et al. (2009) for 2002 to 2006. The data for August 2007 and quarterly survey data for 2019 were obtained from Cheng et al. (2009) and (Zhang et al., 2020b; Zhang et al., 2021), respectively. In addition, 18 field surveys were conducted in ZJB from 2006 to 2022, as shown in Table 1, and detailed sampling stations are shown in Supplementary Figure S1. Surveys were conducted during high tide (spring tide) and low tide (neap tide) in March 2008, August and November 2010, April 2013, January, March, and June 2014, and March 2021, to explore the influence of tides on nutrients and other substances. The year is divided into four seasons based on temperature variations: spring (March-May), summer (June–August), autumn (September–November), and winter (December–February) (Zhou et al., 2020).
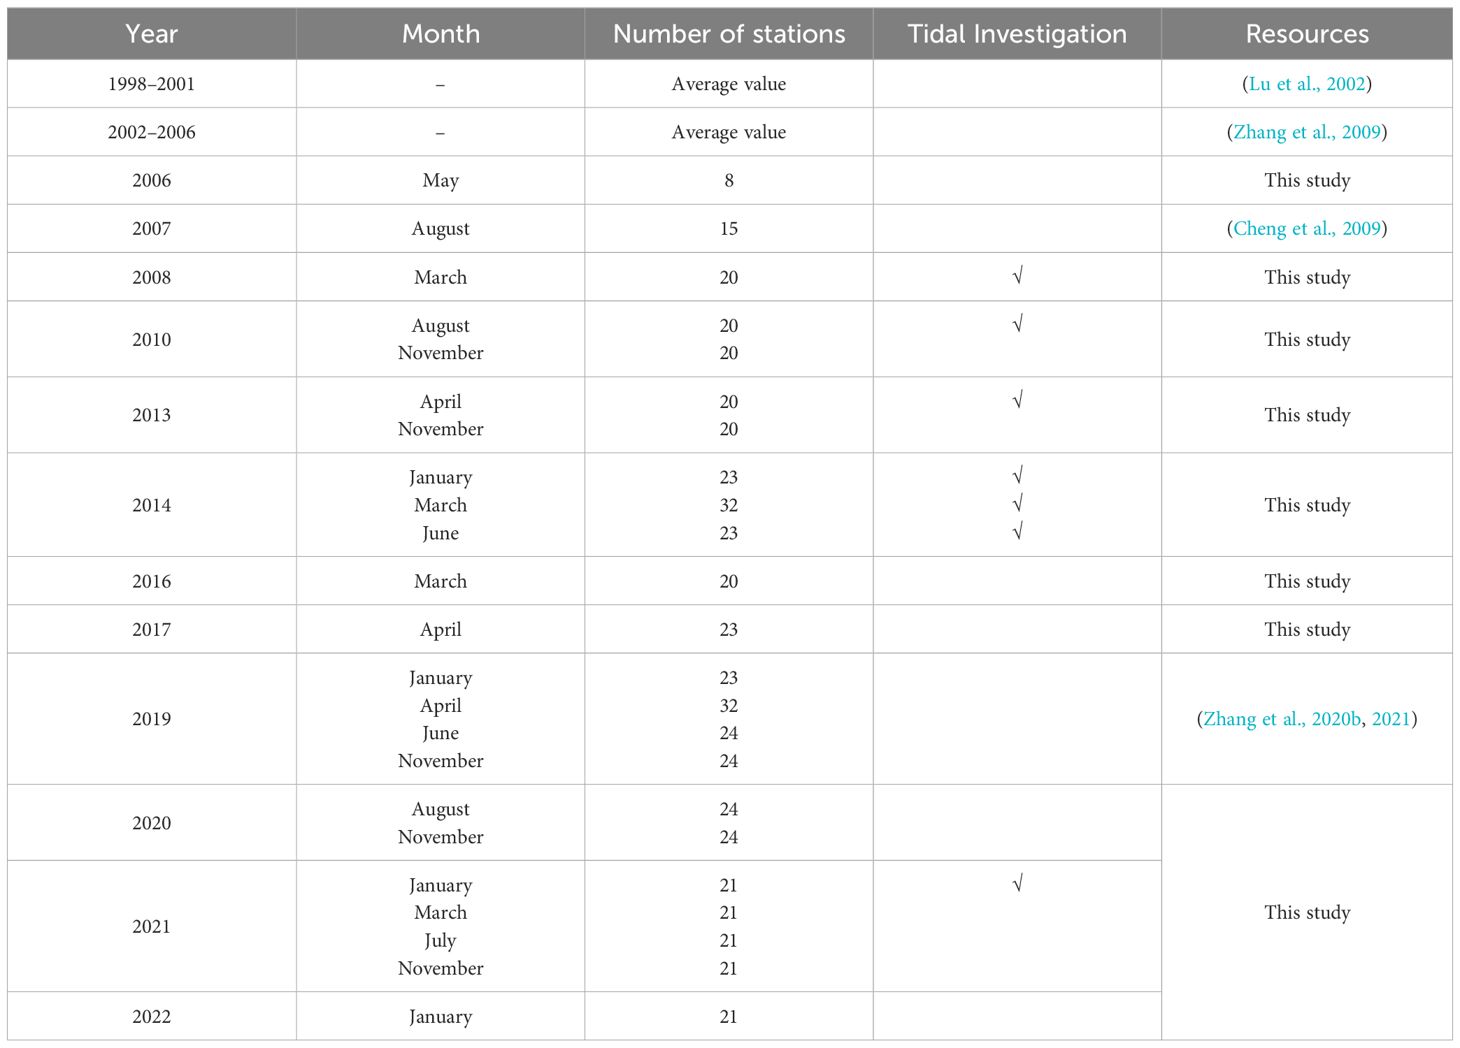
Table 1 Data sources.
Water samples were collected by using a 10 L plexiglass sampler, from the surface layer (0.5–1.0 m below the surface) and the bottom layer (2.0 m above the bottom if water depth exceeded 10 m). Seawater samples were analyzed according to “The specification for marine monitoring - Part 4: Seawater analysis” (GB 17378.4–2007), which was promulgated by the China National Standardization Management Committee. Immediately after the sample was boarded, the temperature was measured using a thermometer at an accuracy of 0.1 °C. Subsequently, dissolved oxygen (DO) samples were collected, preserved using manganese chloride and alkaline potassium iodide solutions, and titrated within 24 h using the Winkler method. Samples for measuring nutrients, such as phosphate, nitrate, nitrite, and ammonia, were filtered through acid-cleaned 0.45 μm acetate cellulose filters and stored at -20°C until laboratory analysis through spectrophotometry. Salinity and chemical oxygen demand (COD) samples were collected in 250 mL plastic bottles and stored at room temperature. Salinity was measured using a conductance salinity meter, and the COD concentration was titrated using alkaline potassium permanganate.
The eutrophication level in ZJB was determined based on the concentrations of COD, DIN, and DIP in the water. The commonly used eutrophication index (EI) was employed (Andersen et al., 2017; Ke et al., 2022; He et al., 2023), as shown in Equation 1.
where the units of COD, DIN, and DIP are expressed in mg·L-1. Generally, when EI<1, the water is not eutrophic; the water is eutrophic when EI>1: ① 1≤EI<2: light eutrophication; ② 2≤EI<5: moderate eutrophication; ③ 5≤EI<15: high eutrophication; ④ EI≥15: severe eutrophication.
To improve water quality, it is essential to clarify the main factors controlling water eutrophication; however, when considering the three primary parameters that affect water eutrophication, COD typically has a magnitude of 1, whereas DIN and DIP typically have magnitudes of 0.1 and 0.01, respectively. Therefore, it is difficult to accurately calculate the contribution of different parameters to the eutrophication level, owing to the large order of magnitude in differences. In Equation 1, 106 is a constant introduced to balance the order of magnitude difference of different parameters, and 4,500 is an empirical constant to judge the state of eutrophication. Therefore, a scientific counting method was used to express each parameter in Equation 1, ensuring that the significant numbers were of the same order of magnitude. The orders of magnitude of COD, DIN, and DIP were unified, as described by Equation 2:
This was then simplified into Equation 3:
In this formula, COD, DIN’, and DIP’ have the same order of magnitude and are all 1. The change in each parameter directly determines the change in the final EI, which directly reflects their contribution to the level of eutrophication.
Apparent oxygen utilization (AOU) represents the discrepancy between the actual measured DO concentration and air-equilibrated concentration under the same physical and chemical conditions (Benson and Krause, 1984). The AOU was calculated according to the modified expression (Equations 4–6) by Garcia and Gordon (1992):
where Ai, Bi, and C0 are constants that can be found in Garcia and Gordon (1992); Ts is scaled temperature, and t is temperature in °C; S is seawater salinity. When AOU values exceed zero, the aquatic ecosystem experiences a net loss of oxygen owing to community respiration. Conversely, negative AOU values suggest a net gain in oxygen, indicative of community production processes.
To minimize the effect of salinity on nutrient distribution in the seawater of ZJB, salinity-normalized nutrients (N-nutrients) were calculated using Equation 7:
where the nutrient could be any type of nutrient, such as nitrate and phosphate; the average salinity was 27.4 during all surveys.
The field survey data were first cleaned and formatted to remove erroneous or incomplete records and ensure that the data were consistent in terms of units. Linear regression analysis was used to analyze the relationships between nutrient concentrations and environmental variables. One-way analysis of variance with Tukey’s test was used to examine significant differences. Correlation analyses were performed using a significance level of p< 0.05.
A map of the study area with the spatial distribution of all parameters was generated using Ocean Data View 4.7.8, using the weighted-average gridding interpolation method (Reiner, 2021). Curves and plots of the historical changes and relationships between nutrients were produced using Data Graph 5.0 (Visual Data Tools, Inc.).
Over the past two decades, substantial seasonal changes have been observed in the temporal distribution of seawater temperature and salinity in ZJB. Seawater temperatures varied from 17.9–32.1°C (n = 486) in the spring to 25.9–34.3°C (n = 202) in the summer. In fall, the temperatures dropped to approximately 20.4–31.8°C (n = 277) and reached their annual minimum in winter, approximately 15.7–24.8°C (n = 195). Salinity varied from 8.6–33.1 (mean 27.5 ± 0.2) in spring to 8.4–33.4 (mean 27.9 ± 0.3) in summer, 13.5–30.1 (mean 26.0 ± 0.1) in autumn, and 16.8–31.4 (mean 28.8 ± 0.2) in winter.
Regarding spatial distribution, sea temperature in various regions of ZJB exhibited minimal variation across the four seasons, primarily influenced by seasonal and climate changes. In contrast, seawater salinity displayed distinct spatial distribution characteristics in different regions during the same season (Figure 2A). In the upper bay, the main freshwater end-member of the ZJB, seawater salinity decreased during spring and summer but increased during autumn and winter. The difference in seawater salinity in spring and summer exceeded 20 but dropped to approximately 10 in autumn and winter (Figure 2B); however, in other areas of ZJB, the salinity difference between the maximum and minimum values was minimal. Overall, salinity in the inner bay was lower than that at the bay mouth, whereas the outer bay exhibited the highest salinity. Seasonally, salinity was highest in winter, followed by spring, and was lowest in autumn. In addition, the surface and bottom water exhibited similar characteristics in terms of temperature and salinity distributions.
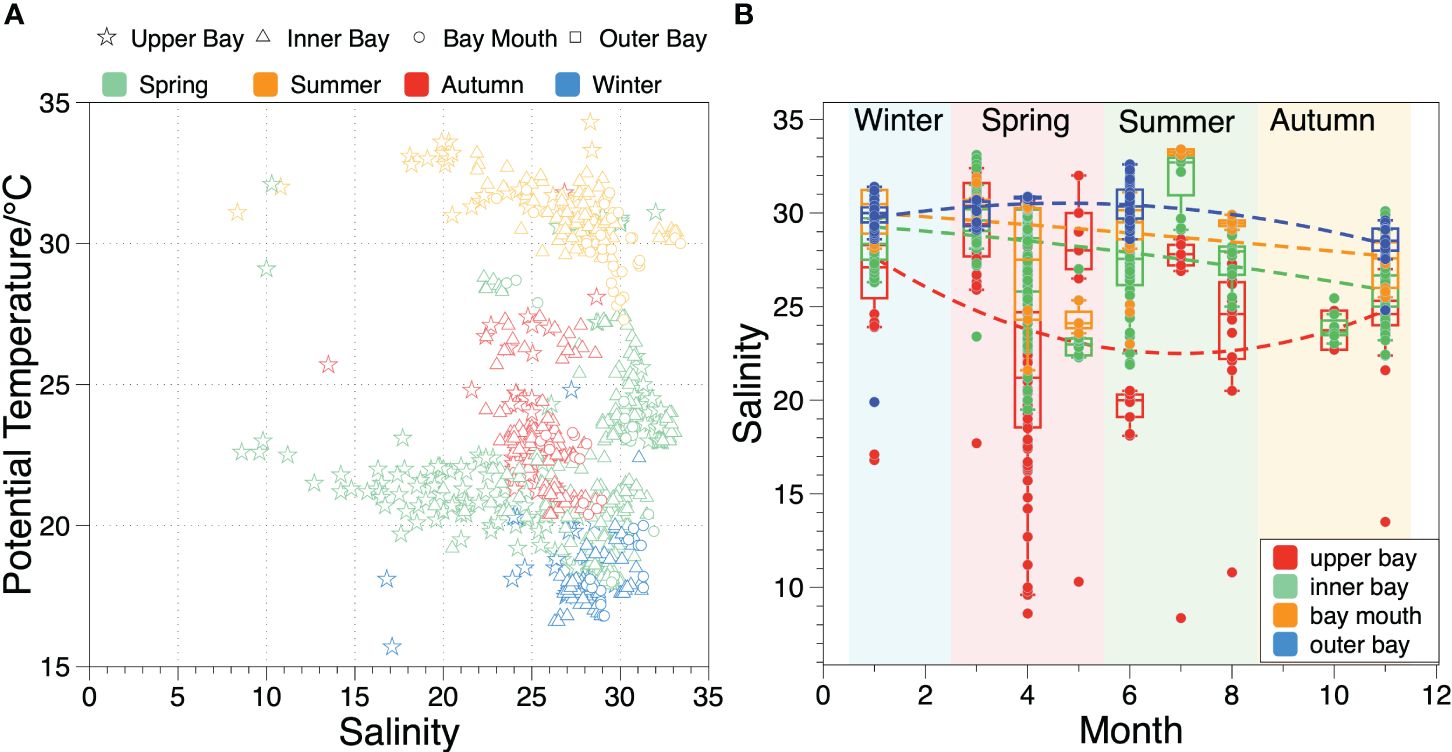
Figure 2 Potential temperature and salinity variations in ZJB in the last two decades. (A) relationship between potential temperature and salinity of ZJB in different seasons, the symbols indicate different regions, and the colors indicate different seasons; (B) the variation of salinity in each section of ZJB during different seasons, and different colors represent different regions of the bay.
Over the past 20 years, the nutrient concentrations in ZJB have undergone pronounced temporal and spatial changes. The temporal distributions of DIN and DIP in ZJB showed similar characteristics (Figures 3A, B). From 1998 to 2001, the mean concentrations of DIN and DIP remained stable, at 0.287 ± 0.033 mg·L-1 and 0.025 ± 0.008 mg·L-1, respectively (Lu et al., 2002). Subsequently, the DIN and DIP changed periodically over time. Since 2001, DIN and DIP concentrations have increased. DIN reached 0.823 mg·L-1 in 2005, and DIP reached its maximum of approximately 0.077 mg·L-1 in 2007. Then, DIN and DIP began to decrease, with an average of 0.252 mg·L-1 and 0.030 mg·L-1 in 2008, respectively. The concentration of both compounds continued to increase until 2010, when DIN and DIP were 0.500 mg·L-1 and 0.089 mg·L-1, respectively. After that, DIN and DIP decreased to their lowest values in 2013–2014, with an average of 0.125 mg·L-1 and 0.012 mg·L-1, respectively. Both concentrations increased again, reaching a peak in 2017, and remained relatively stable with little change until 2020. In 2021, DIN and DIP decreased to 0.435 mg·L-1 and 0.027 mg·L-1 but increased again to 0.768 mg·L-1 and 0.055 mg·L-1 in 2022, respectively.
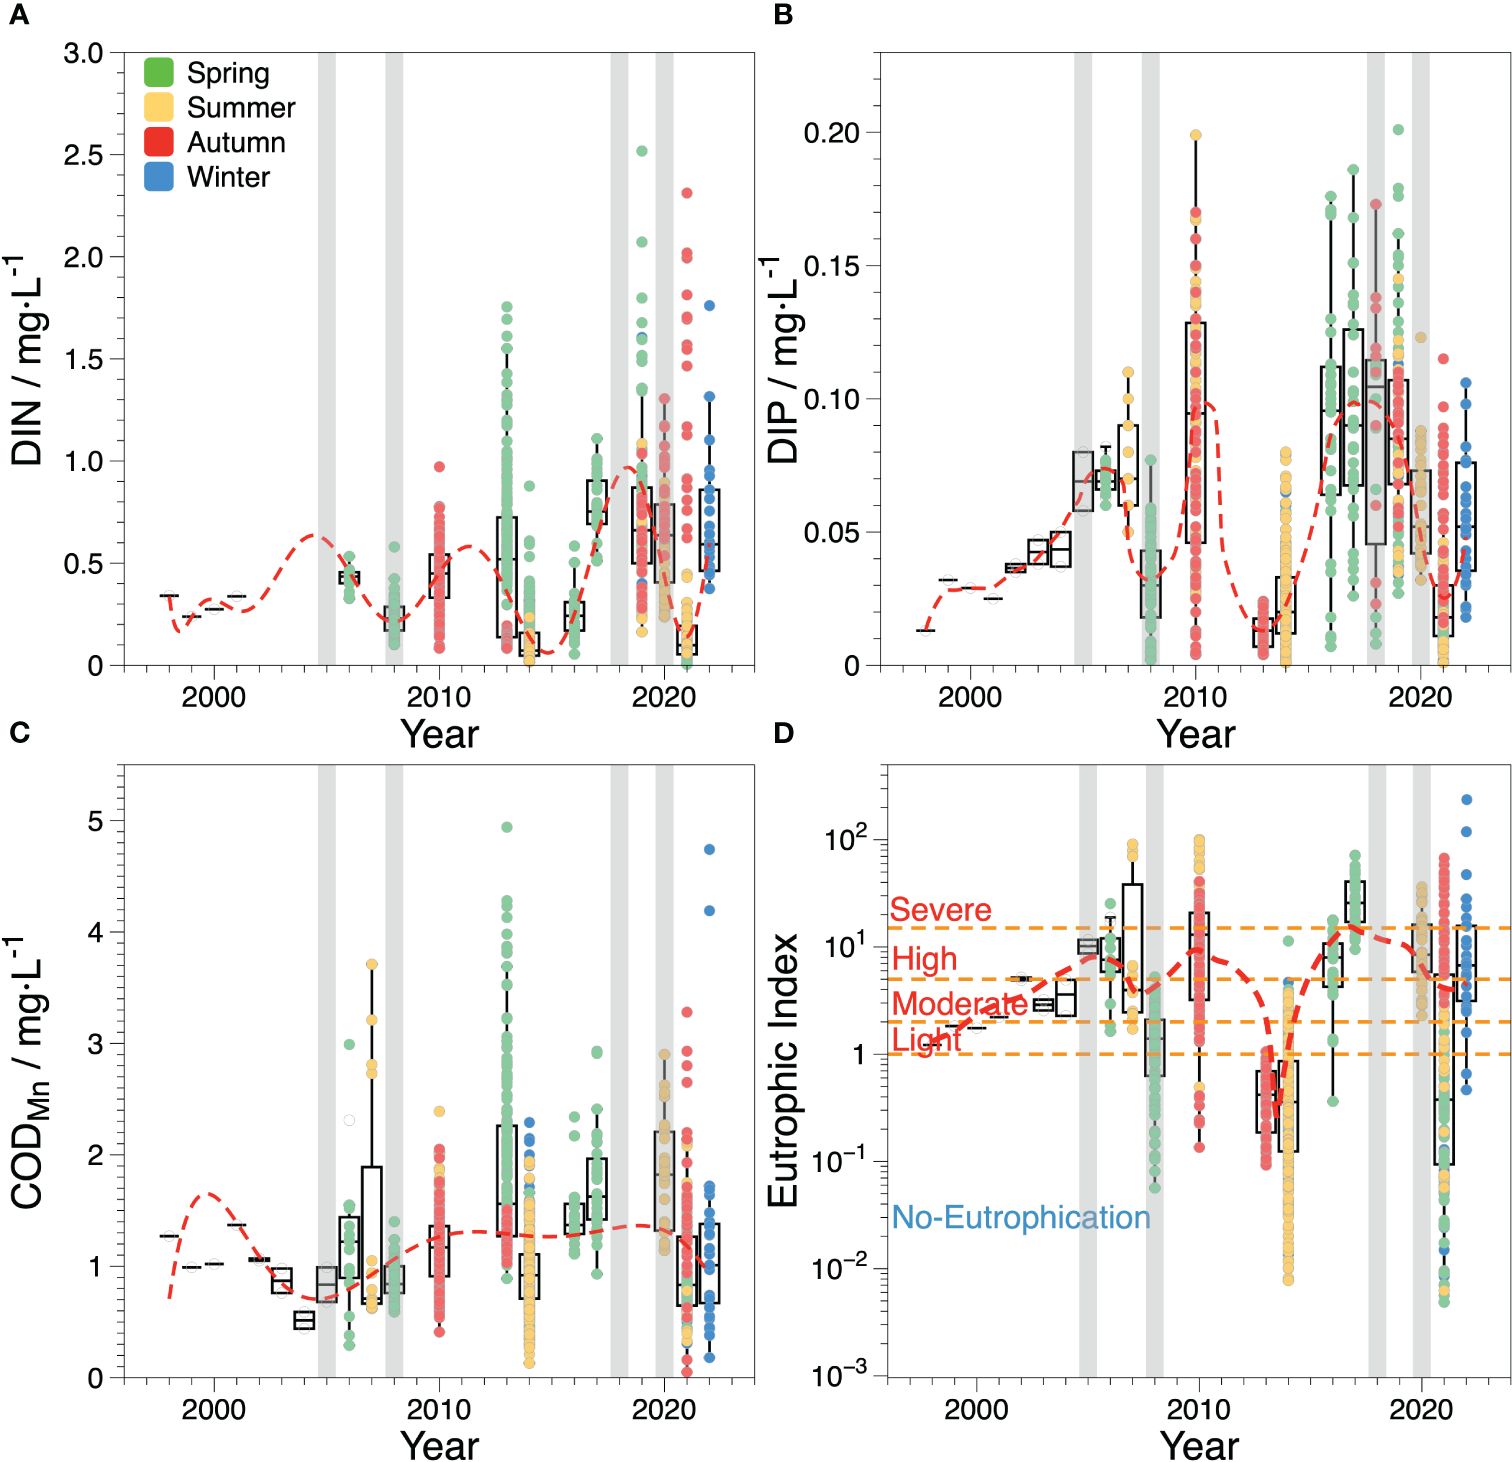
Figure 3 Box-and-whiskers plot (with IQR) showing the median and IQR measurements of annual variation of main water quality parameters in ZJB during the last two decades. The different colors of the points in (A–C) indicate the investigation seasons and the red dashed lines indicate the approximate trend of each parameter. The orange dash lines in (D) represent the critical values for each eutrophication level. The gray areas indicate the period of major marine engineering activities in ZJB.
The spatial distribution of nutrient concentrations in ZJB was mapped horizontally for 16 years, from 2006 to 2022, using available historical and survey data (Supplementary Figures S2, S3). The concentrations of nutrients in ZJB exhibited interannual variation, with the highest values observed in the northern upper bay, followed by the inner bay, and the lowest values in the outer bay. In a narrow waterway where the upper bay water meets the inner bay water, a large amount of water with a high nutrient concentration from the upper bay immerses into the inner bay. Furthermore, the seawater exchange between the inner and outer bays caused outward output or inward invasion during different periods, particularly in the horizontal distribution of DIP in 2014 and 2017.
Over the past two decades, there have been changes in the composition and structure of inorganic nitrogen in the seawater of ZJB (Figure 4). From 2006 to 2013, the concentration of ammonia, similar to that of nitrate, was relatively high. In 2013, the average concentration of ammonia in seawater was as high as 0.217 mg·L-1, which was higher than that of nitrate in the same period (0.142 mg·L-1). Additionally, the ammonia concentration in the upper bay was higher than that in the other bay areas. Since 2013, nitrate concentrations have increased significantly, whereas ammonia and nitrite concentrations have remained stable. Nitrate was consistently the most abundant compound in ZJB, followed by ammonia, with nitrite being the least abundant. The nitrate concentration increased in the upper and inner bays, except for a significant decrease in 2021. In contrast, the nitrate concentration in the bay mouth and outer bay increased significantly to over 0.6 mg·L-1 in 2017, following low levels between 2013 and 2016. Subsequently, the concentration steadily decreased.
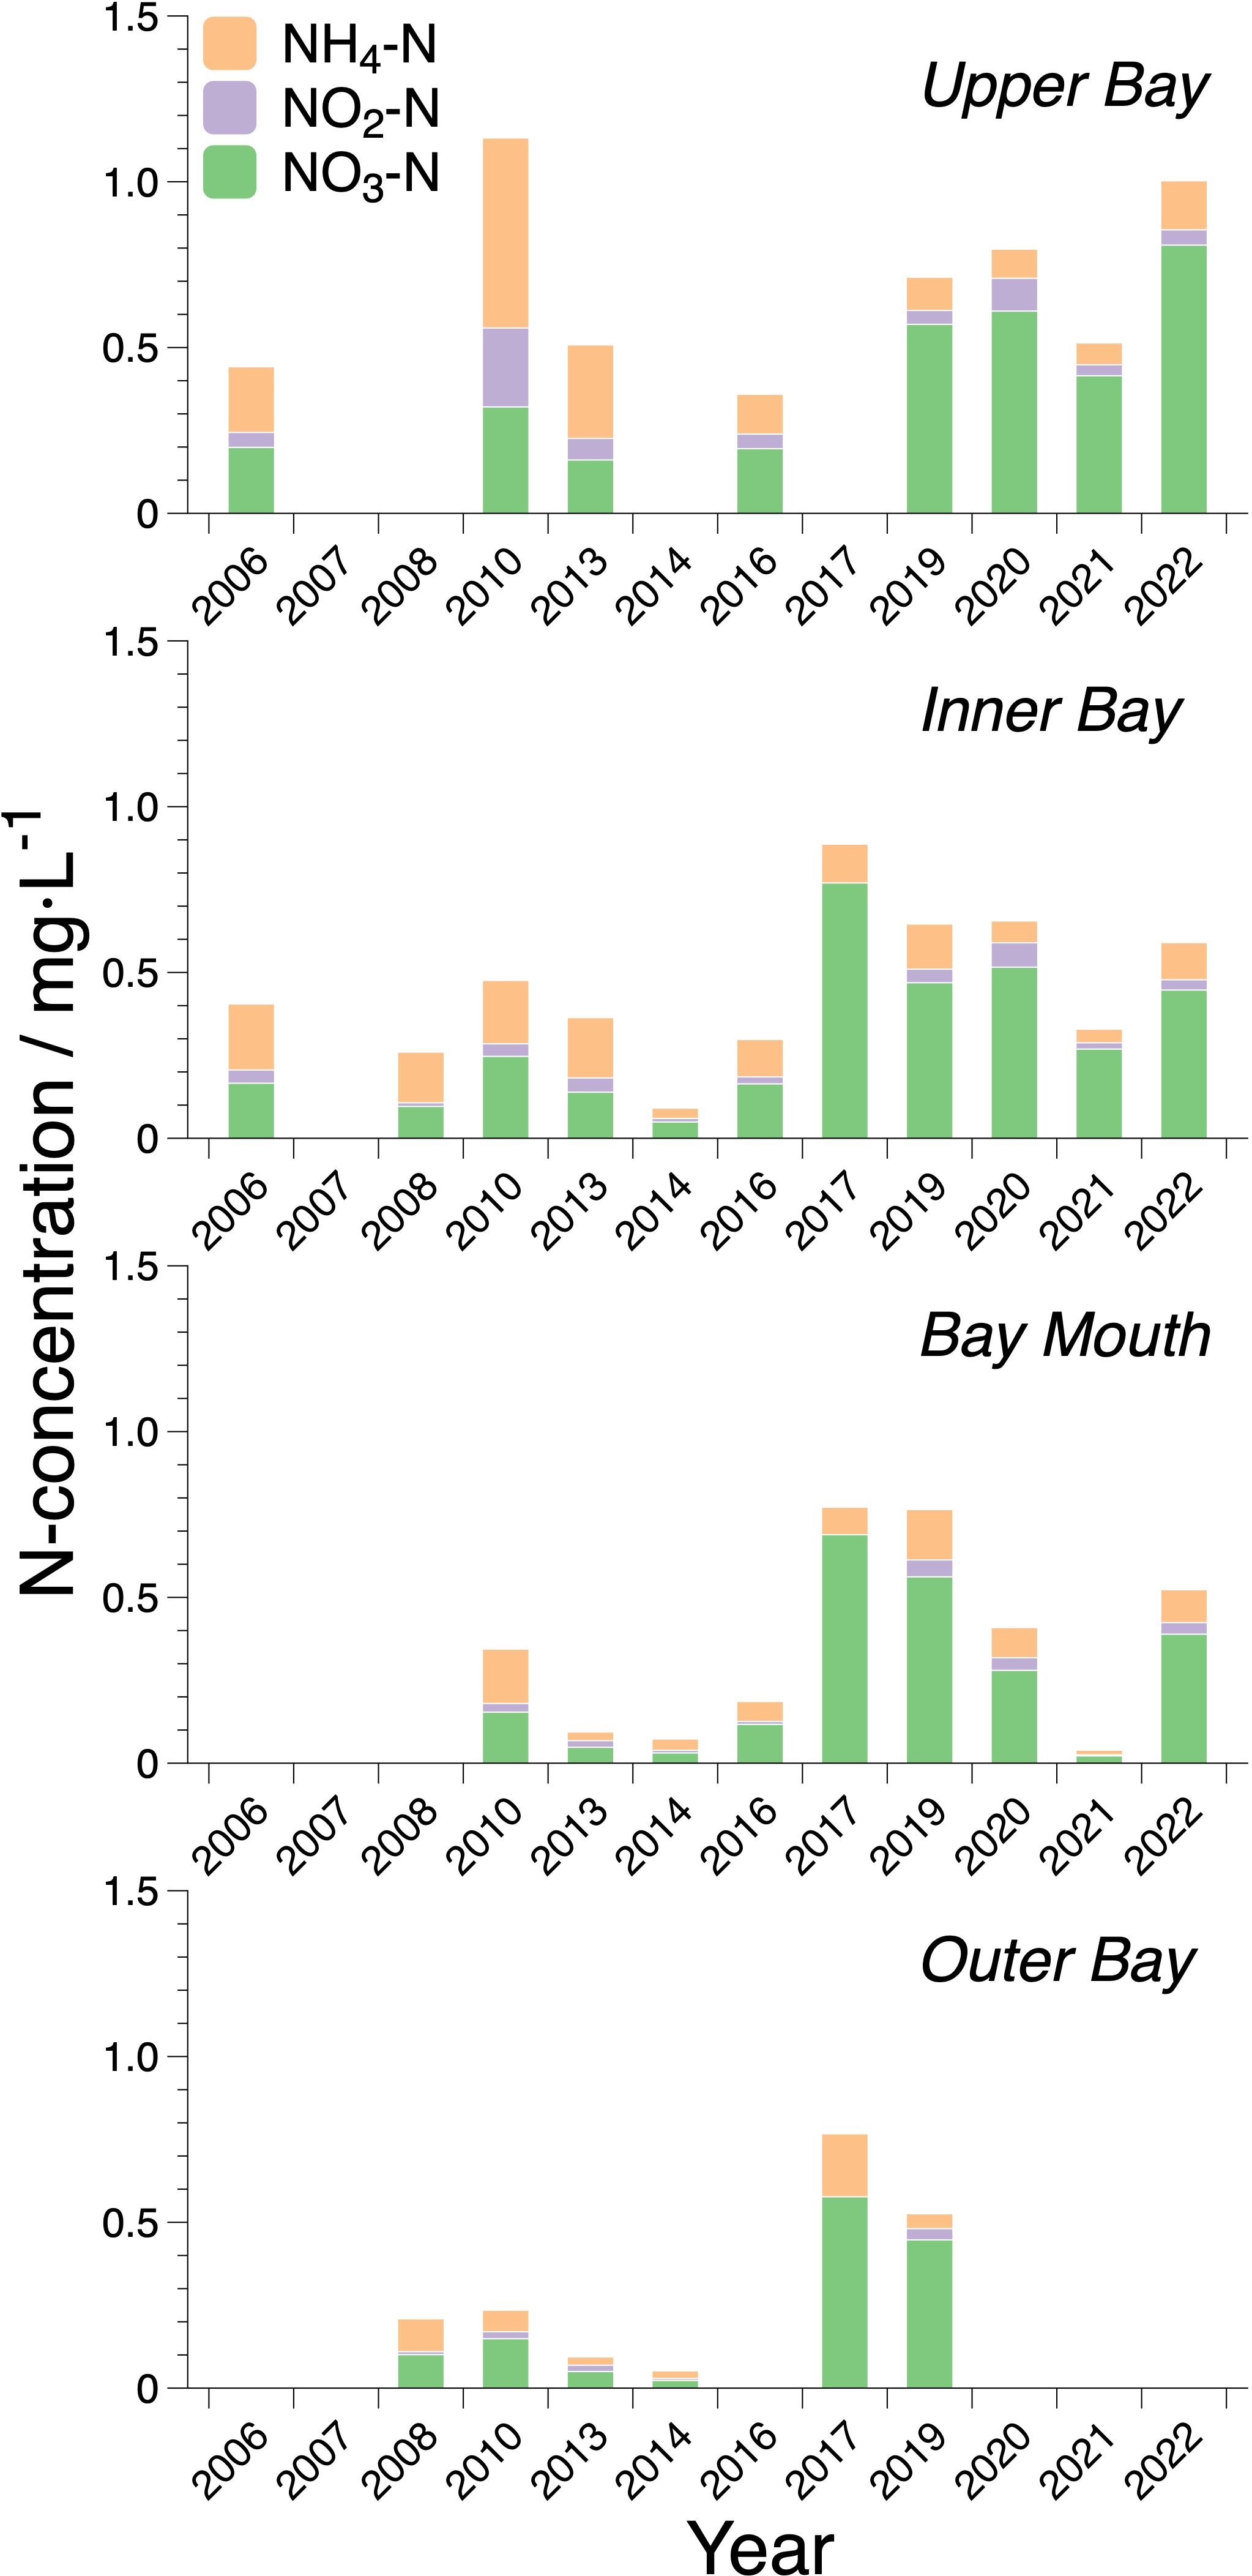
Figure 4 Interannual variation composition variations of different nitrogen components in different regions of ZJB.
From 1998 to 2005, the average concentration of COD in ZJB varied from 0.87 to 1.37 mg·L-1 (Lu et al., 2002; Zhang et al., 2009). Except for 2003, when the COD concentration was the lowest, the COD concentration changed little and fluctuated around 1 mg·L-1 in other periods. After that, the average concentration of COD ranged from 0.79 ± 0.21 mg·L-1 to 1.87 ± 0.81 mg·L-1 between 2006 and 2022 (Figure 3C). Although the average COD concentration in ZJB has not changed substantially in the past 20 years, there were some seasonal differences. During the same period, the COD was highest in spring, followed by summer, and was lowest in autumn and winter. Especially in the spring of 2013, COD was as high as 4.94 mg·L-1 in some areas and exceeded 3 mg·L-1 in most areas. In addition, COD decreased significantly in 2021, with an average of 0.79 ± 0.21 mg·L-1, which is approximately only half of the average concentrations of 1.62 ± 0.49 mg·L-1 and 1.78 ± 0.56 mg·L-1 in 2017 and 2020, respectively.
From 1998 to 2004, eutrophication levels in ZJB ranged from light (1≤E<2) to moderate (2≤E<5) (Figure 3D). The eutrophication level increased between 2005 and 2007, intensifying from south to north. Some regions even experienced severe eutrophication during this time. In 2007, waters in the upper and inner bay areas exhibited severe eutrophication. As eutrophication was gradually reduced from the inner bay to the outer bay, the bay mouth area was essentially at a mild eutrophication level (Supplementary Figure S4). Eutrophication began to improve in 2008; however, in 2010, eutrophication rapidly deteriorated, with most areas experiencing high or severe eutrophication, similar to 2007. Water quality improved once more between 2013 and 2014, and most areas were no longer affected by eutrophication, except for some areas in the upper bay that experienced light eutrophication. From 2016 to 2022, ZJB experienced prolonged periods of high or severe eutrophication, with the exception of 2021, when water quality improved and became non-eutrophic in most locations. Severe eutrophication was mainly observed in the northern upper bay during each period, whereas moderate eutrophication was observed in the inner bay.
Overall, the water quality of ZJB showed a horizontal distribution of steady improvement from north to south, with similar surface and bottom distributions. Eutrophication was the most serious in the upper bay area, followed by the inner bay area, and the water quality outside the bay was generally acceptable.
Seawater eutrophication in ZJB has been severe for a long time owing to diverse reasons in different regions (Figure 5). In the upper bay, the northernmost Suixi River carries large amounts of inorganic (including nutrients such as N and P) and organic (such as organophosphorus compounds, organic acids, and aldehydes) matters into ZJB, together with nutrients discharged from mariculture activities, leading to high concentrations of COD, N, and P (Lao et al., 2022) and long-term eutrophication, with the contribution of DIN being the largest, followed by DIP, and COD contributing the least (typically<30%; Figure 5A). Typically, phosphate and ammonia are strongly associated with urban catchments, whereas nitrate in rivers is correlated with the quantity of cultivated land in the surrounding areas (Ferrier et al., 2001). Thus, the increased use of N fertilizer in land-based farming and aquaculture contributes more than 70% of the DIN in the watershed of ZJB (Zhou et al., 2021). Eutrophication increased significantly when multiple sources and high concentrations of DIN contributed more than 40% in the upper bay. The acceleration of DIN further worsened the eutrophication. Nevertheless, as the DIP contribution increased and exceeded 60%, a decrease in DIN over the same period (Figure 3) led to an increase in the DIP contribution, resulting in a general decrease in eutrophication to moderate or mild levels. Furthermore, the increased and seasonal variations in activities, such as agricultural production and mariculture in ZJB (Zhang et al., 2022), had a significant impact on land-based inputs of DIP and DIN, resulting in the highest contribution of DIP in spring, followed by summer, and the lowest in autumn, with the opposite pattern for DIN. It should be mentioned that even with 20%–40% COD contributions, the water was typically not eutrophic during spring and summer when DIN contributions were comparatively low. This phenomenon reflects the high contribution of COD, which corresponds to a decrease in the DIN levels. Eutrophication levels increased as COD contributions decreased and DIN contributions increased. Thus, DIN is the primary factor contributing to elevated eutrophication levels in the upper bay region and is the most significant contributor to marine eutrophication (Balasuriya et al., 2022).
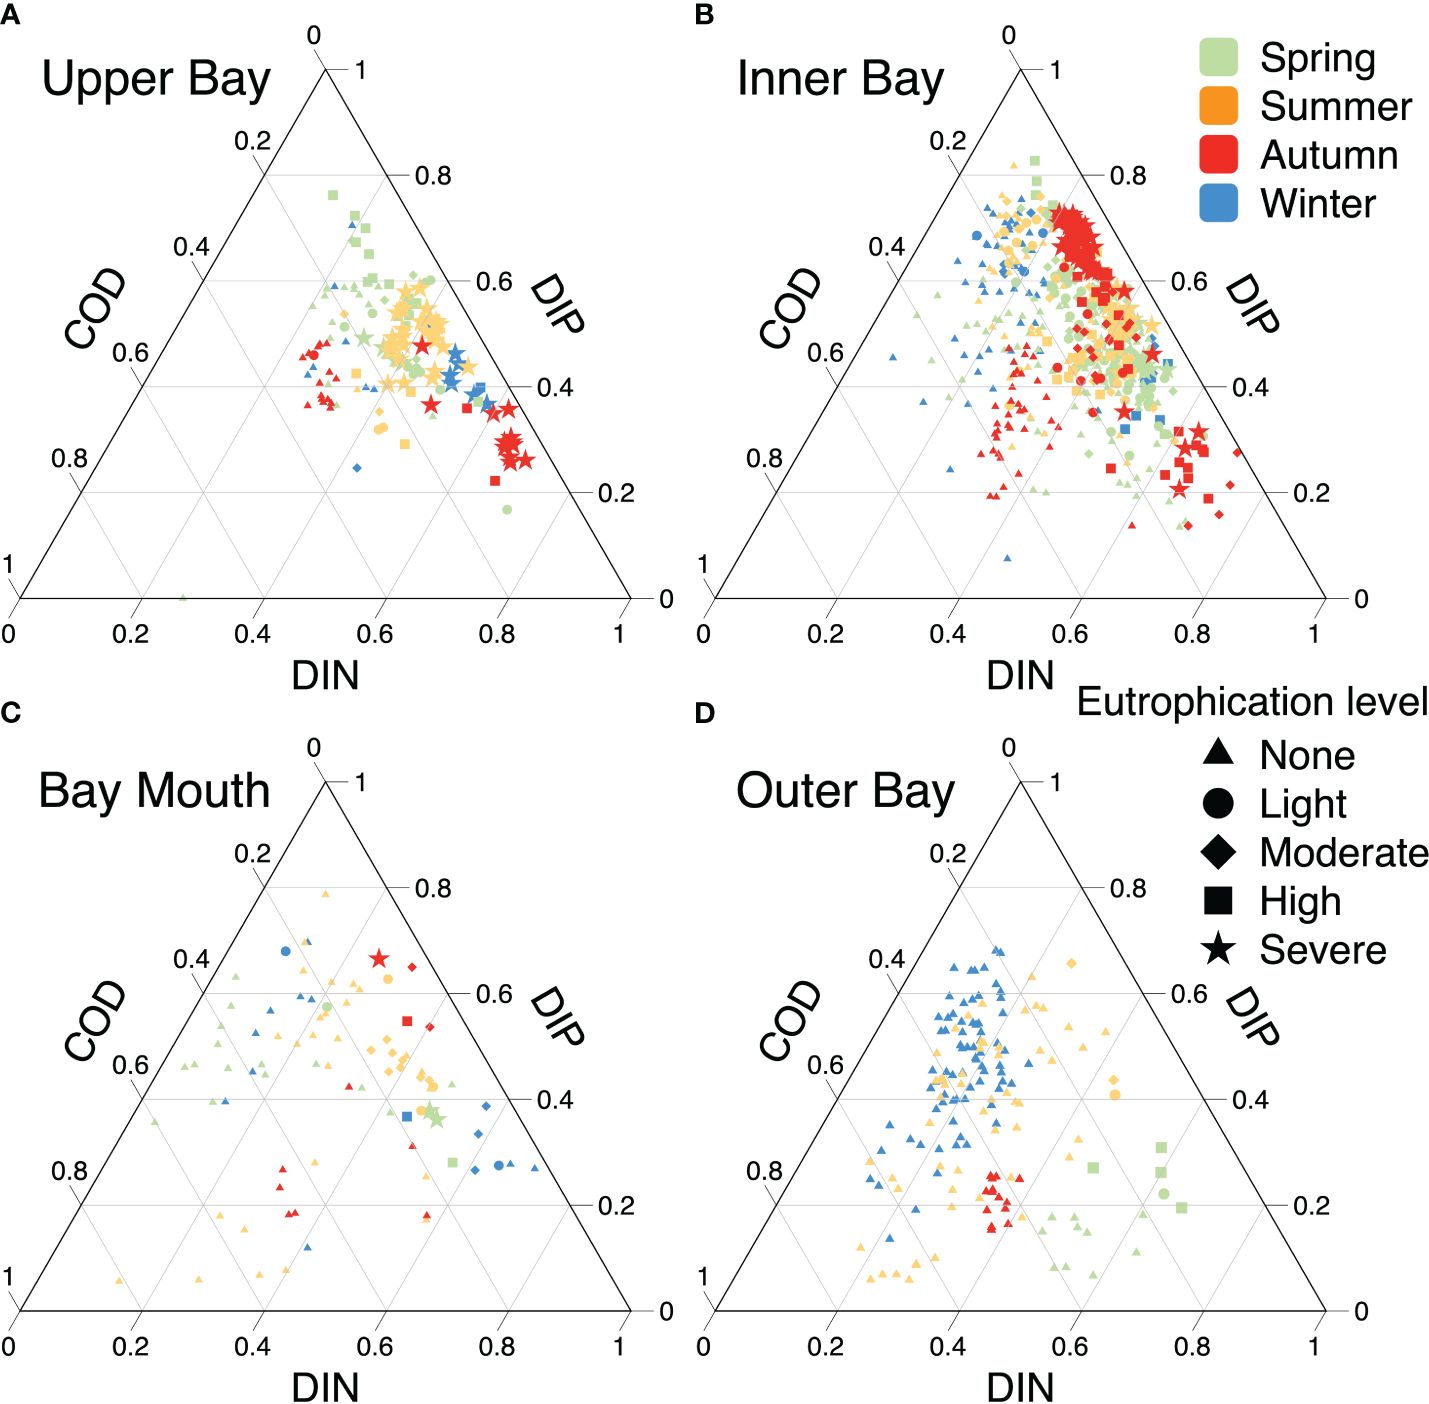
Figure 5 The contribution of water quality parameters to the variation of eutrophication level in different regions of ZJB. (A–D) represent the upper bay, inner bay, bay mouth and outer bay, respectively. Seasons are indicated by different colors. The symbols represent the different eutrophication levels in the ZJB, and the triangle with “none” indicates that seawater is not eutrophic.
In the inner bay, the water quality was predominantly non-eutrophic when the COD contributions exceeded 20%, similar to that in the upper bay; however, the pattern was different when the COD contribution decreased to below 20%. The contributions of DIN and DIP to the inner bay did not exhibit significant seasonal trends. The level of eutrophication in the inner bay was directly proportional to the concentrations of DIN or DIP, and an increase in either nutrient worsened eutrophication. This was because in addition to the waters from the upper bay, industry, aquaculture, harbor inputs, and seawater from outside the ZJB also affect the inner bay area, as do other minute inlets. This is similar to Lake Mendota and Lake Monona in Wisconsin, USA, where high concentrations of P driven by runoff from farmland and urban areas lead to eutrophication (Carpenter, 2008). Therefore, the inner bay area is less susceptible to seasonal changes in runoff than the upper bay. Consequently, the inner bay area experienced more severe and prolonged eutrophication. Moreover, when the DIN and DIP contributions are comparable, the eutrophication level is relatively mild owing to the lower levels of additional nutrients from anthropogenic discharges combined with a stable water quality environment that maintains N and P in a steady state; however, excessive terrestrial N or P discharge can lead to severe eutrophication. Therefore, DIN and DIP in the inner bay are crucial factors that lead to eutrophication.
There was no significant difference in the eutrophication level at the bay mouth because it mainly served as a water exchange channel between the inner and outer bays; however, the outer bay was significantly different from the upper and inner bays because the contribution of DIN was relatively low (<40%) and the water was not eutrophic. COD and DIP dominated the eutrophication level in the outer bay, which was consistent with the water adjacent to Hainan Island (Zhang et al., 2020a). Eutrophication increased as the contribution rate of DIN increased, indicating that DIN may be the main contributor to eutrophication.
Overall, DIN and DIP were the main controlling factors leading to eutrophication in ZJB, but the key contributors varied by area and time period. Water quality management also needs to adapt to local conditions.
Tidal currents drive the movement of water masses, facilitating the mixing of nutrient-rich freshwater with external high-salinity seawater (Lao et al., 2022). This mixing helps redistribute nutrients throughout the bay. The analysis of nutrient variations over different seasons during high and low tides across multiple years depicted unique patterns across diverse regions of ZJB.
The results indicated that in the upper bay, DIN and DIP levels were higher during low tide in the wet season (such as summer), but higher during high tide in the dry season (such as spring) (Figure 6). This may be attributed to the complex topography of ZJB, which has a significant impact on tidal flows. During high tide, the upper bay channel narrows, causing tidal energy to accumulate (Wang et al., 2021b) and resulting in high-salinity seawater entering the upper reaches and mixing with nutrient-rich freshwater (Lao et al., 2022). During low tide, high-nutrient water is reenergized through narrow channels and enters the inner bay, where it is thoroughly mixed. This tidal movement increases the nutrient content, resulting in the upper bay having a lower nutrient content at high tide than at low tide. The inner bay is a vital mixing zone, receiving low-salinity and high-nutrient water from the upper bay and high-salinity and low-nutrient water from the outer bay. In addition, the discharge of domestic and industrial effluents and port activities introduce a considerable amount of nutrients, thus the tidal influence on the inner bay is minimal compared to that on the upper bay. Moreover, the inner bay plays an important role in water exchange, with little variation in nutrient concentrations throughout the tidal cycle because of the rapid flow, short water residence time, and high turbulent diffusion; however, the outer bay experiences pronounced nutrient peaks throughout the year at low tide, particularly in autumn, because of the concentration of tidal energy in the narrow structure at the bay mouth, which promotes continuous water exchange between the inner and outer bays. Owing to continuous tidal action, a large amount of nutrient-rich water is transported out of the bay at low tide, resulting in long-term higher nutrient concentrations in the outer bay at low tide than at high tide.
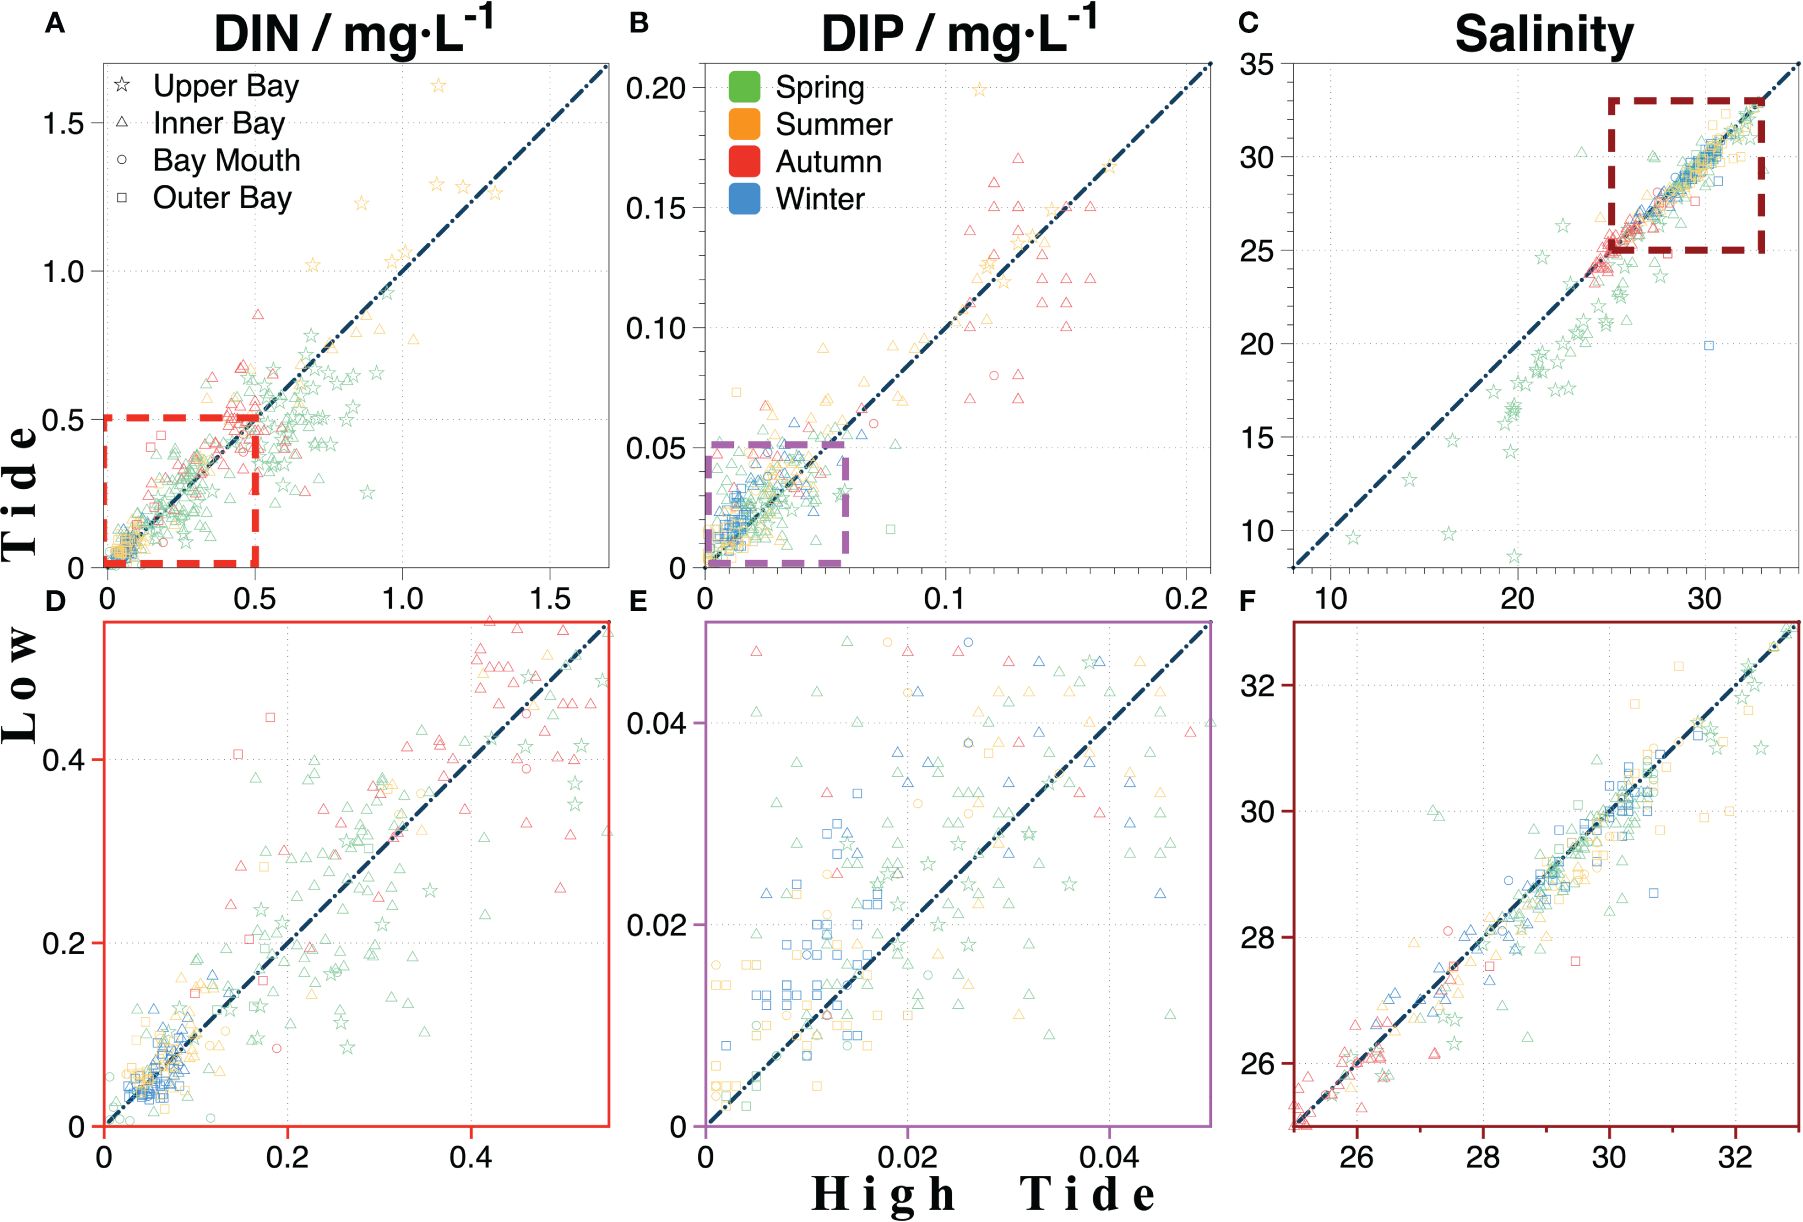
Figure 6 Tidal influence on the nutrient variation in ZJB; (A–C) are the variation of DIN, DIP, and salinity during high tide and low tide, respectively; (D, E) are the magnification diagram of DIN and DIP in (A, B) at concentrations below 0.5 and 0.05, respectively; (F) is the magnification diagram of salinity variation between 25 and 33.
The water quality in ZJB is primarily influenced by two sources: freshwater from the Suixi River in the northern upper bay and high-salinity seawater in the southeastern outer bay. This can be observed from the spatial and temporal variations of salinity in ZJB (Figure 2), which gradually increases from the upper bay to the outer bay. The variations in DO and salinity in ZJB showed similar characteristics, but COD showed the opposite trend, with low-salinity zones typically corresponding to low DO and high COD (Figure 7). The COD levels in the ZJB waters show interannual variations similar to those of domestic sewage, mariculture, and industrial wastewater discharges (Zhang et al., 2022). Elevated COD levels in seawater indicate the presence of organic matter inputs that consume oxygen during decomposition, resulting in low DO levels. This situation is expected to improve gradually with the injection of external seawater.
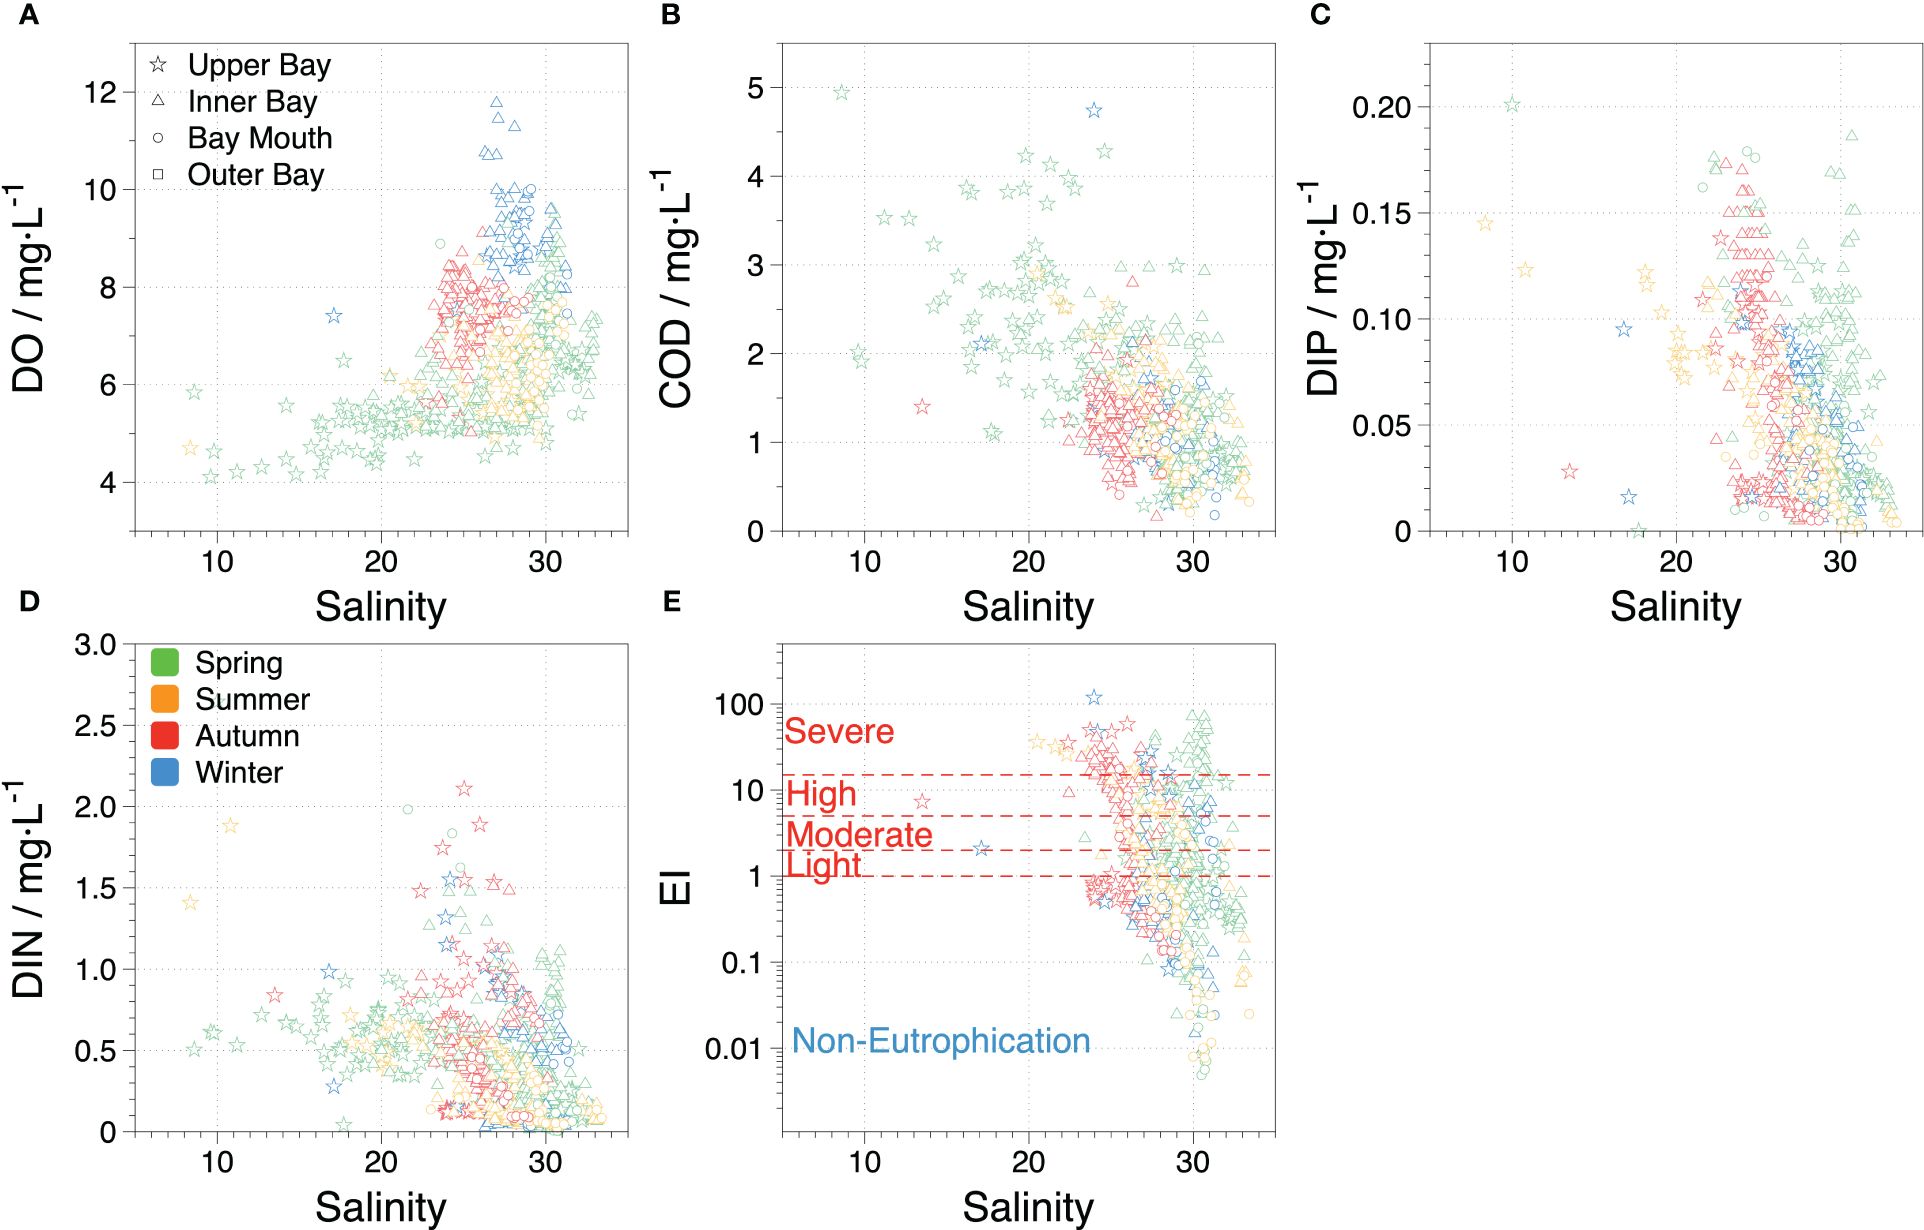
Figure 7 Effects of terrestrial inputs and physical mixing on nutrient variations; (A, B) indicate the relationships between DO, COD, and salinity in ZJB, respectively. (C, D) indicate the relationships between nutrients and salinity in ZJB, respectively. (E) indicates the relationship between eutrophication and salinity in ZJB. The colors indicate different seasons, and the symbols indicate the different areas in the ZJB.
Owing to the escalating annual intrusion of high-salinity seawater from the outer bay, seawater from outside the bay continuously infiltrates the upper bay (Lao et al., 2022). Consequently, diluted freshwater from the Suixi River only accounted for approximately 7% in summer, whereas high-salinity seawater from the outer bay continued to dominate, accounting for approximately 89%. In addition, reduced runoff resulted in diminished input from upstream rivers in autumn and winter, with river water accounting for only approximately 1%, and the intrusion of high-salinity seawater from outside the bay increasing to approximately 94% (Li et al., 2020), resulting in high salinity of approximately 25–30 throughout the interior of ZJB, with no apparent low-salinity zones in the upper bay. Although hypersaline water intrusion from the outer bay has long dominated ZJB, the contribution of nutrients from freshwater (ranging from 54% to 90%) remains significantly higher than that from the outer bay (ranging from 18% to 45%) (Lao et al., 2022). This discrepancy is primarily attributed to the Suixi River, which carries pollutants such as agricultural runoff, domestic sewage, and industrial effluent into the bay (Zhang et al., 2021; He et al., 2023), thus influencing the nutrient composition and water quality of ZJB.
In recent decades, DIN and DIP concentrations in ZJB have been negatively correlated with salinity (Figure 7), comparable to those in Tokyo Bay (Aoki et al., 2022). The primary sources of nutrients in ZJB are inputs from upstream rivers, discharge of industrial and domestic wastewater (Zhang et al., 2021), and mariculture activities in the bay (Li et al., 2020). Consequently, the nutrient levels in the bay were markedly higher than those in the seawater outside the bay. Changes in DIP levels in ZJB over the past two decades (Figure 3B) are generally consistent with changes in P fertilizer use (He et al., 2023), suggesting that upstream agricultural production is a major source of DIP in the bay; however, P discharge from agricultural production is decreasing because of the implementation of P restriction policies and the promotion of P-free products (Li et al., 2019). In 2010, the DIP levels were significantly higher in the inner bay than in the upper bay because of the transport of large amounts of phosphate from various factories and sewage discharge points (Zhang et al., 2021). In addition, DIN levels in ZJB are mainly caused by the discharge of urban agricultural fertilizers and industrial and domestic wastewater (Li et al., 2020; He et al., 2023; Zhang et al., 2023a), which is consistent with other offshore waters such as the Black Sea (Alkan et al., 2022), the Chinese coast (Wang et al., 2020) and the Elbe estuary in Germany (Dähnke et al., 2008). Freshwater runoff is the primary source of terrestrial DIN in the upper bay, with N fertilizer and soil N contributing approximately 70%, and sewage and feces contributing the remaining 30% (Li et al., 2020). Studies have identified the use of N fertilizers as a leading cause of biodiversity loss (Guignard et al., 2017). When these fertilizers are translocated into nearby creeks, they can trigger eutrophication in the affected water bodies, which can further exacerbate eutrophication in the inner bay region after mixing with inner bay waters. Therefore, when water with high concentrations of DIN and DIP in the upper bay mixes with the water in the inner bay, these nutrients can worsen the eutrophication problem in the inner bay, resulting in a decline in water quality and harm to the ecosystem.
N and P are essential biogenic elements in seawater. With carbon, they constitute the marine carbon and nitrogen cycles. During photosynthesis, phytoplankton absorb inorganic N and P at a constant ratio of 16:1, which is known as the Redfield ratio (Gruber and Deutsch, 2014). The Redfield ratio is commonly used to identify the limiting nutrient elements of marine productivity (Peñuelas et al., 2013); however, the ‘Redfield Sea’ is unlikely to be in a steady state, with N-fixing organisms in seawater having lower maximum growth rates owing to the greater energetic cost of breaking the N2 triple bond by N fixation. This results in the formation of nitrate-limited waters, and hence, seawater N limitation must be more severe than P limitation (Tyrrell, 1999); this difference can also be seen in the characteristics of long-term changes in DIN: DIP in the open ocean such as the Pacific and Indian Oceans (Olsen et al., 2016) (Figure 8). Over the last 20 years, ZJB has mostly experienced DIN: DIP ratios below 16, indicating severe nitrogen limitation, which is consistent with China’s coastal mariculture zones (DIN: DIP of approximately 7–11) (Feng et al., 2024). However, this contrasts with the long-term P-limited state in nearshore areas (Figure 8), such as the South Yellow Sea (Chen et al., 2023), Pearl River Estuary (Yao et al., 2022), Chinese rivers (Feng et al., 2024), and offshore central Japan (Katazakai and Zhang, 2021). These coastal waters receive a substantial amount of nutrients from land inputs. N is significantly more abundant than P and frequently exceeds the aquatic carrying capacity, leading to a shift from weak oceanic N limitation to stronger coastal P limitation. Nevertheless, in contrast to other coastal regions, nearshore mariculture areas have developed distinct nutrient structures owing to anthropogenic interventions in mariculture activities and associated effluent discharge, despite also being influenced by land inputs. In mariculture, farmed organisms typically require more P than N, resulting in the amount of phosphorus fertilizer being typically higher than that of N fertilizer; however, excess fertilizer remaining in the water may have a negative impact on the nutrient structure of the mariculture area, leading to long-term N limitation. Therefore, P is continuously in excess during photosynthesis in ZJB, which indirectly explains why the correlation between DIP and AOU is not as significant as that between DIN and AOU (Figure 9).
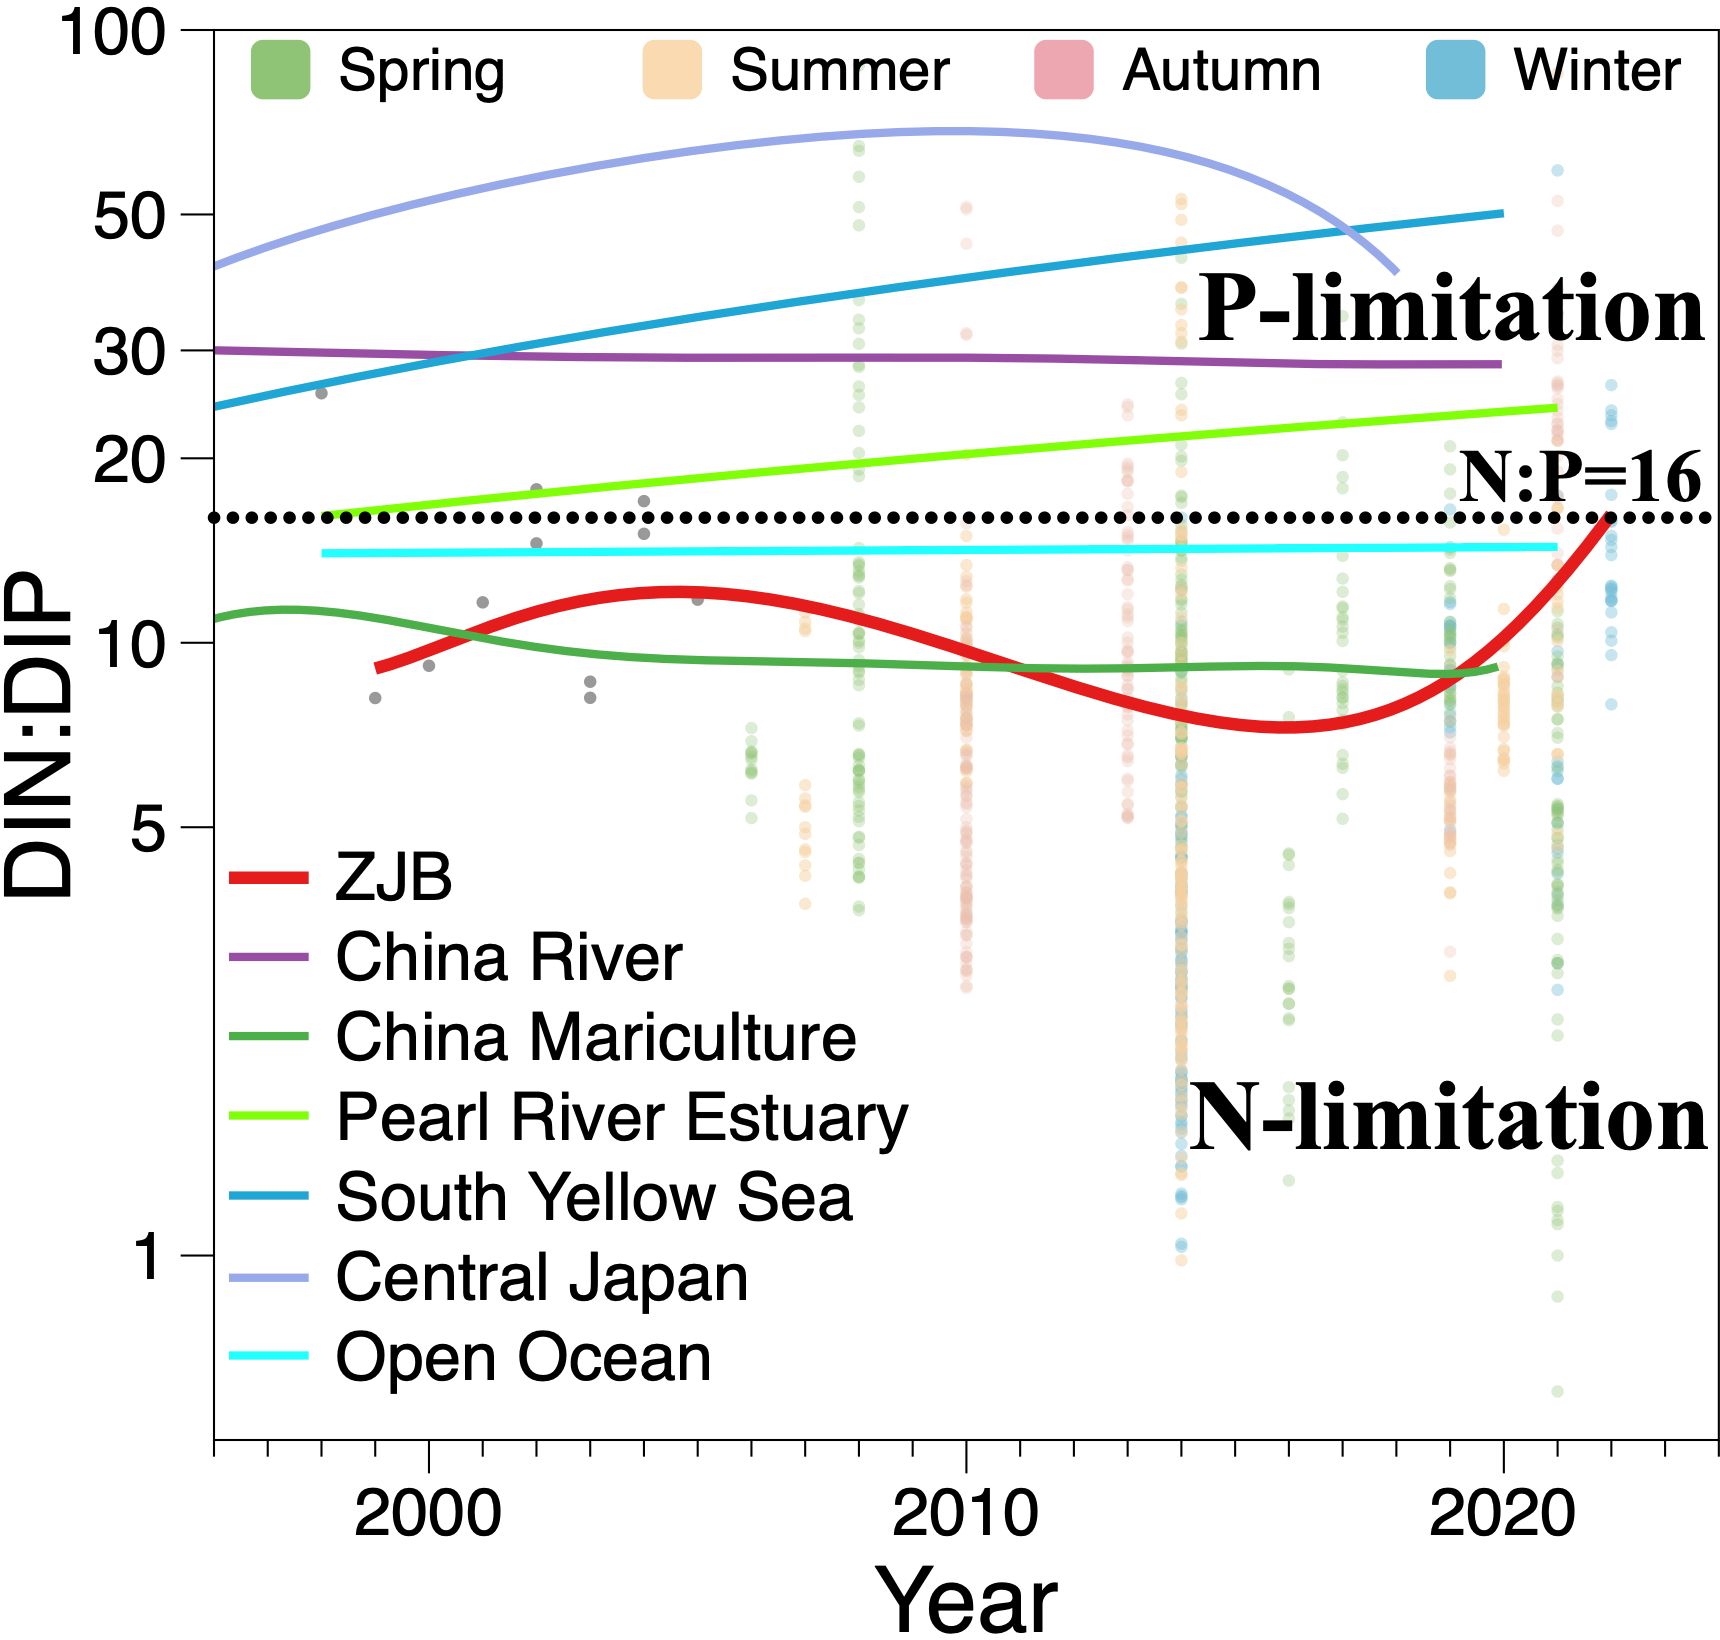
Figure 8 The variations in DIN: DIP in different aquatic environments across decades. The colored dots are the seasonal investigation data, and the gray dots during 1998–2005 are yearly averaged values from references shown in Table 1. The colored lines represent DIN: DIP variations in different worldwide aquatic environments, where the red line indicates the main variation trend in ZJB; the Chinese river and coastal mariculture data are from Feng et al. (2024), the Pearl River Estuary close to Hongkong coastal area data are from Yao et al. (2022), the South Yellow Sea data are from Chen et al. (2023), the data of Central Japan are from Katazakai and Zhang (2021), and the data of the open ocean including the Pacific Ocean and India Ocean are from Olsen et al. (2016).
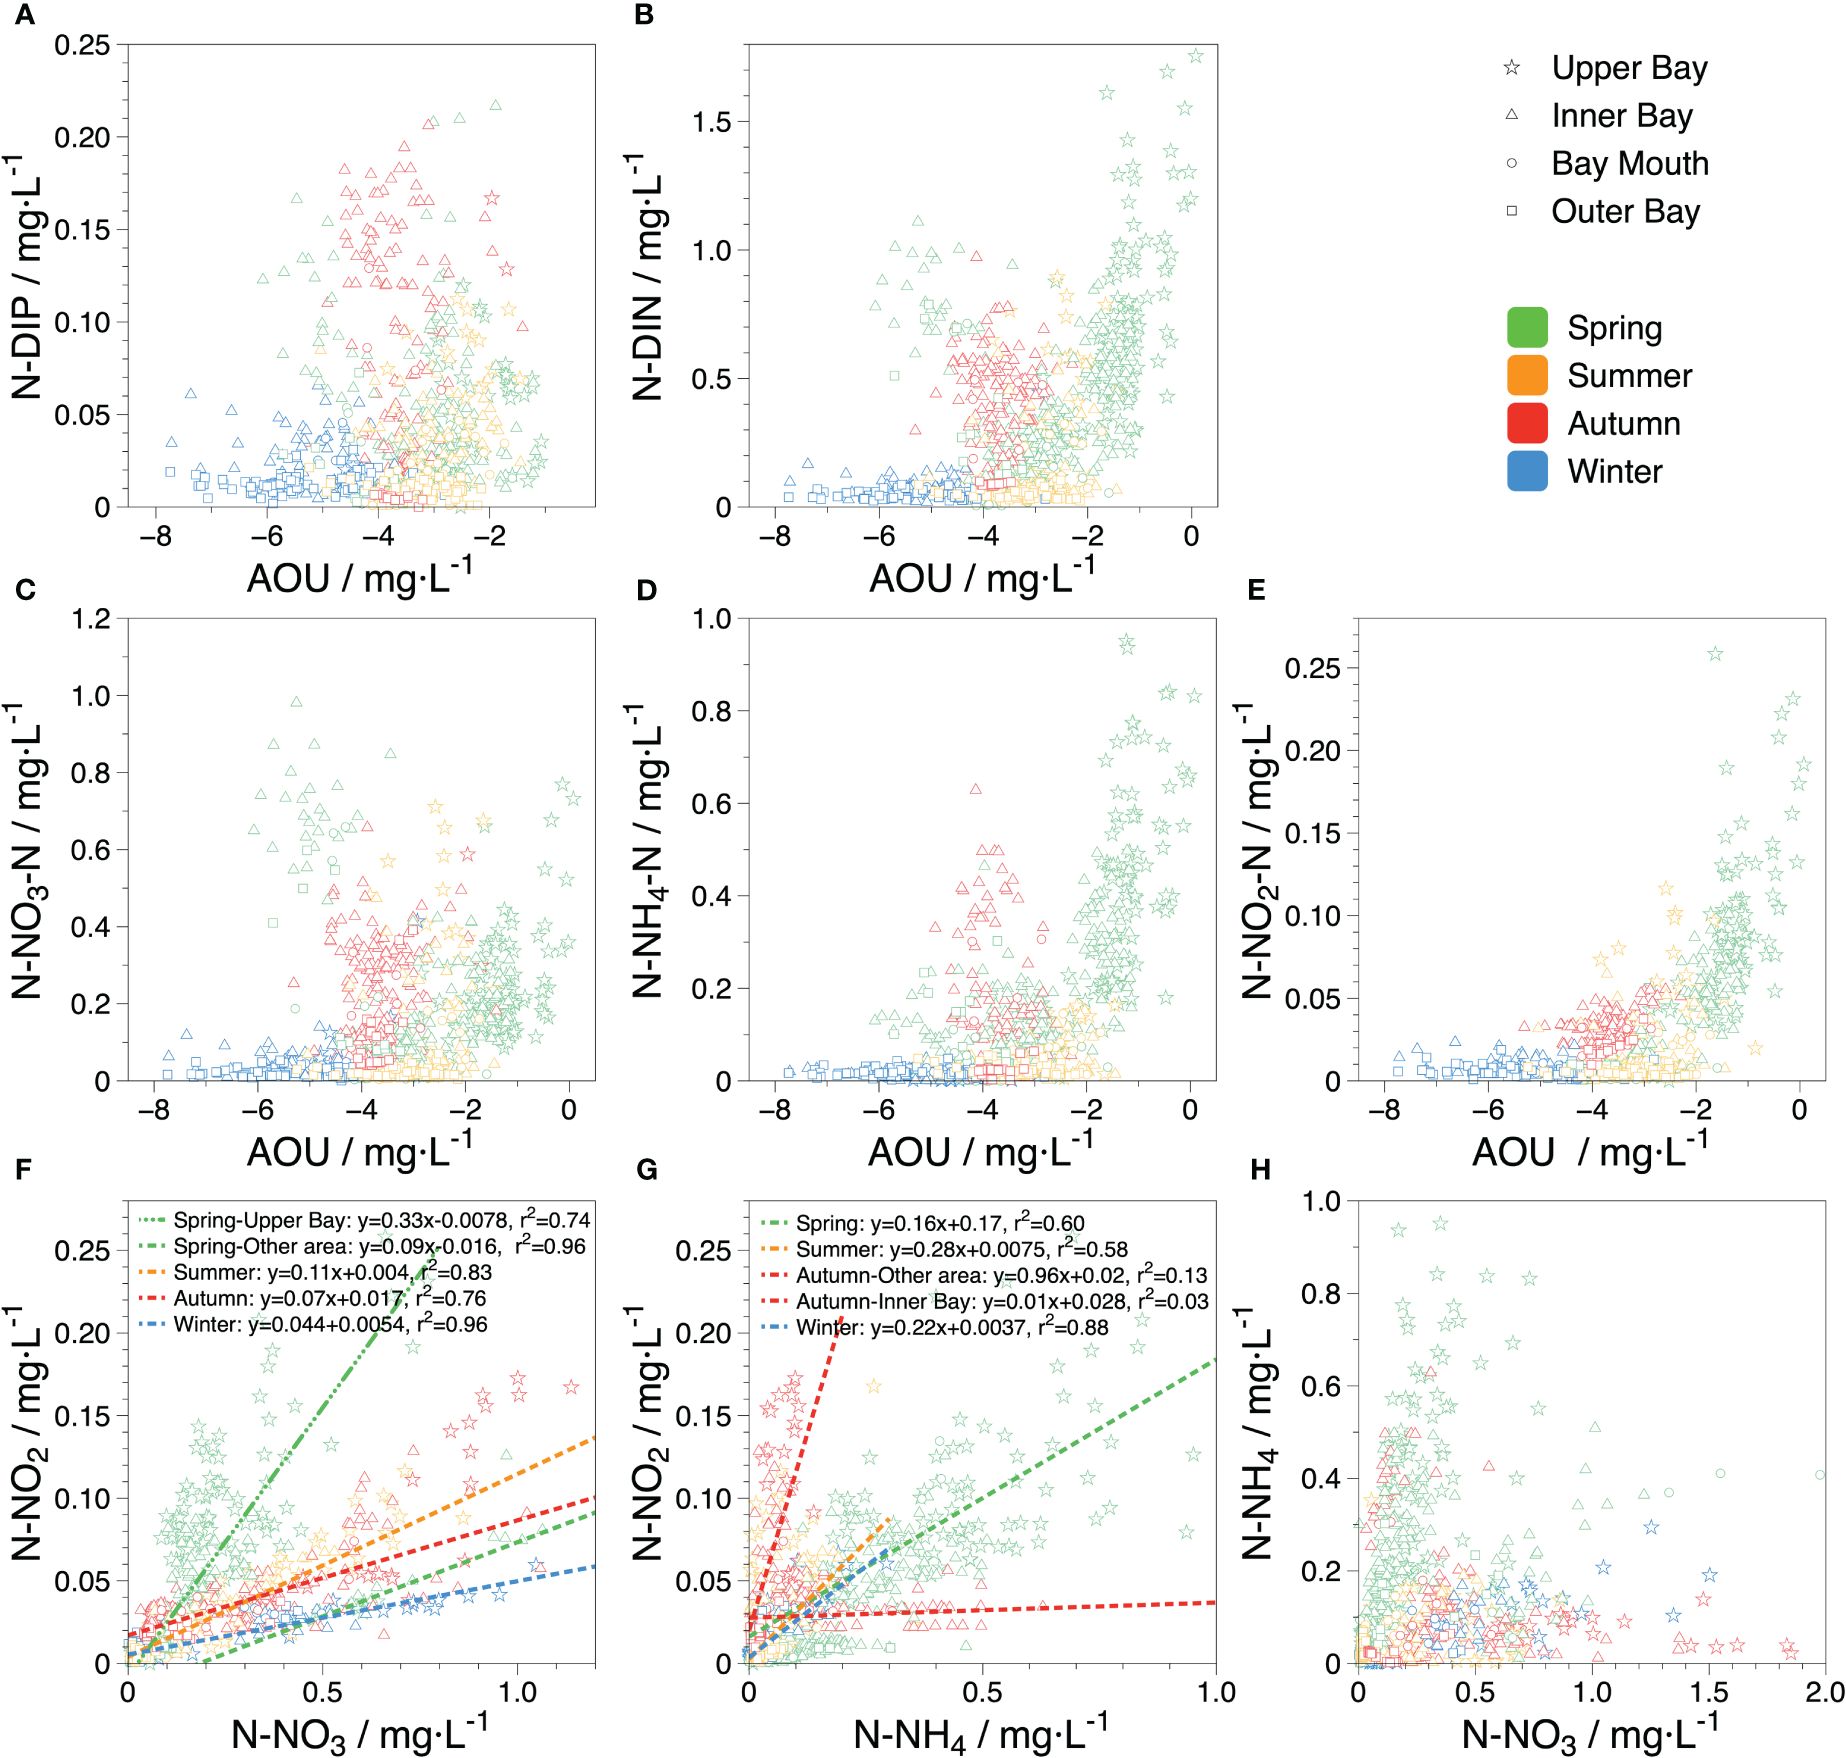
Figure 9 Relationship between different salinity-normalized nutrients and AOU in the seawater of ZJB. (A) indicates the relationship between N-DIP and AOU; (B) indicates the relationship between N-DIN and AOU; (C–E) indicate the relationship between different forms of salinity-normalized nitrogen and AOU; (F, G) indicate the relations of salinity-normalized nitrate vs nitrite and ammonia vs nitrite; (H) indicates the relations between nitrate and ammonia.
In addition to photosynthesis, biologically active processes involving N and P (such as nitrification, denitrification, and heterotrophic and anaerobic oxidation of ammonia) are significantly influenced by various factors, with DO being one of the most significant. The seawater in ZJB was oversaturated with DO for a prolonged period according to the decadal negative concentration of AOU. AOU was lowest during winter (-5.26 ± 0.98 mg·L-1) and highest in spring (-2.63 ± 1.18 mg·L-1). The biological activities of ZJB are predominantly nitrification and photosynthesis because adequate DO in water prevents denitrification. For the AOU, the DO deviated from saturation for two reasons. First, the effect of land-based inputs. Low-oxygen, nutrient-rich freshwater from upstream rivers was physically mixed with high-salinity, oxygen-rich seawater from the inner bay (Figure 7A), as previously discussed. The second factor was the biological activity of nutrients in seawater at different DO concentrations. To mitigate the effects of salinity changes, we analyzed the relationship between salinity-normalized nutrients and the AOU, as shown in Figure 9. High concentrations of both N-DIP and N-DIN corresponded to high AOU levels.
The region with high N-DIN values was primarily located in the upper bay during the spring (Figure 9B). And the ammonia was the highest in the upper bay compare to the whole ZJB, especially in 2010 (Figure 4). Phytoplankton preferentially assimilates high concentrations of ammonia because it requires less energy and does not undergo redox reactions (Zehr and Ward, 2002). Although nitrifying microorganisms (converting NH4+ to NO3- under aerobic conditions) are partially inhibited by intense light owing to shallow water depths (Gruber, 2008), elevated levels of suspended particulate matter from riverine sources may serve dual roles, providing not only the substrate but also a protective environment for nitrifying organisms when combined with high levels of ammonia and sufficient nighttime hours. Nitrification is a key pathway for ammonia depletion, as demonstrated by the variation in nitrite content in ZJB. Nitrite, an important intermediate product of nitrate assimilation, nitrification, and denitrification (Gruber, 2008), has a short turnover time of only 3–7 days in seawater (Lipschultz et al., 1996), produced and immediately consumed during biological activity. Significant correlations between nitrite, normalized nitrate, and nitrite versus normalized ammonia were observed in the upper bay during spring (Figures 9F, G), indicating that large amounts of nitrite intermediates were produced by phytoplankton photosynthesis and nitrification by ammonia-oxidizing microorganisms. After offsetting the oxygen production (photosynthesis) and consumption (nitrification) processes, the DO in the seawater remained oversaturated, indicating that ammonia was also an important N source for photosynthesis. In other areas of ZJB, nitrate was significantly higher than ammonia, and the correlation between nitrate and nitrite (r2 = 0.96) was stronger than that in the upper bay area (r2 = 0.74); nitrite was mainly generated by nitrate through photosynthesis. Furthermore, the decrease in ammonia resulted in a lower oxygen consumption level by nitrification, causing the AOU to be significantly lower than that of the upper bay area and the DO to increase significantly.
During the other seasons, ammonia was considerably lower than nitrate, and nitrite was reduced. Higher concentrations of nitrate were still used for photosynthesis, and weaker nitrification due to less ammonia resulted in lower AOU levels than in spring. Additionally, although the inner bay simultaneously exhibited high levels of nitrate and ammonia, there was no correlation between ammonia and nitrite levels. In addition, although ammonium inhibits the uptake of nitrate by phytoplankton, the chronically lower levels of ammonia in ZJB were not sufficient to inhibit nitrate uptake or have toxic effects on phytoplankton growth (Domingues et al., 2011). Therefore, nitrification occurred mainly in the upper bay area, whereas in the rest of the bay, nitrate was the primary nitrogen source for photosynthesis. Moreover, phytoplankton growth and biomass may be limited by low temperatures during winter (Cullen, 1991); however, seawater temperature during winter ranged between 15–20°C owing to geographical characteristics of ZJB (Figure 2), which allowed phytoplankton to efficiently uptake nitrate (Figure 9F; nitrate vs nitrite, r2 = 0.96). Furthermore, photosynthetic oxygen production exceeded nitrification oxygen consumption owing to the inhibition of ammonia-oxidizing microorganisms at lower temperatures, resulting in the lowest AOU and the highest degree of water DO supersaturation.
Over the past 20 years, ZJB has experienced a series of marine engineering activities that have remarkably impacted the marine ecological environment. Large-scale clean-ups and demolitions of marine aquaculture pile foundations, illegal fishing facilities, and navigation obstructions occurred in ZJB in 2005 and 2011–2012, thereby improving the unstable and complex aquaculture environment of ZJB. By reducing excessive external nutrient loading as a primary measure of adaptive management (Cooke et al., 2016), N and P concentrations in the water column of ZJB decreased significantly in the following years (Figures 3A, B). This suggests that the reduction in unregulated aquaculture activities led to an improvement in the excess discharge of nitrogen and phosphorus fertilizers during the aquaculture process, further verifying the effect of mariculture on the nutrient concentration and structure of seawater in ZJB; however, the COD concentration increased slightly (Figure 3C), indicating that the source of COD in the water was less related to agricultural activities and was still dominated by land-based pollution discharge.
In addition to marine environment improvement works, such as clean-up and demolition, a series of sea-related projects exacerbated marine environment problems. Around 2008, the Zhanjiang municipal government implemented the “One Bay, Two Banks” plan and started implementing the ZJB long-distance navigation channel expansion dredging project. In addition, 300,000 tons and 400,000 tons worth of navigation channel dredging and expansion activities were conducted in the ZJB during 2018–2021. These dredging and reclamation activities resulted in the resuspension of deep-seabed sediments in the water column. Although sandy sediments can quickly return to the seabed, fine-grained sediments (e.g., silt and mud) remain suspended longer. Nutrient concentrations are higher in surface sediments (the upper 15 cm) than in bottom sediments because deeper sediments are in a hypoxic environment that favors denitrification processes (Galloway et al., 2004). Consequently, sediments that return to the water column under anoxic conditions may undergo nitrate reduction, particularly in areas with high turbidity (Jickells, 2005); however, DO in ZJB remained supersaturated, and no instances of hypoxia or anoxia were observed during the monitoring period. Consequently, denitrification is inhibited when anoxic sediments are resuspended in the water column in an oxygen-rich environment, and the release of nutrients from the sediment is accelerated by drastic dredging works (Chen et al., 2021). The long duration of dredging projects will result in the dissolution of large quantities of soluble regenerative nutrients into seawater, leading to an increase in N and P concentrations in the water column (Lohrer and Wetz, 2003). In addition, the inner bay area was already subjected to high nutrient concentrations from multiple sources, which led to a marked increase in nutrients during the corresponding period. This was consistent with the findings of a dredging project in Lake Yuehu (Zhang et al., 2010). Furthermore, the increased density of harbor vessel traffic following channel expansion dredging also contributes to nutrient input (Raudsepp et al., 2019), thus having long-term effects on water quality. Consequently, N, P, and COD levels in ZJB increased substantially between 2008–2010 and 2018–2021 (Figure 3), indicating high or even severe eutrophication. Moreover, the Zhanjiang government conducted a large-scale interception and remediation project in 2020 that resulted in significant reductions in seaward flows from several sewage outfalls. Therefore, the N and P concentrations were significantly reduced in summer when the runoff was high; however, when the runoff was reduced in autumn and winter, the effects of the dredging projects in the bay and other impacts were reflected again, with the N and P concentrations and eutrophication levels in ZJB increasing. Therefore, marine projects seriously affect the nutrient concentration and structural composition of ZJB and aggravate eutrophication.
Nutrients in ZJB seawater have significantly increased during the previous 20 years, leading to long-term eutrophication. As a typical semi-closed bay, the upper and inner bays are under high or severe eutrophication, mainly caused by DIN and DIP; however, the eutrophication level in the outer bay is typically low, and the main contributors are COD and DIP. In addition, tidal action, biological activity, land inputs, and marine engineering strongly influence nutrient structure and concentration. Driven by tidal action, freshwater in the northern part of the upper bay transports large amounts of terrestrial nutrients into the bay. It mixes with high-salinity seawater from the outer bay, promoting nutrient redistribution in the inner bay. Furthermore, the DO in ZJB remained supersaturated for a long period because of the vigorous photosynthesis produced by the abundance of nutrients. Moreover, because of mariculture and related wastewater discharge, ZJB has been in a state of excess P and N limitation for a long time, affecting primary productivity. In addition, marine projects in ZJB have substantially impacted the aquatic environment. Eliminating illegal aquaculture and launching aquaculture tailwater treatment can significantly improve water quality, whereas dredging waterways and other projects can exacerbate the deterioration of water quality. Unfortunately, some analyses were limited by missing or inconsistent historical data and a lack of direct evidence of nutrient use through biological data, which needs to be further investigated in future studies.
The raw data supporting the conclusions of this article will be made available by the authors, without undue reservation.
HL: Methodology, Writing – original draft, Conceptualization. JXZ: Supervision, Writing – review & editing, Data curation, Funding acquisition. JBZ: Supervision, Writing – review & editing, Methodology. PZ: Data curation, Investigation, Writing – review & editing. XD: Writing – review & editing. ZW: Data curation, Writing – review & editing. CL: Writing – review & editing, Data curation, Investigation. CQL: Writing – review & editing, Data curation, Investigation. DW: Investigation, Writing – review & editing. YL: Investigation, Writing – review & editing. JC: Investigation, Writing – review & editing.
The author(s) declare financial support was received for the research, authorship, and/or publication of this article. This work was supported by Research and Development Projects in Key Areas of Guangdong Province (2020B1111020004), Science and Technology Projects in Guangzhou (202201011334), Guangdong Basic and Applied Basic Research Foundation (2023A1515012769).
We are grateful for the reviewers’ careful review and valuable suggestions to improve the manuscript. We thank all members of the research team and others who participated in this study.
The authors declare that the research was conducted in the absence of any commercial or financial relationships that could be construed as a potential conflict of interest.
All claims expressed in this article are solely those of the authors and do not necessarily represent those of their affiliated organizations, or those of the publisher, the editors and the reviewers. Any product that may be evaluated in this article, or claim that may be made by its manufacturer, is not guaranteed or endorsed by the publisher.
The Supplementary Material for this article can be found online at: https://www.frontiersin.org/articles/10.3389/fmars.2024.1373716/full#supplementary-material
Alkan A., Serdar S., Fi̇Dan D., Akbaş U., Zengi̇N B., Kiliç M. B. (2022). Spatial, temporal, and vertical variability of nutrients in the Southeastern Black Sea. Chemosphere 302, 134809. doi: 10.1016/j.chemosphere.2022.134809
Andersen J. H., Carstensen J., Conley D. J., Dromph K., Fleming-Lehtinen V., Gustafsson B. G., et al. (2017). Long-term temporal and spatial trends in eutrophication status of the Baltic Sea: Eutrophication in the Baltic Sea. Biol. Rev. 92, 135–149. doi: 10.1111/brv.12221
Aoki K., Shimizu Y., Yamamoto T., Yokouchi K., Kishi K., Akada H., et al. (2022). Estimation of inward nutrient flux from offshore into semi-enclosed sea (Tokyo Bay, Japan) based on in-situ data. Estuar. Coast. Shelf Sci. 274, 107930. doi: 10.1016/j.ecss.2022.107930
Balasuriya B. T. G., Ghose A., Gheewala S. H., Prapaspongsa T. (2022). Assessment of eutrophication potential from fertiliser application in agricultural systems in Thailand. Sci. Total Environ. 833, 154993. doi: 10.1016/j.scitotenv.2022.154993
Benson B. B., Krause D. (1984). The concentration and isotopic fractionation of oxygen dissolved in freshwater and seawater in equilibrium with the atmosphere1: Oxygen solubility in seawater. Limnol. Oceanogr. 29, 620–632. doi: 10.4319/lo.1984.29.3.0620
Beusen A. H. W., Bouwman A. F., Van Beek L. P. H., Mogollón J. M., Middelburg J. J. (2016). Global riverine N and P transport to ocean increased during the 20th century despite increased retention along the aquatic continuum. Biogeosciences 13, 2441–2451. doi: 10.5194/bg-13-2441-2016
Beusen A. H. W., Doelman J. C., Beek L. P. H. V., Puijenbroek P. J. T. M. V., Mogollón J. M., Grinsven H. J. M. V., et al. (2022). Exploring river nitrogen and phosphorus loading and export to global coastal waters in the Shared Socio-economic pathways. Glob. Environ. Change 72, 102426–. doi: 10.1016/j.gloenvcha.2021.102426
Caffrey J. M., Chapin T. P., Jannasch H. W., Haskins J. C. (2007). High nutrient pulses, tidal mixing and biological response in a small California estuary: Variability in nutrient concentrations from decadal to hourly time scales. Estuar. Coast. Shelf Sci. 71, 368–380. doi: 10.1016/j.ecss.2006.08.015
Carpenter S. R. (2008). Phosphorus control is critical to mitigating eutrophication. Proc. Natl. Acad. Sci. 105, 11039–11040. doi: 10.1073/pnas.0806112105
Chen X., Wang Y., Sun T., Huang Y., Chen Y., Zhang M., et al. (2021). Effects of sediment dredging on nutrient release and eutrophication in the gate-controlled estuary of northern taihu lake. J. Chem. 2021, 7451832. doi: 10.1155/2021/7451832
Chen X., Wei Q., Jian H., Li D., Yu Z., Yao Q. (2023). Long-term variation in nutrients in the South Yellow Sea in response to anthropogenic inputs. Mar. pollut. Bull. 192, 115039. doi: 10.1016/j.marpolbul.2023.115039
Cheng H., Ma Q., Yang F. (2009). Level of eutrophication and phytoplankton diversity in Zhanjiang Bay. Trans. Oceanol. Limnol. 3, 121–126. doi: 10.3969/j.issn.1003-6482.2009.03.018
Conley D. J., Paerl H. W., Howarth R. W., Boesch D. F., Seitzinger S. P., Havens K. E., et al. (2009). Controlling eutrophication: nitrogen and phosphorus. Science 323, 1014–1015. doi: 10.1126/science.1167755
Cooke G. D., Welch E. B., Peterson S., Nichols S. A. (2016). Restoration and management of lakes and reservoirs. 3rd edition (Boca Raton: CRC Press). doi: 10.1201/9781420032109
Cotner J. B., Biddanda B. A. (2002). Small players, large role: microbial influence on biogeochemical processes in pelagic aquatic ecosystems. Ecosystems 5, 105–121. doi: 10.1007/s10021-001-0059-3
Cullen J. J. (1991). Hypotheses to explain high-nutrient conditions in the open sea. Limnol. Oceanogr. 36, 1578–1599. doi: 10.4319/lo.1991.36.8.1578
Dähnke K., Bahlmann E., Emeis K. (2008). A nitrate sink in estuaries? An assessment by means of stable nitrate isotopes in the Elbe estuary. Limnol. Oceanogr. 53, 1504–1511. doi: 10.4319/lo.2008.53.4.1504
Deegan L. A., Johnson D. S., Warren R. S., Peterson B. J., Fleeger J. W., Fagherazzi S., et al. (2012). Coastal eutrophication as a driver of salt marsh loss. Nature 490, 388–392. doi: 10.1038/nature11533
Domingues R. B., Barbosa A. B., Sommer U., Galvão H. M. (2011). Ammonium, nitrate and phytoplankton interactions in a freshwater tidal estuarine zone: potential effects of cultural eutrophication. Aquat. Sci. 73, 331–343. doi: 10.1007/s00027-011-0180-0
Feng Y., Xiong Y., Hall-Spencer J. M., Liu K., Beardall J., Gao K., et al. (2024). Shift in algal blooms from micro- to macroalgae around China with increasing eutrophication and climate change. Glob. Change Biol. 30, e17018. doi: 10.1111/gcb.17018
Ferrier R.o. C., Edwards A.n. C., Hirst D.a., Littlewood I.@an G., Watts C.a. D., Morris R. (2001). Water quality of Scottish rivers: spatial and temporal trends. Sci. Total Environ. 265, 327–342. doi: 10.1016/S0048-9697(00)00674-4
Fu D., Zhong Y., Chen F., Yu G., Zhang X. (2020). Analysis of dissolved oxygen and nutrients in zhanjiang bay and the adjacent sea area in spring. Sustainability 12, 889. doi: 10.3390/su12030889
Galloway J. N., Dentener F. J., Capone D. G., Boyer E. W., Howarth R. W., Seitzinger S. P., et al. (2004). Nitrogen cycles: past, present, and future. Biogeochemistry 70, 153–226. doi: 10.1007/s10533-004-0370-0
Garcia H. E., Gordon L. I. (1992). Oxygen solubility in seawater: Better fitting equations. Limnol. Oceanogr. 37, 1307–1312. doi: 10.4319/lo.1992.37.6.1307
Gruber N. (2008). “The marine nitrogen cycle,” in Nitrogen in the marine environment, 2nd edition (Burlington: Elsevier), 1–50. doi: 10.1016/B978–0-12–372522–6.00001–3
Gruber N., Deutsch C. A. (2014). Redfield’s evolving legacy. Nat. Geosci. 7, 853–855. doi: 10.1038/ngeo2308
Guignard M. S., Leitch A. R., Acquisti C., Eizaguirre C., Elser J. J., Hessen D. O., et al. (2017). Impacts of nitrogen and phosphorus: from genomes to natural ecosystems and agriculture. Front. Ecol. Evol. 5. doi: 10.3389/fevo.2017.00070
He G., Lao Q., Jin G., Zhu Q., Chen F. (2023). Increasing eutrophication driven by the increase of phosphate discharge in a subtropical bay in the past 30 years. Front. Mar. Sci. 10. doi: 10.3389/fmars.2023.1184421
Howarth R. W., Marino R. (2006). Nitrogen as the limiting nutrient for eutrophication in coastal marine ecosystems: Evolving views over three decades. Limnol. Oceanogr. 51, 364–376. doi: 10.4319/lo.2006.51.1_part_2.0364
Jiang X., Liu C., Cai J., Hu Y., Shao K., Tang X., et al. (2023). Relationships between environmental factors and N-cycling microbes reveal the indirect effect of further eutrophication on denitrification and DNRA in shallow lakes. Water Res. 245, 120572. doi: 10.1016/j.watres.2023.120572
Jickells T. (2005). External inputs as a contributor to eutrophication problems. J. Sea Res. 54, 58–69. doi: 10.1016/j.seares.2005.02.006
Katazakai S., Zhang J. (2021). A quarter-century of nutrient load reduction leads to halving river nutrient fluxes and increasing nutrient limitation in coastal waters of central Japan. Environ. Monit. Assess. 193, 573. doi: 10.1007/s10661-021-09279-5
Ke S., Zhang P., Ou S., Zhang J., Chen J., Zhang J. (2022). Spatiotemporal nutrient patterns, composition, and implications for eutrophication mitigation in the Pearl River Estuary, China. Estuar. Coast. Shelf Sci. 266, 107749. doi: 10.1016/j.ecss.2022.107749
Lao Q., Wu J., Chen F., Zhou X., Li Z., Chen C., et al. (2022). Increasing intrusion of high salinity water alters the mariculture activities in Zhanjiang Bay during the past two decades identified by dual water isotopes. J. Environ. Manage. 320, 115815. doi: 10.1016/j.jenvman.2022.115815
Li B., Bicknell K., Renwick A. (2019). Peak phosphorus, demand trends and implications for the sustainable management of phosphorus in China. Resour. Conserv. Recycl. 146, 316–328. doi: 10.1016/j.resconrec.2019.03.033
Li J., Cao R., Lao Q., Chen F., Chen C., Zhou X., et al. (2020). Assessing seasonal nitrate contamination by nitrate dual isotopes in a monsoon-controlled bay with intensive human activities in south China. Int. J. Environ. Res. Public. Health 17, 1921. doi: 10.3390/ijerph17061921
Li J., Chen F., Zhang S., Huang C., Chen C., Zhou F., et al. (2021). Origin of the particulate organic matter in a monsoon-controlled bay in southern China. J. Mar. Sci. Eng. 9, 541. doi: 10.3390/jmse9050541
Li X.-Y., Li B., Sun X.-L. (2014). Effects of a coastal power plant thermal discharge on phytoplankton community structure in Zhanjiang Bay, China. Mar. pollut. Bull. 81, 210–217. doi: 10.1016/j.marpolbul.2013.08.006
Lin G., Lin X. (2022). Bait input altered microbial community structure and increased greenhouse gases production in coastal wetland sediment. Water Res. 218, 118520. doi: 10.1016/j.watres.2022.118520
Lin X., Lu K., Hardison A. K., Liu Z., Xu X., Gao D., et al. (2021). Membrane inlet mass spectrometry method (REOX/MIMS) to measure 15N-nitrate in isotope-enrichment experiments. Ecol. Indic. 126, 107639. doi: 10.1016/j.ecolind.2021.107639
Lipschultz F., Zafiriou O. C., Ball L. A. (1996). Seasonal fluctuations of nitrite concentrations in the deep oligotrophic ocean. Deep Sea Res. Part II Top. Stud. Oceanogr. 43, 403–419. doi: 10.1016/0967-0645(96)00003-3
Lohrer A. M., Wetz J. J. (2003). Dredging-induced nutrient release from sediments to the water column in a southeastern saltmarsh tidal creek. Mar. pollut. Bull. 46, 1156–1163. doi: 10.1016/S0025-326X(03)00167-X
Lu J., Fang H., Li K., Zhang L., Li Q. (2002). Water quality investigation and assessment on seawater in zhanjiang port-bay. Environ. Prot. Transp. 23, 16–18.
Maúre E. D. R., Terauchi G., Ishizaka J., Clinton N., DeWitt M. (2021). Globally consistent assessment of coastal eutrophication. Nat. Commun. 12, 6142. doi: 10.1038/s41467-021-26391-9
Olsen A., Key R. M., Van Heuven S., Lauvset S. K., Velo A., Lin X., et al. (2016). The Global Ocean Data Analysis Project version 2 (GLODAPv2) – an internallyconsistent data product for the world ocean. Earth Syst. Sci. Data 8, 297–323. doi: 10.5194/essd-8-297-2016
Peñuelas J., Poulter B., Sardans J., Ciais P., van der Velde M., Bopp L., et al. (2013). Human-induced nitrogen–phosphorus imbalances alter natural and managed ecosystems across the globe. Nat. Commun. 4, 2934. doi: 10.1038/ncomms3934
Qin B., Zhang Y., Zhu G., Gao G. (2023). Eutrophication control of large shallow lakes in China. Sci. Total Environ. 881, 163494. doi: 10.1016/j.scitotenv.2023.163494
Raudsepp U., Maljutenko I., Kõuts M., Granhag L., Wilewska-Bien M., Hassellöv I.-M., et al. (2019). Shipborne nutrient dynamics and impact on the eutrophication in the Baltic Sea. Sci. Total Environ. 671, 189–207. doi: 10.1016/j.scitotenv.2019.03.264
Reiner S. (2021) Ocean data view. Available at: https://odv.awi.de.
Shi Y., Jia L., Zhang H. (2020). Analysis of the water residence time and influencing factors in zhanjiang bay. Environ. Sci. Technol. China 43, 17–24. doi: 10.19672/j.cnki.1003–6504.2020.11.003
Sinha E., Michalak A. M., Balaji V. (2017). Eutrophication will increase during the 21st century as a result of precipitation changes. Science 357, 405–408. doi: 10.1126/science.aan2409
Tyrrell T. (1999). The relative influences of nitrogen and phosphorus on oceanic primary production. Nature 400, 525–531. doi: 10.1038/22941
Wang J., Beusen A. H. W., Liu X., Van Dingenen R., Dentener F., Yao Q., et al. (2020). Spatially explicit inventory of sources of nitrogen inputs to the yellow sea, east China sea, and south China sea for the period 1970–2010. Earths Future 8, 1–14. doi: 10.1029/2020EF001516
Wang J., Bouwman A. F., Liu X., Beusen A. H. W., Van Dingenen R., Dentener F., et al. (2021a). Harmful algal blooms in chinese coastal waters will persist due to perturbed nutrient ratios. Environ. Sci. Technol. Lett. 8, 276–284. doi: 10.1021/acs.estlett.1c00012
Wang Y., Liu D., Xiao W., Zhou P., Tian C., Zhang C., et al. (2021c). Coastal eutrophication in China: Trend, sources, and ecological effects. Harmful Algae 107, 102058. doi: 10.1016/j.hal.2021.102058
Wang S., Zhou F., Chen F., Meng Y., Zhu Q. (2021b). Spatiotemporal distribution characteristics of nutrients in the drowned tidal inlet under the influence of tides: A case study of zhanjiang bay, China. Int. J. Environ. Res. Public. Health 18, 2089. doi: 10.3390/ijerph18042089
Yao H., Wang J., Han Y., Jiang X., Chen J. (2022). Decadal acidification in a subtropical coastal area under chronic eutrophication. Environ. pollut. 293, 118487. doi: 10.1016/j.envpol.2021.118487
Zehr J. P., Ward B. B. (2002). Nitrogen cycling in the ocean: new perspectives on processes and paradigms. Appl. Environ. Microbiol. 68, 1015–1024. doi: 10.1128/AEM.68.3.1015-1024.2002
Zhang P., Chen Y., Peng C., Dai P., Lai J., Zhao L., et al. (2020a). Spatiotemporal variation, composition of DIN and its contribution to eutrophication in coastal waters adjacent to Hainan Island, China. Reg. Stud. Mar. Sci. 37, 101332. doi: 10.1016/j.rsma.2020.101332
Zhang H., Cheng W., Qiu X., Feng X., Gong W. (2017). Tide-surge interaction along the east coast of the Leizhou Peninsula, South China Sea. Cont. Shelf Res. 142, 32–49. doi: 10.1016/j.csr.2017.05.015
Zhang J., Fu M., Zhang P., Sun D., Peng D. (2023a). Unravelling nutrients and carbon interactions in an urban coastal water during algal bloom period in zhanjiang bay, China. Water 15, 900. doi: 10.3390/w15050900
Zhang P., Peng C., Zhang J., Zhang J., Chen J., Zhao H. (2022). Long-term harmful algal blooms and nutrients patterns affected by climate change and anthropogenic pressures in the zhanjiang bay, China. Front. Mar. Sci. 9. doi: 10.3389/fmars.2022.849819
Zhang P., Peng C.-H., Zhang J.-B., Zou Z.-B., Shi Y.-Z., Zhao L.-R., et al. (2020b). Spatiotemporal urea distribution, sources, and indication of DON bioavailability in zhanjiang bay, China. Water 12, 633. doi: 10.3390/w12030633
Zhang X., Yao C., Zhang B., Tan W., Gong J., Wang G., et al. (2023b). Dynamics of benthic nitrate reduction pathways and associated microbial communities responding to the development of seasonal deoxygenation in a coastal mariculture zone. Environ. Sci. Technol. 57, 15014–15025. doi: 10.1021/acs.est.3c03994
Zhang L., Yu L., Tang M. (2009). Eutrophication and red tide in coastal waters of Zhanjiang port. Water Resour. Prot. 25, 50–54.
Zhang J., Zhang Y., Zhang P., Li Y., Li J., Luo X., et al. (2021). Seasonal phosphorus variation in coastal water affected by the land-based sources input in the eutrophic Zhanjiang Bay, China. Estuar. Coast. Shelf Sci. 252, 107277. doi: 10.1016/j.ecss.2021.107277
Zhang S., Zhou Q., Xu D., Lin J., Cheng S., Wu Z. (2010). Effects of sediment dredging on water quality and zooplankton community structure in a shallow of eutrophic lake. J. Environ. Sci. 22, 218–224. doi: 10.1016/S1001-0742(09)60096-6
Zhou X., Chen C., Chen F., Song Z. (2021). Changes in net anthropogenic nitrogen input in the watershed region of Zhanjiang Bay in south China from 1978 to 2018. Environ. Dev. Sustain. 23, 17201–17219. doi: 10.1007/s10668-021-01335-x
Zhou F., Lu X., Chen F., Zhu Q., Meng Y., Chen C., et al. (2020). Spatial-monthly variations and influencing factors of dissolved oxygen in surface water of zhanjiang bay, China. J. Mar. Sci. Eng. 8, 403. doi: 10.3390/jmse8060403
Keywords: eutrophication, nutrient dynamics, annual variation, coastal, Zhanjiang Bay
Citation: Liang H, Zhang J, Zhang J, Zhang P, Deng X, Chen J, Wang Z, Long C, Lu C, Wang D and Liang Y (2024) Unveiling the eutrophication crisis: 20 years of nutrient development in Zhanjiang Bay, China. Front. Mar. Sci. 11:1373716. doi: 10.3389/fmars.2024.1373716
Received: 20 January 2024; Accepted: 20 May 2024;
Published: 03 June 2024.
Edited by:
Li Jianlon, Shandong University, ChinaReviewed by:
Xianbiao Lin, Ocean University of China, ChinaCopyright © 2024 Liang, Zhang, Zhang, Zhang, Deng, Chen, Wang, Long, Lu, Wang and Liang. This is an open-access article distributed under the terms of the Creative Commons Attribution License (CC BY). The use, distribution or reproduction in other forums is permitted, provided the original author(s) and the copyright owner(s) are credited and that the original publication in this journal is cited, in accordance with accepted academic practice. No use, distribution or reproduction is permitted which does not comply with these terms.
*Correspondence: Junxiao Zhang, emhhbmdqdW54aWFvMjAyMUAxNjMuY29t; Jibiao Zhang, emhhbmdqYkBnZG91LmVkdS5jbg==
Disclaimer: All claims expressed in this article are solely those of the authors and do not necessarily represent those of their affiliated organizations, or those of the publisher, the editors and the reviewers. Any product that may be evaluated in this article or claim that may be made by its manufacturer is not guaranteed or endorsed by the publisher.
Research integrity at Frontiers
Learn more about the work of our research integrity team to safeguard the quality of each article we publish.