 Eunju Lee1
 Hai Van Dang
 Sungwon Shin
 Jeseon Yoo
 Hyoungsu Park
- 1Department of Marine Science and Convergence Engineering, Hanyang University ERICA, Ansan, Republic of Korea
- 2Coastal Disaster & Safety Research Department, Korea Institute of Ocean Science and Technology, Busan, Republic of Korea
- 3Department of Civil and Environmental Engineering, College of Engineering, University of Hawaii at Mānoa, Honolulu, HI, United States
Artificial dunes serve as essential nature-based defenses against the increasing threats posed by climate change and rising sea levels along coastal regions. However, these man-made dunes are particularly susceptible to erosion during severe storm events, necessitating careful consideration of their design for effective coastal protection. Among the myriad factors influencing artificial dune design, wave run-up stands out as a paramount concern. Not only is wave run-up crucial in assessing the extent of coastal flooding, but it also plays a significant role in shaping shoreline dynamics. During intense storm events, wave run-up amplification leads to substantial erosion of sand dunes, forming dune scarps that resemble cliffs. To address these challenges, we conducted a series of innovative two-dimensional large-scale laboratory experiments using movable beds. These experiments aimed to provide a quantitative understanding of wave run-up characteristics on dune scarps. Additionally, our study explored the feasibility of using existing empirical formulas to predict the 2% exceedance of wave run-up (referred to as R2%) in such scenarios. Our results revealed a consistent trend in R2% values, irrespective of variations in the surf similarity parameter when wave run-up was influenced by a dune scarp. Notably, our findings recommend the adoption of the Stockdon empirical formula, incorporating beach slope from the still water level to the dune scarp toe, as an effective method for predicting R2% during highly erosive conditions. This approach can significantly enhance the design and functionality of artificial dunes, bolstering their capacity to safeguard coastal areas from the impacts of severe storms and erosion, thus contributing to resilient coastal ecosystems and sustainable coastal management.
1 Introduction
Due to the effects of climate change, sea level rise, and overpopulation in coastal areas, the possibility of exposure to coastal hazards has increased, such as storms and extreme waves (Neumann et al., 2015). Moreover, approximately 30% of coastal regions have suffered from coastal erosion over the past decades (Luijendijk et al., 2018; Mentaschi et al., 2018; Fontán-Bouzas et al., 2022). Therefore, the vulnerability of coastal areas against both coastal hazards and erosion has increased, drawing considerable attention from researcher communities (Fontán-Bouzas et al., 2022).
Among the nature-based structures, coastal sand dunes serve as a vital defense mechanism, protecting coastal communities from various coastal hazards such as extreme surge levels and erosion (Ciavola et al., 2014; Durán et al., 2016; Palmsten and Splinter, 2016; Phillips, 2018; Pagán et al., 2019; Jin et al., 2021). Additionally, the dunes play a crucial role as repositories of sand, facilitating the natural beach nourishment process (Houser and Ellis, 2013; Jackson et al., 2019; Fontán-Bouzas et al., 2022).
For instance, the construction of coastal sand dunes in Keansburg, NJ, USA, reduced the damage to surrounding infrastructure during Hurricane Sandy in October 2012 (US Army Corps of Engineers, 2013). Similarly, in Italy, the implementation of an artificial coastal sand dune built by beach scarping techniques has effectively safeguarded coastal infrastructures against the adverse impacts of winter waves and surges (Harley and Ciavola, 2013; Palmsten and Splinter, 2016). As a result, artificial dunes and dune nourishment have gained recognition as nature-based structures to minimize the damage resulting from coastal hazards driven by climate change and sea level rise.
Accurately predicting erosion and restoration based on the mechanism of erosion and accretion of the coastal dunes is of great importance for designing and implementing effective coastal dune systems and nourishing strategies (Palmsten and Splinter, 2016). Storm events are particularly significant contributors to dune erosion, requiring the consideration of storm-induced dune erosions in the design of artificial coastal sand dunes.
Accordingly, Sallenger (2000) proposed a simplified model known as the Storm Impact Scale, in which the sand dune responses to the expected storms were categorized into four regimes termed swash, collision, overwash, and inundation (Figure 1). The regimes are determined based on the relationship between offshore wave hydrodynamic conditions and morphology responses of the sand dune. The swash regime occurs when the wave run-up reaches the foreshore. In the collision regime, the wave run-up leads to erosion of the dune base, causing the sediment to be transported offshore. During the overwash regime, waves overtop the dune crest, inducing the sediment to propagate backward across the coastal dune. In the breaching and inundation, the dune crest becomes entirely inundated by flows, and the dune profile disappears (D’Alessandro et al., 2022).

Figure 1 Conceptual figure of storm impact regimes.
Wave run-up is of great importance for evaluating the vulnerability of coastal beaches, dune systems, and coastal structures to the dynamic influence of wave action. Stockdon et al. (2006) defined wave run-up as the time-varying vertical displacement of the wave action relative to the water level, which can be seen as a combination between wave swash and wave setup. Wave run-up is parameterized using deterministic equations for generating an output value such as the maximum run-up height (Rmax) or the elevation exceeding 2% of run-up height from the still water level (R2%) in a given time period based on input conditions (Beuzen et al., 2019). This statistical value, R2%, was suggested for irregular waves to be practically applied in coastal engineering (da Silva et al., 2020), such as predicting overtopping and designing coastal and nature-based structures.
However, the wave run-up is a phenomenon that occurs in the swash zone, which is a very shallow water region, challenging the measurements of wave run-up on the natural beach. Therefore, several empirical formulas have been proposed to estimate wave run-up height using offshore wave information (H0, L0) and foreshore slope (βf) obtained in field observations, laboratory experiments, and numerical modeling. H0 is the deep-water wave height, and L0 is the deep-water wavelength and calculated using the peak period (Tp) as an input:
The wave run-up is proportional to the Iribarren number (surf similarity parameter) for steep beaches (Nielsen and Hanslow, 1991). The Iribarren number is generally used as a critical parameter for estimating wave run-up height on sandy beaches and coastal structures (Battjes, 1974). The Iribarren number(ξ) can be expressed in Equation 2 as
where m is the characteristic slope, and H/L is the wave steepness calculated by characteristic wave height (H) and wavelength (L). Nielsen and Hanslow (1991) supported the results of Hunt (1959) and Holman (1985).
Firstly, Hunt (1959) suggested an empirical formula for estimating the wave run-up, expressed as an Iribarren number, as shown in Equation 3.
Where R is the maximum run-up, and K is the empirical constant. However, this equation is not consistent with the objective of this study, as it pertains specifically to impermeable structures under regular wave conditions (da Silva et al., 2020). Mase and Iwagaki (1984) conducted a series of physical tests to investigate wave run-up of irregular waves on gentle slopes of 1/5, 1.10, 1/20, and 1/30. Wave run-up was measured using a wave probe installed in a groove and was analyzed using the crest method. The following equation derived from this study is expressed through the Iribarren number:
Where ξ0 is the Iribarren number calculated by the foreshore slope and offshore wave steepness (H0/L0). Holman (1986) conducted a field observation in Duck Beach to investigate the wave run-up height on the beach slope under extreme wave conditions. The incident wave heights ranged from 0.4 to 4 m, with periods between 6 and 16 s. The water levels are measured at approximately 20 m on the beach. This study proposed the empirical formula (Equation 4) to estimate R2%
This equation was used for the Storm Impact Scale suggested by Sallenger (2000). However, as indicated, this equation is based on the measurement in a specific site, Duck Beach. Therefore, it is necessary to apply other datasets under the storm events. Unlike Equation 5, if the slope is less than 0.1, wave run-up is not proportional to the Iribarren number but rather to the (Nielsen and Hanslow, 1991).
Stockdon et al. (2006) also developed the empirical formula for extreme wave run-up, taken as 2% of exceedance, based on ten field experiment datasets obtained from the east and west coasts of the US and Netherlands through video monitoring (Equation 6). This study determined wave run-up height composed into two processes, including total swash excursion and time average wave setup. The first equation of Equation 6 considers the various features of the offshore wave, setup, swash, and beach slopes, which is similarly expressed as the Iribarren number, ξ0 of Holman (1986). However, for waves with an Iribarren number less than 0.3, the setup component was estimated using only offshore wave conditions rather than including the beach slope, which gives a regression value of 0.6. da Silva et al. (2020) confirmed that the empirical formula suggested by Stockdon et al. (2006) still represents a significant accuracy in estimating R2% under extreme waves.
Roberts et al. (2007) performed large-scale physical model tests in the “SUPERTANK” flume to investigate the maximum beach run-up relative to the water levels. A total of 30 trials were conducted at movable beds for erosion and accretion conditions under regular and irregular wave cases. The finding indicates that the Iribarren number does not influence maximum wave run-ups, and the maximum wave run-up directly equals 0.94 times the breaking wave heights. However, in the conservative design, the value is increased to 1. Therefore, an empirical formula (Equation 7) was proposed to estimate the maximum run-up height directly related to the breaking wave height:
Following Stockdon et al. (2006), several studies have been proposed to quantify wave run-up based on video monitoring on sandy beaches. Firstly, Vousdoukas et al. (2012) conducted a coastal vulnerability assessment using wave run-up observations from the video at Faro Beach, S. Portugal, characterized by a meso-tidal and steep-sloped beach. This study analyzed the frequency and magnitude of wave run-up events and used this data to evaluate the vulnerability of the beach to erosion and inundation. The study found that the beach was highly vulnerable to erosion and inundation, particularly during storm events and high tides. The authors also noted that including the parameterization of either the shore-normal wind speed component or tidal elevation improved the accuracy of the R2% prediction. To obtain the optimal fit for the measurements, various parameters were tested. The formula that provided the best performance had an RMSE of 0.39 m. The empirical formula suggested by Vousdoukas et al. (2012) was indicated in Equation 8, which did not consider wind and tide components.
According to Atkinson et al. (2017), the accuracy of 11 wave run-up models was assessed using field observation data collected from eleven non-truncated beaches in New South Wales and Queensland, Australia. This study showed that the most accurate existing models for predicting R2% are suggested by Holman (1986) and Vousdoukas et al. (2012) based on the assessment. A new formula, as shown in Equation 9, for R2% was developed based on the best fit to predictions from six existing field observations and one large-scale laboratory experiment. This may increase the uncertainty already presented in current models in such conditions. The swash zone slope was used for beach slope (β) as an input parameter to estimate wave run-up.
Didier et al. (2020) presented the initial findings on wave run-up variability on a regional scale along the Estuary and Gulf of St. Lawrence. Video observed the time-varying swash motions on five beaches over the 3-year monitoring period. Based on these observations, a new R2% formula in Equation (10) was proposed for use in fetch-limited and sheltered environments.
However, all existing previous studies on wave run-up that have been conducted so far neglected the influence of dune scarps. In light of the sea level rise and climate change, the occurrence of dune scarping caused by dune erosion is expected to increase. Consequently, understanding the factors that influence dune scarping and its impact on dune systems is crucial to effectively managing coastal erosion in the future (Davidson et al., 2020), since the consideration of the wave run-up affected by dune scarps is necessary for designing artificial sand barriers to cope with climate change. The primary objective of this study is to investigate the wave run-up affected by dune scarps using stereo imagery data from a two-dimensional large-scale movable bed experiment. Furthermore, when the wave run-up is affected by the dune scarp, this study also investigates the feasibility of using existing empirical equations for predicting R2%.
A two-dimensional large-scale movable bed experiment was conducted to investigate the erosion and accretion mechanisms of a coastal sand dune during a single storm event and posterior recovery process. During the experiment, storm-induced wave run-up along the coastal dune profile caused dune erosions, resulting in the formation of dune scarps. Consequently, accurately estimating the wave run-up becomes crucial. Given the significant influence of the beach-dune system profile, particularly its slope parameter, on the wave run-up dynamics, the precise prediction of this parameter is imperative to improve the accuracy of wave run-up estimates. Thus, the primary objectives of this study are to evaluate the effectiveness of existing slope-driven empirical formulas and to determine the optimal slope configuration that enhances the precision of wave run-up predictions, represented by R2%.
This study is constructed into five sections as follows. Apart from the introduction, Section 2 presents a detailed description of the two-dimensional large-scale moveable bed experiment, including the bed profile, wave condition, instrumentation, and stereo imagery techniques for measuring wave run-up, R2%. The results of dune scarp formation and R2% estimation derived from stereo imagery and existing empirical equations, are shown in Section 3. This section further indicates the characteristics of observed R2% values, shows the feasibility of the existing empirical formula, and suggests which slope would be beneficial to improve the prediction accuracy of R2% on the dune scarp. The discussions are indicated in Section 4. Finally, this paper summarizes the conclusion in Section 5.
2 Overview of methodology
In this section, we present the research methodology by conducting a series of large-scale physical experiments to characterize the impact of dune erosion on the wave runup process. The objective of this section is to provide a comprehensive description of the experimental setups, including bed profiles, wave conditions, instrumentation deployed, stereo imagery techniques used to analyze wave runup, and morphological changes observed during the experiment
2.1 Bed profile
The large-scale experiment of a dune-beach system was carried out in the wave flume at Chonnam National University of South Korea. The dimensions of the wave flume are 100 m in length, 2 m in width, and 3 m in depth at the wavemaker. Equipped with a hinged wavemaker, the two-dimensional large-scale flume, has the capability to generate both monochromatic and random waves, reaching a maximum wave height of 1.3 m with a period of 8 s. As illustrated in Figure 2A, the dune-beach system was simplified and idealized for the experiment to represent a natural dune on the west coast of South Korea utilizing a 1:4 scale. This system was constructed at the leading edge of the wave flume using 104.295 m3 of silica sand, characterized by a medium-size (D50) of 0.15 mm. The experimental profile comprises three different sections: an initial section, representing the offshore beach with a slope of 1:45 spanning from 28.65 m to 46.65 m, followed by an initial foreshore of 15.75 m with a slope of 1:31.5. The section representing the initial foredune features a slope of 1:3.6, extending from 62.4 m to 66 m, was established to mimic the dune face with a dune height of 1 m. In Figure 2B, the black dotted line indicates the initial bed profile before the waves start, and the black solid line shows the final bed profile after all wave interactions.
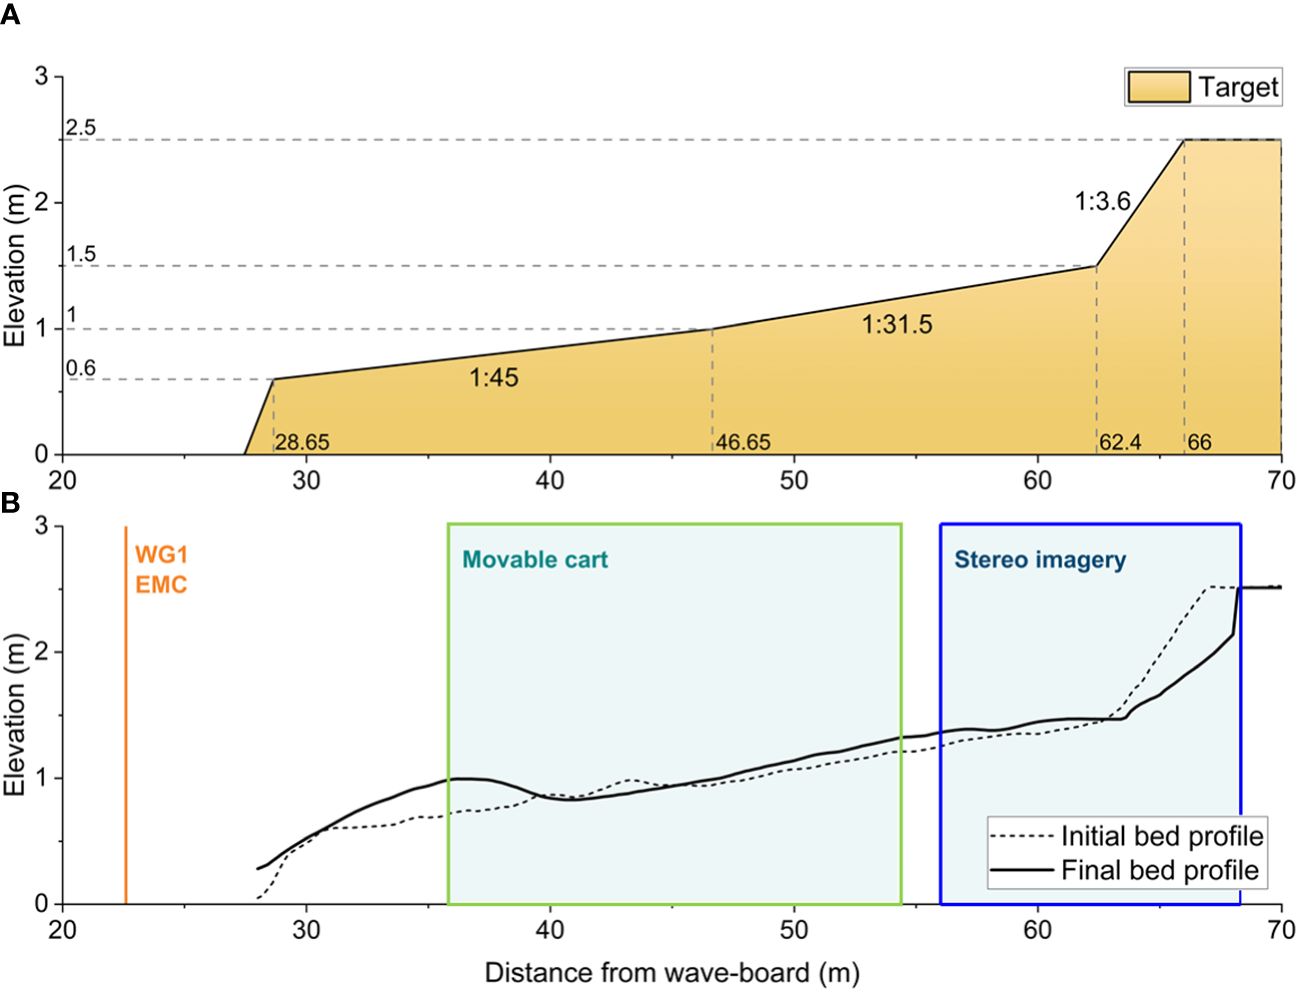
Figure 2 (A) Target bed profile for the experiment (B) Initial (dash line), Final (solid line) bed profile, and deployed instruments of the experiment. A wave gauge (WG1) and electromagnetic current meters (EMS) were located the seaward to the bed. A moveable cart equipped with a wave gauge, an acoustic Doppler velocimeter, an acoustic Doppler velocimeter profiler, and an echosounder measured hydrodynamics within 35.748 – 54.248 m from the wave-board (green box). Stereo imagery that can obtain hydrodynamics in the shallow water region covered 56 – 68.2 m from the wave-board (blue box).
2.2 Wave condition
Figure 3 presents the experimental incident wave conditions for an entire representative single storm event using Bretschneider-Mitsuyasu spectra. The prototype storm was monitored using offshore observational buoys operated by the Korea Hydrographic and Oceanographic Agency during the storm event that inflicted significant damage on the Korean Peninsula since 2003. Suh et al. (2010) presented detailed characteristics of wave measurement stations situated around the Korean peninsula. For example, at the Hongdo buoy in the Yellow Sea, the significant wave height ranged from 0.11 m to 5.87 m, while the significant wave period was 2.14 m/s to 19.02 m/s. Based on the observation findings and the characteristics of the wave flume, an identical prototype storm condition was selected with a maximum wave height of 2.68 m and a maximum peak period of 7.6 s. Wave conditions in the physical experiment were designed using Froude similarities, with a length scale of 1/4 prototype and time scale . To reproduce a real storm, significant wave heights (Hs) and surge levels (water level) were increased and decreased incrementally during the experiment. Specifically, the significant wave heights ranged from 0.14 m to 0.67 m, while the surge levels increased between 1.46 m and 1.7 m (Table 1). The wave period was sequentially increased to reach its maximum value similar to the time evolution observed during the most severe storm condition registered and consequently fixed to investigate the mechanism of dune restoration. van Gent et al. (2008) asserted that the longer wave periods with the same wave height lead to the more pronounced restoration of the coastal sand dune-beach systems.
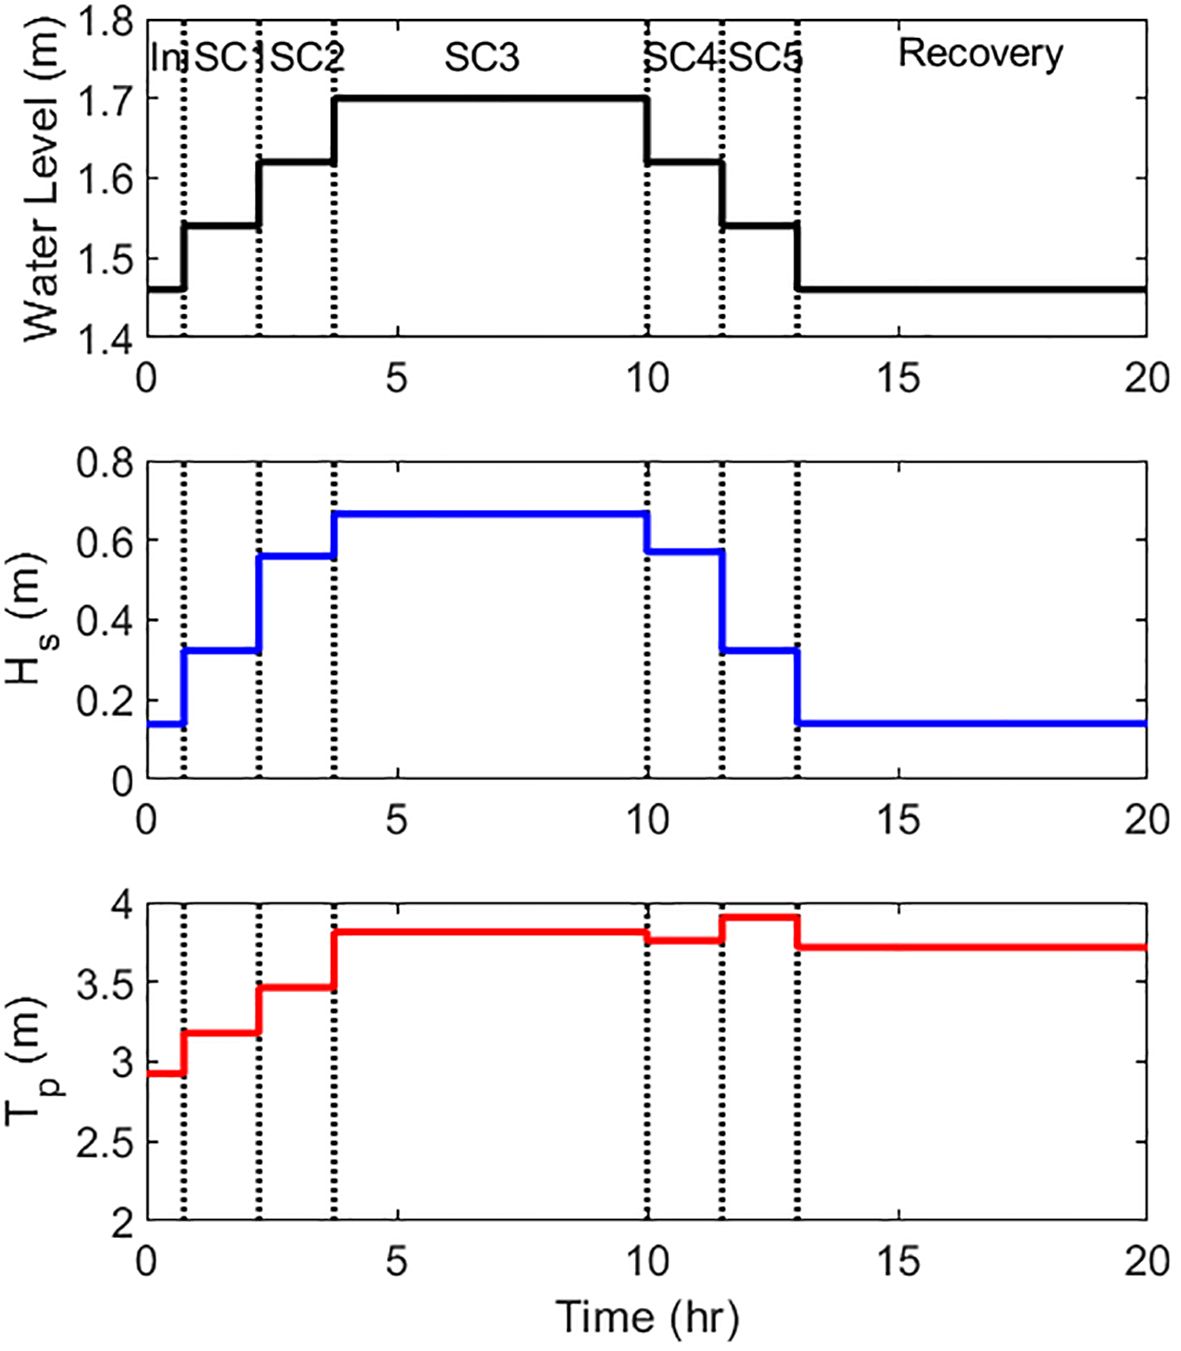
Figure 3 Incident wave condition (Water level, significant wave height – Hs, Peak period – Tp) during the initial condition (ini), storm conditions (SC1, SC2, SC3, SC4, and SC5), and Recovery processes.
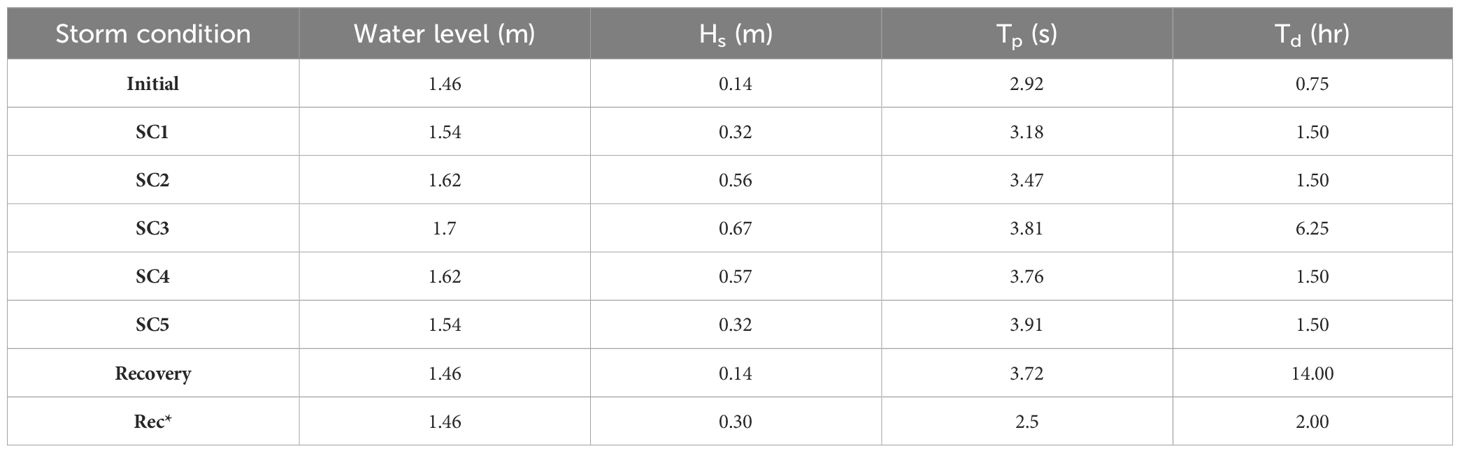
Table 1 Incident wave condition of this experiment.
In this study, wave conditions were classified into eight regimes, including ‘Initial (pre-storm condition)’, ‘SC1 (Storm condition 1)’, ‘SC2 (Storm condition 2)’, ‘SC3 (Storm condition 3; great erosive condition)’, ‘SC4 (Storm condition 4)’, ‘SC5 (Storm condition 5)’, ‘Recovery (post-storm condition or accretive condition)’ depending on significant wave heights, peak periods, and water levels. The initial condition was conducted to simulate low wave conditions, referred to as the pre-storm conditions, resulting in negligible sediment transport and no erosion of coastal dunes. Six wave runs were conducted for each initial and storm conditions (SC1, SC2, SC4, and SC5), with 24 runs (Trial 19 ~42) specifically examining the most erosive conditions (SC3). The results from the duration of storm conditions when dune erosion occurred will be investigated and discussed in this paper. The duration of the wave runs was set at 15, 30, 60, or 120 minutes, ensuring sufficient time to calculate statistical values such as the significant wave height (Goda, 2010). It is important to note that only storm surge was considered, and the tidal effects were excluded in the current laboratory experiment.
2.3 Instrumentation
Figures 2B, 4 show an overview of the installation of several physical instruments to measure the transformation of wave hydrodynamics and bed profiles during the experiment. A resistance wave gauge (WG1) and an electromagnetic current meter (EMC) was installed near the waveboard to measure offshore wave and flow information (Figure 2B). Additional instruments, such as a wave gauge, an acoustic Doppler velocimetry, an acoustic Doppler velocimetry profiler, and an echosounder, were mounted on a movable cart. This cart facilitated the deployment of instruments to measure wave characteristics in various cross-shore locations, spanning from 35.748 m to 54.248 m toward the landward direction. This setup allowed for the analysis of wave transformation in the foreshore area with the formation of sand bars (Figure 2B – green box). Given the dynamic nature of the movable bed experiment, characterized by the movement of the sand that alters the elevation of the observation area, the movable cart is designed to move freely in the z-direction (vertical axis from the bottom). A moveable cart equipped with a capacitance-type wave gauge (WG), an acoustic Doppler velocimeter (ADV), an acoustic Doppler velocimeter profiler (ADVP), and an echosounder were installed (Figures 4A, B). The ADV is capable of measuring water velocity in three directions by analyzing the Doppler shift of sound waves reflected off particles suspended in the water. Meanwhile, the ADVP, an extension of the ADV, provides velocity measurements not only in a single point but also along a vertical profile of the water column. In order to measure the velocity profile near the bed according to the moved sand for each wave run, the ADVP probe was positioned 8 cm above the bed, taking into account the blanking distance (5 cm) of the ADVP and the observation area (profile length = 3 cm). However, in the very shallow water regions, these instruments could initially be exposed to the air, leading to very foamy waves passing through the instruments; therefore, the ADV and ADVP could not measure the physical velocity data. Therefore, a pair of stereo cameras were installed on the wave flume (z = 3.70 m above the still water level).
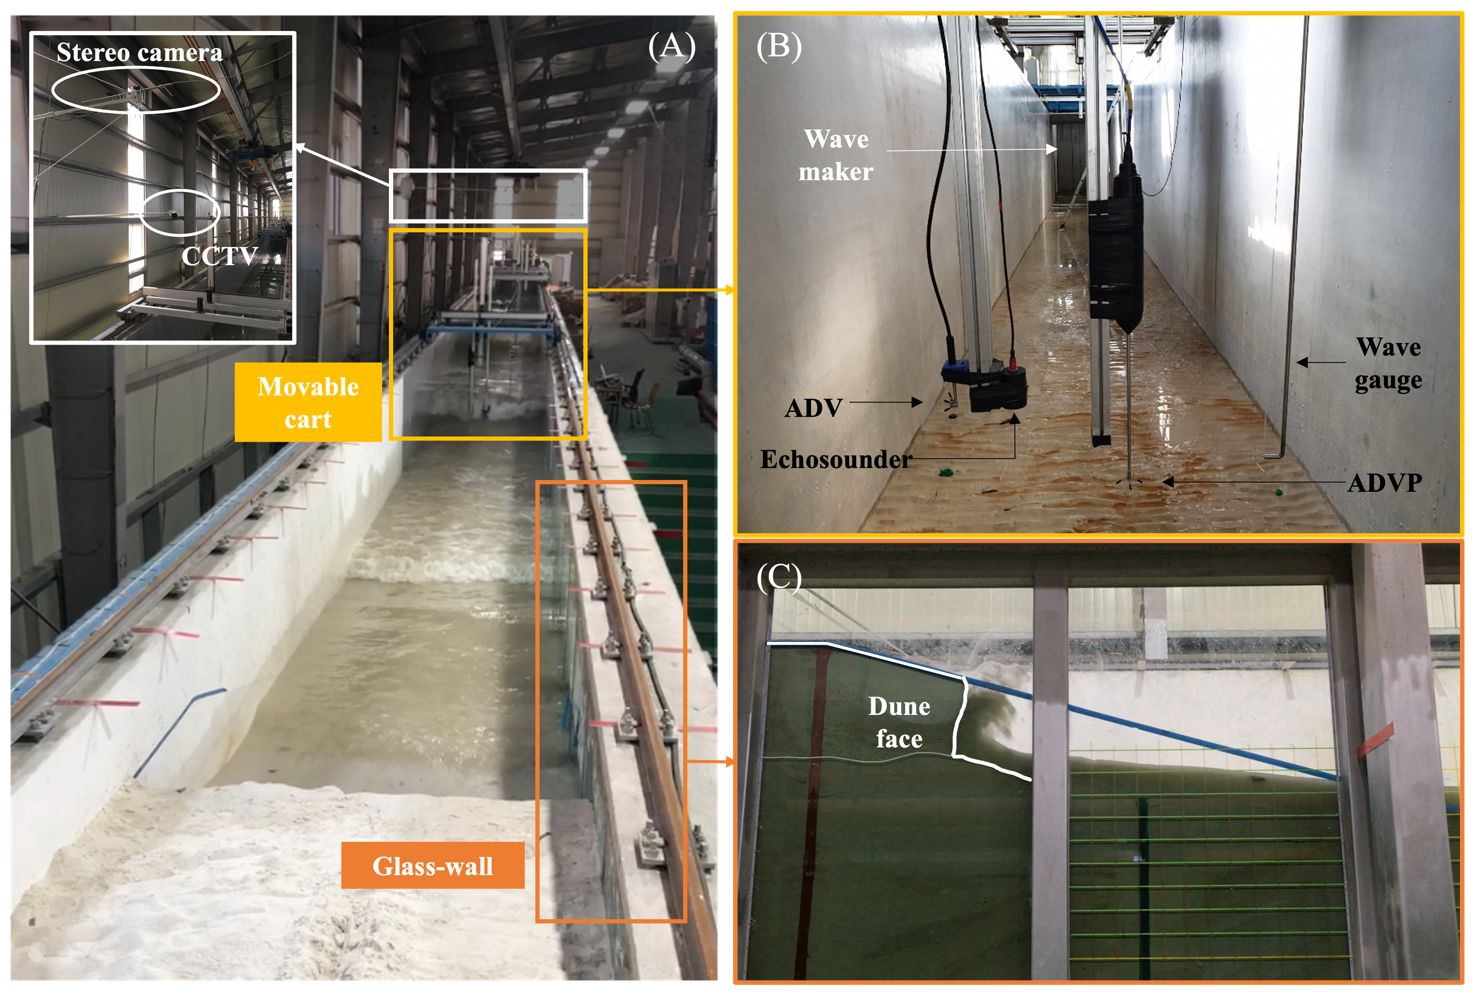
Figure 4 (A) The overview of instrumentations (B) Instrument layout installed in movable cart (C) details of the partial glassed wall on the side of the flume.
The observed area through stereo imagery was from 56 m to 68.2 m from the wave-board and depicted in the blue box in Figure 2B. The installed stereo imaging system consists of two digital cameras (Figure 4A), which mount 8-mm distortionless lenses and collect 8-bit grayscale imagery with 2456 × 2048 pixel resolution and 3.45-μm square active elements. The two cameras were synchronized using an external trigger, which provides image sampling rates of 1 to 15 Hz and keeps the synchronization delay within 1 ms. The cameras were positioned 0.36 m apart located at a distance of 25.80 m from the shoreline, and rotated down-looking with an inclination angle of about 30 degrees. Herein, image frames were captured for a time interval of 20 minutes per trial with a sampling rate of 5 Hz. Moreover, Figure 4C shows an image of the maximum wave run-up observed on the dune scarp at the glassed-wall side of the wave flume. As shown in Figure 4C, the wave flume has a partial glass wall that can see the side view of the coastal sand dune during the wave run. Therefore, the erosion processes of the coastal dune were visibly observed from the glass wall during the entire experiment.
Furthermore, in measuring the bed profile of a beach-dune system, a combination of instruments is employed to capture both underwater and above-water topographical features. The Level Stuff and Echosounder are utilized for surveys below the water level, providing detailed measurements of submerged terrain. The Echosounder operates by emitting sound waves that bounce off the seabed and return to the instrument. Additionally, Level Stuff ensures accurate horizontal leveling during the survey process. Meanwhile, the laser range Finder comes into play for measuring the area above the water level, including the coastal dune. This instrument uses laser beams to determine distances to various points on the surface of the land, enabling precise measurements of elevation and topographic features. By deploying these instruments at 20 cm intervals after every wave run, comprehensive data on the beach-dune bed profile can be obtained, facilitating thorough analysis and understanding of coastal morphology and dynamics.
2.4 Stereo imagery
The stereo imaging technique was adopted to measure the free water surface of breaking waves spatially and temporally in the wave flume. A stereo camera view can reconstruct the sensor surfaces in 3-D and provide a more extensive dataset in terms of spatial and temporal dimensions than what can be collected at fixed point wave gauges. Indeed, the stereo imaging approach has been applied to measure spatial and temporal data of ocean waves (Benetazzo et al., 2018, 2021; Bergamasco et al., 2021; Pistellato et al., 2021; Davison et al., 2022).
The image analysis consists of mainly three steps: 1) pre-processing of internal camera calibration, 2) stereo image processing, and 3) post-processing of horizontally aligning the reconstructed 3-D surface field (x, y, z) with the direction of the flume. In the first step, the internal camera parameters were estimated, such as the lens focal length vector, the principal point of image frame coordinates, and the distortion vectors (Zhang, 2000; Ma et al., 2004), which were needed in the second step. In the second step, the stereo images were processed using open-source software (Bergamasco et al., 2017), which was developed based on the dense-stereo matching algorithm proposed by Hirschmüller (2008). Pixels of each stereo-image pair were matched with sub-pixel resolution using the default matching-window size of 13 × 13 pixels. Thereby, dense disparity maps, also regarded as depth maps, were produced from the matched image pairs in time series. In the third step, the reconstructed surface field with regard to the local coordinates from the line of the left camera sight was aligned such that the y-axis coincides with the flume direction (i.e., the direction of wave propagation).
Some results produced by stereo image processing techniques are presented in Figures 5, 6. In detail, Figures 5A, B show a stereo-image pair snapshotted during the case of Trial 40 and the 3-D surface field reconstructed from the image pair (Figure 5C). In order to reduce the computational cost, the background area outside the wave flume was masked and not considered in the stereo image processing. Figure 6 shows a part of the time stack of the surface elevation profile for the case of Trial 40, which was collected along the cross-shore transect at the center line of the flume.
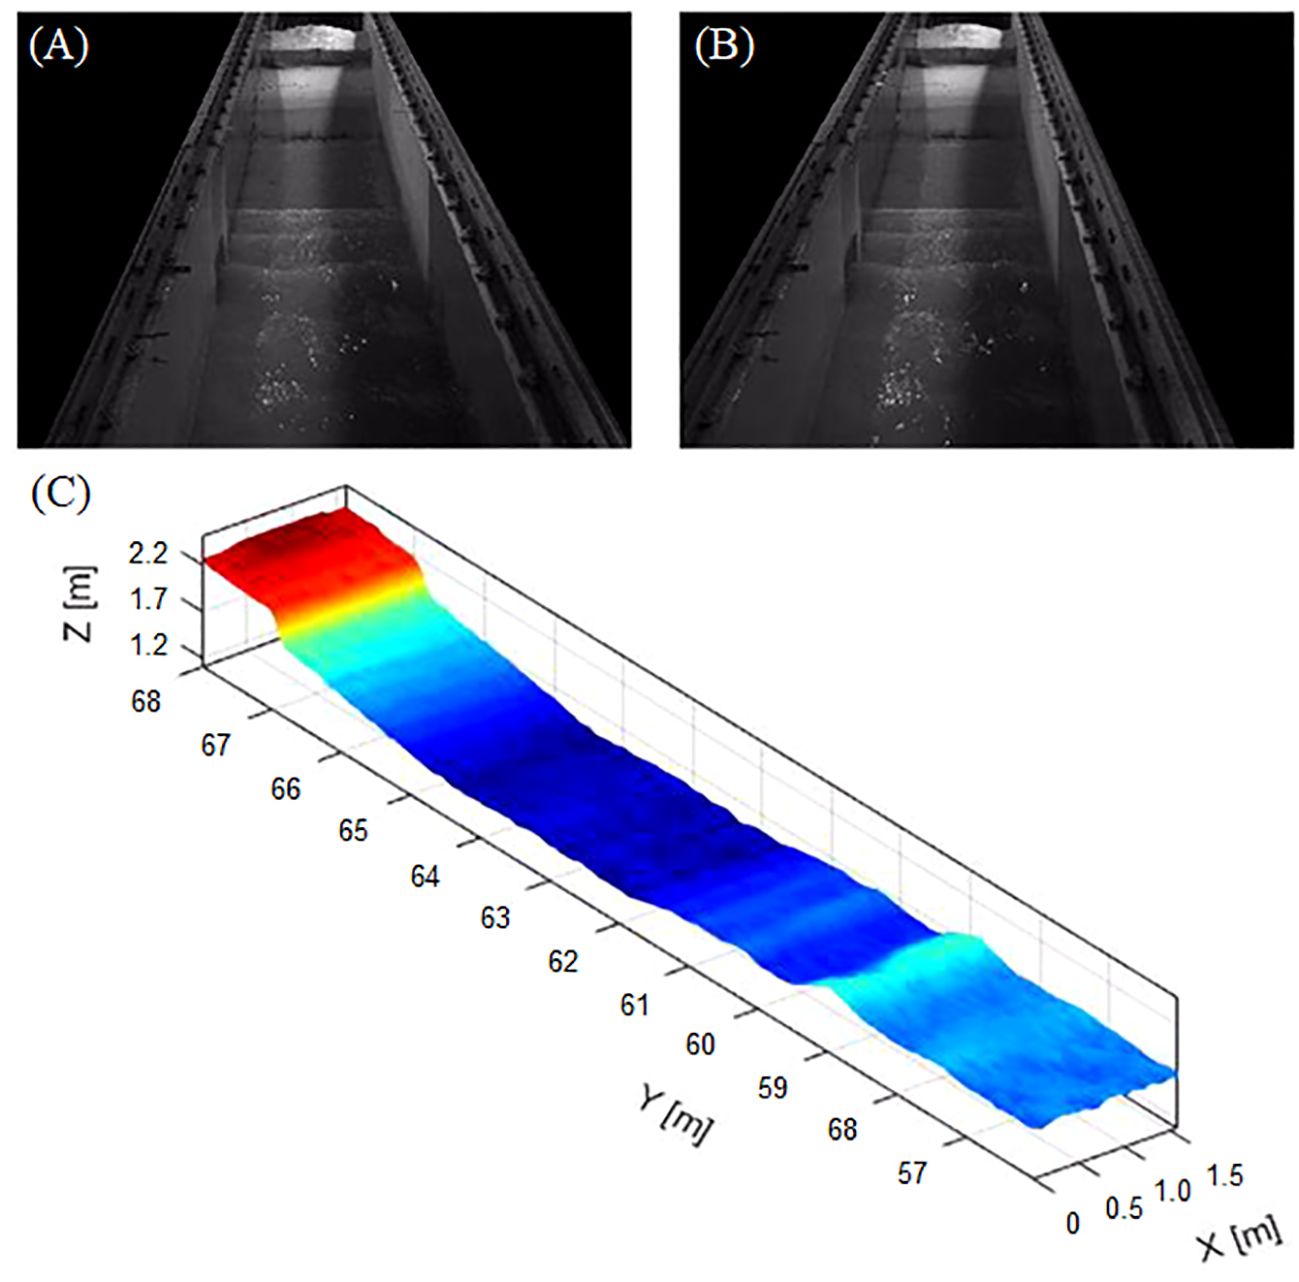
Figure 5 An example of the results produced by the stereo-image processing procedure for the case of Trial 40: (A) an image snapshot of the left camera, (B) the paired image snapshot of the right camera, (C) the 3-D wave field reconstructed from (A, B) by the stereo-image processing.
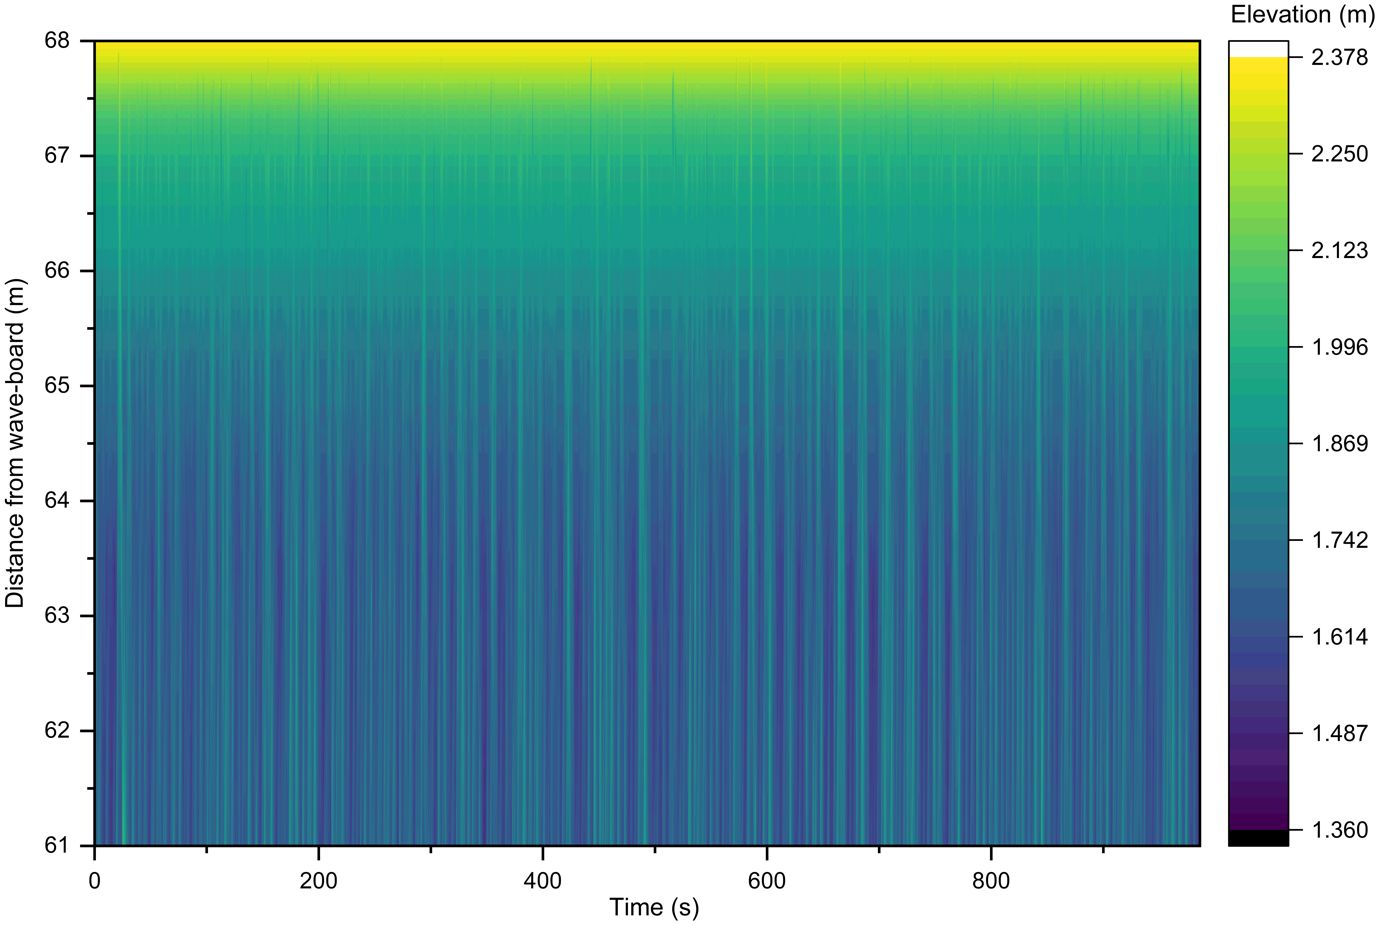
Figure 6 Time-stack of surface elevation including waves and dune during Trial 40 extracted from stereo imagery.
The results of water surface variations measured by stereo imaging were compared to the measurements by wave gauges. Since the cart with wave gauges could not be placed within the coverage of the camera view, the cart was located offshore close to the boundary of the camera view for the cases of SC4 and Recovery trials. Table 2 presents comparisons of the measured wave heights between the wave gauges and the stereo cameras. It is convincible that the measured wave heights by the stereo cameras are comparable to the measurements by the wave gauges.
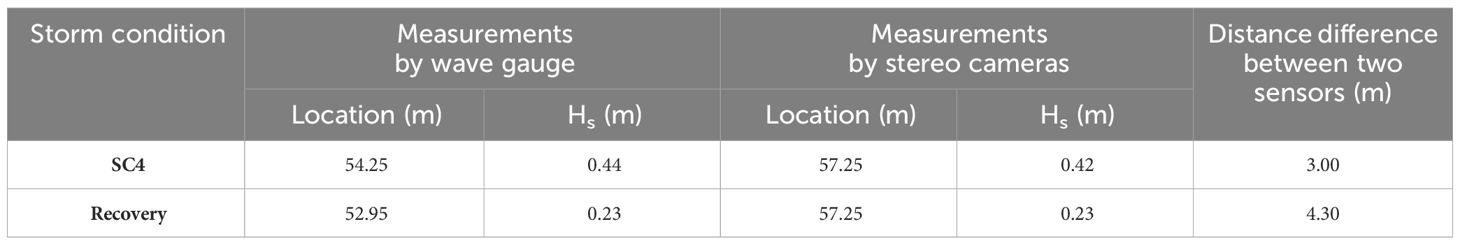
Table 2 Comparison of the measured wave heights between the wave gauge and the stereo imaging.
Figure 7 represents the comparison between the time-averaged values of stereo imaging, still water level (SWL), and bed elevation during Trial 40. Through this, the validity of wave observations through stereo images was also confirmed by showing that the average value of wave observed through stereo images is the same as the SWL. Furthermore, the bed elevation above the SWL (66 - 67 m from the wave-board) is identical to the averaged values of stereo imaging. The difference between bed elevation and stereo imaging at 67 - 68 m from the wave-board is due to the presence of only wave run-up (upward trend) on the ground, unlike waves that have both positive and negative signs. Therefore, it is presumed that the time-averaged values of the stereo imaging at 67 - 68 m from the wave-board do not follow the ground.
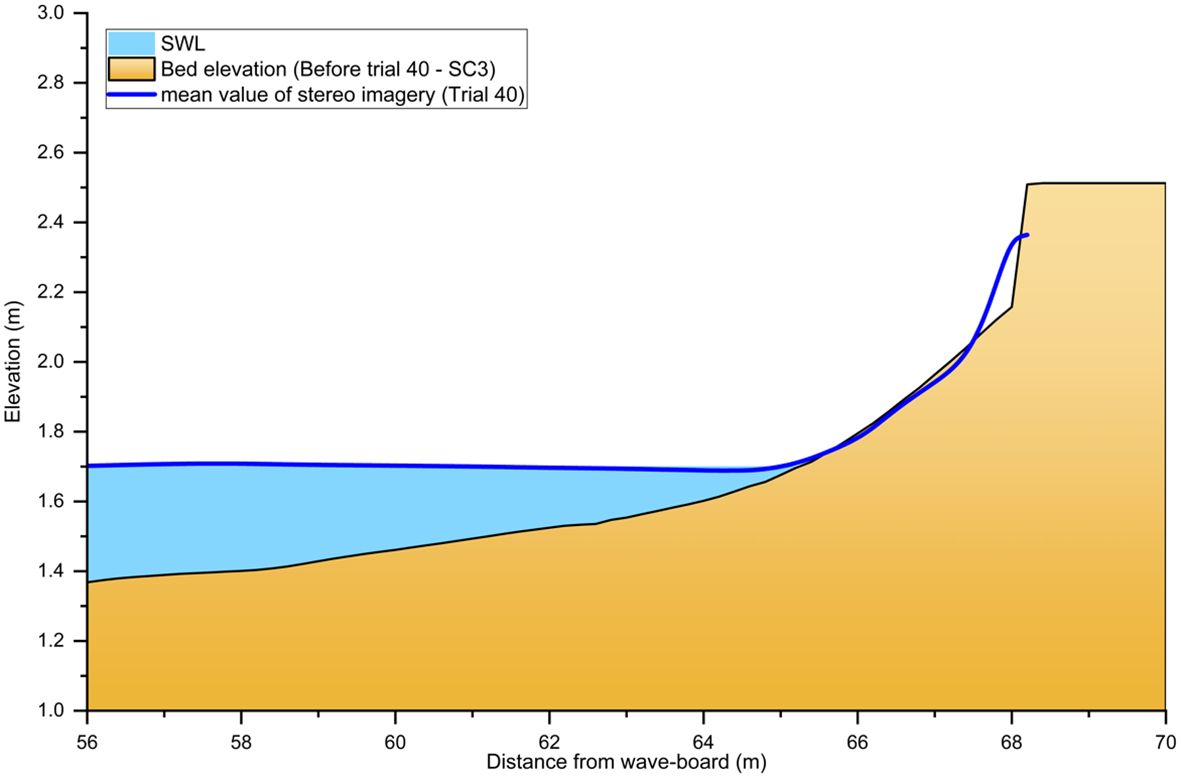
Figure 7 Still water level (sky blue) and the mean value of the stereo imagery (blue solid line) during Trial 40 and the bed elevation before Trial 40.
2.5 Morphological change
Figure 8 shows the results of the bed survey after operating each storm condition, indicating two underwater sandbars were generated during SC3. One sandbar located offshore around x = 36 m was called as an outer sandbar, and the inner sandbar, located onshore position around x = 52 m, was witnessed. Also, slumping started to occur slightly at the foredune during SC1, and Immediately after the start of SC2, a pronounced cliff-shaped dune scarp was formed. The cliff of the foredune was generated during SC2. Then, the location of the dune scarp was retreated during SC3 and maintained after SC3. As shown in the bed profile after Recovery (Figure 5 – Red solid line), the inner sandbar collapsed, while the outer sand bar slightly moved onshore during the Recovery process.

Figure 8 Bed profile after each storm condition.
Figure 9A shows continuous bed elevation over time as a color map. The x-axis represents the elapsed time from the first wave run (refer to Table 1). The y-axis represents the distance from the wave-board, which illustrates the entire survey area spanning from the top of the coastal dune to the seaward side of the outer sand bar. Figure 9B indicates the cross-shore bed profile at the instant of 9 hours after the first wave run (SC3), specifically showing the entire bed survey area. The detailed characteristics of the sediment transport were captured and illustrated in Figure 9A. During the period between SC2 and SC3, erosion of the foredune occurred at the cross-shore position between 64 m and 68 m, and then the form of the foredune (dune scarp) was maintained. The slope of the area ranging from 50 m to 60 m from the wave-board became mild, while two underwater sandbars were formed as sand moved offshore rapidly during SC3, which represents the most erosive scenario. Following the SC3, the inner sandbar slightly migrated onshore; however, the outer sandbar exhibited insignificant change. During recovery conditions, sediment was transported onshore gradually, leading to a gradual reduction in the height of the outer sandbar (Figure 9C) and an increase in its width during the recovery process.
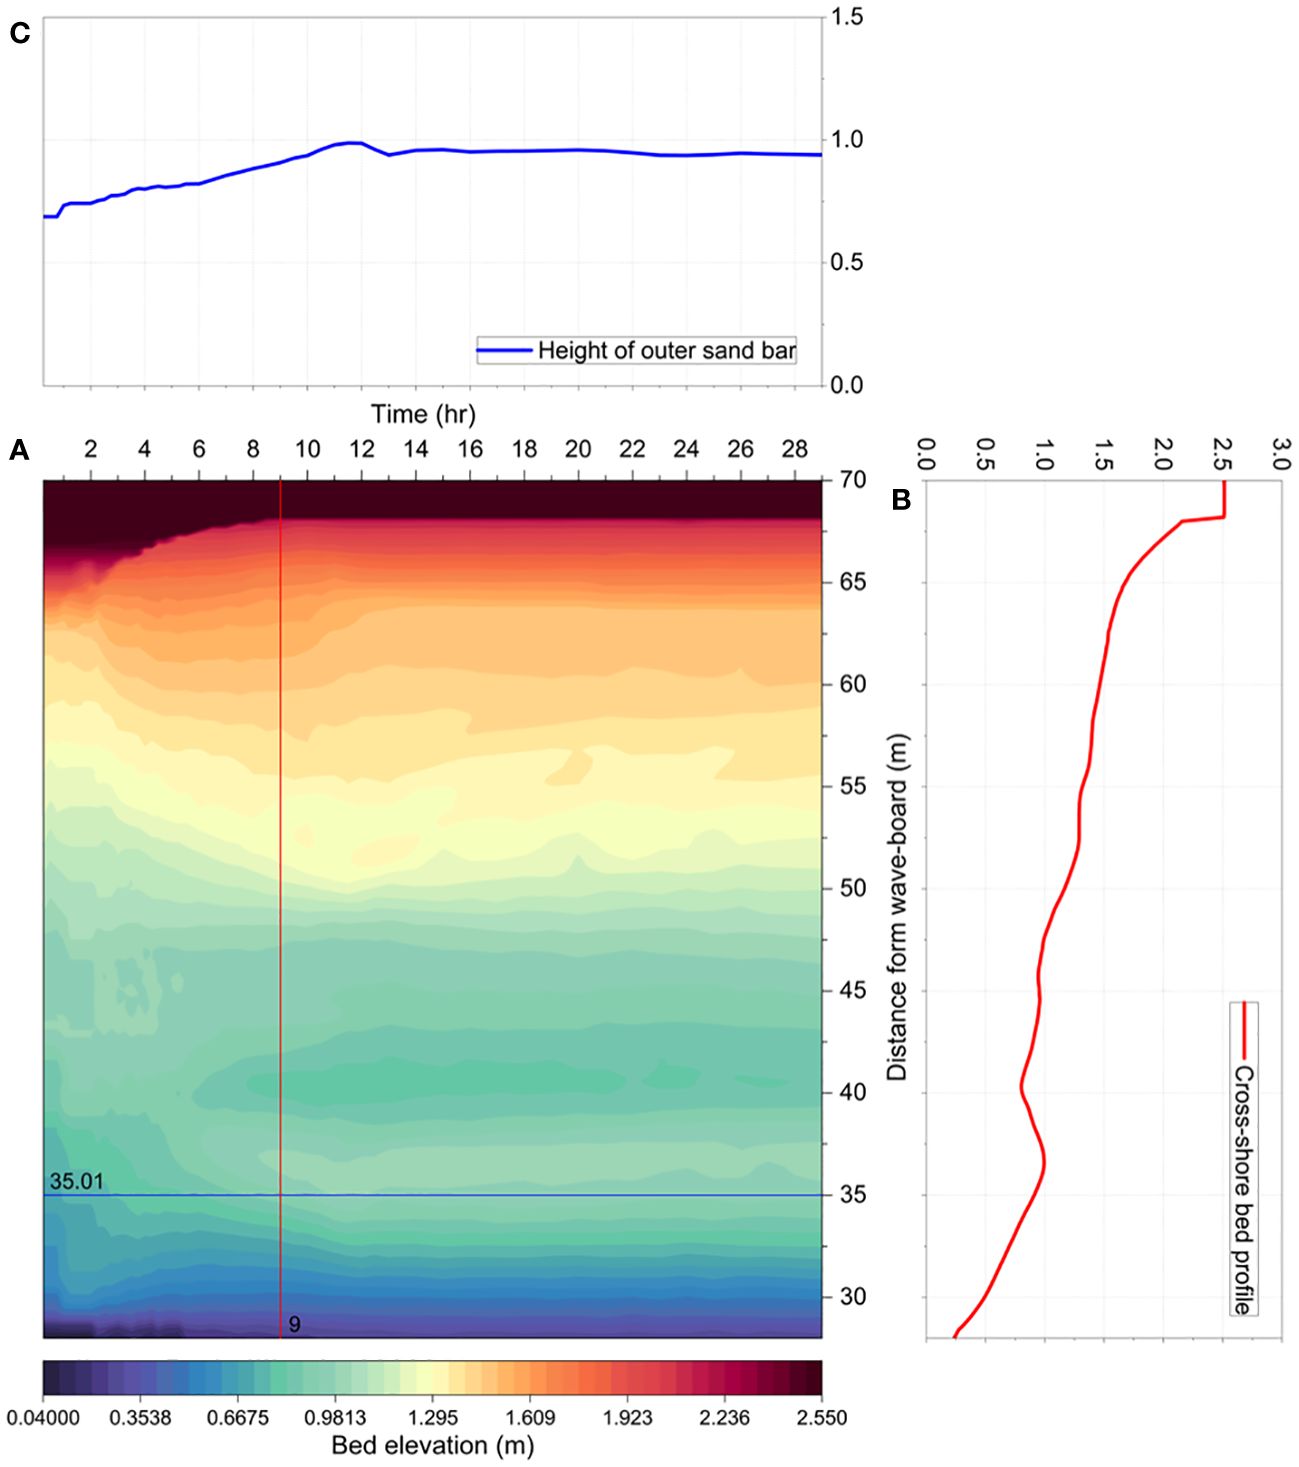
Figure 9 (A) Bed profile after each wave-run (B) Cross-shore bed profile (red solid line) 9 hours after the experiment started (C) Changes in the height of the outer sandbar (blue solid line) over time.
3 Results
3.1 Dune scarp formation
Generally, the initial dune profile is characterized by mild slopes. The dune face is eroded during storm events, causing the dune scarping above still water level. The variation of the representative dune profile at the cross-shore distance between 61 m and 70 m under different wave conditions during SC1, SC2, and SC3 is illustrated in Figure 10. During SC1, which wave condition simulated the first stage of an entire storm event (Water level 1.54 m; Hs = 0.32 m, Tp = 3.18 s), slumping slightly occurred at the beginning, inducing an increase in the area of slumping occurrence during Trial 7 to Trial 10 (Figure 10A). In the second stage of an entire storm event (SC2: Water level = 1.62 m; Hs = 0.56 m, Tp = 3.47 s), the increasing erosion of the dune face caused the formation of dune scarp, which is characterized by rapidly and strongly increasing dune profiles over a short distance (Richter et al., 2013). The cliff-formed dune scarp and its toe are clearly visible, and the dune scarp toe started to retreat (Figure 10B). The cliff top and dune scarp toe can be utilized as shoreline indicators (Anfuso et al., 2007). The dune scarp toe is a critical parameter in characterizing the dune scarp profile and is a component of the spatially and temporally varying beach-dune system. The dune scarp toe typically shifts toward landward during storm conditions. A detailed description of scarp toe is presented in van IJzendoorn et al., 2021. In the current experiment, dune scarp toes are illustrated as red dots in Figures 10B, C. Similar to the previous studies, the altitude of the dune scarp toe increased, and the dune scarp toe receded backward from the medium erosive condition (SC2) to the most erosive condition (SC3).
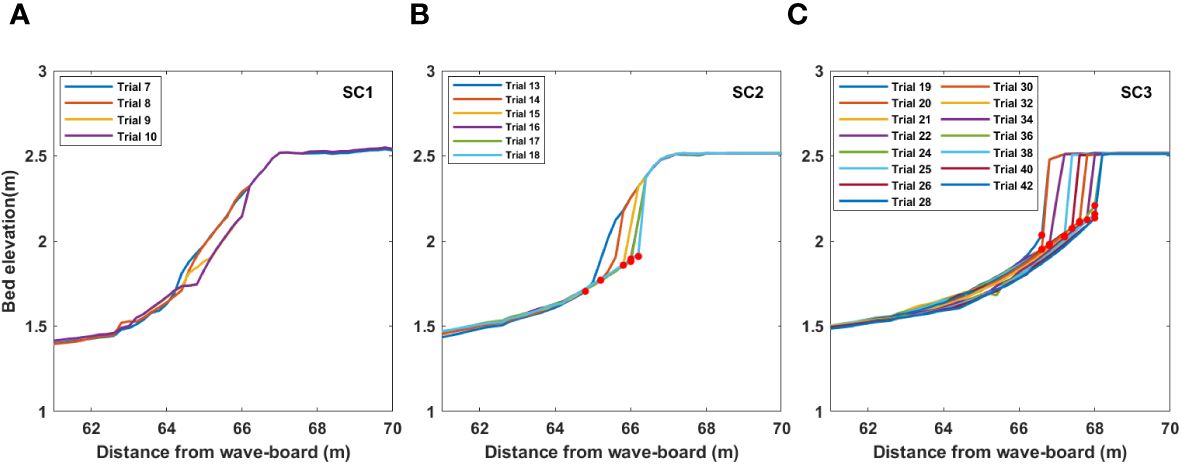
Figure 10 Dune profile during (A) storm condition 1, (B) storm condition 2, and (C) storm condition 3.
The trajectory of the dune scarp toe between SC2 and SC3 is depicted in Figure 11. Palmsten and Holman (2012) expressed the observed trajectory of the dune scarp as a fraction of the foreshore beach slope. Figure 11 demonstrates that the dune toe moves along the foreshore beach slope. Furthermore, the trajectory of the dune toe aligns with the slope proposed in our subsequent study, and its detailed information will be extensively discussed in Section 4.1.
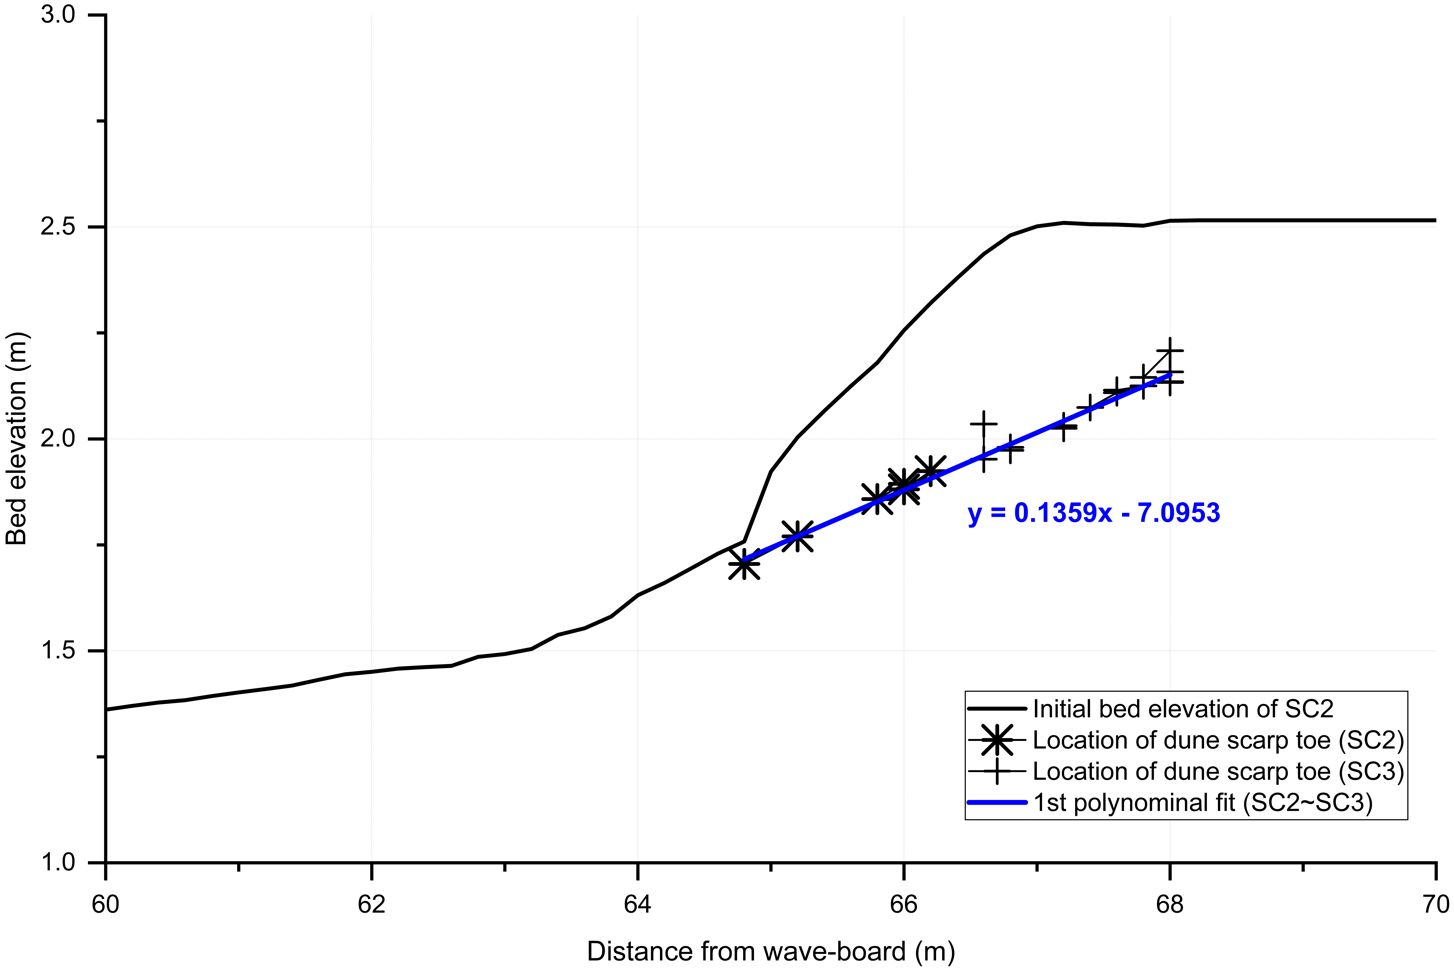
Figure 11 Trajectory of the dune scarp toe and the 1st polynomial fit of the dune scarp toe (Blue solid line) during SC2 – 3.
3.2 Wave run-up
3.2.1 Observation: R2%
Characterized wave run-up heights (R2%) were calculated using the time series of wave elevation measured in the stereo imagery technique. R2% is composed of wave setup and run-up maxima components (Stockdon et al., 2006). Figure 12 shows an example of a time series of wave run-up in Trial 40 of SC3. A total of 278 peak wave elevations in the time series were extracted and utilized for estimating R2% of 0.63 m. However, as shown in Figures 5, 6A, 10, despite significant changes in the overall topography, including the retreat of the dune scarp, R2% values remained relatively constant at approximately 0.55 m with a standard deviation of 0.01 m for other trials in SC3. Moreover, for characterized wave run-up height (R2%) of other storm conditions, run-up values calculated using the stereo imagery are presented in Table 3. Since there are no observed R2% values between Trials 30 and 38, it is difficult to determine the difference accurately. However, it is speculated that this is due to the complexity of ongoing changes in the coastal morphological conditions, such as the formation of underwater sandbars between Trials 30 and 38.
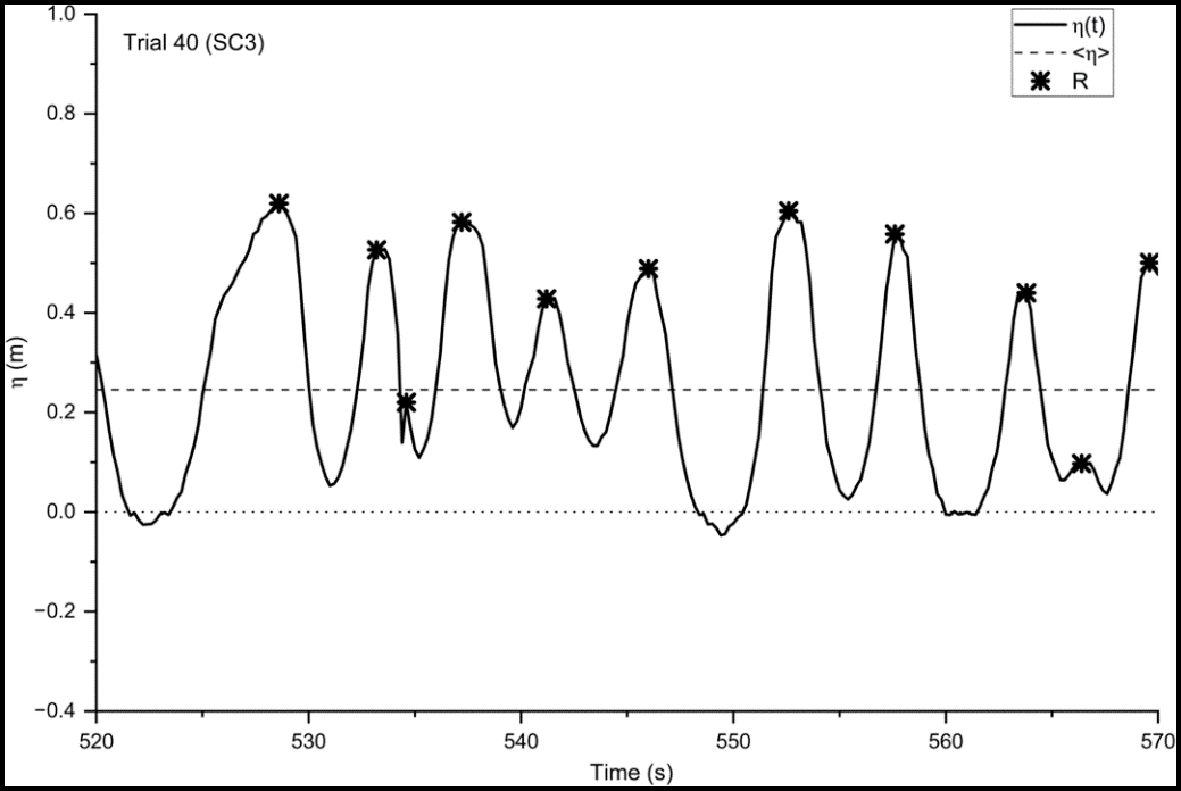
Figure 12 Time series of the water level extracted from time-stack of stereo imagery indicating wave run-up maxima, R, and setup at the shoreline,<η>.
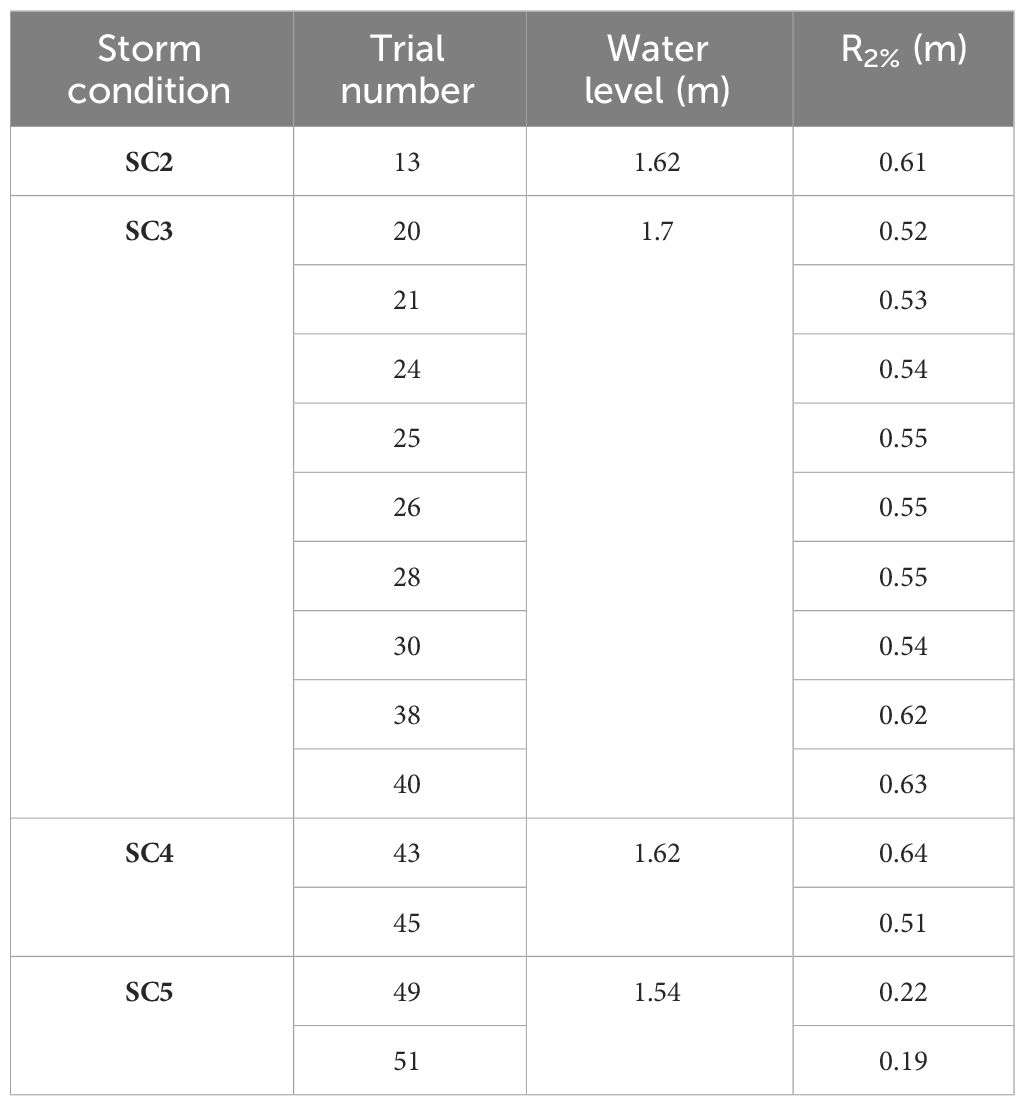
Table 3 Observed values of R2% obtained from stereo imagery.
Figure 13 shows the dune sedimentary budget and whether the R2% occurred on the dune scarp or not. The dune sedimentary budget refers to the balance between sedimentary accumulation and erosion processes during the storm events, which is calculated by integrating the dune area starting from x = 62.4 m as the initial foredune to the end of the dune. The average erosion rates of the dune for each storm condition are 0.7279, 1.0762, 1.0023, 0.2143, and 0.0480 m3/(m × hr), respectively (Figure 13A). Additionally, during the Recovery condition, there was a minimal accretion rate of 0.0007 m3/(m × hr) compared to the erosion rate. During SC2 – SC3, the slumping occurred with the formation of the dune scarp, and the erosion rate is the highest, as mentioned in Section 2.3. Figure 13B indicates where the R2% is measured. The total water level is calculated as the sum of the still water level and R2%. As shown in Figure 13B, during SC2, SC3, and SC4 (Only Trial 43, which is the first wave-run of SC4), the total water level exceeded the altitude of the dune scarp toe, which means that R2% occurred on the dune scarp, resulting in the dune erosion at the highest erosion rate.
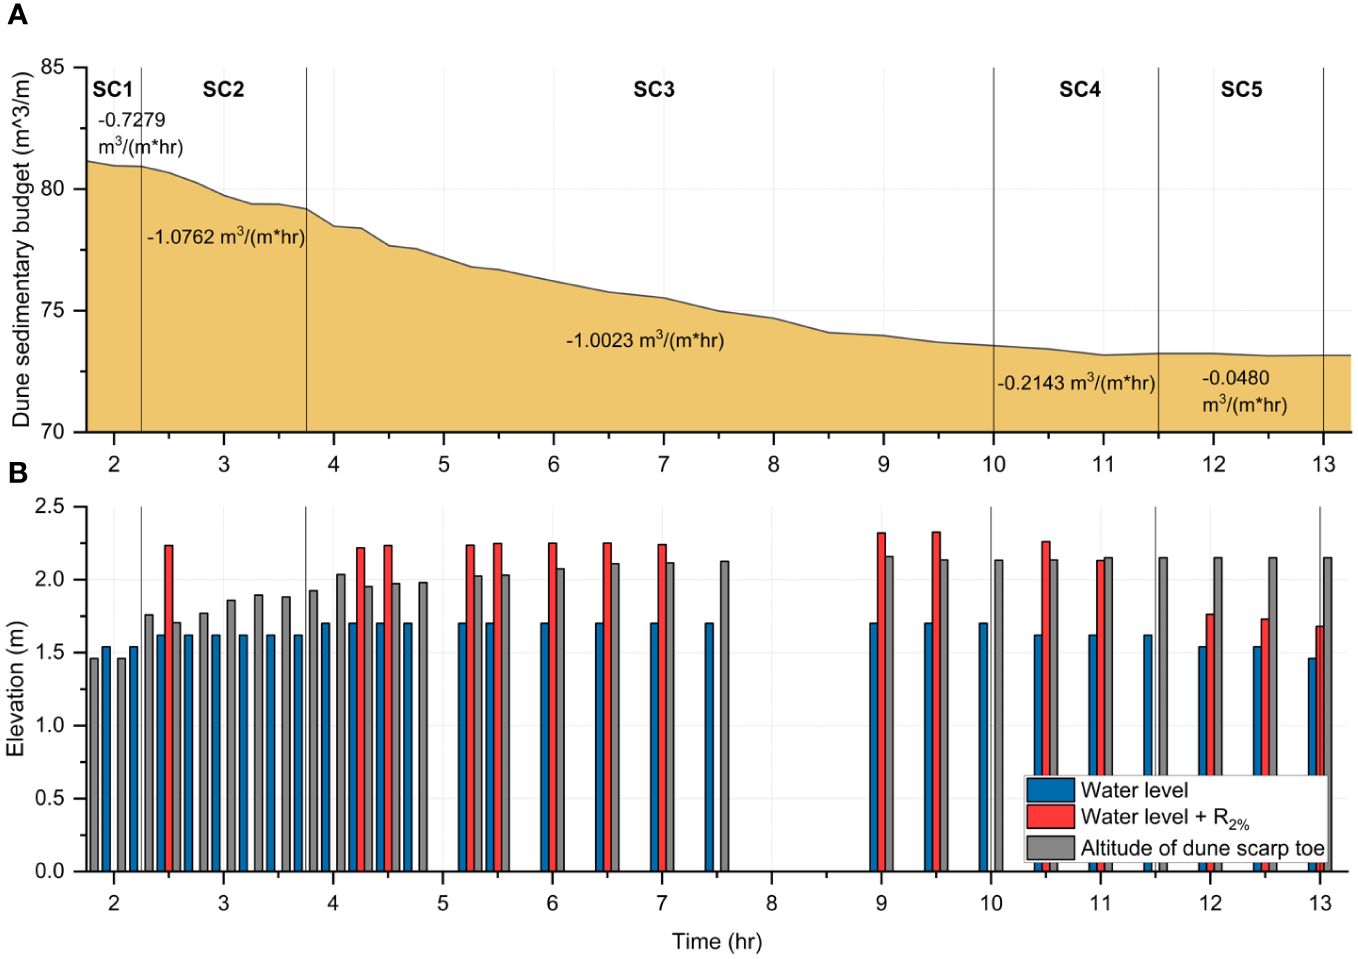
Figure 13 (A) Dune sedimentary budget indicating the erosion rate of the dune and (B) the total water level (red) and the altitude of the dune scarp toe (gray) over time.
Figure 14 presents the observed R2% derived from stereo imagery as a function of wave conditions [(H0L0)0.5]. Despite different wave conditions, it can be observed that R2% values are almost similar when R2% occurred on the dune scarp (refer to Figure 13B). As seen in Figure 9A, the bed profile changed continuously, even under the same wave conditions. The results reveal that when R2% occurs on the dune scarp, it maintains a nearly identical value regardless of different wave and morphological conditions. However, in the case of SC5, R2% occurs at the beach instead of the dune scarp (Figure 13B). In this case, R2% decreases depending on the wave conditions, unlike when R2% occurs at the dune scarp.
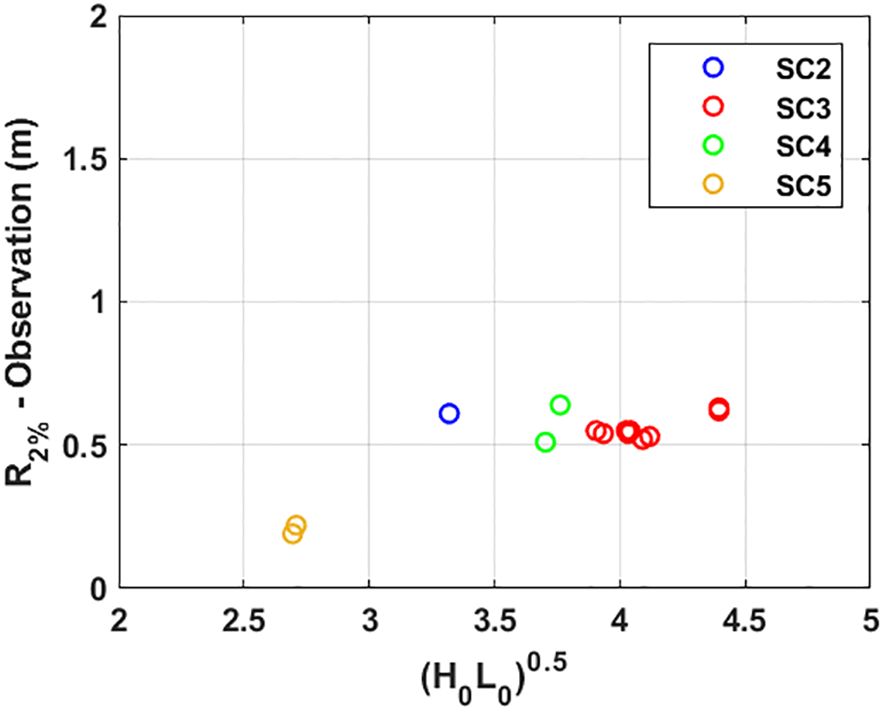
Figure 14 Observed R2% from stereo imagery versus (H0L0)0.5.
Bemmelen et al. (2020) proposed a linear relationship between the dune scarp toe and R2% based on the results from laboratory experiments and field observations. However, Bemmelen et al. (2020) utilized theR2% values estimated using the empirical formula suggested by Stockdon et al. (2006) when analyzing the relationship. The present study compared the estimated R2% through Stockdon et al. (2006) (hereinafter Stockdon formula) and the R2% observed through stereo imagery with the findings of Bemmelen et al. (2020) (Figure 15). The experimental results of SC3 were only used because the R2% occurred on the dune scarp, allowing for a clear comparison between estimated and observed values under the same wave condition. As shown in Figure 15, the estimated R2% obtained using the Stockdon formula (red-filled square) showed a linear relationship with the altitude of the dune scarp (St) with respect to the still water level (SWL), while the observed R2% derived from the stereo imagery technique (blue filled square) remained relatively constant regardless of St relative to SWL. This implies that when R2% occurs on the scarp under the same wave conditions, almost the same values of R2% were observed irrespective of variations in the dune scarp toe elevation, slope, and other topographical characteristics. Furthermore, the Stockdon formula, which performed well in predicting under extreme conditions, fails to accurately reproduce the predicted R2% values that occurred on the dune scarp even when the same input parameters, such as slopes, are used.
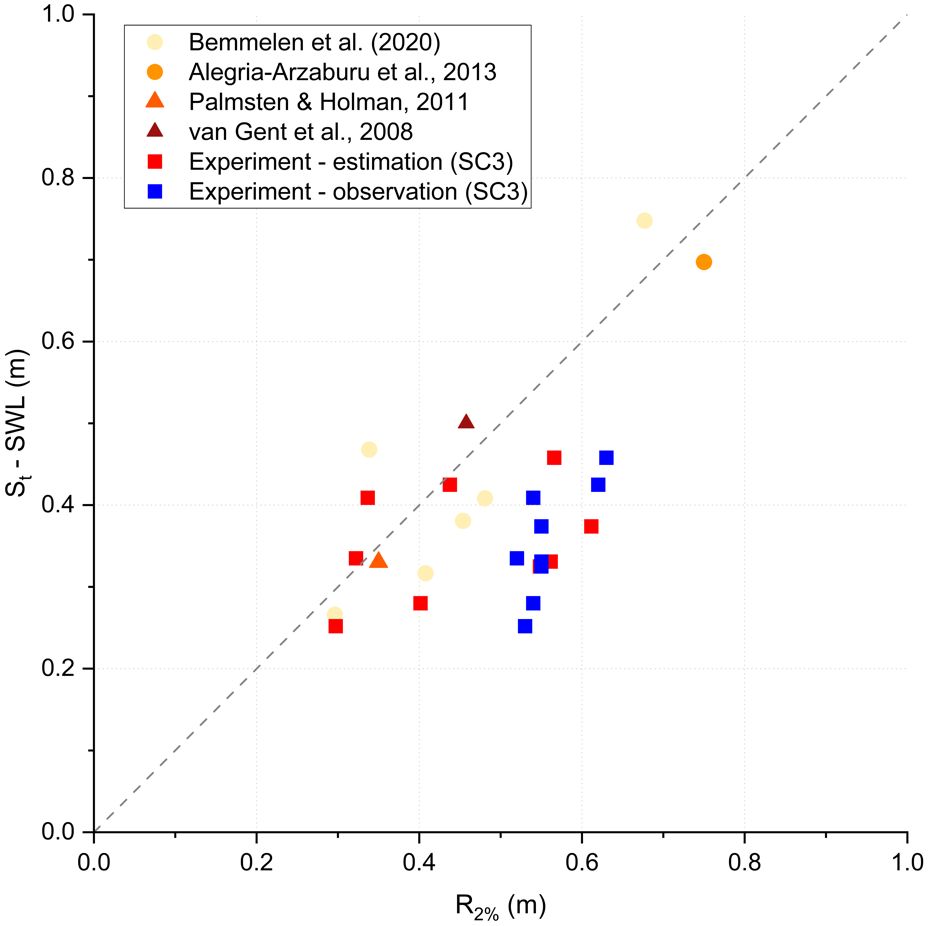
Figure 15 Dune scarp toe elevation (St) with respect to still water level (SWL) versus wave run-up elevation estimated for previous studies and our experiment (red square) compared to the observed R2% values of our experiment (blue square). This plot is originated from Bemmelen et al. (2020).
3.2.2 Estimation: R2%
As mentioned in the “Introduction” section, da Silva et al. (2020) confirmed the effective performance of the Stockdon equation (Equation 6) in estimating R2%in extreme wave conditions. Moreover, this equation is suggested based on the ten field observation results; therefore, implementing the Stockdon equation in run-up prediction is more reliable than other previous equations. Although Atkinson et al. (2017) evaluated eleven empirical formulas based on six field observations, they found the formula proposed by Holman (1986) and Vousdoukas et al. (2012) to be the most accurate. However, since both empirical formulas were derived from a single field observation, these were not used in this study. Instead, the formula proposed by Vousdoukas et al. (2012) was used to evaluate its applicability on R2% prediction when the wave run-up occurred on the dune scarp. Further details will be mentioned in the “Discussion” section.
In the Stockdon formula (Equation 6), the deep water wave height (H0 as an input was calculated using the linear wave theory based on the significant wave height (Hs) measured at WG1 installed offshore (Figure 2). In this case, the shore-normal approach was assumed, following Stockdon et al. (2006). L0, as an input of Equuation 6, is the deep-water wavelength calculated using the peak period, Tp (Equation 1). For the slope (β), this current study considered four different slope estimations.
(1) The average slope with the range of <η> + 2σ, as proposed by Stockdon et al. (2006), was utilized (referred to as βST), where and represent the mean value and standard deviation of the continuous water level measurement, respectively. While Stockdon et al. (2006) proposed slopes based on ten field observations, this study did not consider extreme cases such as the storm or dune scarp. Therefore, other slope estimation approaches were investigated.
(2) The average slope with the range of <η> + σ proposed by Palmsten and Holman (2012) was selected (referred to as βPH). This slope was also suggested through a two-dimensional large-scale movable bed experiment that simulated a single storm and resulted in the formation of the dune scarp. Palmsten and Holman (2012) proposed this slope to improve the reproducibility of characterized run-up height R16%; however, due to the significant variability of <η> and 2σ caused by storm wave conditions with increasing significant wave heights (Hs), it can be challenging to define the foreshore slope during typhoon events. Therefore, considering this factor, βPH was used to investigate its feasibility as an input. In order to compare with the slope range proposed by Stockdon et al. (2006) during the storm, the average slope with the range of <η> + σ was set in this study.
(3) A time-varying mean beach slope between the still water level and dune toe was used (βB; Figure 16). In a recent study by Blenkinsopp et al. (2016), the differences in wave run-up predictions were examined by comparing the utilization of swash zone slope and surf zone slope in prototype-scale laboratory experiments (BARDEX2). The findings revealed that the prediction based on the swash zone slope exhibited significantly greater accuracy than those based on the surf zone slope. During storm conditions, the swash predominantly occurred on the range from SWL to the dune scarp toe (beach slope, βB) due to the setup and storm surge. Also, the beach slope is one of the morphological properties indicating dune vulnerability and should be up-to-date to estimate coastal risks appropriately (Cohn et al., 2021). Therefore, this study used βB for parameterization to investigate the feasibility of prediction R2% on the dune scarp.
(4) Dune slope refers to the slope from the dune toe to the dune crest (βD; Figure 16). Since R2% occurred on the dune scarp, the foredune slope was also examined to understand its association. These different slopes were calculated and indicated in Table 4.
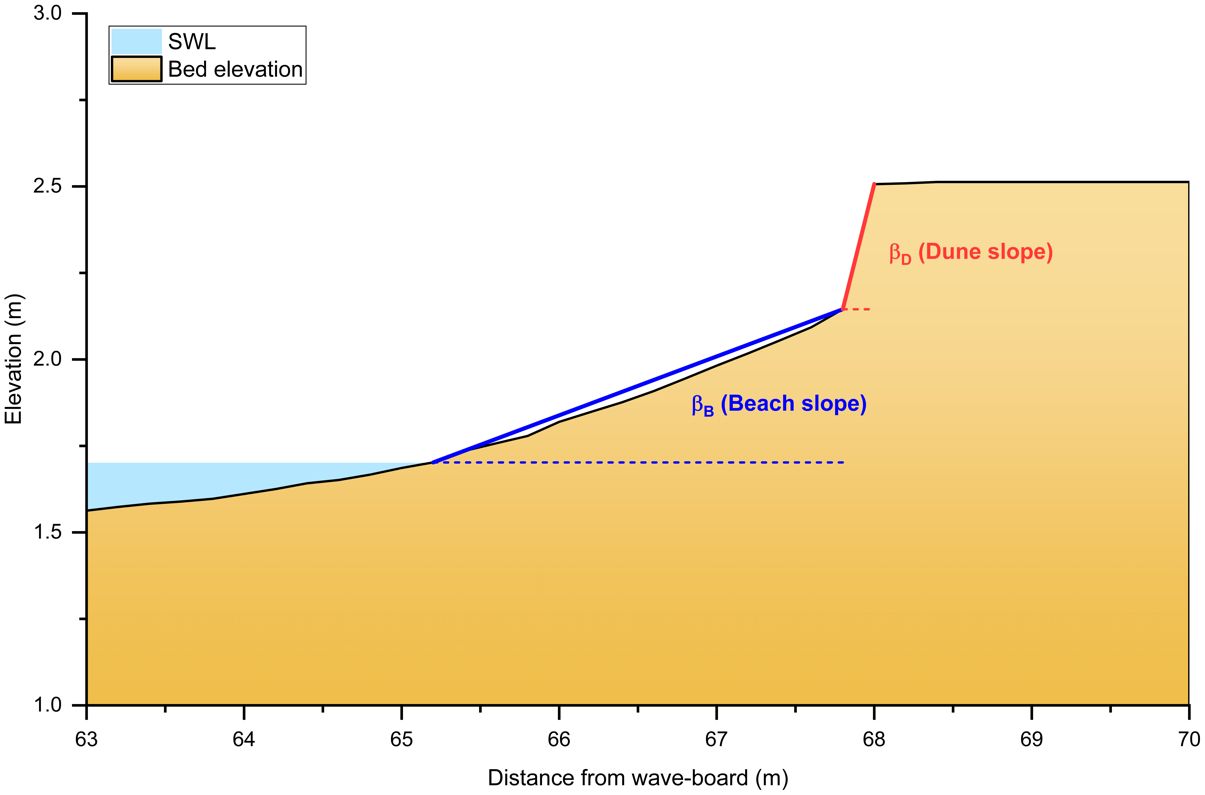
Figure 16 Graphic illustration to define beach and dune slope (βB, βD) in this study.
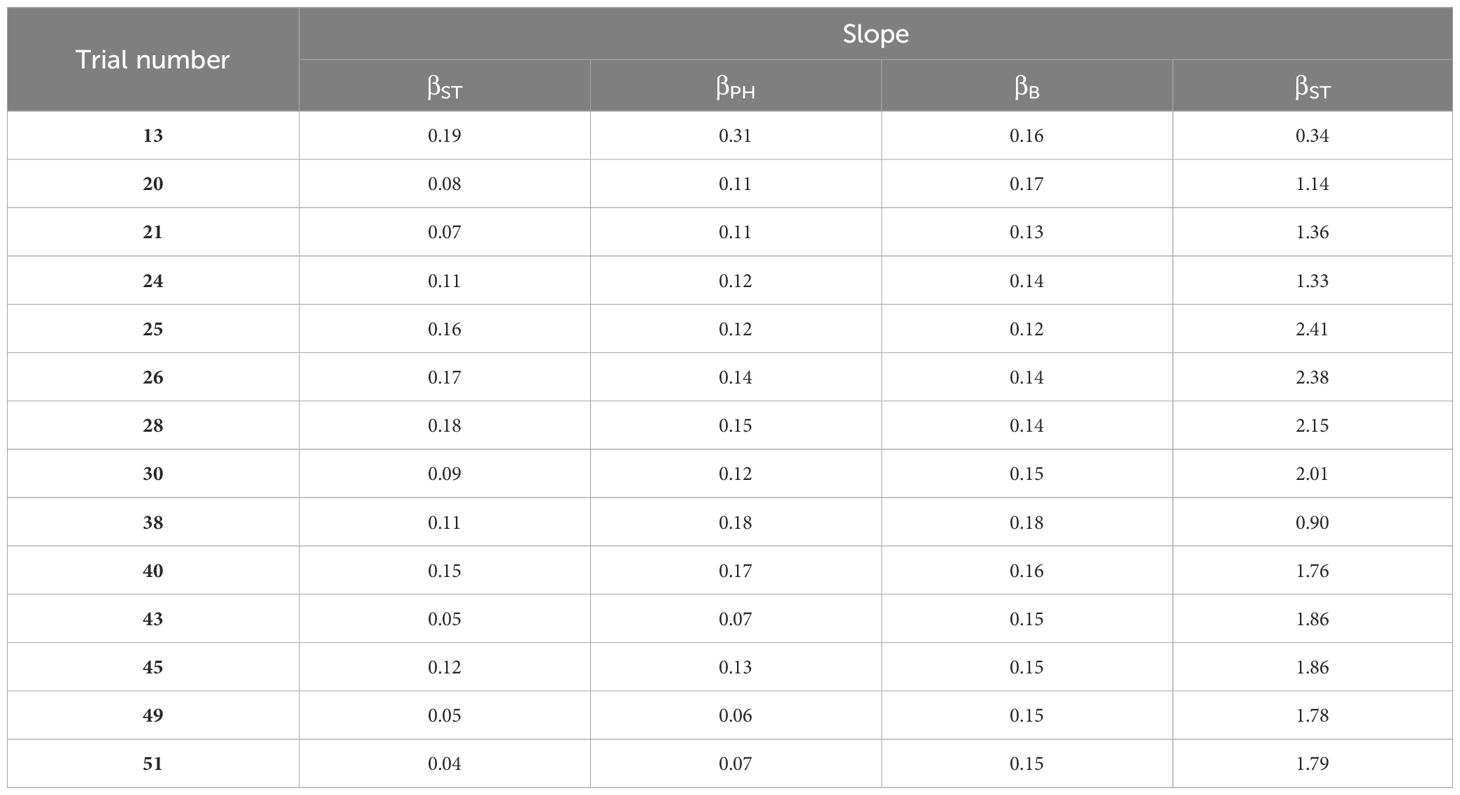
Table 4 Slope values calculated according to each slope (βST, βPH, βB, βD).
According to da Silva et al. (2020), defining a single formulation that can adequately estimate wave run-up in such a wide range of conditions, including morphological changes, is challenging. Therefore, this study aims to examine the required slope for investigating the feasibility and improving the accuracy of existing empirical formulas (Stockdon formula) as preliminary research of R2% occurring on the dune scarp rather than proposing a new empirical formula.
Additionally, the surf zone slope was not considered in this study because Stockdon et al. (2006) and da Silva et al. (2020) indicated that the surf zone slope does not provide a significant improvement over βST. Furthermore, using swash zone slope exhibited a better accuracy in estimating wave run-up than surf zone slope (Blenkinsopp et al., 2016).
Table 5 represents the estimated R2% values considering all the abovementioned inputs. It specifically shows the R2% calculated based on each slope (βST, βPH, βB, βD).
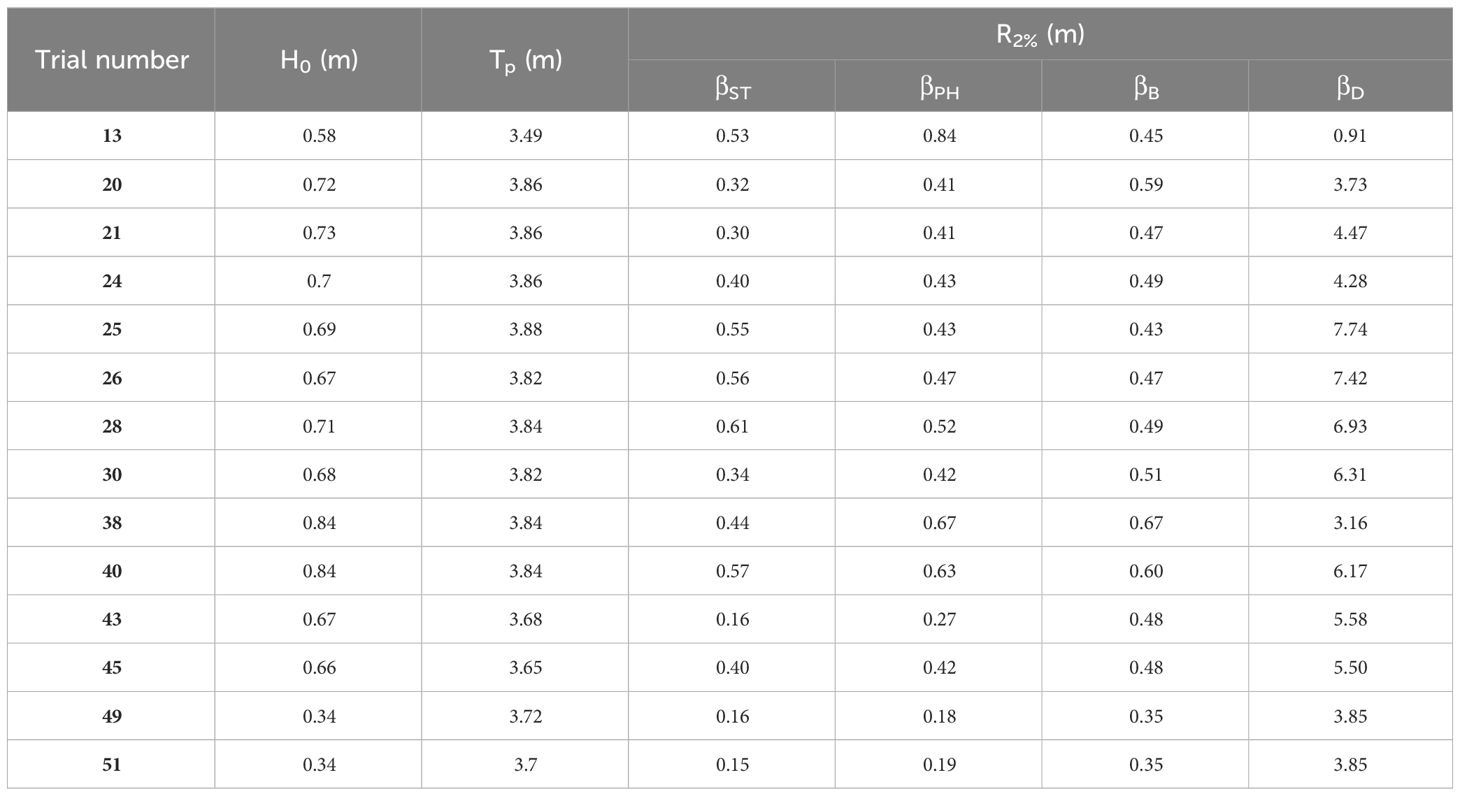
Table 5 Estimated R2% from Stockdon formula when using slope βST, βPH, βB, and βD.
3.2.3 Comparison between observed and estimated R2%
Figure 17 presents a comparative analysis between the observed and estimated R2% values in relation to each slope parameter (βST, βPH, βB, βD), indicating the potential applicability of slope parameters to enhance predictive accuracy when encountering R2% scenarios on either the scarp or beach. It shows which slope should be applied when R2% occurs on the scarp or beach to improve accuracy for prediction. Figure 17 indicates that using the slopes, βST and βPH, resulted in an underestimation of R2% in most storm cases; however, a significant overestimation was witnessed in using dune slope (βD). However, using the slope, βB, when wave run-up on the dune scarp, improves the estimation accuracy (SC2-SC4). Table 6 shows the accuracy of wave run-up parameterization according to each slope. is the mean value of the RMSE of each storm condition and was calculated to evaluate the prediction accuracy, while the mean difference error, was calculated and indicated in Table 6. values of SC3 according to the slope, when R2% occurred on the dune scarp, were 0.1470, 0.0920, 0.0655, and 5.2705 for βST, βPH, βB, βD, respectively. Compared to the results of Stockdon et al. (2006) (refer to Table 4 in Stockdon et al., 2006), the error range of both and from this study is smaller than Stockdon et al. (2006). The findings reveal that R2% derived from the Stockdon equation incorporating the beach slope parameter exhibited a better agreement with observed R2% values using the stereo imagery technique than other types of slopes. Compared to the slopes βST and βPH, using the beach slope (βB) has the practical advantage of requiring only the morphological survey data. During the storm event, when R2% does not occur on the dune scarp (SC5), using βPH instead of the βST resulted in slightly higher accuracy in predicting R2% (Figures 17A, B), which is attributed to the wide variation of <η> and 2σ caused by storm wave conditions.
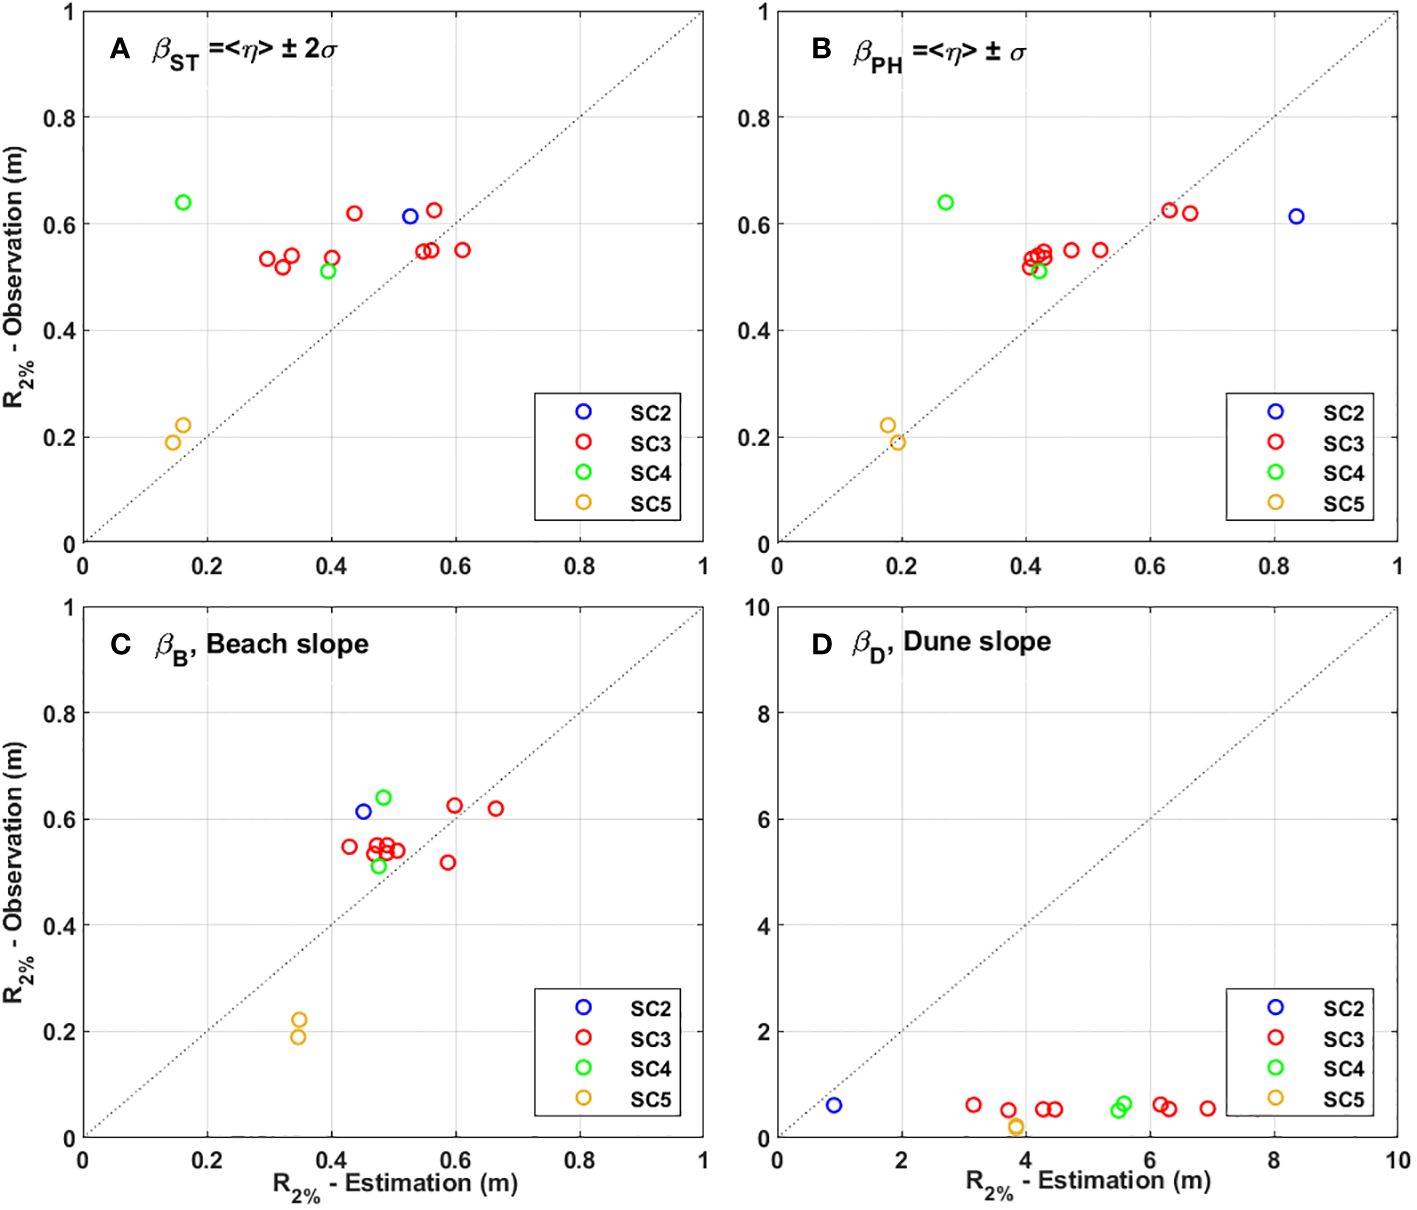
Figure 17 Comparison between the observed R2% and the estimated R2% from the Stockdon formula when using slope (A) average slope derived from Stockdon equations (βST), (B) average slope derived from Palmsten and Holman equations βPH, (C) averaged beach slope (βB), and (D) averaged dune slope (βD), respectively.
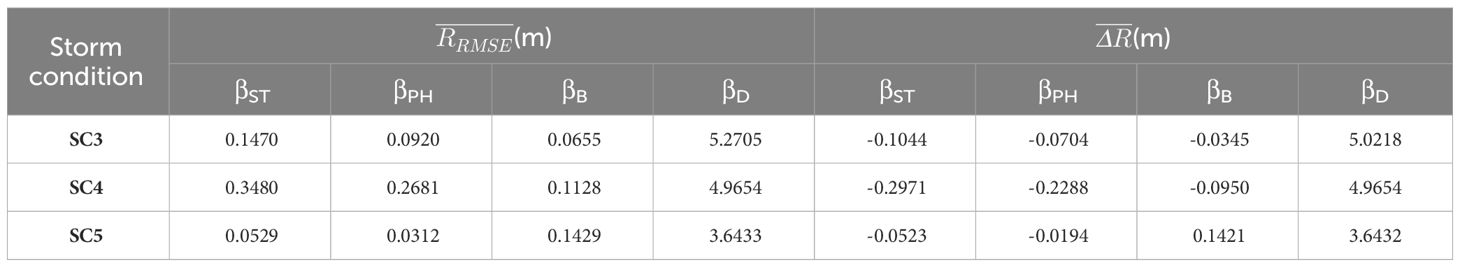
Table 6 Accuracy of wave run-up parameterization according to each slope βST, βPH, βB, and βD.
4 Discussion
4.1 Characteristics of morphological change
Initially, a comprehensive overview of morphological changes has been presented in “Section 2.4”. Therefore, in this section, this study aims to discuss the slope and the location of the dune scarp toe.
This study proposed the use of βB (beach slope) when estimating R2% occurred on the dune scarp. During SC2, SC3, and SC4 (specifically Trial 43), when R2% occurred on the dune scarp, as shown in Figure 13B, the total water level (Still water level + R2%) was approximately 2.2 m. The reason is that the wave run-up is limited by the dune or dune scarp. In contrast, the consistently observed R2% limited by the dune or dune scarp, both βST and βPH resulted in the varying ranges of the slope depending on wave conditions, as well as rapid changes in morphology (Table 4). Even under the same wave conditions, the values of βST and βPH had variations due to the rapid changes in morphology. However, as shown in Table 4, βB yields relatively consistent slope values compared to βST and βPH. Therefore, when using βB, it is recognized that accurate estimations of R2% can be obtained through the Stockdon formula.
Furthermore, the Root Mean Square Error (RMSE) and Mean Absolute Error (MAE) between the βB for each wave run and the first-order polynomial fitting curve from the trajectory of the dune scarp toe during SC2-SC3 (Figure 12) had slight differences, with values of 0.0097 and 0.0086, respectively. This result supported Palmsten and Holman (2012) that the dune scarp toe movement corresponds to the foreshore beach slope. Therefore, the dune scarp toe moved in accordance with βB, extending from the still water level to the dune toe. It is considered that this result could lead to more accurate predictions when forecasting the erosion and retreat of the dune through numerical modeling, particularly regarding the location of the dune scarp toe.
4.2 Storm impact scale
In this study, the proposed slope parameter (βB) was utilized to determine the storm impact scale, along with the remaining factors calculated based on Sallenger (2000). Figure 18A represents the results calculated using the initial bed profile and incident wave conditions, while Figure 18B illustrates the results considering the wave conditions obtained from WG1 and the consequent alternations in the bed profiles induced by the waves. As shown in Figure 18A, when evaluating the storm impact scale based on the initial bed profile, it is anticipated that overwash would occur during the storm event. However, during this experiment, overwash did not occur, and the coastal dune served as a natural barrier or seawall, attenuating wave run-up. Collision of the dune was observed during this experiment as a maximum scenario, which aligns with the results in Figure 18B. Therefore, when embarking on the design of artificial sand dunes based on the initial bed profile, there exists a possibility of overdesigning the structures in anticipation of the storm-induced overwash. Consequently, it is recommended to consider the proposed slope (βB) and account for the dynamic changes in bed profile resulting from the storms when designing the artificial dunes.
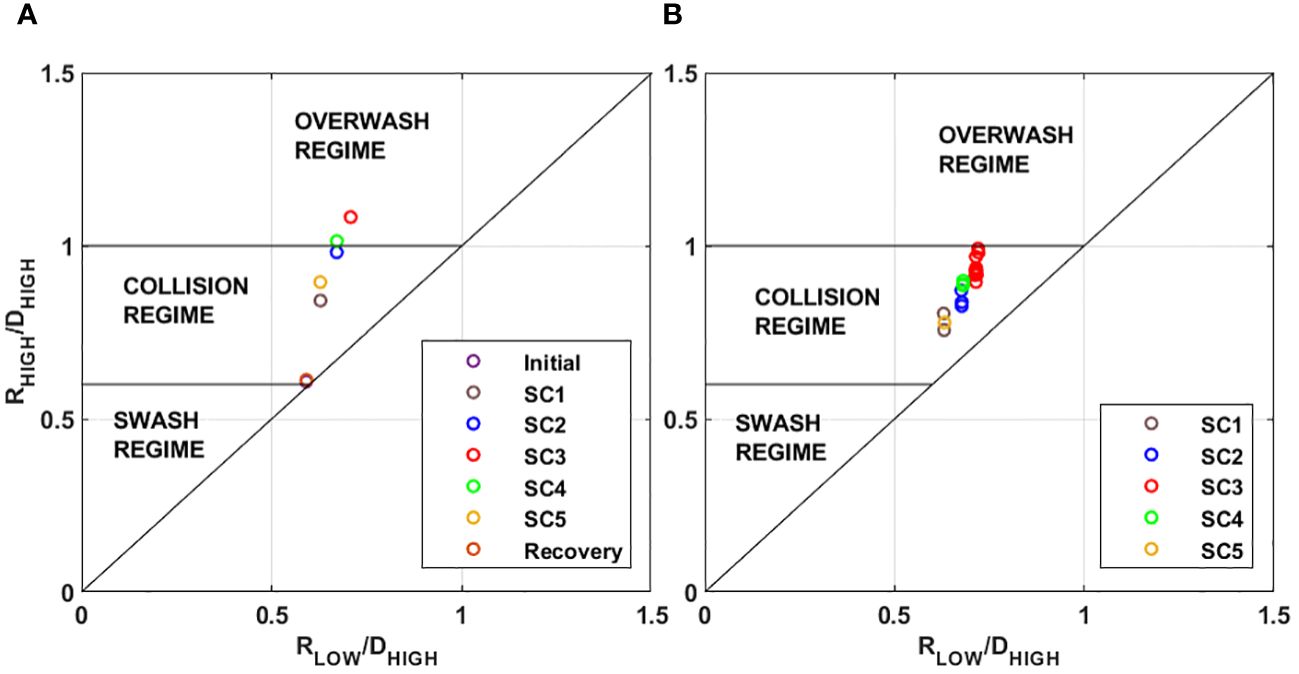
Figure 18 Storm impact scale of our experiment when using (A) initial bed profile and (B) bed profile after each wave-run.
4.3 Observation: R2%
The observed R2% obtained through the stereo imagery technique in this experiment compared with the empirical formula for R2% of coastal dikes and embankment seawalls proposed by van der Meer et al. (2018), known as EurOtop (2018) (refer to Figure 19). Although, in our experiment, the breaker parameter (Irribaren number) is relatively small compared to the hard structures, the dimensionless wave run-up values were approximately uniform, with an average value of 0.785, similar to the embankment seawalls. It seems that when the R2% occurred on the dune scarp (cliff), the dune scarp acted like a vertical wall. So, even though the beach slope (βB) was slightly changed, the values of dimensionless R2% were approximately constant.
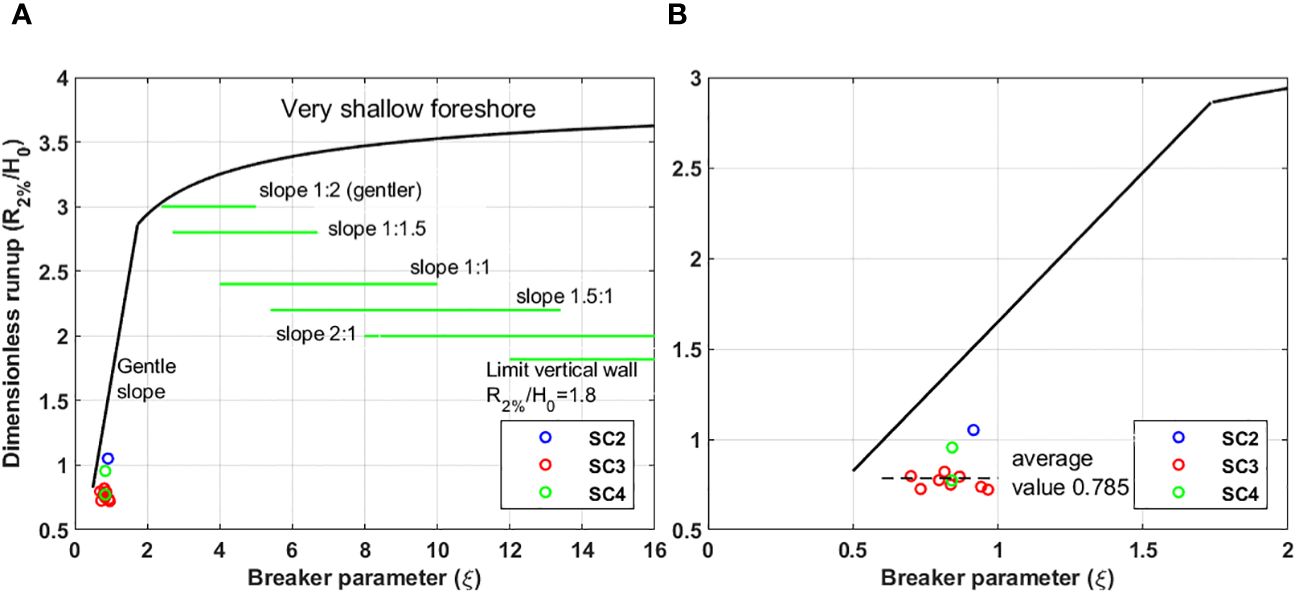
Figure 19 Observed R2% values from the stereo imagery plotted with the empirical formula for R2% of coastal dikes and embankment seawalls based on EurOtop (2018).
4.4 Estimation: R2%
Atkinson et al. (2017) evaluated eleven empirical formulas for estimating R2% and concluded that the formulas suggested by Hunt and Vousdoukas et al. (2012) had the highest accuracy. However, both empirical formulas were based on a single field observation dataset. Additionally, the slope used by Atkinson et al. (2017) considered the range from the breaking point to the 2% wave rundown limit. However, finding the breaking point in the surf zone is difficult, posing engineering challenges to define it accurately. According to Stockdon et al. (2006), a slight improvement was applied to the surf zone slope to estimate R2%. When comparing our experimental observations with the formula proposed by Vousdoukas et al. 2012 to investigate the feasibility of the Vousdouskas formula for predicting R2% occurred on the dune scarp. The result indicates an overestimation of R2% regardless of which slope to use (Figure 20) because wave run-up may be truncated or overtopped by beach scarps, cliffs, and dunes, leading to different tail shapes in probability density functions in extreme events (Vousdoukas et al., 2012). However, in this experiment, which simulated a single storm event, overwash did not occur due to the dune scarp, and the collision regime was reached instead. Therefore, when R2% occurs on the dune scarp, it is suggested to use the Stockdon formula with a beach slope (βB).
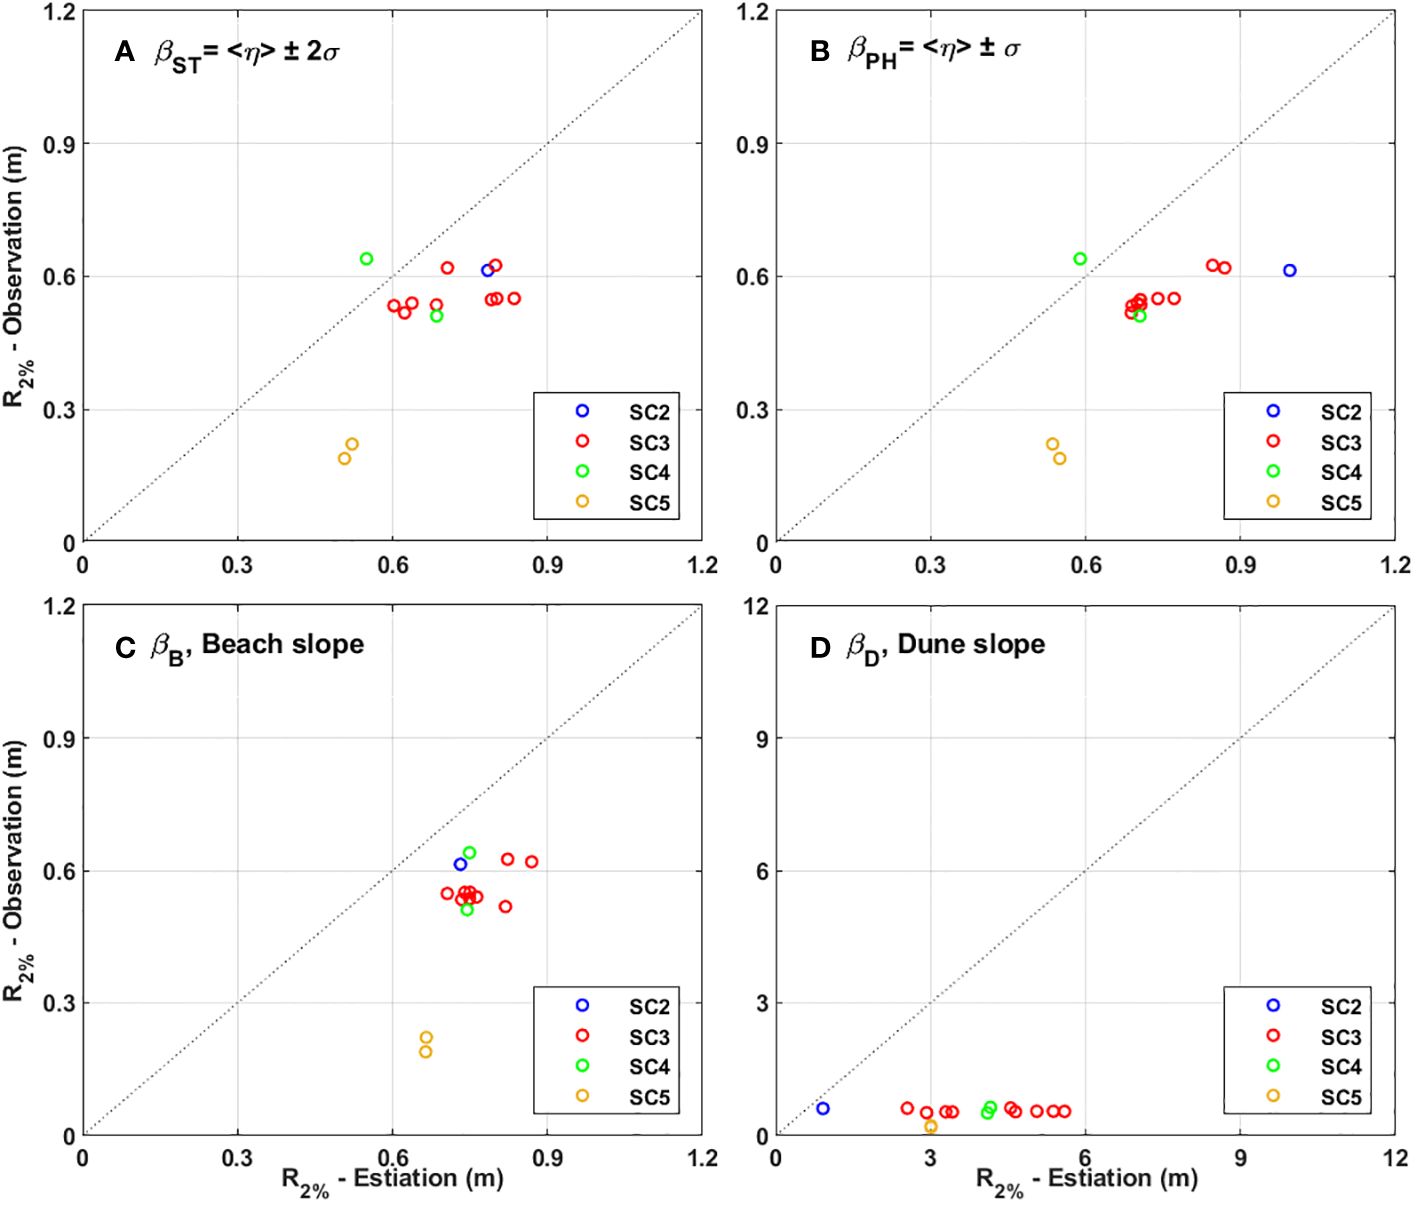
Figure 20 Comparison between the observed R2% and the estimated R2% from the Vousdouskas formula when using slope (A) βST, (B) βPH, (C) βB, and (D) βD, respectively.
4.5 Future work
In this study, the laboratory experiment contains several uncertainties since the specific processes have not been thoroughly quantified, such as bar migration, sediment grain sizes, and scale effects. First, a series of large-scale experiments for an entire simplified storm, including pre-storm (initial), storm (SC1~SC5), and post-storm (Recovery), interacting with a beach-dune system were conducted to investigate the wave hydrodynamic patterns and morphological changes. The coastal dunes experienced significant erosion during the storm with high surge levels and extreme waves, causing the dune face to be eroded and the sediment transported towards seaward, forming the inner sandbar around a cross-shore distance of 50 m. However, the inner bar is completely washed in the recovery process and the outer bar is located between 32 m and 38 m in the beach profile. Sandbar migration is driven by a combination of hydrodynamic processes, sediment transport, and morphological systems. Understanding the detailed mechanism of sandbar migration is challenging and complex; therefore, this phenomenon is negligible in this study. Thus, further work is needed to identify the mechanism to provide useful information on wave runup estimation.
Second, several previous studies (e.g., van de Graaff et al., 1977; Vellinga, 1981) conducted a series of laboratory experiments to examine the influence of grain size on the beach-dune profile. The results indicate that the coastal dune has fine sediment with smaller settling velocities, and would experience greater total erosion volumes, and a broader settling area, resulting in milder-sloped dunes with lower dune toes (van Wiechen et al., 2023). In addition, wave runup height depends strongly on the foreshore beach slope and surface roughness, both of which relate directly to the sediment grain size characteristics. Steeper coarse-grained beaches tend to allow less wave runup excursion, while flatter fine-grained beaches are more susceptible to greater inland flooding. However, the increased roughness of coarser sediments also enhances the frictional dissipation of wave uprush and backwash motions. Finer sediments provide less resistance to swash flows across the beach-dune system. In detail, the standard empirical formula for wave runup height estimation includes the foreshore beach slope tanβ which can be related to the equilibrium beach profile shape and the sediment scale parameter, which correlates with the mean sediment size. Therefore, coarser grains would produce higher tanβ values and lower predicted runup, while finer sediment yields lower tanβ and higher estimates of wave runup extent. In addition, the roughness coefficient in wave runup formulas accounts for frictional resistance to swash zone flows. This drag resistance depends greatly on the size and distribution of beach sediment and bedforms. Therefore, the grain size fundamentally impacts beach slope, equilibrium profile shape, and surface roughness, it is a vital factor that must be well characterized across beach-dune profiles to produce reliable estimation of wave runup heights. Investigation of grain size variability is essential to improve wave run prediction capabilities of wave runup, providing useful information on risk assessments and management of coastal flood impacts.
5 Conclusion
In this study, a series of two-dimensional large-scale experiments were conducted to evaluate the feasibility of using existing empirical formulas and suggest the slope as an input of empirical formula to estimate R2% when the wave run-up is influenced by the dune scarp.
The large-scale movable bed experiment replicates a single storm event to investigate the erosion and restoration mechanism of the dunes and sediment. The hydrodynamics were observed using wave gauges, an electromagnetic current meter, an acoustic Doppler velocimeter, an acoustic Doppler velocimeter profiler, and a pair of stereo cameras, while the morphological changes were measured at 20 cm intervals using Level Stuff and an echo-Logger.
Three-dimensional water surface elevation was extracted using the stereo imagery technique in shallow water. Based on this result, swash motion and setup were measured. Therefore, R2% was calculated following Stockdon et al. (2006). Also, in this experiment, the wave run-up was affected by the dune scarp during SC2-4. And swash and collision regimes in storm impact scales occurred.
The conclusions drawn from this experiment are as follows:
1. The dune scarp was formed and retreated during an entire storm event, in which slumping occurred particularly during the initial phase of the storm (SC1), and the slumping area increased over time. The dune scarp was clearly formed in SC2, and the dune scarp toe could be clearly identified. In the greatest erosive case, SC3, the dune scarp retreated with slumping. In the subsequent stages, when the storm weakened (SC4 and SC5), swash motion mainly occurred on the foreshore slope, and there was no further retreat of the dune scarp and dune erosion. The findings confirm that R2% is an essential factor in dune erosion.
2. When wave run-up was influenced by the dune scarp, R2% was consistently observed regardless of morphological changes. This study showed that the dune scarp acted like a seawall compared to EurOtop (2018).
3. For R2% occurred on the dune scarp, this study suggests using the Stockdon formula with beach slope, βB (from still water level to the dune toe). This approach yielded the highest accuracy and consistency in estimating R2% based on experimental and field observation data.
4. The elevation of the dune scarp toe was observed to follow the beach slope, βB, consistent with Palmsten and Holman (2012).
5. When using numerical models to predict dune erosion, the results shown in this study could contribute to an improvement in the accuracy of predicting the form of the dune when R2% occurs on the dune scarp. This information can also be applied to the design of artificial dune structures.
6. When using the storm impact scale to predict dune erosion during storms, this study suggested using beach slopes, βB and up-to-date morphological change to avoid overprediction of dune erosion.
Data availability statement
The original contributions presented in the study are included in the article/supplementary material. Further inquiries can be directed to the corresponding author.
Author contributions
EL: Conceptualization, Data curation, Formal analysis, Methodology, Software, Visualization, Writing – original draft, Writing – review & editing. HD: Conceptualization, Data curation, Investigation, Methodology, Visualization, Writing – original draft, Writing – review & editing. SS: Conceptualization, Data curation, Funding acquisition, Methodology, Project administration, Supervision, Writing – review & editing. JY: Conceptualization, Data curation, Investigation, Methodology, Software, Visualization, Writing – review & editing. HP: Conceptualization, Investigation, Methodology, Supervision, Writing – review & editing.
Funding
The author(s) declare financial support was received for the research, authorship, and/or publication of this article. This work was supported by the National Research Foundation of Korea (NRF) grant funded by the Korean government (MSIT) (No. 2022R1F1A1071641) and Korean Institute of Marine Science & Technology Promotion (KIMST) funded by the Ministry of Oceans and Fisheries, Korea (No. RS-2023-00256687).
Acknowledgments
We thank research groups at Chonnam National University and Korean Marine & Ocean University for conducting the experimental campaigns.
Conflict of interest
The authors declare that the research was conducted in the absence of any commercial or financial relationships that could be construed as a potential conflict of interest.
Publisher’s note
All claims expressed in this article are solely those of the authors and do not necessarily represent those of their affiliated organizations, or those of the publisher, the editors and the reviewers. Any product that may be evaluated in this article, or claim that may be made by its manufacturer, is not guaranteed or endorsed by the publisher.
References
Anfuso G., Dominguez L., Gracia F. J. (2007). Short and medium-term evolution of a coastal sector in Cadiz, SW Spain. Catena 70, 229–242. doi: 10.1016/j.catena.2006.09.002
Atkinson A. L., Power H. E., Moura T., Hammond T., Callaghan D. P., Baldock T. E. (2017). Assessment of run-up predictions by empirical models on non-truncated beaches on the south-east Australian coast. Coast. Eng. 119, 15–31. doi: 10.1016/j.coastaleng.2016.10.001
Bemmelen C. W. T., De Schipper M. A., Darnall J., Aarninkhof S. G. J. (2020). Beach scarp dynamics at nourished beaches. Coast. Eng. 160, 103725. doi: 10.1016/j.coastaleng.2020.103725
Benetazzo A., Barbariol F., Bergamasco F., Bertotti L., Yoo J., Shim J.-S., et al. (2021). On the extreme value statistics of spatio-temporal maximum sea waves under cyclone winds. Prog. Oceanography 197, 102642. doi: 10.1016/j.pocean.2021.102642
Benetazzo A., Bergamasco F., Yoo J., Cavaleri L., Kim S. S., Bertotti L., et al. (2018). Characterizing the signature of a spatio-temporal wind wave field. Ocean Model. 129, 104–123. doi: 10.1016/j.ocemod.2018.06.007
Bergamasco F., Benetazzo A., Yoo J., Torsello A., Barbariol F., Jeong J.-Y., et al. (2021). Toward real-time optical estimation of ocean waves’ space-time fields. Comput. Geosciences 147, 104666. doi: 10.1016/j.cageo.2020.104666
Bergamasco F., Torsello A., Sclavo M., Barbariol F., Benetazzo A. (2017). WASS: An open-source pipeline for 3D stereo reconstruction of ocean waves. Comput. Geosciences 107, 28–36. doi: 10.1016/j.cageo.2017.07.001
Beuzen T., Goldstein E. B., Splinter K. D. (2019). Ensemble models from machine learning: an example of wave run-up and coastal dune erosion. Natural Hazards Earth System Sci. 19, 2295–2309. doi: 10.5194/nhess-19-2295-2019
Blenkinsopp C. E., Matias A., Howe D., Castelle B., Marieu V., Turner I. L. (2016). Wave run-up and overwash on a prototype-scale sand barrier. Coast. Eng. 113, 88–103. doi: 10.1016/j.coastaleng.2015.08.006
Ciavola P., Ferreira O., Dongeren A. V., Vries J. V. T. D., Armaroli C., Harley M. (2014). Prediction of storm impacts on beach and dune systems. Hydrometeorological Hazards 3.4, 227–252. doi: 10.1002/9781118629567.ch3d
Cohn N., Brodie K. L., Johnson B., Palmsten M. L. (2021). Hotspot dune erosion on an intermediate beach. Coast. Eng. 170, 103998. doi: 10.1016/j.coastaleng.2021.103998
D’Alessandro F., Tomasicchio G. R., Frega F., Leone E., Francone A., Pantusa D., et al. (2022). Beach–dune system morphodynamics. J. Mar. Sci. Eng. 10, 627. doi: 10.3390/jmse10050627
da Silva P. G., Coco G., Garnier R., Klein A. H. (2020). On the prediction of run-up, setup and swash on beaches. Earth-Science Rev. 204, 103148. doi: 10.1016/j.earscirev.2020.103148
Davidson S. G., Hesp P. A., Silva G. M. D. (2020). Controls on dune scarping. Prog. Phys. Geography: Earth Environ. 44, 923–947. doi: 10.1177/0309133320932880
Davison S., Benetazzo A., Barbariol F., Ducrozet G., Yoo J., Marani M. (2022). Space-time statistics of extreme ocean waves in crossing sea states. Front. Mar. Sci. 9. doi: 10.3389/fmars.2022.1002806
Didier D., Caulet C., Bandet M., Bernatchez P., Dumont D., Augereau E., et al. (2020). Wave run-up parameterization for sandy, gravel and platform beaches in a fetch-limited, large estuarine system. Continental Shelf Res. 192, 104024. doi: 10.1016/j.csr.2019.104024
Durán R., Guillén J., Ruiz A., Jiménez J. A., Sagristā E. (2016). Morphological changes, beach inundation and overwash caused by an extreme storm on a low-lying embayed beach bounded by a dune system (NW Mediterranean). Geomorphology 274, 129–142. doi: 10.1016/j.geomorph.2016.09.012
Fontán-Bouzas A., Andriolo U., Silva P. A., Baptista P. (2022). Wave impact analysis on a beach-dune system to support coastal management and nourishment works: the showcase of Mira, Portugal. Front. Mar. Sci. 9. doi: 10.3389/fmars.2022.861569
Goda Y. (2010). Random seas and design of maritime structures Vol. 33 (World Scientific). doi: 10.1142/ASOE
Harley M. D., Ciavola P. (2013). Managing local coastal inundation risk using real-time forecasts and artificial dune placements. Coast. Eng. 77, 77–90. doi: 10.1016/j.coastaleng.2013.02.006
Hirschmuller H. (2008). Stereo processing by semiglobal matching and mutual information. IEEE Trans. Pattern Anal. Mach. Intell. 30 (2), 328–341. doi: 10.1109/TPAMI.2007.1166
Holman R. A. (1986). Extreme value statistics for wave run-up on a natural beach. Coast. Eng. 9, 527–544. doi: 10.1016/0378-3839(86)90002-5
Holman R. A., Sallenger A. H. Jr. (1985). Setup and swash on a natural beach. J. Geophysical Research: Oceans 90, 945–953. doi: 10.1029/JC090iC01p00945
Houser C., Ellis J. (2013). Beach and dune interaction. Treatise Geomorphology 10, 267–288. doi: 10.1016/B978-0-12-374739-6.00283-9
Hunt I. A. Jr. (1959). Design of seawalls and breakwaters. J. waterways harbors division 85, 123–152. doi: 10.1061/JWHEAU.0000129
Jackson D. W., Costas S., Guisado-Pintado E. (2019). Large-scale transgressive coastal dune behaviour in Europe during the Little Ice Age. Global Planetary Change 175, 82–91. doi: 10.1016/j.gloplacha.2019.02.003
Jin H., Do K., Shin S., Cox D. (2021). Process-Based model prediction of coastal dune erosion through parametric calibration. J. Mar. Sci. Eng. 9, 635. doi: 10.3390/jmse9060635
Luijendijk A., Hagenaars G., Ranasinghe R., Baart F., Donchyts G., Aarninkhof S. (2018). The state of the world’s beaches. Sci. Rep. 8, 1–11. doi: 10.1038/s41598-018-24630-6
Ma Y., Soatto S., Košecká J., Sastry S. (2004). An invitation to 3-d vision: from images to geometric models (Vol. 26) (New York: springer). Available at: https://www.eecis.udel.edu/~cer/arv/readings/old_mkss.pdf.
Mase H., Iwagaki Y. (1984). “Run-up of random on gentle slopes,” in Proc. of 19th Conference on Coastal Engineering, Houston, Texas. 593–609.
Mentaschi L., Vousdoukas M. I., Pekel J. F., Voukouvalas E., Feyen L. (2018). Global long-term observations of coastal erosion and accretion. Sci. Rep. 8, 12876. doi: 10.1038/s41598-018-30904-w
Neumann B., Vafeidis A. T., Zimmermann J., Nicholls R. J. (2015). Future coastal population growth and exposure to sea-level rise and coastal flooding-a global assessment. PloS One 10, e0118571. doi: 10.1371/journal.pone.0118571
Nielsen P., Hanslow D. J. (1991). Wave run-up distributions on natural beaches. J. Coast. Res. 7 (4), 1139–1152. Available at: https://www.jstor.org/stable/4297933.
Pagán J. I., Bañón L., López I., Bañón C., Aragonés L. (2019). Monitoring the dune-beach system of Guardamar del Segura (Spain) using UAV, SfM and GIS techniques. Sci. total Environ. 687, 1034–1045. doi: 10.1016/j.scitotenv.2019.06.186
Palmsten M. L., Holman R. A. (2012). Laboratory investigation of dune erosion using stereo video. Coast. Eng. 60, 123–135. doi: 10.1016/j.coastaleng.2011.09.003
Palmsten M. L., Splinter K. D. (2016). Observations and simulations of wave run-up during a laboratory dune erosion experiment. Coast. Eng. 115, 58–66. doi: 10.1016/j.coastaleng.2016.01.007
Phillips J. D. (2018). Environmental gradients and complexity in coastal landscape response to sea level rise. Catena 169, 107–118. doi: 10.1016/j.catena.2018.05.036
Pistellato M., Bergamasco F., Torsello A., Barbariol F., Yoo J., Jeong J.-Y., et al. (2021). A physics-driven CNN model for real-time sea waves 3D reconstruction. Remote Sens. 13, 3780. doi: 10.3390/rs13183780
Richter A., Faust D., Maas H. G. (2013). Dune cliff erosion and beach width change at the northern and southern spits of Sylt detected with multi-temporal Lidar. Catena 103, 103–111. doi: 10.1016/j.catena.2011.02.007
Roberts T. M., Wang P., Kraus N. C. (2007). Limits of beach and dune erosion in response to wave run up from large-scale laboratory data, Geology Faculty Publications (University of South Florida). Available at: https://apps.dtic.mil/sti/pdfs/ADA481986.pdf. Paper 192.
Sallenger A. H. Jr. (2000). Storm impact scale for barrier islands. J. Coast. Res. 16 (3), 890–895. Available at: https://www.jstor.org/stable/4300099.
Stockdon H. F., Holman R. A., Howd P. A., Sallenger A. H. Jr. (2006). Empirical parameterization of setup, swash, and run-up. Coast. Eng. 53, 573–588. doi: 10.1016/j.coastaleng.2005.12.005
Suh K. D., Kwon H. D., Lee D. Y. (2010). Some statistical characteristics of large deepwater waves around the Korean Peninsula. Coast. Eng. 57, 375–384. doi: 10.1016/j.coastaleng.2009.10.016
US Army Corps of Engineers. (2013). Hurricane Sandy Coastal Projects Performance Evaluation Study (US Army Corps of Engineers). Available at: https://asbpa.org/wp-content/uploads/2016/04/Sandy-Coastal-Projects-Performance-FINAL.pdf.
van de Graaff J. (1977). Dune erosion during a storm surge. Coast. Eng. 1, 99–134. doi: 10.1016/0378-3839(77)90010-2
van der Meer J. W., Allsop N. W. H., Bruce T., De Rouck J., Kortenhaus A., Pullen T., et al. (2018). EurOtop: Manual on wave overtopping of sea defences and related structures: an overtopping manual largely based on European research, but for worldwide application. Available at: https://www.researchgate.net/publication/313501579_EurOtop_Manual_on_wave_overtopping_of_sea_defences_and_related_sturctures_-_An_overtopping_manual_largely_based_on_European_research_but_for_worlwide_application_2nd_edition.
van Gent M. R. A., de Vries J. V. T., Coeveld E. M., De Vroeg J. H., Van de Graaff J. (2008). Large-scale dune erosion tests to study the influence of wave periods. Coast. Eng. 55, 1041–1051. doi: 10.1016/j.coastaleng.2008.04.003
van IJzendoorn C. O., de Vries S., Hallin C., Hesp P. A. (2021). Sea level rise outpaced by vertical dune toe translation on prograding coasts. Sci. Rep. 11, 12792. doi: 10.1038/s41598-021-92150-x
van Wiechen P. P. J., de Vries S., Reniers A. J. H. M., Aarninkhof S. G. J. (2023). Dune erosion during storm surges: A review of the observations, physics and modelling of the collision regime. Coast. Eng. 186, 104383. doi: 10.1016/j.coastaleng.2023.104383
Vellinga P. (1981). “Schaalserie Duinafslag,” in Tekst en tabellen en Figuren. Verslag Modelonderzoek. M1263. Deel IIA. Technical Report (Delft Hydraulics).
Vousdoukas M. I., Wziatek D., Almeida L. P. (2012). Coastal vulnerability assessment based on video wave run-up observations at a mesotidal, steep-sloped beach. Ocean Dynamics 62, 123–137. doi: 10.1007/s10236-011-0480-x
Keywords: coastal sand dune, dune scarp, wave run-up, large-scaled moveable bed experiment, remote sensing, stereo imaging
Citation: Lee E, Van Dang H, Shin S, Yoo J and Park H (2024) Observations of wave run-up affected by dune scarp during storm conditions: a two dimensional large-scaled movable bed experiment. Front. Mar. Sci. 11:1369418. doi: 10.3389/fmars.2024.1369418
Received: 12 January 2024; Accepted: 15 April 2024;
Published: 03 May 2024.
Edited by:
Inmaculada Rodríguez-Santalla, Rey Juan Carlos University, SpainReviewed by:
Jose A. A. Antolínez, Delft University of Technology, NetherlandsJosé Pinho, University of Minho, Portugal
Copyright © 2024 Lee, Van Dang, Shin, Yoo and Park. This is an open-access article distributed under the terms of the Creative Commons Attribution License (CC BY). The use, distribution or reproduction in other forums is permitted, provided the original author(s) and the copyright owner(s) are credited and that the original publication in this journal is cited, in accordance with accepted academic practice. No use, distribution or reproduction is permitted which does not comply with these terms.
*Correspondence: Sungwon Shin, c3VuZ3dzaGluQGhhbnlhbmcuYWMua3I=