 Nicholas P. Jones
 David S. Gilliam
94% of researchers rate our articles as excellent or good
Learn more about the work of our research integrity team to safeguard the quality of each article we publish.
Find out more
ORIGINAL RESEARCH article
Front. Mar. Sci., 24 May 2024
Sec. Coral Reef Research
Volume 11 - 2024 | https://doi.org/10.3389/fmars.2024.1369286
The size structure of stony coral populations can reveal underlying demographic barriers to population growth or recovery. Recent declines in coral cover from acute disturbances are well documented, but few studies have assessed size structure and the demographic processes that determine population growth. Vital rates, such as recruitment and survival, vary spatially and temporally in response to environmental conditions, in turn influencing assemblage composition. The Southeast Florida Coral Reef Ecosystem Conservation Area (Coral ECA) is a high-latitude reef system offshore of a heavily urbanized coastline. Consecutive heat stress events, stony coral tissue loss disease (SCTLD), and Hurricane Irma caused significant declines in stony coral cover and density from 2014 to 2018. The recovery potential of stony coral assemblages is influenced by their composition, the size structure of the remnant populations, and population growth during inter-disturbance periods. To assess the viability of the remaining stony coral assemblages in the Coral ECA, we quantified variation in stony coral recruit density, abundance, size structure, and assemblage composition across depth and latitude at permanent sites over 3 years (2019–2022) when no disturbances occurred. We found spatial decoupling in recruit density, adult colony density, and cover that maintains a preponderance of small colonies and skewed size structure. At sites close to shore where recruit density was higher, there was limited evidence of survival and growth of recruits, while at sites where large colonies were sampled or cover was relatively high, there was limited recruitment. The majority (>75%) of recruits sampled were Siderastrea siderea, but size frequency distributions were positively skewed and the coefficient of variation was high, suggesting high recruit/juvenile colony mortality and little growth into larger size classes. Porites astreoides size structure was generally lognormal and mesokurtic, particularly closer to shore, suggesting a transition between size classes. Skewness decreased moving offshore in Montastraea cavernosa and S. siderea, suggesting a transition between size classes. Recruit and adult diversity also increased moving offshore, but recruits of most species were uncommon throughout the study area. We suggest that low recruitment and high mortality, particularly in small colonies and inshore, even during inter-disturbance periods, limit the population growth of stony coral assemblages in southeast Florida.
As coral reef communities continue to undergo declines in coral cover (Gardner et al., 2003; De’ath et al., 2012; Hughes et al., 2018; Jones et al., 2022), understanding demographic barriers to the recovery and expansion of stony coral (order Scleractinian) assemblages is key to assessing their viability (Dietzel et al., 2020; Edmunds and Riegl, 2020). Vital rates, such as recruitment and survival, drive changes in population growth and size structure (Holbrook et al., 2018; Pisapia et al., 2020). These are influenced by acute disturbances and chronic pressures, which can reduce fecundity, impair growth, and drive mortality (Bellwood et al., 2004; Baker et al., 2008; Carilli et al., 2009; De’ath et al., 2009; Bauman et al., 2013). The size structure of populations can therefore be used to infer the underlying impact of environmental pressures on stony corals and their potential to persist (Pisapia et al., 2020). Populations dominated by small colonies suggest high disturbance frequency or chronic pressures constrain growth and survival despite consistent recruitment (Bak and Meesters, 1998; Bauman et al., 2013; Riegl et al., 2017). A preponderance of intermediate-sized colonies may reflect pulses of recruitment (Riegl et al., 2018), and a high ratio of large to small colonies may indicate an aging population with limited recruitment (Bak and Meesters, 1999; Miller et al., 2016; Riegl et al., 2018).
Spatial and taxonomic variations in stony coral demographics may reflect differential resilience and influence assemblage composition (Bak and Meesters, 1999; Bauman et al., 2013; Holbrook et al., 2018; Edmunds and Riegl, 2020; Kramer et al., 2020). In many regions, recent changes to assemblage composition following disturbance have been exemplified by the loss of reef-building species and relative increases in stress-tolerant species (Bellwood et al., 2004; De Bakker et al., 2016; Hughes et al., 2019; Jones et al., 2020). In the Pacific, high recruitment of fast-growing species has driven recovery (Edmunds, 2018; Holbrook et al., 2018), but recovery has been limited in the Caribbean (Gardner et al., 2005; Hughes et al., 2017; Roff, 2021). This is often presumed to relate to chronic anthropogenic pressures (Connell, 1997; Gardner et al., 2005; Mumby, 2009), but there is growing recognition that spatial disconnects between recruit sinks and locations where stony corals survive and grow can also impair population growth and influence assemblage composition (Miller et al., 2000; van Woesik et al., 2014; Edmunds, 2021). These may lead to spatial differences in recruit density, growth, and mortality, which can lead to positively skewed (many small, but few large colonies; e.g., Bauman et al., 2013) where recruitment is high but survival is low or negatively skewed (low recruitment but high survival) size structure (Miller et al., 2000), both of which can present a barrier to population growth (Pisapia et al., 2020). As such, it is necessary to assess spatial variation in recruitment, size structure, and assemblage composition to determine the impact of environmental conditions and potential demographic bottlenecks that may limit stony coral persistence.
The Southeast Florida Coral Reef Ecosystem Conservation Area (Coral ECA) is a marginal reef system offshore of a heavily urbanized coastline. The 170-km-long Coral ECA is located toward the northern limit of stony coral distribution in the western Atlantic (~27.1 N to 25.6 N). Historically, temperature has limited stony coral population growth and diversity (Toth et al., 2021), but increasing temperature under climate change may precipitate more suitable conditions (Vergés et al., 2019). However, with a human population of ~7 million and widespread coastal construction, stony corals in the Coral ECA are also subject to chronic anthropogenic pressures, which may limit population growth (Jones and Gilliam, 2024). Over recent years, stony corals in the Coral ECA experienced significant declines in cover and density from thermal stress (2014 and 2015) and stony coral tissue loss disease (SCTLD; prevalent from 2014 to 2017; Walton et al., 2018; Jones et al., 2020; Hayes et al., 2022). Although there is evidence of recovery in density during the inter-disturbance period that followed this, when no thermal stress events or hurricanes occurred and SCTLD prevalence was low (Jones and Gilliam, 2024), increases in coral cover have generally been very limited in the Coral ECA (Jones et al., 2022), suggesting underlying barriers to population growth (Bellwood et al., 2004; Edmunds and Elahi, 2007; Hughes et al., 2011).
To assess the contemporary condition of stony coral assemblages in southeast Florida and the potential for population growth, we quantified variation in stony coral recruit density, size structure, and assemblage composition across depth and latitude over 3 years. We specifically tested for spatial, temporal, and taxonomic differences in recruit density, adult density, cover, and size structure to understand the viability of stony coral populations, focusing predominantly on the three most abundant stony coral species, Montastraea cavernosa, Porites astreoides, and Siderastrea siderea. Further, we explicitly tested the relationship between recruit abundance and a) temporal change in adult colony abundance and b) mean adult colony size to assess whether recruits were contributing to population growth and whether there was spatial variation in the location corals are recruiting and where colonies appear to be persisting/growing (i.e., higher abundance of large colonies). The expectation was that sites with higher recruit abundance in year 1 would have increased adult colony abundance in year 2, and at sites with low recruit abundance, adult colony abundance would remain relatively unchanged. Finally, spatial differences in stony coral recruit and adult assemblage composition were analyzed.
Limited monitoring of the deep outer reef habitat in the Coral ECA (~20–30 m in depth and farthest from shore) has previously been conducted, with focus placed on the shallower nearshore/inner (4–10 m), middle (11–16 m), and outer (16–18 m) reef habitats. All four habitats, and three sub-regions divided by latitude, were monitored in Broward County, Florida (26.34 N to 25.97 N) between 2019 and 2022. Assessing spatial variation in the stony coral assemblage across depth and latitude could provide insight into whether locations offshore are buffered from anthropogenic pressures (e.g., Glynn, 1996; Bongaerts et al., 2010), or those further north, despite the relatively short distance, by temperature (Beger et al., 2014). We predict that recruit density, size structure, and assemblage composition will vary spatially in relation to anthropogenic pressures, with stony coral health and diversity suspected to improve in deeper habitats, further offshore. This will lead to increased diversity and less skewed and mesokurtic size frequency distributions, which suggests consistent recruitment, survival, and transition between size classes, as has been seen in other anthropogenically impacted areas (Mellin et al., 2019; Otaño-Cruz et al., 2019).
Scleractinian (stony coral) assemblages were monitored annually for 3 years between 2019 and 2022 at 27 permanently defined sites offshore Broward County, Florida (Figure 1). Sites were spatially distributed between reef habitats and sub-regions. Habitats varied with depth and distance offshore. The inner reef habitat, 275–780 m offshore at a depth range of 4–10 m, comprises the nearshore ridge complex and linear inner reef. The middle reef habitat is 770–2,000 m offshore at 11–16 m in depth. The outer reef habitat is 1,500–3,000 m offshore at 16–18 m in depth. The deep outer reef habitat was furthest offshore at the eastern edge of the outer reef at 23–26 m in depth. Sites were also divided into three sub-regions by latitude and by ports and inlets, as per Jones et al. (2020). The Deerfield sub-region, furthest north, is between Boca and Hillsboro inlets. The Broward/Fort Lauderdale sub-region is between Hillsboro Inlet and Port Everglades. The Hollywood/Miami sub-region is furthest south, between Port Everglades and the Broward/Miami-Dade County line. Surveys on the inner, middle, and outer reef habitats were conducted from late September to December in each sample year. Surveys on the deep outer reef habitat were conducted in March and April every year.
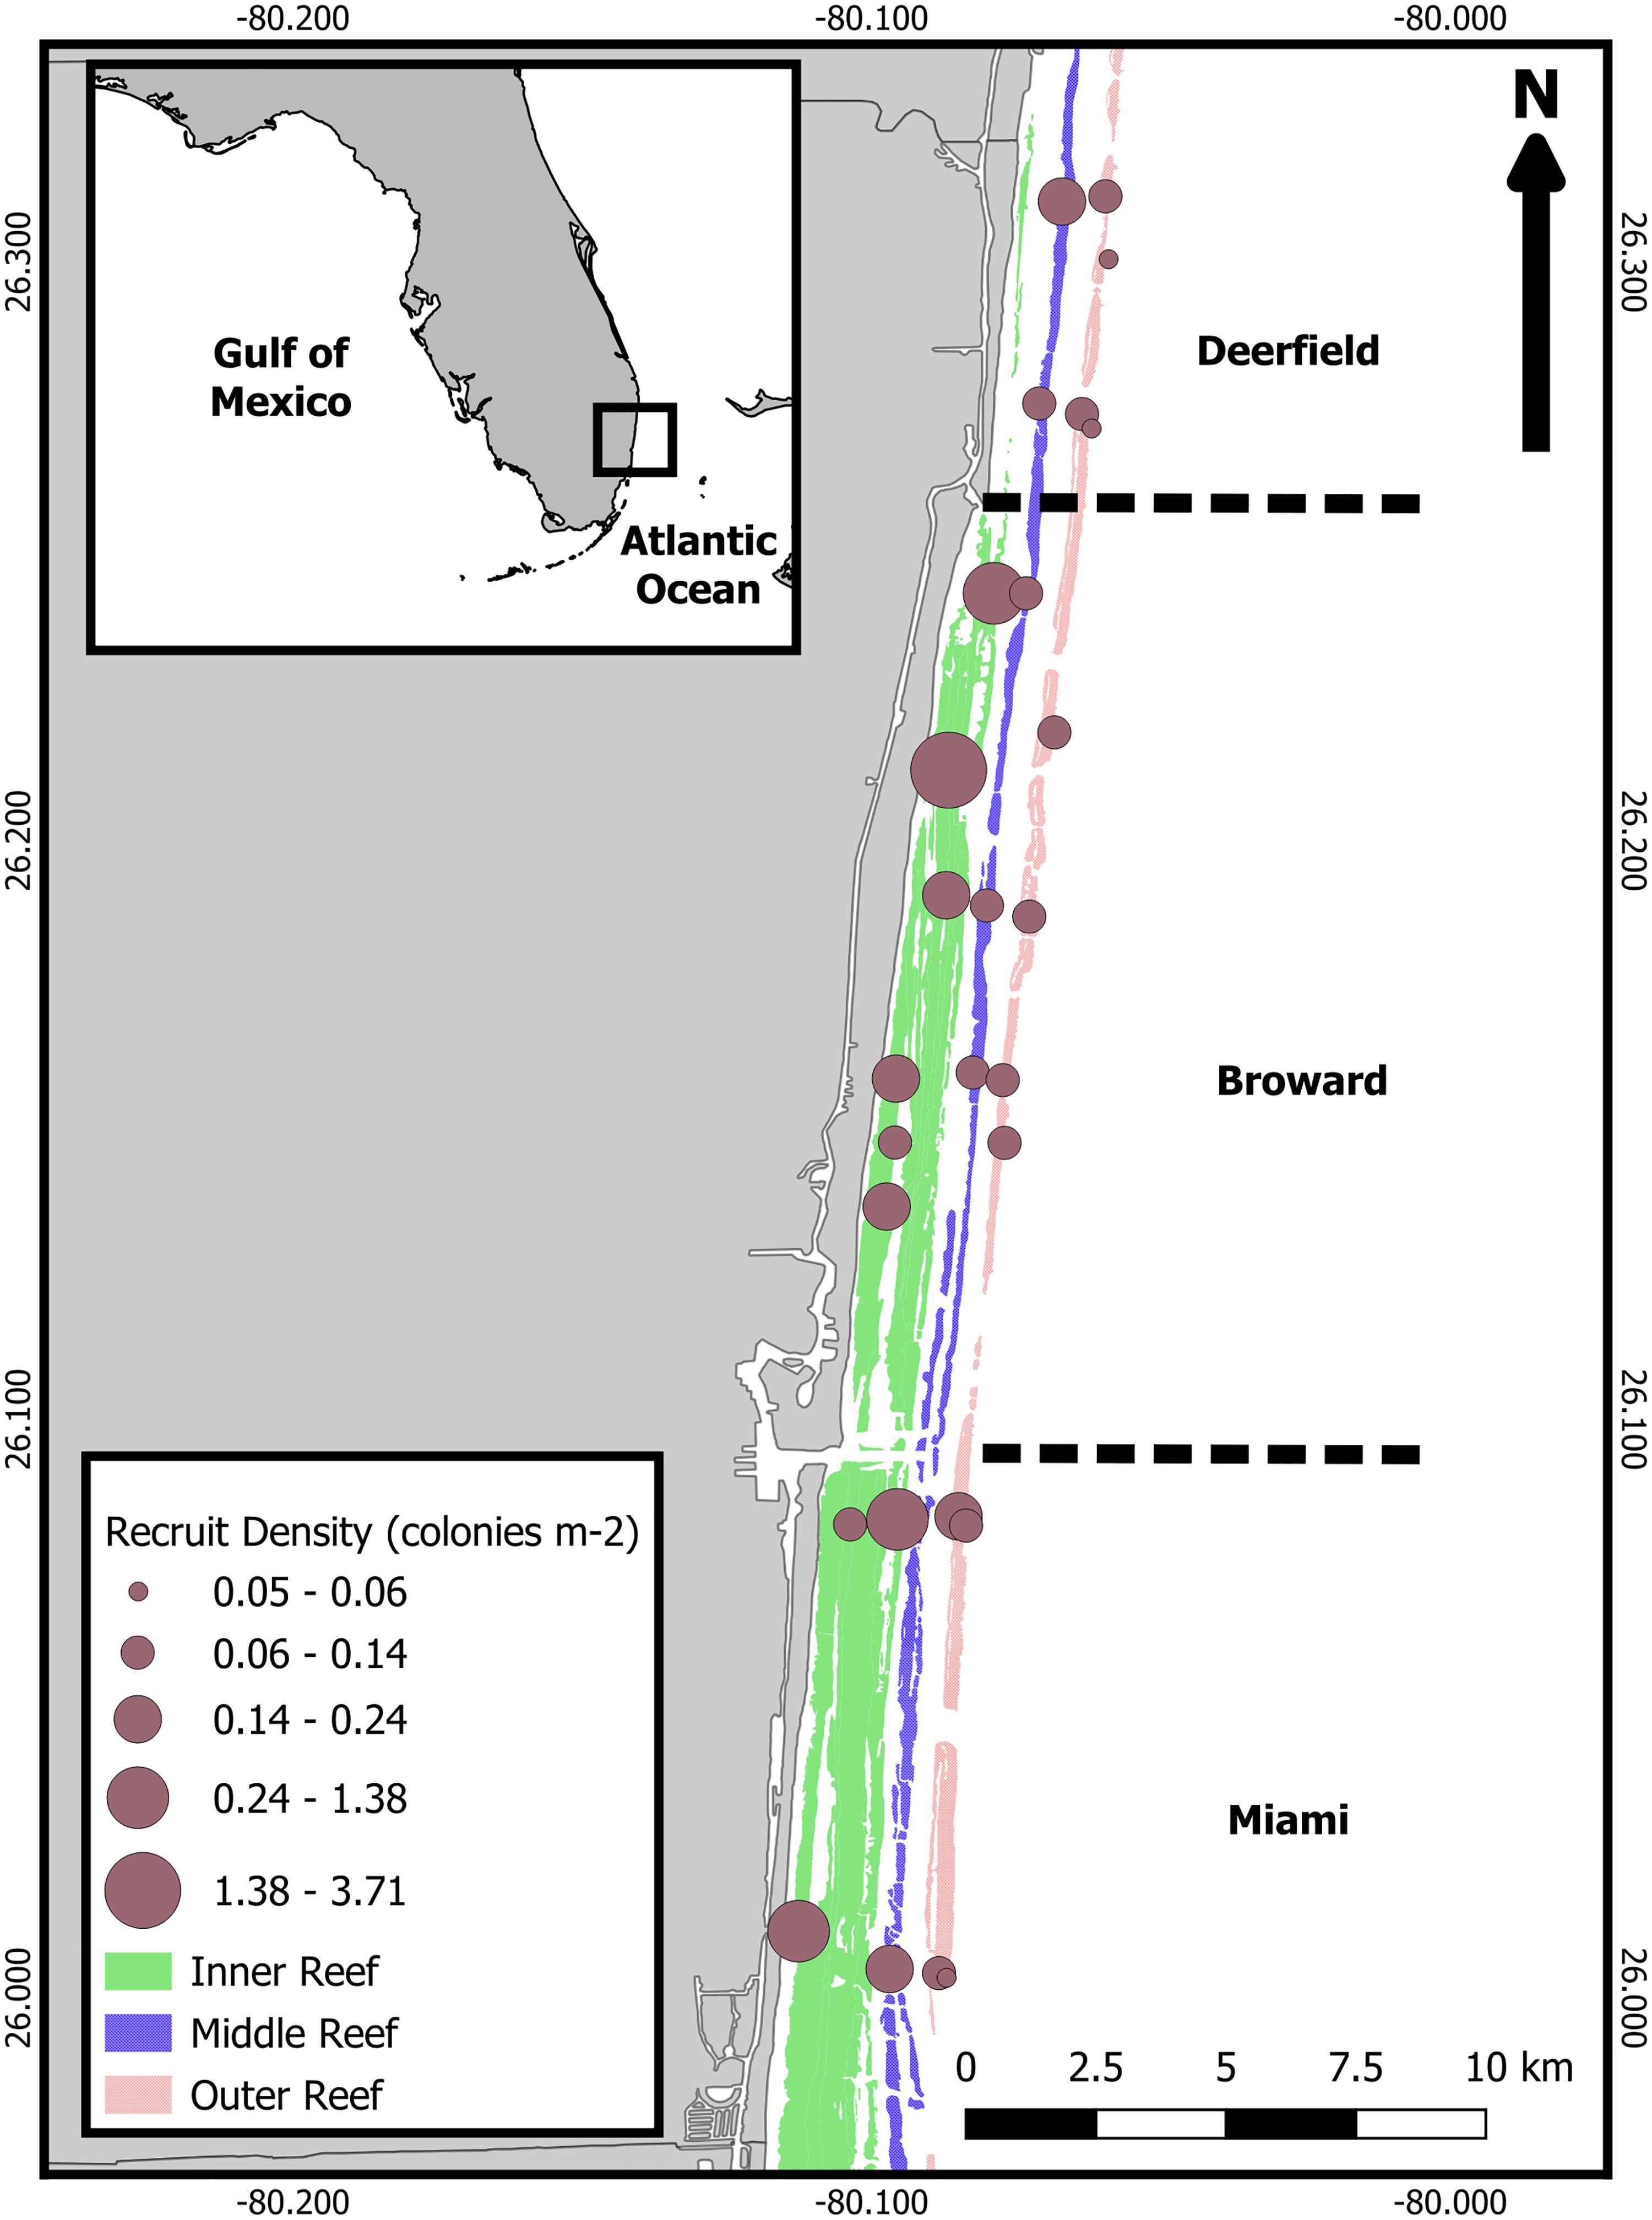
Figure 1 Map of study area and monitoring sites. Reef habitats run parallel from shore, inshore to offshore: inner reef (comprised of a nearshore ridge complex and linear inner reef), middle reef, and outer reef (deep outer reef sites on the eastern edge of the outer reef). Divisions of the Deerfield (north, six sites), Broward/Fort Lauderdale (central, 13 sites), and Hollywood/Miami (south, eight sites) sub-regions are identified by dashed lines perpendicular to shoreline. Size of the site points corresponds to recruit density (colonies/m2). Inset map: study location marked with black box. Study locations and spatial designations are in Supplementary Table 1.
Each site consisted of a single 20 m by 1.5 m belt transect, defined by 40, 0.75 m2 quadrats (each quadrat measures 1 × 0.75 m). All stony coral colonies where a portion of live tissue was within the belt transect were identified to species. If large colonies overlapped multiple quadrats, the colony was recorded in the quadrat with most live tissue. The maximum diameter, perpendicular width, and height of every colony at least 2 cm in diameter were measured to the closest centimeter, and percent colony mortality was estimated. Live tissue length and width within the quadrat were also measured on every colony in order to calculate the percent live tissue cover on each transect (hereafter referred to as cover). Recruits (defined here as colonies under 2 cm in diameter) were identified to species and tallied. Recruit and adult colony density was calculated for each 30-m2 site. Each coral species was assigned to one of eight coral growth forms (arborescent, corymbose, digitate, encrusting, laminar, massive, solitary, or submassive) based on the Coral Trait Database (Madin et al., 2016; Supplementary Table 2).
Spatial and temporal variations in stony coral recruit density, adult density, cover, and mean colony diameter were statistically assessed in RStudio (R Core Team, 2020). Generalized linear mixed models (GLMMs) were developed using the package glmmTMB (Brooks et al., 2017) to analyze each metric in relation to the Habitat (Inner, Middle, Outer, or Deep outer reef), Sub-region (from north to south Deerfield, Broward/Fort Lauderdale, or Hollywood/Miami), and Survey year (year 1, year 2, or year 3). Five different recruit density response variables were assessed: total recruit abundance, the abundance of each of the three most abundant species (M. cavernosa, P. astreoides, and S. siderea), and the abundance of all other species. Poisson GLMMs were used for each recruit response variable with an offset, survey area, to account for any differences in survey area and to model the response variable as density. A random intercept, Site, was included to account for repeated surveys of the same site. Overdispersion was detected in the model containing all species and S. siderea, and a negative binomial GLMM was fitted. A single model was used for each total adult stony coral density (negative binomial GLMM with survey area offset) and cover (gamma distribution and log link). Full model selection was performed from all potential candidate models, and the fitted minimum adequate model was selected by the Akaike information criterion (AIC). In the event of equivalent models (i.e., within an AIC score of 2; Burnham and Anderson, 2004), the more complex model was selected. Model validation was performed using the package “DHARMa”, with residual diagnostics, including overdispersion, heterogeneity, and temporal autocorrelation, conducted on the fitted model (Hartig 2017). Post-hoc, pairwise assessment of retained factors in the fitted model was conducted using the package “emmeans” and Tukey’s method, where differences in the response variable were analyzed between levels of a factor (e.g., Habitat) or interaction (e.g., Survey Year × Habitat) based on model predictions (Lenth, 2019). Emmeans linear contrasts were used to assess significant variation in levels of a fixed effect against the mean value. For interactions between categorical and continuous fixed effects (covariates), the “emtrends” function was used to assess covariate trends between levels of the categorical, fixed effect.
The change in adult colony abundance was calculated per site for every year possible. This was visually compared to recruit abundance the previous year (i.e., recruit abundance from survey year 1 plotted against the change in adult colony abundance from survey year 1 to survey year 2 and recruit abundance from year 2 plotted against the change in adult colony abundance from survey year 2 to 3). The relationship between change in adult colony abundance and recruit abundance precluded suitable modeling with linear models. Recruit abundance was also analyzed in relation to the mean adult colony diameter in the same year. To do this, a Generalized Additive Mixed Model (GAMM) of recruit abundance vs. mean colony diameter per site per year was fitted with a gamma distribution, log link. This model was compared with a similar model with the smoothing term mean colony diameter by survey year fitted to see if the relationship was consistent across time. Models were compared using AIC. Model validation indicated no problems.
Size frequency distributions of the maximum colony diameter were constructed for M. cavernosa, P. astreoides, S. siderea, and all other species combined (termed non-target species). Recruit sizes (colonies < 2 cm) were estimated along a continuous distribution between 0.5 cm and 2 cm and incorporated into size frequency distributions for analysis and visual assessment. Log10-transformed size frequency distributions were compared between species and within species by habitat and survey year using Kolmogorov–Smirnov (KS) two-sample tests. The mean colony diameter (mean of the colony diameter for each colony per site), log10-transformed coefficient of variation [coefficient of variation (CV) = log10(standard deviation)/log10(mean)], log10-transformed skewness, and log10-transformed kurtosis were calculated per site per year. Initial analysis of each variable using GLMMs indicated high site-level variation (high conditional R2 and heterogeneity in residuals). To assess the origins of site-level variation and whether it was influenced by proximity to land-based anthropogenic pressures, mean colony diameter, log10 CV, log10 skewness, and log10 kurtosis in the final survey year were analyzed in relation to species, the distance of the site from the shoreline, and the depth using GLMs. Mean length, CV, and kurtosis models were fitted with a gamma distribution and log link, and the model for skewness was fitted with a Gaussian distribution and identity link. Again, model selection was performed using the AIC from all possible combinations, and model validation was conducted using “DHARMa”. Model validation of the mean colony diameter GLM indicated a lack of linearity of residuals and the presence of outliers. A Generalized Additive Model (GAM), with a gamma distribution and log link, was fitted using the package “mgcv”. The significance of fitted factors in the minimum adequate model was assessed using chi-squared ANOVA. Model validation was performed on the fitted minimum adequate model using gam.check where fitted residuals and fitted values were plotted against observed residuals and fitted values, respectively, to assess the heterogeneity of residuals.
Multivariate analyses of spatial and temporal variations in recruit and adult stony coral assemblage composition were conducted in Primer 7 (Clarke and Gorley, 2006). Prior to the generation of Bray–Curtis similarity coefficients, data were square root transformed. Spatiotemporal variations in recruit stony coral assemblage composition and adult stony coral assemblage composition were statistically analyzed using Permutation Analysis of Variance (PERMANOVA; Anderson, 2001; McArdle and Anderson, 2001). Type 3 PERMANOVA based on 9,999 permutations of residuals under a reduced model was used with sites in each survey year as samples. Similarity matrices were assessed by the fixed factors: Survey year, Habitat, and Sub-region. Multivariate results were considered significant at p < 0.05. The three-way interaction, Survey year × Habitat × Sub-region, was pooled when analyzing recruit, and adult assemblage composition after results suggested it accounted for minimal variation. The interactions Survey Year × Habitat and Survey year × Sub-region were also pooled for adult assemblage composition. Similarity profile routine (SIMPROF) was used to identify significant groups of samples (Clarke et al., 2008). For visual assessment of similarity between habitats, sub-regions, or survey years, threshold metric multidimensional scaling (tmMDS) plots were created. Each sample in the tmMDS represents each site at each time point, and the distance between samples depicts the similarity in assemblage composition (i.e., the closer a sample, the more similar the assemblage composition). SIMPROF groups were overlayed, and the spatiotemporal differences were visually assessed by plotting species vectors onto the tmMDS. Species richness, Shannon–Weaver diversity index (H′), and Pielou’s evenness index (J′) were calculated for each site, habitat, sub-region, and survey year.
Recruit density was low at most sites (Figure 1), averaging 0.95 ± 0.2 recruits/m2 (± SE) over all years. Recruit density varied strongly by habitat, with a significant interaction between survey year and sub-region (Table 1 and Supplementary Tables 3–6; negative binomial GLMM, conditional R2 = 0.88, marginal R2 = 0.41). Recruit density was significantly higher on the inner reef than the deep outer reef [Figure 2A; emmeans pairwise comparison with Tukey’s test (Tukey’s pairwise), p = 0.009], with model predictions suggesting that recruit density was twice the mean on the inner reef and half the mean on the deep outer reef (linear contrasts, p < 0.05). Recruit density was significantly higher than the mean in year 1 and lower than the mean in year 3 (linear contrasts, p < 0.05). This was largely driven by temporal variation within the central sub-region, Broward, where recruit density was significantly higher in years 1 and 2 than in year 3 (Supplementary Figure 1; Tukey’s pairwise, p < 0.0001). Adult colony density (negative binomial GLMM; R2 = 0.15; Supplementary Tables 7, 8) and cover (gamma GLMM; conditional R2 = 0.96, marginal R2 = 0.27; Supplementary Tables 9, 10) also varied most strongly by habitat (Figures 2B, C). In comparison to recruit density, cover was significantly higher on the deep outer reef than on the middle reef (Tukey’s pairwise, p = 0.01) and marginally higher on the deep outer reef than on the inner reef (Tukey’s pairwise, p = 0.08). Model predictions found that cover was twice the mean on the deep outer reef (linear contrasts, p = 0.01). Cover did not vary significantly by sub-region or by survey year. Adult density was the highest on the outer reef (2.8 colonies/m2), but no significant differences between habitats, sub-regions, or survey years were found, with the fitted model suggesting most variation was at the site level. Model validation of the final fitted models indicated no problems.
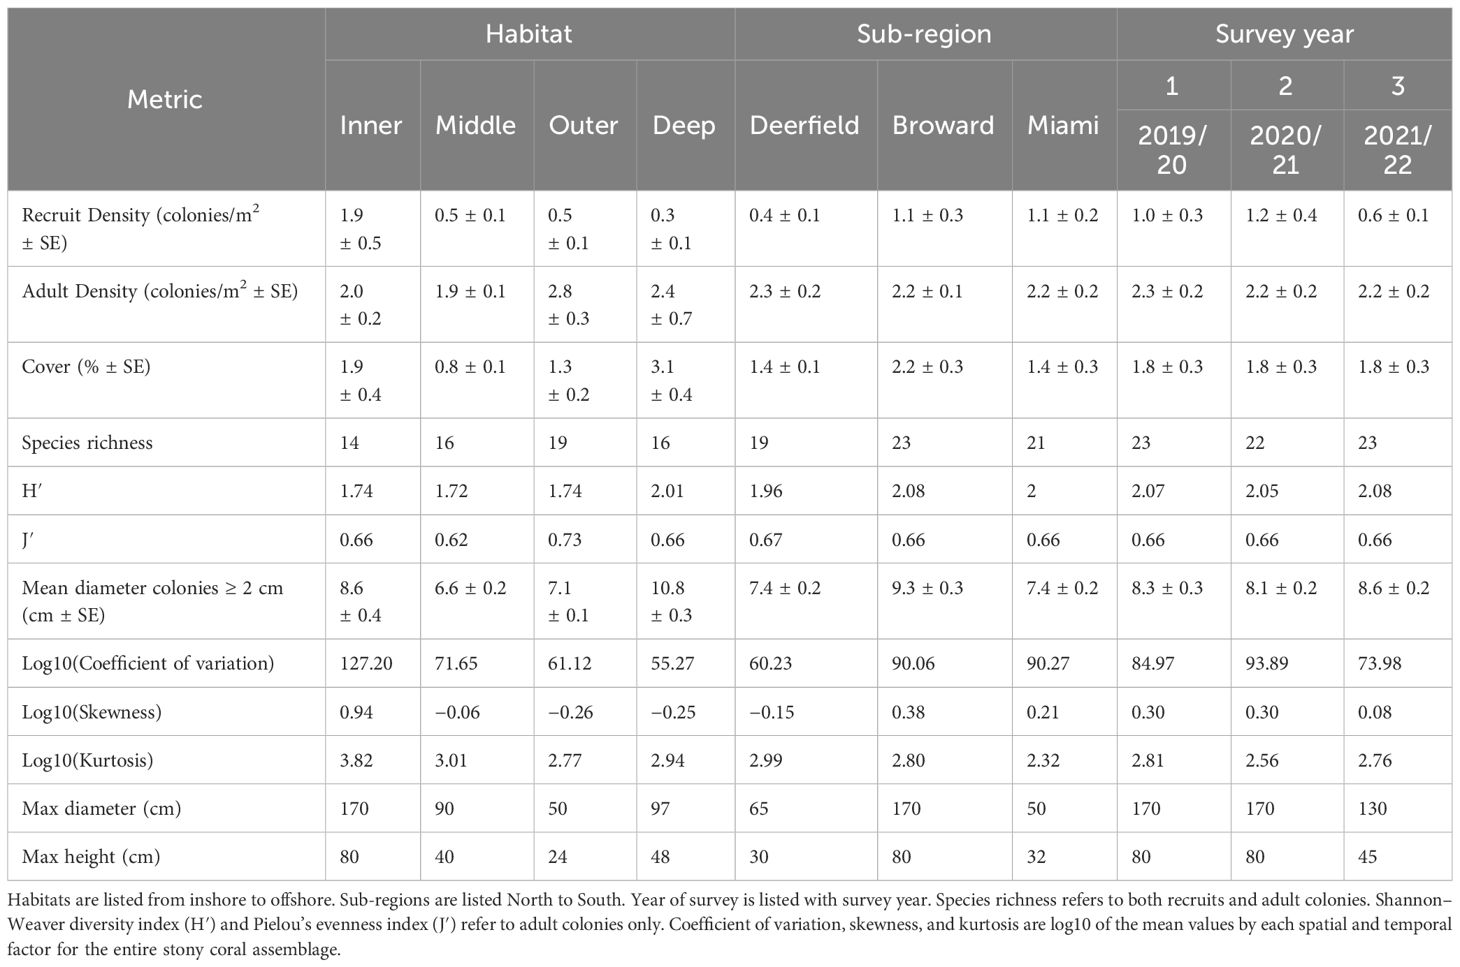
Table 1 Spatial and temporal variations in stony coral demographics and diversity.
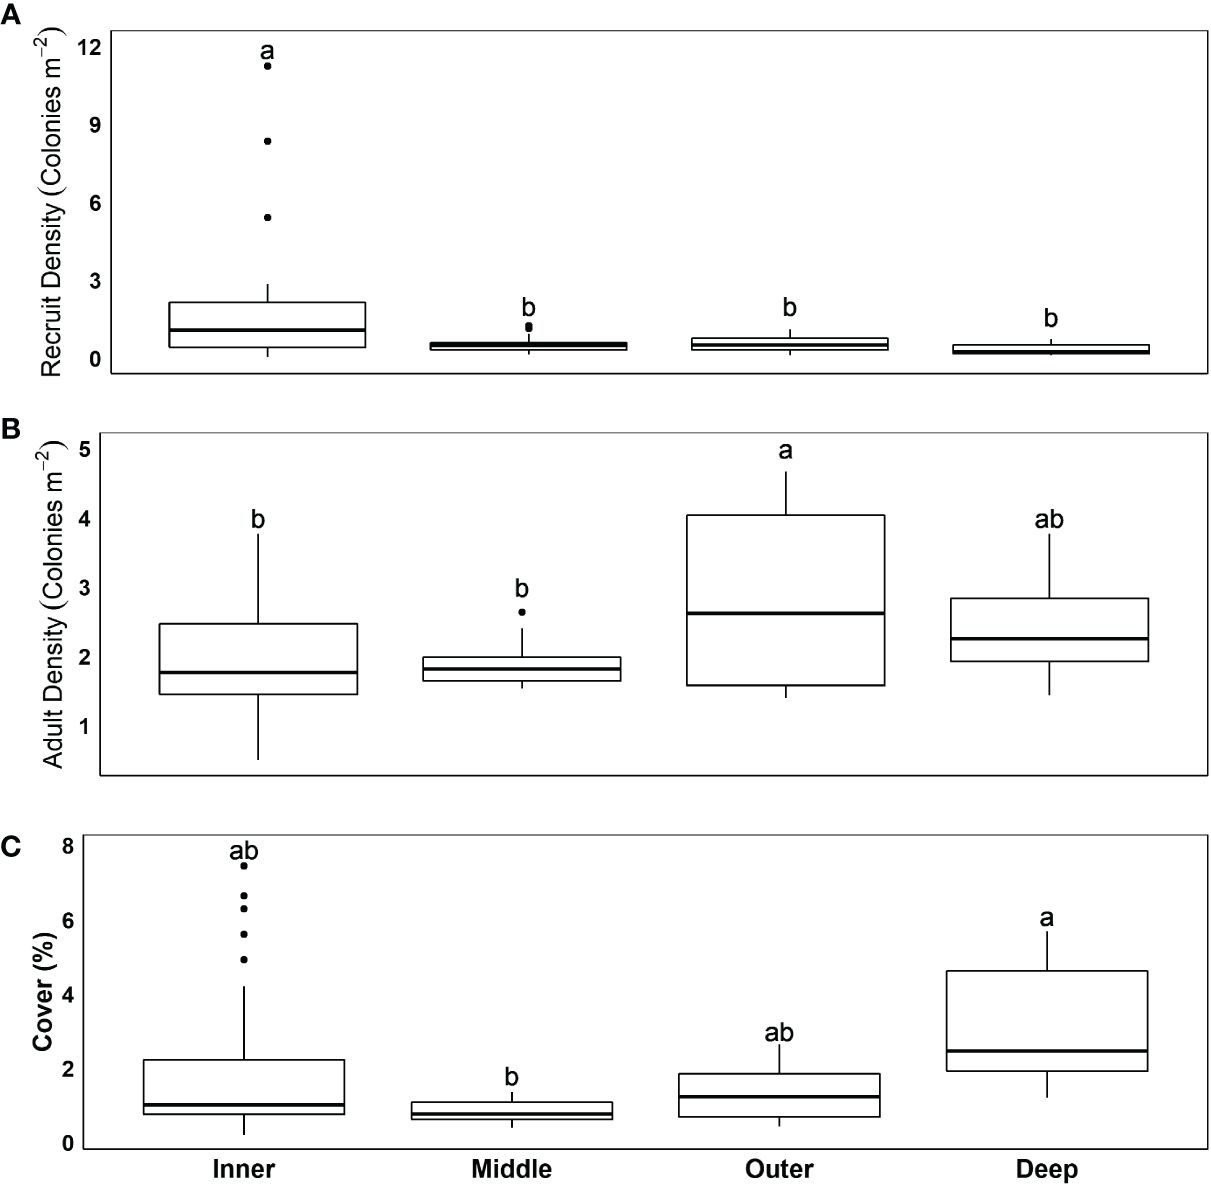
Figure 2 Spatial variation in (A) recruit density, (B) adult colony density, and (C) cover, based on reef habitat. Values are averaged over years. Lower case letters represent significant differences between post-hoc Tukey pairwise analysis of GLMMs. Significance is at p < 0.05.
We sampled 2,177 stony coral recruits from 18 species (<2 cm in diameter). Despite the influx of recruits (731 in year 1, 938 in year 2, and 508 in year 3), the total number of adult colonies sampled, which included 24 species, declined each year (1,845 in year 1, 1,814 in year 2, and 1,749 in year 3). There was no clear relationship between recruit abundance and the change in adult colony abundance (Figure 3A), and at many sites, declines in adult colony abundance followed higher recruit density (Supplementary Figure 3). This was most obvious at POMP4, where despite the influx of 337 recruits in 2020, adult colony density declined by 15% from 2020 to 2021 and recruit density by 76%. There was a significant relationship between recruit abundance and mean adult colony diameter (GAMM, edf = 3.5, f = 6.89, p < 0.001; R2 =0.30), with recruit abundance declining with mean adult colony diameter (Figure 3B). The same relationship was consistent between survey years. Sites with larger colonies (i.e., above the average mean colony diameter of 8.6 cm) generally had low recruitment (10.7 recruits per site per year), while sites with smaller colonies (<8.6 cm) averaged over three times as many recruits per year (34.9 recruits per site per year).
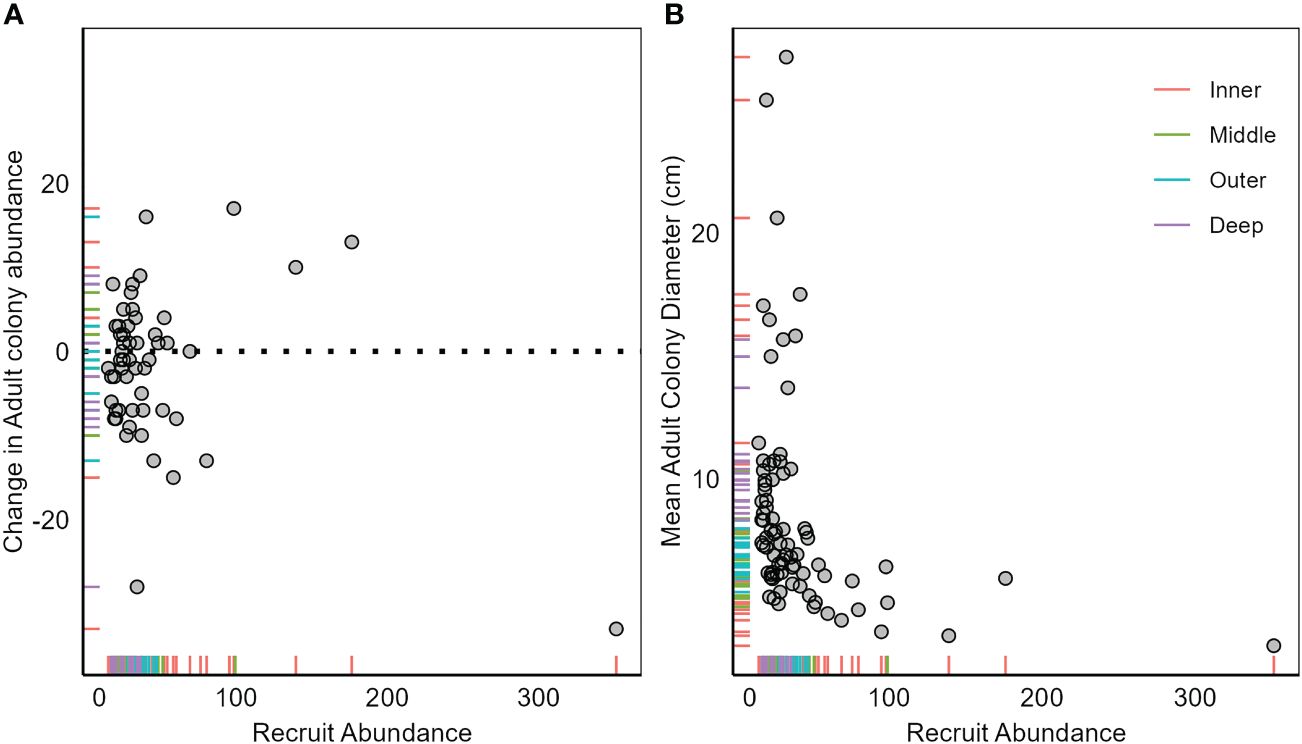
Figure 3 Relationship between recruit abundance in year x and (A) change in adult (≥2 cm maximum diameter) colony abundance from x to x + 1 (i.e., absolute change from year 1 to year 2 is plotted against recruit abundance in year 1) and (B) mean adult colony diameter in year x. Each point represents a sample (site surveyed in 1 year). Tick marks on axis represent sample positions and are color-coded by habitat. Dashed line in panel A is at 0 and represents no change in colony abundance. Samples above the dashed line represent influx of recruits into the adult assemblage, with samples below having a loss of adult colonies. Note the large discrepancy between the scale of recruit abundance and change in adult colony abundance.
Three-quarters of recruits were S. siderea, with recruit density varying by habitat and with a significant interaction between sub-region and survey year (negative binomial GLMM, conditional R2 = 0.89, marginal R2 = 0.50; Supplementary Tables 16–21). S. siderea recruit density was three times higher on the inner reef than elsewhere (linear contrast, p = 0.001; Figure 4A), where it was significantly higher than the outer and deep outer reefs (Tukey’s pairwise, p < 0.05). S. siderea recruit density in years 1 and 2 was significantly higher than in year 3 in Broward (Tukey’s pairwise, p < 0.05). M. cavernosa recruit density varied most strongly by sub-region and year (Poisson GLMM, conditional R2 = 0.10, marginal R2 = 0.04; Supplementary Tables 11–14). M. cavernosa recruit density was significantly higher than the mean in year 1 (linear contrasts, p < 0.05) and higher in year 1 than in year 3 (linear contrasts, p < 0.05). M. cavernosa recruit density was higher in the Miami sub-region than in Broward (Tukey’s pairwise, p < 0.05; Supplementary Figure 2A). P. astreoides recruit density was fairly consistent over time and space and did not vary significantly by any spatial or temporal factor (Poisson GLMM; conditional R2 of the null model = 0.28, Figure 4A; Supplementary Table 15). All other recruit species, except for Porites porites on the inner reef, were generally rare and were grouped together as non-target species for analysis. Non-target recruit density varied most strongly by sub-region (Poisson GLMM, conditional R2 = 0.30, marginal R2 = 0.15; Supplementary Tables 22, 23). A latitudinal gradient was evident, with significantly higher non-target recruit density in Miami than in Deerfield (Tukey’s pairwise, p < 0.05; Supplementary Figure 2A).
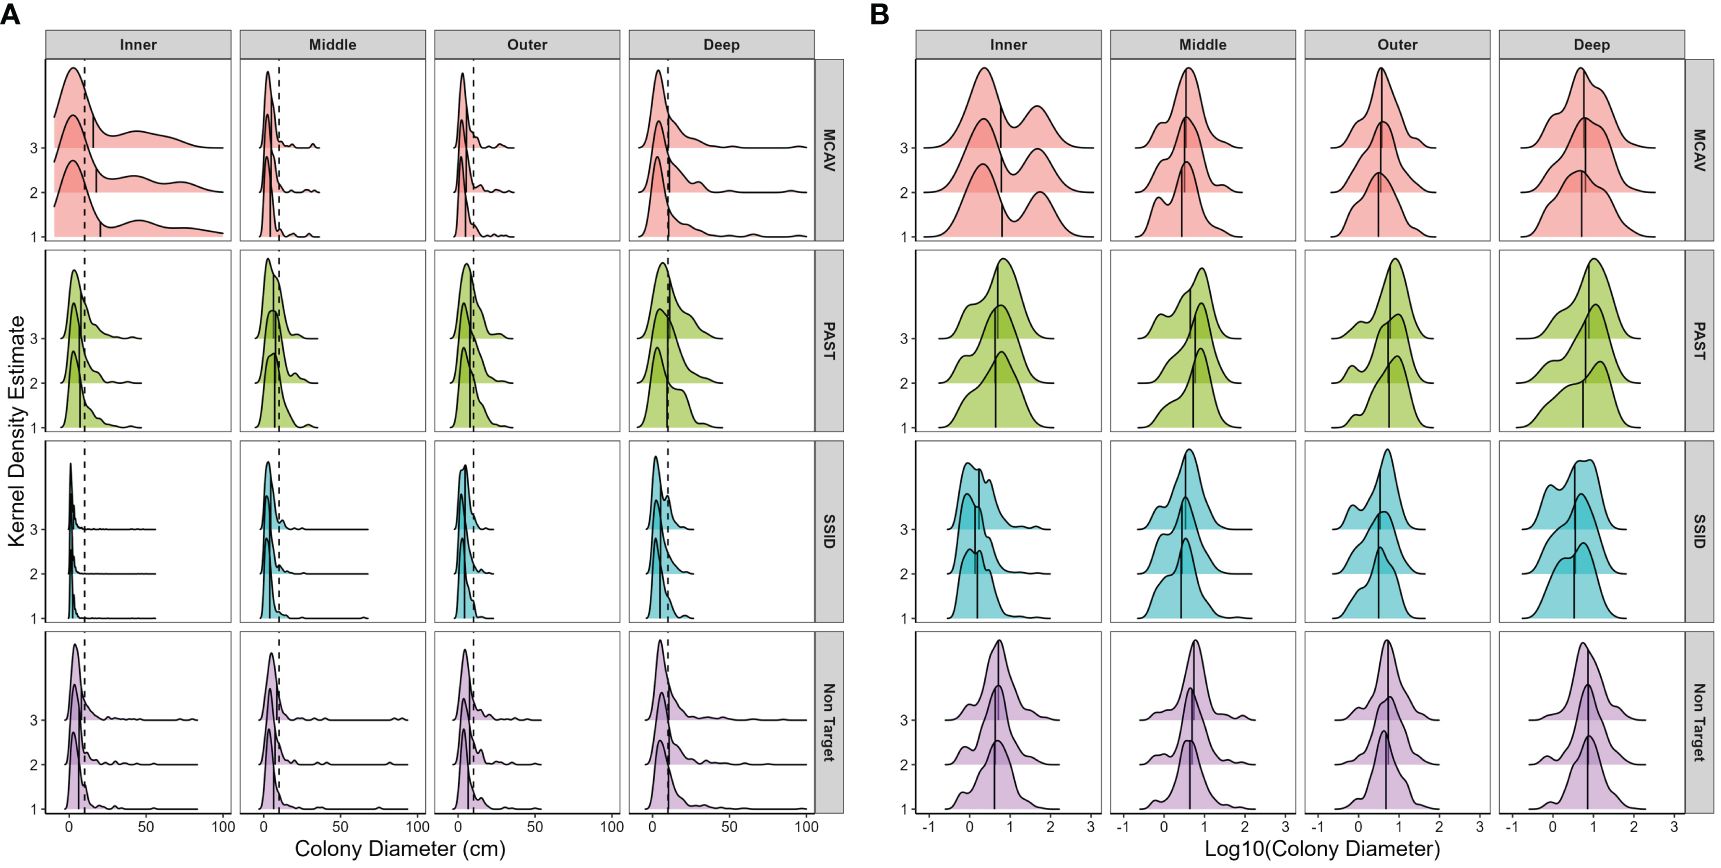
Figure 4 Spatial and temporal variations in size frequency distributions using (A) untransformed and (B) log10-transformed maximum colony diameter separated by target species. Panels from top to bottom: MCAV, Montastraea cavernosa; PAST, Porites astreoides; SSID, Siderastrea siderea; Non-Target, all other species. Panels from left to right moving offshore: nearshore ridge/inner reef, middle reef, outer reef, and deep outer reef. Within each panel, histograms are separated by survey year. Frequency estimated by kernel density estimate, which uses kernel smoothing (the weighted average of the observed data) for probability density estimation (using a smoothed histogram) for each species/habitat combination. See Supplementary Table 25 for observed density per species in each habitat in each survey year. Vertical dashed line in panel (A) marks 10 cm maximum diameter and the approximate size at puberty in M. cavernosa, P. astreoides, and S. siderea (Soong, 1993) and highlights the low frequency of few mid-sized or large colonies. Solid vertical line within histograms represents the mean size per species, per habitat, and per year. Note that in panel (A), maximum colony diameter was limited to 100 cm for graphical display due to paucity of larger colonies.
Untransformed size frequency distributions were skewed for all species, and most colonies were smaller than 10 cm maximum diameter (Figure 4A). M. cavernosa and P. astreoides log10-transformed size frequency distributions did not change over time (KS, D < 0.1, p > 0.05). Spatial variation in log10-transformed size frequency distribution was therefore analyzed in year 3 for each species. M. cavernosa size frequency distribution on the nearshore/inner reef, where the largest colonies were found (Table 1), significantly differed from that on all other habitats (KS, D = 0.29 to 0.30, p < 0.01), with a noticeable bimodal distribution, dearth of intermediate-sized colonies, and a high coefficient of variation (Figure 4B). M. cavernosa size frequency distributions on the deep outer reef were also significantly different from those on all other habitats (KS, D = 0.23 to 0.25, p < 0.01), with a lognormal distribution (KS, D = 0.05, p > 0.05). The coefficient of variation was high in all habitats (>65), and kurtosis was very low on the inner reef (1.7). In survey year 3, M. cavernosa size frequency distribution was significantly different from all other species (KS, D > 0.24, p < 0.0001).
P. astreoides size frequency distribution did not significantly vary between the inner, middle, or outer reefs (KS, p > 0.05; Figure 4B) and was the most mesokurtic of all species. Despite this, most colonies were below 10 cm in diameter (Figure 4A). Log-transformed size frequency distributions were significantly different on the deep outer reef to the inner reef (KS, p < 0.05), with the largest mean size (10.7 cm) and most negative skew (−0.6) on the deep outer reef. P. astreoides size frequency distribution was significantly different from S. siderea every year (KS, D > 0.4, p < 0.0001) and from non-target species in year 1 (KS, D = 0.1, p = 0.01), but not in year 3 (KS, D = 0.08, p > 0.05).
S. siderea size frequency distribution changed significantly every year (KS, D > 0.08, p < 0.001; Figure 4). Recruit density was the highest in year 1 and declined over time, leading to a lower coefficient of variation, skewness, and kurtosis (Figure 4B). Every year, the size frequency distribution on the inner reef was significantly different from that on all other habitats (KS, D > 0.3, p < 0.0001), with the bulk of colonies recruits or very small adult colonies. Skewness, kurtosis, and coefficient of variation declined substantially moving offshore in S. siderea, with the size frequency distribution on the deep outer reef also significantly different from that on the middle reef in years 1 and 2 (KS, D = 0.19, p < 0.05).
Non-target size frequency distribution was significantly different between year 1 (2019/20) and year 3 (2021/22; KS, D = 0.09, p < 0.05), with evidence that recruits and small colonies from year 1 were growing into larger size classes by year 3, resulting in an increase in mean colony diameter (Figure 4B). Non-target size frequency distribution in both years (1 and 3) was significantly different on the deep outer reef than in all other habitats (KS, D > 0.16, p < 0.05). Non-target species mean colony diameter was the highest on the deep outer reef, and log-transformed size frequency distributions were mesokurtic on the inner, outer, and deep outer reefs. S. siderea and the non-target species size frequency distributions were significantly different every year (KS, D > 0.34, p < 0.0001).
Colony diameter varied spatially by species (chi-squared ANOVA of GAM, p < 0.001), with mean M. cavernosa colony diameter varying significantly with distance from shore (chi-squared ANOVA of GAM, p < 0.001), with P. astreoides, S. siderea, and non-target species being consistent (Supplementary Figure 4; GAM, R2 = 0.675). M. cavernosa colony diameter was twice as high as the mean approximately 500 m from shore, declined to ~1,000 m, and then steadily increased (Supplementary Figure 4A). Log10-transformed CV varied by species and declined significantly with depth (t = −2.4, p = 0.02; GLM, R2 = 0.32). M. cavernosa CV was estimated to be 1.4 times greater than the non-target species (Tukey’s pairwise, t = 3.3, p = 0.008); P. astreoides CV was 60% of that in S. siderea (Tukey’s pairwise, t = −3.5, p = 0.004) and S. siderea CV, which was significantly higher than the mean (linear contrasts, z = 4.8, p < 0.0001) and was nearly double that of the non-target species (t = 5.8, p < 0.0001; Supplementary Figure 5). Log10-transformed skewness varied by species and had a significant interaction between species and depth (GLM, R2 = 0.20; Supplementary Figure 6). S. siderea skewness declined significantly with depth, with an estimated decline in the skewness of 0.05 m−1 (linear trends, p < 0.05). M. cavernosa skewness had a slightly declining trend (linear contrasts, p < 0.05). P. astreoides and non-target species had marginal increasing trends in skewness moving offshore (linear contrasts, p < 0.05). Log10-transformed kurtosis varied by species but did not vary by depth or distance from shore, although this only accounted for a small amount of the variation, and kurtosis was similar across all species (R2 = 0.11, Supplementary Figure 8). P. astreoides kurtosis was marginally lower than the non-target species (Tukey’s pairwise, t = −2.56, p = 0.06).
Recruit assemblage composition significantly varied by habitat (PERMANOVA, Pseudo-f = 6.85, p = 0.0001) with a significant interaction between habitat and sub-region (Pseudo-f = 1.78, p = 0.02), but did not vary temporally. Recruit assemblage composition varied significantly between all habitats except the middle and outer reefs (p < 0.01, Supplementary Table 24). Inner reef sites had higher relative S. siderea and P. porites recruit density and low diversity and evenness (H′ = 0.6; J′ = 0.2; Figure 5). Recruit diversity and evenness increased moving offshore and were highest on the deep outer reef (H′ = 1.5; J′ = 0.7). Recruit assemblage composition did not significantly vary between sub-regions on inner or deep outer reefs, but recruitment in the northernmost sub-region (Deerfield) was significantly different from that in the central sub-region (Broward) on the middle reef (t = 2.1, p = 0.008), and the recruit assemblage in Broward and the southernmost sub-region (Miami) varied on the outer reef (t = 2.1, p = 0.02). The middle reef in Deerfield had twice as many recruits (primarily S. siderea and Stephanocoenia intersepta) as the middle reef in Broward. The outer reef in Miami had three times as many M. cavernosa recruits as the outer reef in Broward. SIMPROF analysis found that recruit assemblage composition split into two groups (Pi = 0.73, p = 0.02; Figure 5). One group was made up of two low-cover sites within 500 m of the shoreline, HH2 and POMP4, which had twice as many S. siderea recruits than at any other site. The other group contained all other samples and was comparatively diverse. No recruits with arborescent or corymbose morphologies were found. Two sites had recruits with laminar morphologies, and only one Orbicella sp. recruit was found (Supplementary Figure 8).
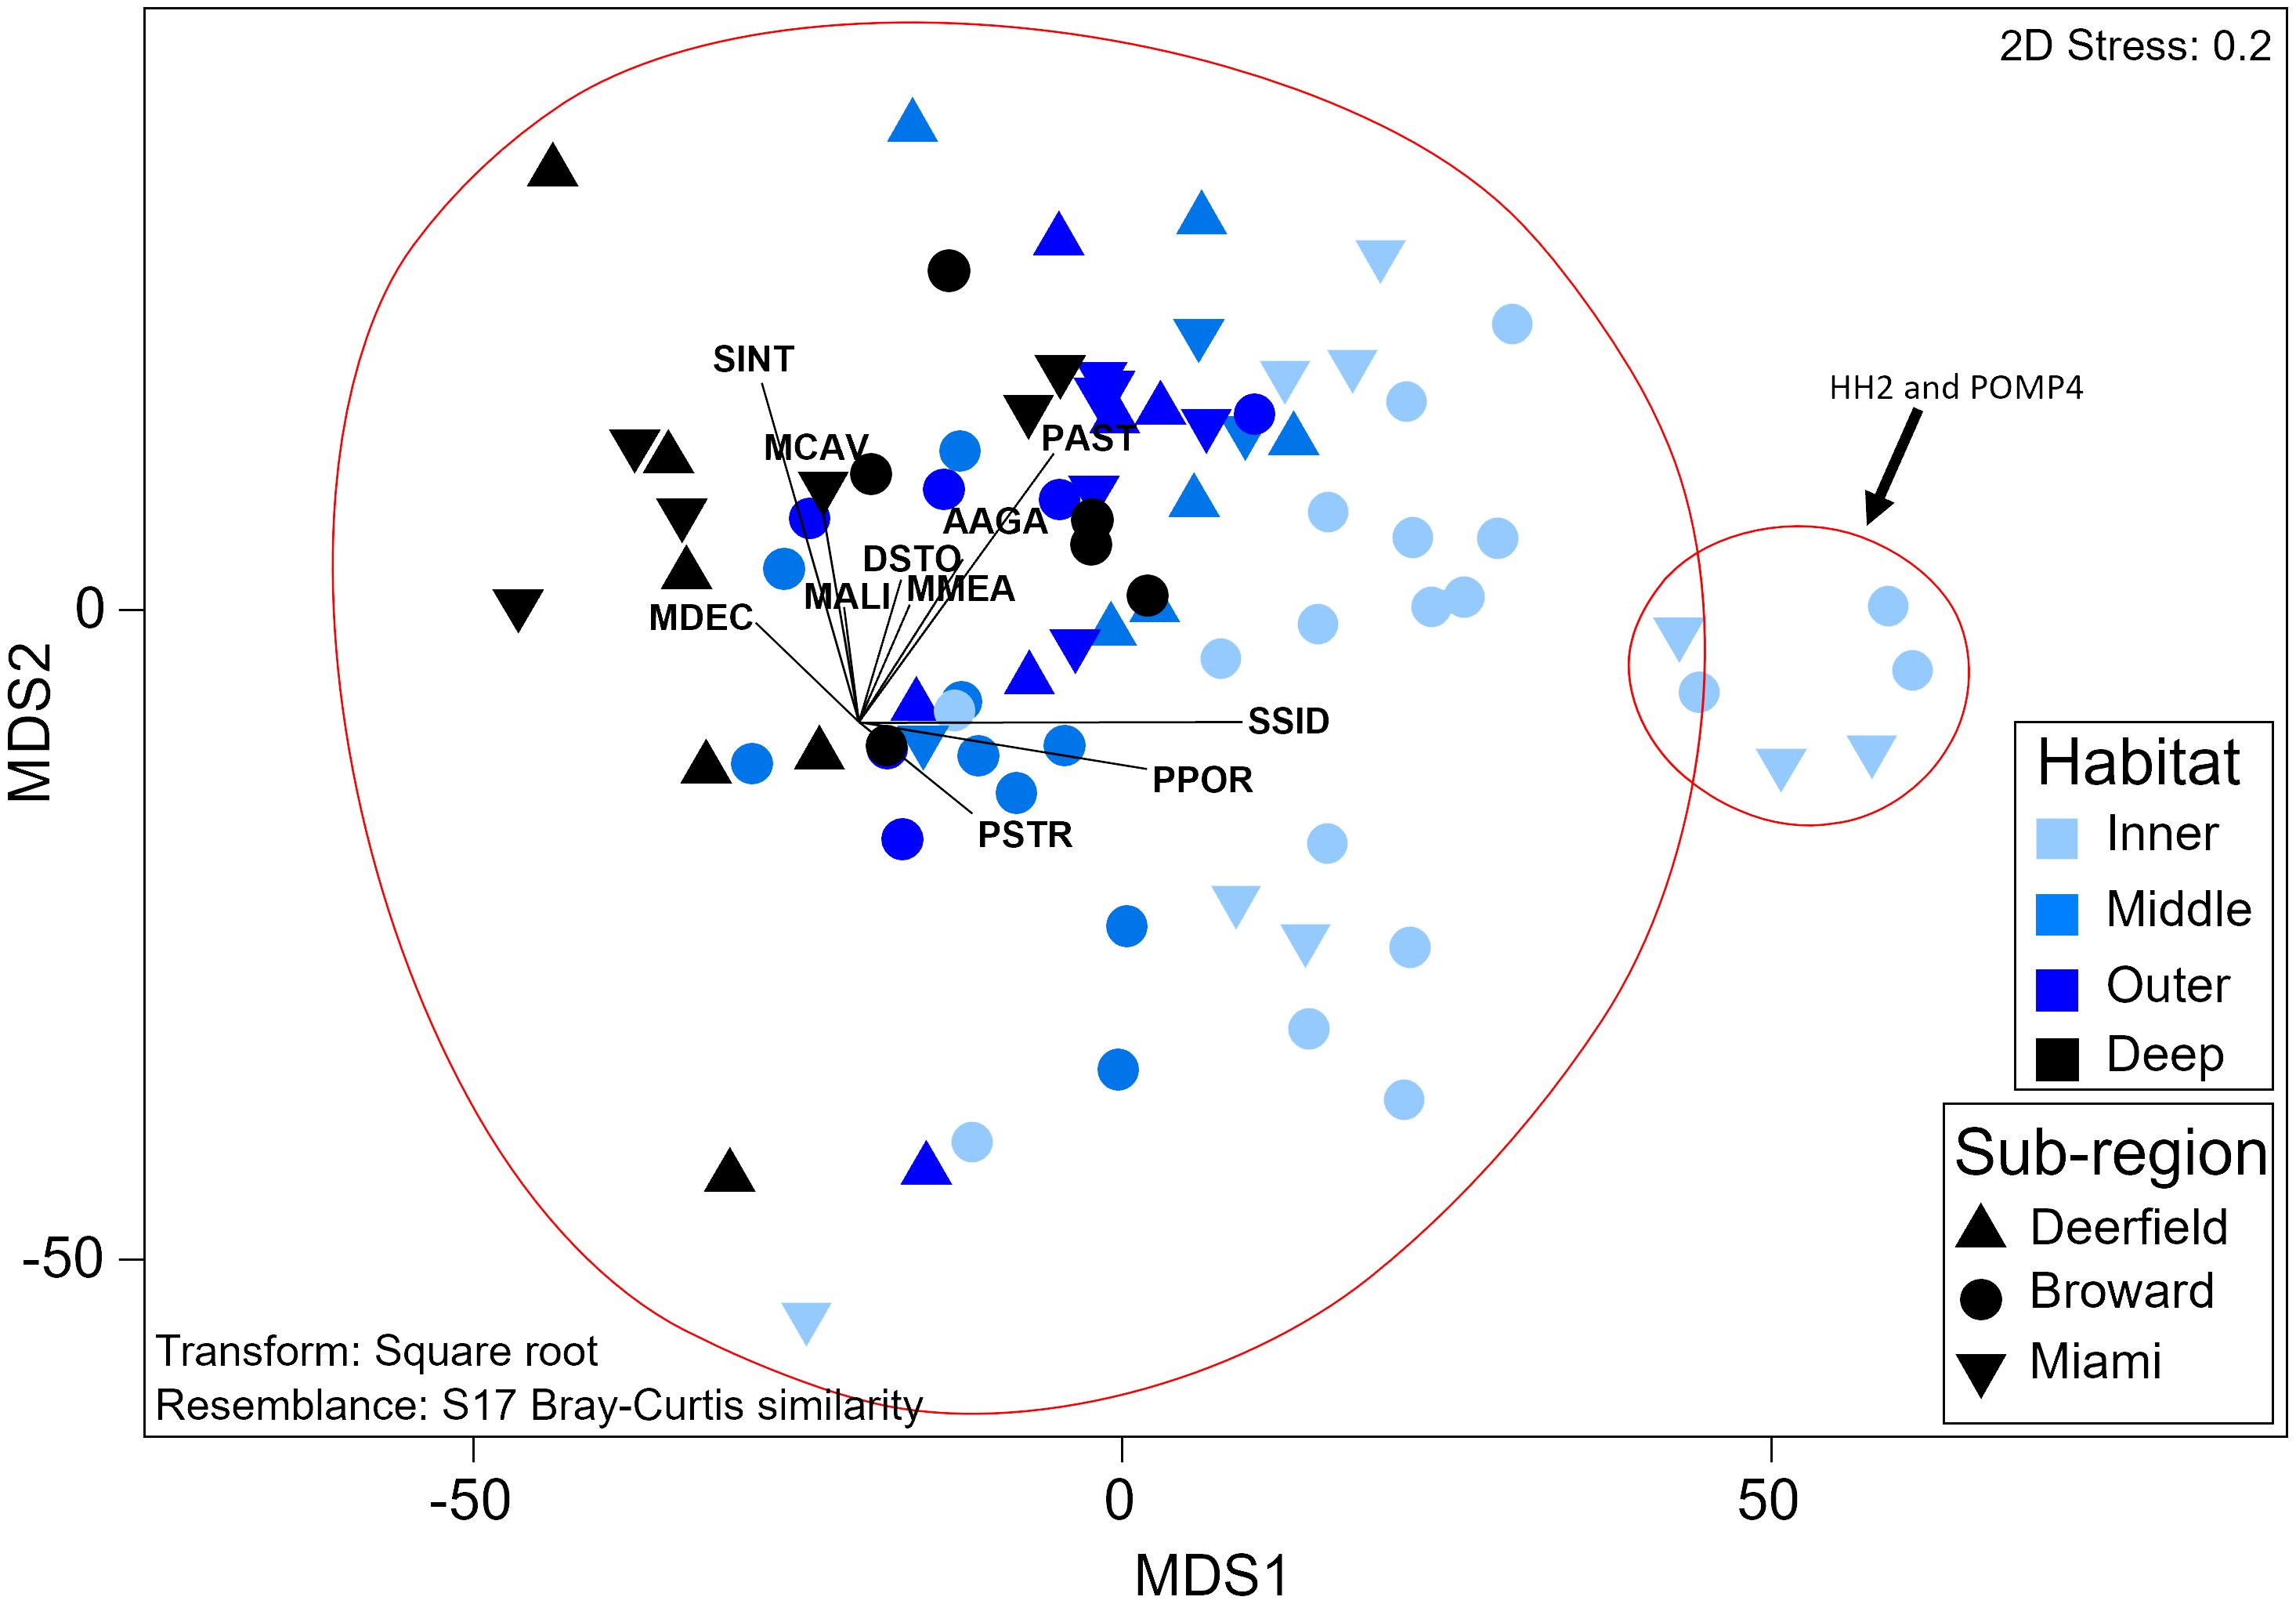
Figure 5 Threshold metric multidimensional scaling plot of recruit assemblage composition. Each sample represents the assemblage composition at one site during one survey year. Red circles symbolize significant groups identified by SIMPROF. Vectors represent coral species. Labels comprise the first letter of the genus and the first three letters of the species (Supplementary Table 2). SIMPROF, similarity profile routine.
Adult stony coral assemblage composition also varied strongly by habitat (PERMANOVA, Pseudo-f = 20.1, p = 0.0001), with a significant interaction between habitat and sub-region (Pseudo-f = 1.7, p = 0.02). Assemblage composition significantly varied between every habitat (Supplementary Table 24), with a depth-based gradient of species distribution and relative abundance (Figure 6). Inner reef sites were dominated by S. siderea and P. porites, with higher relative Solenastrea bournoni density. A clear depth-based split between shallow and deeper sites from P. porites to Madracis decactis as the only digitate coral was seen (Supplementary Figure 9). Diversity (H′) and evenness (J′) were highest on the deep outer reef and the lowest on the middle reef. No species representing corymbose, laminar, or solitary morphologies were found at inner reef sites. The single arborescent species, Acropora cervicornis, was only found on the inner reef at two of nine sites. Assemblage composition on the inner or outer reefs did not vary significantly by sub-region (p > 0.05). Assemblage composition in the northernmost sub-region (Deerfield) was significantly different from that in both sub-regions to the south on the middle reef (Broward, t = 2.3 p = 0.006; Miami, t = 2.6, p < 0.01) with lower species richness, evenness, and diversity. Assemblage composition in Deerfield was also significantly different from that in Broward on the deep outer reef (t = 2.0, p = 0.04), with lower species richness and density, but higher evenness. Sites generally clustered together or clustered with the closest site in the same habitat into significant SIMPROF groups (Pi = 4.9, p = 0.001).
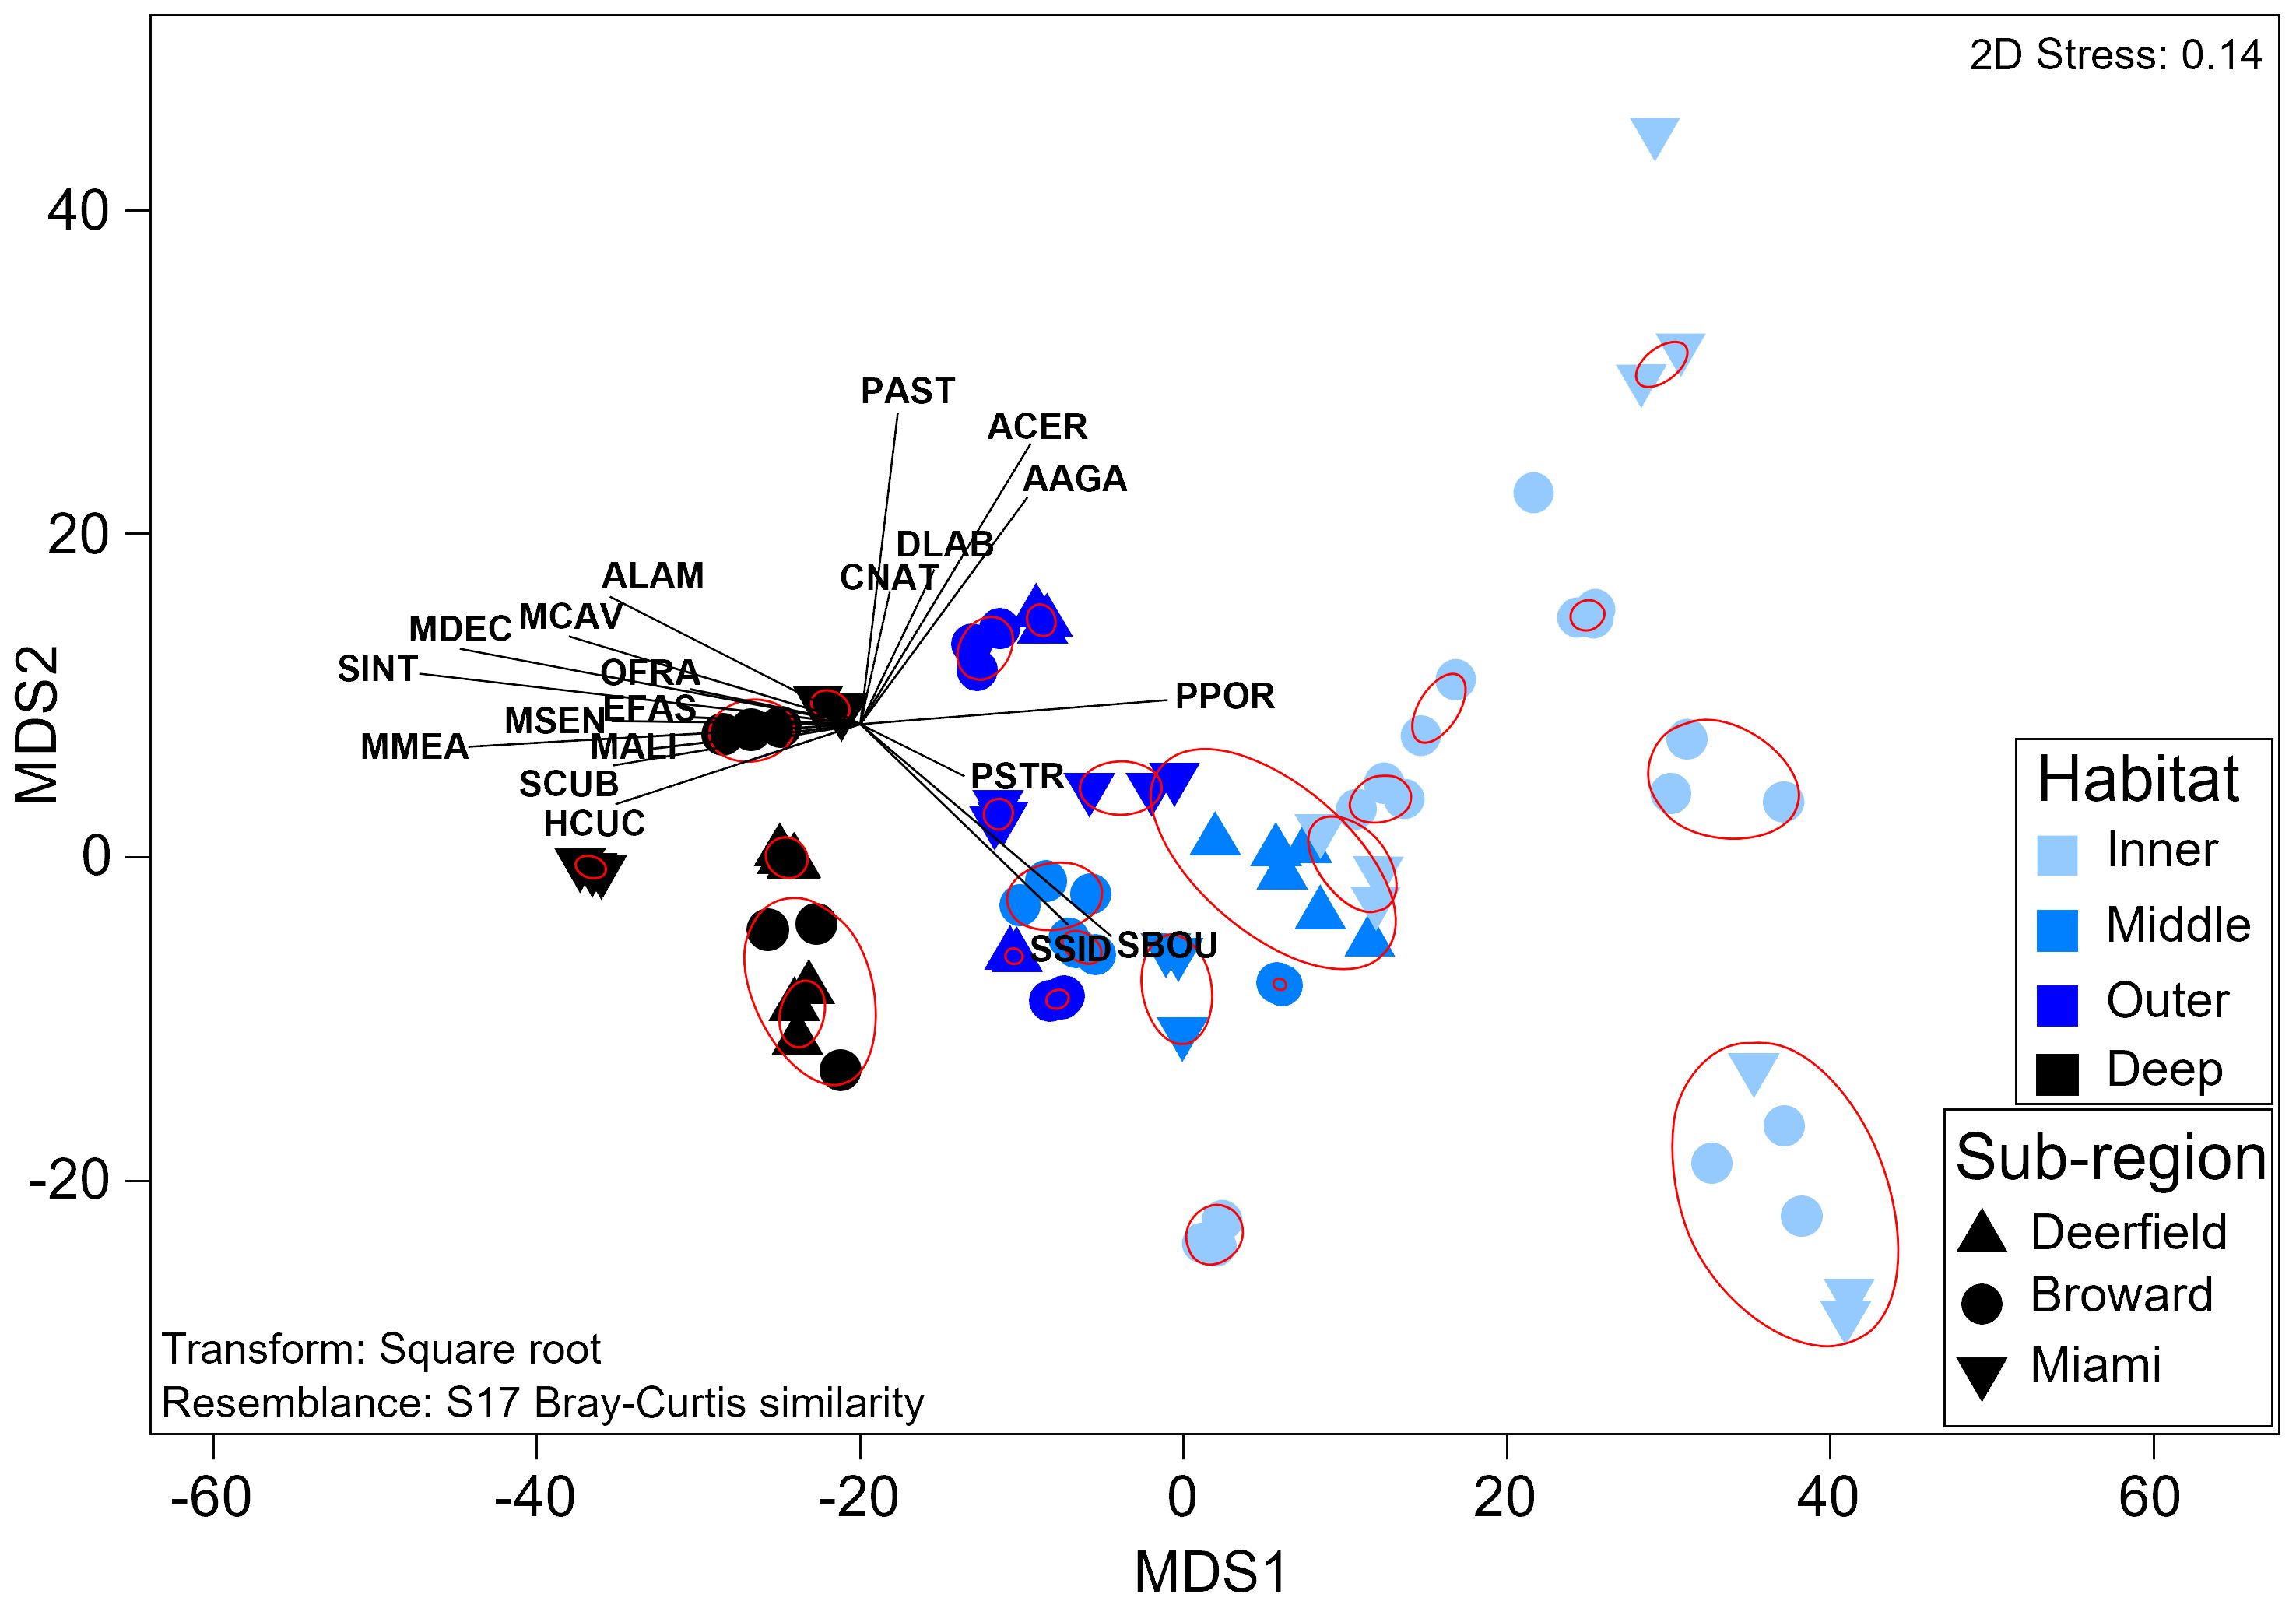
Figure 6 Threshold metric multidimensional scaling plot of adult coral assemblage composition. Each sample represents the assemblage composition at one site during one survey year. Red circles symbolize significant groups identified by SIMPROF. Vectors represent coral species. Labels comprise the first letter of the genus and the first three letters of the species (Supplementary Table 2). SIMPROF, similarity profile routine.
In this study, we identified a spatial disconnect between stony coral recruit density, adult colony density, size structure, and cover that suggests a bottleneck to population growth in southeast Florida (Miller et al., 2000; Edmunds, 2021). Recruitment was four times higher inshore, while adult colony density, diversity, mean colony size, and cover were all higher offshore. At sites with higher recruit density, there were frequently subsequent declines in adult colony density, and inshore size frequency distributions were heavily positively skewed, providing limited evidence of recruit survival or growth into larger size classes. Conversely, where larger colonies were more common, there was limited recruitment, particularly in species that contributed most strongly to cover. As a result, there is a preponderance of small colonies and heavily skewed size frequency distributions in the Coral ECA that suggests high colony mortality, potentially from environmental pressure (Bauman et al., 2013; Anderson and Pratchett, 2014; Riegl et al., 2017).
We hypothesized that depth and distance from shore may have provided some refugia to stony corals on the deep outer reef during thermal stress, disease, and Hurricane Irma from 2014 to 2018 (e.g., Sturm et al., 2022). On the deep outer reef, farthest from anthropogenic stress, stony coral cover was the highest, and adult density and diversity were relatively high, but recruit density was low. Conversely, recruit density, particularly S. siderea, was higher inshore, but size frequency distributions were generally heavily positively skewed, suggesting high mortality. Size structure was more evenly spread in each species on the outer reef or deep outer reef, and skewness had declining trends with depth in M. cavernosa and S. siderea, suggesting that recruits do grow into larger size classes (Anderson and Pratchett, 2014; Kramer et al., 2020). Further, species richness and the number of coral growth forms increased with depth and distance from shore, with a noticeable increase in the relative abundance of species with massive and laminar morphologies (Kramer et al., 2020). However, these were uncommon as recruits, with encrusting, digitate, and submassive species, which did not substantially contribute to cover, more common as recruits. These results suggest that, as predicted, the deep outer reef habitat, the deepest and farthest from the extensively urbanized shoreline, is the least disturbed.
Historically, M. cavernosa is the dominant hermatypic species in the Coral ECA, with a high density of larger colonies (>50 cm) just north of Port Everglades on the inner reef in the Broward sub-region (Moyer et al., 2003). Despite being heavily impacted by SCTLD from 2014 to 2017 (Walton et al., 2018), there was still a relatively high abundance of large M. cavernosa colonies here, but very few recruits reflecting an aging population. M. cavernosa recruit density was comparatively high at southern inshore sites where large adults were sporadic. As a result, M. cavernosa had a bimodal size structure on the inner reef and a high coefficient of variation with a latitudinal divide between recruit and adult colony density. The presence of large colonies inshore highlights the enhanced ability of M. cavernosa to effectively remove sediment (Loya, 1976), which may reduce partial mortality (Jones and Gilliam, 2024) and has often been assumed to enable them to survive and grow faster in inshore conditions (Goodbody-Gringley et al., 2015). Whether limited recruitment is due to a lack of larval supply, potentially because recent thermal stress and disease have caused fecundity to decline (Hughes et al., 2019), reduced settlement or high post-settlement mortality requires further study (Doropoulos et al., 2016; Price et al., 2019; Edmunds, 2021). Regardless of the demographic mechanism, recovery of the M. cavernosa inner reef population will be limited without sufficient recruitment (Holbrook et al., 2018; Pisapia et al., 2020).
Recruit density was 500% higher on the inner reef than on the deep outer reef, predominately due to S. siderea, which represented three-quarters of the 2,177 recruits sampled. Harper et al. (2023) found exceptionally high S. siderea recruitment in the Coral ECA and Florida Keys in 2018 and the recruits sampled here in 2019 and 2020 may be related to the same mass recruitment event. Despite high recruitment in years 1 and 2 (1.8 ± 0.9 recruits/m2 and 2.3 ± 1.2 recruits/m2; ± SE), there was little survival or growth into larger size classes, and cover did not change over the study as seen in the Florida Keys (van Woesik et al., 2014). S. siderea is considered stress-tolerant (Darling et al., 2012) and regularly forms large colonies on inshore reefs in the Florida Keys (Lirman and Fong, 2007). However, on the Coral ECA inner reef, the size structure was heavily positively skewed, indicative of a highly disturbed habitat with high mortality and slow growth rate (Miller et al., 2000; Bauman et al., 2013; Kramer et al., 2020; Pisapia et al., 2020; Jones et al., 2023). Nowhere was this more evident than at the two sites with the highest recruit density, HH2 and POMP4, where S. siderea accounted for 99% of recruits. Following the highest recruitment event, 337 recruits at POMP4 in 2020, adult colony abundance declined by 15% and recruit abundance by 76%. With no major disturbance event in the study period, this highlights the chronic environmental pressure the stony coral assemblage is under in the Coral ECA (Jones et al., 2022), which includes large fluctuations in temperature (Jones et al., 2020), nutrient enrichment, and sedimentation (Jones and Gilliam, 2024). S. siderea size structure was more normally distributed at middle, outer, and deep outer reef sites where temperatures tend to be more stable and turbidity is lower (Jones and Gilliam, 2024).
P. astreoides had a comparatively lognormal size structure, and recruit density was uniform over time and space. An encrusting, generalist, brooding species, P. astreoides, is thermally tolerant and has been increasing in cover in the Coral ECA over the last 15 years (Jones et al., 2020), largely due to the proliferation of a few successful genotypes through sexual reproduction and clonality (Shilling et al., 2023). Jones et al. (2023) found high partial mortality in P. astreoides, which may prevent growth into larger size classes and explain the high frequency of small (5–10 cm) colonies. Despite this, P. astreoides was the only species where no spatial decoupling between recruit and adult density was evident, suggesting that the population is comparatively healthy and that recruitment is consistent (Harper et al., 2023). Skewness did decline moving offshore, as mean colony size increased, likely due to a slight change in growth form to a plating morphology at the deepest sites. As frequently suggested (Toth et al., 2019; Jones et al., 2020), this provides further evidence that P. astreoides will continue to be a dominant part of the stony coral assemblage.
Recruit density was generally low, averaging 0.95 ± 0.2 recruits/m2 (± SE). Similar recruit densities have been recorded using similar survey methods in Biscayne National Park (Miller et al., 2000) and the Florida Keys (Chiappone and Sullivan, 1996), but recruit density at most sites in the Coral ECA was substantially lower than recorded elsewhere in the Caribbean. Edmunds et al. (2004) recorded ~8 recruits/m2 in the Florida Keys, while Williams et al. (2017) recorded ~8 recruits/m2 in Antigua and ~18 recruits/m2 in Barbados, although all of these surveys counted all colonies below 4 cm in diameter. Only S. siderea recruit density at one inner reef site (POMP4) was comparable (7.4 ± 2.5 recruits/m2), with most other sites having an order of magnitude less. The measure of recruitment used in this study, identifying colonies under 2 cm in diameter using 0.75-m2 quadrats, was designed to quantify settlement success, to only capture recruits once during the study period, and to provide an ecologically relevant way to assess recruitment success (Miller et al., 2000; Price et al., 2019). This is particularly pertinent on reefs with high epilithic algal matrix (EAM) and macroalgal cover, like the Coral ECA (Jones et al., 2020, 2022), where as few as 1% of newly settled corals may survive (Doropoulos et al., 2016). Our findings, high colony turnover, large coefficient of variation, and positive skew, provide an indication of high mortality in recruits and juveniles that do settle, which presents a substantial barrier to population growth on these marginal reefs that experience high disturbance frequency (Jones et al., 2022).
Diversity was low at most sites, particularly within the recruits, with multiple growth forms absent in each habitat. Eighteen species representing six growth forms were sampled as recruits; however, only M. cavernosa, P. astreoides, S. siderea, and S. intersepta were found at over 50% of sites, with most other species rare. Many species heavily impacted by SCTLD were sampled as recruits (Supplementary Figure 8), but low recruit diversity at many sites may reflect an Allee effect for some species, with few adult conspecifics within close proximity following the loss of many colonies of reproductive size from disease (Walton et al., 2018). Twenty-four species were sampled as adults, representing eight growth forms, with M. cavernosa, P. astreoides, S. siderea, and S. intersepta again most abundant. A slight latitudinal and inshore to offshore gradient in stony coral diversity were found. Shannon diversity and species richness were lower in the northernmost sub-region, Deerfield, which lacked the only arborescent species, A. cervicornis. Despite the small latitudinal difference, mean annual water temperatures were generally lower in Deerfield (Jones and Gilliam, 2024), and reduced recruit and adult diversity did suggest that the distance is still sufficient for the environmental conditions to be unsuitable for some stony coral species. Diversity was the highest in the outer and deep outer reef habitats and the lowest in the inner reef, as seen in other locations with inshore sediment stress (Otaño-Cruz et al., 2019).
Following significant declines in cover and density from thermal stress, SCTLD, and Hurricane Irma from 2014 to 2018 (Walton et al., 2018; Jones et al., 2020; Hayes et al., 2022), there was evidence of stony coral recovery during the 2018 to 2021 inter-disturbance period with substantial recruitment (Jones and Gilliam, 2024) and faster growth rate of M. cavernosa (Jones et al., 2023). Here, we found little evidence that recruits consistently grow into larger size classes, which, particularly on the inner reef, maintains positively skewed coral populations dominated by small colonies below presumed reproductive size (Soong, 1993), indicative of highly disturbed or marginal locations (Bauman et al., 2013; Anderson and Pratchett, 2014; Pisapia et al., 2020). In addition to limited recruitment, our findings suggest the loss of smaller colonies despite the study taking place during an inter-disturbance period when the water temperature was relatively stable and no major acute disturbances were recorded. Temperature constraints are frequently suggested to reduce stony coral health on high-latitude, marginal reefs (Schoepf et al., 2023) and limit reef accretion in the Coral ECA (Toth et al., 2021), with local chronic pressures further hindering recovery potential (Jones and Gilliam, 2024). Our results suggest that anthropogenic pressures influence stony coral viability, with M. cavernosa and particularly S. siderea size frequency distributions less skewed at deeper, offshore sites. They also suggest that spatial decoupling in M. cavernosa and S. siderea recruitment, size structure, and survival may present a substantial barrier to population growth.
The datasets presented in this study can be found in online repositories. The names of the repository/repositories and accession number(s) can be found below: https://github.com/nj350/Recruitment-Size-Structure---Frontiers.
The manuscript presents research on animals that do not require ethical approval for their study.
NJ: Conceptualization, Formal analysis, Visualization, Writing – original draft, Writing – review & editing. DG: Conceptualization, Funding acquisition, Supervision, Writing – review & editing.
The author(s) declare financial support was received for the research, authorship, and/or publication of this article. Partial funding was through an award from the Broward County Board of County Commissioners.
We thank the past and present members of the NSU Coral Reef Restoration, Assessment, and Monitoring Lab for the monitoring dives. Thanks to Prof. Morgan Pratchett and Dr. Matt Johnston for edits and advice. Thanks to Dr. Rosanna Milligan for statistical advice.
The authors declare that the research was conducted in the absence of any commercial or financial relationships that could be construed as a potential conflict of interest.
All claims expressed in this article are solely those of the authors and do not necessarily represent those of their affiliated organizations, or those of the publisher, the editors and the reviewers. Any product that may be evaluated in this article, or claim that may be made by its manufacturer, is not guaranteed or endorsed by the publisher.
The Supplementary Material for this article can be found online at: https://www.frontiersin.org/articles/10.3389/fmars.2024.1369286/full#supplementary-material
Anderson M. J. (2001). A new method for non-parametric multivariate analysis of variance. Austral Ecol. 26, 32–46. doi: 10.1111/j.1442-9993.2001.01070.pp.x
Anderson K. D., Pratchett M. S. (2014). Variation in size-frequency distributions of branching corals between a tropical versus sub-tropical reef. Mar. Ecol. Prog. Ser. 502, 117–128. doi: 10.3354/meps10697
Bak R. P., Meesters E. H. (1998). Coral population structure: the hidden information of colony size-frequency distributions. Mar. Ecol. Prog. Ser. 162, 301–306. doi: 10.3354/meps162301
Bak R. P., Meesters E. H. (1999). Population structure as a response of coral communities to global change. Am. Zoologist 39, 56–65. doi: 10.1093/icb/39.1.56
Baker A. C., Glynn P. W., Riegl B. (2008). Climate change and coral reef bleaching: An ecological assessment of long-term impacts, recovery trends and future outlook. Estuarine Coast. shelf Sci. 80, 435–471. doi: 10.1016/j.ecss.2008.09.003
Bauman A. G., Pratchett M. S., Baird A. H., Riegl B., Heron S. F., Feary D. A. (2013). Variation in the size structure of corals is related to environmental extremes in the Persian Gulf. Mar. Environ. Res. 84, 43–50. doi: 10.1016/j.marenvres.2012.11.007
Bellwood D. R., Hughes T. P., Folke C., Nyström M. (2004). Confronting the coral reef crisis. Nature 429, 827. doi: 10.1038/nature02691
Beger M., Sommer B., Harrison P. L., Smith S. D., Pandolfi J. M. (2014). Conserving potential coral reef refuges at high latitudes. Divers. Distrib. 20, 245–257. doi: 10.1111/ddi.12140
Bongaerts P., Ridgway T., Sampayo E. M., Hoegh-Guldberg O. (2010). Assessing the “deep reef refugia” hypothesis: focus on Caribbean reefs. Coral Reefs 29, 309–327. doi: 10.1007/s00338-009-0581-x
Brooks M. E., Kristensen K., Van Benthem K. J., Magnusson A., Berg C. W., Nielsen A., et al. (2017). glmmTMB balances speed and flexibility among packages for zero-inflated generalized linear mixed modeling. R J. 9, 378–400. doi: 10.32614/RJ-2017-066
Burnham K. P., Anderson D. R. (2004). Multimodel inference: understanding AIC and BIC in model selection. Sociological Methods Res. 33, 261–304. doi: 10.1177/0049124104268644
Carilli J. E., Norris R. D., Black B. A., Walsh S. M., McField M. (2009). Local stressors reduce coral resilience to bleaching. PloS One 4, e6324. doi: 10.1371/journal.pone.0006324
Chiappone M., Sullivan K. (1996). Distribution, abundance and species composition of juvenile Scleractinian corals in the Florida reef tract. Bull. Mar. Sci. 58, 555–569. Available online at: https://www.ingentaconnect.com/content/umrsmas/bullmar/1996/00000058/00000002/art00014.
Clarke K. R., Somerfield P. J., Gorley R. N. (2008). Testing of null hypotheses in exploratory community analyses: similarity profiles and biota-environment linkage. J. Exp. Mar. Biol. Ecol. 366, 56–69. doi: 10.1016/j.jembe.2008.07.009
Connell J. (1997). Disturbance and recovery of coral assemblages. Coral Reefs 16, S101–S113. doi: 10.1007/s003380050246
Darling E. S., Alvarez-Filip L., Oliver T. A., McClanahan T. R., Côté I. M. (2012). Evaluating life-history strategies of reef corals from species traits. Ecol. Lett. 15, 1378–1386. doi: 10.1111/j.1461-0248.2012.01861.x
De’ath G., Fabricius K. E., Sweatman H., Puotinen M. (2012). The 27–year decline of coral cover on the Great Barrier Reef and its causes. Proc. Natl. Acad. Sci. 109, 17995–17999. doi: 10.1073/pnas.1208909109
De’ath G., Lough J. M., Fabricius K. E. (2009). Declining coral calcification on the Great Barrier Reef. Science 323, 116–119. doi: 10.1126/science.1165283
De Bakker D. M., Meesters E. H., Bak R. P., Nieuwland G., Van Duyl F. C. (2016). Long-term shifts in coral communities on shallow to deep reef slopes of Curaçao and Bonaire: are there any winners? Front. Mar. Sci. 3, 247. doi: 10.3389/fmars.2016.00247
Dietzel A., Bode M., Connolly S. R., Hughes T. P. (2020). Long-term shifts in the colony size structure of coral populations along the Great Barrier Reef. Proc. R. Soc. B 287, 20201432. doi: 10.1098/rspb.2020.1432
Doropoulos C., Roff G., Bozec Y. M., Zupan M., Werminghausen J., Mumby P. J. (2016). Characterizing the ecological trade-offs throughout the early ontogeny of coral recruitment. Ecol. Monogr. 86, 20–44. doi: 10.1890/15-0668.1
Edmunds P. J. (2018). Implications of high rates of sexual recruitment in driving rapid reef recovery in Mo’orea, French Polynesia. Sci. Rep. 8, 16615. doi: 10.1038/s41598-018-34686-z
Edmunds P. J. (2021). Recruitment hotspots and bottlenecks mediate the distribution of corals on a Caribbean reef. Biol. Lett. 17, 20210149. doi: 10.1098/rsbl.2021.0149
Edmunds P. J., Bruno J. F., Carlon D. B. (2004). Effects of depth and microhabitat on growth and survivorship of juvenile corals in the Florida Keys. Mar. Ecol. Prog. Ser. 278, 115–124. doi: 10.3354/meps278115
Edmunds P. J., Elahi R. (2007). The demographics of a 15-year decline in cover of the Caribbean reef coral Montastraea annularis. Ecol. Monogr. 77, 3–18. doi: 10.1890/05-1081
Edmunds P. J., Riegl B. (2020). Urgent need for coral demography in a world where corals are disappearing. Mar. Ecol. Prog. Ser. 635, 233–242. doi: 10.3354/meps13205
Gardner T. A., Côté I. M., Gill J. A., Grant A., Watkinson A. R. (2003). Long-term region-wide declines in Caribbean corals. Science 301, 958–960. doi: 10.1126/science.1086050
Gardner T. A., Côté I. M., Gill J. A., Grant A., Watkinson A. R. (2005). Hurricanes and Caribbean coral reefs: impacts, recovery patterns, and role in long-term decline. Ecology 86, 174–184. doi: 10.1890/04-0141
Glynn P. W. (1996). Coral reef bleaching: facts, hypotheses and implications. Global Change Biol. 2, 495–509. doi: 10.1111/j.1365-2486.1996.tb00063.x
Goodbody-Gringley G., Marchini C., Chequer A. D., Goffredo S. (2015). Population structure of Montastraea cavernosa on shallow versus mesophotic reefs in Bermuda. PloS One 10, e0142427. doi: 10.1371/journal.pone.0142427
Harper L. M., Huebner L. K., Cain E. D., Ruzicka R., Gleason D. F., Fogarty N. D. (2023). Multi-year coral recruitment study across the Florida Reef Tract reveals boom-or-bust pattern among broadcast spawners and consistency among brooders. Mar. Ecol. Prog. Ser. 721, 39–58. doi: 10.3354/meps14399
Hayes N. K., Walton C. J., Gilliam D. S. (2022). Tissue loss disease outbreak significantly alters the Southeast Florida stony coral assemblage. Front. Mar. Sci. 9, 975894. doi: 10.3389/fmars.2022.975894
Holbrook S. J., Adam T. C., Edmunds P. J., Schmitt R. J., Carpenter R. C., Brooks A. J., et al. (2018). Recruitment drives spatial variation in recovery rates of resilient coral reefs. Sci. Rep. 8, 7338. doi: 10.1038/s41598-018-25414-8
Hughes T. P., Barnes M. L., Bellwood D. R., Cinner J. E., Cumming G. S., Jackson J. B., et al. (2017). Coral reefs in the anthropocene. Nature 546, 82–90. doi: 10.1038/nature22901
Hughes T. P., Bellwood D. R., Baird A. H., Brodie J., Bruno J. F., Pandolfi J. M. (2011). Shifting base-lines, declining coral cover, and the erosion of reef resilience: comment on Sweatman et al. 2011. Coral Reefs 30, 653–660. doi: 10.1007/s00338-011-0787-6
Hughes T. P., Kerry J. T., Baird A. H., Connolly S. R., Chase T. J., Dietzel A., et al. (2019). Global warming impairs stock–recruitment dynamics of corals. Nature 568, 387. doi: 10.1038/s41586-019-1081-y
Hughes T. P., Kerry J. T., Baird A. H., Connolly S. R., Dietzel A., Eakin C. M., et al. (2018). Global warming transforms coral reef assemblages. Nature 556, 492. doi: 10.1038/s41586-018-0041-2
Jones N. P., Figueiredo J., Gilliam D. S. (2020). Thermal stress-related spatiotemporal variations in high-latitude coral reef benthic communities. Coral Reefs 39, 1661–1673. doi: 10.1007/s00338-020-01994-8
Jones N. P., Gilliam D. S. (2024). Temperature and local anthropogenic pressures limit stony coral assemblage viability in southeast Florida. Mar. pollut. Bull. 200, 116098. doi: 10.1016/j.marpolbul.2024.116098
Jones N. P., Pratchett M. S., Milligan R., Gilliam D. S. (2023). High incidence of partial mortality constrains realized growth for three coral species in southeast Florida. Mar. Ecol. Prog. Ser. 721, 59–70. doi: 10.3354/meps14420
Jones N. P., Ruzicka R. R., Colella M. A., Pratchett M. S., Gilliam D. S. (2022). Frequent disturbances and chronic pressures constrain stony coral recovery on Florida’s Coral Reef. Coral Reefs 41, 1–15. doi: 10.1007/s00338-022-02313-z
Kramer N., Tamir R., Eyal G., Loya Y. (2020). Coral morphology portrays the spatial distribution and population size-structure along a 5–100 m depth gradient. Front. Mar. Sci. 7. doi: 10.3389/fmars.2020.00615
Lenth R. (2019). emmeans: Estimated Marginal Means, aka Least-Squares Means. (R package version 1.7.2). Available online at: https://CRAN.R-project.org/package=emmeans.
Lirman D., Fong P. (2007). Is proximity to land-based sources of coral stressors an appropriate measure of risk to coral reefs? An example from the Florida Reef Tract. Mar. Pollut. Bull. 54, 779–791. doi: 10.1016/j.marpolbul.2006.12.014
Loya Y. (1976). Effects of water turbidity and sedimentation on the community structure of Puerto Rican corals. Bull. Mar. Sci. 26, 450–466. Available online at: https://www.ingentaconnect.com/content/umrsmas/bullmar/1976/00000026/00000004/art00003.
Madin J. S., Anderson K. D., Andreasen M. H., Bridge T. C., Cairns S. D., Connolly S. R., et al. (2016). The Coral Trait Database, a curated database of trait information for coral species from the global oceans. Sci. Data 3, 1–22. doi: 10.1038/sdata.2016.17
McArdle B. H., Anderson M. J. (2001). Fitting multivariate models to community data: a comment on distance-based redundancy analysis. Ecology 82, 290–297. doi: 10.1890/0012-9658(2001)082[0290:FMMTCD]2.0.CO;2
Mellin C., Matthews S., Anthony K. R., Brown S. C., Caley M. J., Johns K. A., et al. (2019). Spatial resilience of the Great Barrier Reef under cumulative disturbance impacts. Global Change Biol. 25, 2431–2445. doi: 10.1111/gcb.14625
Miller M. W., Weil E., Szmant A. M. (2000). Coral recruitment and juvenile mortality as structuring factors for reef benthic communities in Biscayne National Park, USA. Coral reefs 19, 115–123. doi: 10.1007/s003380000079
Miller M., Williams D. E., Huntington B. E., Piniak G. A., Vermeij M. J. (2016). Decadal comparison of a diminishing coral community: a study using demographics to advance inferences of community status. PeerJ 4, e1643. doi: 10.7717/peerj.1643
Moyer R. P., Riegl B., Banks K., Dodge R. E. (2003). Spatial patterns and ecology of benthic communities on a high-latitude South Florida (Broward County, USA) reef system. Coral Reefs 22, 447–464. doi: 10.1007/s00338-003-0334-1
Mumby P. J. (2009). Phase shifts and the stability of macroalgal communities on Caribbean coral reefs. Coral Reefs 28, 761–773. doi: 10.1007/s00338-009-0506-8
Otaño-Cruz A., Montañez-Acuña A. A., García-Rodríguez N. M., Díaz-Morales D. M., Benson E., Cuevas E., et al. (2019). Caribbean near-shore coral reefs benthic community response to changes in sedimentation dynamics and environmental conditions. Front. Mar. Sci. 6, 551. doi: 10.3389/fmars.2019.00551
Pisapia C., Edmunds P. J., Moeller H. V., Riegl B. M., McWilliam M., Wells C. D., et al. (2020). Projected shifts in coral size structure in the Anthropocene. Adv. Mar. Biol. 87, 31–60. doi: 10.1016/bs.amb.2020.07.003
Price N., Muko S., Legendre L., Steneck R., Van Oppen M., Albright R., et al. (2019). Global biogeography of coral recruitment: tropical decline and subtropical increase. Mar. Ecol. Prog. Ser. 621, 1–17. doi: 10.3354/meps12980
R Core Team (2020). R: A language and environment for statistical computing (R Foundation for Statistical Computing).
Riegl B., Cavalcante G., Bauman A. G., Feary D. A., Steiner S., Purkis S. (2017). Demographic mechanisms of reef coral species winnowing from communities under increased environmental stress. Front. Mar. Sci. 4, 344. doi: 10.3389/fmars.2017.00344
Riegl B., Johnston M., Purkis S., Howells E., Burt J., Steiner S. C., et al. (2018). Population collapse dynamics in Acropora downingi, an Arabian/Persian Gulf ecosystem-engineering coral, linked to rising temperature. Global Change Biol. 24, 2447–2462. doi: 10.1111/gcb.14114
Roff G. (2021). Evolutionary history drives biogeographic patterns of coral reef resilience. BioScience 71, 26–39. doi: 10.1093/biosci/biaa145
Schoepf V., Baumann J. H., Barshis D. J., Browne N. K., Camp E. F., Comeau S., et al. (2023). Corals at the edge of environmental limits: a new conceptual framework to re-define marginal and extreme coral communities. Sci. Total Environ. 25, 163688. doi: 10.1016/j.scitotenv.2023.163688
Shilling E. N., Eckert R. J., Sturm A. B., Voss J. D. (2023). Porites astreoides coral populations demonstrate high clonality and connectivity in southeast Florida. Coral Reefs 42, 1131–1145. doi: 10.1007/s00338-023-02417-0
Soong K. (1993). Colony size as a species character in massive reef corals. Coral reefs 12, 77–83. doi: 10.1007/BF00302106
Sturm A. B., Eckert R. J., Carreiro A. M., Voss J. D. (2022). Population genetic structure of the broadcast spawning coral, Montastraea cavernosa, demonstrates refugia potential of upper mesophotic populations in the Florida Keys. Coral Reefs 41, 587–598. doi: 10.1007/s00338-021-02112-y
Toth L. T., Precht W. F., Modys A. B., Stathakopoulos A., Robbart M. L., Hudson J. H., et al. (2021). Climate and the latitudinal limits of subtropical reef development. Sci. Rep. 11, 1–15. doi: 10.1038/s41598-021-87883-8
Toth L. T., Stathakopoulos A., Kuffner I. B., Ruzicka R. R., Colella M. A., Shinn E. A. (2019). The unprecedented loss of Florida’s reef-building corals and the emergence of a novel coral-reef assemblage. Ecology 100, e02781. doi: 10.1002/ecy.2781
van Woesik R., Scott Iv W. J., Aronson R. B. (2014). Lost opportunities: coral recruitment does not translate to reef recovery in the Florida Keys. Mar. pollut. Bull. 88, 110–117. doi: 10.1016/j.marpolbul.2014.09.017
Vergés A., McCosker E., Mayer-Pinto M., Coleman M. A., Wernberg T., Ainsworth T., et al. (2019). Tropicalisation of temperate reefs: Implications for ecosystem functions and management actions. Funct. Ecol. 33, 1000–1013. doi: 10.1111/1365-2435.13310
Walton C. J., Hayes N. K., Gilliam D. S. (2018). Impacts of a regional, multi-year, multi-species coral disease outbreak in Southeast Florida. Front. Mar. Sci. 5, 323. doi: 10.3389/fmars.2018.00323
Keywords: demographics, marginal reefs, Montastraea cavernosa, Porites astreoides, Siderastrea siderea, size frequency distribution
Citation: Jones NP and Gilliam DS (2024) Spatial differences in recruit density, survival, and size structure prevent population growth of stony coral assemblages in southeast Florida. Front. Mar. Sci. 11:1369286. doi: 10.3389/fmars.2024.1369286
Received: 12 January 2024; Accepted: 06 May 2024;
Published: 24 May 2024.
Edited by:
Charles Alan Jacoby, University of South Florida St. Petersburg, United StatesReviewed by:
Margaret Miller, SECORE International, United StatesCopyright © 2024 Jones and Gilliam. This is an open-access article distributed under the terms of the Creative Commons Attribution License (CC BY). The use, distribution or reproduction in other forums is permitted, provided the original author(s) and the copyright owner(s) are credited and that the original publication in this journal is cited, in accordance with accepted academic practice. No use, distribution or reproduction is permitted which does not comply with these terms.
*Correspondence: Nicholas P. Jones, bmozNTBAbm92YS5lZHU=
Disclaimer: All claims expressed in this article are solely those of the authors and do not necessarily represent those of their affiliated organizations, or those of the publisher, the editors and the reviewers. Any product that may be evaluated in this article or claim that may be made by its manufacturer is not guaranteed or endorsed by the publisher.
Research integrity at Frontiers
Learn more about the work of our research integrity team to safeguard the quality of each article we publish.