 Linxi Meng
 Yunwei Yan
 Lei Zhang
 Wen Xing4
 Yi Yu
Yi Yu Xiaogang Xing
- 1State Key Laboratory of Satellite Ocean Environment Dynamics, Second Institute of Oceanography, Ministry of Natural Resources, Hangzhou, China
- 2Key Laboratory of Marine Hazards Forecasting, Ministry of Natural Resources, Hohai University, Nanjing, China
- 3Observation and Research Station of Air-Sea Interface, Ministry of Natural Resources, Hohai University, Nanjing, China
- 4State Key Laboratory of Tropical Oceanography, South China Sea Institute of Oceanology, Chinese Academy of Sciences, Guangzhou, China
Marine Heatwaves (MHWs) are persistent anomalous sea surface temperature warming events that can affect the marine ecological environment and ecosystems. Here, we study the winter MHWs in the cold tongue region of the South China Sea (SCS) from 1982 to 2022. Our results show that the winter MHWs in the cold tongue region have the strongest cumulative intensity in the SCS, exceeding 45°C·day/time. These strong MHWs are due to their high mean intensity and long duration. Significant interannual variations are observed in these MHWs, with extreme MHW events occurring in the El Niño winters of 97/98 and 15/16. By employing a mixed layer heat budget analysis, we reveal that the extreme MHW event in the winter of 97/98 is caused primarily by the surface heat flux term, and secondarily by the vertical entrainment term. While the 15/16 extreme event is caused by a combination of the surface heat flux term, the vertical entrainment term and the horizontal advection term.
1 Introduction
Changes in the state of the ocean, particularly extreme oceanic state variations, have significant impacts on marine environments, climate systems, ecosystems, and human societies (Smith et al., 2021; Hu and Li, 2022; Masanja et al., 2023). Marine Heatwaves (MHWs) are mutually discrete, prolonged events of anomalous warming of sea surface temperatures (SSTs), lasting from a few days to several months (Hobday et al., 2016). The occurrence of such extreme events can disrupt marine ecosystems and reduce biodiversity (Wernberg et al., 2016; Hughes et al., 2017; Smale et al., 2019; Yao et al., 2022; Smith et al., 2023; Joyce et al., 2024), which in turn affects, among other things, fishery resources and social production (Mills et al., 2013; Caputi et al., 2016; Hughes et al., 2017; Pastor and Khodayar, 2023). Since the Industrial Revolution, MHWs have become more persistent, frequent, widespread, and intense in the context of ongoing global warming (Frölicher and Laufkötter, 2018; Jacox et al., 2020; Yao et al., 2022). Oliver et al. (2021) found that the frequency and duration of global MHWs increased by 34% and 17%, respectively, resulting in a 54% increase in annual MHW days from 1925 to 2016. As a result, the frequency of coral bleaching has increased, seagrass density has decreased, and kelp biomass has declined (Smale et al., 2019). Future projections from the Coupled Model Intercomparison Project Phase 6 (CMIP6) simulations indicate a continuous increase in MHW events, leading to sustained disruptions of marine ecosystems (Yao et al., 2022; Cheng et al., 2023; Dong et al., 2023). Under the 1.5°C (2.0°C) global temperature increase target of the Paris Agreement, the annual mean MHW days are projected to increase by 16 (23) times (Frölicher and Laufkötter, 2018). Hence, MHWs have rapidly emerged as an important research frontier and hotspot.
MHW events exhibit significant spatiotemporal variations (Hobday et al., 2016; Oliver et al., 2018; Holbrook et al., 2019; Hu et al., 2021; Kuroda and Setou, 2021; Wang et al., 2022a). For example, Hu and Li (2022) found that the frequency of MHW events in global oceans is 1−3 times per year, with a lower frequency in the equatorial eastern-central Pacific, where the MHWs tend to be single, long-lasting, and of high intensity. Holbrook et al. (2019) found that high-intensity MHW events primarily occur in boundary current regions and the equatorial eastern-central Pacific Ocean, while the equatorial eastern Pacific exhibits the longest duration of MHWs. Liang et al. (2023) found that the frequency and intensity of MHWs exhibit obvious seasonal characteristics, with higher intensity and frequency of MHW events occurring in summer than in winter. Oliver et al. (2018) found that, influenced by global warming, MHWs also exhibit low-frequency variations such as on interdecadal timescales: for global average, there is a significant increase in the frequency, intensity, and duration of MHWs in the period of 2000−2016 compared to the period of 1982−1998.
The formation of MHWs can be driven by external forcings from human activities and internal modes of the climate system (Hu and Li, 2022). Frölicher and Laufkötter (2018) found a substantial increase in the frequency, intensity, duration, and spatial extent of global MHWs in response to the anthropogenic forcing. The internal climate variability modes mainly include local driving factors and remote influences (Holbrook et al., 2019). The local factors involve air-sea heat flux, horizontal temperature advection, and vertical mixing. Air-sea heat fluxes that favor the formation of MHWs include anomalously high net solar radiation caused by less cloud cover and greater insolation, and anomalously low latent and sensible heat from the ocean to the atmosphere, often accompanied by exceptionally weak surface winds. These processes may operate independently or simultaneously, generating air-sea heat flux-driven MHWs, such as those that occurred in the Mediterranean Sea in 2003 and 2006 (Olita et al., 2007; Mavrakis and Tsiros, 2019) and from the southeastern tropical Indian Ocean to the Coral Sea in 2015/16 (Benthuysen et al., 2018), as well as in the East China Seas in 2004, 2006, and 2016 (Tan and Cai, 2018; Yan et al., 2020). Horizontal temperature advection can drive local temperature changes that lead to advective-type MHWs, such as the MHW event in the Tasman Sea in 2015/16 (Oliver et al., 2017). The remote influence may come from large-scale phenomena like El Niño-Southern Oscillation (ENSO), Pacific Decadal Oscillation (PDO), and Madden-Julian Oscillation (MJO), which can influence atmospheric circulation and oceanic conditions in distant regions through teleconnection, leading to the formation of MHWs (Oliver et al., 2021). For example, oceanic Rossby waves generated by changes in surface wind stress curl over the South Pacific region can modulate meridional heat transport through the Tasman Sea, enhancing the likelihood of MHW events (Oliver et al., 2017; Holbrook et al., 2020; Li et al., 2020).
The South China Sea (SCS; 100°−125°E, 0°−25°N; Figure 1) is a large semi-closed marginal ocean located in the northwest Pacific, with an average depth of 2000 meters (Yao et al., 2022). The SCS is a global hotspot of marine biodiversity with widely distributed coral reefs (Wang and Li, 2009; Li et al., 2011), and it plays an important role in the economy and development of surrounding countries due to its high marine biological productivity and significant ecological functions (De Deckker, 2016). Under global warming, the SCS has become a region prone to frequent MHW occurrences (Li et al., 2019; Yao et al., 2020; Tan et al., 2022; Wang et al., 2022a; Yang et al., 2022a). From 1982 to 2020, the average total summer MHW days, duration, and frequency in the SCS increased by approximately 3.0 days/decade, 1.0 days/time/decade, and 0.2 times/decade, respectively (Yao and Wang, 2021). On the seasonal scale, the occurrence area of SCS MHWs is slightly smaller in summer than in winter, while the MHW mean intensity is greater in summer (Yang et al., 2022b). Previous studies have mainly focused on summer MHWs (Gao et al., 2020; Yao and Wang, 2021; Tan et al., 2022; Oh et al., 2023), since it is the critical season for coral bleaching with the strongest upwelling system (Yao and Wang, 2021; Feng et al., 2022; Li and Donner, 2022). For instance, Yao and Wang (2021) found that summer MHWs in the SCS are mainly concentrated near the Nansha Islands and the Beibu Gulf. This is due to the anomalous strengthening of the western North Pacific subtropical high-pressure system during summer, and the westward extension of the system that leads to anomalous easterly winds at low latitudes, weakening the southwestern monsoon and the upwelling in the midwestern SCS, favoring the formation of MHWs (Yao and Wang, 2021). On interannual timescales, MHWs in the SCS are influenced by ENSO (Liu et al., 2022; Tan et al., 2022). During El Niño events, the anomalous northwestern Pacific anticyclone in winter led to enhanced solar radiation in the southwestern and northern SCS and reduced latent heat flux, resulting in the formation of MHWs (Liu et al., 2022). Spatially, previous studies have mainly focused on MHWs in the northern SCS, especially the continental shelf area (Wang et al., 2022a; Feng et al., 2022; Wang et al., 2023), because there are more intense and frequent MHWs in the SCS continental shelf than in the open sea (Cai et al., 2016; Li et al., 2019; Yao et al., 2020; Wang et al., 2022b). Abnormal air-sea heat flux is the main cause of their formation (Wang et al., 2022a, 2023; Wang et al., 2022b).
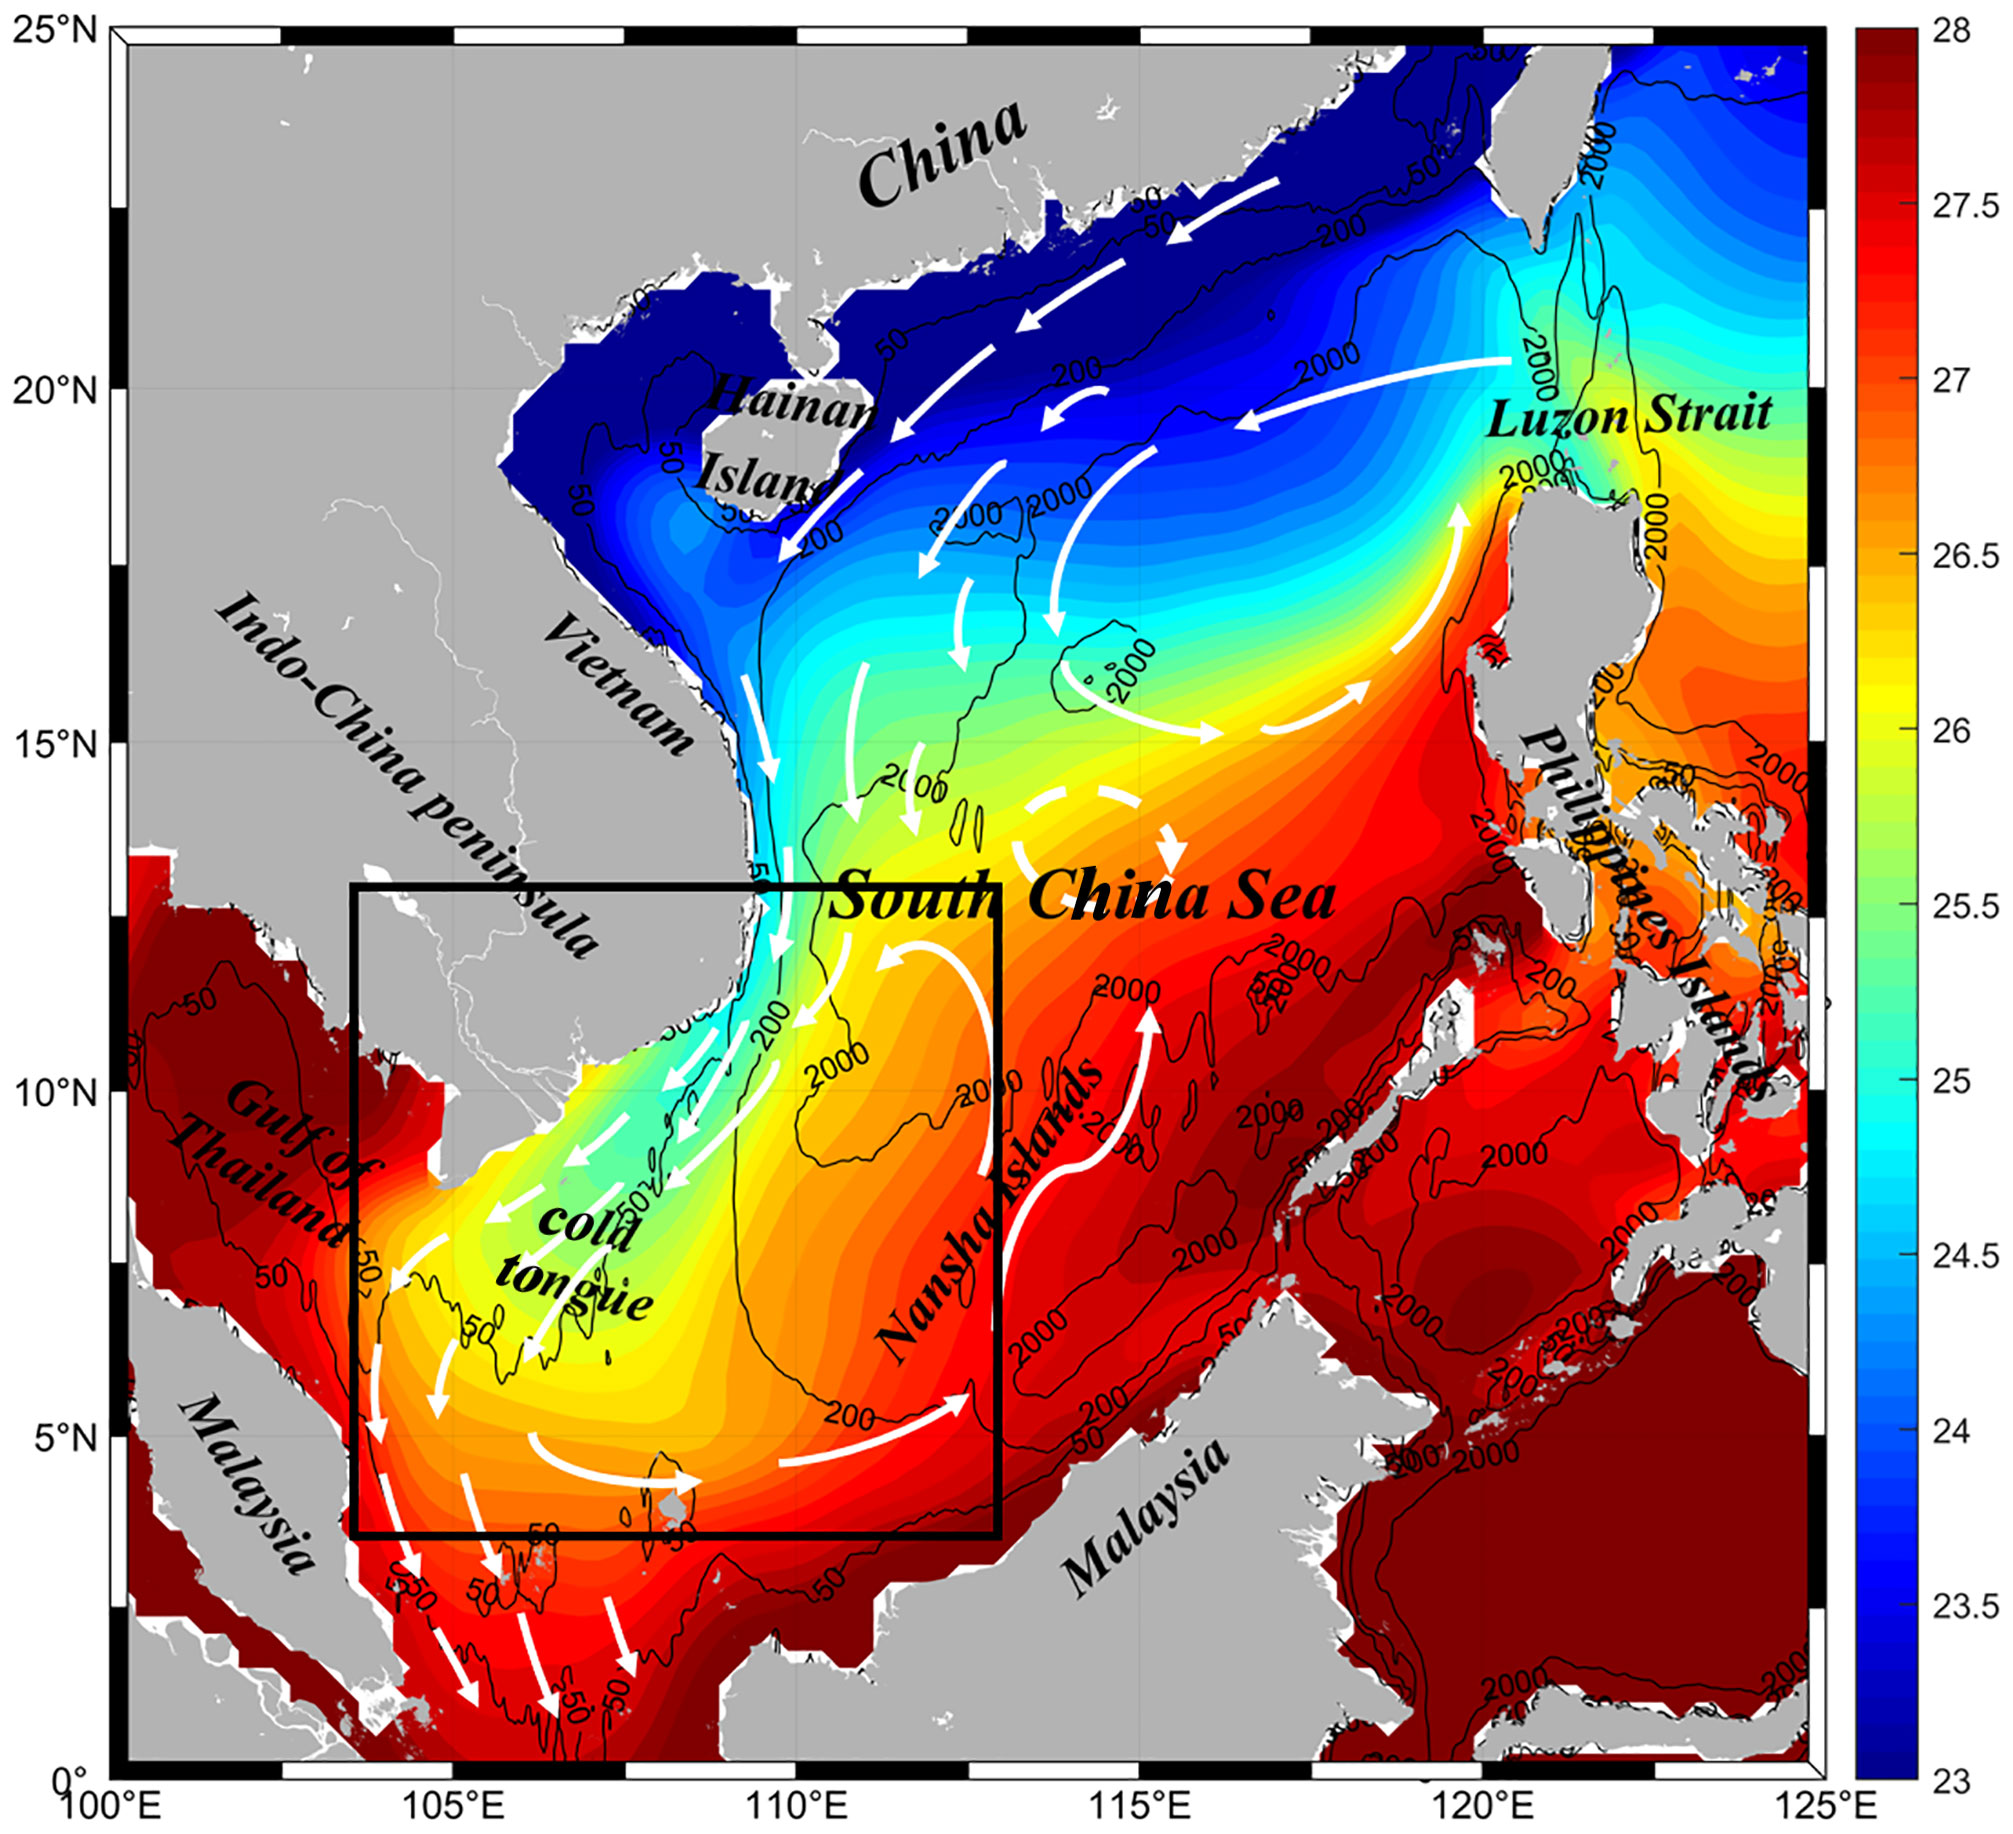
Figure 1 The multi-year mean winter SST in the SCS during 1982–2022 (shading). White arrows indicate a schematic representation of the surface circulation during winter. Black box represents the cold tongue region.
This study focuses on winter MHWs in the cold tongue region of the SCS. During winter, the northeast monsoon prevails in the SCS, leading to the formation of basin-scale cyclonic circulation, accompanied by strong western boundary currents (Liu et al., 2001; Yan et al., 2019). The strong north-to-south western boundary currents transport cold water from the northern part of the SCS to the southern part, forming the “cold tongue” (Liu et al., 2004) (Figure 1). Influenced by ENSO, the western boundary currents in the SCS exhibit significant interannual variability (Wang et al., 2013; Quan et al., 2016; Zhao and Zhu, 2016; Zu et al., 2019): During El Niño years, the northeast monsoon in the SCS weakens, leading to weakening of basin-scale circulation and western boundary currents. The weakened western boundary currents reduce the north-to-south cold advection, which leads to the recession or disappearance of the cold tongue in the SCS (Liu et al., 2004). This implies that MHWs are very likely to occur in the winter cold tongue region during El Niño years. Therefore, this paper will investigate the characteristics and mechanisms of winter MHWs in the cold tongue region.
2 Data and methods
2.1 Data
Temperature data with daily resolution are ideal for identifying and describing MHWs. Additionally, the time period of the data needs to be long enough (longer than 30 years) to estimate a climatological field (Oliver et al., 2021). Satellite-based SST datasets can provide global, continuous, and decades-long products for studying MHWs (Oliver et al., 2018). Therefore, the data utilized in this study is the daily mean dataset from the National Oceanic and Atmospheric Administration (NOAA) Optimum Interpolation Sea Surface Temperature (OISST) version 2, covering from late 1981 to present (Reynolds et al., 2007; Huang et al., 2021). This dataset is assembled by combining bias-adjusted observations from different platforms (satellites, ships, buoys) on a global regular grid and filling in gaps by interpolation. Remote sensing SST data from the Advanced Very High Resolution Radiometer (AVHRR) provides the primary input. The horizontal resolution is 0.25°×0.25°. Access and download of the data are available from the website at: https://www.ncei.noaa.gov/products/optimum-interpolation-sst.
To explore the mechanism of MHWs in the winter cold tongue region of the SCS, the mixed layer heat budget analysis was conducted using the OFES (ocean general circulation model for the Earth Simulator) product, which is a long-time series (1950-present) of high-resolution ocean model data (Sasaki et al., 2008). In addition, the OFES does not adopt an assimilation scheme. Therefore, its dynamic process is self-consistent and can be used for numerical diagnosis of thermodynamic or dynamic processes. For this study, ocean temperature, ocean current fields (including zonal velocity, meridional velocity, and vertical velocity), and surface heat flux data from the OFES 3−day dataset were employed. The horizontal resolution of OFES is 0.1°×0.1°, with a vertical resolution of 5 meters at the surface. The data are available at: http://apdrc.soest.hawaii.edu/las_ofes/v6/dataset?catitem=87.
2.2 Methods
2.2.1 Definition of MHW events
In this study, the period from 1982 to 2022 was selected as the climatological period. The definition of MHW events followed the method proposed by Hobday et al. (2016), who identified events exceeding the 90th percentile of seasonal variability—where the daily SST surpassed the threshold (typically defined as the 90% value of SST centered on the local climatological mean for the preceding and following 11 days) for five consecutive days or more. Events with intervals less than three days were considered the same event.
2.2.2 MHW indices
After identifying MHW events, six metrics are used to represent the characteristics of MHWs (Zhao and Marin, 2019), including frequency, duration, mean intensity, maximum intensity, cumulative intensity, and total days (Table 1).
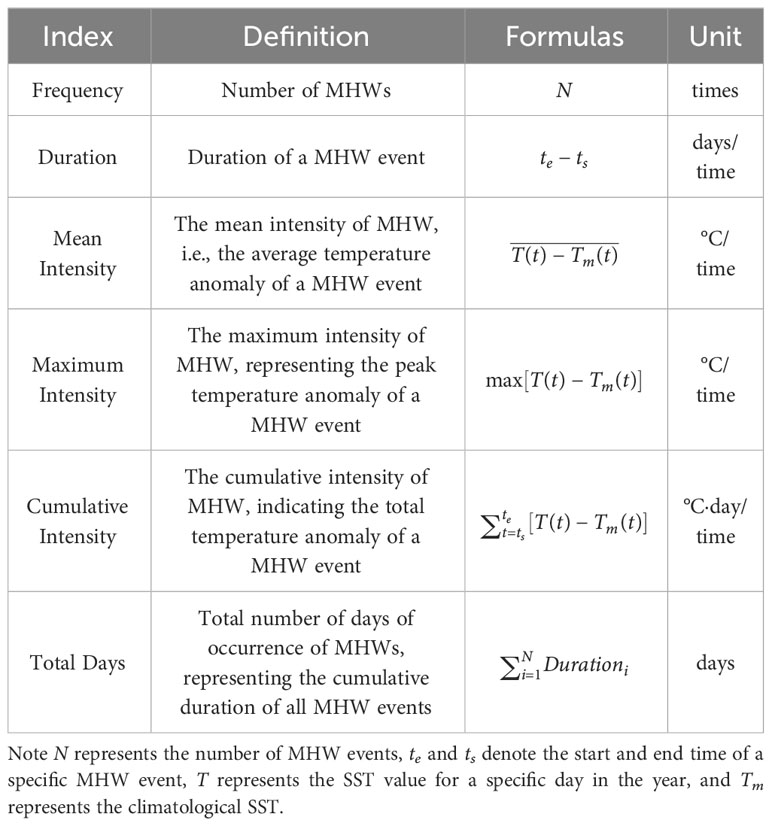
Table 1 Definitions of Marine Heatwave (MHW) Indices.
2.2.3 MLT equation
The mixed layer temperature (MLT) equation is an effective method for understanding the generation and maintenance of MHWs (Benthuysen et al., 2014; Chen et al., 2014; Kataoka et al., 2017; Oliver et al., 2021). The changes in MLT are primarily caused by a combination of air-sea heat exchanges, advection by currents and eddies, horizontal and vertical mixing, and entrainment of water into the mixed layer (Moisan and Niiler, 1998):
In Equation (1), represents the temperature averaged in the surface mixed layer (ML), denotes time, is the net heat flux at the ocean surface, comprising various components of air-sea heat flux, is the downward radiative heat flux at the bottom of the ML, is the seawater density, is the specific heat capacity of seawater, h is the mixed layer depth (MLD), represents the two-dimensional horizontal velocity vector averaged in the ML. represents the horizontal gradient operator, is the vertical velocity at the bottom of the ML, is the temperature just below the ML. represents the MLT tendency term, represents the surface heat flux term, represents the horizontal advection term, and represents the vertical entrainment term. By diagnosing the MLT equation, the main controlling factors of MHWs can be understood, and further analysis can elucidate their underlying physical processes.
3 Characteristics of MHWs in the cold tongue region of the SCS
3.1 Annual average and seasonal characteristics of MHWs in the SCS
Figure 2 shows the annual average statistical characteristics of MHWs (frequency, mean intensity, maximum intensity, duration, total days, and cumulative intensity) in the SCS from 1982 to 2022. The frequency of MHWs is highest in the northeastern SCS and along the coast, reaching 2−3 events per year, while it is lower in the southwestern regions, averaging less than 2 events per year (Figure 2A). The mean intensity and maximum intensity exhibit the highest values in the northern shelf area of the SCS, exceeding 2°C/time, gradually decreasing southward, demonstrating a “north high-south low” pattern (Figures 2B, C). The duration of MHWs is longer in the northwestern SCS, with a maximum of more than 14 days/time (Figure 2D). The spatial distribution of MHW occurrence total days is similar to that of the duration, with more days in the northwestern SCS, and over 30 days in the Beibu Gulf each year (Figure 2E). The cumulative intensity of MHWs is affected by both mean intensity and duration. Areas with high cumulative intensity are mainly in the northern and western SCS, with maximum values exceeding 25°C·day/time. These results are generally consistent with the findings of previous studies (Yao et al., 2020; He et al., 2023).
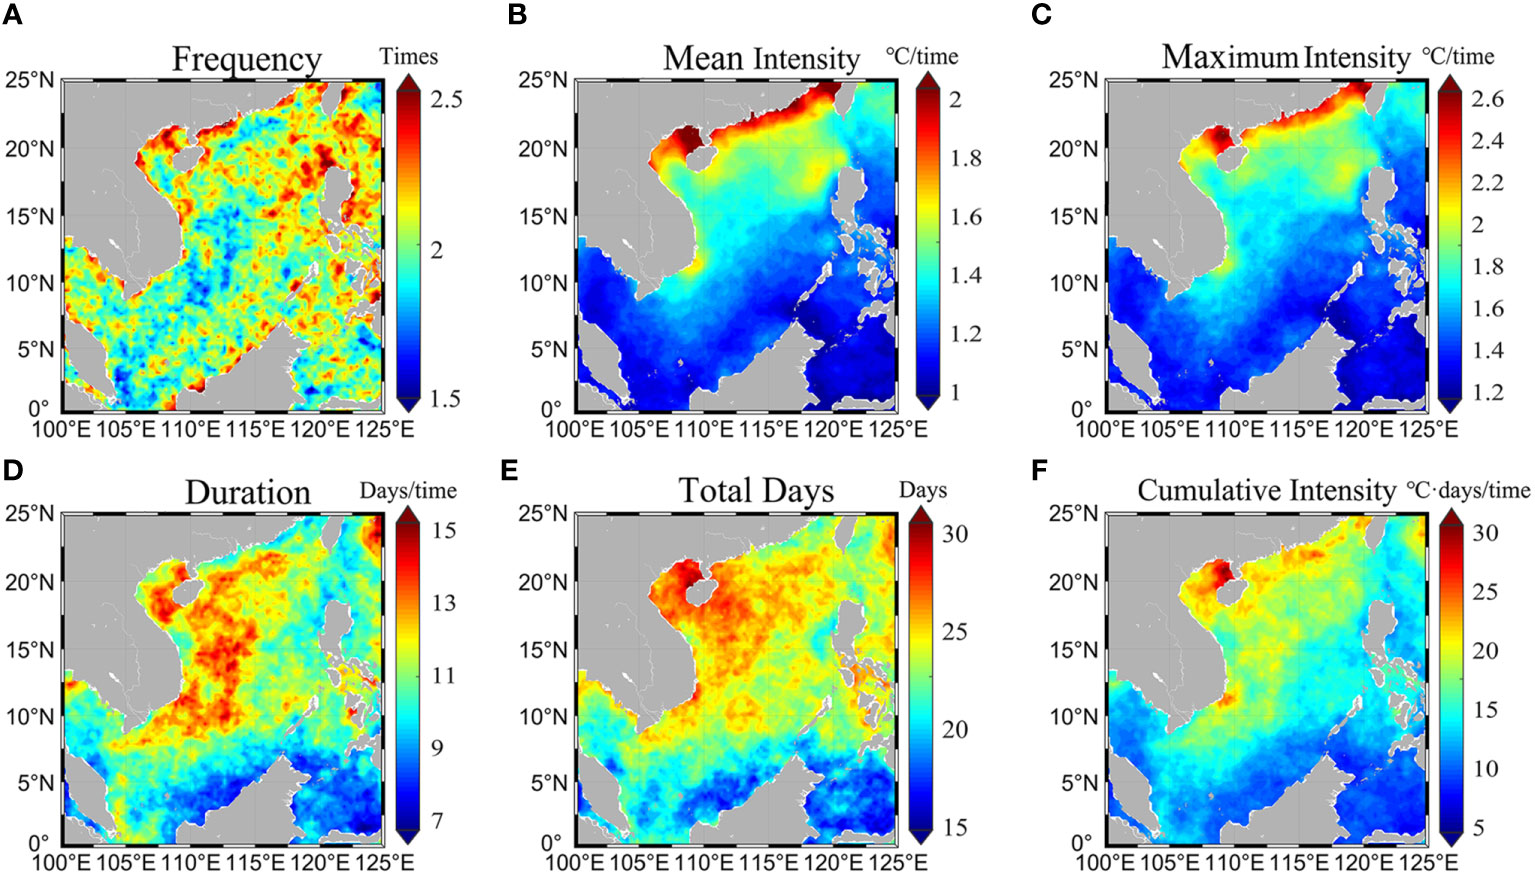
Figure 2 Spatial distribution of multi-year average (A) frequency (units: times), (B) mean intensity (units: °C/time), (C) maximum intensity (units: °C/time), (D) duration (units: days/time), (E) total days (units: days), and (F) cumulative intensity (units: °C·day/time) of SCS MHWs from 1982 to 2022. MHW is detected using NOAA OISST following the method proposed by Hobday et al. (2016).
To further analyze the seasonal difference of MHWs in the SCS, Figure 3 presents boxplots showing the MHW characteristics in spring (March, April, May), summer (June, July, August), autumn (September, October, November), and winter (December, January, February). The average frequency of MHWs in the SCS is roughly equal in spring, summer, and autumn (~0.5 times) and slightly lower in winter (~0.4 times) (Figure 3A). The mean/maximum intensity of MHWs is higher in spring and winter, with the highest in winter (1.37/1.64°C/time), and lower in summer and autumn (~1.23/1.48°C/time) (Figures 3B, C). The duration of MHWs is highest in winter (9.8 days/time), followed by autumn (8.5 days/time), and lowest in spring and summer (~8.1 days/time) (Figure 3D). The total days of MHWs are comparable in spring, summer and winter (~5.3 days) and slightly higher in autumn (6.3 days) (Figure 3E). Affected by mean intensity and duration, the cumulative intensity of MHWs is highest in winter (14.23°C·day/time), second highest in spring (11.56°C·day/time), and lowest in autumn and summer (∼10.52°C·day/time) (Figure 3F). These findings agree with the results of Liu et al. (2022).
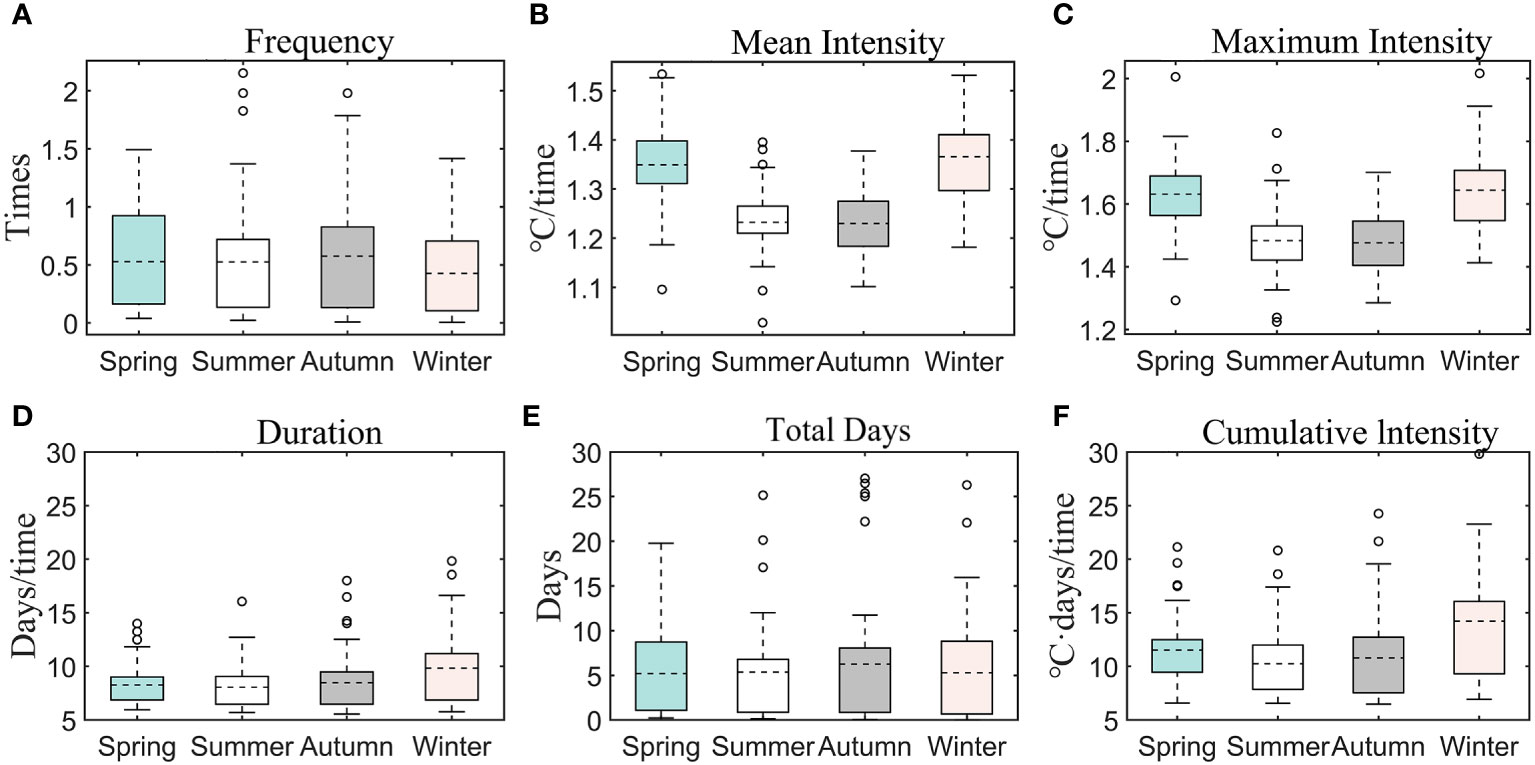
Figure 3 Boxplots of the (A) frequency (units: times), (B) mean intensity (units: °C/time), (C) maximum intensity (units: °C/time), (D) duration (units: days/time), (E) total days (units: days), and (F) cumulative intensity (units: °C·day/time) of SCS MHWs in spring (March, April, May), summer (June, July, August), autumn (September, October, November), and winter (December, January, February) after removing extremes marked by the circles. The dashed line inside the box represents the mean value, and the bottom and top of the box line represent the 1st and 3rd quartiles, respectively.
Cumulative intensity represents the overall strength of the MHWs. MHWs with strong cumulative intensity could potentially exert severe pressure on the marine ecosystem, leading to a decrease in biodiversity and having significant repercussions on fisheries and the economy (Eakin et al., 2010; Frölicher et al., 2018; Marin et al., 2021). Figure 4 shows the spatial distribution of seasonal variation in cumulative intensity in the SCS. In spring and autumn, the northwestern part of the SCS shows high values, with cumulative intensity exceeding 25°C·day/time. In summer, high values are observed in the central SCS and around Hainan Island, reaching over 30°C·day/time. In winter, two high-value areas are present in the western part: the winter cold tongue region (black box area in Figure 4) and the offshore area of northeast Vietnam, with cumulative intensity exceeding 45°C·day/time and 40°C·day/time, respectively. These findings show that the winter MHWs in the cold tongue region have the strongest cumulative intensity in the SCS. The strong cumulative intensity corresponds to strong mean intensity (>1.5°C/time) and long duration (>45 days/time) in this region (Figure 5). Given that the strongest MHWs have not been previously studied, our research aims to fill this gap by studying the winter MHWs in the cold tongue region of the SCS.
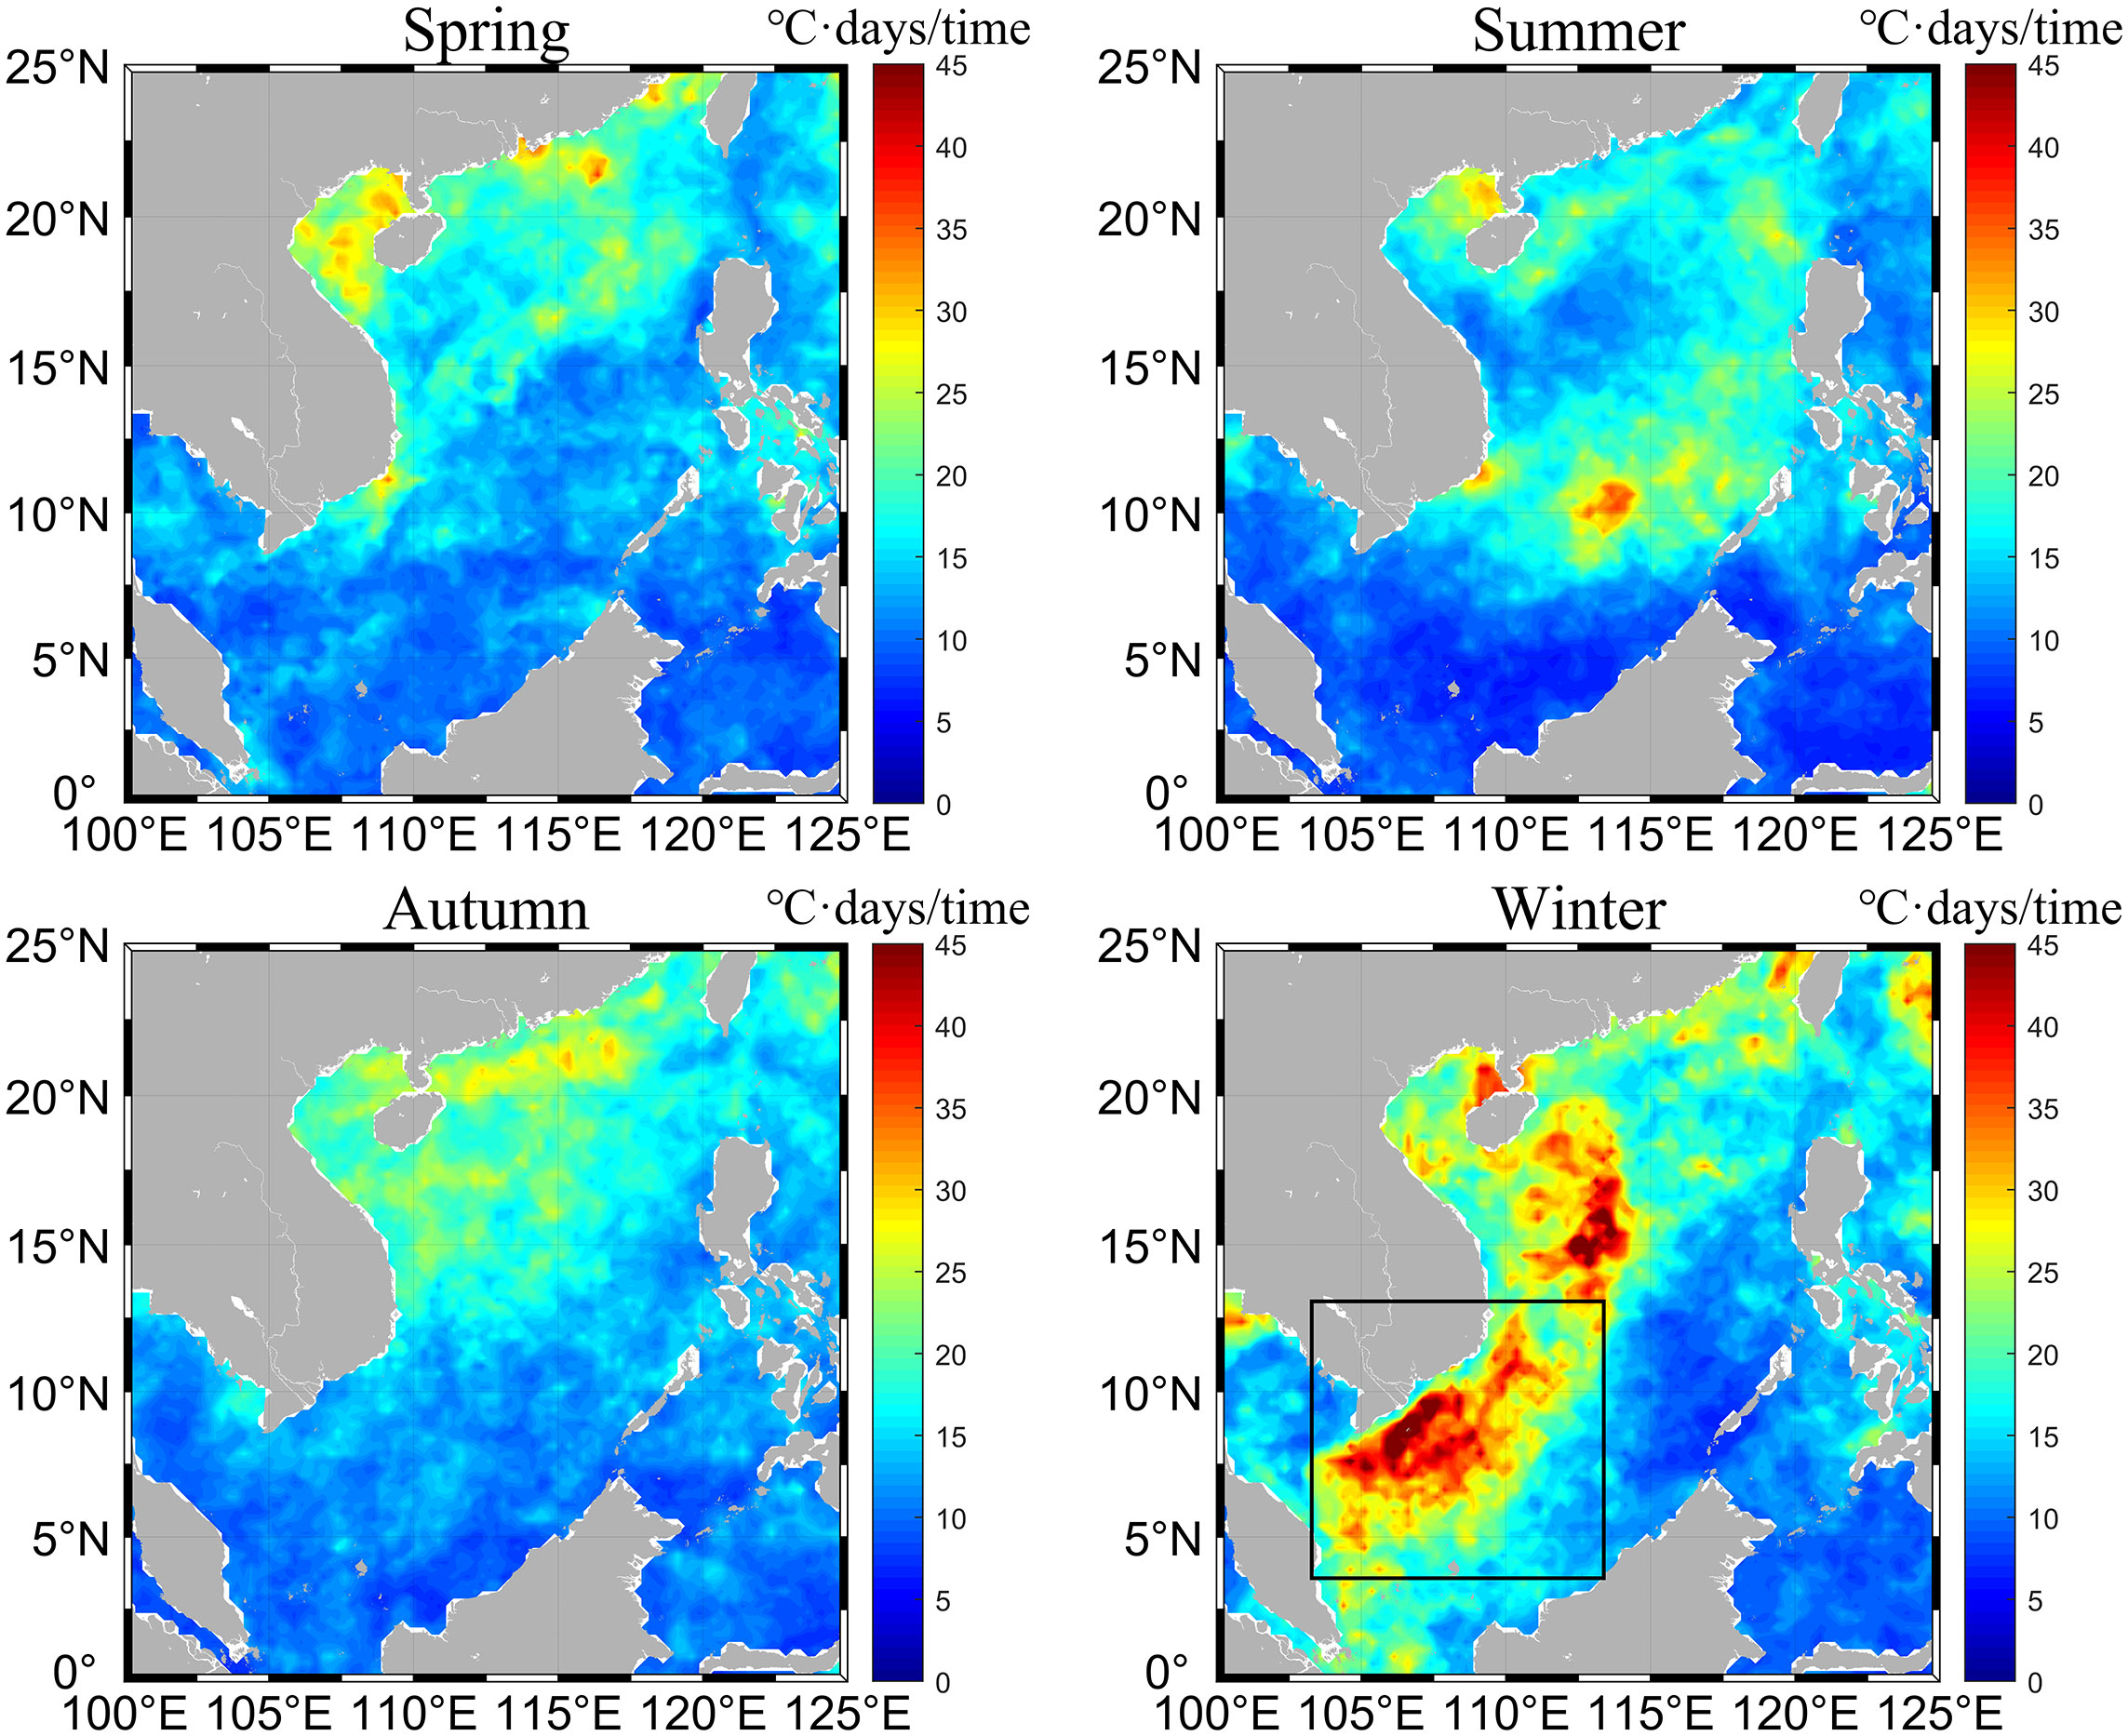
Figure 4 Seasonal variation in cumulative intensity (units: °C·day/time) of SCS MHWs from 1982 to 2022: spring (March, April, May), summer (June, July, August), autumn (September, October, November), and winter (December, January, February). Black box represents the cold tongue region.
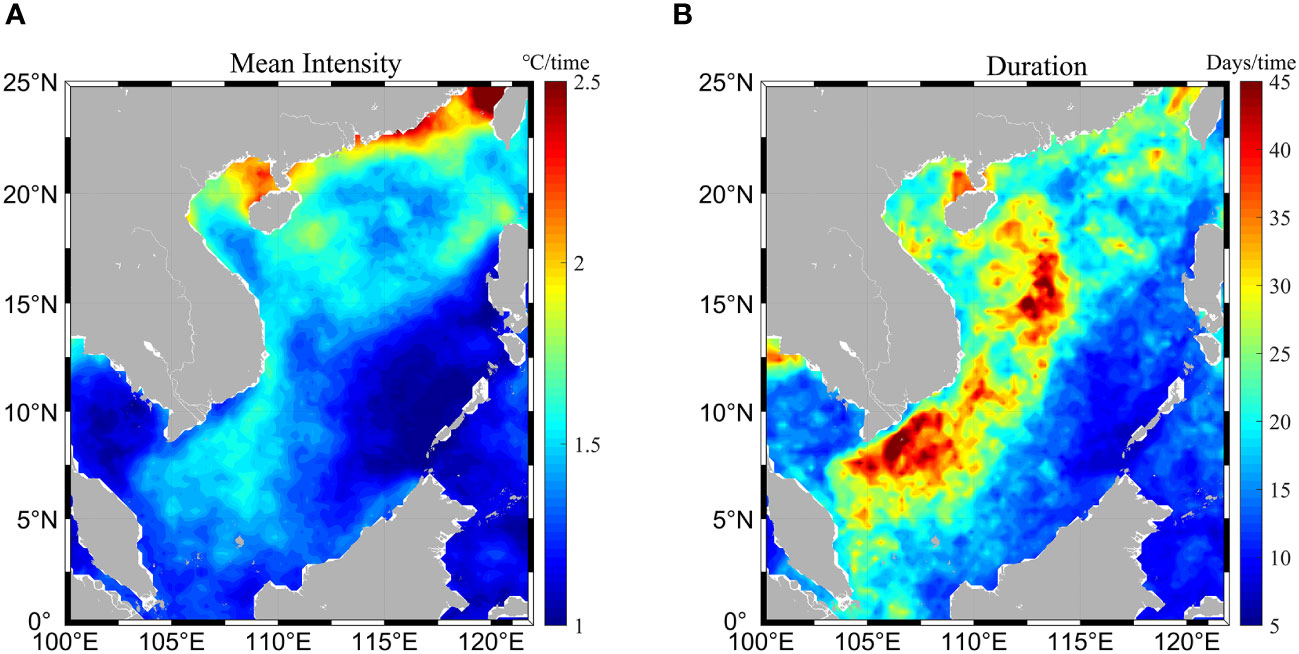
Figure 5 Winter (December, January, February) mean intensity [(A), units: °C/time] and duration [(B), units: days/time] of SCS MHWs from 1982 to 2022.
3.2 Characteristics of winter MHWs in the cold tongue region
To investigate the characteristics of winter MHWs in the cold tongue region, we considered this region (103°−113°E, 3°−13°N, marked by the black box in Figures 1 and 4) as a whole for MHW identification. Considering the winter monsoon in the SCS prevailing during the period from November to March next year (Shaw and Chao, 1994), we selected this time window to detect MHWs in the cold tongue region. Therefore, the winter hereafter for the cold tongue MHW spans from November to March next year. From 1982 to 2022, a total of 16 winter MHW events were detected in this region (Table 2). Notably, there was no MHW before the winter of 97/98 (November 1997 – March 1998). This is related to the fact that the long-term warming trend of SST was not removed when calculating the threshold (for details see Section 5).
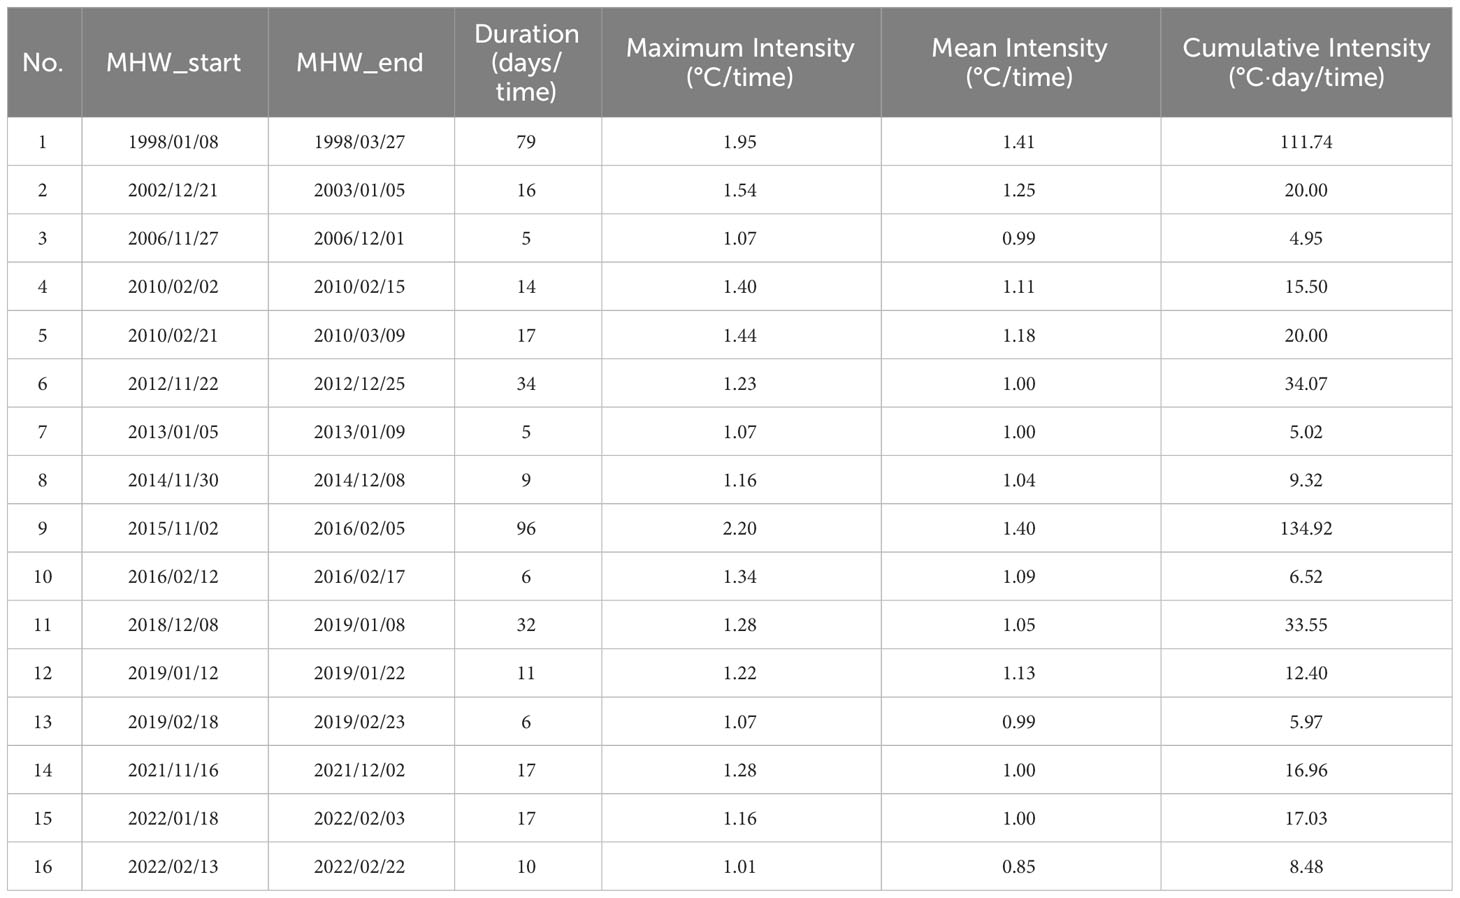
Table 2 Properties of winter MHWs in the Cold Tongue Region of the SCS during 1982−2022.
To investigate the interannual variability of winter MHW events in this region, we conducted a statistical analysis of their characteristics by year (Figure 6). It is found that the frequency of MHWs during winter has increased in recent years, with only one MHW event occurring in the winters of 97/98, 02/03 and 06/07, while two occurred in three winters during 2010−2016. The winters of 18/19 and 21/22 had the highest frequency, with three MHW events occurring in each winter. In contrast to the frequency, the mean (maximum) intensity of winter MHWs in this region shows no clear trend, with the average value of 1.09°C/time (1.34°C/time). The intensity of winter MHWs exhibits significant interannual variability. Specifically, the winter MHW event in 97/98 and the first MHW event in 15/16 exhibited the highest intensity, with the mean (maximum) intensity of 1.41°C/time and 1.40°C/time (1.95°C/time and 2.20°C/time), respectively. Excluding these two strongest MHW events, the average value of the mean (maximum) intensity is 1.05°C/time (1.23°C/time). The average duration and cumulative intensity of winter MHWs are 23.4 days/time and 28.53°C·day/time, respectively. The winter MHW event in 97/98 and the first MHW event in 15/16 significantly exceed other events, with the duration of 79 days/time and 96 days/time, respectively, and the cumulative intensity of 111.74°C·day/time and 134.92°C·day/time, respectively. Excluding these two events, the average duration and cumulative intensity of winter MHWs in this region are 14.2 days/time and 14.98°C·day/time.
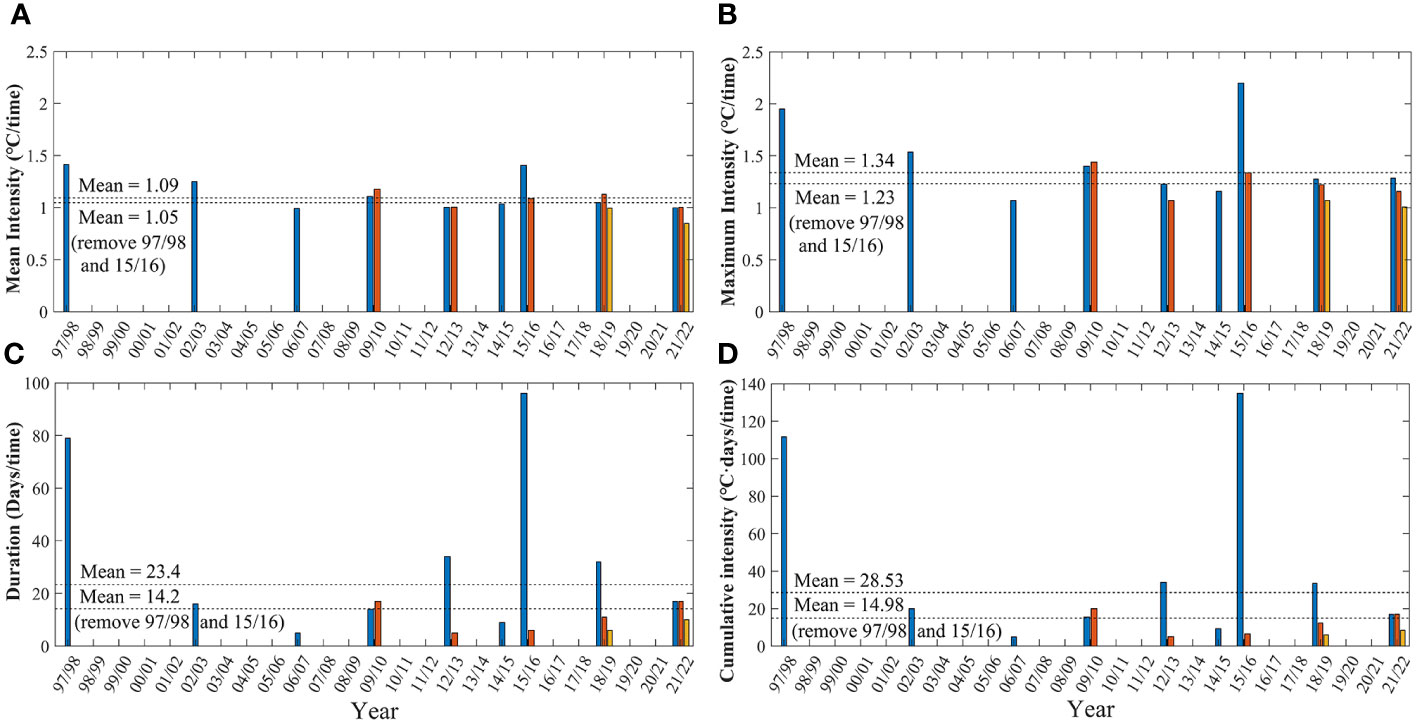
Figure 6 Statistical characteristics of winter MHWs in the cold tongue region of the SCS during 1982−2022: (A) mean intensity (units: °C/time), (B) maximum intensity (units: °C/time), (C) duration (units: days/time) and (D) cumulative intensity (units: °C·day/time). Different colors in the bar plot represent different MHW events in the same year. Since the absence of MHW events before the winter of 97/98, the horizontal axis begins from the winter of 97/98. More detailed information on the MHWs in the winter cold tongue of SCS can be seen in Table 1.
Since the intensity and duration of the MHW events in the winters of 97/98 and 15/16 (first event) are significantly higher, the characteristics of these two extreme MHW events are further analyzed in comparison with others (Figure 7). It is evident that all four characteristic indices of these two extreme events surpass those of others: the mean (maximum) intensity of the extreme events in the winters of 97/98 and 15/16 (first event) is 0.36°C and 0.35°C (0.71°C and 0.97°C) higher than that of other events, representing an increase of 34% and 33% (58% and 78%), respectively. The duration of these extreme events increases by 64.8 and 81.8 days, which are 4.6 and 5.8 times longer than other events. The cumulative intensity also strengthens by 96.76°C·day and 119.94°C·day, being 6.5 and 8.0 times higher than other events. Therefore, the two extreme MHW events in the winters of 97/98 and 15/16 (first event) are selected as representative events for further analysis.
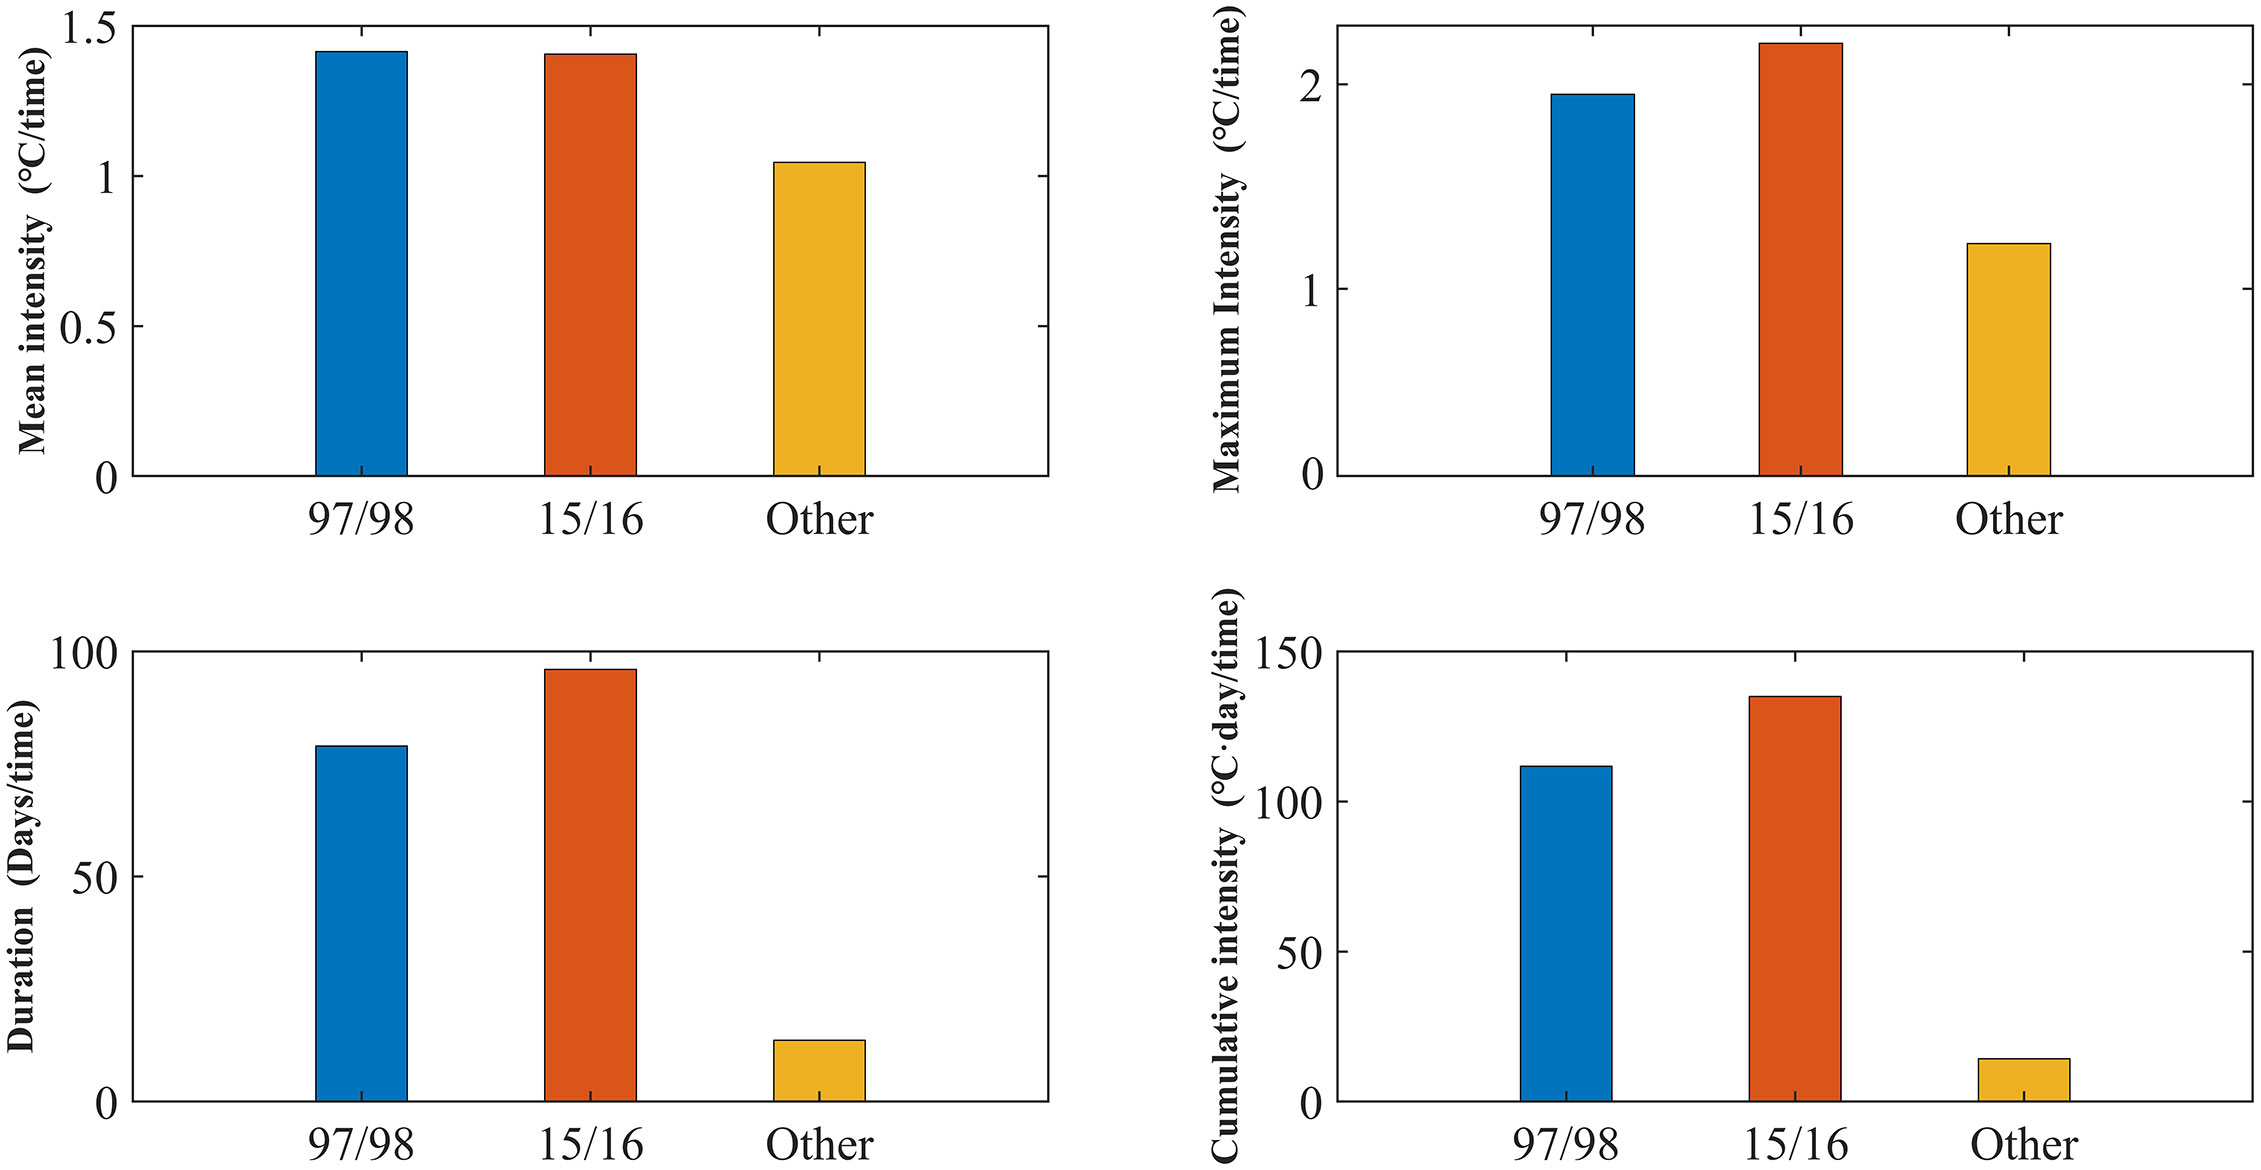
Figure 7 Comparison of the characteristic indices between two extreme MHW events in the winters of 97/98 and 15/16 (first event) and other events in the winter cold tongue region in the SCS during 1982−2022: mean intensity (units: °C/time), maximum intensity (units: °C/time), duration (units: days/time), and cumulative intensity (units: °C·day/time).
Figure 8 shows the SST anomalies (SSTA) during the extreme MHW in the winter of 97/98. It can be seen that the SST exhibited a positive anomaly of more than 1°C in late December 1997 near (109°E, 7°N), forming the MHW. The MHW initially appeared at the frontal zone. As the MHW developed, in mid to late January 1998, MHW occupied almost the entire cold tongue region, with the maximum SSTA appearing at the frontal zone, which could exceed +2.5°C. In early to mid-February, the intensity of the MHW slightly weakened, but increased again towards the end of the month, with the maximum SSTA appearing in the southeast coast of Vietnam, surpassing +2.5°C. In March, the MHW weakened, until it practically dissipated in April.
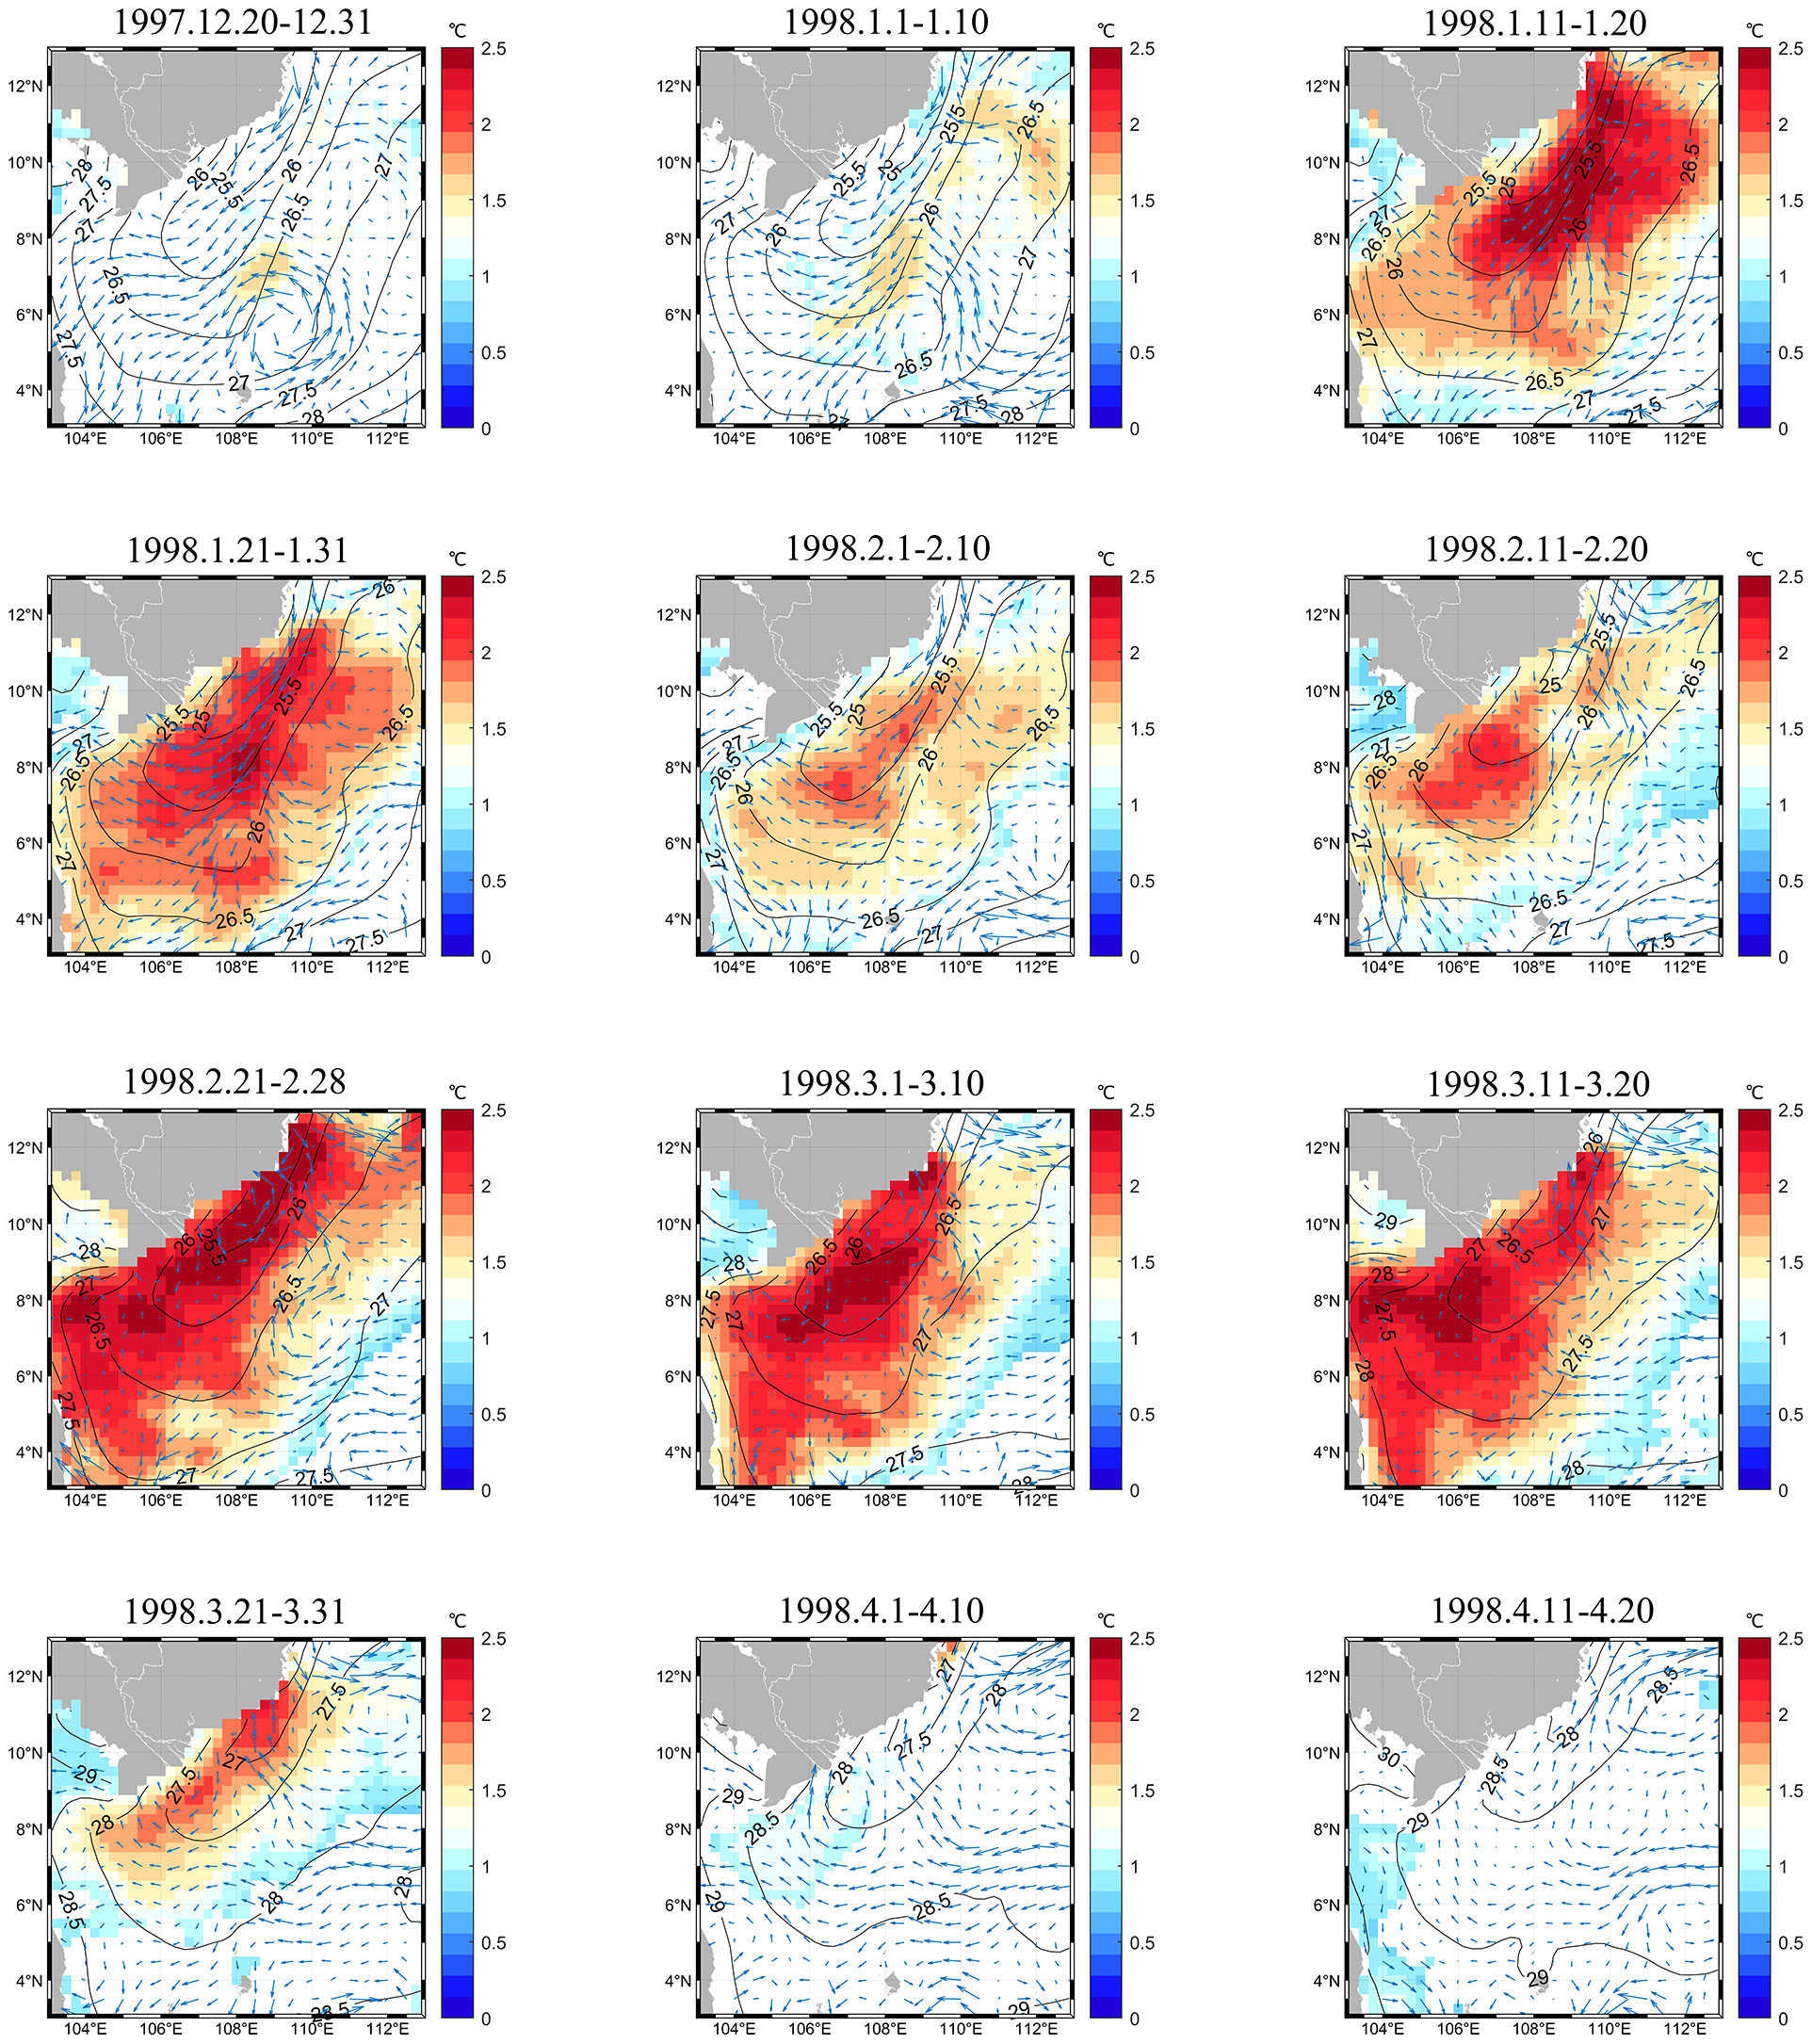
Figure 8 Variation of SSTA in the winter cold tongue region of the SCS during the period 1997.12.20−1998.4.20. Colors represent SSTA exceeding the MHW threshold, while contour lines represent the climatology of SST. The blue arrows represent the ocean current fields, utilizing data from OSCAR Surface Currents.
The extreme MHW event in the winter of 15/16 started in early November 2015 (Figure 9). Similar to the pattern observed in 97/98, the MHW also appeared first at the frontal zone, followed by a continuous expansion in spatial coverage and an increase of intensity. In mid-December, the MHW covered almost the entire cold tongue region, with an intensity surpassing +1.5°C. In mid to late January, the MHW reached its strongest point, with the maximum SSTA appearing at the center of the cold tongue region, exceeding +2.5°C. In February, the MHW gradually weakened until it dissipated.
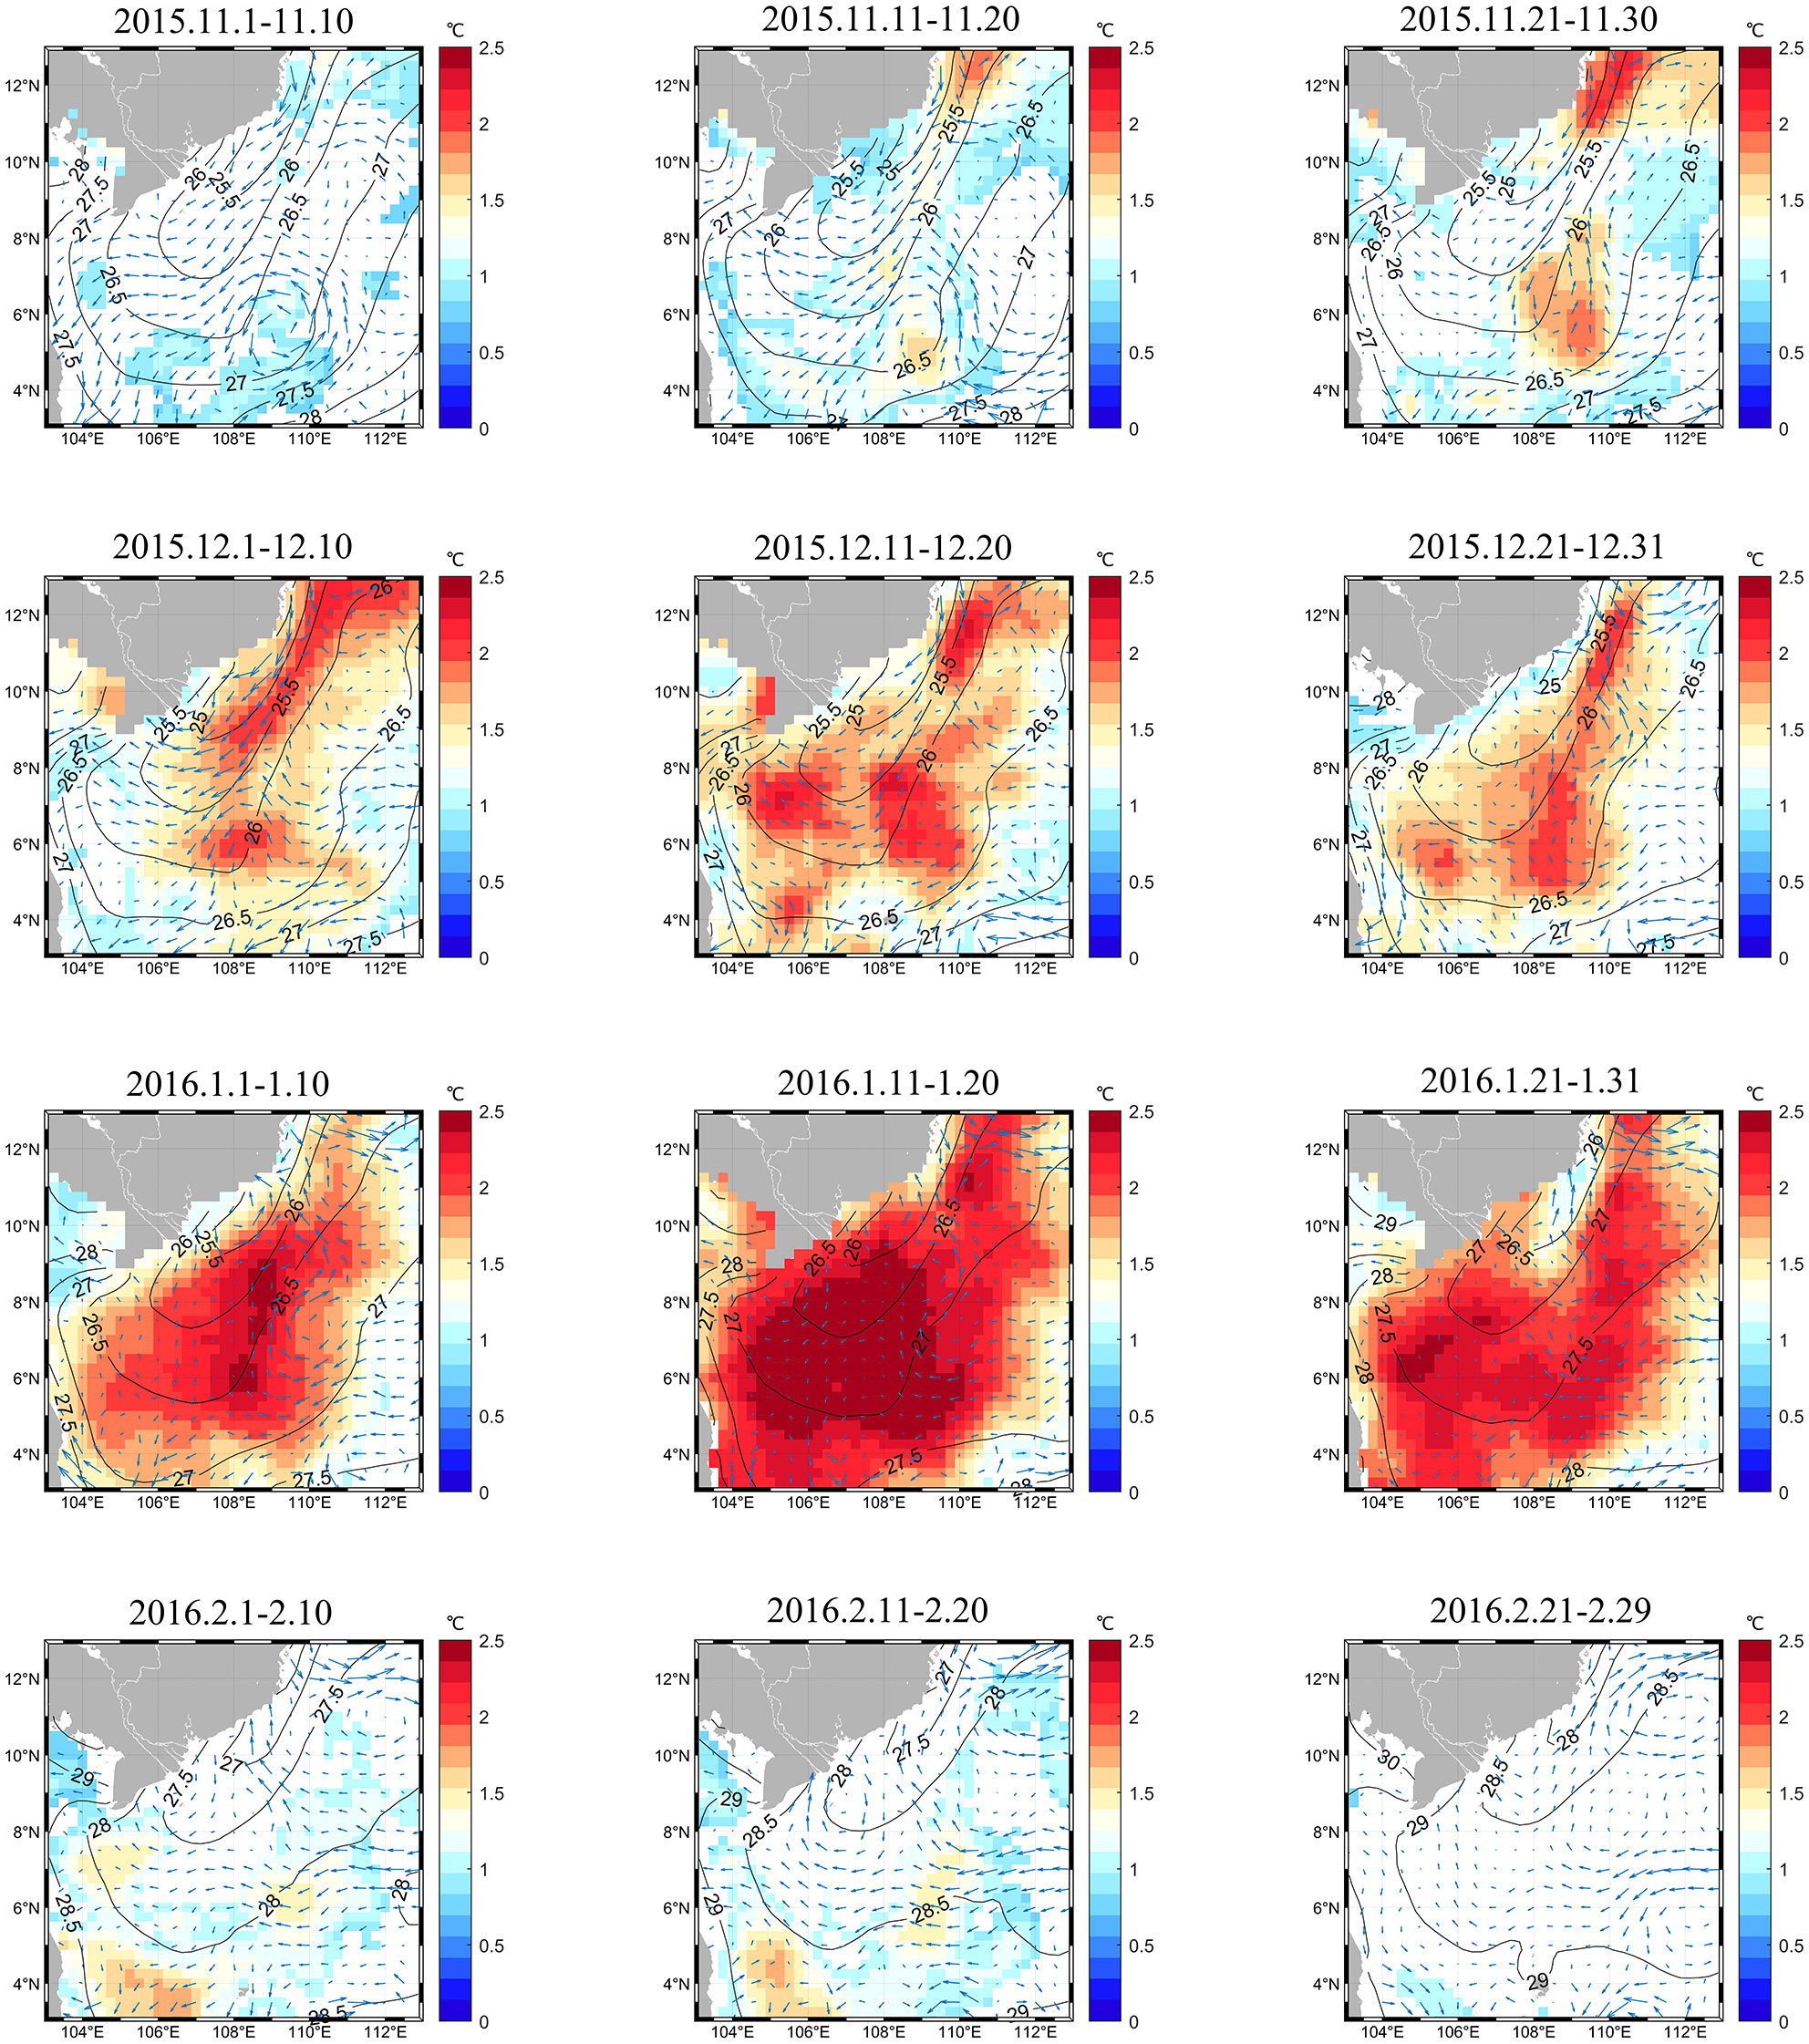
Figure 9 Variation of SSTA in the winter cold tongue region of the SCS during the period 2015.11.1−2016.2.29. Colors represent SSTA exceeding the MHW threshold, while contour lines represent the climatology of SST. The blue arrows represent the ocean current fields, utilizing data from OSCAR Surface Currents.
4 Mechanism analysis of extreme MHW events in the winter cold tongue region of the SCS
4.1 Comparison of OISST and OFES Data
To explore the occurrence and maintenance mechanisms of the extreme MHWs during 97/98 and 15/16, we calculated the MLT equation using the OFES data. We first evaluated the performance of OFES SSTA data in simulating the two MHW events. Figure 10 shows the comparison of SSTA between OFES model data and OISST data during MHW events. For simplicity, only the cumulative SSTA during the strongest MHW event in each winter is shown here. It is evident that the OFES is able to reproduce the two extreme MHW events during the winters of 97/98 and 15/16, although it generally underestimates the intensity of MHWs. In comparison to OISST data, OFES data underestimate SSTA by 35% and 30% during these two MHW events, respectively. Figure 11 shows the SSTA time series of OFES and OISST data during the two extreme MHW events. It exhibits consistent trends between the two datasets throughout the two MHW events, with correlation coefficients of 0.92 and 0.94, respectively. This comparison indicates that the OFES data can be used to analyze the mechanism of these two extreme MHW events in winters of 97/98 and 15/16.
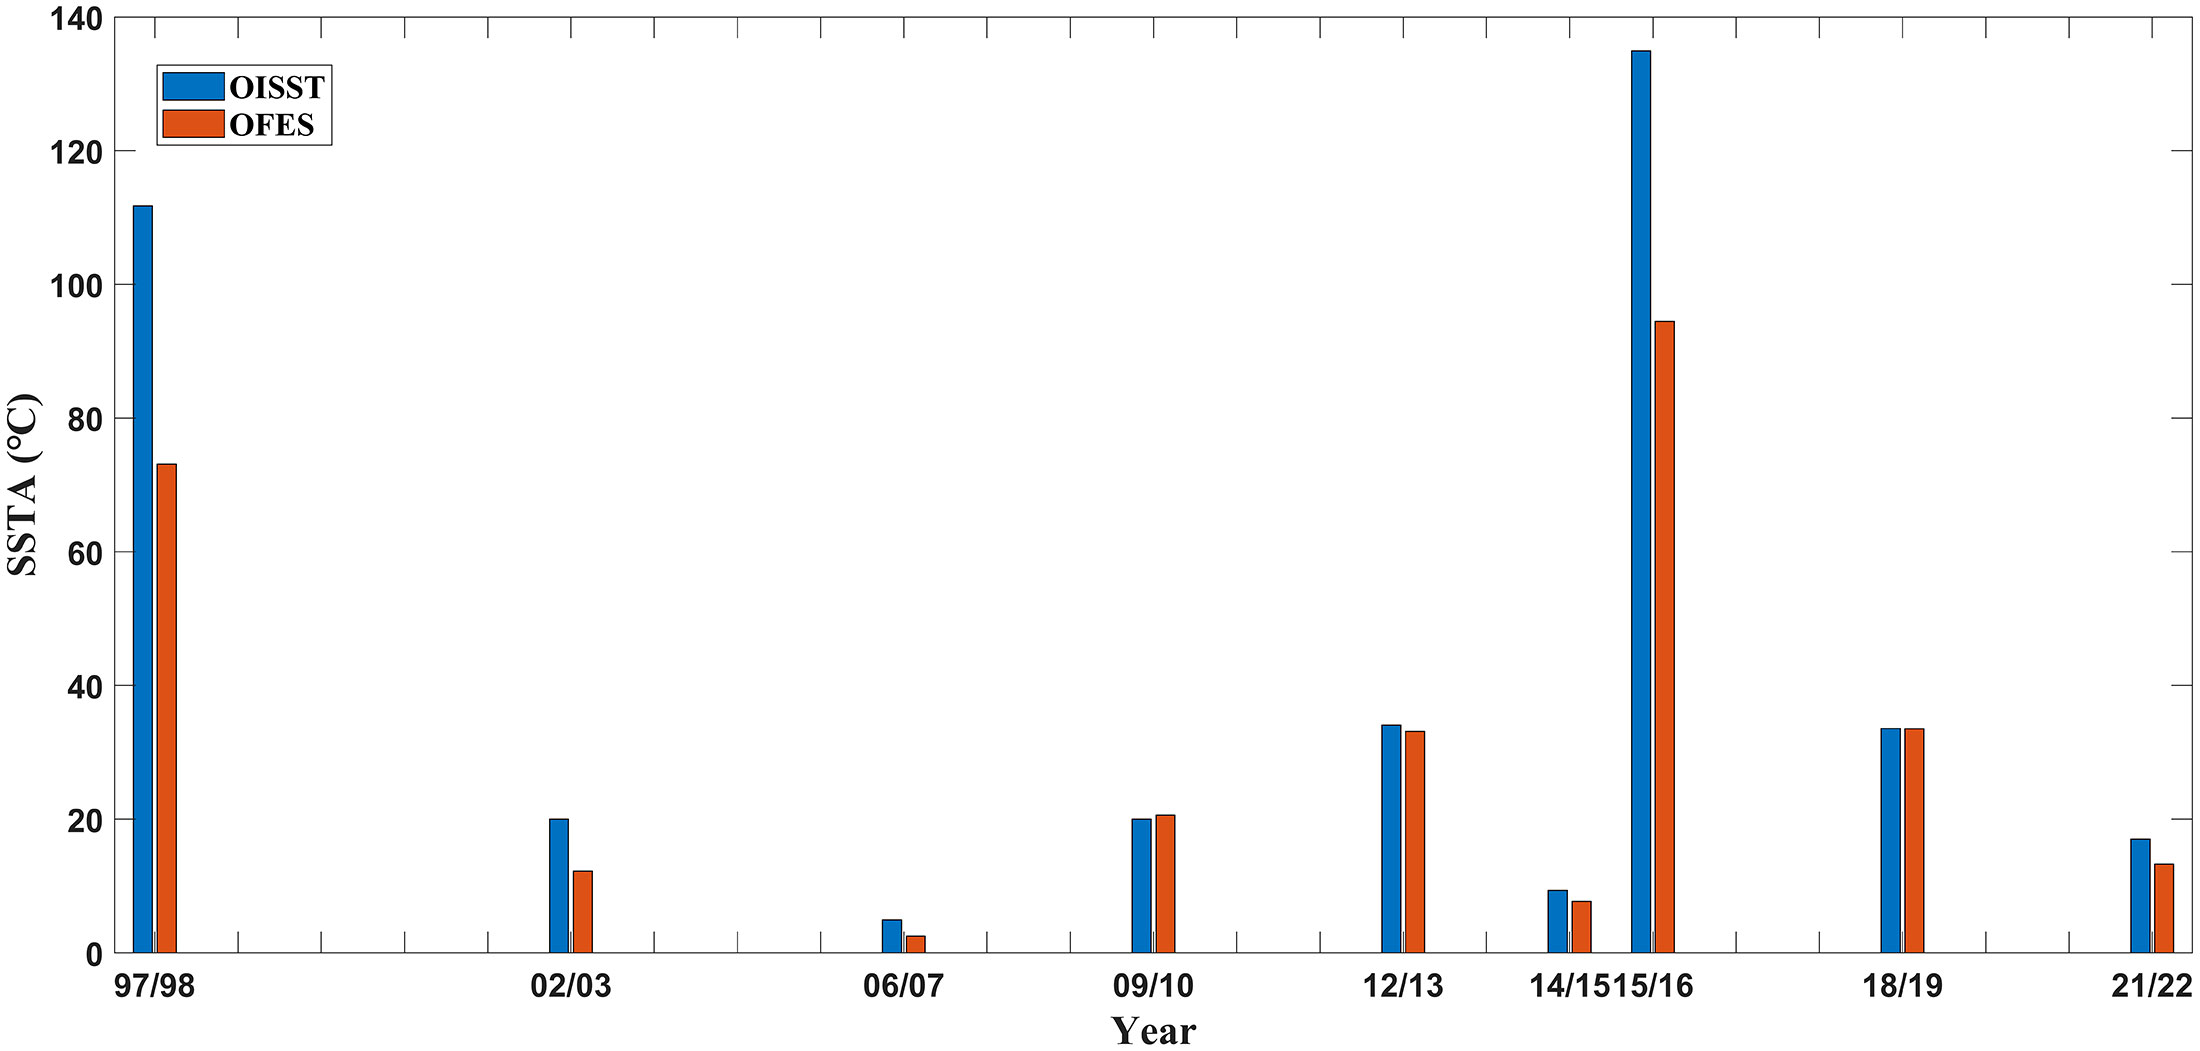
Figure 10 Comparison cumulative of SSTA between OISST and OFES data for winter MHW events in the cold tongue region of SCS during the period 1982−2022. Blue and red bars represent SSTA calculated from OISST and OFES data, respectively. Only the largest MHW event in each winter is shown.
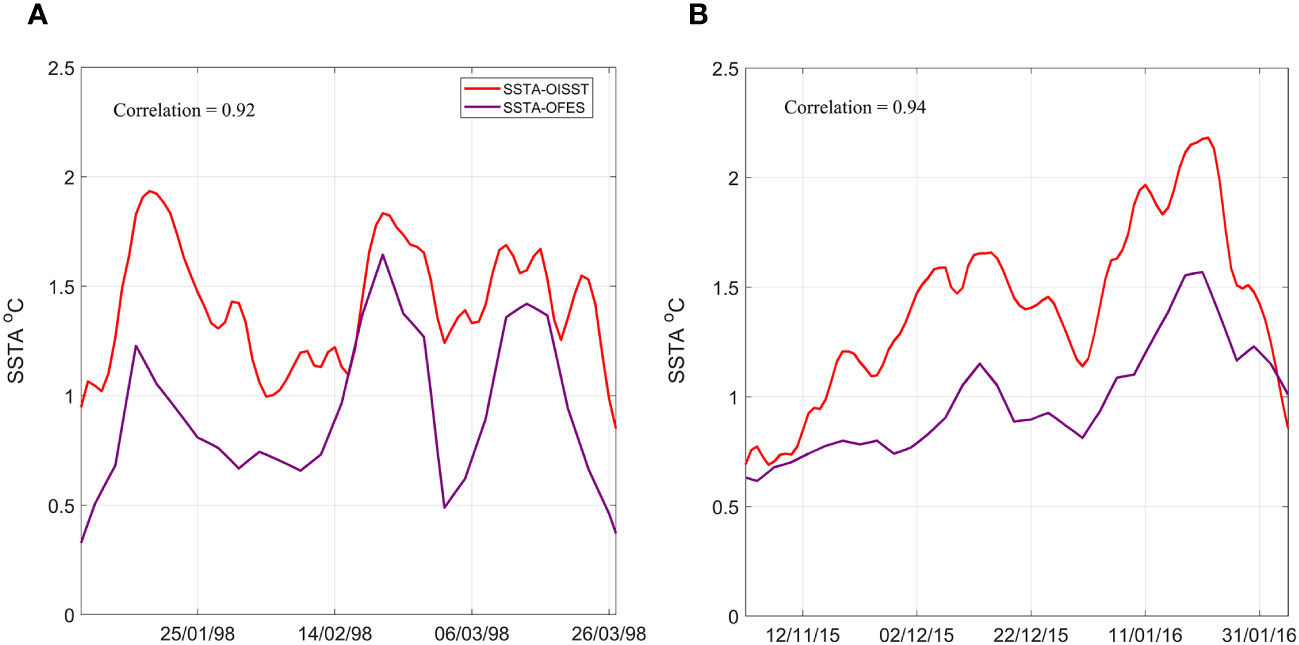
Figure 11 Comparison of SSTA between OISST and OFES data for two extreme MHW events in the cold tongue region of SCS: (A) 1998.1.8−1998.3.27, and (B) 2015.11.2−2016.2.5. Note that a three-day moving average has been applied to the OISST data.
4.2 Mechanisms of the 97/98 and 15/16 extreme MHW events
Figure 12 shows the anomalies of all terms in the MLT equation in the SCS winter cold tongue region during the 97/98 and 15/16 extreme MHW events relative to climatology. Positive anomalies in the MLT tendency term indicate a faster-than-climatology warming or slower-than-climatology cooling. It is obvious that there were three distinct periods of positive anomalies in the MLT tendency term during the 97/98 extreme MHW event (highlighted in red shading in Figure 12A), occurring on 5−16 January, 10−21 February, and 3−11 March in 1998, respectively. The first warming anomaly provided energy for the occurrence of the event, and the two in the latter periods sustained the event. Analysis of the MLT equation indicates that the contribution of the horizontal advection term to the MHW event was relatively small. The positive anomalies in the MLT tendency term during these three periods were mainly attributed to the surface heat flux term, supplemented by a secondary contribution from the vertical entrainment term. On average, over these three periods, the contributions of the surface heat flux term and vertical entrainment term were 62% and 25%, respectively. This result indicates that the extreme and prolonged MHW event in 97/98 was caused by three intermittent anomalies in the atmospheric/oceanic environment, rather than sustained one, which contrasts with our initial assumption. Further work is needed to understand the causes of these intermittent anomalies in the atmospheric/oceanic environment.
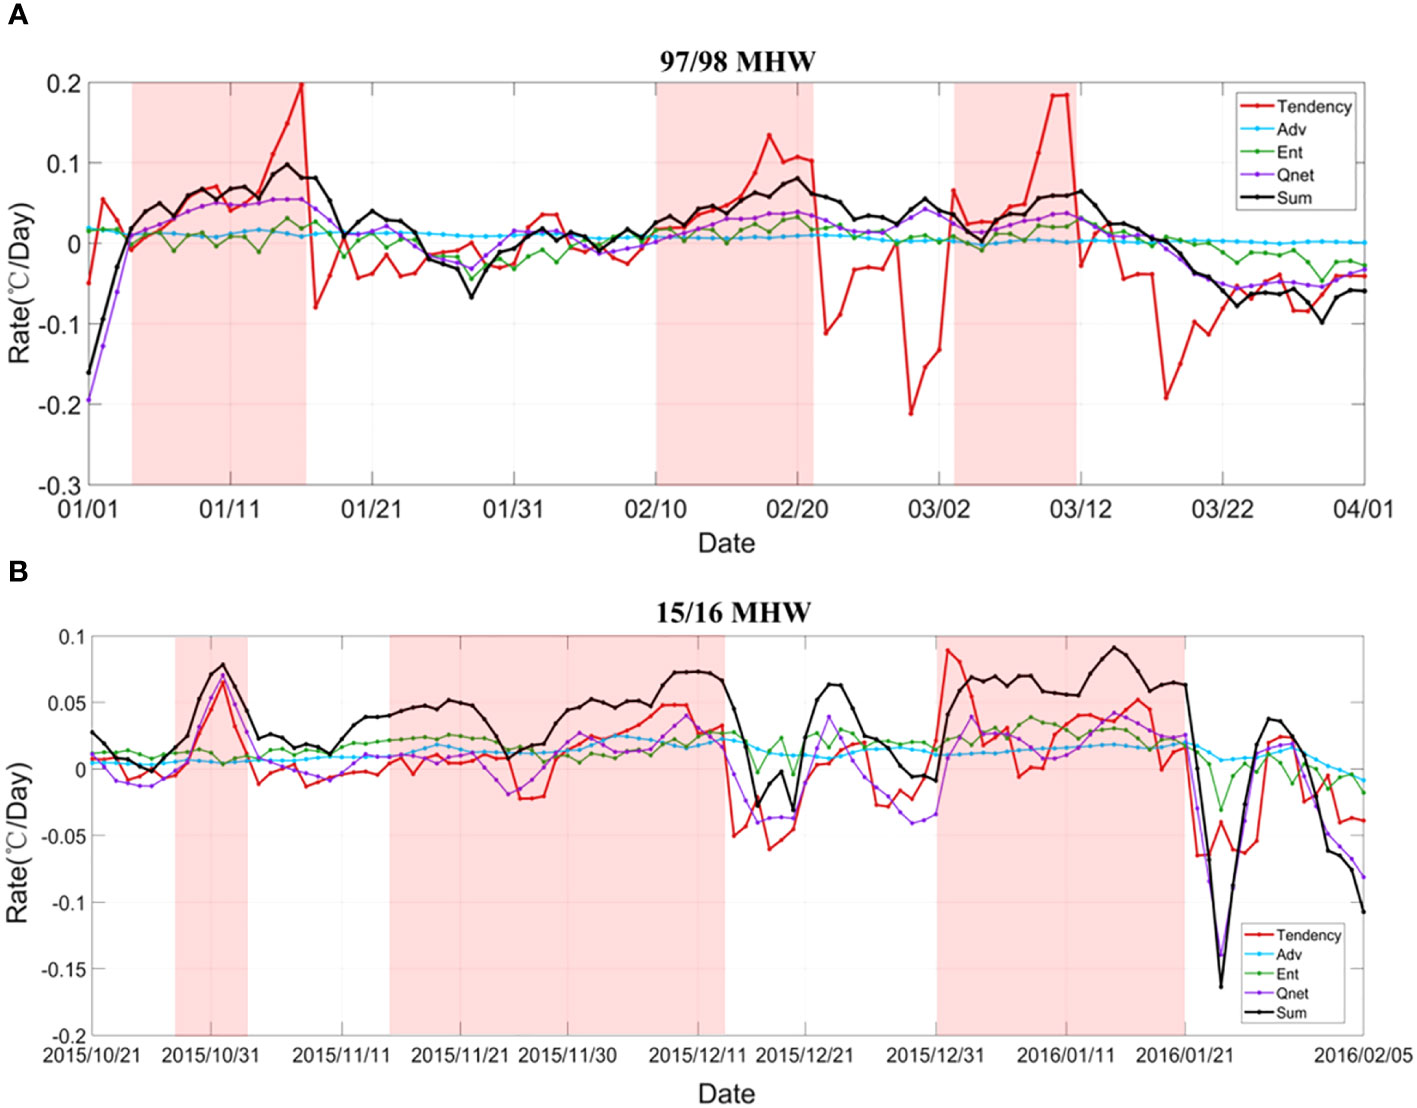
Figure 12 Time series plot of the anomalies of all terms in the MLT equation over the winter cold tongue of the SCS during the period of the (A) 97/98 MHW event (1998.1.8−1998.3.27) and (B) 15/16 MHW event (2015.11.2−2016.2.5): the MLT tendency term (red line), the surface heat flux term (purple line), the horizontal advection term (cyan line), the vertical entrainment term (green line). The black line represents the sum of the surface heat flux, horizontal advection, and vertical entrainment terms. The red shaded areas denote three distinct periods of positive anomalies in the MLT tendency term.
The extreme MHW event in 15/16 was also caused by multiple intermittent anomalies in the atmospheric/oceanic environment (Figure 12B). During the 15/16 MHW event, there ware three distinct periods with positive MLT tendency term anomalies (highlighted in red shading in Figure 12B), occurring during 28 October−3 November, 15 November−13 December, and 31 December−21 January, respectively. The anomalous warming during these periods generated and maintained the extreme event. Analysis of the MLT equation indicates that horizontal advection term, vertical entrainment term, and surface heat flux term all contributed to the 15/16 MHW process. On average for the three periods, the contributions of horizontal advection term, vertical entrainment term, and surface heat flux term were 24%, 33%, and 43%, respectively.
5 Discussion
When identifying MHWs in this study, the long-term warming trend of SST was not removed in calculating the threshold. Consequently, the identified MHWs in the winter cold tongue region of SCS all occur during 97/98 and beyond, and there is an increasing trend in the frequency of MHWs (Table 2; Figure 6). To investigate the impact of the long-term SST variation on MHWs, especially the identification of extreme events, an 11−year running mean threshold was applied to detect MHWs (Zhang et al., 2018; Hörhold et al., 2023). Specifically, the 11−year running mean threshold is calculated by taking the 90th percentile of SST within a running window of 11 years centered on each year, where the window spans five years before and after the target year, and MHWs are detected accordingly. This approach aims to remove the influence of long-term variability in SST. Notably, for the years 1982−1986, the forward running condition cannot be satisfied, so the threshold obtained in 1987 is used for detection. Similarly, for the years 2018−2022, the backward sliding condition cannot be satisfied, so the threshold obtained in 2017 is used for detection (Zhang et al., 2018).
After removing the SST long-term trend, there was no apparent increasing trend in the frequency of MHWs (Figure 13). Before 97/98, MHWs were observed (e.g., in the winters of 82/83, 87/88, and 91/92), and after 09/10, there was a significant decrease in the frequency of MHWs (from 11 events to 2 events in the most recent decade). To emphasize the impact of long-term SST variations on extreme MHW events, the differences in the strongest MHW events in each winter are compared below. It can be seen that the mean intensity of MHWs has shown a certain degree of weakening after 97/98, especially in recent MHW events, such as the events in 15/16 and 18/19, which weakened by 19% and 22%, respectively. In terms of the duration of MHWs, there was an increase before 09/10, followed by a decrease for subsequent events. For example, the extreme MHW event exhibited an increase of 13 days in 97/98 but a decrease of 13 days in 15/16. However, MHWs in 97/98 and 15/16 still had the longest durations. Under the combined influence of intensity and duration, the cumulative intensity of MHWs remained the highest in 97/98 and 15/16, but it strengthened by 15% in 97/98 and weakened by 30% in 15/16. The years with stronger MHWs correspond to those with higher SST, and 97/98 and 15/16 are the years characterized by the first two highest SST.
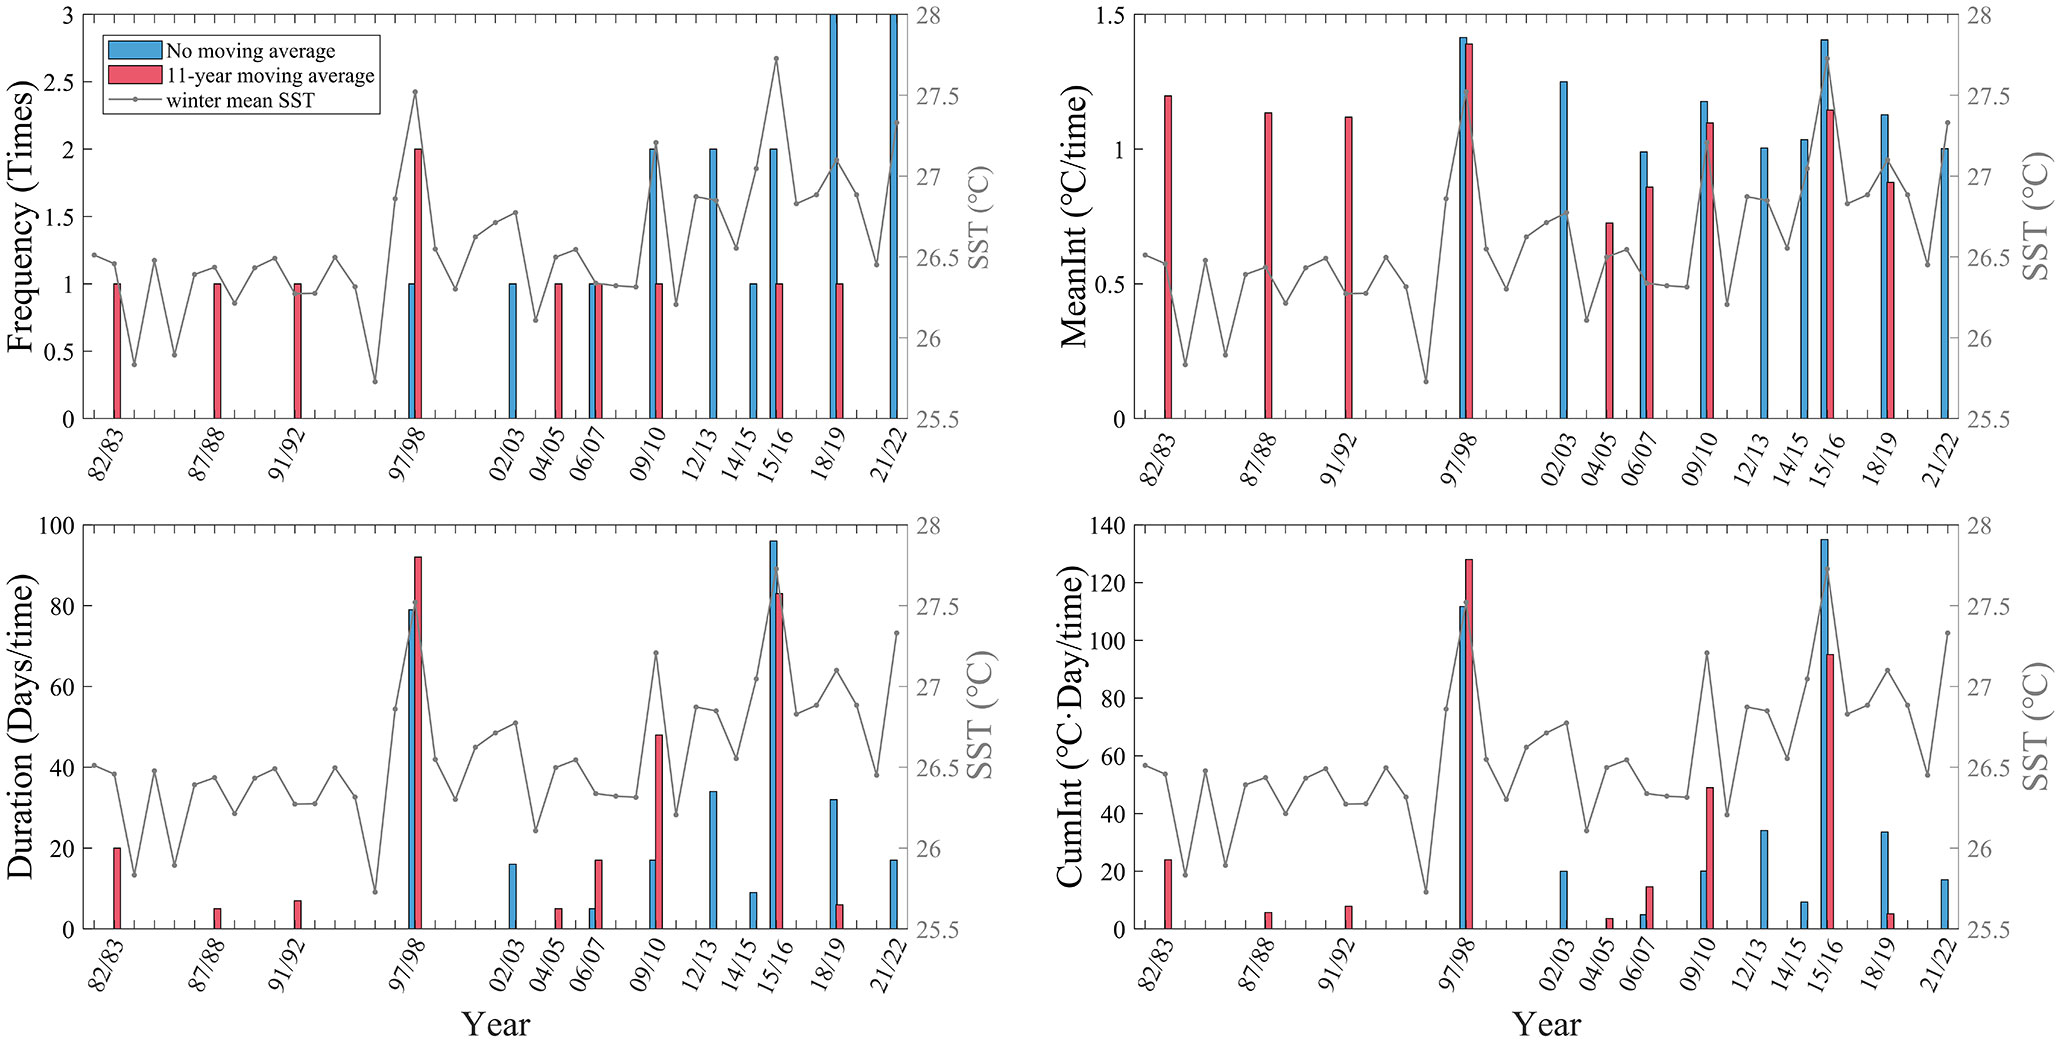
Figure 13 Comparison of the characteristic indices (frequency, mean intensity, duration, and cumulative intensity) of MHW events detected by thresholds without (blue bar) and with (red bar) 11−year running mean in the winter cold tongue region of the SCS during 1982−2022. The metrics of MHWs are calculated by selecting the strongest MHW event in each year. The gray line represents the annual mean SST during each winter.
The two extreme MHW events in winters of 97/98 and 15/16 were associated with El Niño (Liu et al., 2022). During El Niño year, a low-level enhanced anticyclone occurs over the western North Pacific, changing atmospheric forcing and oceanic environment in the SCS and hence generating MHWs. We also checked the years of other MHWs in this region (82/83, 87/88, 91/92, 04/05, 06/07, 09/10, and 18/19), and found them all being El Niño years. In addition to El Niño, they may also be affected by other factors, such as local upwelling and entrainment (Yao and Wang, 2021), the unusual Indian Ocean dipole (Xiao et al., 2020), the inter-basin interaction (Yao and Wang, 2021). Further work is needed on the relative contributions of these factors.
6 Conclusions
In this study, the seasonal characteristics of MHWs in the SCS are briefly analyzed, based on which we focus on the winter cold tongue region, where has the strongest cumulative intensity of the MHWs in the SCS. We systematically investigate MHW events in this region during winter, with special attention paid to the extreme events in the winters of 97/98 and 15/16. The main conclusions are as follows:
1. MHWs in the SCS exhibit distinct seasonal characteristics. In winter, the frequency of MHW events is the lowest (~0.4 times), while the intensity is the highest (the mean and maximum intensity are 1.37°C/time and 1.64°C/time, respectively), the duration is the longest (9.8 days/time), and the cumulative intensity is the highest (14.23°C·day/time). In the winter cold tongue region, MHWs demonstrate the highest cumulative intensity, which can exceed 45°C·day/time, corresponding to the high mean intensity (above 1.5°C/time) and long duration (above 45 days/time) in this region.
2. Significant interannual variations of MHWs are observed in the cold tongue region of the SCS. From 1982 to 2022, a total of 16 MHW events occurred in this region, among which extreme MHW events occurred in the winters of 97/98 and 15/16. The mean (maximum) intensity for these two extreme events was 1.41°C/time and 1.40°C/time (1.95°C/time and 2.20°C/time), respectively, with duration was 79 days/time and 96 days/time, respectively, and cumulative intensity was 111.74°C·day/time and 134.92°C·day/time (6.5 and 8.0 times stronger compared to other MHW events).
3. The analysis of the MLT equation indicates that the extreme MHW event in the winter of 97/98 in the cold tongue region of the SCS was mainly caused by the surface heat flux term, with the vertical entrainment term contributing secondarily. While in the winter of 15/16, the extreme MHW event was caused by a combination of the surface heat flux term, the vertical entrainment term and the horizontal advection term.
Data availability statement
The original contributions presented in the study are included in the article/supplementary material. Further inquiries can be directed to the corresponding author.
Author contributions
LM: Writing – original draft. YWY: Writing – review & editing. LZ: Writing – review & editing. WX: Writing – review & editing. YY: Writing – review & editing. XX: Writing – review & editing.
Funding
The author(s) declare that financial support was received for the research, authorship, and/or publication of this article. This work is supported by the Southern Marine Science and Engineering Guangdong Laboratory (Zhuhai) (SML2023SP219), the Project of State Key Laboratory of Satellite Ocean Environment Dynamics, Second Institute of Oceanography (SOEDZZ2204), the Project of State Key Laboratory of Tropical Oceanography, South China Sea Institute of Oceanology, Chinese Academy of Sciences (LTO2322), the National Key R&D Program of China: Young Scientist Program (2023YFC3108800), and the development fund of South China Sea Institute of Oceanology of the Chinese Academy of Sciences (SCSIO202203).
Conflict of interest
The authors declare that the research was conducted in the absence of any commercial or financial relationships that could be construed as a potential conflict of interest.
Publisher’s note
All claims expressed in this article are solely those of the authors and do not necessarily represent those of their affiliated organizations, or those of the publisher, the editors and the reviewers. Any product that may be evaluated in this article, or claim that may be made by its manufacturer, is not guaranteed or endorsed by the publisher.
References
Benthuysen J. A., Feng M., Zhong L. (2014). Spatial Patterns of Warming off Western Australia during the 2011 Ningaloo Niño: Quantifying Impacts of Remote and Local Forcing. Cont. Shelf Res. 91, 232–246. doi: 10.1016/j.csr.2014.09.014
Benthuysen J. A., Oliver E. C. J., Feng M., Marshall A. G. (2018). Extreme marine warming across tropical Australia during austral summer 2015–2016. J. Geophys. Res. 123, 1301–1326. doi: 10.1002/2017JC013326
Cai R., Tan H., Qi Q. (2016). Impacts of and adaptation to inter-decadal marine climate change in coastal China seas. Int. J. Climatol. 36, 3770–3780. doi: 10.1002/joc.4591
Caputi N., Kangas M., Denham A., Feng M., Pearce A., Hetzel Y., et al. (2016). Management adaptation of invertebrate fisheries to an extreme marine heat wave event at a global warming hot spot. Ecol. Evol. 6, 3583–3593. doi: 10.1002/ece3.2137
Chen K., Gawarkiewicz G., Lentz S., Bane J. (2014). Diagnosing the warming of the Northeastern U.S. Coastal Ocean in 2012: A linkage between the atmospheric jet stream variability and ocean response. J. Geophys. Res. 119, 218–227. doi: 10.1002/2013JC009393
Cheng Y., Zhang M., Song Z., Wang G., Zhao C., Shu Q., et al. (2023). A quantitative analysis of marine heatwaves in response to rising sea surface temperature. Sci. Total Environ. 881, 163396. doi: 10.1016/j.scitotenv.2023.163396
De Deckker P. (2016). The indo-pacific warm pool: critical to world oceanography and world climate. Geosci. Lett. 3, 20. doi: 10.1186/s40562-016-0054-3
Dong T., Liu F., Dong W., Zhu X., Hu S., Yao Y., et al. (2023). Double intensification centers of summer marine heatwaves in the South China Sea associated with global warming. Res. Sq. doi: 10.21203/rs.3.rs-2536963/v1
Eakin C. M., Morgan J. A., Heron S. F., Smith T. B., Liu G., Alvarez-Filip L., et al. (2010). Caribbean corals in crisis: record thermal stress, bleaching, and mortality in 2005. PloS One 5, e13969. doi: 10.1371/journal.pone.0013969
Feng Y., Bethel B., Dong C., Zhao H., Yao Y., Yu Y. (2022). Marine heatwave events near Weizhou Island, Beibu Gulf in 2020 and their possible relations to coral bleaching. Sci. Total Environ. 823, 153414. doi: 10.1016/j.scitotenv.2022.153414
Frölicher T. L., Fischer E. M., Gruber N. (2018). Marine heatwaves under global warming. Nature 560, 360–364. doi: 10.1038/s41586-018-0383-9
Frölicher T. L., Laufkötter C. (2018). Emerging risks from marine heat waves. Nat. Commun. 9, 650. doi: 10.1038/s41467-018-03163-6
Gao G., Marin M., Feng M., Yin B., Yang D., Feng X., et al. (2020). Drivers of marine heatwaves in the East China Sea and the South Yellow Sea in three consecutive summers during 2016–2018. J. Geophys. Res. 125, e2020JC016518. doi: 10.1029/2020JC016518
He W., Zeng X., Deng L., Pi Q., Zhao J. (2023). Enhanced impact of prolonged MHWs on satellite-observed chlorophyll in the South China Sea. Prog. Oceanogr. 218, 103123. doi: 10.1016/j.pocean.2023.103123
Hobday A. J., Alexander L. V., Perkins S. E., Smale D. A., Straub S. C., Oliver E. C. J., et al. (2016). A hierarchical approach to defining marine heatwaves. Prog. Oceanogr. 141, 227–238. doi: 10.1016/j.pocean.2015.12.014
Holbrook N. J., Scannell H. A., Sen Gupta A., Benthuysen J. A., Feng M., Oliver E. C. J., et al. (2019). A global assessment of marine heatwaves and their drivers. Nat. Commun. 10, 2624. doi: 10.1038/s41467-019-10206-z
Holbrook N. J., Sen Gupta A., Oliver E. C. J., Hobday A. J., Benthuysen J. A., Scannell H. A., et al. (2020). Keeping pace with marine heatwaves. Nat. Rev. Earth Environ. 1, 482–493. doi: 10.1038/s43017-020-0068-4
Hörhold M., Münch T., Weißbach S., Kipfstuhl S., Freitag J., Sasgen I., et al. (2023). Modern temperatures in central–north Greenland warmest in past millennium. Nature 613, 503–507. doi: 10.1038/s41586-022-05517-z
Hu S., Li S. (2022). Progress and prospect of marine heatwave study. Adv. Earth Sci. (in Chinese) 37, 51–64. doi: 10.11867/j.issn.1001-8166.2021.121
Hu S., Li S., Zhang Y., Guan C., Du Y., Feng M., et al. (2021). Observed strong subsurface marine heatwaves in the tropical Western Pacific Ocean. Environ. Res. Lett. 16, 104024. doi: 10.1088/1748-9326/ac26f2
Huang B., Liu C., Banzon V., Freeman E., Graham G., Hankins B., et al. (2021). Improvements of the daily optimum interpolation sea surface temperature (DOISST) version 2.1. J. Clim. 34, 2923–2939. doi: 10.1175/JCLI-D-20-0166.1
Hughes T. P., Kerry J. T., Álvarez-Noriega M., Álvarez-Romero J. G., Anderson K. D., Baird A. H., et al. (2017). Global warming and recurrent mass bleaching of corals. Nat. 543, 373–377. doi: 10.1038/nature21707
Jacox M. G., Alexander M. A., Bograd S. J., Scott J. D. (2020). Thermal displacement by marine heatwaves. Nature 584, 82–86. doi: 10.1038/s41586-020-2534-z
Joyce P. W. S., Tong C. B., Yip Y. L., Falkenberg L. J. (2024). Marine heatwaves as drivers of biological and ecological change: implications of current research patterns and future opportunities. Mar. Biol. 171, 1–13. doi: 10.1007/s00227-023-04340-y
Kataoka T., Tozuka T., Yamagata T. (2017). Generation and decay mechanisms of Ningaloo Niño/Niña. J. Geophys. Res. 122, 8913–8932. doi: 10.1002/2017JC012966
Kuroda H., Setou T. (2021). Extensive marine heatwaves at the sea surface in the Northwestern Pacific Ocean in summer 2021. Remote Sens. 13, 3989. doi: 10.3390/rs13193989
Li X., Donner S. D. (2022). Lengthening of warm periods increased the intensity of warm-season marine heatwaves over the past 4 decades. Clim. Dyn. 59, 2643–2654. doi: 10.1007/s00382-022-06227-y
Li Z., Holbrook N. J., Zhang X., Oliver E. C. J., Cougnon E. A. (2020). Remote forcing of Tasman Sea marine heatwaves. J. Climatol. 33, 5337–5354. doi: 10.1175/JCLI-D-19-0641.1
Li Y., Ren G., Wang Q., You Q. (2019). More extreme marine heatwaves in the China Seas during the global warming hiatus. Environ. Res. Lett. 14, 104010. doi: 10.1088/1748-9326/ab28bc
Li S., Yu K., Chen T., Shi Q., Zhang H. (2011). Assessment of coral bleaching using symbiotic zooxanthellae density and satellite remote sensing data in the Nansha Islands, South China Sea. Chin. Sci. Bull. 56, 1031–1037. doi: 10.1007/s11434-011-4390-6
Liang K., Qiu Y., Zhou X., Teng H., Lin X., He Y.. (2023). Multi-scale variations of marine heatwaves and its mechanisms. Sci. Geo. Sin. (in Chinese) 43, 719–725. doi: 10.13249/j.cnki.sgs.2023.04.015
Liu Q., Jiang X., Xie S., Liu W. (2004). A gap in the Indo-Pacific warm pool over the South China Sea in boreal winter: Seasonal development and interannual variability. J. Geophys. Res. 109, C07012. doi: 10.1029/2003JC002179
Liu K., Xu K., Zhu C., Liu B. (2022). Diversity of marine heatwaves in the South China Sea regulated by ENSO. J. Climate 35, 877–893. doi: 10.1175/JCLI-D-21-0309.1
Liu Z., Yang H., Liu Q. (2001). Regional dynamics of seasonal variability in the South China Sea. J. Phys. Oceanogr. 31, 272–284. doi: 10.1175/1520-0485(2001)031<0272:RDOSVI>2.0.CO;2
Marin M., Feng M., Phillips H. E., Bindoff N. L. (2021). A global, multiproduct analysis of coastal marine heatwaves: distribution, characteristics, and long-term trends. J. Geophys. Res. Oceans 126, e2020JC016708. doi: 10.1029/2020JC016708
Masanja F., Yang K., Xu Y., He G., Liu X., Xu X., et al. (2023). Impacts of marine heat extremes on bivalves. Front. Mar. Sci. 10. doi: 10.3389/fmars.2023.1159261
Mavrakis A. F., Tsiros I. X. (2019). The abrupt increase in the Aegean Sea surface temperature during the June 2007 southeast Mediterranean heatwave - A marine heatwave event? Weather 74, 201–207. doi: 10.1002/wea.3296
Mills K., Pershing A., Brown C., Chen Y., Chiang F., Holland D., et al. (2013). Fisheries management in a changing climate: lessons from the 2012 ocean heat wave in the Northwest Atlantic. Oceanography 26, 191–195. doi: 10.5670/oceanog.2013.27
Moisan J. R., Niiler P. P. (1998). The seasonal heat budget of the North Pacific: net heat flux and heat storage rates, (1950–1990). J. Phys. Oceanogr. 28, 401–421. doi: 10.1175/1520-0485(1998)028%3C0401:TSHBOT%3E2.0.CO;2
Oh H., Kim G. E., Kim Y. S., Park J., Jang C. J., Min Y., et al. (2023). Classification and causes of East Asian marine heatwaves during boreal summer. J. Climate 36, 1435–1449. doi: 10.1175/JCLI-D-22-0369.1
Olita A., Sorgente R., Natale S., Gaberšek S., Ribotti A., Bonanno A., et al. (2007). Effects of the 2003 European heatwave on the Central Mediterranean Sea: surface fluxes and the dynamical response. Ocean Sci. 3, 273–289. doi: 10.5194/os-3-273-2007
Oliver E. C. J., Benthuysen J. A., Bindoff N. L., Hobday A. J., Holbrook N. J., Mundy C. N., et al. (2017). The unprecedented 2015/16 Tasman Sea marine heatwave. Nat. Commun. 8, 16101. doi: 10.1038/ncomms16101
Oliver E. C. J., Benthuysen J. A., Darmaraki S., Donat M. G., Hobday A. J., Holbrook N. J., et al. (2021). Marine heatwaves. Ann. Rev. Mar. Sci. 13, 313–342. doi: 10.1146/annurev-marine-032720-095144
Oliver E. C. J., Donat M. G., Burrows M. T., Moore P. J., Smale D. A., Alexander L. V., et al. (2018). Longer and more frequent marine heatwaves over the past century. Nat. Commun. 9, 1324. doi: 10.1038/s41467-018-03732-9
Pastor F., Khodayar S. (2023). Marine heat waves: Characterizing a major climate impact in the Mediterranean. Sci. Total Environ. 861, 160621. doi: 10.1016/j.scitotenv.2022.160621
Quan Q., Xue H., Qin H., Zeng X., Peng S. (2016). Features and variability of the South China Sea western boundary current from 1992 to 2011. Ocean Dyn. 66, 795–810. doi: 10.1007/s10236-016-0951-1
Reynolds R., Smith T., Liu C., Chelton D., Casey K., Schlax M. (2007). Daily high-resolution-blended analyses for sea surface temperature. J. Climate 20, 5473–5496. doi: 10.1175/2007JCLI1824.1
Sasaki H., Nonaka M., Masumoto Y., Sasai Y., Uehara H., Sakuma H. (2008). “An eddy-resolving hindcast simulation of the quasiglobal ocean from 1950 to 2003 on the Earth simulator,” in High Resolution Numerical Modelling of the Atmosphere and Ocean. Eds. Hamilton K., Ohfuchi W. (Springer New York, New York, NY), 157–185. doi: 10.1007/978-0-387-49791-4_10
Shaw P., Chao S. (1994). Surface circulation in the South China Sea. Deep Sea Res. Part I: Oceanographic Res. Pap. 41, 1663–1683. doi: 10.1016/0967-0637(94)90067-1
Smale D. A., Wernberg T., Oliver E. C. J., Thomsen M., Harvey B. P., Straub S. C., et al. (2019). Marine heatwaves threaten global biodiversity and the provision of ecosystem services. Nat. Clim. Change 9, 306–312. doi: 10.1038/s41558-019-0412-1
Smith K. E., Burrows M. T., Hobday A. J., King N. G., Moore P. J., Sen Gupta A., et al. (2023). Biological impacts of marine heatwaves. Annu. Rev. Mar. Sci. 15, 119–145. doi: 10.1146/annurev-marine-032122-121437
Smith K. E., Burrows M. T., Hobday A. J., Sen Gupta A., Moore P. J., Thomsen M., et al. (2021). Socioeconomic impacts of marine heatwaves: Global issues and opportunities. Sci. 374, eabj3593. doi: 10.1126/science.abj3593
Tan H., Cai R. (2018). What caused the record-breaking warming in East China Seas during August 2016? Atmos. Sci. Lett. 19, e853. doi: 10.1002/asl.853
Tan H., Cai R., Wu R. (2022). Summer marine heatwaves in the South China Sea: trend, variability and possible causes. Adv. Clim. Change Res. 13, 323–332. doi: 10.1016/j.accre.2022.04.003
Wang P., Li Q. eds. (2009). The South China Sea. Dordrecht: Springer Netherlands. doi: 10.1007/978-1-4020-9745-4
Wang D., Liu Q., Xie Q., He Z., Zhuang W., Shu Y., et al. (2013). Progress of regional oceanography study associated with western boundary current in the South China Sea. Chin. Sci. Bull. 58, 1205–1215. doi: 10.1007/s11434-012-5663-4
Wang Y., Zeng J., Wei Z., Li S., Tian S., Yang F., et al. (2022a). Classifications and characteristics of marine heatwaves in the Northern South China Sea. Front. Mar. Sci. 9. doi: 10.3389/fmars.2022.826810
Wang Y., Zhang C., Tian S., Chen Q., Li S., Zeng J., et al. (2023). Seasonal cycle of marine heatwaves in the northern South China Sea. Clim. Dyn. 61, 3367–3377. doi: 10.1007/s00382-023-06747-1
Wang Q., Zhang B., Zeng L., He Y., Wu Z., Ju C. (2022b). Properties and drivers of marine heat waves in the Northern South China Sea. J. Phys. Oceanogr. 52, 917–927. doi: 10.1175/JPO-D-21-0236.1
Wernberg T., Bennett S., Babcock R. C., de Bettignies T., Cure K., Depczynski M., et al. (2016). Climate-driven regime shift of a temperate marine ecosystem. Sci. 353, 169–172. doi: 10.1126/science.aad8745
Xiao F., Wang D., Leung M. Y. T. (2020). Early and extreme warming in the South China Sea during 2015/2016: role of an unusual Indian Ocean dipole event. Geophys. Res. Lett. 47, e2020GL089936. doi: 10.1029/2020GL089936
Yan Y., Chai F., Xue H., Wang G. (2020). Record-breaking sea surface temperatures in the Yellow and East China Seas. J. Geophys. Res. 125, e2019JC015883. doi: 10.1029/2019jc015883
Yan Y., Wang G., Xue H., Chai F. (2019). Buoyancy effect on the winter South China Sea Western boundary current. J. Geophys. Res. 124, 6871–6885. doi: 10.1029/2019JC015079
Yang Y., Li Q., Song Z., Sun W., Dong W. (2022a). A comparison of global surface temperature variability, extremes and warming trend using reanalysis datasets and CMST-Interim. Int. J. Climatol. 42, 5609–5628. doi: 10.1002/joc.7551
Yang Y., Sun W., Yang J., Lim Kam Sian K. T. C., Ji J., Dong C. (2022). Analysis and prediction of marine heatwaves in the Western North Pacific and Chinese coastal region. Front. Mar. Sci. 9. doi: 10.3389/fmars.2022.1048557
Yao Y., Wang C. (2021). Variations in summer marine heatwaves in the South China Sea. J. Geophys. Res. 126, e2021JC017792. doi: 10.1029/2021JC017792
Yao Y., Wang C., Fu Y. (2022). Global marine heatwaves and cold-spells in present climate to future projections. Earth’s Future 10, e2022EF002787. doi: 10.1029/2022EF002787
Yao Y., Wang J., Yin J., Zou X. (2020b). Marine heatwaves in China’s marginal seas and adjacent offshore waters: past, present, and future. J. Geophys. Res. 125, e2019JC015801. doi: 10.1029/2019JC015801
Zhang L., Han W., Sienz F. (2018). Unraveling causes for the changing behavior of the tropical Indian ocean in the past few decades. J. Clim. 31, 2377–2388. doi: 10.1175/JCLI-D-17-0445.1
Zhao Z., Marin M. (2019). A MATLAB toolbox to detect and analyze marine heatwaves. J. Open Source Software 4, 1124. doi: 10.21105/joss.01124
Zhao R., Zhu X. (2016). Weakest winter South China Sea western boundary current caused by the 2015–2016 El Niño event. J. Geophys. Res. 121, 7673–7682. doi: 10.1002/2016JC012252
Keywords: marine heatwaves, South China Sea, cold tongue, statistical characteristics, mixed layer heat budget
Citation: Meng L, Yan Y, Zhang L, Xing W, Yu Y and Xing X (2024) Characteristics and mechanism of winter marine heatwaves in the cold tongue region of the South China Sea. Front. Mar. Sci. 11:1362805. doi: 10.3389/fmars.2024.1362805
Received: 29 December 2023; Accepted: 05 March 2024;
Published: 15 March 2024.
Edited by:
Kyung-Ae Park, Seoul National University, Republic of KoreaReviewed by:
Liqiang Zhao, Guangdong Ocean University, ChinaDo-Seong Byun, Korea Hydrographic and Oceanographic Agency, Republic of Korea
Copyright © 2024 Meng, Yan, Zhang, Xing, Yu and Xing. This is an open-access article distributed under the terms of the Creative Commons Attribution License (CC BY). The use, distribution or reproduction in other forums is permitted, provided the original author(s) and the copyright owner(s) are credited and that the original publication in this journal is cited, in accordance with accepted academic practice. No use, distribution or reproduction is permitted which does not comply with these terms.
*Correspondence: Xiaogang Xing, eGluZ0BzaW8ub3JnLmNu