 Titi Sui
 Musheng Yang1
 Chi Zhang
 Jinhai Zheng
- 1Key Laboratory of Coastal Disaster and Protection, Hohai University, Ministry of Education, Nanjing, Jiangsu, China
- 2Survey and Design, Nanjing Hydraulic Research Institute, Nanjing, Jiangsu, China
- 3The National Key Laboratory of Water Disaster Prevention, Hohai University, Nanjing, Jiangsu, China
Numerical studies were conducted on the wave-induced residual liquefaction of a silt–coarse sand layered seabed. Fully dynamic soil equations and residual seabed response equations were incorporated into the development of a numerical model. The numerical results were compared with theoretical solutions and experimental data from previous studies. Relatively good agreement was found in this comparison, validating the reliability of the proposed numerical model. The present model was applied to systematically investigate the wave-induced residual response with a silt–coarse sand layered seabed. The effects of coverage thickness, permeability, Young’s modulus in the upper silt layer on the residual response of the seabed were carefully examined. Numerical simulations indicate that the potential liquefaction is prone to occur with low permeability of the upper silt layer and shallower water depth, and the effect of coverage thickness of the silt layer on pore pressure and liquefaction potential is determined by shear stress ratio (χ) and effective normalized spreading parameter (Se) which represent the “generation power” and “dissipation potential” for residual pore pressure. The performance of the pore pressure and liquefaction in the layered seabed is the result of a trade-off between two non-dimensional parameters.
1 Introduction
The wave-induced response and liquefaction of porous seabeds are important factors in beach evolution (Cai et al., 2022) and coastal engineering restoration. When a wave propagates over a seabed surface, the cyclic wave pressure generates excess pore pressure within the seabed. The seabed is liquefied if the excess pore pressure exceeds the soil overburden pressure. Liquefied soils behave like liquids when the effective stresses become zero, which causes a substantial possibility of seabed instability and the destruction of marine structures (De Groot et al., 2006; Muñoz-Perez et al., 2015; Liu et al., 2019).
Two mechanisms of wave-induced liquefaction exist in real environments: momentary liquefaction and residual liquefaction (Sumer, 2014). Momentary liquefaction is primarily caused by the attenuation and phase lag of the oscillatory pore pressure along the seabed depth. This leads to a pressure discrepancy between the inner bed and the bed surface, i.e., excess pore pressure, which is the most important factor in the onset of liquefaction (Jeng, 2012). Numerous previous studies have focused on momentary liquefaction, including theoretical research (Yamamoto et al., 1978), experimental studies (Qi et al., 2019), and numerical simulations (Jeng et al., 2013; Zhang et al., 2016; Li et al., 2018; Sui et al., 2019a; Liu et al., 2023b). Momentary liquefaction mainly occurs in sandy seabeds with relatively high permeability and compressive resistance. Owing to its high rigidity, the elastic theory of momentary liquefaction is often used to demonstrate soil behavior. Interested readers can refer to Sumer (2014) for more detailed information.
The other mechanism is residual liquefaction, which was the one this study focuses on. Residual liquefaction is caused by the buildup of pore pressure under cyclic wave loadings, which takes place in seabeds of sand and silt (Sassa and Sekiguchi, 1999, 2001; Sumer and Fredsøe, 2002; Sassa et al., 2006; Sumer, 2014). Loose sand has a tendency to shrink under shear loading, this tendency to volume reduction will translate into an increase in pore pressure in poorly drained soils. Therefore, residual liquefaction may readily occur in loose deposits (with low relative densities) of fine sand or silt with partial drainage. Among the studies on seabed residual liquefaction, Seed and Rahman (1978) were pioneers in exploring the buildup of pore pressure under the influence of dynamic wave loading. In their research, they employed a 1D analytical model to examine cyclic shear stress, incorporating a nonlinear source term for the accumulation of pore pressure. McDougal et al. (1989) and Cheng et al. (2001) further proposed shallow, medium, and deep seabeds; the solutions of Cheng et al. (2001) were based on the Fourier transform. Jeng et al. (2007) and Jeng and Seymour (2007) developed a new model using a nonlinear source term and compared its performance with that of a traditional linear source term. Their investigations indicated that the pore pressures predicted with either the linear source term or the nonlinear source term are almost identical. In addition, a commonly used “J–S curve” based on the above research was proposed for a prediction of residual liquefaction by Jeng and Seymour (2007). Sumer et al. (2012) conducted wave flume experiments to examine the residual response of the seabed. They utilized the experimental data to validate a 2D mathematical model initially proposed by Sumer and Cheng (1999). Subsequently, this model was expanded into three-dimensional space by Sui et al. (2019b) to explore the residual response of a seabed surrounding a monopile foundation. Sui et al. (2023) investigated the effect of wave exposure history on the seabed residual liquefaction in the same flume of Sumer et al. (2012). However, scale effects exist in the 1g wave flume experiments due to the mismatch between the time-scaling of wave propagation (the Froude law) and soil consolidation process. To avoid this problem, Sassa and Sekiguchi (1999) used the centrifuge flume combined with the viscous scaling (Sekiguchi et al., 1995), first demonstrated the comprehensive characteristics of wave-induced residual liquefaction involving the progressive nature of wave-induced seabed liquefaction, amplification of oscillatory pore pressure, effects of wave-induced stress axes rotations, and re-liquefaction characteristics. They also established the time scaling laws for the wave-induced liquefaction. Then Sassa and Sekiguchi (2001) developed the first elastoplastic constitutive model to consistently describe the effects of wave-induced principal stress axes rotations based on the PZIII model (Pastor et al., 1990). By plotting the stress paths under the continuous action of the progressive wave, it is found that the rotation of the principal stress axes becomes increasingly pronounced, eventually having a significant influence on the residual liquefaction. Treating the progressive liquefaction as a moving-boundary problem, Sassa et al. (2001) developed a unified theory to consistently describe the concurrent liquefaction processes involving the wave-induced progressive liquefaction, maximum liquefaction depth, re-buildup of residual pore pressure, amplification of oscillatory pore pressure and the distinct vertical deformation of liquefied soil. In this model, the completely liquefied state of soil is modelled as a high-density inviscid fluid corresponding to the mass density of liquefied soil. The predicted results of the models developed by Sassa and Sekiguchi (2001) and Sassa et al. (2001) were comprehensively validated by the relevant centrifuge wave tests (Sassa and Sekiguchi, 1999). Using the same facilities as Sassa and Sekiguchi (1999), the marine structures of pipelines (Miyamoto et al., 2020) or pile foundations (Miyamoto et al., 2021) were further considered in their recent investigations. Because of the significantly increasing stress levels of soil, experimental observations in a centrifuge flume can be theoretically treated as an individual prototype in a real marine environment.
In terms of nonhomogeneous seabeds, Kirca et al. (2014) conducted experiments focusing on wave-induced liquefaction within a composite of clay and sand. Their findings revealed a heightened susceptibility of silt to liquefaction with rising clay content, up to a critical threshold value. Beyond this threshold, the combination of silt and clay ceased to exhibit liquefaction behavior. Sui et al. (2018) numerically examined the residual response of a nonhomogeneous silt seabed subjected to standing-wave loading. Their findings demonstrated a notable escalation in pore pressure beneath the node of standing waves in comparison to the conditions under the antinode of wave loading. This notable tendency is consistent with the effects of the rotation of the principal stress axes shown in Sassa and Sekiguchi (2001). More recently, Sui et al. (2022) investigated the liquefaction of seashell and sand mixtures. They found that the liquefaction resistance increases with an increase in the seashell content of the mixture, and the seabed is not liquefied when the seashell content is greater than 30%. This is because the high seashell content corresponds to a high Young’s modulus of the seabed, which suppresses liquefaction. This research is significant for the ecological protection design of structures (He et al., 2022; Liu et al., 2023a). The aforementioned studies mostly focused on the seabed response to nonhomogeneous sediment deposits. For a layered seabed, which is also commonly observed in real environments, investigations are relatively rare in the available literature. Utilizing the partial differential equation module of COMSOL Multiphysics, Jeng et al. (2019) conducted an investigation into the residual responses induced by waves and currents in a seabed situated within the Yellow River Delta of China. Their research revealed that the multilayer distribution of the seabed, which is commonly encountered in real seabed configurations, exerts a substantial impact on both the residual response and the occurrence of liquefaction in the seabed. Studies by Jeng et al. (2019) proposed an “antiliquefaction method” that replaces the surface bed with coarser sand for the prevention of liquefaction; however, the effects of important seabed parameters (like the thickness, drainage and stiffness of upper silt layer) on the layered seabed response and the corresponding residual liquefaction have not been systematically investigated.
In this article, a systematic numerical study of the wave-induced residual response and liquefaction of a layered seabed is presented. The effects of important wave and seabed parameters, such as permeability, Young’s modulus, and water depth, on the seabed residual response were carefully examined. The remainder of this article is organized as follows: The governing equations and model validations are described in Section 2. The simulation results of pore pressure accumulation in layered seabeds are presented in Section 3. Section 4 includes the discussion about pore pressure generation and dissipation to explain the results in Section 3; the residual liquefaction in layered seabed is also analyzed. Finally, the summary of conclusions is provided in Section 5.
2 Numerical model
Following previous studies on wave-induced residual liquefaction, the oscillatory response is closely related to the accumulation of pore pressure (Sassa and Sekiguchi, 2001; Sumer et al., 2012; Jeng and Zhao, 2015; Sui et al., 2019b; Duan and Wang, 2020). In the elastoplastic model like Sassa and Sekiguchi (2001), the oscillatory and residual pore pressure, soil stresses and displacements are solved and coupled. In Sumer et al. (2012); Jeng and Zhao (2015) and Sui et al. (2019b), the oscillatory response and the residual response are solved separately. The model used in the present study has two modes for pore pressure variation: the oscillatory and residual modes. The governing equations for both modes are presented in detail in this section.
2.1 Oscillatory model
The fully dynamic (FD) model based on Biot’s theory and the soil elastic constitutive relation are used to investigate seabed oscillatory responses. This model is frequently employed to simulate the dynamic behavior of soil, accounting for both the acceleration of the soil skeleton and the pore fluid. The governing equation of the FD model can be expressed as follows (Zienkiewicz et al., 1980):
The variables are defined as follows: σij represents the total soil stress (Pa), ρ stands for the average density of the porous medium (kg/m3), ρf denotes the density of pore fluid (kg/m3), gi represents the gravitational acceleration in the i-direction (m/s2), ui is the soil displacement in the i-direction (m), wi signifies the relative displacement of the fluid respect to the solid skeleton in the i-direction (m), ki represents the soil permeability in the i-direction (m/s), and n stands for the porosity of the solid phase. β in Equation (3) is the compressibility of the pore fluid. The expression of β is:
Where Kf is the bulk modulus of the pore fluid (N/m2), Sr is the saturation of soil. The shear stress of the soil under the action of waves can be obtained by solving the oscillatory response of the seabed, which is adopted as a driving force for the seabed residual response (Seed and Rahman, 1978). More details about the oscillatory model which involves the stress-strain relation, discretization scheme et al., interested readers can refer to the authors’ previous publication of Sui et al. (2019a).
2.2 Residual model
According to Jeng (2012), the governing equations for the seabed residual response in a 3D space can be written as (Equation 5)
where pr designates the residual pore pressure (Pa), Cv is the coefficient of soil consolidation (m2/s), and f denotes the source term for the accumulation of pore pressure (Pa/s). Here, Cv and f are defined as (Equations 6 and 7)
where E represents the Young’s modulus of soil (Pa), γw is the unit weight of water (N/m3), T is the period of wave loading (s), while αr and βr are empirical parameters that can be determined using the following expressions (Sumer et al., 2012) (Equations 8-10):
Here, τxz, τyz, and τxy are the shear stresses of the soil in space (Pa) (Equation 12), which are obtained from the oscillatory module of the present model. It should be noted that the saturation degree (Sr) can have an influential role in pore pressure accumulation. This impact is included in the oscillatory model in section 2.1, as seen in Equations 1-4. The oscillatory model provides the shear stress for the source (f) of the residual model.
2.3 Boundary conditions
To address the governing equations mentioned above, it is essential to impose appropriate boundary conditions. In this model, the lateral boundary and the bottom boundary of the seabed are treated as rigid and impermeable. Consequently, the seabed displacements and the normal gradients of pore pressure are constrained to zero (Equation 13).
At the interface between the seabed and water, the residual pore pressure is maintained at zero, while the oscillatory pore pressure equals the dynamic wave pressure. Furthermore, the vertical effective normal and shear stresses become negligible at this juncture (Equation 14):
According to the linear wave theory, the dynamic wave pressure exerted on the seabed surface can be expressed as (Equation 15):
where H represents the wave height (m), d denotes the water depth (m), α stands for the wave number (m-1), and ω is the wave frequency (s-1).
2.4 Model validation
To ensure the model’s reliability, it is essential to conduct verification before its practical application. Three validation cases are performed, involving the comparison of model results with previous analytical solutions and experimental data. The wave and seabed parameters for the validations are listed in Table 1.
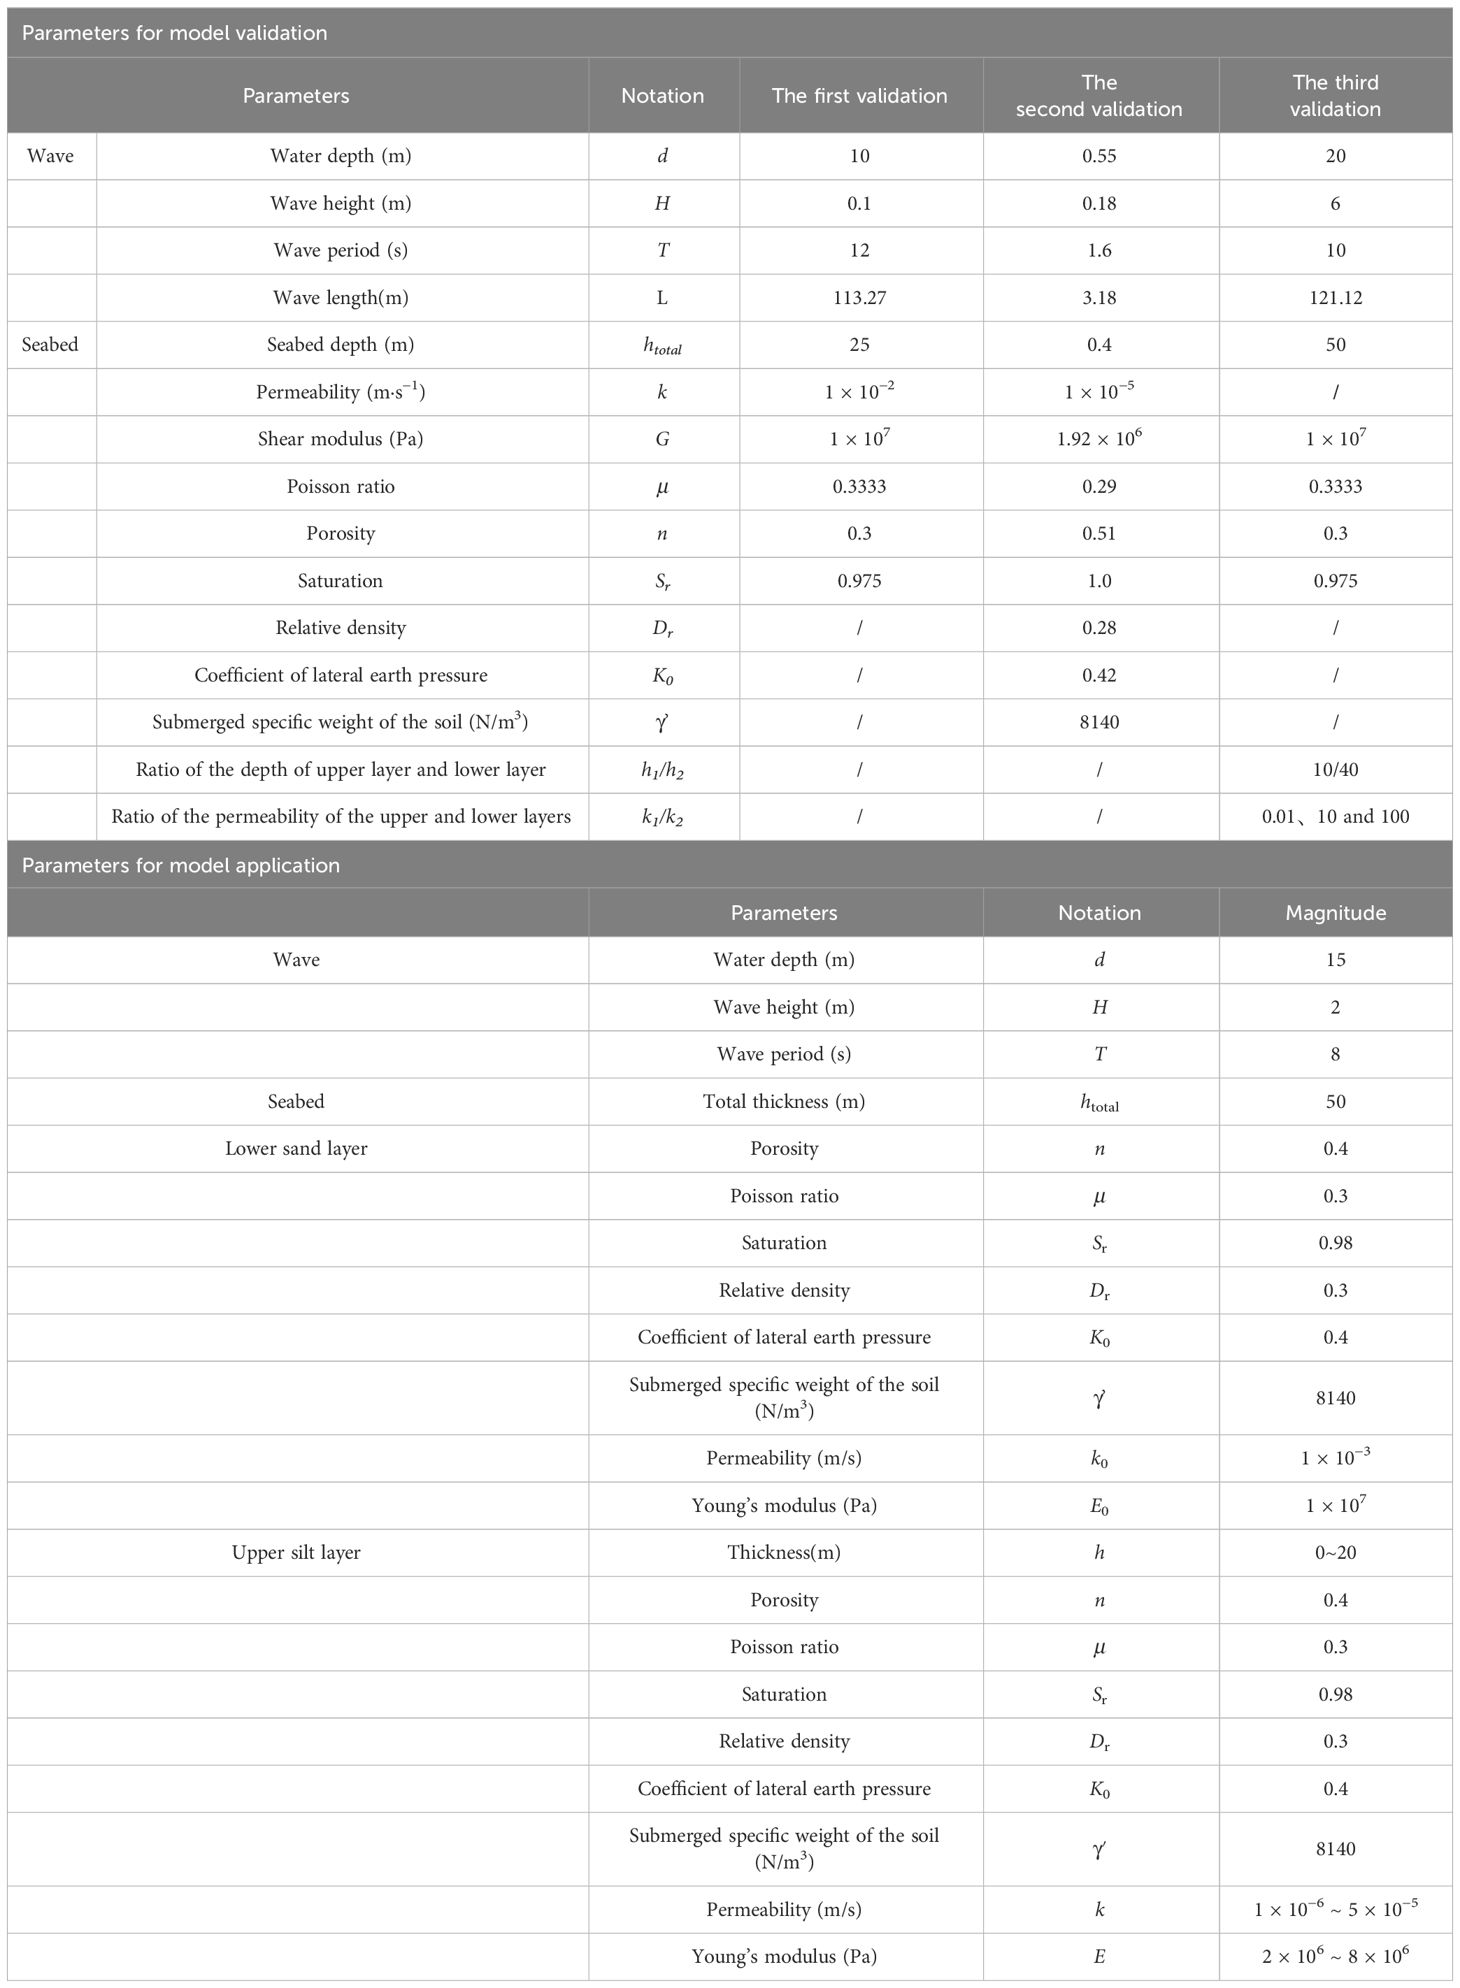
Table 1 Wave and seabed parameters for numerical simulation.
For the first validation, the proposed model is subjected to comparison with an analytical solution for the oscillatory seabed responses as previously presented by Jeng (2012). In this case, the wave is obliquely incident at an angle of 45°. The distributions of oscillatory pore pressure and soil stresses under short-crest wave loading are shown in Figure 1. The present numerical result and the previous analytical solutions agree relatively well. Note that, the present numerical model adopted the same governing equations, boundary conditions, wave loading etc. as the analytical model. The good comparison shown in Figure 1 proves that the discretization method and numerical scheme used in the numerical model were appropriate and reliable for the present simulation.
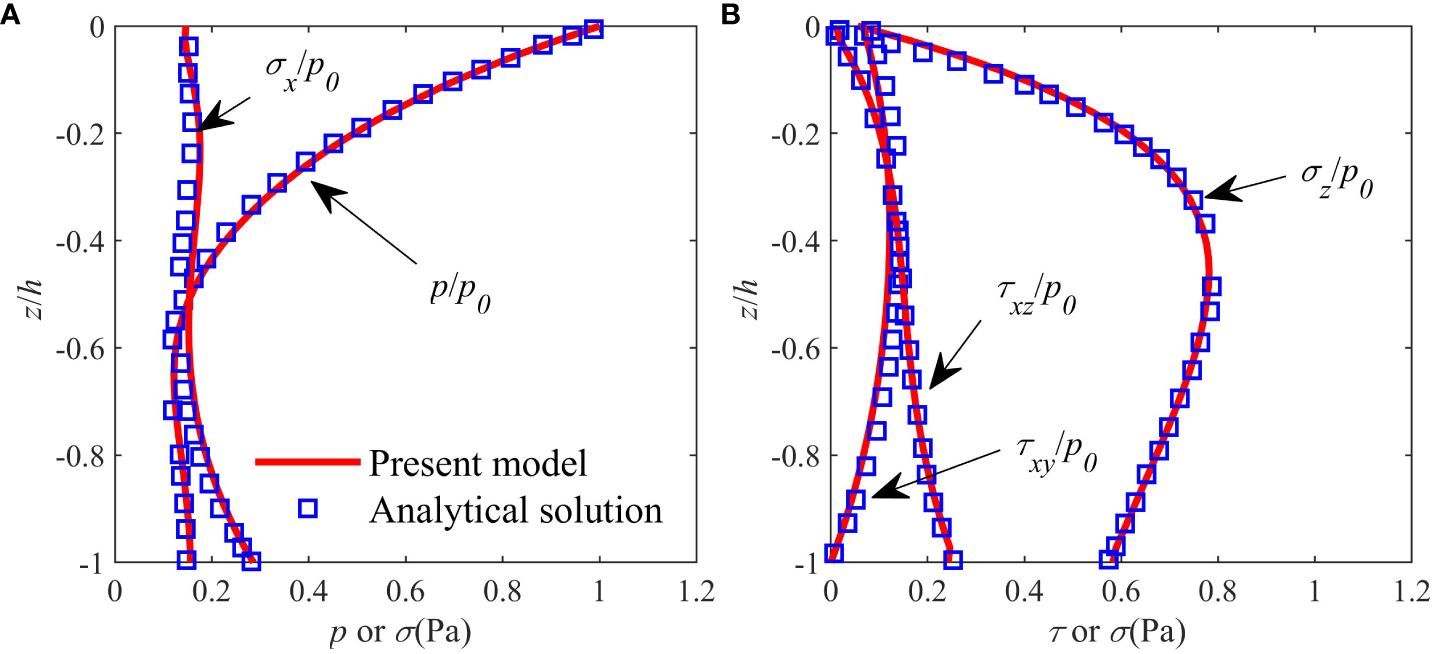
Figure 1 Comparison of vertical distribution of maximum pore pressure and soil stresses between the present simulated results and the analytical solution by Jeng (2012), (A) pore pressure and the horizontal normal stress (B) shear stresses and the vertical normal stress.
For the second validation, the reliability of the proposed model in forecasting pore pressure accumulation is assessed using residual pore pressure data obtained from a wave flume test conducted by Sumer et al. (2012). In this test, pressure transducers were positioned at varying depths within a silt pit. Figure 2 presents a comparative analysis of the vertical distribution of residual pore pressure with respect to seabed depth, contrasting the findings from the present numerical simulation with both the numerical simulations and experimental data from Sumer et al. (2012). The proposed model predicted the accumulation of pore pressure relatively well. It is noted that, due to the mismatch of timescales between wave propagation and soil consolidation, scale effects exist when expanding the standard wave flume experimental results from laboratory scaling to field scaling. The present model is based on the theory of Seed and Rahman (1978) where the important coefficients α and β were obtained from the large-scale cyclic shear test by Peacock and Seed (1968), and Alba et al. (1976). Therefore, the present model is capable of simulating the seabed residual response on a large scale. Figure 2 shows that the present model can also simulate the residual response in a standard flume test on a small scale as well. This is because that the alterations in soil behavior with depth appear to have limited significance in relatively shallow soil layers, precisely where the primary occurrence of wave-induced pore pressure buildup and liquefaction takes place (Sumer, 2014).
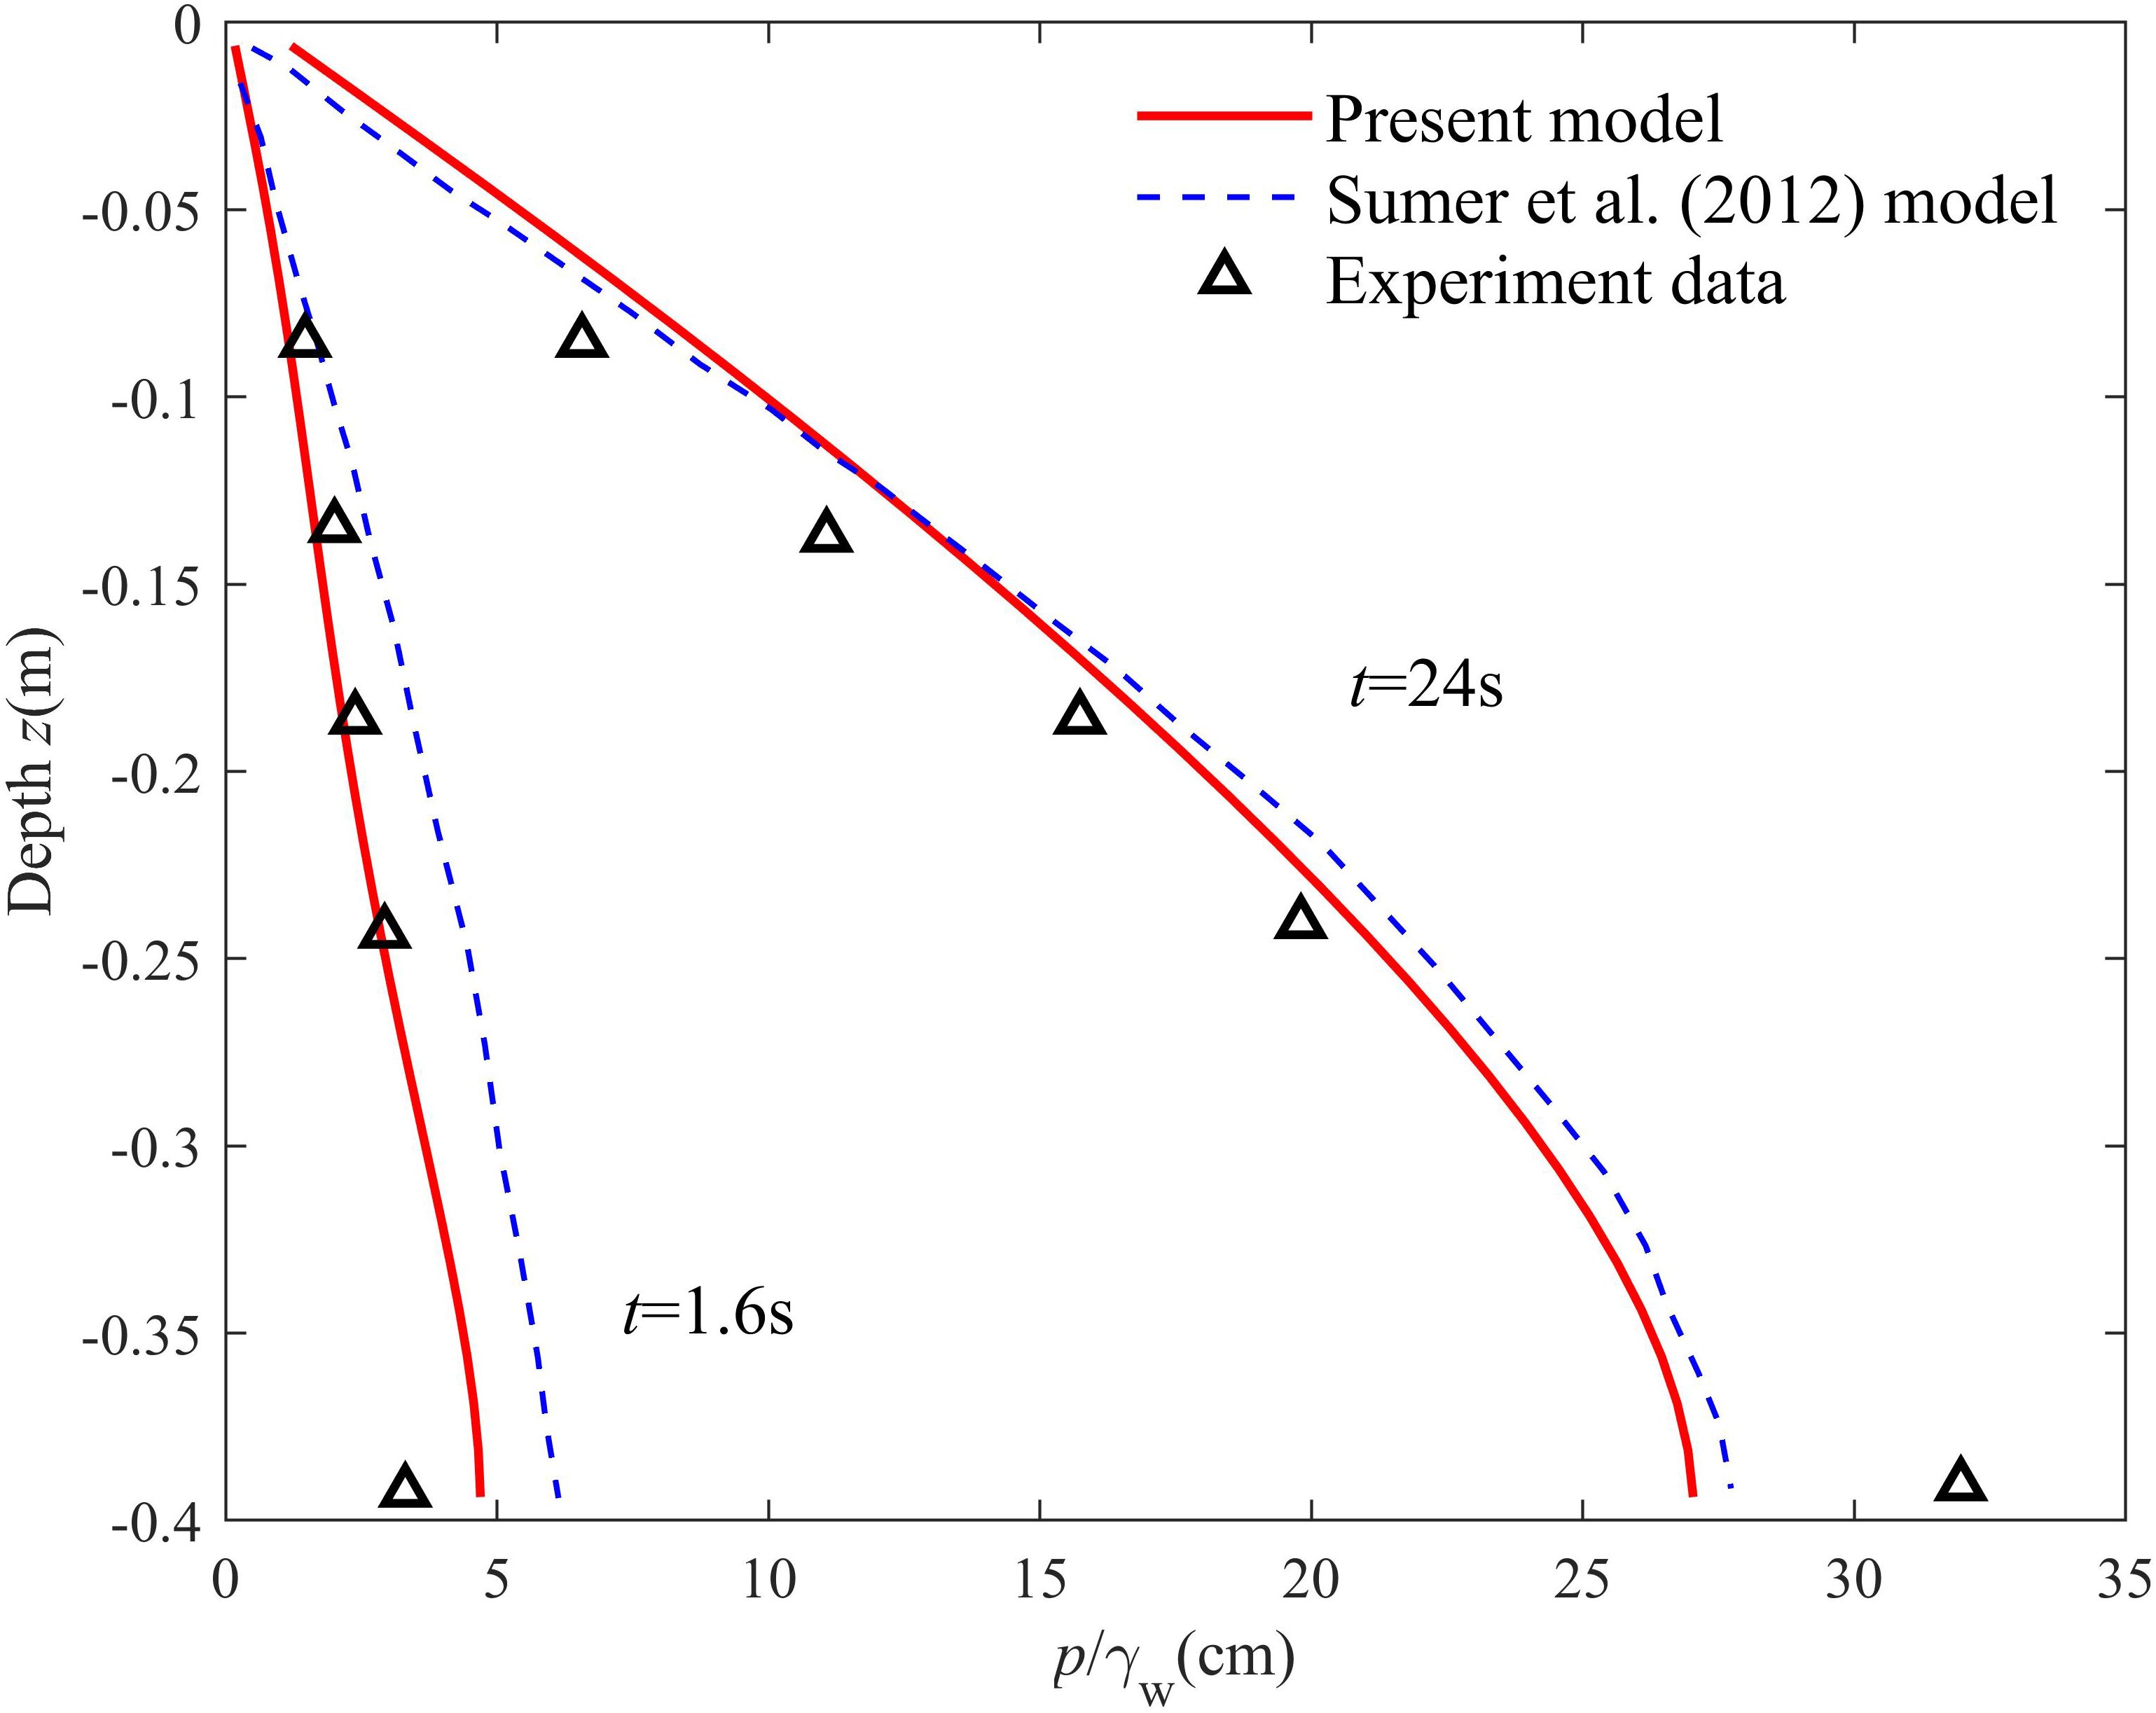
Figure 2 Comparison of vertical distribution of residual pore pressure between the present numerical simulation and both numerical simulation and experimental data by Sumer et al. (2012).
The third validation pertains to the assessment of the wave-induced response in a layered seabed. Hsu et al. (1995) established a semi-analytical solution for pore pressure and soil stresses in a layered seabed subjected to dynamic wave loading. Figure 3 illustrates a comparison between the simulated results (represented by solid lines) and the analytical results (labeled data) with respect to the vertical distribution of pore pressure and soil stress in a layered seabed. As shown in Figure 3, the simulation results and analytical solution agreed relatively well. The reason for the error may be that the present model retains the spatial gradient terms of the soil nonhomogeneous parameters in the governing equations, which were not considered by Hsu et al. (1995).

Figure 3 Comparison of vertical distribution of the (A) pore pressure and (B) effective stress in a layered seabed between the present numerical simulation (solid line) and a semi-analytical solution (labels) by Hsu et al. (1995).
3 Results
Layered seabeds are commonly encountered in natural environments. Numerous studies have been conducted on layered seabeds with oscillatory seabed responses. This study focuses on the residual response and liquefaction of a two-layered seabed, where the silt layer is placed on top of a sand layer (Figure 4). The soil and wave parameters used in the numerical simulation are listed in Table 1, which can be found in the part “parameters for model application”.
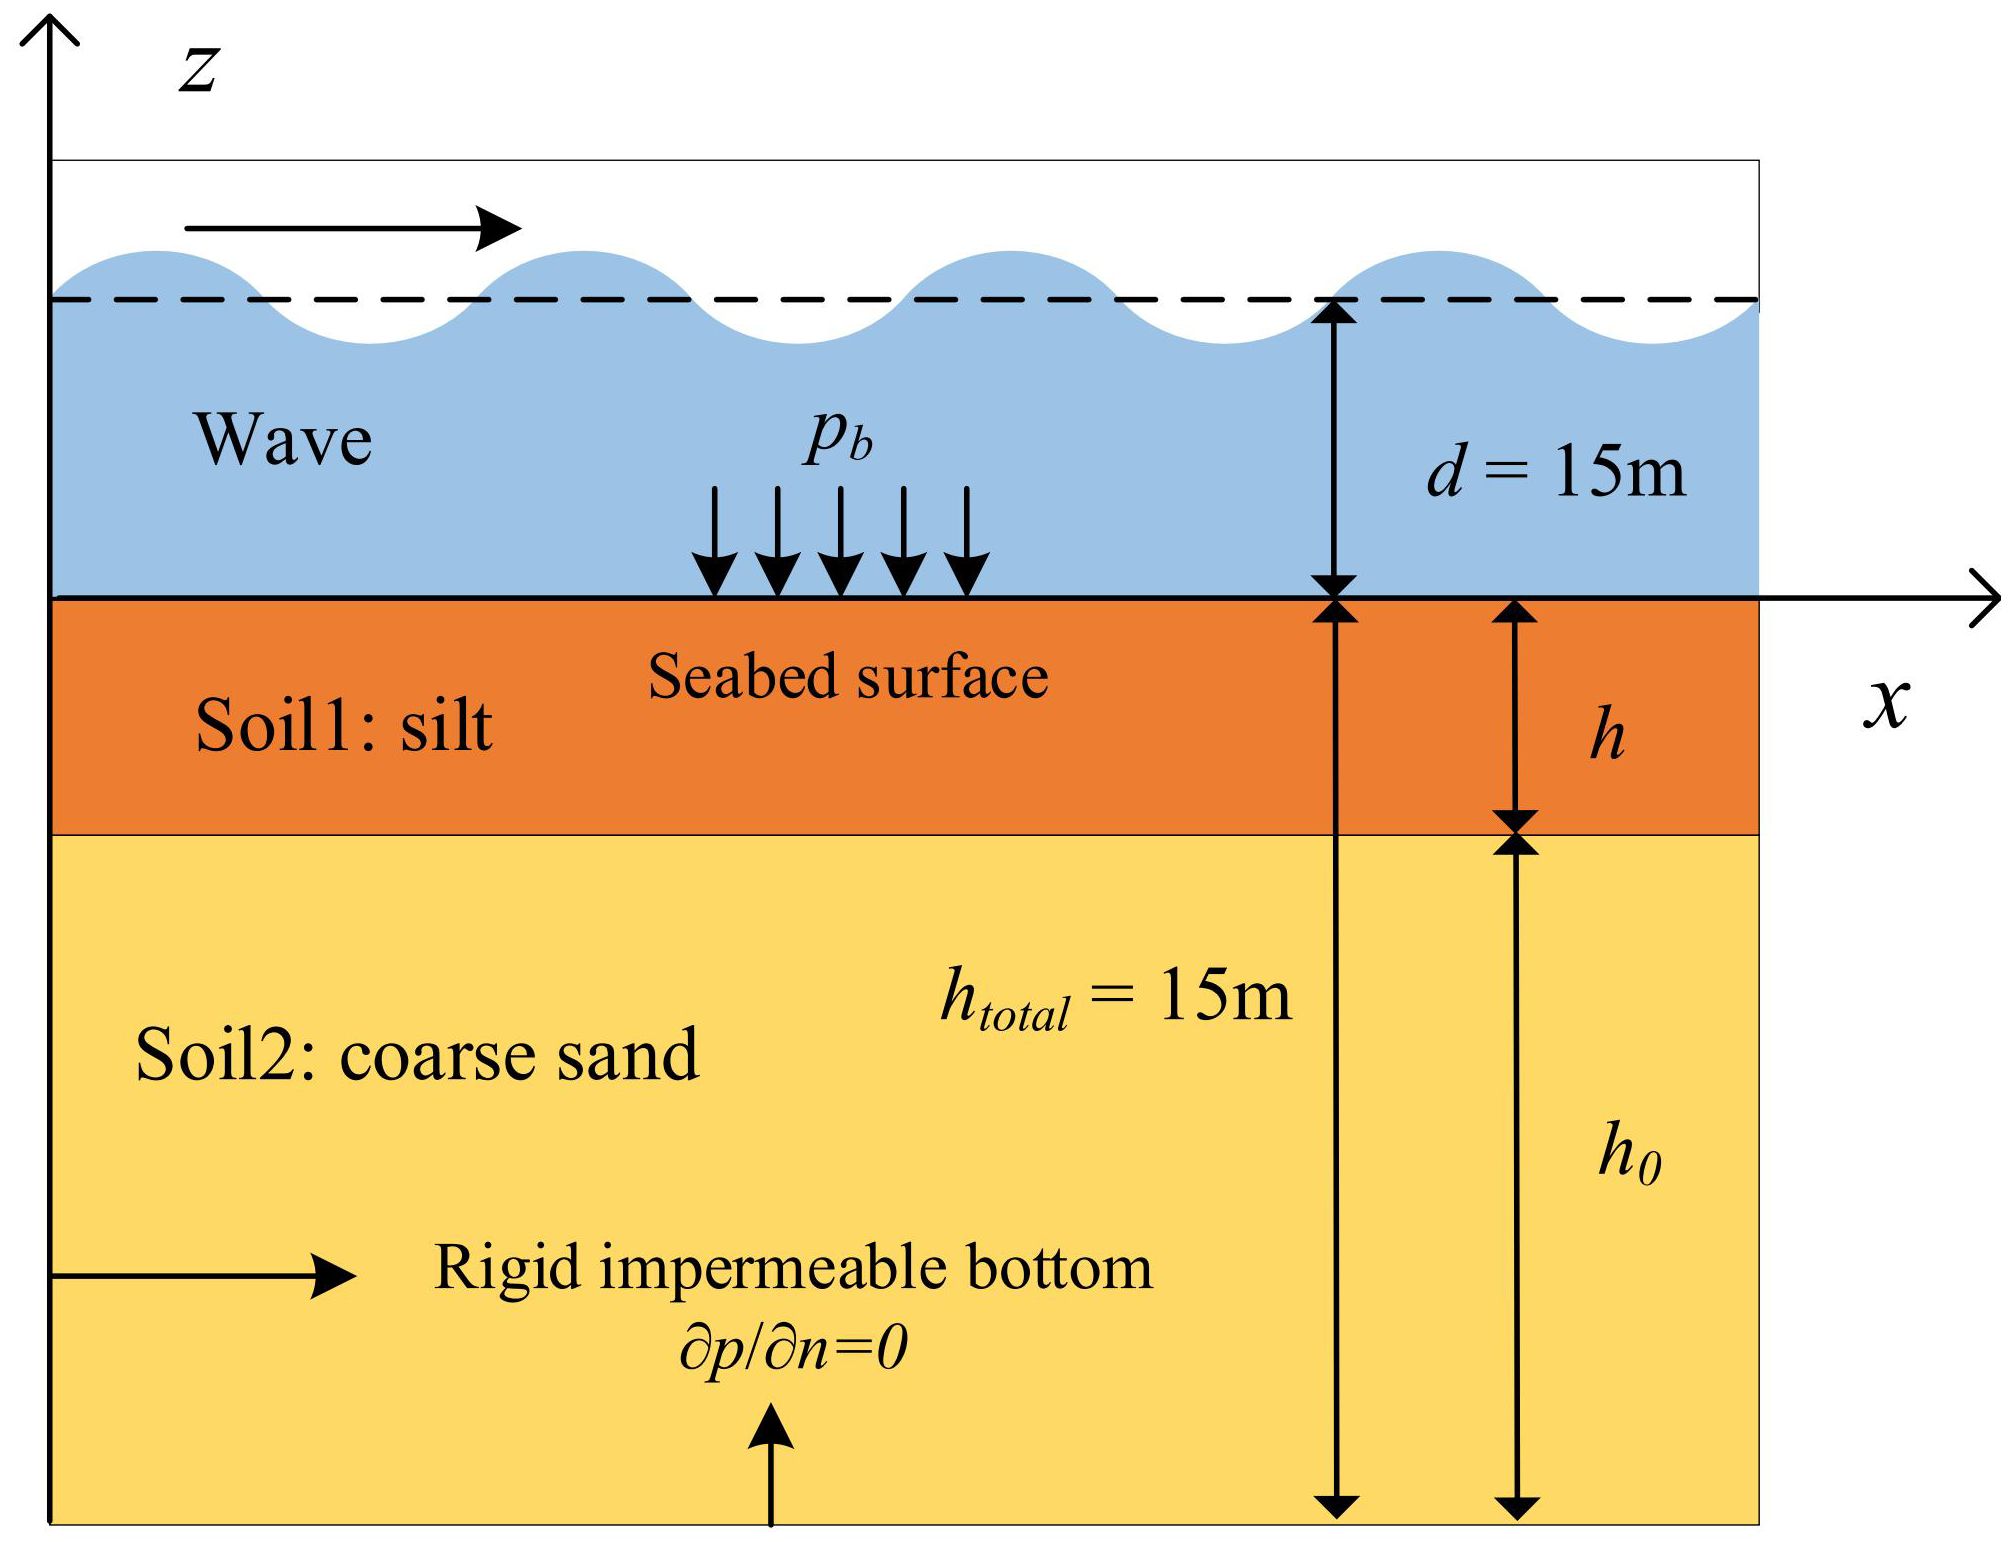
Figure 4 Sketch for the wave-layered seabed interaction.
3.1 pore pressure accumulation in layered seabed
The spatial distribution of pore pressure for a “standard” case (using all the default values in Table 1) at (a) t = 40T and (b) t = 100T are shown in Figure 5. The interface between the upper and lower layers is delineated by the black dashed line. The figure illustrates that the pore pressure in the upper layer (located above the dashed line) exceeded that in the lower layer (situated below the dashed line). In addition, comparing Figures 5A, B reveals that, when the time lasts from t = 40T to t = 100T, the pore pressure in the upper layer increases significantly, varying from approximately 1 × 10⁴ to 2.5 × 10⁴ Pa. In the lower sand layer, the pore pressure exhibits almost no change, with a value of approximately 0.5 × 10⁴ Pa. This indicates that the pore pressure increased significantly in the upper silt layer, whereas it hardly increased in the lower sand layer. This is because the upper silt part has partial drainage conditions, which makes it more capable of pore pressure buildup. However, the lower sand layer has relatively high permeability, which means that pore pressure dissipation is easier than pore pressure accumulation. Another reason is that the shear stresses in the soil of the upper silt layer are much larger than those in the lower part, which provides more “power” for the accumulation of the pore pressure (which will be discussed in detail in the next section).

Figure 5 Temporal and spatial features of the residual pore pressure in the layered seabed (h = 10 m, k = 1 × 10⁻⁵ m/s, E = 5 × 10⁶ Pa) (A) t = 40T (B) t = 100T
Figure 6 presents the time series of pore pressure accumulation at a depth of z = -15 m within the lower sand layer for various upper silt layer depths. It is evident that pore pressure gradually increases with time due to the generation of excess pore pressure. In Figure 6, the influence of the upper silt layer’s coverage thickness on the pore pressure in the lower sand layer is depicted. Figure 6 shows that, during the period from 0 to 800 s, the pore pressure increased slightly if there was no silt layer coverage (h = 0 m) (black solid line). When the coverage thickness of the upper silt layer was h = 5 m, the pore pressure increased dramatically from zero to approximately 1.8 × 10⁴ Pa during the same period (red solid line). However, the maximum pore pressure then decreased significantly when the coverage thickness increased (h = 10 m for the red dashed line and h = 15 m for the blue solid line). This indicates an “increase–decrease” pattern with the increase in depth of the upper silt layer, which is more clearly shown in the nested graph of Figure 6 with quantitative plotting. Here, pr, max indicates the pore pressure at t = 800 s, which was the end of the simulation. The nested graph of Figure 6 shows that there was a peak value (pr, max = 1.8 × 10⁴ Pa) when the coverage thickness of the upper silt layer h was approximately 5 m.
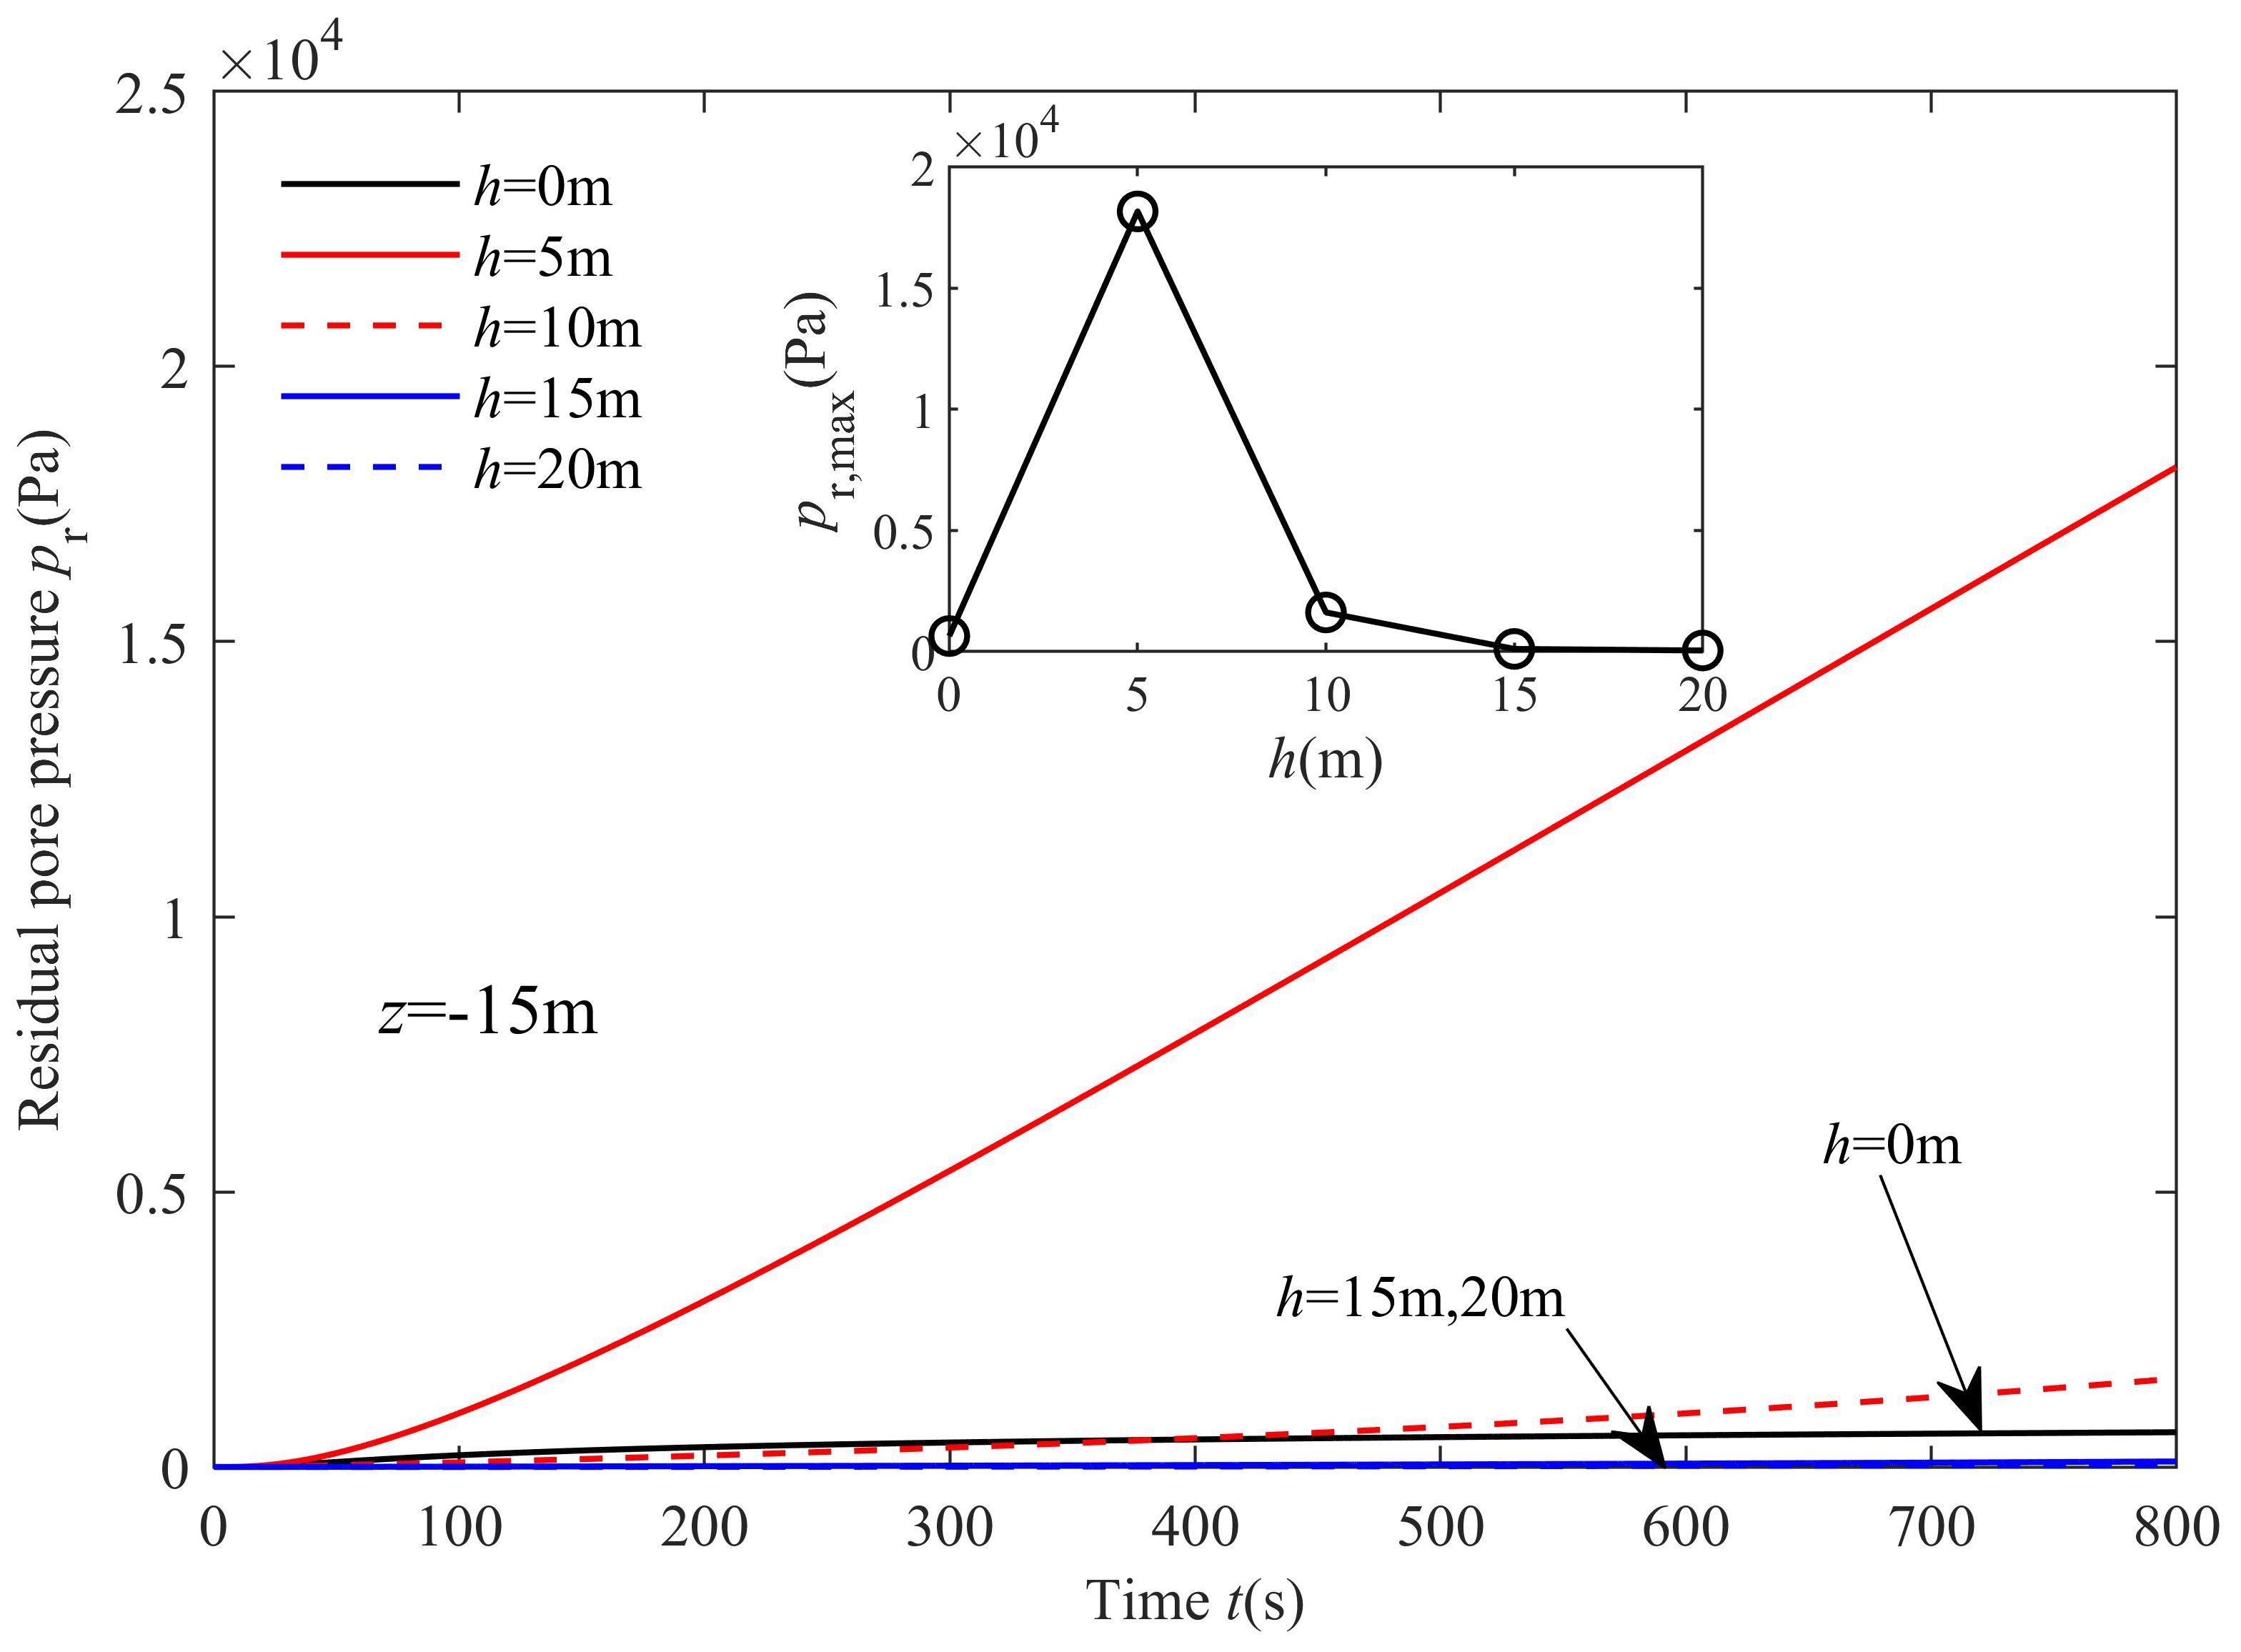
Figure 6 Time series of pore pressure variation with different coverage thicknesses of the upper silt layer.
The effect of the coverage thickness of the upper silt layer (h) on the vertical pore pressure distribution at t = 100T is illustrated in Figure 7. In this plot, the coverage thickness h ranges from 0 to 9 m. The figure illustrates a rapid initial increase in pore pressure, followed by a substantial decrease in the vertical direction. Notably, in the absence of silt layer coverage (h = 0 m), minimal pore pressure accumulation was observed in the vertical direction. Moreover, the coverage thickness was found to exert significant effects on the vertical distribution of pore pressure. For the various coverage thicknesses (h), the vertical locations for the maximum pore pressures were roughly constant at approximately z = −0.15 htotal. However, the maximum values exhibited a significant discrepancy at different coverage thicknesses. The maximum pore pressure increased with an increase in coverage thickness for h varying from 0 to 5 m. Subsequently, the maximum pore pressure had a large decrease with increasing h. For instance, the maximum pore pressure pmax was 16 kPa for h = 3 m, 18.3 kPa for h = 4 m, and 25 kPa for h = 5 m, but it decreased to 16 kPa when h = 6 m.
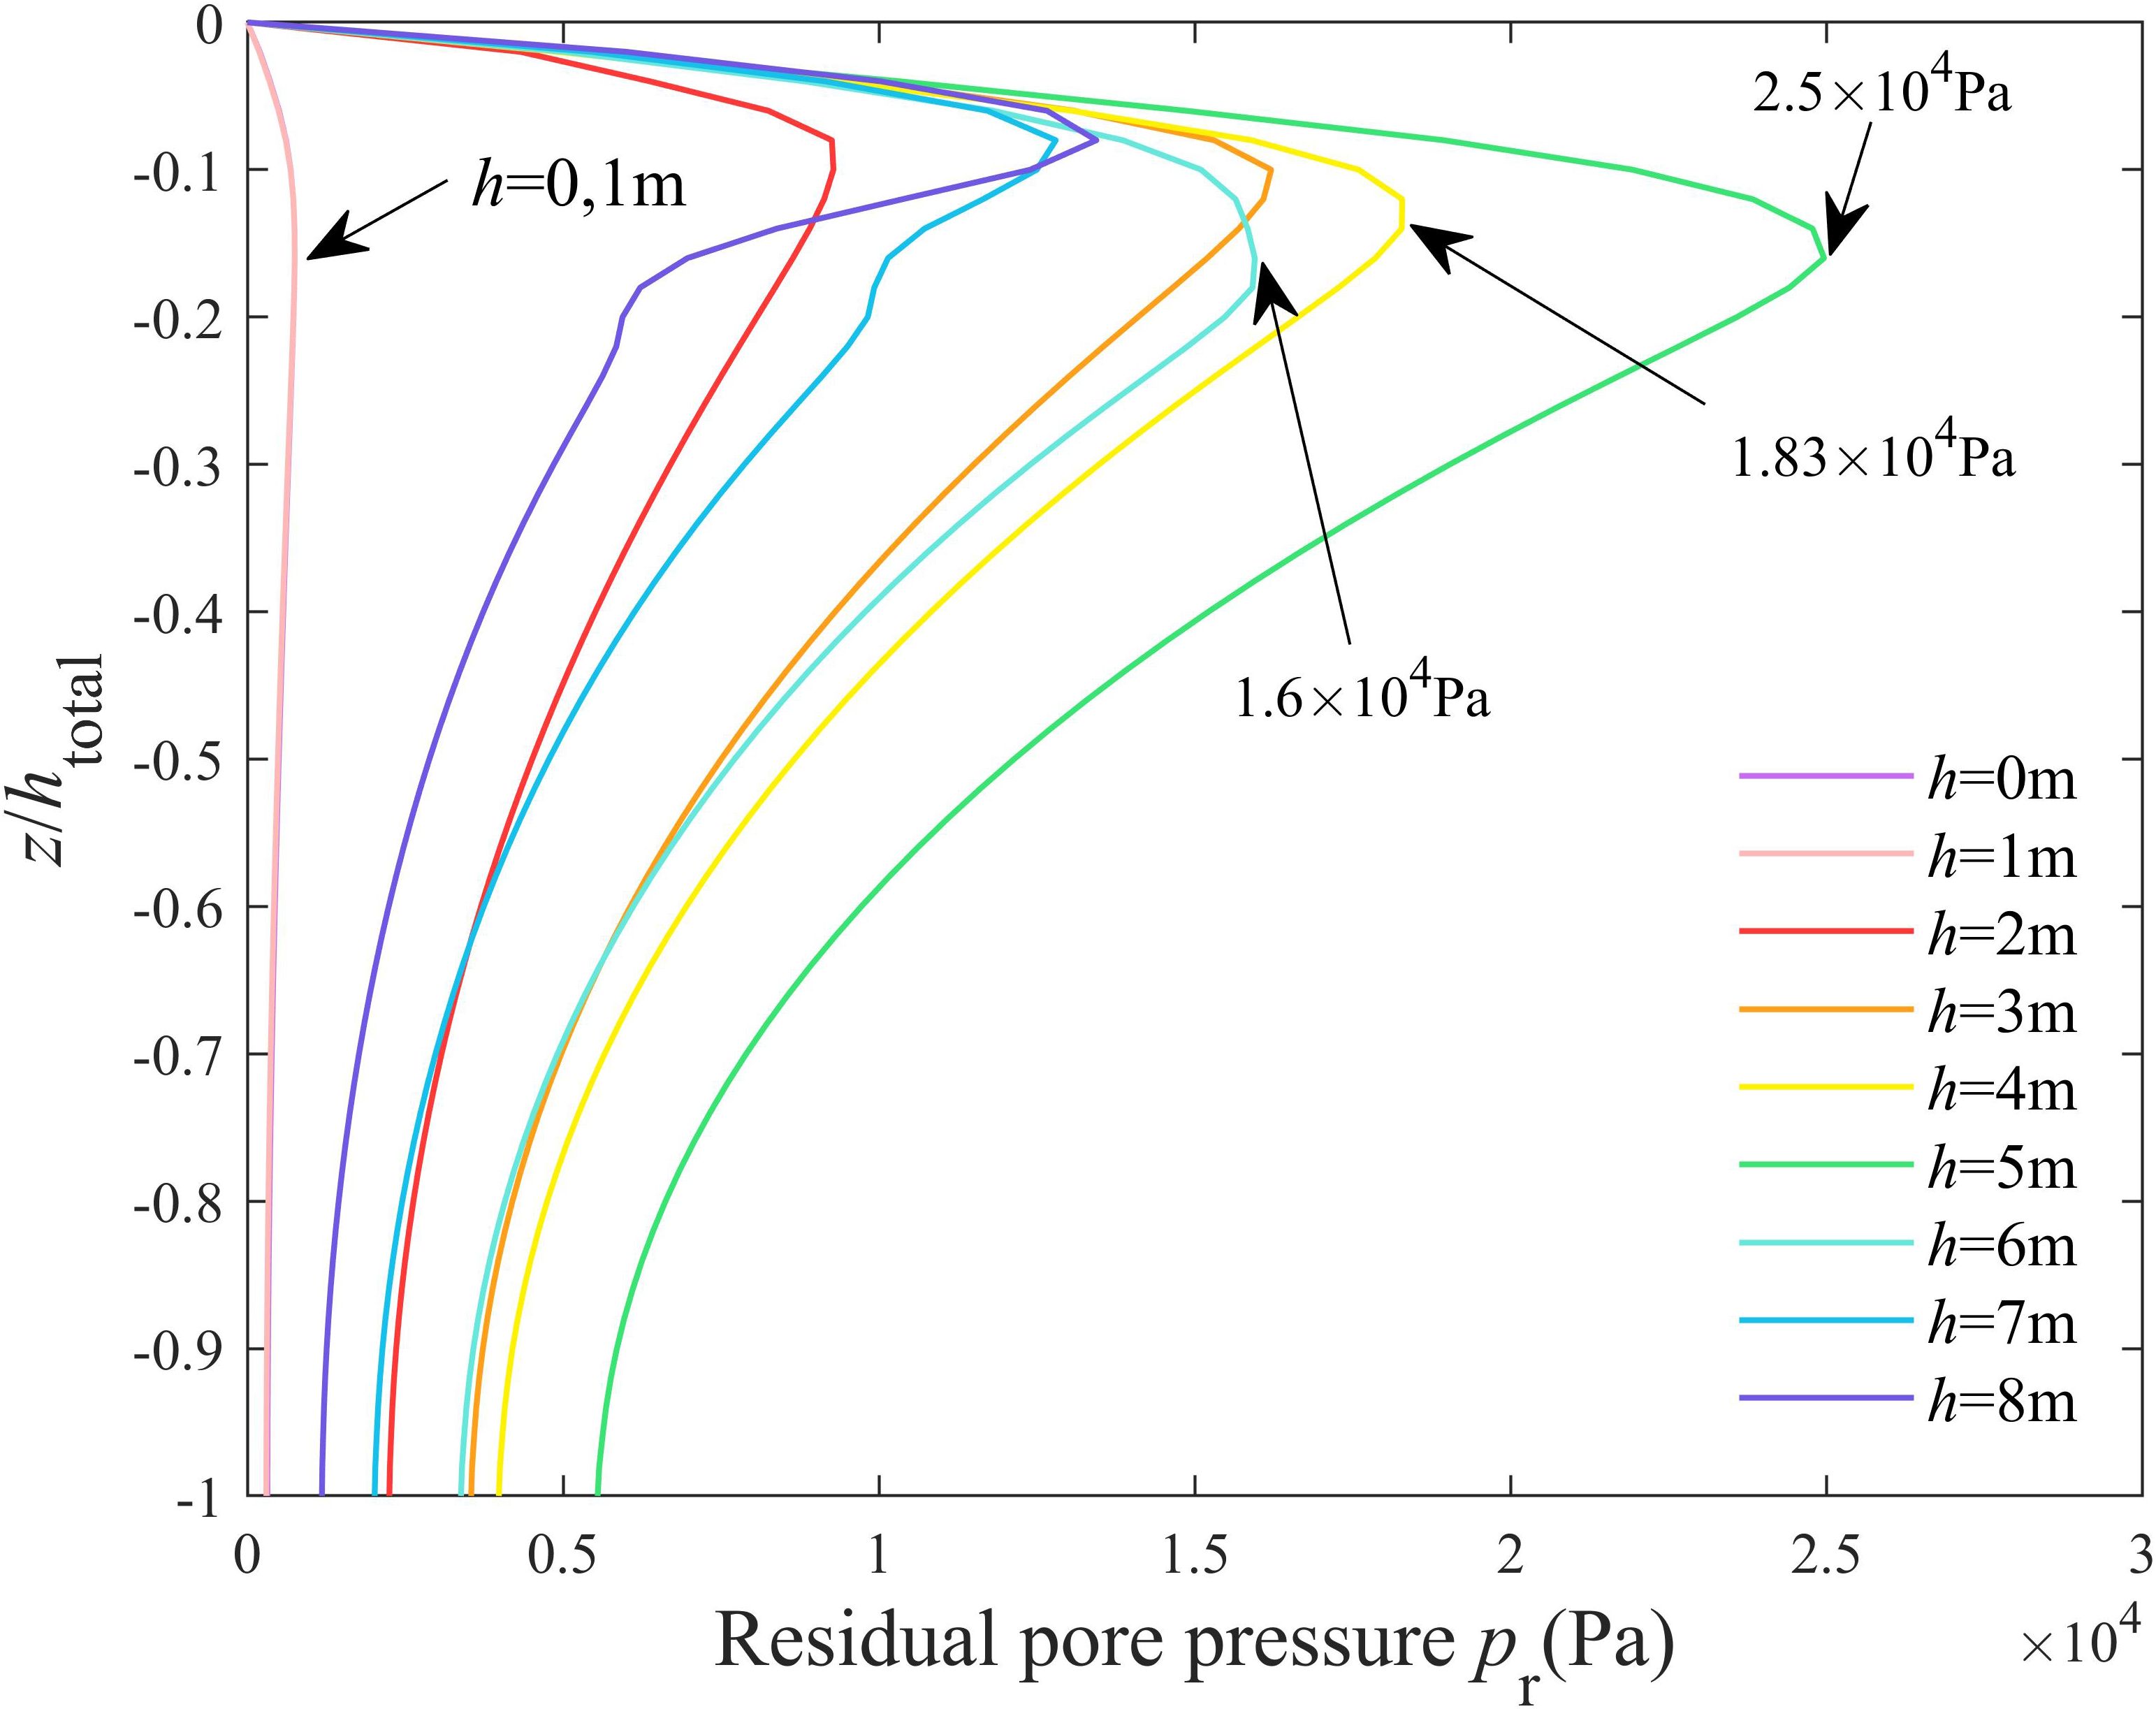
Figure 7 Vertical distribution of residual pore pressure pr with various coverage thicknesses of the upper silt layer.
The impact of the permeability (k) and Young’s modulus (E) of the upper silt layer on the vertical distribution of pore pressure is depicted in Figures 8A, B. The dashed line demarcates the interface between the silt and sand layers. Figures 8A, B demonstrate that pore pressure accumulation predominantly transpires above the dashed line, signifying that pore pressure accumulates more readily in the silt layer, while it is more challenging to generate in the lower sand layer. In addition, the maximum pore pressure (pr, max) increases with decreasing permeability. It is reasonable to assume that decreasing permeability indicates a partial drainage condition of the seabed, which would promote an increase in pore pressure. Regarding the effects of Young’s modulus, as shown in Figure 8B, the maximum pore pressure basically increases with an increase in Young’s modulus, except for one case (E = 8 × 10⁶ Pa). For instance, the pore pressure at E = 8 × 10⁶ Pa is approximately 17 kPa, which is larger than that of 15 kPa at E = 6 × 10⁶ Pa.

Figure 8 Effects of (A) permeability k, (B) Young’s modulus E and (C) water depth d of the upper silt layer on the vertical distribution of the residual pore pressure pr.
In addition to soil parameters, water depth are also important for pore pressure accumulation. Figure 8C illustrates the vertical distribution of (a) pore pressures and (b) shear stresses in the soil at different water depths. As indicated in Figure 8C, the predominant pore pressure accumulation was observed in the upper silt layer. In addition, for the various water depths, the locations for the maximum pore pressure are all approximately z/htotal = −0.1. The maximum pore pressure increases significantly with decreasing water depth.
3.2 pore pressure generation and dissipation
Pore pressure within the seabed arises from two primary physical mechanisms: pore pressure generation and dissipation (Seed and Rahman, 1978). The source term (f) in Equation (4) is accountable for pore pressure generation and encompasses crucial variables such as shear stresses τxz (for the 2D cases) and the initial effective soil stress (σ0’) defined by Equation (11). Greater shear stress τxz indicates a higher potential for pore pressure generation (Jeng et al., 2007; Jeng and Zhao, 2015). Sassa and Sekiguchi (1999) firstly defined the “shear stress ratio (χ)” rather than the shear stress to serve as an index of the severity of wave loading, on which the pore pressure generation depends on. The shear stress ratio is defined as the ratio of shear stress and the soil initial effective stress (Equation 16):
The calculation of shear stress (τ) is detailed in the oscillatory mode of the model (see Section 2.1).
On the other hand, pore pressure dissipation is regulated by the normalized spreading parameter S, which characterizes the ability of pore pressure to propagate through the soil skeleton. Parameter S is expressed as (Equation 17) (Sumer, 2014).
Here, in the given equation, L represents the wave length (m), and T represents the wave period (s). This parameter is first defined by Sassa and Sekiguchi (1999) and Sassa et al. (2001) (named the partial drainage factor in their paper). As outlined by Sumer (2014), the impact of the spreading parameter on pore pressure transmission can be understood from a physical perspective: a higher value of S implies enhanced spreading and dissipation of excess pore pressure.
The vertical distribution of shear stress of soil τxz, the shear stress ratio χ and the effective normalized spreading parameter Se with various coverage thicknesses of the upper silt layer are shown in Figures 9A–C. The effective normalized spreading parameter Se is newly defined in this study, which considers the effects of the upper-layered silt on the values of S above the point of concern. A detailed calculation of Se can be found in the Appendix (Figure 10). Figure 9A demonstrates that, akin to the vertical distribution of pore pressures, the shear stress τxz initially rises but subsequently declines with increasing seabed depth. The obvious disconnection in the curved line of the shear stress distribution is caused by the sudden change in the soil properties at the interface between the silt and sand layers. This disconnection was likewise observed in the pore pressure distribution, as depicted in Figure 7, and it is more pronounced in the shear stress distribution presented in Figure 9A. This observation suggests that the potential for pore pressure generation (τxz), diminishes at both the surface and bottom of the seabed, while exhibiting a peak value at the midpoint. Additionally, the maximum value of shear stress τxz increased as the coverage thickness followed by a decrease with an increasing h. This is also similar to the basic conclusions obtained on pore pressure variation (Figure 7). Figure 9B illustrates the effects of the coverage thickness h on the maximum shear stress ratio χ. Note that, the shear stress ratio χ could be seen as the “power” for the generation of the pore pressure (Sassa and Sekiguchi, 1999). This means that a larger χ corresponds to a greater likelihood of pore pressure accumulation. Figure 9B shows that, in the vertical direction, the maximum shear stress ratio χ greatly decreases with the increase of the seabed depth. For an increasing coverage thickness h, there is a decrease in the maximum shear stress ratio. The above simulation results indicate that the pore pressure at the upper seabed layer has more power to accumulate with a smaller coverage thickness h. The effects of coverage thickness (h) on the vertical distribution of Se are shown in Figure 9C. The effective normalized spreading parameter Se exhibited an increase in value with the ascending seabed depth. This trend can be attributed to the significantly higher Young’s modulus E associated with the lower sand layer. This indicates that the pore pressure dissipation ability increases with seabed depth when the upper seabed has partial drainage. Moreover, Figure 9C illustrates the effective normalized spreading parameter Se diminishes as the coverage thickness of the upper silt layer (h) increases. This relationship can be readily inferred from the definition of Se, taking into account that the Young’s modulus E is lower for the upper silt layer. This implies that the ability of pore pressure dissipation decreases with an augmentation in coverage thickness (h).
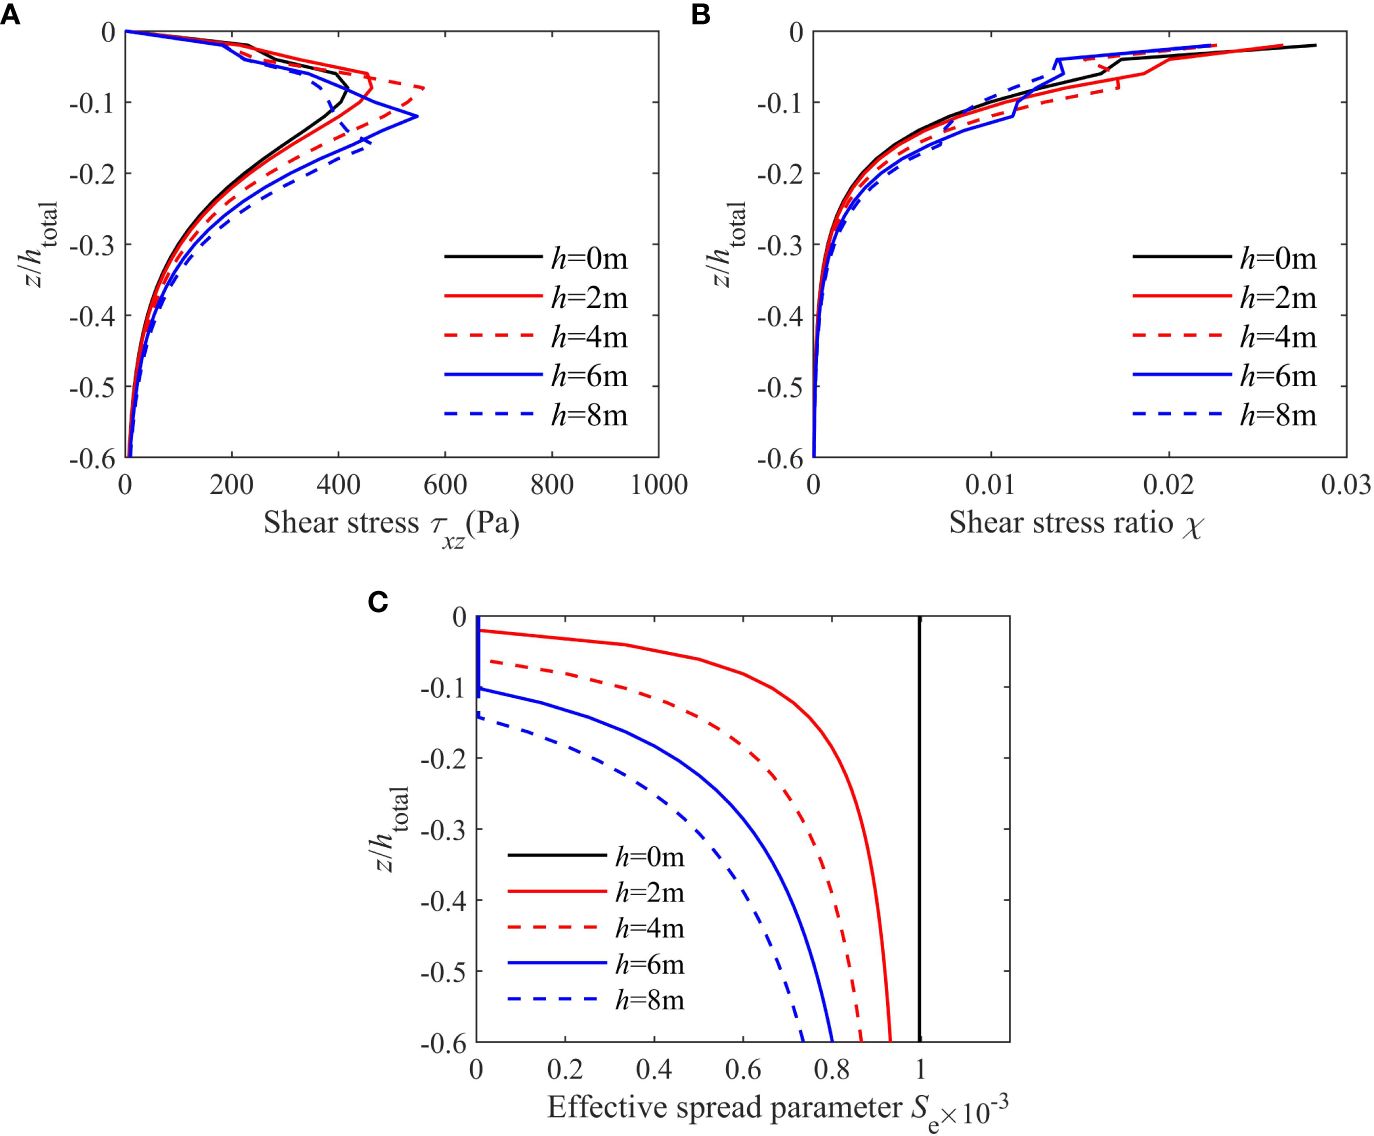
Figure 9 (A) Vertical distribution of soil shear stresses τxz, (B) the shear stress ratio χ and (C) the normalized parameter Se with various coverage thicknesses of the upper silt layer;.

Figure 10 Sketch map for the definition of effective spreading parameter Se.
Figure 11 shows the (A) the maximum pore pressure (obtained from Figure 7) and (B) the shear stress ratio χ, the normalized spreading parameter Se with various thicknesses of the upper layer h. It shows that, the increase in the thickness of the upper layer (h) results in a rise of residual pore pressure until h reaches 5 m. After that, residual pore pressure exhibits a decreasing trend (Figure 11A). The reasons can be explained in Figure 11B for illustrating the changing trend of χ and Se with various thickness of the upper layer. Figure 11B shows that an increase in the coverage thickness would cause a monotonically decreasing trend in χ and Se. As per the definitions provided in Figure 9, it can be inferred that an increase in the value of h results in a decrease in the shear stress ratio χ, which in turn leads to a potential decrease in the pore pressure. On the other hand, a decrease in the value of Se corresponds to a potential increase in the pore pressure. The shear stress ratio (implying generation) and the normalized spreading parameter (implying dissipation) are the two important factors that govern the residual pore pressure. As shown in Figure 11A, the turning point for pore pressure variations occurred at a depth of 5 meters. This suggests that, for the current scenario, the normalized spreading parameter Se has a dominant effect on the pore pressure when the depth is less than 5 meters. However, when the depth exceeds 5 meters, the dominant factor that affects the pore pressure is changed to the shear stress ratio χ.
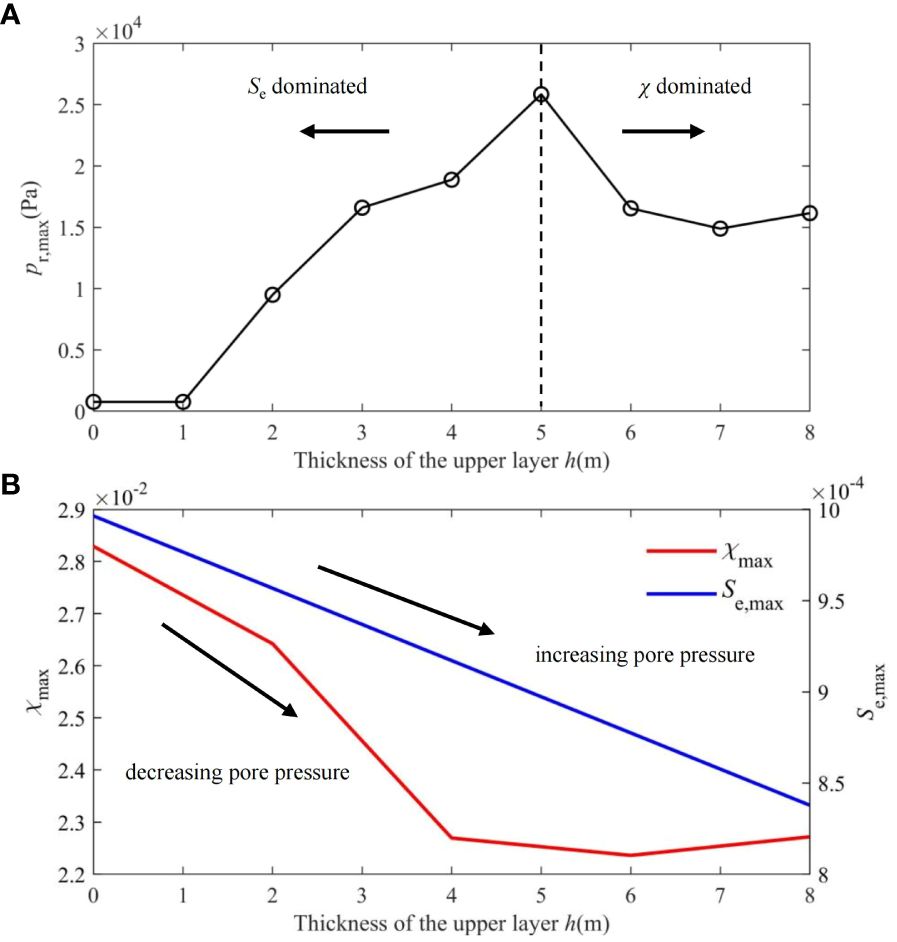
Figure 11 Variation of the (A) max residual pore pressure pr, (B) soil shear stresses ratio χ and the normalized parameter Se along the depth with various coverage thicknesses of the upper silt layer.
To figure out the reason for the effect of permeability and Young’s modulus on pore pressure accumulation, Figures 12A–F illustrate the vertical distribution of τxz, χ and Se with various permeabilities (k) and Young’s modulus E. As shown in Figures 12A, B, the shear stress and shear stress ratio did not change significantly when the permeability (k) decreased from 5 × 10⁻⁵ to 6 × 10⁻⁶ m/s. This indicates that the influence of permeability (k) on pore pressure generation is limited. Figure 12C shows that Se decreases continuously with decreasing permeability. This inhibits pore pressure dissipation, resulting in an increase in the maximum pore pressure, as shown in Figure 8A. The effects of E on the vertical distribution of τxz, χ and Se are shown in Figures 12D–F, illustrating that, in the upper silt layer, all of the τxz, χ and Se have an increase with an increase in E. Detailed comments for this phenomenon will be proposed in the “Discussion”.
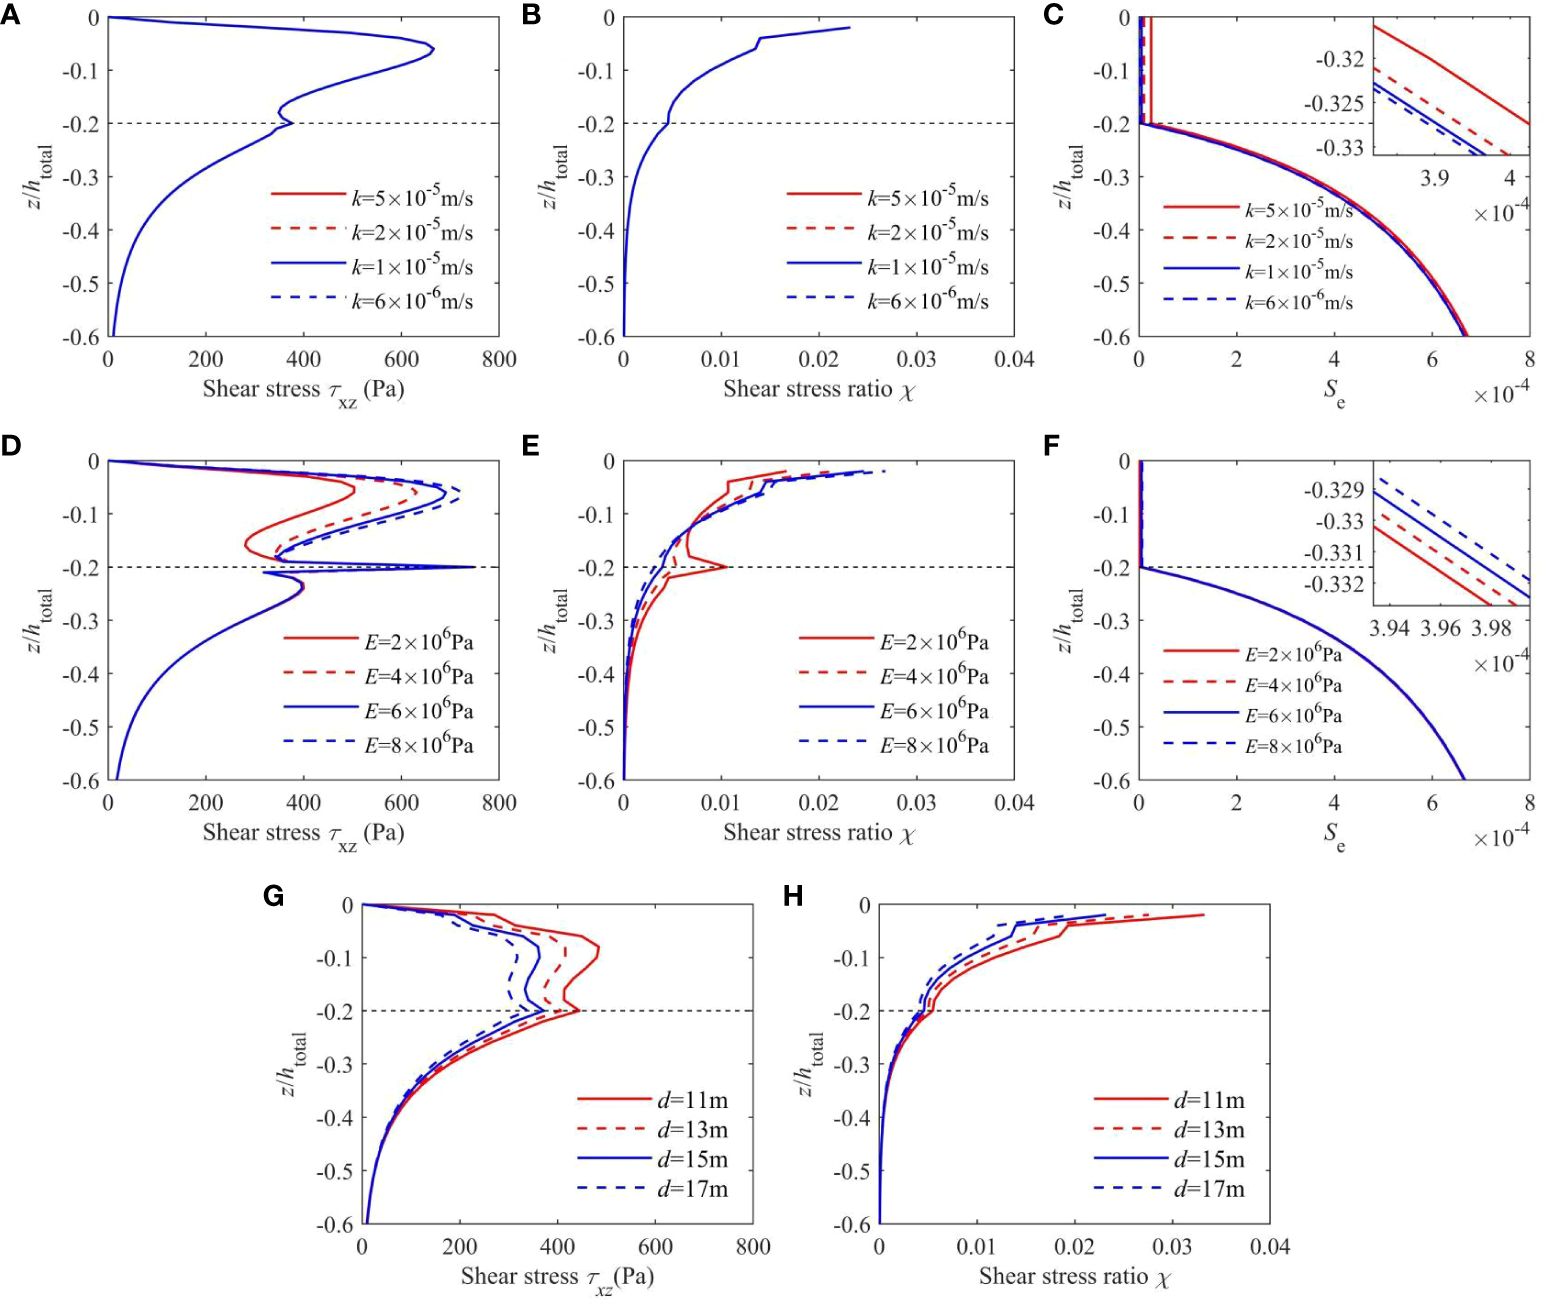
Figure 12 Effects of permeability k, Young’s modulus E and water depth d of the upper silt layer on the vertical distribution of the (A, D, G) soil shear stresses τxz, (B, E, H) shear stress ratio χ and the (C, F) effective normalized spreading parameter Se.
For the various water depths, only the factor for pore pressure generation is affected. The vertical distributions of shear stresses (τxz) and shear stress ratio (χ) with various water depths are shown in Figures 12G, H. It is clear that the shear stress (τxz) and shear stress ratio (χ) decrease with the increase in water depth (d). It is reasonable to assume that increasing the water depth would decrease the dynamic wave pressure at the seabed surface and weaken the soil response. This further decreases the shear stress (τxz) and the shear stress ratio (χ) of the soil, which would correspondingly reduce the pore pressure generation capability. As a result, the maximum pore pressure decreases with increasing water depth, as shown in Figure 8C.
3.3 liquefaction
The assessment of wave-induced liquefaction was conducted with a meticulous examination to determine the stability of the seabed. It is widely acknowledged that liquefaction occurs when the excess pore pressure surpasses the initial effective stress (σ0’), leading to a complete loss of soil resistance. In line with Jeng (1997)’s work, the criterion for the initiation of liquefaction is formulated as follows:
In this equation, γ′ represents the submerged specific weight of the soil (N/m3), and K0 = 0.42 stands for the coefficient of lateral earth pressure.
Based on the liquefaction criterion (Equation 18), the liquefaction depths for various coverage thicknesses in the upper silt layer are shown in Figure 13. The dashed line in Figure 13A corresponds to the overburden pressure of the soil in the vertical direction. The point of intersection between the pore and overburden pressures designates the liquefaction depth (zL). As depicted in Figure 13, the liquefaction depth is zero when h = 0, as there is minimal accumulated pore pressure in the absence of an upper silt layer (Figure 7). However, as the coverage thickness increases, the liquefaction depth also rises, reaching zL = 4.5 m when h = 5 m. Subsequently, the liquefaction depth decreases significantly with increasing coverage thickness. This trend of pore pressure variation with coverage thickness is quantitatively shown in Figure 13B for clarity.
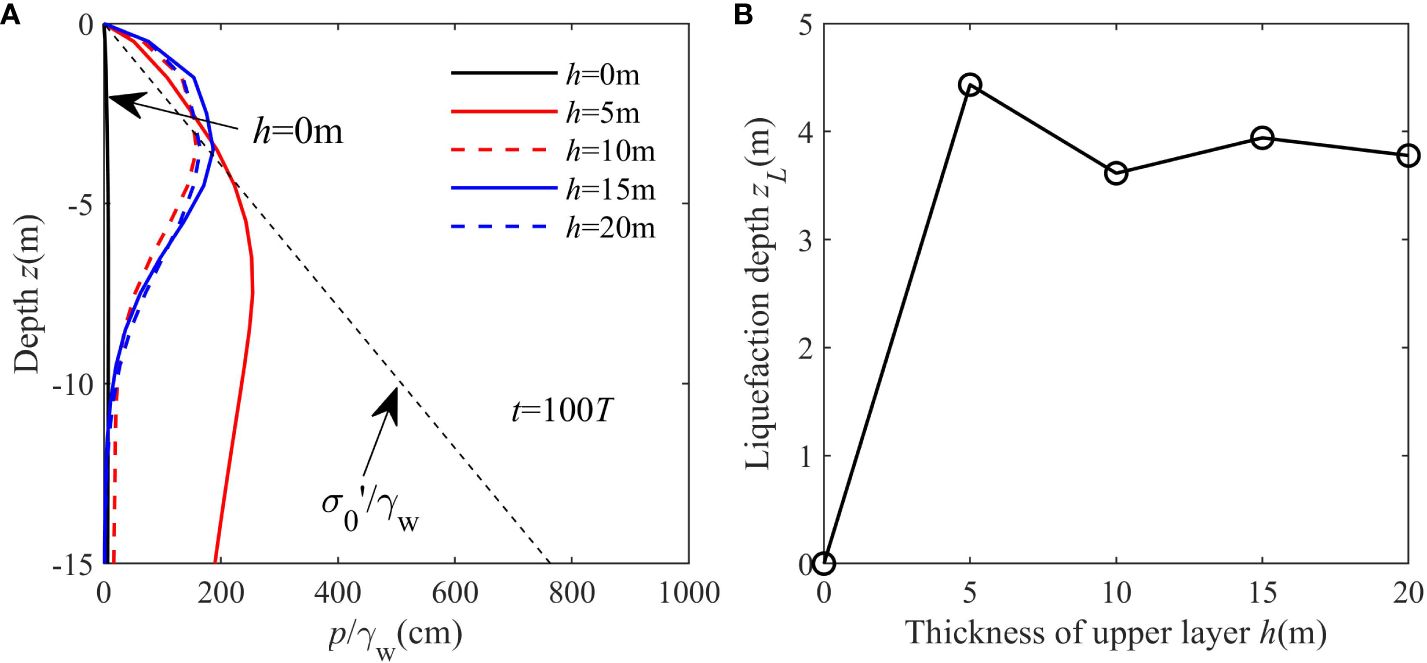
Figure 13 Vertical distribution of (A) residual pore pressure pr and (B) liquefaction depth zL with various coverage thicknesses of the upper silt layer.
Figure 14 depicts the influence of permeability (k), Young’s modulus (E) of the upper silt layer, and water depth (d) on the liquefaction depth. Same as Figure 13A, the dashed lines in Figures 14A, C, E mark the soil initial effective stresses. It is evident that the liquefaction depth substantially diminishes with an increase in the permeability of the upper silt layer, as displayed in Figure 14A. An increase in permeability is anticipated to facilitate the dissipation of accumulated pore pressure, leading to a reduction in the liquefaction depth. In addition, Figure 14B shows that increasing the Young’s modulus first increases the liquefaction depth to the peak (zL = 3.85 m) and then decreases it. This phenomenon is attributed to the non-monotonic impact of Young’s modulus on pore pressure, as demonstrated in Figure 8B. Furthermore, Figure 14C illustrates the effects of water depth (d) on the liquefaction depth of a layered seabed, where it is evident that the liquefaction depth decreases with increasing water depth. In practical engineering contexts, this implies that liquefaction is more likely to occur in relatively shallow water.
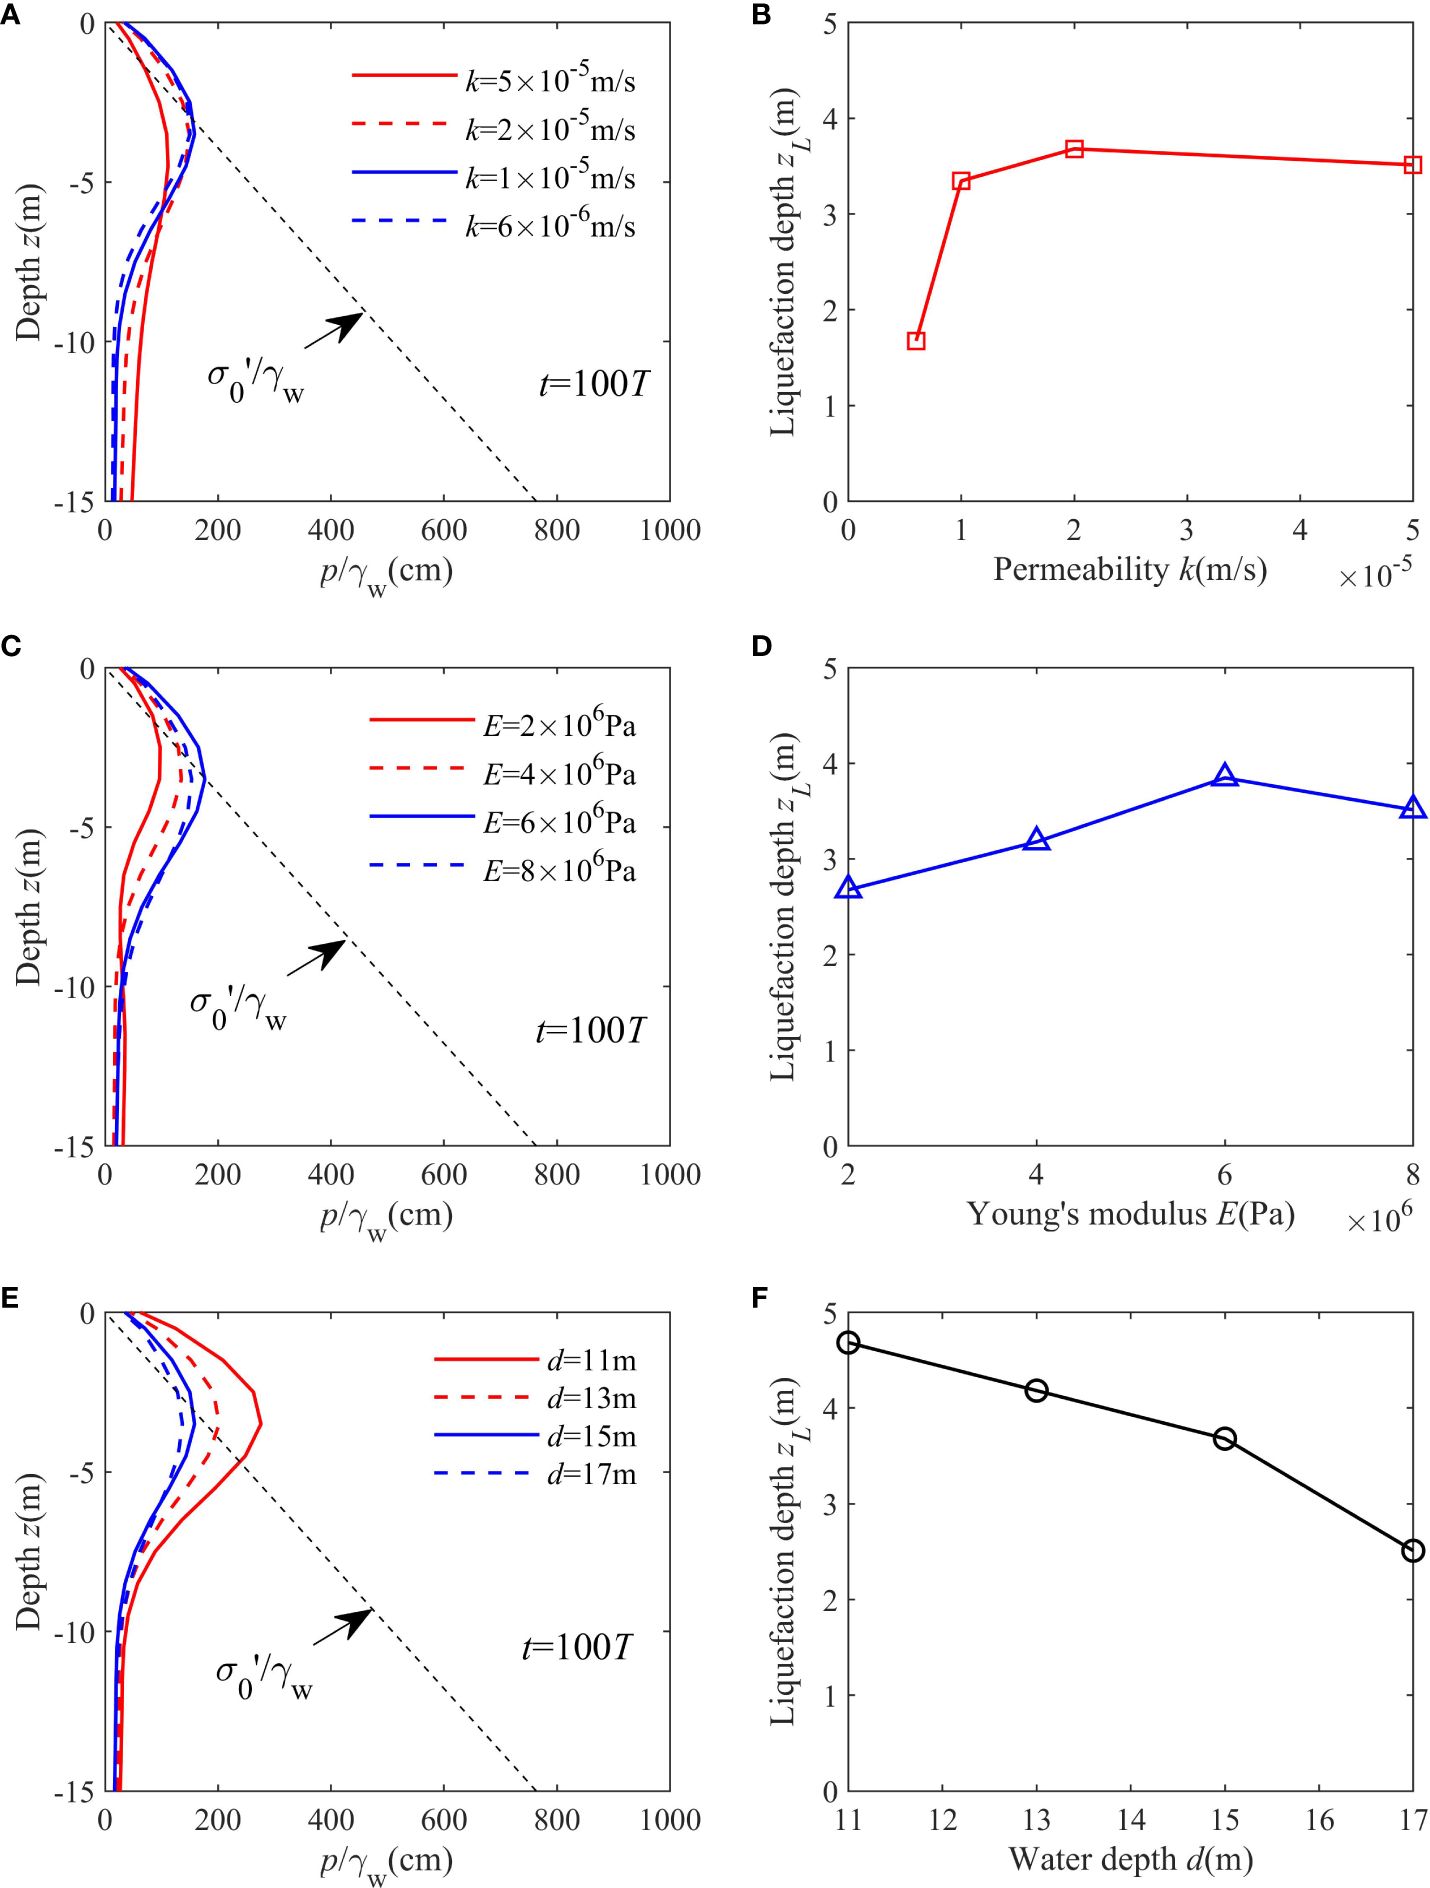
Figure 14 Effects of permeability k and Young’s modulus E of the upper silt layer and the water depth d on Vertical distribution of (A, C, E) residual pore pressure pr and the (B, D, F) liquefaction depth zL.
4 Discussion
Based on the simulation results, the effect of an upper-coverage silt layer on the seabed pore pressure development and liquefaction potential has been investigated in detail in the present study. This form of layer is common in the real marine environment, resulting in low permeability and drainage in the shallow seabed, where is the primary occurrence of wave-induced pore pressure buildup and liquefaction takes place (Sumer, 2014). Based on the geological survey results (like Figure 2 in Jeng et al. (2019)), the existence of this form of layered seabed (the upper-coverage silt layer) in reality can be demonstrated. The present case setup is similar to the “Type C” in Jeng et al. (2019).
Regarding the effect of Young’s modulus on the pore pressure accumulation. Figures 12D–F suggest that both the abilities of pore pressure generation and dissipation are enhanced with increasing Young’s modulus, which agrees with previous studies on the seabed oscillatory response (such as Thomas, 1989, 1995; Hsu et al., 1995; Jeng, 2012). Consequently, unlike permeability, there exists no monotonic correlation between E and the affected pore pressure. This underscores the complex influence of E on pore pressure, contingent upon the specific input values for the calculation. Notably, a substantial surge in shear stresses and shear stress ratio are observed at the interface between the upper silt layer and lower sand layer, particularly noticeable when E is relatively low. This is mainly caused by the significant change in soil properties between the two layers. However, this happens at a relatively deep location of z/htotal = −0.2, where the overburden pressure is much larger. Therefore, a relatively small source term (f) exists that does not affect the maximum pore pressure that much in the upper silt layer (Figure 8B).
We have observed that the thickness of the coverage layer plays a pivotal role in shaping the pattern of pore pressure development along the seabed depth. The simulation results reveal that the maximum residual pore pressure and liquefaction depth occur in scenarios featuring a medium-thickness upper layer (5 meters in this study), as depicted in Figures 7, 13. The intricate dynamics leading to this outcome have been thoroughly examined through the lens of pore pressure generation and dissipation, elucidated in Figure 11. This emphasizes the imperative consideration of the liquefaction risk associated with relatively thin silt upper layers in the design of marine and offshore engineering projects. Simultaneously, a notable concern arises when employing the ‘top layer replacement’ strategy to augment seabed bearing capacity. The comparative permeability of coarse sand, in contrast to silt, facilitates easier penetration of dynamic wave pressure, thereby intensifying the downward transmission of dynamic pressure. If permeability is sufficiently elevated or the thickness of the replacement layer fails to appreciably attenuate wave energy, it is equivalent to the marginally weakened waves act on the surface of the silt layer. Assuming an initially substantial upper-coverage layer, e.g., 10 meters or more, replacing a segment with coarse sand could reduce the thickness of the silt layer to a ‘medium thickness’. This scenario may amplify liquefaction potential compared to the original seabed conditions. Consequently, we advocate for the careful consideration of this prospect in the strategic implementation of top layer replacement in engineering designs.
It should also be noted from Figures 7, 13 that, when the thickness of the upper-coverage silt layer is larger enough (about 7 m in the present study), the effect of the upper-layer thickness on the pore pressure accumulation and liquefaction becomes negligible. At this situation, the seabed can be seen as a pure silt seabed, the effect of the lower sand layer can be neglected (because the pore pressure cannot penetrate the upper layer to reach there). This means the layered seabed with a sufficiently thick low permeable top layer can be considered as homogeneous. It proposes a simplified approach to preliminarily evaluate the liquefaction potential of the multi-layered seabed in engineering designs.
The effect of coverage thickness on pore pressure and liquefaction potential is determined by two important parameters, shear stress ratio (χ) and normalized spreading parameter (S), which can be seen as the mechanism behind the seabed response. The former represents the “generation power” while the latter denotes “dissipation potential” for residual pore pressure and liquefaction. This phenomenon occurs in the layered seabed as well as in any general seabed, where the type of seabed affects the balance between these two parameters. For the present study, an increase in the upper silt layer’s thickness corresponds to an increase in the generation power and a decrease in the dissipation potential, as shown in Figure 11B. This results in a complex trend of pore pressure, which includes an “increase-decrease” pattern, as illustrated in Figure 11A.
5 Conclusions
The numerical investigation of wave-induced residual response and liquefaction in a silt-coarse sand layered seabed was conducted. The model’s accuracy was initially verified through comparison with established analytical solutions and experimental data, demonstrating a reasonable level of agreement. Subsequently, the study meticulously examined the influence of various factors, including the coverage thickness, permeability, Young’s modulus of the upper silt layer, and water depth, on pore pressure accumulation and liquefaction. The underlying mechanisms driving these effects were elucidated through a comprehensive quantitative analysis of the power (shear stress ratio) and dissipation (effective spreading parameter) involved in pore pressure accumulation. The following conclusions were drawn:
(1) The influence of silt coverage on the response and liquefaction behavior of silt-coarse sand layered seabed is notably substantial.
(2) The vertical pore pressure consistently declines as the permeability of the upper silt layer and water depth increase. However, when it comes to increasing the Young’s modulus, the trend in pore pressure is no longer monotonic and varies depending on the specific values chosen.
(3) For the silt-coarse sand layered seabed, the potential liquefaction depth primarily depends on the soil properties of the upper silt layer and water depth. For instance, the seabed is prone to liquefaction with lower permeability in the upper silt layer and shallow water conditions.
(4) The shear stress ratio (τ/σ0’) and the effective normalized spreading parameter (Se) within the soil are the two primary factors that dictate the accumulation of pore pressure and the potential depth of liquefaction in a layered seabed.
Limitation and future work
The present model is based on the parameterized linear-elastic assumption, where the pore pressure accumulation is driven by an empirical source term (Equation 7). This method was first proposed by Seed and Rahman (1978) and continued to be developed in the following decades (McDougal et al., 1989; Cheng et al., 2001; Jeng and Seymour, 2007; Jeng et al., 2007; Sumer et al., 2012; Sumer, 2014; Jeng and Zhao, 2015; Sui et al., 2019b). Although its feasibility in predicting the pore pressure accumulation and residual liquefaction has been demonstrated by these studies, the model doesn’t include the following two major characteristics of the wave-induced residual liquefaction, namely the progressive nature of liquefaction and principal stress axes rotations (Sassa and Sekiguchi, 1999, 2001; Sassa et al., 2001). According to the research by Sassa et al. (2001) and Miyamoto et al. (2004), the liquefied soil under waves can be seen as a high-density inviscid fluid that has a mass density of liquefied soil. The interface between the liquefied soil and the unliquefied soil is treated as a moving boundary. The present model focuses on the liquefaction potential with a basic assumption that the seabed is in solid phase. Simulations for the soil behavior in liquid phase need to be more sophisticated e.g. the elastoplastic model which will be included in the future studies.
Data availability statement
The original contributions presented in the study are included in the article/supplementary material. Further inquiries can be directed to the corresponding author. The code used in the present study is named WINBED (Wave INduced seaBED response) which is a self-developed program. It is capable to simulate oscillatory (WINBED 1.0, Sui et al., 2016) and residual response (WINBED 2.0, Sui et al., 2019) with non-homogeneous soil properties. The code is currently open-sourced if being requested.
Author contributions
TS: Funding acquisition, Methodology, Software, Writing – original draft, Writing – review & editing. MY: Investigation, Methodology, Validation, Writing – original draft, Writing – review & editing. LP: Data curation, Writing – review & editing. JC: Supervision, Visualization, Writing – review & editing. CZ: Methodology, Supervision, Writing – review & editing. JZ: Methodology, Supervision, Writing – review & editing.
Funding
The author(s) declare financial support was received for the research, authorship, and/or publication of this article. This work was supported by the National Natural Science Foundation of China (52271274, 51909076), the Key Laboratory of Ministry of Education for Coastal Disaster and Protection, Hohai University (202205).
Acknowledgments
The authors thank Hohai University for the venue support.
Conflict of interest
The authors declare that the research was conducted in the absence of any commercial or financial relationships that could be construed as a potential conflict of interest.
Publisher’s note
All claims expressed in this article are solely those of the authors and do not necessarily represent those of their affiliated organizations, or those of the publisher, the editors and the reviewers. Any product that may be evaluated in this article, or claim that may be made by its manufacturer, is not guaranteed or endorsed by the publisher.
References
Alba P. D., Seed H. B., Chan C. K. (1976). Sand liquefaction in large-scale simple shear tests. J. Geotech Eng. Div. 102, 909–927. doi: 10.1061/AJGEB6.0000322
Cai F., Cao C., Qi H. S., Su X. Z., Lei G., Liu J. H. (2022). Rapid migration of mainland China’s coastal erosion vulnerability due to anthropogenic changes. J. Environ. Manag 319, 1–15. doi: 10.1016/j.jenvman.2022.115632
Cheng L., Sumer B. M., Fredsøe J. (2001). Solutions of pore pressure build up due to progressive waves. Int. J. Numer. Anal. Meth. Geomech. 25, 885–907. doi: 10.1002/nag.159
De Groot M. B., Kudella M., Meijers P., Oumeraci H. (2006). Liquefaction phenomena underneath marine gravity structures subjected to wave loads. J. Waterway Port Coast. Ocean Eng. 132, 325–335. doi: 10.1061/(ASCE)0733-950X(2006)132:4(325)
Duan L. L., Wang D. Y. (2020). Novel three-dimensional numerical model for residual seabed response to natural loadings near a single pile. Appl. Ocean Res. 94, 102004. doi: 10.1016/j.apor.2019.102004
He Y. Y., Liu J. H., Cai F., Li B. L., Qi H. S., Zhao S. H. (2022). Aeolian sand transport influenced by tide and beachface morphology. Geomorphology 396, 107987. doi: 10.1016/j.geomorph.2021.107987
Hsu J. R. C., Jeng D. S., Lee C. P. (1995). Oscillatory soil response and liquefaction in an unsaturated layered seabed. Int. J. Numer. Anal. Meth. Geomech. 19, 825–849. doi: 10.1002/nag.1610191202
Jeng D. S. (1997). Wave-induced seabed instability in front of a breakwater. Ocean Eng. 24, 887–917. doi: 10.1016/S0029-8018(96)00046-7
Jeng D. S. (2012). Porous Models for Wave-Seabed Interactions (Springer Science and Business Media). doi: 10.1007/978-3-642-33593-8
Jeng D. S., Chen L., Liao C. C., Tong D. G. (2019). A numerical approach to determine wave (current)-induced residual responses in a layered seabed. J. Coast. Res. 35, 1271–1284. doi: 10.2112/JCOASTRES-D-19-00023.1
Jeng D. S., Seymour B. R. (2007). Simplified analytical approximation for pore-water pressure buildup in marine sediments. J. Waterway Port Coast. Ocean Eng. 133, 309–312. doi: 10.1061/(ASCE)0733-950X(2007)133:4(309)
Jeng D. S., Seymour B. R., Li J. (2007). A new approximation for pore pressure accumulation in marine sediment due to water waves. Int. J. Numer. Anal. Meth. Geomech. 31, 53–69. doi: 10.1002/nag.547
Jeng D. S., Ye J. H., Zhang J. S., Liu P. L.-F. (2013). An integrated model for the wave-induced seabed response around marine structures: Model verifications and applications. Coast. Eng. 72, 1–19. doi: 10.1016/j.coastaleng.2012.08.006
Jeng D. S., Zhao H. Y. (2015). Two-dimensional model for accumulation of pore pressure in marine sediments. J. Waterway Port Coast. Ocean Eng. 141, 04014042. doi: 10.1061/(ASCE)WW.1943-5460.0000282
Kirca V. S. O., Sumer B. M., Fredsøe J. (2014). Influence of clay content on wave-induced liquefaction. J. Waterway Port Coast. Ocean Eng. 140, 04014024. doi: 10.1061/(ASCE)WW.1943-5460.0000249
Li Y. Z., Ong M. C., Tang T. (2018). Numerical analysis of wave-induced poro-elastic seabed response around a hexagonal gravity-based offshore foundation. Coast. Eng. 136, 81–95. doi: 10.1016/j.coastaleng.2018.02.005
Liu S. S., Cai F., Qi H. S., Liu J. H., Yang W., Liu G. (2023a). Economic contribution of beach resources and their sustainable development in China. Ocean Coast. Management. 239, 106598. doi: 10.1016/j.ocecoaman.2023.106598
Liu T., Wei G. L., Kou H. L., Guo L. (2019). Pore pressure observation: pressure response of probe penetration and tides. Acta Oceanolog Sin. 38, 107–113. doi: 10.1007/s13131-019-1462-4
Liu T., Zhang Y., Meng Q. S. (2023b). Numerical investigation and design of suction caisson for on-bottom pipelines under combined V-H-M-T loading in normal consolidated clay. Ocean Eng. 274, 113997. doi: 10.1016/j.oceaneng.2023.113997
McDougal W. G., Tsai Y. T., Liu P. L., Clukey E. C. (1989). Wave-induced pore water pressure accumulation in marine soils. J. Offshore Mech. Arct. Eng. 111, 1–11. doi: 10.1115/1.3257133
Miyamoto J., Sassa S., Sekiguchi H. (2004). Progressive solidification of a liquefied sand layer during continued wave loading. Géotechnique 54, 617–629. doi: 10.1680/geot.2004.54.10.617
Miyamoto J., Sassa S., Tsurugasaki K., Sumida H. (2020). Wave-induced liquefaction and floatation of a pipeline in a drum centrifuge. J. Waterway Port Coast. Ocean Eng. 146, 04019039. doi: 10.1061/(ASCE)WW.1943-5460.0000547
Miyamoto J., Sassa S., Tsurugasaki K., Sumida H. (2021). Wave-induced liquefaction and instability of offshore monopile in a drum centrifuge. Soils Found. 61, 35–49. doi: 10.1016/j.sandf.2020.10.005
Muñoz-Perez J. J., Khan-Mozahedy A. B. M., Neves M. G., Tejedor B., Gomez-Pina G., Campo J. M., et al. (2015). Sinking of concrete modules into a sandy seabed: A case study. Coast. Eng. 99, 26–37. doi: 10.1016/j.coastaleng.2015.02.012
Pastor M., Zienkiewicz O. C., Chan A. H. C. (1990). Generalized plasticity and the modelling of soil behaviour. Int. J. Numer Anal. Methods Geomech. 14, 151–190. doi: 10.1002/nag.1610140302
Peacock W. H., Seed H. B. (1968). Sand liquefaction under cyclic loading simple shear conditions. J. Soil Mech. Found Eng. Div 94, 689–708. doi: 10.1061/JSFEAQ.0001135
Qi W. G., Li C. F., Jeng D. S., Gao F. P., Liang Z. (2019). Combined wave-current induced excess pore-pressure in a sandy seabed: Flume observations and comparisons with theoretical models. Coast. Eng. 147, 89–98. doi: 10.1016/j.coastaleng.2019.02.006
Sassa S., Sekiguchi H. (1999). Wave-induced liquefaction of beds of sand in a centrifuge. Géotechnique 49, 621–638. doi: 10.1680/geot.1999.49.5.621
Sassa S., Sekiguchi H. (2001). Analysis of wave-induced liquefaction of sand beds. Géotechnique 51, 115–126. doi: 10.1680/geot.2001.51.2.115
Sassa S., Sekiguchi H., Miyamoto J. (2001). Analysis of progressive liquefaction as a moving-boundary problem. Géotechnique 51, 847–857. doi: 10.1680/geot.2001.51.10.847
Sassa S., Takayama T., Mizutani M., Tsujio D. (2006). Field observations of the build-up and dissipation of residual pore water pressures in seabed sands under the passage of storm waves. J. Coast. Res. 39, 410–414.
Seed H. B., Rahman M. S. (1978). Wave-induced pore pressure in relation to ocean floor stability of cohesionless soils. Mar. Georesour. Geotechnol. 3, 123–150. doi: 10.1080/10641197809379798
Sekiguchi H., Kita K., Okamoto O. (1995). Response of poro-elastoplastic beds to standing waves. Soils Found. 35, 31–42. doi: 10.3208/sandf.35.31
Sui T. T., Jin Y., Wang Z. J., Zhang C., Shi J. (2019a). Effects of the soil property distribution gradient on the wave-induced response of a non-homogeneous seabed. J. Mar. Sci. Eng. 7, 281. doi: 10.3390/jmse7080281
Sui T. T., Kirca V. S. O., Sumer B. M., Carstensen S., Fuhrman D. R. (2022). Wave induced liquefaction in a silt and seashell mixture. Coast. Eng. 178, 104215. doi: 10.1016/j.coastaleng.2022.104215
Sui T. T., Sumer B. M., Kirca V. S. O., Carstensen S., Zheng J. H., Fuhrman D. R. (2023). Effect of history of wave exposure on seabed liquefaction. Coast. Eng. 183, 104307. doi: 10.1016/j.coastaleng.2023.104307
Sui T. T., Zhang C., Guo Y. K., Zheng J. H., Jeng D. S., Zhang J. S., Zhang W. (2016). Three-dimensional numerical model for wave-induced seabed response around mono-pile. Ships Offshore Struc. 11(6), 667–678. doi: https://doi.org/10.1080/17445302.2015.1051312
Sui T. T., Zhang C., Jeng D. S., Guo Y. K., Zheng J. H., Zhang W., et al. (2019b). Wave- induced seabed residual response and liquefaction around a mono-pile foundation with various embedded depth. Ocean Eng. 173, 157–173. doi: 10.1016/j.oceaneng.2018.12.055
Sui T. T., Zhang C., Zheng J. H., Guo Y. K., Xie M. G. (2018). Numerical study of standing wave- induced seabed residual response with the non-homogeneous soil property. J. Coast. Res. 85, 921–925. doi: 10.2112/SI85-185.1
Sumer B. M., Cheng N. S. (1999). “A random-walk model for pore pressure accumulation in marine soils,” in The Ninth International Of fshore and Polar Engineering Conference, OnePetro. France. 1:521–526.
Sumer B. M., Fredsøe J. (2002). The Mechanics of Scour in the Marine Environment Vol. 17 (World Scientific). doi: 10.1142/ASOE
Sumer B. M., Ozgur Kirca V., Fredsøe J. (2012). Experimental validation of a mathematical model for seabed liquefaction under waves. Int. J. Offshore Polar Eng. 22, 133–141.
Thomas S. D. (1989). A finite element model for the analysis of wave induced stresses, displacements and pore pressures in an unsaturated seabed I: theory. Comput. Geotech 8, 1–38. doi: 10.1016/0266-352X(89)90055-4
Thomas S. D. (1995). A finite element model for the analysis of wave induced stresses, displacements and pore pressures in an unsaturated seabed II: Model verification. Comput. Geotech 17, 107–132. doi: 10.1016/0266-352X(95)91305-N
Yamamoto T., Koning H. L., Sellmeijer H., Hijum E. V. (1978). On the response of a poro-elastic bed to water waves. J. Fluid Mech. 87, 193–206. doi: 10.1017/S0022112078003006
Zhang C., Sui T. T., Zheng J. H., Xie M. X., Nguyen V. T. (2016). Modelling wave-induced 3D non-homogeneous seabed response. Appl. Ocean Res. 61, 101–114. doi: 10.1016/j.apor.2016.10.008
Zienkiewicz O. C., Chang C. T., Bettess P. (1980). Drained, undrained, consolidating and dynamic behaviour assumptions in soils. Géotechnique 30, 385–395. doi: 10.1680/geot.1980.30.4.385
Appendix: definition of the effective normalized dissipation parameter Se
The effective normalized spreading parameter Se is defined under the assumption that the accumulated pore pressure primarily spreads upward from the inner seabed to the surface. This assumption is justified by the impermeable nature of the seabed bottom and the zero pore pressure boundary condition at the seabed surface. Consequently, the effectiveness of pore pressure dissipation is primarily influenced by the coverage thickness above the specific point of interest.
Figure 10 Sketch map for the definition of effective spreading parameter Se shows a sketch map of the definition of the effective spreading parameter Se. The spreading parameters in the upper silt layer and lower sand layer are denoted as S and S0, respectively. Point A is a point of concern with a vertical distance z (the upward direction is positive) from the seabed surface. The effective normalized spreading parameter Se is expressed.
The effective normalized spreading parameter Se is expressed in Equation A1.
Keywords: seabed response, layered seabed, pore pressure accumulation, liquefaction, numerical simulation
Citation: Sui T, Yang M, Peng L, Chen J, Zhang C and Zheng J (2024) Wave-induced residual response and liquefaction of a nonhomogeneous layered seabed. Front. Mar. Sci. 11:1360641. doi: 10.3389/fmars.2024.1360641
Received: 23 December 2023; Accepted: 15 March 2024;
Published: 02 April 2024.
Edited by:
Juan Jose Munoz-Perez, University of Cádiz, SpainReviewed by:
Tao Liu, Ocean University of China, ChinaShinji Sassa, Port and Aviation Technology, Japan
Copyright © 2024 Sui, Yang, Peng, Chen, Zhang and Zheng. This is an open-access article distributed under the terms of the Creative Commons Attribution License (CC BY). The use, distribution or reproduction in other forums is permitted, provided the original author(s) and the copyright owner(s) are credited and that the original publication in this journal is cited, in accordance with accepted academic practice. No use, distribution or reproduction is permitted which does not comply with these terms.
*Correspondence: Titi Sui, dHRzdWlAaGh1LmVkdS5jbg==