 Meredith Sherrill1*
 Alexandre Bernier-Graveline2
 Jessica Ewald3Zhiqiang Pang3Michel Moisan2Mathieu Marzelière2
 Maris Muzzy4
 Tracy A. Romano5,6Robert Michaud2
 Jonathan Verreault1*
- 1Centre de recherche en toxicologie de l'environnement (TOXEN), Département des sciences biologiques, Université du Québec à Montréal, Montreal, QC, Canada
- 2Groupe de recherche et d’éducation sur les mammifères marins, Tadoussac, QC, Canada
- 3Institute of Parasitology, McGill University, Sainte-Anne-de-Bellevue, QC, Canada
- 4Animal Care & Science Division, John G. Shedd Aquarium, Chicago, IL, United States
- 5Sea Research Foundation, Inc. D/B/A Mystic Aquarium, Research Department, Mystic, CT, United States
- 6Department of Marine Sciences, University of Connecticut, Groton, CT, United States
The St. Lawrence Estuary (SLE) belugas (Quebec, Canada) are an endangered population whose numbers remain low despite ongoing conservation efforts. Multiple anthropogenic factors and changing environmental conditions are thought to have contributed to the recent 20-year decline in blubber fatty acid concentrations reported in stranded SLE belugas. Despite this evidence that energy reserves within the population are declining, there is currently no method for estimating the body condition of free-ranging animals. The potential metabolic consequences of declining fat reserves have also yet to be explored. The objectives of this study were to use unmanned aerial vehicle (UAV)-based photogrammetry to estimate the scaled mass index (SMI) of free-ranging SLE belugas, and to compare this proxy of body condition to the lipidome of outer-layer blubber samples collected from the same individuals via remote biopsy darting. Morphometric analysis of aerial images (n = 44 SLE belugas), combined with data collected from animals under professional human care, produced SMI estimates (females: 807 ± 98 kg, males: 743 ± 39 kg) similar in range to those previously calculated for SLE beluga carcasses of known weight. A non-targeted lipidomic analysis followed by pathway enrichment analysis, identified metabolic pathways predicted to show altered activity in association with SMI in the blubber of free-ranging male SLE belugas (n = 27). Mapping of enriched pathways compared to the Kyoto Encyclopedia of Genes and Genomes (KEGG) metabolic pathways maps, revealed that enriched pathways pertained to the metabolism of multiple lipid classes including fatty acyls and glycerophospholipids. Vitamin A, Vitamin E, and tyrosine metabolism pathways were also enriched in correlation with SMI. This study provides the basis for the development of a non-invasive technique for estimating the body condition of free-ranging SLE belugas and identifies metabolic pathways that merit further exploration to improve our understanding of the potential metabolic impacts of energy loss in cetaceans.
1 Introduction
The St. Lawrence Estuary (SLE; Quebec, Canada) belugas (Delphinapterus leucas) are a genetically and geographically distinct population that is considered endangered according to both the Species at Risk Act (DFO, 2012) and the Committee on the Status of Endangered Wildlife in Canada (COSEWIC, 2014). Despite a 40-year ban on commercial hunting and ongoing conservation efforts, the population’s numbers remain low. Bernier-Graveline et al. (2021) recently demonstrated that a period of population instability and ecosystem change (1999-2012) (Mosnier et al., 2015) coincided with decreasing fatty acid concentrations in SLE beluga carcass blubber (1998-2016). Combined with a known dietary shift (Lesage, 2014), these results suggest that environmental changes, including shifting prey availability, may have contributed to an overall decline in energy reserves within the population.
While body condition (i.e., energy reserves) in cetaceans has been well-linked to survivorship and reproductive success (Miller et al., 2012; Christiansen et al., 2018; Fearnbach et al., 2018; Stewart et al., 2022), it is logistically challenging to estimate for most cetacean populations. Recently, unmanned aerial vehicle (UAV)-based photogrammetry has become a reliable, non-invasive method of estimating morphometric measurements from free-ranging large cetaceans. This technique has been used to assess the body condition of North Atlantic (Eubalaena glacialis) and southern right whales (Eubalaena australis) (Christiansen et al., 2018, 2019; Stewart et al., 2022), humpback whales (Megaptera novaeangliae) (Christiansen et al., 2016; Aoki et al., 2021; Bierlich et al., 2022), gray whales (Eschrichtius robustus) (Soledade Lemos et al., 2020; Christiansen et al., 2021), blue whales (Balaenoptera musculus) (Durban et al., 2016) and sperm whales (Physeter macrocephalus) (Glarou et al., 2022). In contrast, relatively few studies have adapted aerial photogrammetry techniques to the study of small or medium cetaceans (Fearnbach et al., 2018; Cheney et al., 2022).
Increasing understanding of the complex functions of cetacean blubber has further highlighted the importance of considering energy reserves when assessing the health of both individuals and populations. Blubber is a principal site of energy storage in cetaceans, and it is equally essential to their thermoregulation, buoyancy, and maintenance of a hydrodynamic body shape (reviewed by Iverson and Koopman (2018)). Blubber is also an active endocrine organ, as demonstrated by hormone profiling (Galligan et al., 2019, 2020) and proteomic studies (Kershaw et al., 2018) suggesting that blubber may play a role in lipid metabolism, hormone regulation, immune system response, and intercellular signaling. As cetacean blubber consists primarily of energy-rich triacylglycerides (Krahn et al., 2004; Koopman, 2018), studies of cetacean adipose tissue have primarily focused on triacylglyceride and fatty acid analysis (Koopman et al., 1996; Krahn et al., 2004; Waugh et al., 2012, 2014). However, recent studies (Bernier-Graveline et al., 2021; Bories et al., 2021) have demonstrated that more minor lipid components, such as glycerophospholipids and sphingolipids (both lipid membrane components), can also provide information regarding cetacean life history and physiological state. Specifically, Bernier-Graveline et al. (2021) investigated the relationships between body condition (animals grouped according to scaled mass index; SMI) and a wide range of lipid metabolites within blubber samples collected from SLE beluga carcasses. Changes in body condition were found to be associated with changes in both energy-rich and structural lipid classes. In particular, males in “good” body condition had higher ratios of polyunsaturated fatty acids (PUFA) to monounsaturated fatty acids (MUFA) compared to males in “moderate” or “poor” body condition. Concentrations of several individual sphingolipids and glycerophospholipids (mainly phosphatidylcholines) also varied significantly with body condition when sex was considered as a covariate, suggesting that energy-rich lipids may be selectively mobilized in beluga blubber over structural lipids during periods of energy loss to produce a distinct signature in the lipid profile (Bernier-Graveline et al., 2021).
Despite the multiple essential roles of cetacean blubber, there is currently no method for estimating energy reserves in the free-ranging SLE beluga population. Larrat and Lair (2021) demonstrated that SMI, a mass-based proxy of body condition that removes the expected positive relationship between body size and body weight (Peig and Green, 2009), showed good agreement with a visual evaluation (Larrat et al., 2019) of the body condition of adult beluga carcasses. The objective of this study was therefore to estimate the SMI of free-ranging SLE belugas via aerial photogrammetry and to use this metric of body condition to identify metabolic pathways within the outer-layer blubber that may be affected by decreasing energy reserves. SMI was calculated based on body volume estimates obtained via aerial photogrammetry (Christiansen et al., 2018). Body volume estimates of the SLE belugas were converted to mass (and SMI) using a total body density estimate informed by vertical images and body mass data collected from belugas under professional human care. Remote biopsy darting of the free-ranging SLE belugas paired with a non-targeted lipidomic analysis was used to explore the outer-layer blubber lipidome. Based on Bernier-Graveline et al. (2021), we hypothesized that pathways related to the metabolism of both glycerophospholipids and fatty acids are correlated with SMI. Techniques developed for this study (i.e., the calculation of SMI from aerial images) will provide an important, minimally-invasive tool for the long-term monitoring of energy reserves within the SLE beluga population, and may be applicable to the study of other smaller cetaceans. Results from this study will also contribute to a better understanding of the pleiotropic roles of cetacean blubber and the potential metabolic implications of energy loss.
2 Materials and methods
2.1 Field sampling
2.1.1 Biopsy collection
Skin and outer-layer blubber tissue samples were collected from the flanks of 17 female and 30 male SLE belugas (Supplementary Table 1) via remote biopsy darting as described by Simond et al. (2019). Sampling was performed within six geographic sectors in the SLE and the Saguenay River (Quebec, Canada; Supplementary Figure 1), with biopsies collected in September-October of 2019 and 2021 using sterilized stainless steel biopsy tips (8 x 25 mm to 8 x 30 mm). Biopsies consisted primarily of skin (i.e., epidermis) and fibrous connective tissue (i.e., dermis), therefore, as in previous studies (Simond et al., 2019, 2020), “blubber” is hereafter used to refer to both dermal and hypodermal tissues. Samples were processed in the field, with subsamples of skin (~40 mg) preserved in a salt-saturated DMSO solution (Seutin et al., 1991), before being sent to Saint Mary’s University (Halifax, NS, Canada) for sexing via PCR (Gilson et al., 1998). In 2019, blubber was separated from the skin on the research vessel prior to being wrapped in solvent-rinsed aluminum foil and flash-frozen in liquid nitrogen. In 2021, blubber and skin were flash-frozen together. In both cases, samples were then stored at -80°C prior to analysis. Dorsal flank photos of all biopsied animals were also collected during the sampling using a Nikon D7500 camera for photo-ID purposes. The color (white or grey) of biopsied animals was recorded to serve as a general proxy for age class (Stewart et al., 2006).
2.1.2 Unmanned aerial vehicle imaging
Aerial video footage of belugas near the research vessel was collected concurrently with the biopsies in both 2019 and 2021 via unmanned aerial vehicle (UAV). Biopsy collection was recorded in the video footage whenever possible. The 2019 UAV setup consisted of a DJI M200 and Zenmuse X5s camera with an Olympus Zuiko 45mm lens, while a DJI Inspire II equipped with a Zenmuse X7 with a DJI DL 50mm F2.8 lens was used in 2021 (Supplementary Table 2). During both sampling years, flight altitude was measured by a Lightware LiDAR SF11/C with the drone’s barometer altimeter used as a backup when necessary. All videos were recorded with the camera angled vertically at 90° and included the recording of a known-size control object (Control 1: actual size: 50cm; mean ± SD: 50 ± 0.01 cm, Control 2: actual size: 40 cm; mean ± SD: 39 cm ± 0.01 cm, Control 3: actual size: 10 cm; mean ± SD: 10 ± 0.005 cm). No significant differences were found between the control measurements as measured in 2019 versus 2021 (data not shown) despite the different UAV setups.
2.2 Morphometric analysis
2.2.1 Image processing and animal identification
When biopsies were not recorded “live” in the video footage, biopsied animals were identified in aerial videos by their unique markings (i.e., photo-ID). Overhead still dorsal images of the animals positioned flat at the surface of the water were then extracted from the videos for morphometric analysis using Final Cut Pro Version 10.5.1 (Apple Inc., Cupertino, CA, USA). The image scoring criteria developed by Christiansen et al. (2018) were modified for this study to better evaluate the range of body positions observed in the aerial footage and the quality of extracted still images. Images were scored between 1 (good) and 4 (poor) for straightness, roll, pitch, head arch, body arch, and tail arch, and between 1-5 (good to poor) for length measurability and width measurability (Supplementary Table 3). Photos which scored ≥ 3 for head or body arch, ≥ 4 for body roll or tail arch, or a 5 for either measurability criteria were excluded from further analysis. Photos were not excluded based on their straightness or pitch scores, although no images scored higher than a 2 for pitch within this study. Additionally, overhead still lateral images were extracted of any animals (biopsied or non-biopsied) that were observed rolling, provided that a flat dorsal image meeting the scoring criteria could also be extracted.
2.2.2 Morphometric measurements and body volume estimation
MorphoMetriX 1.0 (Torres and Bierlich, 2020) was used to estimate total body length (measured from the tip of the melon to the notch of the tail fluke) and a series of body widths at 5% intervals along the total length of all biopsied animals (Christiansen et al., 2019; Figure 1A). Extracted still image of rolling animals were used to estimate body height measurements at the same 5% increments (Figure 1B). Body height to width ratios of these rolling animals were then calculated at each 5% increment to develop as set of average ratios describing the body shape of a beluga. Body volumes of all biopsied animals were then estimated using these average ratios by modeling each animal’s cross-sectional shape as a series of ellipses between adjacent measurement sites (Christiansen et al., 2019). Due to decreased precision when measuring the smaller body widths near the peduncle, dorsal width measurements for each animal at measurement sites between 80-95% of the total length were estimated via linear interpolation, similar to in Christiansen et al. (2019). Body height at 95% of the total length was also estimated via linear interpolation, as its measurability depended on the position of the tail fluke.
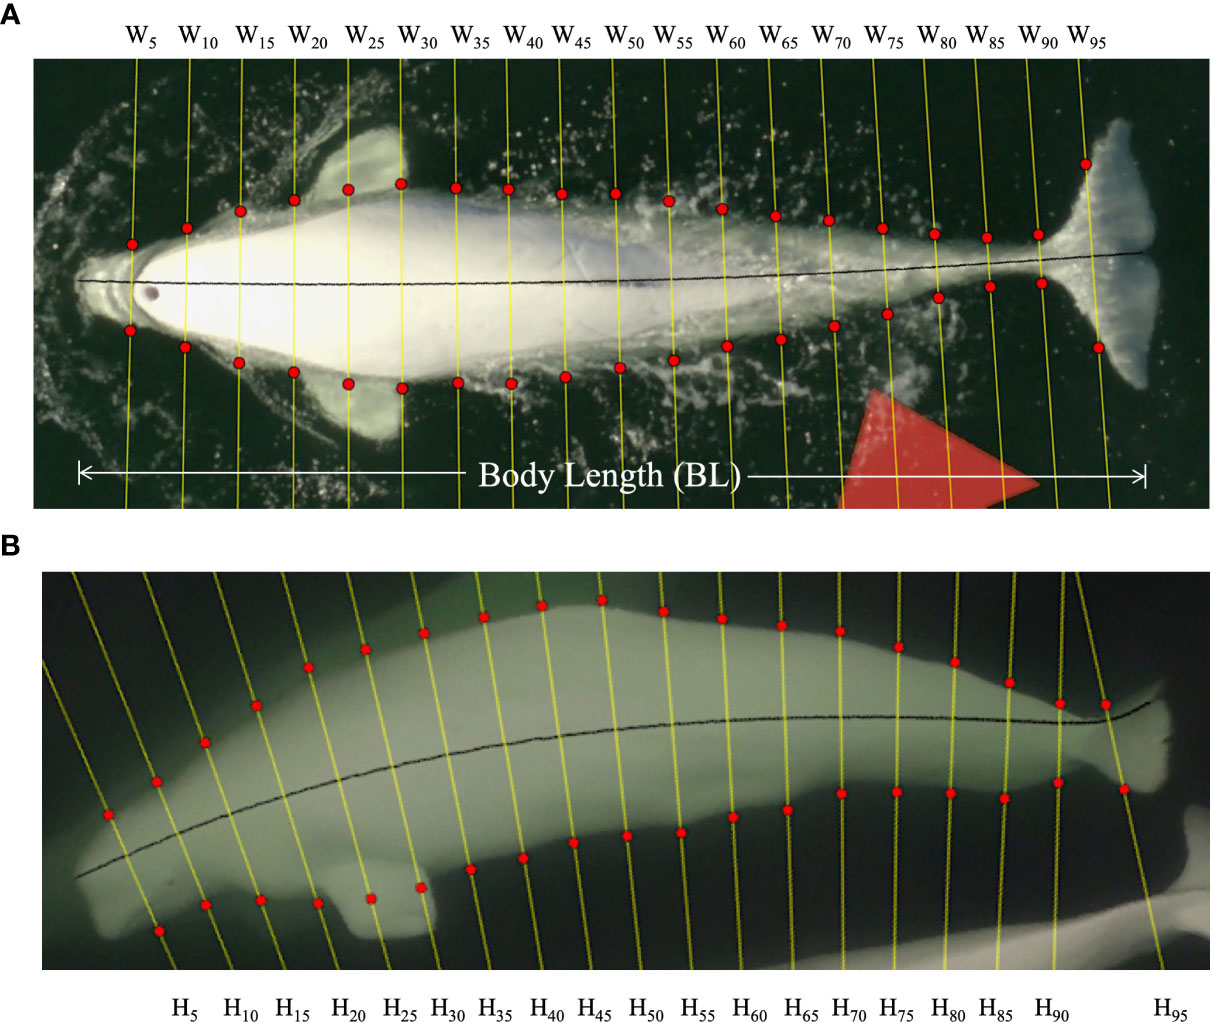
Figure 1 Example aerial dorsal (A) and lateral images (B) of a SLE beluga as used to extract (MorphoMetriX) total body length (BL) in addition to width (W) and height (H) measurements along 5% increments of the total body length for morphometric analysis.
2.2.3 Beluga density estimate
Total body length and a series of width measurements (as well as measurements of a known-size control object) were collected using the method described above (Section 2.2.2) from dorsal and lateral still vertical images (setup details described in Supplementary Table 4) of belugas (n = 9) under professional human care at the John G. Shedd (Chicago, IL, USA) and Mystic (Mystic, CT, USA) aquariums. Images were selected for morphometric analysis using the scoring criteria described above (Section 2.2.1). Similarly, height to width ratios were calculated for each animal, and their volumes were estimated from their individual ratios using the elliptical modeling technique (Christiansen et al., 2019). Each individual animal’s total body density was estimated by dividing their known body weight by their volume (animals weighed within two weeks of vertical image collection; Supplementary Table 5).
2.2.4 Scaled mass index calculation
Total body densities of the aquarium animals were averaged to produce a mean total body density estimate, which was then used to estimate the body mass of all biopsied SLE belugas. The SMI ( of biopsied individuals then was calculated according to the following equation (Peig and Green, 2009):
Where is the average estimated mass of an individual, BLi is the average length of that individual as estimated from aerial images, and BL0 is the average length of all individuals in the population (also as estimated from aerial images). The slope coefficient, , was calculated from a standardized major axis regression applied to ln-transformed total length and body mass data (Supplementary Figure 2).
2.3 Lipidomic analysis
2.3.1 Non-targeted analysis and data preprocessing
Aliquots of blubber (5-25 mg) from 44 biopsied free-ranging SLE belugas (17 females, 27 males) with aerial images meeting the quality criteria for morphometric analysis, were shipped on dry ice to the University of Victoria Genome BC Proteomics Centre (Victoria, BC, Canada) for non-targeted lipidomic analysis. Lipids were extracted using a mixed solvent of isopropanol-chloroform (4:1, v:v) as described in the SI. A quality control (QC) sample was prepared by pooling 10 μL aliquots of the lipid extracts from all analyzed samples. Non-targeted analysis was performed using an Ultimate 3000 ultra-high-performance liquid chromatography (UHPLC) system (Thermo Fischer Inc., Waltham, MA, USA), coupled to an LTQ-Orbitrap Velos Pro mass spectrometer (MS; Thermo Fischer Inc.) with electrospray ionization (ESI). The chromatographic separations were performed using a Waters XBridge BEH C8 XP column (130Å, 2.5 µm, 2.1 mm*50 mm) for binary solvent elution. Data were acquired in positive-ion and negative-ion detection modes (details provided in the SI). Raw data files were processed using XCMS (https://scmsonline.scripps.edu/) with a customized R script (https://www.r-project.org) for peak detection, retention time shift correction, peak grouping, and peak alignment. Mass de-isotoping and chemical background noise removal were also performed, resulting in two raw data peak intensity tables (positive- and negative-ion mode, respectively). Unidentified detected lipid features were characterized by their m/z ratios and retention times.
UHPLC-MS/MS runs were carried out in data-independent acquisition mode using both linear ion-trap collision-induced dissociation (CID) and C-trap high-energy collision-induced dissociation (HCD). The normalized collision energies were 32% to 42% for CID and 28% to 38% for HCD. Briefly, MS2 data processing via MetaboAnalyst 5.0 (Pang et al., 2021) included steps for data deconvolution, searching of weighted spectra against a custom-curated lipidomics database, and scoring of tentative candidate matches (i.e., tentative lipid IDs) based on the MS-DIAL scoring system (Tsugawa et al., 2015) (details provided in SI). For each detected lipid feature, the top five candidate matches were then considered, with tentative lipid superclass and main class identity assigned based on their scores (scores >35 were considered). When necessary, feature retention time and instrument detection mode (positive- or negative-ion) were also considered.
2.3.2 Data processing and statistical analysis
MetaboAnalyst 5.0 (Pang et al., 2021) was used to process and analyze the resulting raw peak intensity tables (MS1 level data). Positive- and negative-ion mode data were processed separately. Features were filtered to remove those with low repeatability (>80% missing values or relative standard deviation > 20% across the QCs removed). Remaining missing values were estimated using single value decomposition. Intensities were normalized by sum, log-transformed and auto-scaled before both modes were merged for further analysis. Initial visualization of the merged dataset via principal component analysis (PCA) identified DLB1911 (a female) as an outlier (data not shown), and this sample was excluded from further analyses. Preliminary analyses also revealed possible collinearity between SMI and the suspected reproductive status of females (data not shown). Females were therefore removed from subsequent analyses. Multivariable linear models were used to identify lipid features associated with SMI in male SLE belugas using the limma R package (Ritchie et al., 2015), as implemented in the multi-factor analysis module in MetaboAnalyst. A combination of supervised and unsupervised approaches was first used to identify relevant covariates from all available metadata (sampling year, biopsied animal color, and geographic sector). Separate linear models that included SMI and relevant covariates as predictors, were fit to the intensities of each individual lipid feature, and model coefficients and their associated p-values were extracted for the SMI term. Associations between individual metadata and lipid features were assessed (Supplementary Table 6). PCA (Supplementary Figure 3) was also used to identify potential surrogate variables (as used in other omics pipelines) for unknown technical or biological factors (Leek et al., 2010). A principal component (PC) was considered for inclusion as a covariate if it was significantly associated with a high number of individual lipid features compared to individual covariates, and was not explained by any recorded metadata. Analysis of covariates resulted in the inclusion of color, sector, and PC1 in the final linear model. The raw p-values (p< 0.05 considered significant) associated with the SMI model term were then used to generate a ranked list of detected lipid features (Supplementary Table 7) for downstream functional analysis.
2.3.3 Functional and network analysis
Functional analysis was performed using the mummichog v2.0 algorithm (see Li et al. (2013) for an explanation of the algorithm) on the top 10% of lipid features (p< 0.1) using a mass accuracy of 5 ppm. Features with [M+H]+, [M+Na]+, [M+NH4]+, [M-H20+H]+, [M-H]-, or [M+Na-2H]- primary ions were considered. Experimental data was compared to the metabolic pathways of the MetaFishNet (MFN) database as described for humans as no cetacean databases were available. Network analysis using the Kyoto Encyclopedia of Genes and Genomes (KEGG) database (Kanehisa et al., 2017) was performed to visualize the relationships between enriched pathways.
3 Results
3.1 Scaled mass index estimation
After photo-ID matching, 275 still aerial images of 47 biopsied SLE belugas were extracted from the video footage. After image scoring, photos from 44 individuals (17 females, 27 males) fulfilled the quality criteria, and were included in the morphometric analysis. Total body length (BLi) of the biopsied individuals ranged from 2.8 – 4.3 m (Supplementary Table I). As in Larrat and Lair (2021), males and females were treated as a single group with an average total body length (BL0) of 3.4 m. Body height to width ratios were calculated using MorphoMetriX for 25 SLE belugas observed rolling, producing the set of average ratios that were used to estimate body volumes (Figure 2, Supplementary Table 7).
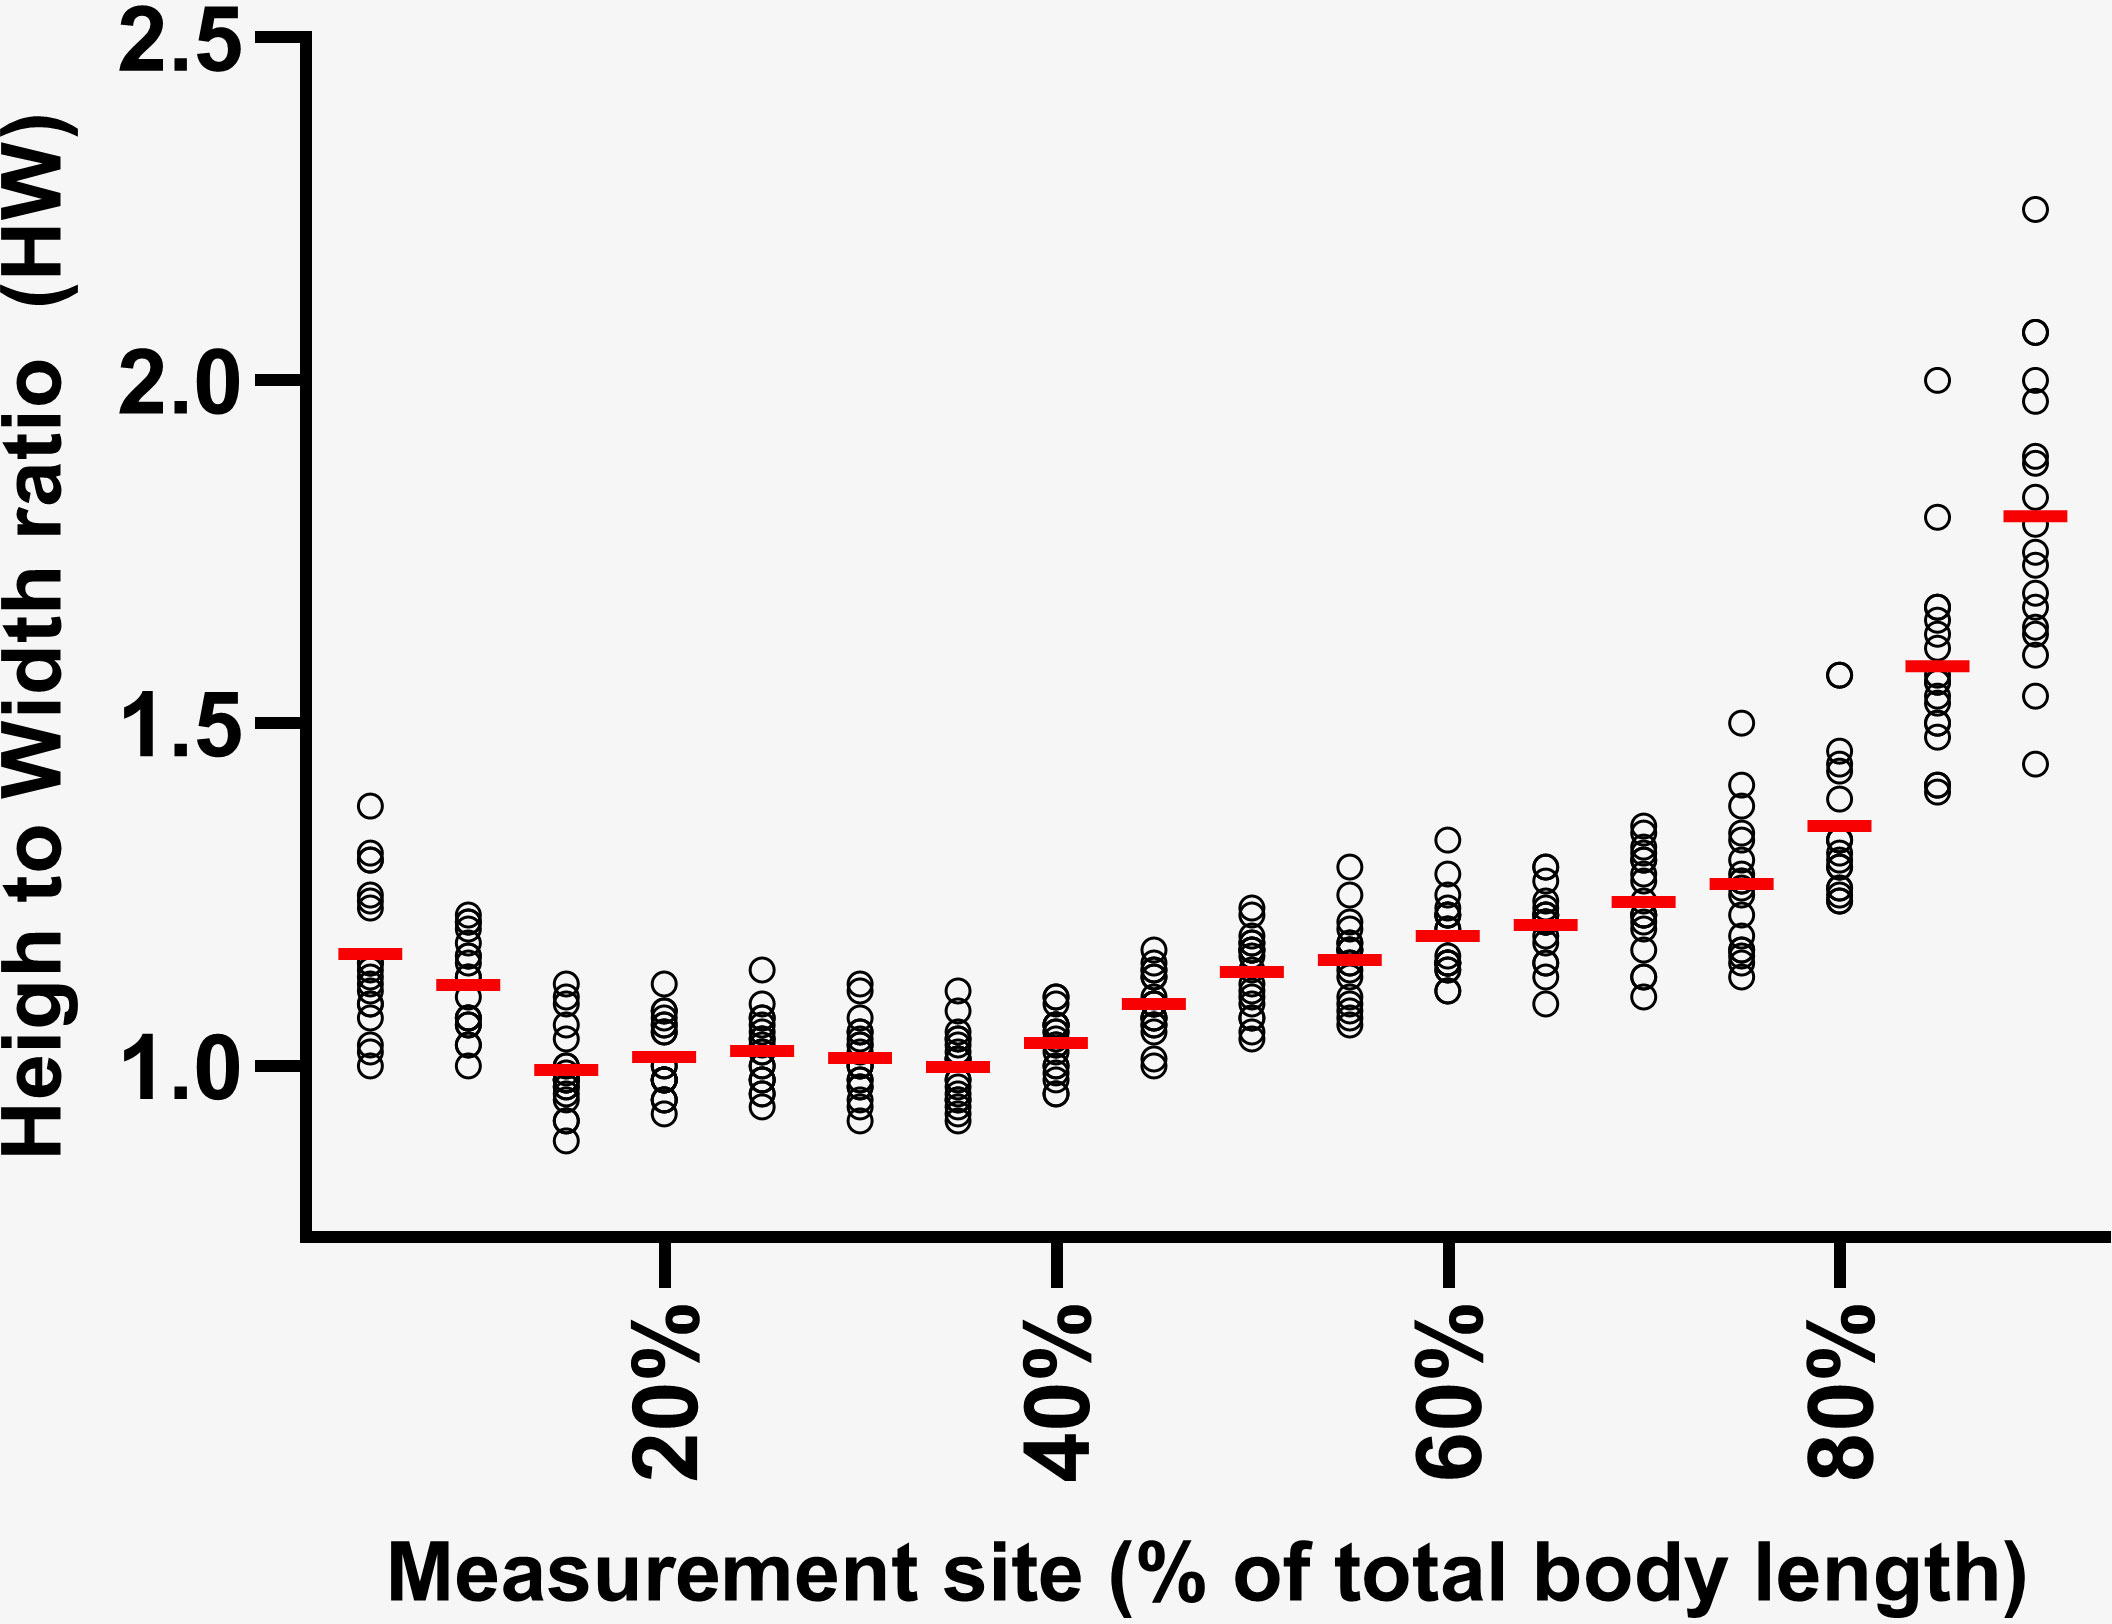
Figure 2 Height to width ratios of 25 free-ranging SLE belugas as measured at 5% increments (5 – 90%) along their total body lengths (end of the melon to notch of the tail fluke). Average ratios from each measurement site (red lines) were used to estimate the volumes of all biopsied animals.
Body volume estimates calculated using the elliptical model (Christiansen et al., 2019) ranged from 0.36 – 1.18 m3, which when multiplied by the average total body density estimate acquired from aquarium belugas (1217 kg/m3; Supplementary Table 5), produced SLE beluga body mass estimates ranging from 434 – 1434 kg (Table 1). As expected, estimated body masses were positively associated with total body length (Supplementary Figure 2A). Fitting of a linear regression to the ln-transformed body length and mass data produced a slope coefficient (bSMA) of 2.50 (95% CI 2.25 – 2.77; Supplementary Figure 2B). When calculated according to the equation described by Peig and Green (2009), SMI ( values for all biopsied animals ranged from 679 – 976 kg, with males and females having similar SMI ranges and means (Table 1).
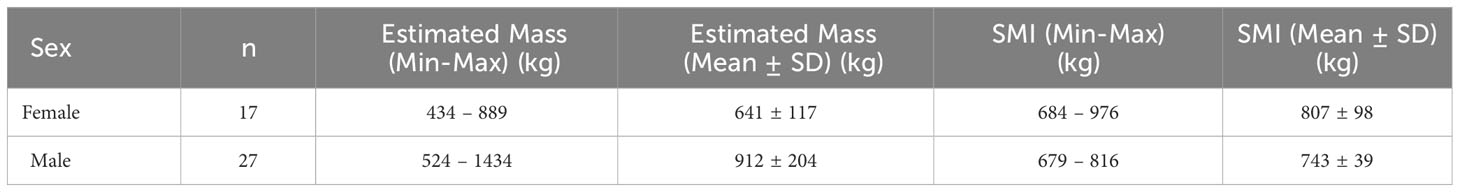
Table 1 Summary data of estimated mass (kg) and scaled mass index (kg) ranges and average values for female and male free-ranging SLE belugas as estimated from morphometric analysis of aerial images.
3.2 Non-targeted lipidomic analysis
A total of 10,383 lipid features were detected in outer-layer SLE blubber via UHPLC-MS analysis (6,259 features in positive-ion mode, 4,124 features in negative-ion mode). After removing features with low repeatability, a total of 4,460 features characterized by their detection mode (positive- or negative-ion), retention times, and m/z ratios, were retained in the final dataset. PCA demonstrated good clustering of the pooled QC sample runs, indicating high stability across the duration of each analysis (Supplementary Figure 3). MS2 level data was collected on 1,694 lipid features (1,070 in positive-ion mode, 624 in negative-ion mode). After data processing and match scoring, 1,146 features were tentatively assigned to eight lipid super classes (fatty acyls, glycerolipids, glycerophospholipids, organic acids, polyketides, prenol lipids, sphingolipids, sterol lipids) or classified as “undetermined”. Features were also tentatively identified at the level of main class (Supplementary Table 9).
3.3 Functional and network analysis
A linear model with covariate adjustments (limma R package) determined that 237 lipid features were significantly correlated with SMI (raw p< 0.05) in male SLE belugas when animal color, geographic sector, and PC1 were included as model covariates (potential identities of these features were not explored within the scope of this paper). Functional analysis identified 22 enriched metabolic pathways predicted to show altered biological activity (Gamma p< 0.05) in relationship to SMI. Enriched pathways containing five or more metabolite “hits” (i.e., features within the experimental database tentatively matched to a known compound by the algorithm) are described in Table 2 and detailed results can be found in the SI (Supplementary Table 10). Visualization of the data via network analysis revealed that the enriched pathways pertained to four KEGG pathway modules: Lipid Metabolism, Carbohydrate Metabolism (multiple pathways pertained to Carbohydrate and Lipid Metabolism modules), Metabolism of Cofactors & Vitamins, and Amino Acid Metabolism. Enriched pathways also formed three clusters when compared to the KEGG Metabolic Pathways Map, with multiple points of overlap between pathways (Figure 3).
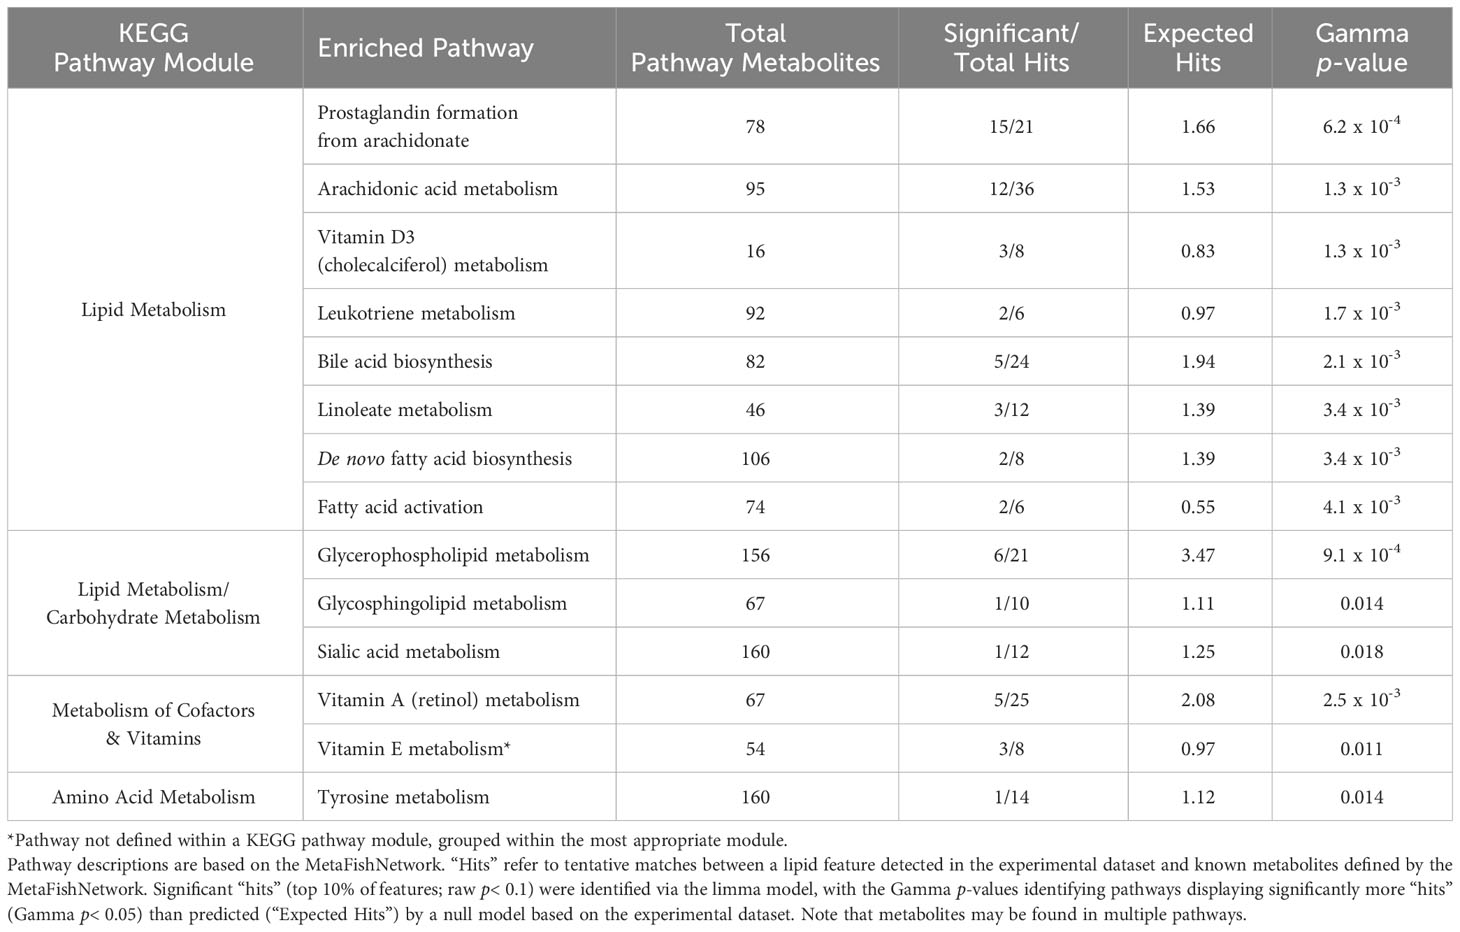
Table 2 Enriched pathways (grouped by Kyoto Encyclopedia of Genes and Genomes (KEGG) pathway module) containing five or more total “hits” correlated with SMI in SLE beluga outer-layer blubber (n = 27 males).
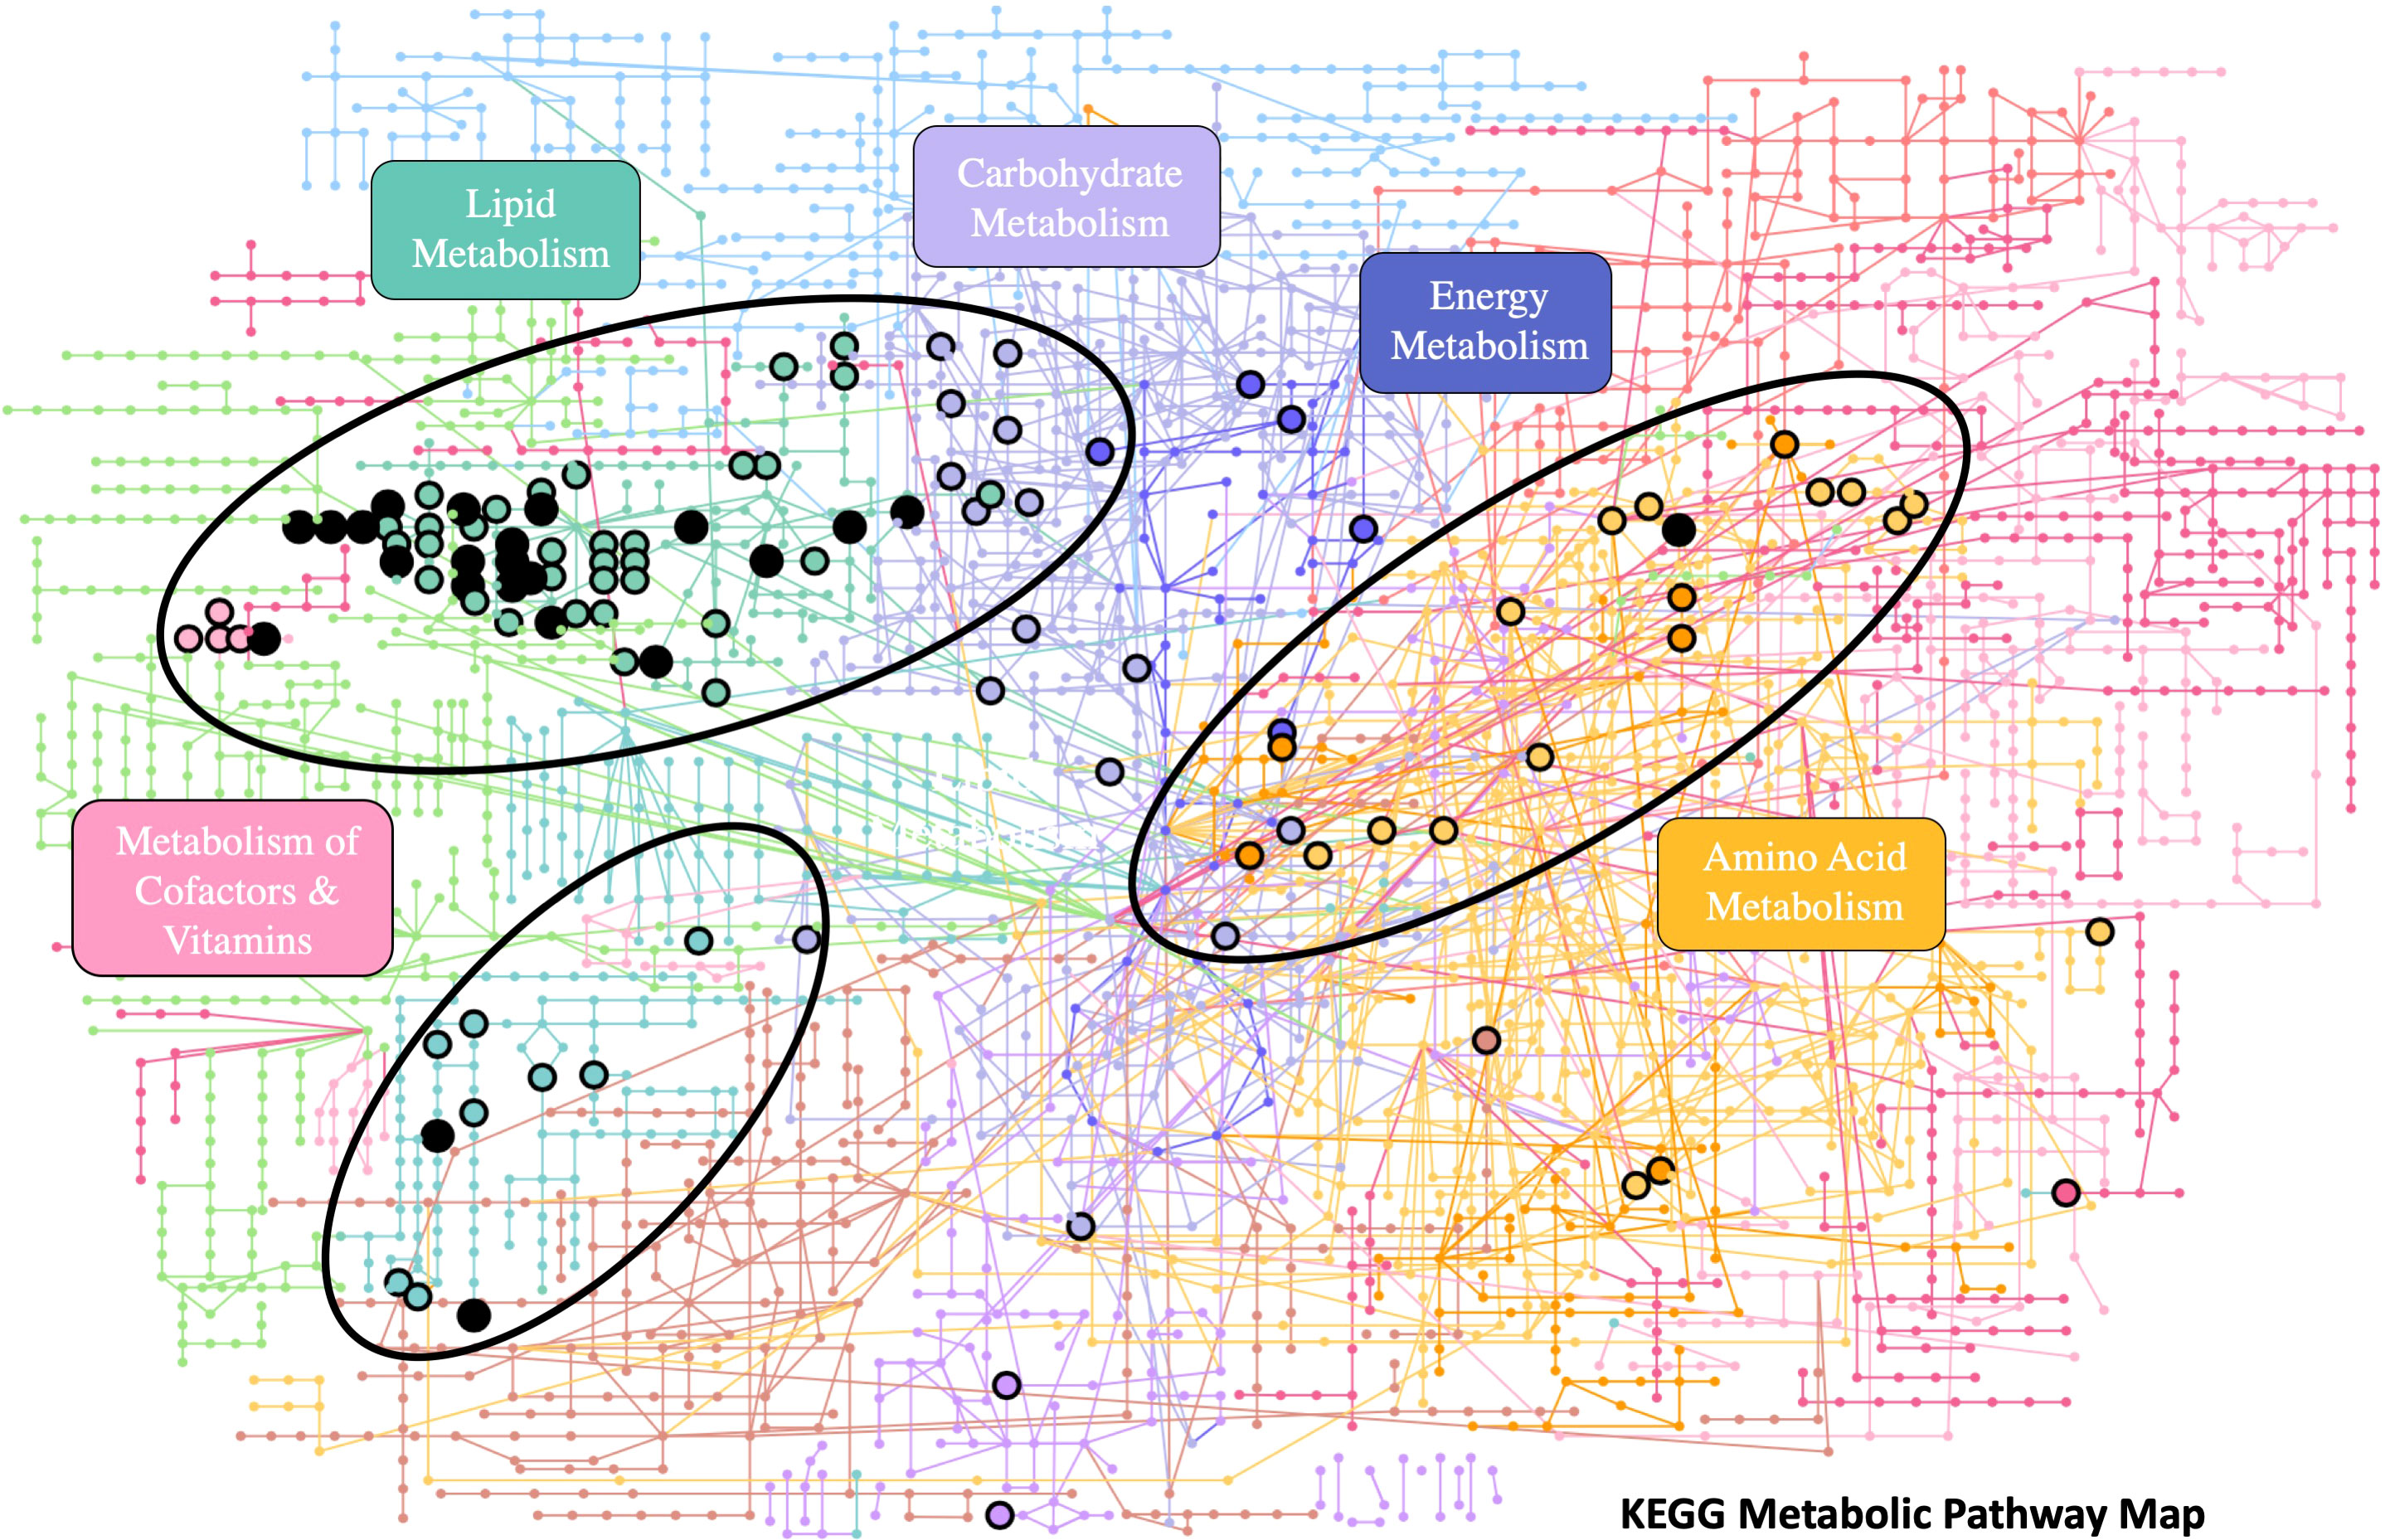
Figure 3 Network analysis (MetaboAnalyst 5.0) showing the grouping of enriched pathways in SLE beluga blubber containing five or more “hits” compared to the KEGG Metabolic Pathway Map. Closed circles represent significant “hits”, while open circles represent “hits” detected but not significant. KEGG pathway modules are labeled by color.
4 Discussion
Results from this study demonstrated that SMI can be estimated from aerial images of free-ranging SLE belugas to produce values that are consistent with those previously calculated from carcasses of known weight. This study is the first to propose a metric of body condition for free-ranging SLE belugas, and is one of the first to apply aerial photogrammetry techniques to the study of a smaller cetacean species. To our knowledge, this study is also the first to report correlations between a morphometric index of body condition and predicted pathway-level metabolic changes in the blubber of free-ranging cetaceans.
4.1 Aerial photogrammetry of belugas
Aerial videos were successfully collected concurrently with remote biopsy samples, and well-marked biopsied animals were identified in aerial video footage. Comparisons between the known total lengths of belugas under professional human care (estimated precision: ± 10-20 cm) and their total lengths as estimated from vertical images demonstrated that animals tended to measure shorter in the vertical images. Animal body position, particularly the degree of body arch, is therefore an important source of error to be further explored as images collected in aquarium facilities all had low (good) measurability scores. Morphometric analysis of these individuals of known total length also suggested that the body straightness score had little effect on the total length as measured by MorphoMetriX. Analysis of aerial images of free-ranging SLE belugas further suggested that measurement precision appeared to be more affected by animal body position (with the exception of body straightness) than by the “measurability” (i.e., visibility and clarity of the animal’s outline) of either the total length or body widths. Including images of animals which scored a 4 out of 5 in either “Length measurability” or “Width measurability” criteria in the morphometric analysis, still produced total length measurements with an average intra-animal CV of 2.2%, and average width measurement CVs under 5% (between 10 – 75% of the total body length). Nevertheless, future efforts should focus on capturing longer drone videos recording more surfacing events to optimize the chances of extracting high quality still images. Future work is also needed to assess the effects of different sources of error, including measurement errors inherent to each different drone, camera, and range finder setup, that may affect final volume and body mass estimates. The incorporation of a method to estimate photogrammetric uncertainty, such as in Bierlich et al. (2021), would improve the interpretation of the morphometric data and allow for more reliable comparisons between existing data and future datasets.
4.2 Body mass and scaled mass index estimates
Volume estimates of free-ranging SLE belugas (calculated from aerial images) combined with a total body density estimate derived from belugas under professional human care, produced both body mass and SMI estimates that were consistent with the weights of 51 recovered SLE beluga carcasses and their SMIs (Bernier-Graveline et al., 2021). The weight of free-ranging SLE female belugas within this study averaged 641 ± 117 kg (mean ± SD), while dead-stranded females weighed prior to necropsy averaged 654 ± 127 kg (n = 37; Bernier-Graveline et al. (2021)). The average free-ranging male weight estimate (912 ± 204 kg), was slightly lower than that of dead-stranded male carcasses (also weighed prior to necropsy) (n = 14, 976 ± 197 kg; Bernier-Graveline et al. (2021)). It should be noted that only two free-ranging males in this study had an average total length greater than 4 m, suggesting that the dataset may be skewed towards medium and shorter-length males. However, SMI values appeared comparable between both free-ranging and stranded males and females (free-ranging females: 807 ± 98 kg, female carcasses: 814 ± 208 kg; free-ranging males 743 ± 39 kg, male carcasses: 732 ± 101 kg). These results suggest that this non-invasive aerial photogrammetry technique can be successfully used to estimate the body weight, and potentially body condition, of free-ranging SLE belugas. It should be noted that animals included in this study appeared to be primarily animals in “moderate” or “good” body condition (visual observation from the research vessel), without obvious signs of emaciation (M.Sherrill; personal observation). During periods of nutritional stress, muscular catabolism of the epaxial muscles may be an important source of energy for belugas (Larrat and Lair, 2021). If such muscular atrophy does not result in an observable loss of body width, estimates of SMI calculated from aerial images will likely overestimate the condition of these emaciated animals, and may not reflect the severity of their nutritional state.
Additional work will also be necessary to determine how to distinguish pregnant SLE beluga females from non-pregnant females with large energy reserves. During their study of SLE beluga carcasses, Larrat and Lair (2021) found that the inclusion of pregnant females in their dataset did not change their calculated slope coefficient (bSMA) or their estimates of SMI. However, within the present study, a group of seven females had the highest SMI estimates, suggesting that the relationship between SMI and reproductive status needs to be further explored. Similarly, cetacean body composition is known to vary with age, sex, and reproductive status (Koopman, 2007; Mallette et al., 2016; Adamczak et al., 2021). Future work should therefore also include the development of multiple total body density estimates to account for these differences.
4.3 Non-targeted lipidomic analysis
UHPLC-MS based non-targeted lipidomic analysis produced a dataset describing the relative abundance of over 4,000 lipid features in beluga blubber samples, while requiring minimal quantities of tissue (~20 mg). As limited amounts of tissue can be collected via remote biopsy darting, the amount of information that can be obtained from each sample must be maximized. A non-targeted approach was therefore selected for this study to allow for unbiased analysis of all detectable lipid classes, with the successful extraction and detection of a range of lipid super classes and main classes confirmed via MS2 level analysis.
However, as MS2 data were not available for all detected lipid features, enrichment analysis via the mummichog algorithm was used to identify metabolic pathways ("enriched pathways") predicted to show altered biological activity correlated with SMI. By shifting the unit of analysis from individual lipid features to pre-defined metabolic pathways, this method relies on the “collective behavior” of metabolites to predict pathway-level functional differences without the need for pre-identification of detected lipid features (Li et al., 2013; Lu et al., 2022). It should be noted when interpreting these results, that it cannot be inferred whether enriched pathways are expected to be up-regulated or down-regulated. Equally, that the enrichment of a pathway involving a particular metabolite, such as “Vitamin A (retinol) metabolism”, does not imply that metabolite itself is predicted to be enriched, as the enrichment pertains to the pathway as a whole.
4.4 Pathway enrichment analysis
Mapping of enriched pathways against the KEGG Metababolic Pathways Map provided a visual overview of the relationships between enriched pathways and revealed that the majority of enriched pathways pertained to the Lipid Metabolism KEGG pathway module, with some pathways overlapping with the Carbohydrate Metabolism module. Enriched pathways were also found within the Metabolism of Cofactors & Vitamins, and Amino Acid Metabolism KEGG pathway modules. The observed clustering and overlap between the enriched pathways provided additional confidence in the results of the functional analysis.
The majority of enriched pathways within the Lipid Metabolism module appeared related to the metabolism and mobilization of fatty acyls, specifically the metabolism of the fatty acid arachidonic acid. Enriched pathways included both pathways related to the formation of arachidonic acid from its precursor, linoleic acid (“Linoleate metabolism” and “Arachidonic acid metabolism”), and the biosynthesis of the inflammatory-regulating eicosanoids from arachidonic acid (“Prostaglandin formation from arachidonate”, “Leukotriene metabolism”). These results appear to be consistent with the findings of Bernier-Graveline et al. (2021), which demonstrated that male SLE beluga carcasses in “good” or “moderate” body condition (grouped according to SMI values) had higher concentrations of arachidonic acid in full-depth blubber samples compared to males in “poor” condition. This result and the present study both suggest that metabolic activity pertaining to arachidonic acid may vary with body condition in male SLE belugas. Arachidonic acid may therefore be an interesting potential biomarker of body condition to explore in future studies.
“Hits” from two additional enriched pathways within the Lipid Metabolism module, “Vitamin D3 metabolism” and “Bile Acid metabolism”, formed a second, smaller cluster when compared to the KEGG Metabolic Pathways Map. Vitamin D3 is a lipid-soluble vitamin with diverse metabolic roles. In human and murine adipose tissue, Vitamin D3 has been shown to affect energy homeostasis via the regulation of adipose tissue inflammation and adipocyte differentiation (Park and Han, 2021). Similarly, there is increasing evidence that bile acids may play a similar regulatory role in mammalian (human and murine) lipid metabolism through hormone-like signaling regulating adipogenesis, lipogenesis, and obesity-induced inflammation of adipose tissue (Houten et al., 2006; Schmid et al., 2019). While there are few studies pertaining to Vitamin D3 or bile acids in marine mammal, blubber-layer Vitamin D3 concentrations do appear to be influenced by diet. A comparison between six marine mammal species in the Alaskan Arctic revealed that primarily invertebrate feeders (e.g., Bowhead whales, Balaena mysticetus) generally had lower blubber layer concentrations of Vitamin D3 than piscivorous or carnivorous species, including belugas (Kenny et al., 2004). To our knowledge, bile acids have not been analyzed in marine mammal blubber, however, both Vitamin D3 and bile acids may be interesting future targets for analysis.
Several enriched pathways contained “hits” within both the Lipid Metabolism and Carbohydrate Metabolism modules. Of particular interest is the enrichment of “Glycerophospholipid metabolism” in relation to SMI. Bernier-Graveline et al. (2021) found higher concentrations of multiple glycerophosphatidylcholine analogs in male and female SLE beluga carcasses in “poor” body condition compared to those in “good” condition. As this class of structural lipids comprises a large proportion of adipocyte cell membranes, the authors hypothesized that these relationships may be caused by compositional changes within the cell membranes associated with changing energy reserves. During their assessment of humpback whale and killer whale (Orcinus orca) blubber lipidomes, Bories et al. (2021) determined that phosphatidycholines were the second most abundant component of humpback whale blubber, while phosphosphingolipids were the second most abundant component in killer whale blubber. Similarly, the authors proposed that these differences in lipid composition may stem from different energetic strategies, with humpback whales depending on large annual weight stores to meet their energetic needs (Waugh et al., 2012). In contrast, killer whales forage year-round and do not depend on the build-up of large energy reserves (Dietz et al., 2020). The results of the present study further suggest that the analysis of structural and minor lipid classes in cetacean blubber can provide important insights into their energy metabolism.
A single pathway within the Amino Acid Metabolism module, “Tyrosine metabolism” was enriched in correlation with SMI. This result is difficult to interpret as the potential roles of amino acids in mammalian adipose tissue are not well understood. However, similarly, Kershaw et al. (2018) detected the presence of proteins involved in amino acid metabolism in blubber samples collected from stranded harbor porpoise (Phocoena phocoena), suggesting that cetacean blubber may play a minor role in amino acid metabolism. Metabolomic analysis of plasma from samples obtained from “healthy” and “diseased” bottlenose dolphins (Tursiops truncates) also detected differences in circulating amino acid concentrations, suggesting that muscle wasting and amino acid catabolism may serve as an energy source for dolphins in a “diseased” state (Derous et al., 2022). However, it remains to be determined if muscle wasting produces a detectable metabolic signature in cetacean blubber.
Two final enriched pathways of particular interest were “Vitamin A (Retinol) metabolism” and “Vitamin E metabolism”. While Vitamin E metabolism is not defined within one of the KEGG metabolism modules, it is being considered as part of the Metabolism of Cofactors & Vitamins KEGG module along with “Vitamin A (retinol) metabolism” for the purposes of this study. Vitamins A and E are both lipid-soluble essential nutrients that are acquired by mammals through diet. Retinol is the most common form of Vitamin A in mammals and plays numerous roles in growth and development, immune function and reproduction (Brossaud et al., 2017). Vitamin E is an antioxidant that is also known to affect immune system development and function (Alcalá et al., 2015). Both Vitamin A and Vitamin E have previously been associated with potential measures of body condition in belugas from the western Canadian Arctic (Desforges et al., 2013). However, concentrations of both vitamins in marine mammal blubber are also known to vary with a range of biological and ecological factors including sex, age, diet, and contaminant exposure (Desforges et al., 2013; Pedro et al., 2019). Specifically, concentrations of polychlorinated biphenyls were shown to be the strongest predictor of blubber-layer Vitamin A concentrations in the same Arctic belugas (Desforges et al., 2017). As the SLE belugas have been chronically exposed to high levels of organohalogen contaminants, including polychlorinated biphenyls, organochlorine pesticides, various halogenated flame retardants, per- and polyfluoroalkyl substances, industrial antioxidants and ultraviolet absorbents (Simond et al., 2017, 2019; Barrett et al., 2021; Blouin et al., 2022), the relationships between Vitamins A and E and contaminant levels in SLE beluga blubber will be important to explore and will provide additional context for the interpretation of these results.
4.5 Future directions
This study is one of the first to link a morphometric index of cetacean body condition (SMI) estimated via UAV-photogrammetry, to potential metabolic differences between free-ranging individuals. The enrichment of metabolic pathways pertaining to fatty acids and glycerophospholipids in correlation with SMI in the present study is consistent with recent literature, and suggests that SMI may be an appropriate index of body condition to use when assessing the energy reserves of free-ranging SLE belugas from aerial images.
Future studies will be warranted to explore how multiple biological and ecological factors can be considered to improve both SMI estimates and the interpretation of the blubber lipidomic data. As cetacean blubber is stratified throughout its depth both in terms of lipid composition and function (Aguilar and Borrell, 1990; Koopman et al., 1996; Reeb et al., 2007), it is important to consider that differences in biopsy depth and angle will likely affect the the lipid composition within each biopsy sample. It also remains to be determined if the pathway enrichment predicted within the outermost-layer of the blubber corresponds with changes in the inner layer (traditionally thought to be the most metabolically active layer; Koopman et al. (1996)). As the SLE belugas remain one of the most contaminated marine mammal population in the world, it will also be important to consider the potential effects of endocrine-disrupting organohalogen contaminants within the blubber on the lipid profile and storage of energy reserves.
With further refinement, the calculation of SMI from aerial images has the potential to be an effective, non-invasive technique for assessing both individual and population level energy reserves within the SLE beluga population. The results of the non-targeted lipidomic analysis further demonstrate the utility of analyzing a wide range of lipid classes. The results can also be used to inform future targeted experiments to further our understanding of how declining energy reserves can potentially affect both the structure and function of cetacean blubber.
Data availability statement
Lipidomics datasets can be found in the MetaboLights data repository at https://www.ebi.ac.uk/metabolights/MTBLS9694.
Ethics statement
The animal study was approved by Parks Canada (SAGMP-2019-32682 and SAGMP-2021-39518), Fisheries and Oceans Canada (QUE-LEP-003-2019, QUE-LEP-002-2021, and QUE-LEP-002B-2021), the Institutional Animal Care Committee (permit #970) at the Université du Québec à Montréal, the Mystic Aquarium Institutional Animal Care and Use Committee (IACUC protocol #17007), and the Shedd Aquarium Research Committee (#2021-08). The study was conducted in accordance with the local legislation and institutional requirements.
Author contributions
MS: Conceptualization, Formal analysis, Methodology, Writing – original draft, Writing – review & editing, Data curation. AB: Conceptualization, Writing – review & editing, Data curation, Methodology. JE: Formal analysis, Methodology, Writing – review & editing. ZP: Formal analysis, Methodology, Writing – review & editing. MMo: Data curation, Methodology, Writing – review & editing. MMa: Data curation, Methodology, Writing – review & editing. MMu: Data curation, Project administration, Writing – review & editing. TR: Data curation, Project administration, Writing – review & editing. RM: Conceptualization, Funding acquisition, Methodology, Writing – review & editing. JV: Conceptualization, Funding acquisition, Methodology, Project administration, Writing – review & editing.
Funding
The author(s) declare financial support was received for the research, authorship, and/or publication of this article. Funding for this research was provided primarily by Fisheries and Oceans Canada’s (DFO) and the Natural Science and Engineering Research Council of Canada’s (NSERC) Whale Science for Tomorrow program (DFO/NSERC Grant WST-18-Q-01). Additional funding for the field sampling was provided by the Sea Research Foundation (Mystic Aquarium) and the Fondation Prince Albert II de Monaco.
Acknowledgments
T. Perrero and L. Tremblay (Groupe de recherche et d'éducation sur le mammifères marins) contributed to numerous aspects of the field sampling, while V. Jolicoeur and L. Zeppetelli-Bédard (Université du Québec à Montréal) assisted with biopsy processing. Animal sexing was led by Dr. T. Frasier (Saint Mary’s University). Assistance with MorphoMetriX was provided by Dr. K.C. Bierlich (Oregon State University) and Dr. W. Torres (University of Washington), with photogrammetry guidance provided by Dr. F. Christiansen (Aarhus University). Dr. S. Larrat and Dr. S. Lair (Université de Montréal) advised on the use of SMI. J. Ciletti, K. Justice, M. Van der Maelen, E. Kruckow and the complete beluga care teams at both Mystic and Shedd Aquarium contributed the collection of multiple datasets. Lipidomic analysis was performed by Dr. J. Han (University of Victoria Genome BC Proteomics Centre) and his team. This constitutes scientific contribution #369 from the Sea Research Foundation, Inc.
Conflict of interest
The authors declare that the research was conducted in the absence of any commercial or financial relationships that could be construed as a potential conflict of interest.
Publisher’s note
All claims expressed in this article are solely those of the authors and do not necessarily represent those of their affiliated organizations, or those of the publisher, the editors and the reviewers. Any product that may be evaluated in this article, or claim that may be made by its manufacturer, is not guaranteed or endorsed by the publisher.
Supplementary material
The Supplementary Material for this article can be found online at: https://www.frontiersin.org/articles/10.3389/fmars.2024.1360374/full#supplementary-material
References
Adamczak S. K., Holser R. R., Costa D. P., Berens Mccabe E. J., Wells R. S. (2021). Body composition of common bottlenose dolphins in Sarasota Bay, Florida. Front. Mar. Sci. 8. doi: 10.3389/fmars.2021.615773
Aguilar A., Borrell A. (1990). Patterns of lipid content and stratification in the blubber of fin whales (Balaenoptera physalus). J. Mammalogy 71, 544–554. doi: 10.2307/1381793
Alcalá M., Sánchez-Vera I., Sevillano J., Herrero L., Serra D., Ramos M. P., et al. (2015). Vitamin E reduces adipose tissue fibrosis, inflammation, and oxidative stress and improves metabolic profile in obesity. Obesity 23, 1598–1606. doi: 10.1002/oby.21135
Aoki K., Isojunno S., Bellot C., Iwata T., Kershaw J., Akiyama Y., et al. (2021). Aerial photogrammetry and tag-derived tissue density reveal patterns of lipid-store body condition of humpback whales on their feeding grounds. Proc. R. Soc. B: Biol. Sci. 288, 20202307. doi: 10.1098/rspb.2020.2307
Barrett H., Du X., Houde M., Lair S., Verreault J., Peng H. (2021). Suspect and nontarget screening revealed class-specific temporal trends, (2000–2017) of poly- and perfluoroalkyl substances in st. Lawrence beluga whales. Environ. Sci. Technol. 55, 1659–1671. doi: 10.1021/acs.est.0c05957
Bernier-Graveline A., Lesage V., Cabrol J., Lair S., Michaud R., Rosabal M., et al. (2021). Lipid metabolites as indicators of body condition in highly contaminant-exposed belugas from the endangered St. Lawrence Estuary population (Canada). Environ. Res. 192, 110272. doi: 10.1016/j.envres.2020.110272
Bierlich K. C., Hewitt J., Schick R. S., Pallin L., Dale J., Friedlaender A. S., et al. (2022). Seasonal gain in body condition of foraging humpback whales along the Western Antarctic Peninsula. Front. Mar. Sci. 9. doi: 10.3389/fmars.2022.1036860
Bierlich K. C., Schick R. S., Hewitt J., Dale J., Goldbogen J. A., Friedlaender A. S., et al. (2021). Bayesian approach for predicting photogrammetric uncertainty in morphometric measurements derived from drones. Mar. Ecol. Prog. Ser. 673, 193–210. doi: 10.3354/meps13814
Blouin K., Malaisé F., Verreault J., Lair S., Lu Z. (2022). Occurrence and temporal trends of industrial antioxidants and UV absorbents in the endangered St. Lawrence Estuary beluga whale (Delphinapterus leucas). Sci. Total Environ. 842, 156635. doi: 10.1016/j.scitotenv.2022.156635
Bories P., Rikardsen A. H., Leonards P., Fisk A. T., Tartu S., Vogel E. F., et al. (2021). A deep dive into fat: Investigating blubber lipidomic fingerprint of killer whales and humpback whales in northern Norway. Ecol. Evol. 11, 6716–6729. doi: 10.1002/ece3.7523
Brossaud J., Pallet V., Corcuff J. B. (2017). Vitamin A, endocrine tissues and hormones: interplay and interactions. Endocr. Connect 6, R121–r130. doi: 10.1530/EC-17-0101
Cheney B. J., Dale J., Thompson P. M., Quick N. J. (2022). Spy in the sky: a method to identify pregnant small cetaceans. Remote Sens. Ecol. Conserv. 8, 492–505. doi: 10.1002/rse2.258
Christiansen F., Dujon A. M., Sprogis K. R., Arnould J. P. Y., Bejder L. (2016). Noninvasive unmanned aerial vehicle provides estimates of the energetic cost of reproduction in humpback whales. Ecosphere 7, e01468. doi: 10.1002/ecs2.1468
Christiansen F., Rodríguez-González F., Martínez-Aguilar S., Urbán J., Swartz S., Warick H., et al. (2021). Poor body condition associated with an unusual mortality event in gray whales. Mar. Ecol. Prog. Ser. 658, 237–252. doi: 10.3354/meps13585
Christiansen F., Sironi M., Moore M. J., Di Martino M., Ricciardi M., Warick H. A., et al. (2019). Estimating body mass of free-living whales using aerial photogrammetry and 3D volumetrics. Methods Ecol. Evol. 10, 2034–2044. doi: 10.1111/2041-210X.13298
Christiansen F., Vivier F., Charlton C., Ward R., Amerson A., Burnell S., et al. (2018). Maternal body size and condition determine calf growth rates in southern right whales. Mar. Ecol. Prog. Ser. 592, 267–281. doi: 10.3354/meps12522
COSEWIC. (2014). COSEWIC assessment and status report on the beluga whale (Delphinapterus leucas), St. Lawrence Estuary population, in Canada (Ottowa, Canada: Committee on the Status of Endangered Wildlife in Canada).
Derous D., Kebke A., Fair P. A., Styczynski M., Bossart G. D., Douglas A., et al. (2022). Untargeted plasma metabolomic analysis of wild bottlenose dolphins (Tursiops truncatus) indicate protein degradation when in poorer health. Comp. Biochem. Physiol. Part D: Genomics Proteomics 42, 100991. doi: 10.1016/j.cbd.2022.100991
Desforges J.-P., Levin M., Jasperse L., De Guise S., Eulaers I., Letcher R. J., et al. (2017). Effects of polar bear and killer whale derived contaminant cocktails on marine mammal immunity. Environ. Sci. Technol. 51, 11431–11439. doi: 10.1021/acs.est.7b03532
Desforges J.-P. W., Ross P. S., Dangerfield N., Palace V. P., Whiticar M., Loseto L. L. (2013). Vitamin A and E profiles as biomarkers of PCB exposure in beluga whales (Delphinapterus leucas) from the western Canadian Arctic. Aquat. Toxicol. 142-143, 317–328. doi: 10.1016/j.aquatox.2013.08.004
DFO (2012). Recovery strategy for the beluga whale (Delphinapterus leucas), St. Lawrence Estuary Population in Canada. Species at Risk Act Recovery Series Strategy. (Ottawa.: Fisheries and Oceans Canada), 88 pp + X pp.
Dietz R., Rikardsen A. H., Biuw M., Kleivane L., Noer C. L., Stalder D., et al. (2020). Migratory and diurnal activity of North Atlantic killer whales (Orcinus orca) off northern Norway. J. Exp. Mar. Biol. Ecol. 533, 151456. doi: 10.1016/j.jembe.2020.151456
Durban J. W., Moore M. J., Chiang G., Hickmott L. S., Bocconcelli A., Howes G., et al. (2016). Photogrammetry of blue whales with an unmanned hexacopter. Mar. Mammal Sci. 32, 1510–1515. doi: 10.1111/mms.12328
Fearnbach H., Durban J., Ellifrit D., Balcomb K. (2018). Using aerial photogrammetry to detect changes in body condition of endangered southern resident killer whales. Endangered Species Res. 35, 175–180. doi: 10.3354/esr00883
Galligan T. M., Balmer B. C., Schwacke L. H., Bolton J. L., Quigley B. M., Rosel P. E., et al. (2019). Examining the relationships between blubber steroid hormones and persistent organic pollutants in common bottlenose dolphins. Environ. pollut. 249, 982–991. doi: 10.1016/j.envpol.2019.03.083
Galligan T. M., Boggs A. S. P., Balmer B. C., Rowles T., Smith C. R., Townsend F., et al. (2020). Blubber steroid hormone profiles as indicators of physiological state in free-ranging common bottlenose dolphins (Tursiops truncatus). Comp. Biochem. Physiol. A Mol. Integr. Physiol. 239, 110583. doi: 10.1016/j.cbpa.2019.110583
Gilson A., Syvanen M., Levine K., Banks J. (1998). Deer gender determination by polymerase chain reaction: validation study and application to tissues, bloodstains, and hair forensic samples from California. California Fish Game 84, 159–169.
Glarou M., Gero S., Frantzis A., Brotons J. M., Vivier F., Alexiadou P., et al. (2022). Estimating body mass of sperm whales from aerial photographs. Mar. Mammal Sci. 39, 251–273. doi: 10.1111/mms.12982
Houten S. M., Watanabe M., Auwerx J. (2006). Endocrine functions of bile acids. EMBO J. 25, 1419–1425. doi: 10.1038/sj.emboj.7601049
Iverson S. J., Koopman H. N. (2018). “Blubber,” in Encyclopedia of marine mammals, 3rd ed. Eds. Würsig B., Thewissen J. G. M., Kovacs K. M. (London, UK: Academic Press), 107–110.
Kanehisa M., Furumichi M., Tanabe M., Sato Y., Morishima K. (2017). KEGG: new perspectives on genomes, pathways, diseases and drugs. Nucleic Acids Res. 45, D353–d361. doi: 10.1093/nar/gkw1092
Kenny D., O’hara T., Chen T., Lu Z., Tian X., Holick M. (2004). Vitamin D content in Alaskan Arctic zooplankton, fishes, and marine mammals. Zoo Biol. 23, 33–43. doi: 10.1002/zoo.10104
Kershaw J. L., Botting C. H., Brownlow A., Hall A. J. (2018). Not just fat: investigating the proteome of cetacean blubber tissue. Conserv. Physiol. 6, coy003. doi: 10.1093/conphys/coy003
Koopman H. (2007). Phylogenetic, ecological, and ontogenetic factors influencing the biochemical structure of the blubber of odontocetes. Mar. Biol. 151, 277–291. doi: 10.1007/s00227-006-0489-8
Koopman H. N. (2018). Function and evolution of specialized endogenous lipids in toothed whales. J. Exp. Biol. 221, jeb161471. doi: 10.1242/jeb.161471
Koopman H. N., Iverson S. J., Gaskin D. E. (1996). Stratification and age-related differences in blubber fatty acids of the male harbour porpoise (Phocoena phocoena). J. Comp. Physiol. B 165, 628–639. doi: 10.1007/BF00301131
Krahn M. M., Herman D. P., Ylitalo G. M., Sloan C. A., Burrows D. G., Hobbs R. C., et al. (2004). Stratification of lipids, fatty acids and organochlorine contaminants in blubber of white whales and killer whales. J. Cetacean Res. Manage. 6, 175–189. doi: 10.47536/jcrm.v6i2.781
Larrat S., Lair S. (2021). Body condition index in beluga whale (Delphinapterus leucas) carcasses derived from morphometric measurements. Mar. Mammal Sci. 38 (1), 274–287. doi: 10.1111/mms.12855
Larrat S., Santamaria-Bouvier A., Lair S. (2019). Agreement between repeated subjective visual evaluations of body bondition of St. Lawrence beluga whale (Delphinapterus leucas) carcasses using a visual analog scale. J. Wildl Dis. 55, 518–521. doi: 10.7589/2018-04-105
Leek J. T., Scharpf R. B., Bravo H. C., Simcha D., Langmead B., Johnson W. E., et al. (2010). Tackling the widespread and critical impact of batch effects in high-throughput data. Nat. Rev. Genet. 11, 733–739. doi: 10.1038/nrg2825
Lesage V. (2014). Trends in the trophic ecology of St. Lawrence beluga (Delphinapterus leucas) over the period 1988-2012, based on stable isotope analysis. DFO Can. Sci. Advis. Sec. Sci. Advis. Rep. 2013/126. iv + 25 p.
Li S., Park Y., Duraisingham S., Strobel F. H., Khan N., Soltow Q. A., et al. (2013). Predicting network activity from high throughput metabolomics. PloS Comput. Biol. 9, e1003123. doi: 10.1371/journal.pcbi.1003123
Lu Y., Pang Z., Xia J. (2022). Comprehensive investigation of pathway enrichment methods for functional interpretation of LC–MS global metabolomics data. Briefings Bioinf. 24 (1), bbac553. doi: 10.1093/bib/bbac553
Mallette S. D., Mclellan W. A., Scharf F. S., Koopman H. N., Barco S. G., Wells R. S., et al. (2016). Ontogenetic allometry and body composition of the common bottlenose dolphin (Tursiops truncatus) from the U.S. mid-Atlantic. Mar. Mammal Sci. 32, 86–121. doi: 10.1111/mms.12253
Miller C., Best P., Perryman W., Baumgartner M., Moore M. (2012). Body shape changes associated with reproductive status, nutritive condition and growth in right whales Eubalaena glacialis and E. australis. Mar. Ecol. Prog. Ser. 459, 135. doi: 10.3354/meps09675
Mosnier A., Doniol-Valcroze T., Gosselin J. F., Lesage V., Measures L. N., Hammill M. O. (2015). Insights into processes of population decline using an integrated population model: The case of the St. Lawrence Estuary beluga (Delphinapterus leucas). Ecol. Model. 314, 15–31. doi: 10.1016/j.ecolmodel.2015.07.006
Pang Z., Chong J., Zhou G., Anderson De lima morais D., Chang L., Barrette M., et al. (2021). MetaboAnalyst 5.0: narrowing the gap between raw spectra and functional insights. Nucleic Acids Res. 49, W388–W396. doi: 10.1093/nar/gkab382
Park C. Y., Han S. N. (2021). The role of Vitamin D in adipose tissue biology: adipocyte differentiation, energy metabolism, and inflammation. J. Lipid Atheroscler 10, 130–144. doi: 10.12997/jla.2021.10.2.130
Pedro S., Dietz R., Sonne C., Rosing-Asvid A., Hansen M., Mckinney M. A. (2019). Are vitamins A and E associated with persistent organic pollutants and fatty acids in the blubber of highly contaminated killer whales (Orcinus orca) from Greenland? Environ. Res. 177, 108602. doi: 10.1016/j.envres.2019.108602
Peig J., Green A. J. (2009). New perspectives for estimating body condition from mass/length data: the scaled mass index as an alternative method. Oikos 118, 1883–1891. doi: 10.1111/j.1600-0706.2009.17643.x
Reeb D., Best P. B., Kidson S. H. (2007). Structure of the integument of southern right whales, Eubalaena australis. Anatomical Rec. 290, 596–613. doi: 10.1002/ar.20535
Ritchie M. E., Phipson B., Wu D., Hu Y., Law C. W., Shi W., et al. (2015). limma powers differential expression analyses for RNA-sequencing and microarray studies. Nucleic Acids Res. 43, e47. doi: 10.1093/nar/gkv007
Schmid A., Schlegel J., Thomalla M., Karrasch T., Schäffler A. (2019). Evidence of functional bile acid signaling pathways in adipocytes. Mol. Cell Endocrinol. 483, 1–10. doi: 10.1016/j.mce.2018.12.006
Seutin G., White B. N., Boag P. T. (1991). Preservation of avian blood and tissue samples for DNA analyses. Can. J. Zoology 69, 82–90. doi: 10.1139/z91-013
Simond A. E., Houde M., Lesage V., Michaud R., Verreault J. (2020). Metabolomic profiles of the endangered St. Lawrence Estuary beluga population and associations with organohalogen contaminants. Sci. Total Environ. 717, 137204. doi: 10.1016/j.scitotenv.2020.137204
Simond A. E., Houde M., Lesage V., Michaud R., Zbinden D., Verreault J. (2019). Associations between organohalogen exposure and thyroid- and steroid-related gene responses in St. Lawrence Estuary belugas and minke whales. Mar. pollut. Bull. 145, 174–184. doi: 10.1016/j.marpolbul.2019.05.029
Simond A. E., Houde M., Lesage V., Verreault J. (2017). Temporal trends of PBDEs and emerging flame retardants in belugas from the St. Lawrence Estuary (Canada) and comparisons with minke whales and Canadian Arctic belugas. Environ. Res. 156, 494–504. doi: 10.1016/j.envres.2017.03.058
Soledade Lemos L., Burnett J. D., Chandler T. E., Sumich J. L., Torres L. G. (2020). Intra- and inter-annual variation in gray whale body condition on a foraging ground. Ecosphere 11, e03094. doi: 10.1002/ecs2.3094
Stewart R., Campana S., Jones C., Stewart B. (2006). Bomb radiocarbon dating calibrates beluga (Delphinapterus leucas) age estimates. Can. J. Zoology 84, 1840–1852. doi: 10.1139/z06-182
Stewart J. D., Durban J. W., Europe H., Fearnbach H., Hamilton P. K., Knowlton A. R., et al. (2022). Larger females have more calves: influence of maternal body length on fecundity in North Atlantic right whales. Mar. Ecol. Prog. Ser. 689, 179–189. doi: 10.3354/meps14040
Torres W. I., Bierlich K. C. (2020). MorphoMetriX: a photogrammetric measurement GUI for morphometric analysis of megafauna. J. Open Source Software 5, 1825. doi: 10.21105/joss.01825
Tsugawa H., Cajka T., Kind T., Ma Y., Higgins B., Ikeda K., et al. (2015). MS-DIAL: data-independent MS/MS deconvolution for comprehensive metabolome analysis. Nat. Methods 12, 523–526. doi: 10.1038/nmeth.3393
Waugh C. A., Nichols P. D., Noad M. C., Nash S. B. (2012). Lipid and fatty acid profiles of migrating Southern Hemisphere humpback whales (Megaptera novaeangliae). Mar. Ecol. Prog. Ser. 471, 271–281. doi: 10.3354/meps10059
Keywords: beluga whale (Delphinapterus leucas), body condition, non-targeted lipidomics, energy metabolism, unmanned aerial vehicle (UAV), photogrammetry
Citation: Sherrill M, Bernier-Graveline A, Ewald J, Pang Z, Moisan M, Marzelière M, Muzzy M, Romano TA, Michaud R and Verreault J (2024) Scaled mass index derived from aerial photogrammetry associated with predicted metabolic pathway disruptions in free-ranging St. Lawrence Estuary belugas. Front. Mar. Sci. 11:1360374. doi: 10.3389/fmars.2024.1360374
Received: 22 December 2023; Accepted: 15 March 2024;
Published: 19 April 2024.
Edited by:
Lars Bejder, University of Hawaii at Manoa, United StatesReviewed by:
Michael John Moore, Woods Hole Oceanographic Institution, United StatesShannon Atkinson, University of Alaska Fairbanks, United States
Copyright © 2024 Sherrill, Bernier-Graveline, Ewald, Pang, Moisan, Marzelière, Muzzy, Romano, Michaud and Verreault. This is an open-access article distributed under the terms of the Creative Commons Attribution License (CC BY). The use, distribution or reproduction in other forums is permitted, provided the original author(s) and the copyright owner(s) are credited and that the original publication in this journal is cited, in accordance with accepted academic practice. No use, distribution or reproduction is permitted which does not comply with these terms.
*Correspondence: Meredith Sherrill, c2hlcnJpbGwubWVyZWRpdGhAY291cnJpZXIudXFhbS5jYQ==; Jonathan Verreault, dmVycmVhdWx0LmpvbmF0aGFuQHVxYW0uY2E=