
94% of researchers rate our articles as excellent or good
Learn more about the work of our research integrity team to safeguard the quality of each article we publish.
Find out more
ORIGINAL RESEARCH article
Front. Mar. Sci., 10 May 2024
Sec. Marine Fisheries, Aquaculture and Living Resources
Volume 11 - 2024 | https://doi.org/10.3389/fmars.2024.1358111
 Mary K. McCabe1*Laura Mudge1Tahiry Randrianjafimanana2Nestin Rasolofoarivony2Fanny Vessaz3Robertin Rakotonirainy2Faissoil Ahmed Said3François Rakotoarisoa2Tsiorisoa Ratoniherison2Steve Box2Courtney Cox1
Octopus fisheries face heightened demand driven by depleted fish stocks and escalating economic value, leading to overextraction of octopus populations and magnifying threats to coastal ecosystems and the livelihoods of fishers who depend on them. Implementation of management strategies such as periodic fishing closures can offer sanctuary for octopus, providing the necessary space and time for the growth and reproduction of this rapidly proliferating species. Despite evidence of positive management outcomes, the role of periodic closures in the long-term sustainability of octopus populations remains uncertain. Here, we examine trends in octopus landings over time and the effects of periodic closures along the Mozambique Channel from Comoros to Madagascar (12°-25°S). Long-term trends in octopus landings varied across three regions: generally stable over a 6-year period in Comoros, increasing over a 4-year period in the Barren Isles and declining over a 17-year period in Atsimo Andrefana, Madagascar. We observed a significant increase in mean catch per unit effort (CPUE, kilograms/fisher-day), and mean total catch (kilograms/day) following periodic closures across villages extracting octopus from closure areas. When evaluating each region independently, we observed this positive effect across Comoros and Atsimo Andrefana, Madagascar while trends in the Barren Isles showed no effect of octopus closures. We applied generalized linear mixed models to examine the influence of 10 covariates on mean daily total catch and CPUE within 7 days and 30 days post-closure. Baseline conditions (quantified by the pre-closure CPUE and daily total catch), closure duration and start month of closure had positive, statistically significant correlations with post-closure CPUE and daily total catch. Additionally, closure duration from 13 to 16 weeks and closure size of approximately 70 hectares were qualitatively associated with net gains in CPUE. Although periodic closures yield positive outcomes for octopus fisheries, the effects may be short-lived, as observed in Atsimo Andrefana, Madagascar, where catch declined over the long-term despite temporary improvements. Our findings underscore a need for a diverse portfolio of management strategies to restore and sustain populations over the long-term.
Octopus fisheries are an integral part of the diet and economy of coastal communities and are threatened by multiple stressors including climate change, overfishing, illegal fishing and habitat destruction (Barnes-Mauthe et al., 2013; Muttenzer and Andriamahefazafy, 2021; Cooke, 2022; Farquhar et al., 2022). Octopuses play an important ecological role as both predator and prey in the marine food web, thus contributing to the overall health and balance of the coastal ecosystem (Yarnall, 1969; Forsythe and Hanlon, 1997; Guard, 2009). The emergence of global markets has shifted many small-scale fisheries from primarily subsistence-based to trade-focused, consequently exposing marine resources to the peril of overexploitation (Iida, 2005; Cripps and Gardner, 2016). Moreover, declining traditional finfish catches have compelled fishers to shift their attention to invertebrates, often leading to cascading impacts on the marine food web (Anderson et al., 2011). Today, octopus fisheries are expanding worldwide to meet demand and fill market gaps left by overexploited fish species, such as tuna, grouper and snapper (Sauer et al., 2021; Ospina-Alvarez et al., 2022). From East Africa to Hawaii, small-scale octopus fisheries produce upwards of 88,000 tons of catch a year (Willer et al., 2023). Octopus cyanea, also known as the day or big blue octopus, is a steadily harvested resource from Indo-Pacific reefs (Norman, 1991; Loganimoce et al., 2023; Willer et al., 2023). Approximately 3,000 tons of octopus are exported annually from the West Indian Ocean (WIO), worth an estimated value of US$12.2 million per year (Rocliffe and Harris, 2016).
Small-scale fisheries in the coastal villages of southwest Madagascar are estimated to employ 87% of the adult population and generate approximately 82% of household income (Barnes-Mauthe et al., 2013; Oliver et al., 2015). Fishers from Madagascar are part of a larger market of buyers and exporters that supply octopus to foreign markets (Humber et al., 2006). The Barren Isles fishery is seasonal, with fishers migrating annually to the islands from April to November following local weather patterns (Muttenzer and Andriamahefazafy, 2021). The arid climate and soil profiles of western Madagascar do not support large agricultural production, one of many reasons why the cultural identity and economy of the Vezo (‘people of the sea’) are naturally intertwined with the highly productive marine systems of the Mozambique Channel (Astuti, 1995). Throughout the Comoros Islands, local fish consumption can constitute as much as 50% of landings, with large pelagic fish making up approximately 75% of the country’s overall fish consumption (Breuil and Grima, 2014). Comoros lacks the capacity for octopus storage and transportation to support larger export markets and hence remains a subsistence-based fishery with most fishers also maintaining other sources of income (Ahamada et al., 2008; Hauzer et al., 2013a; Freed and Granek, 2014).
As the demand and price of octopus have risen, the once predominantly female fishers that glean for octopus in the rocky intertidal at low tide have been joined by more male fishers that spear dive at deeper depths, impacting catch across all regions (Guard and Mgaya, 2002; Doherty et al., 2015; Rocliffe and Harris, 2016). Both male and female fishing associations exist in Comoros, where men historically fished for pelagic and reef fishes on small-scale fleets of pirogues and motorboats (Doherty et al., 2015). However, interviews with local fishers reported declines in catch abundance and mean fish sizes in recent decades (Hauzer et al., 2013a, b), suggesting more fishers may now be participating in the octopus fishery and ‘fishing down’ marine food webs (Rocliffe and Harris, 2016; Sauer et al., 2021).
The small-scale octopus fisheries of Madagascar and Comoros are managed both nationally and locally. Seasonal octopus closures banning all octopus harvesting on the west coast of Madagascar (from December 15 to January 31) and on the east coast of Madagascar (from June 1 to July 15) were established by the national government in 2005. A minimum size limit of 350g was also established by the national government for O. cyanea (Rocliffe and Harris, 2016). However, since the most common method of fishing (gleaning) is unselective, size limits are difficult to implement and enforce. As an additional measure to safeguard well-established traditional fishing grounds, local management groups and fishing associations implement community-level periodic closures of a predefined fishing ground that can vary in duration and size, typically occurring outside or in complement to the national closure (Supplementary Table 1). These closures typically represent approximately one-fifth of a village’s total fishing grounds. When implemented in conjunction with other management strategies like size limits, gear restrictions, species bans and limited access, periodic closures can expedite population recovery and maximize catch (Johannes, 1982; Cohen and Foale, 2013; Carvalho et al., 2019).
In Madagascar, the first locally-led periodic closure was implemented in the village of Ankereo, Atsimo Andrefana, in 2004. Initial success of this management initiative catalyzed the establishment of the first locally managed marine area (LMMA) in Madagascar and inspired neighboring villages to establish similar management structures with closure implementations. Today, independent civil society network initiatives such as MIHARI, a national Malagasy network of LMMAs, connects fishers across the country by supporting workshops, advocating for community rights and fisheries reform. The research results and best practices shared through these network forums have prompted numerous management measures across the country, including the initial Barren Isles octopus closures in 2018. Subsequently, the Vezo Miray Nosy Barren Association was founded as an officially recognized legal entity entrusted with the responsibility of overseeing the LMMA in this area. The management associations in southwest Madagascar and Barren Isles are legally created and empowered to set and enforce local rules known as Dina and manage local resources in their designated areas. In the Comoros archipelago, periodic closures were first established in 2016 supported by the Moheli National Park and governmental (WorldBank) projects. While LMMAs have not been created in Comoros as of yet, locally managed male and female fishing associations exist in some villages and implement periodic closures in collaboration with local authorities.
Considering octopus life history traits when designing closure parameters such as duration, season, habitat and size can increase the probability of octopus reaching reproductive age, enabling fishers to capture larger octopus with comparable effort (Humber et al., 2006; Emery et al., 2016; Goetze et al., 2018). This, in turn, can lead to increased income for fishers (Oliver et al., 2015; Silas et al., 2022). Periodic closures are argued to be most advantageous to this fast-growing invertebrate during reproduction and brooding seasons to protect larval cohorts (Cohen and Foale, 2013; Emery et al., 2016), as well as the post-settlement stage, when growth rates are maximized (Benbow et al., 2014; Oliver et al., 2015). Females are known to brood in the deep rocky subtidal (~100m) (Van Heukelem, 1976; Herwig et al., 2012). O. cyanea paralarvae can spend approximately 30 to 60 days in the water column traveling more than 100 km before settling in a benthic coral environment (Wells and Wells, 1970; Van Heukelem, 1973; Bower et al., 1999; Casu et al., 2002; Murphy et al., 2002). Local environmental conditions such as wind speed, sea surface temperature (SST) and chlorophyll-a can affect octopus landings; often on a time lag due to their influence on food availability at the paralarval stage (Chande et al., 2021). Growth and maturation can vary greatly based on latitude and local environmental factors (Guard and Mgaya, 2002; Herwig et al., 2012; Raberinary and Benbow, 2012; Silas et al., 2021). Based on the life-history study of O. cyanea, researchers in Tanzania have recommended (April-July) periodic closures to protect growth periods; or the use of rotational closures for these cyclic spawners (Guard and Mgaya, 2002; Chande et al., 2021). Past studies from Madagascar recommended closures from June to August and September to November to protect settlers from recruitment peaks during maximum growth periods (Raberinary and Benbow, 2012; Oliver et al., 2015). The high plasticity of octopus life history traits and opportunistic feeding regimes are ideal for managing adaptive octopod populations via closures amid modern fishery and climate stressors (Caballero-Alfonso et al., 2010; Quetglas et al., 2013; Rodhouse, 2013; Rodhouse et al., 2014). Studies suggest that octopus fisheries could be benefiting from a changing ocean environment; octopuses were found to grow quicker and mature earlier at increased temperatures (Forsythe and Hanlon, 1988; Caverivière et al., 1999; Semmens et al., 2004; André et al., 2009; Uriarte et al., 2012; Caamal-Monsreal et al., 2016). These plastic and condensed biological stages make octopus fisheries adaptable to future climate scenarios and suitable for dynamic closure schedules.
While there is evidence suggesting that periodic closures of octopus fisheries have effectively enhanced fisher catch and income, further research is required to explore optimal closure design parameters and formulate long-term management strategies (Benbow and Harris, 2011; Oliver et al., 2015; Silas et al., 2022). Here, we examine long-term trends in octopus catch (> 4 years) and short-term effects of periodic octopus closures (7 and 30 days) across Madagascar and Comoros. Our analyses establish baselines for octopus catch, identify major drivers of positive closure outcomes and provide management recommendations for designing effective closures. Additionally, we examine the ongoing use of closures in the Atsimo Andrefana region of Madagascar.
Octopus landings and periodic closure data were analyzed from three regions in Southeast Africa situated along the Mozambique Channel (Figures 1A, B). The selection of these three regions was informed by the continued efforts of local communities to implement periodic closures and the availability of reliable octopus landings data. The first region is located in Comoros (Figure 1C) on the southwest side of the island Anjouan (Nzwani). The other two regions are situated on the west side of Madagascar: the Barren Isles in the Melaky region (Figure 1D), which is locally managed by the Vezo Miray Nosy Barren (VMNB) Association and the southwest region located within the Atsimo Andrefana region (Figure 1E), which includes, Manjaboake, Sambele, Soariake, Teariake and Velondriake LMMAs. The latitudinal range of our tropical study region extends from 12°S to 25°S.
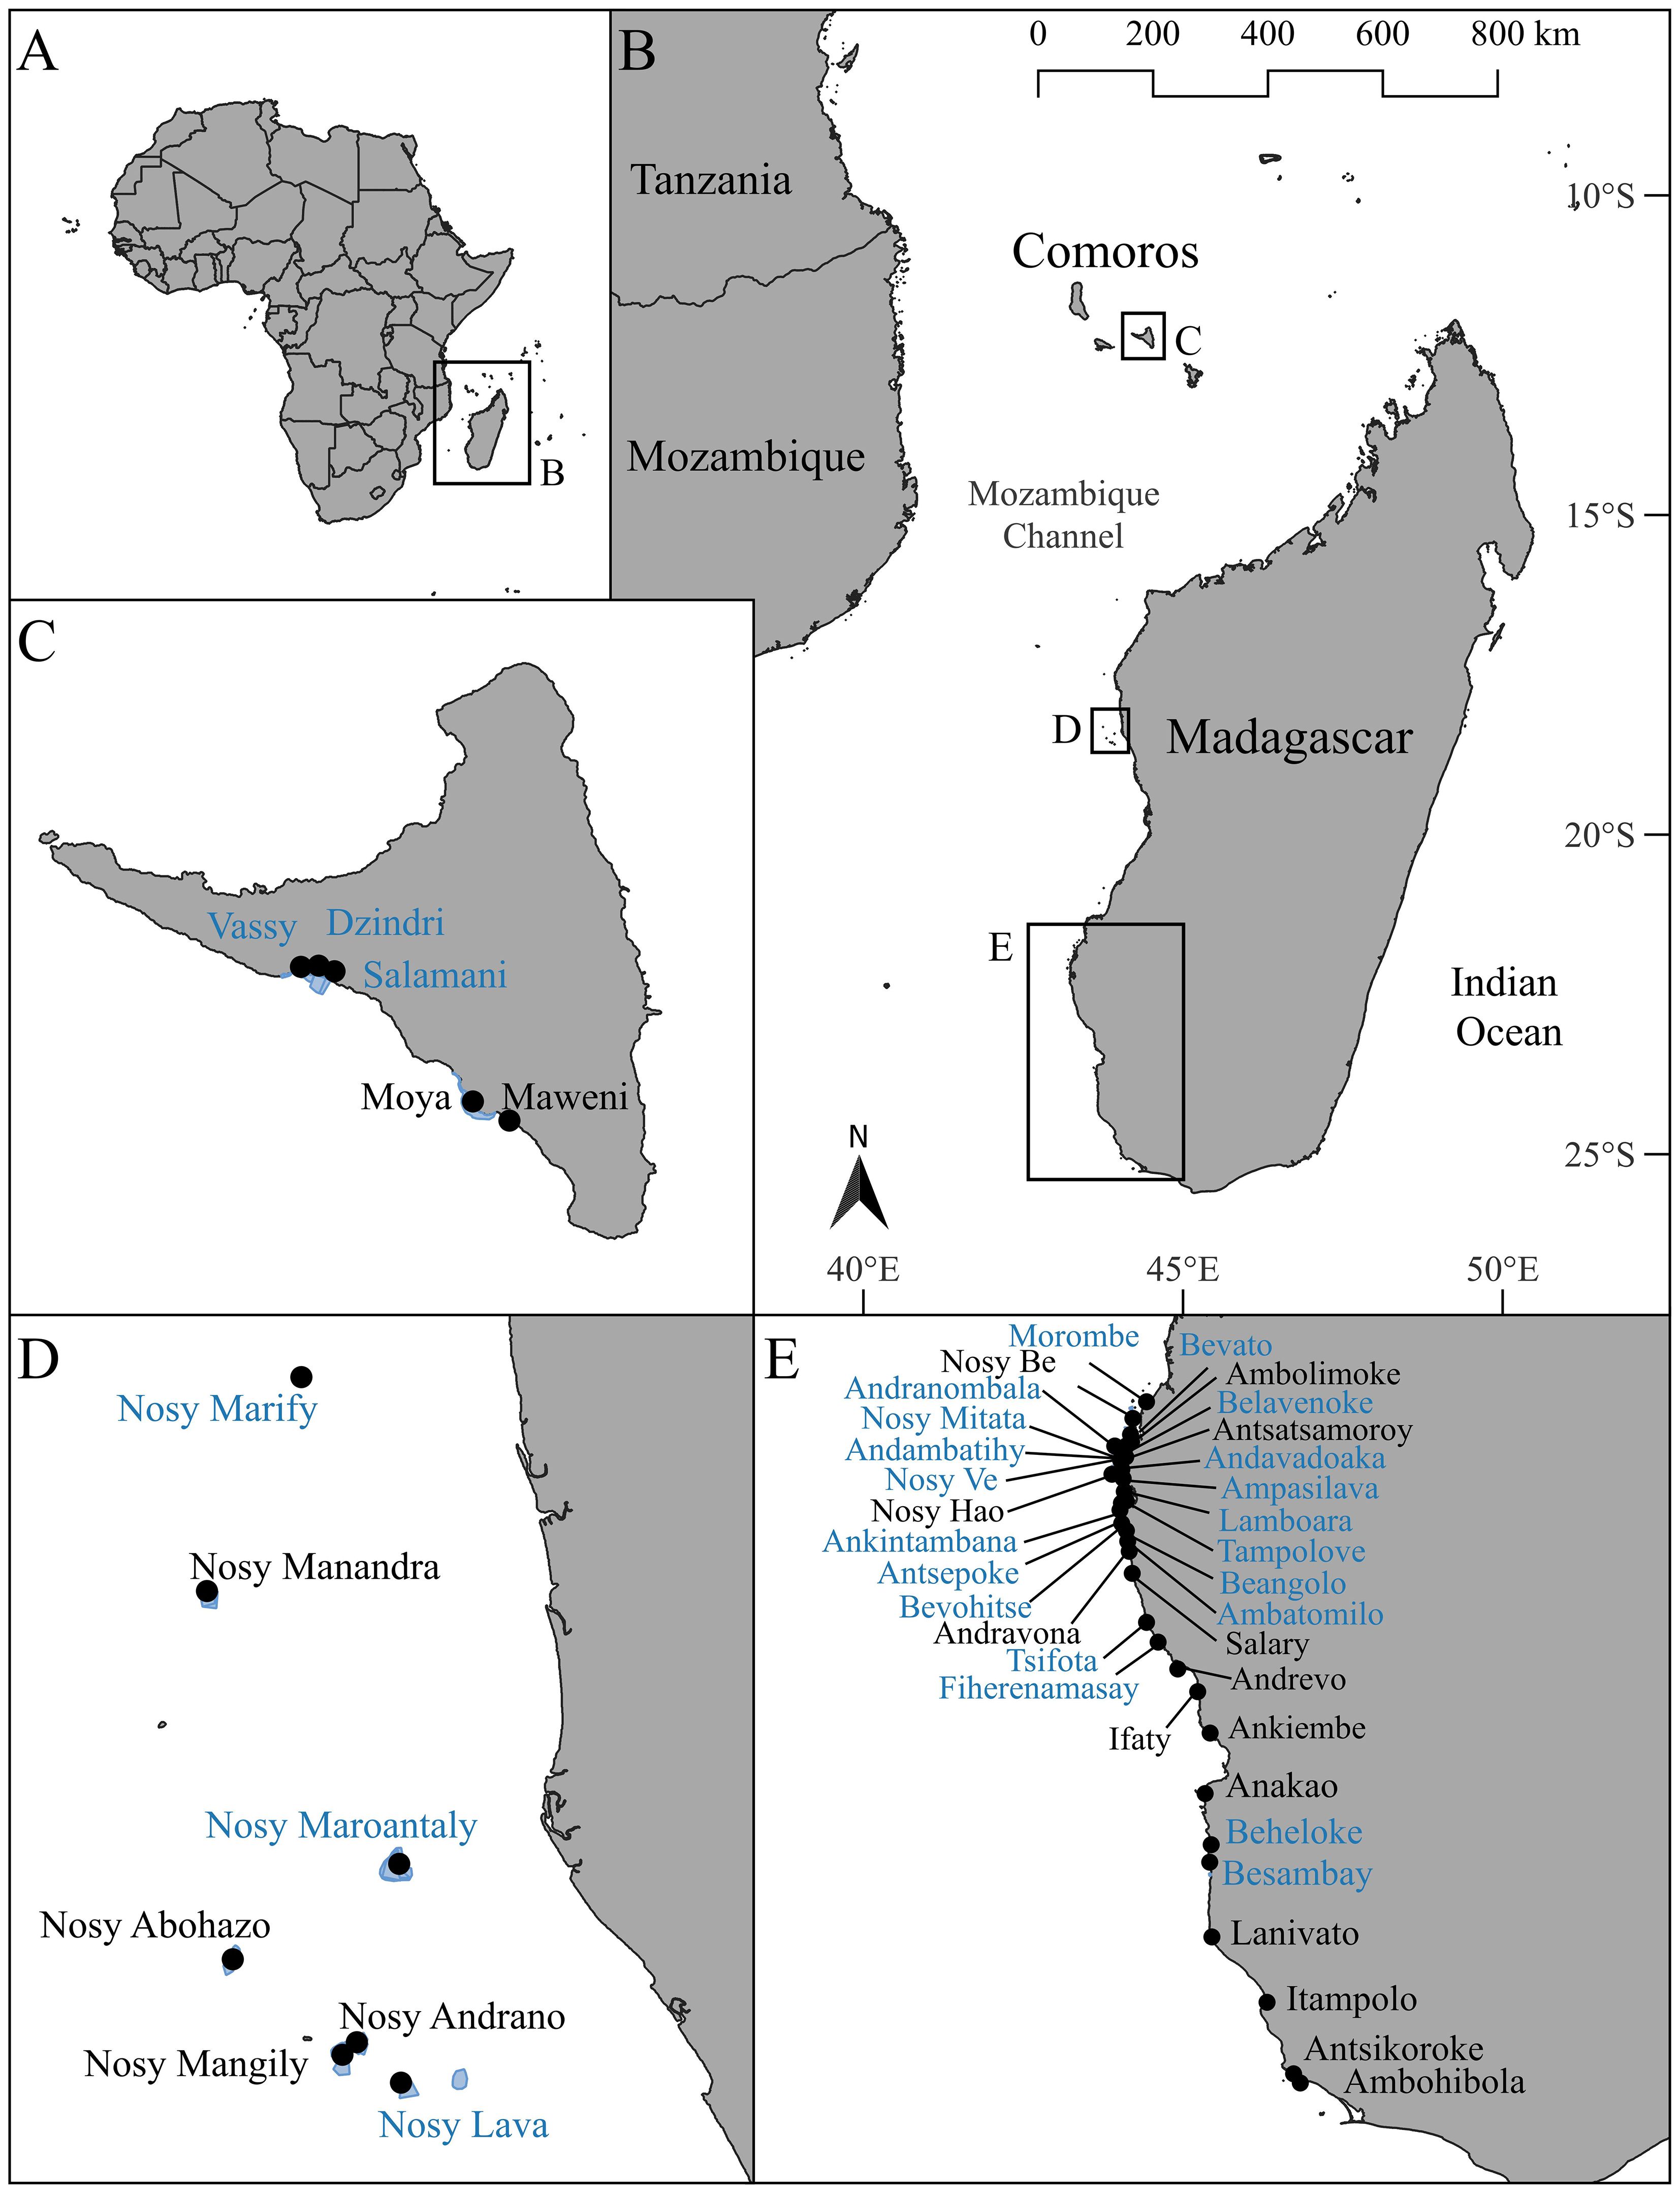
Figure 1 Map of Africa (A) with an inset of the sampling region (B) focusing on octopus fishery closures on the island of Anjouan (Nzwani), Comoros Islands (C), the Barren Isles, Madagascar (D) and the Atsimo Andrefana province, Madagascar (E). Blue polygons represent the closure areas. Black circles are the villages where octopus landings have been sampled. Villages that were included in the closure analyses are colored blue.
Circulation patterns through the Mozambique Channel originate from the WIO. The westward flow of the South Equatorial Current (SEC) is deflected on the northern tip of Madagascar imparting a series of clockwise and anticlockwise eddies and gyres around the Comoros archipelago (Schott et al., 2009). The main current ultimately splits with the East African Coastal Current (EACC) carrying water north past Tanzania and a complex system of mesoscale (100-300 km) eddies dominating meridional circulation south through the Mozambique Channel (Collins et al., 2014; Ternon et al., 2014). The eddies force deep water toward the surface, promoting localized upwelling and a high level of marine productivity and biodiversity (Ternon et al., 2014; Charles et al., 2020). Comoros is located in the Northern Mozambique Channel where coral reefs are reported to be the most structurally complex and diverse in the WIO (Obura et al., 2018). The Barren Isles lie at the shallower, narrow boundary adjacent to the Davie Ridge, which separates the two basins of North and South Mozambique Channel (Charles et al., 2020). The Atsimo Andrefana region is geographically influenced by the Southwest Madagascar Coastal Current (SMACC), which flows south opposite to the dominant winds, impacting local upwelling and larval transport patterns (Ramanantsoa et al., 2018). Complex connectivity and dispersal patterns exist throughout the Channel, evident by the differentiation of genetic lineages in some, but not all marine species across known barriers (Obura et al., 2018). Genetic studies of O. cyanea found a high level of connectivity among WIO populations, with low but significant differentiation between North and South Madagascar due to potential restricted gene flow (Van Nieuwenhove et al., 2019). Understanding circulation, dispersal and connectivity patterns can aid in the identification of important marine areas in the region.
Local community groups determined the location, size, temporal period (season) and duration of periodic closures with the support of partners dedicated to supporting small-scale fishery management including Blue Ventures, Dahari, Reef Doctor, Wildlife Conservation Society (WCS), World Wildlife Fund (WWF), Institut Halieutique et des Sciences Marines (IHSM) and government authorities. Participatory mapping exercises allowed community groups to define spatial boundaries of each closure in Google Earth. Areas were typically closed from 6 to 19 weeks and ranged in size from 7 to 245 ha. A closure is determined by the spatial area restricted from fishing, and a closure event is characterized by both the designated spatial area and the dates during which fishing is prohibited. The initiation month of each closure’s temporal period was determined using a combination of traditional knowledge and reproductive studies from each region. All octopus fishing is prohibited in closure areas during closure events. Closure surveillance is organized by local communities across all regions. This process typically includes 2-3 individuals patrolling the area several times a week during both the day and night. Surveillance efforts were assumed to be consistent across closure events. Incorporating quantitative measures of surveillance and enforcement into future studies is recommended to strengthen our understanding of their impact on periodic closures.
To evaluate the effectiveness of periodic closures, we analyzed landings data by village rather than focusing solely on octopus harvested from closure areas. Fishers commonly harvest from various locations during a single trip, making it unreliable to assign individual octopus to specific fishing sites. Moreover, this approach allowed us to capture trends of all landed octopus, not just those harvested from closure areas. This is important for understanding changes during closure periods as fishers shift fishing activities to open areas. A total of 449 closure events occurred across the three regions between 2004 and 2022. Changes in octopus landings were analyzed for both a period of 7-days and 30-days before and after a closure. These time intervals were chosen to examine the closure effect after the first tidal series (~7days) and into the second or third set of spring low tides (~30days). For inclusion in the analysis, a closure event required a minimum of three days of observations both before and after the closure, with at least five fishers and ten octopuses documented (Oliver et al., 2015). For the 30-day period, 93 out of the 449 closure effects had sufficient data for analysis; and for the 7-day period, 64 out of 449 closure events had sufficient data for analysis (see Supplementary Table 1 for full closure details).
Octopus catch data was collected at landing sites across 45 villages. In each village, enumerators collected octopus landings data at access points between the village and the reef or at local village markets. Enumerators included both women and men from the local community. Involving community members in this process builds local capacity for gathering and understanding fisheries data while ensuring consistency, as fishers trust the data collector. NGOs provided enumerator trainings on fisher survey content and data collection methodology. Data were collected using standard survey forms recorded on paper or through one of two digital systems: KoboToolbox (https://www.kobotoolbox.org/) in Madagascar and Abalobi (https://abalobi.org/) in Comoros. To ensure data quality throughout the year, ongoing training and support were provided, accompanied by data verification processes. Data collectors aimed to record octopus landings four to five days per week throughout the year, documenting information such as date, village, fisher’s name, gender, species, octopus sex, total catch weight, individual weight, fishing site, fishing method and gear type. Given that enumerators are community members it was not possible to collect data every day. Data was recorded on the same days each week as much as possible to reduce bias. Daily catch per unit effort (kg/fisher-day), daily total octopus catch (kg/day) and the number of fishers (n/day) were estimated for each village associated with a closure. Refer to Table 1 for a summary of octopus data collected across all villages and time periods.
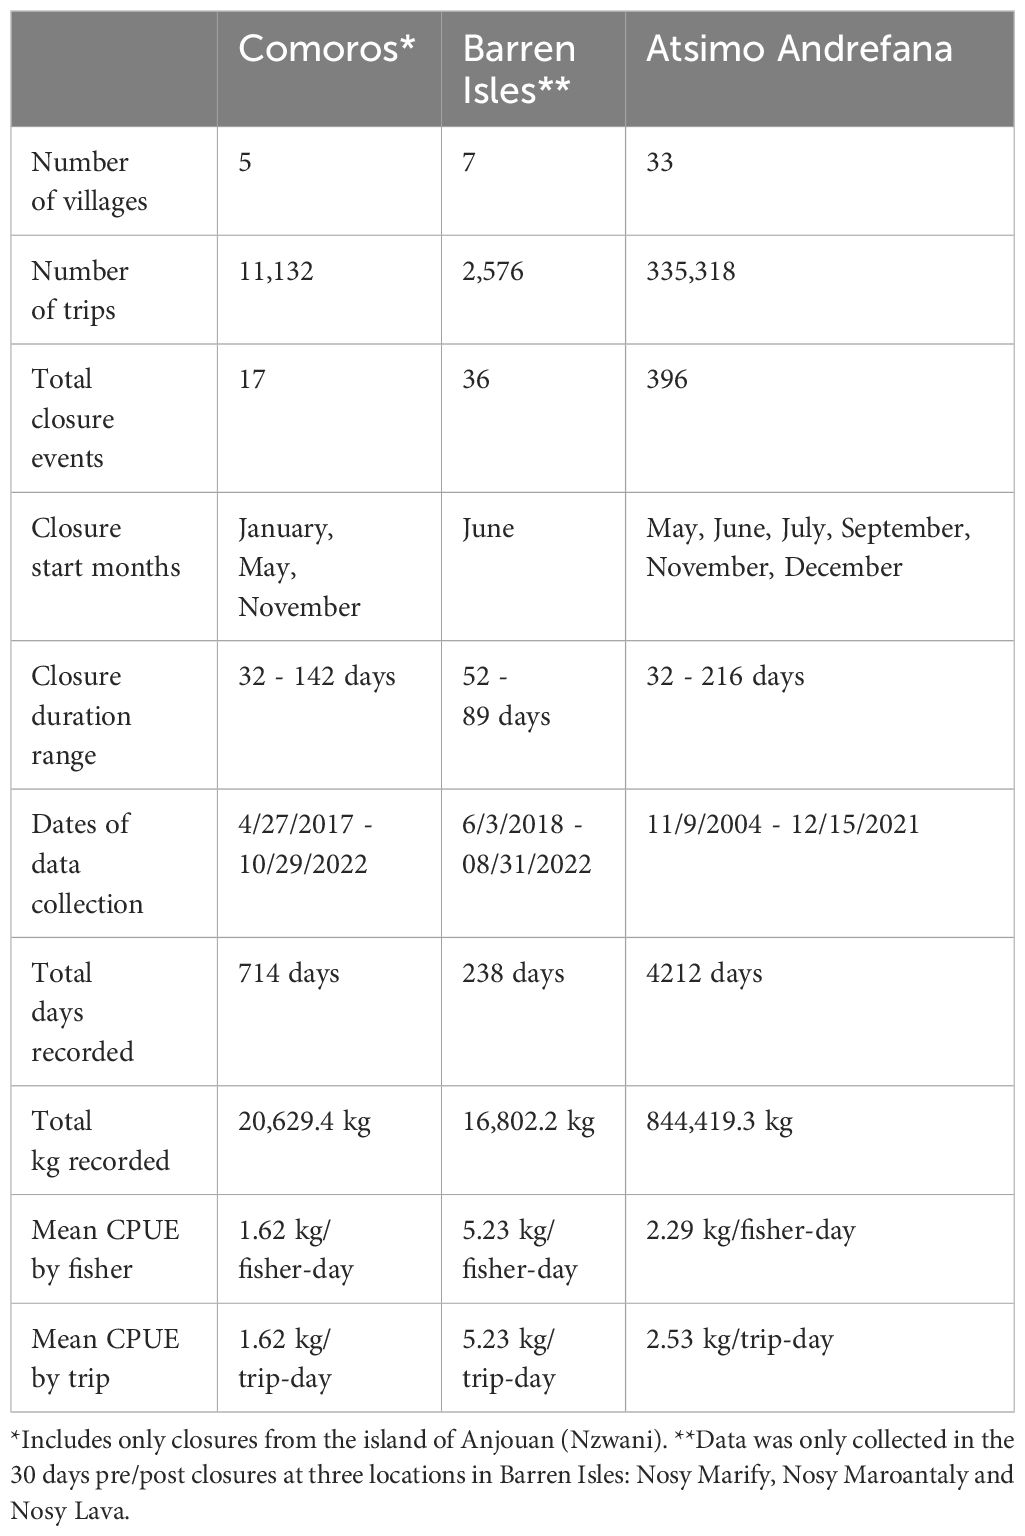
Table 1 Closure events and octopus data summaries across regions.
Habitat type, sea surface temperature (SST) and larval connectivity have the potential to influence variability in octopus catch (Scheel et al., 2017; Van Nieuwenhove et al., 2019; Chande et al., 2021). To account for these environmental factors across our study regions and villages, we obtained data on habitat coverage, mean SST and larval import at each closure location. Although wind speed may also have an impact on octopus catch, we did not include it in our analysis because of insufficient satellite data coverage throughout our study period. O. cyanea live and forage within rocky substrate and coral reefs, while also maintaining dens in naturally occurring holes in the hard substratum (Forsythe and Hanlon, 1997). Benthic habitat maps, sourced from the Allen Coral Atlas (2022), were intersected with closure area shapefiles in QGIS to determine the proportion of the closure covered by suitable octopus habitat. Coverage (%) of each habitat class was calculated by dividing the intersected or overlapping habitat type area by the closure’s total area. The classes of coral/algae, rubble and rock were combined (summed percent cover) to create a “coral complex” class that is of ecological importance to our targeted coastal octopus populations.
The mean temperature over the four months preceding the opening date of each closure was determined using satellite-derived SST. The temperature during this time period is representative of conditions that can potentially influence growth during the larval and juvenile stage and size of octopus when harvested (Silas et al., 2021). Data was extracted from NOAA ERDDAP satellite database using the ‘rerddap’ and ‘rerddapXtracto’ packages in R (Mendelssohn, 2022; Chamberlain, 2023). The date range, latitude, longitude and a radius of 0.2-degree units, was used to define the parameters for satellite data extracted at each closure location. Average SST (‘erdMH1sstd8dayR20190SQ’) was obtained from AquaMODIS 8-day composite data (https://coastwatch.pfeg.noaa.gov/erddap/).
Ecological connectivity, estimated as larval import, was derived from a species-specific biophysical model simulating probable dispersal and settlement patterns of four key ecological and commercial fish species (Epinephelus malabaricus, Lethrinus lentjan, Caesio teres and Scarus ghobban) across coral reef habitats in Mozambique, Comoros and the western coast of Madagascar (Treml and Critchell, 20201). The model was developed to inform marine reserve network design supported by an international NGO, Rare, using aspatially explicit biophysical modelling framework (Treml et al., 2008, Treml et al., 2012, Treml et al., 2015; Krueck et al., 2022; Muenzel et al., 2023). Twenty years of hydrodynamic data, the product of an ocean circulation model developed in the Delft3D modelling system, were used to force the biophysical model. The native model output had an unstructured variable resolution ranging from 1 km nearshore and around 15 km near the open ocean boundaries. The biophysical model incorporated species-specific biological parameters including relative adult density, reproductive output, spawning phenology, periods of pre-competency, competency, dispersal duration and larval mortality. The life history parameters determine when and what proportion of larvae settle in habitat cells over time. Larval import was defined as the product of the number of nodes that a focal node is connected to and the average weight to these nodes adjusted by the tuning parameter (alpha) of 0.5 which gives equal importance to both the number and weight of connections (Opsahl et al., 2010). Across the modeled species, larval competency ranged from 10 to 24 days and pelagic larval duration (PLD) ranged from 31 to 43 days. Spawning windows included January to April, March to August, and year-round. The larval mortality rate during the dispersal period was assumed to be 5% per day for all species (White et al., 2014). Octopus have a typical pelagic larval duration of 30 to 60 days, competency window of approximately 15 days and likely spawn throughout the year. As biophysical models for octopus were not conducted within our study area, we used the mean larval import value across the four modeled fish species to represent general ecological connectivity at coral reef patches across Madagascar and Comoros. See Supplementary Table 2 for a full list of environmental and contextual variables.
To understand the trends in octopus catch over the entire duration of data collection, we evaluated trends in the average monthly CPUE (kg/fisher-day) and total catch (kg/day) for each region. Data was aggregated by month across each village to account for potential inaccuracies and gaps in daily data collection. As not all villages had comprehensive time series data (with some data collection focused only around closure periods), a regional trend analysis provided a more accurate depiction of the general context regarding the variation in octopus catch over time. We used generalized additive models (GAMs) to test the relationships between mean monthly CPUE (kg/fisher-day) and total catch (kg/day) over time. GAMs were preferred to generalized linear models as we expected non-linear relationships between variables. The best models were chosen based on the lowest Akaike’s information criterion (AIC) and all models used a Gamma distribution and log function. Smoothing parameters were estimated using REML. GAMs were run using the ‘mgcv’ package (Wood, 2011) in R. The model fits were validated by examining the residual plots.
Paired Wilcoxon tests were used to determine significant differences in our response variables (i.e. CPUE or total catch) before and after a closure, within both 7-day and 30-day time intervals. These differences were evaluated across all regions and within each individual region. To identify effective size and duration of closures, we performed a breakpoint regression analysis between each of these variables and the absolute change in mean CPUE before and after a closure. We used the ‘segmented’ package in R (Muggeo, 2017) to identify significant change points which may represent a minimum duration or size of closure that provides a net positive change in CPUE.
A mixed model statistical approach was used to evaluate the relationship between response and predictor variables associated with each closure. Using the lme4 package in R (Bates et al., 2015), we developed generalized linear mixed effect models to test closure effects on four response variables: mean village total catch and CPUE within 7- and 30-days post-closure. The fixed effects of the final models included the pre-closure catch/CPUE, closure size (ha), duration (days), period (starting month of the closure, 1-12), nth closure for that village, number of villages associated with the closure, proximity of the closure to the village (km), larval connectivity, mean SST, coral complex (%) cover and microalgal (%) cover. Three closure events within the Barren Isles region at the village Nosy Lava were removed from the mixed model analysis due to a lack of habitat coverage data. Village and starting year of the closure were considered as random effects, accounting for potential spatial or temporal variation. Raw data and model residuals were analyzed for normality, heteroscedasticity, outliers and collinearity. Mean fishers per closure was excluded from the mixed model analysis due to its use when calculating CPUE. The benthic categories of sand and seagrass (%) coverage were removed as predictor variables due to high collinearity with coral complex cover (VIF >5). The fixed-effects variables are on scales that differ in orders of magnitude, so to allow for direct comparison of regression coefficients, all fixed-effect variables were centered and scaled prior to modeling, using the gscale function in R (Long, 2022). Distribution fitting and comparison of candidate models was completed to guide model specification and ultimately determine a final global model structure for each response variable. This included checking model assumptions (e.g. multicollinearity, homogeneity of variance, etc.), comparing model distribution fits and evaluating random-effects structure using the ‘performance’ R package (Lüdecke et al., 2021).
Using the ‘MuMIn’ package in R (Bartoń, 2023), we conducted model selection on each global model, running all possible combinations of co-variables fitted by maximum likelihood, to identify the top models that best explain the response variables. Models with ΔAICc < 2 were retained for model averaging, as they have strong evidence for containing the best fit model. Full averaged coefficient estimates were used to determine significant relationships between predictor and response variables. Supplementary Table 3 reports a summary of top models, including which predictors were retained and the model AIC value, and top results were then model averaged to determine estimates and importance. These results helped determine which predictor variables are associated with positive catch outcomes to inform management recommendations.
Trends in monthly octopus CPUE and total catch varied across regions (Figure 2). Mean monthly CPUE and total catch in Comoros indicate a steady extraction of octopus neither significantly increasing or decreasing between 2017 and 2022 (F = 3.471, p = 0.067; F = 1.118, p = 0.406). Since the monitoring of octopus landings began in 2018 across the Barren Isles, mean monthly CPUE has increased over time (F =6.929, p = 0.0052) and mean monthly total catch exhibits an increasing trend although not statistically significant (F = 1.201, p = 0.317). From 2004 to 2011, we observed an increase in mean monthly CPUE in Atsimo Andrefana followed by a steady decrease through 2021 (F = 14.05, p = <0.001). Similarly, we observed fluctuations in mean monthly total catch from 2004 to 2021, with catch declining over the past 6 years (F = 3.05, p =0.005).
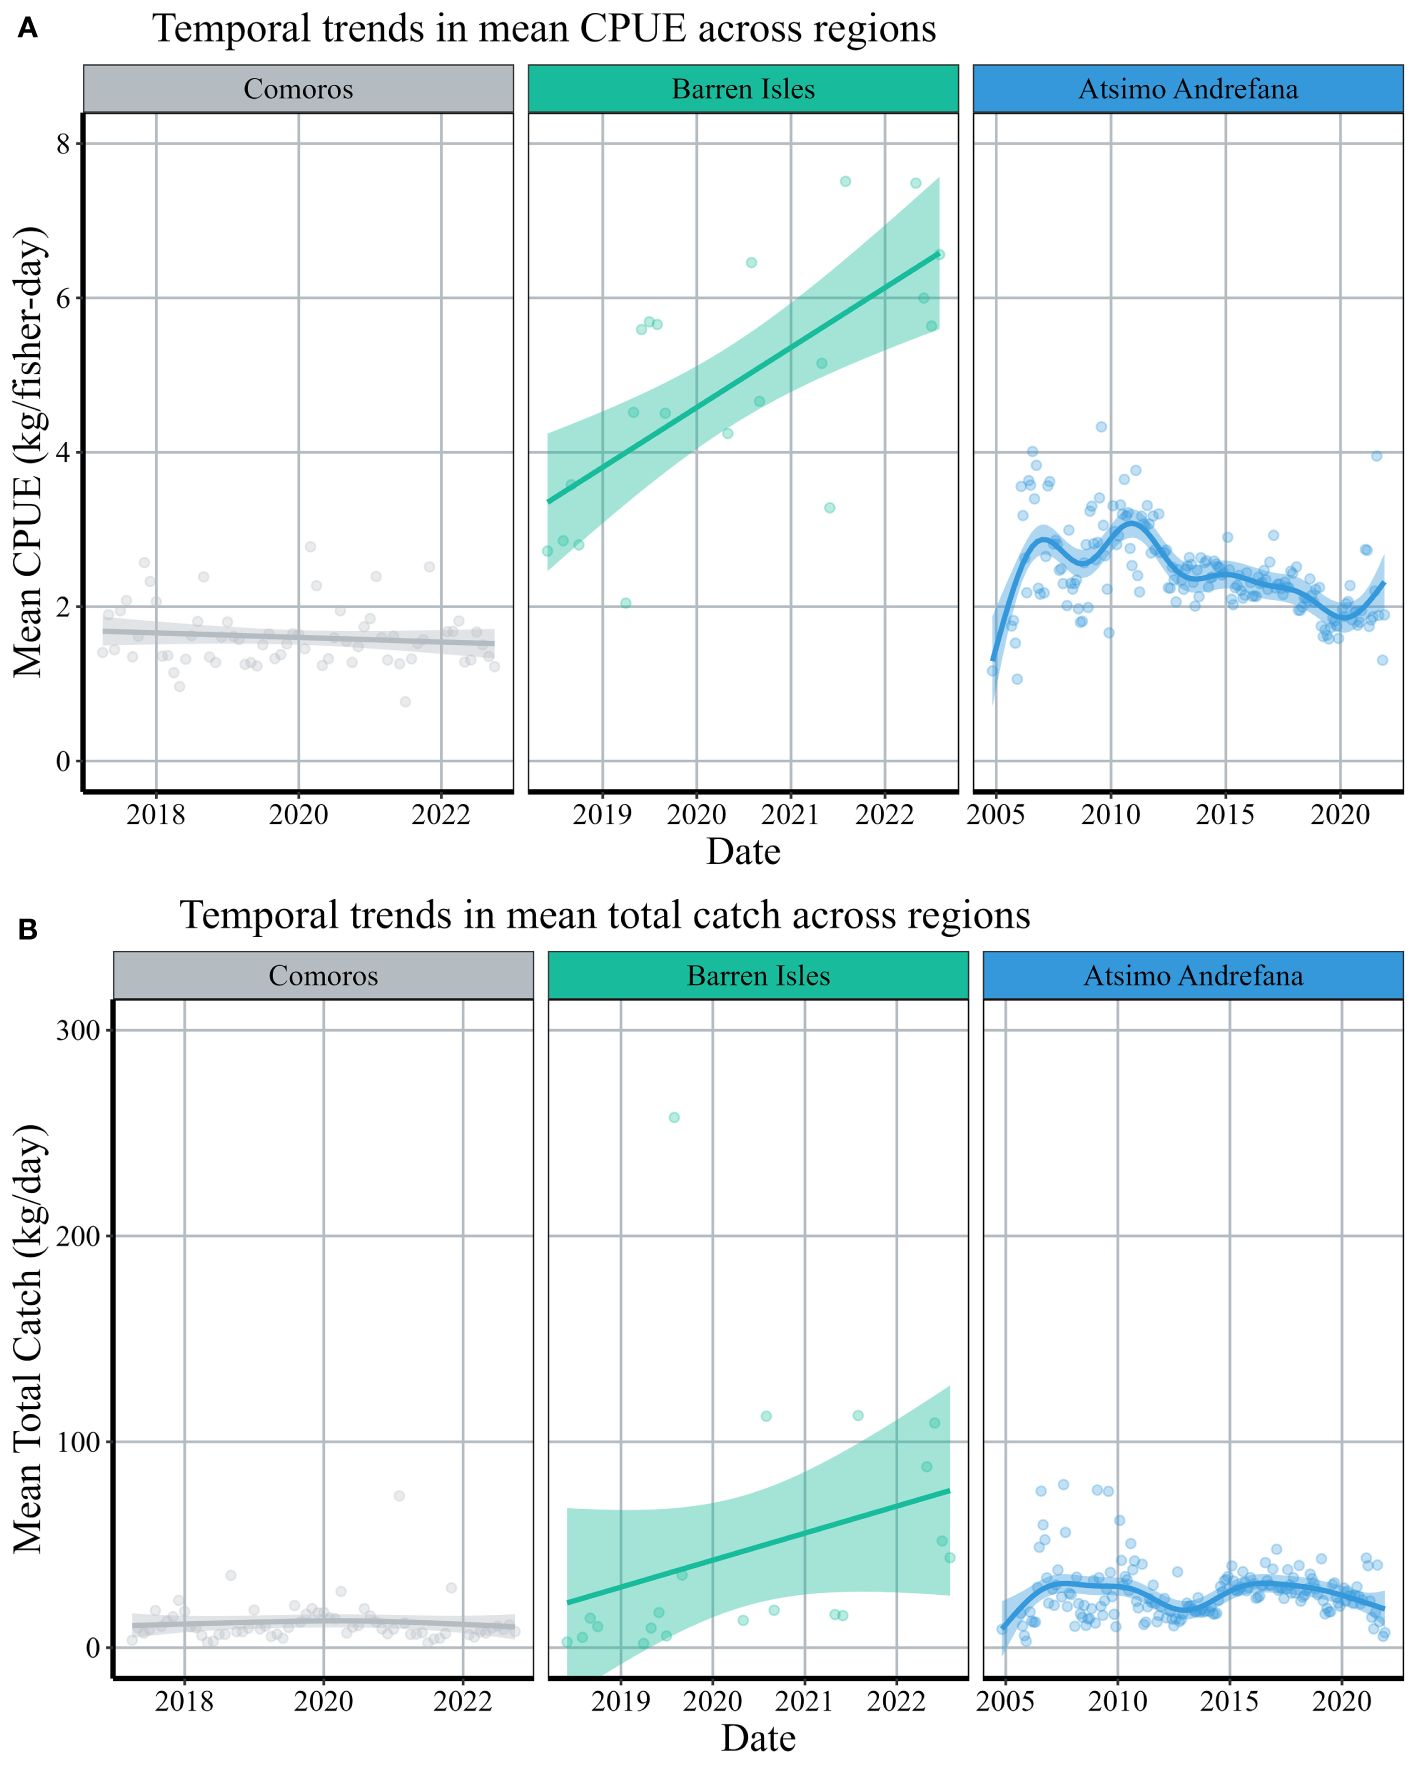
Figure 2 Temporal trends of mean (A) CPUE and (B) daily total catch across regions. CPUE and total catch was averaged by month among all villages in a region. Solid lines represent the gam-smoothed temporal trends of each region and confidence intervals are represented by the surrounding transparent color. Note different scales on the x-axis across regions.
After examining 93 closures across 26 villages, we observed significant increases in median total octopus catch and CPUE within both 7 and 30 days following periodic closures (Figure 3, Table 2). Median octopus CPUE (± standard error) increased from 2.0 ± 0.12 kg/fisher-day 30 days before a closure to 2.5 ± 0.12 kg/fisher-day after a closure (Figure 3A, Table 2). Median CPUE also increased from 2.1 ± 0.16 kg/fisher-day to 2.8 ± 0.17 in the 7-day time interval (Figure 3B). Median daily total catch weight recorded within 30 days of a closure increased by 95% from 19.5 ± 1.62 kg/day to 38.0 ± 3.37 kg/day across villages (Figure 3C, Table 2). The mean number of fishers increased from 10.3 ± 6.3 fisher/day before the closure to 16.4 ± 10.0 fishers/day after the closure. Median daily total catch in the 7 days prior to a closure was 24.4 ± 2.13 kg/day (11.5 ± 6.9 fishers/day) and increased to 62.4 ± 8.32 kg/day after the closure with approximately 23.6 fishers/day (Figure 3D). Median CPUE (30-days) post-closure increased significantly in the Atsimo Andrefana and Comoros regions (Table 2), while CPUE did not differ before and after closures in the Barren Isles (Figure 4A). Median daily total catch increased significantly after a closure in all regions (Figure 4B, Table 2).
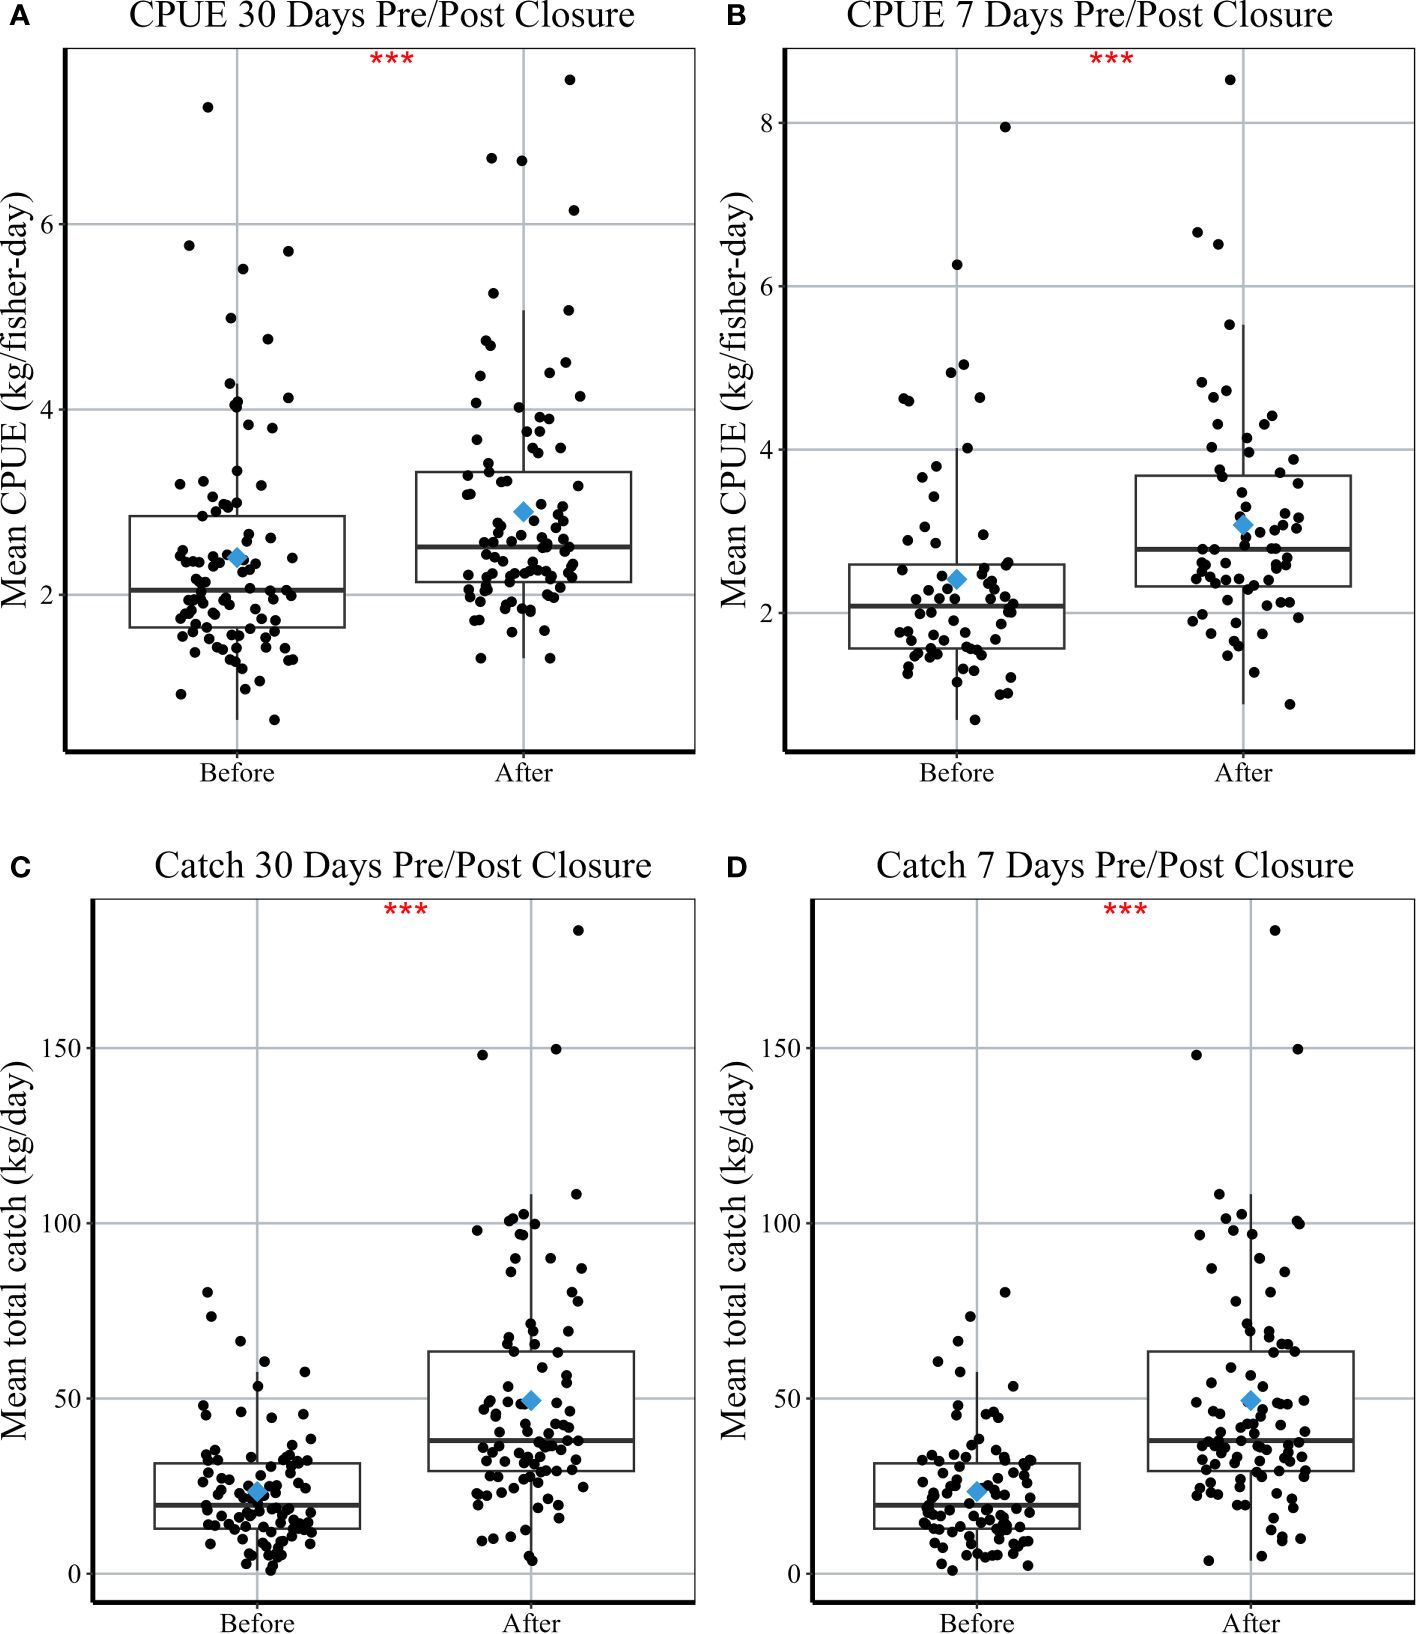
Figure 3 Comparison of (A, B) mean CPUE (kg/fisher-day) and (C, D) mean daily total catch (kg/day) per village in the 30 and 7 days before and after a closure. Each box or interquartile range (IQR) extends from the 25th to the 75th percentile; vertical lines (‘whiskers’) represent ±1.5*IQR; bold black lines represent median values; points represent individual village means per closure. Blue diamonds represent the mean values pre/post closure across all regions. Stars represent a significant difference before and after closures using a paired Wilcoxon test, with significant codes: 0; ***, 0.001; **, 0.01; *, 0.05; 0.1; 1.
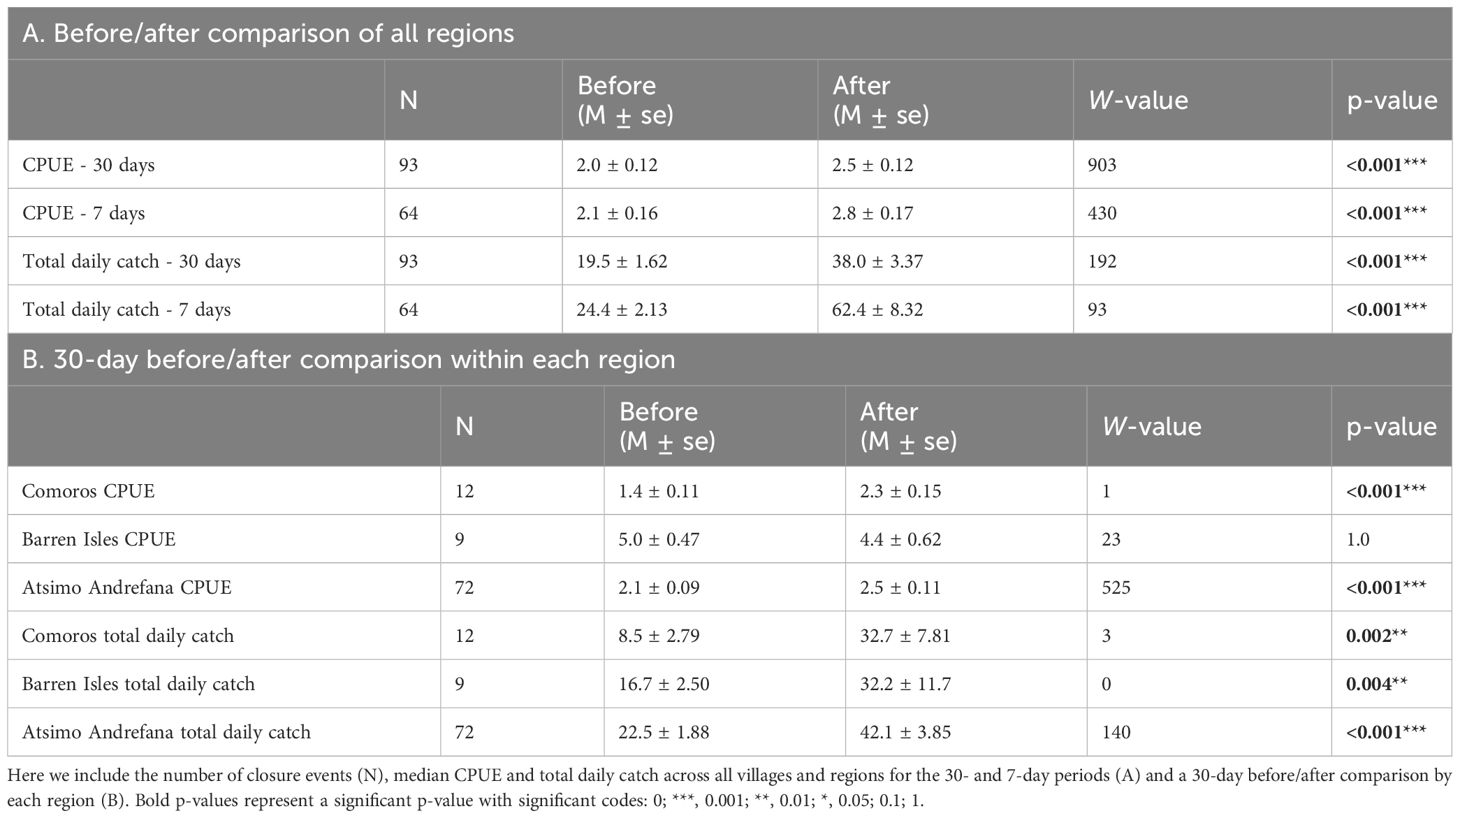
Table 2 Comparison of median values (M) and standard error (se) before and after a periodic closure using a paired Wilcoxon test (W, p-values).
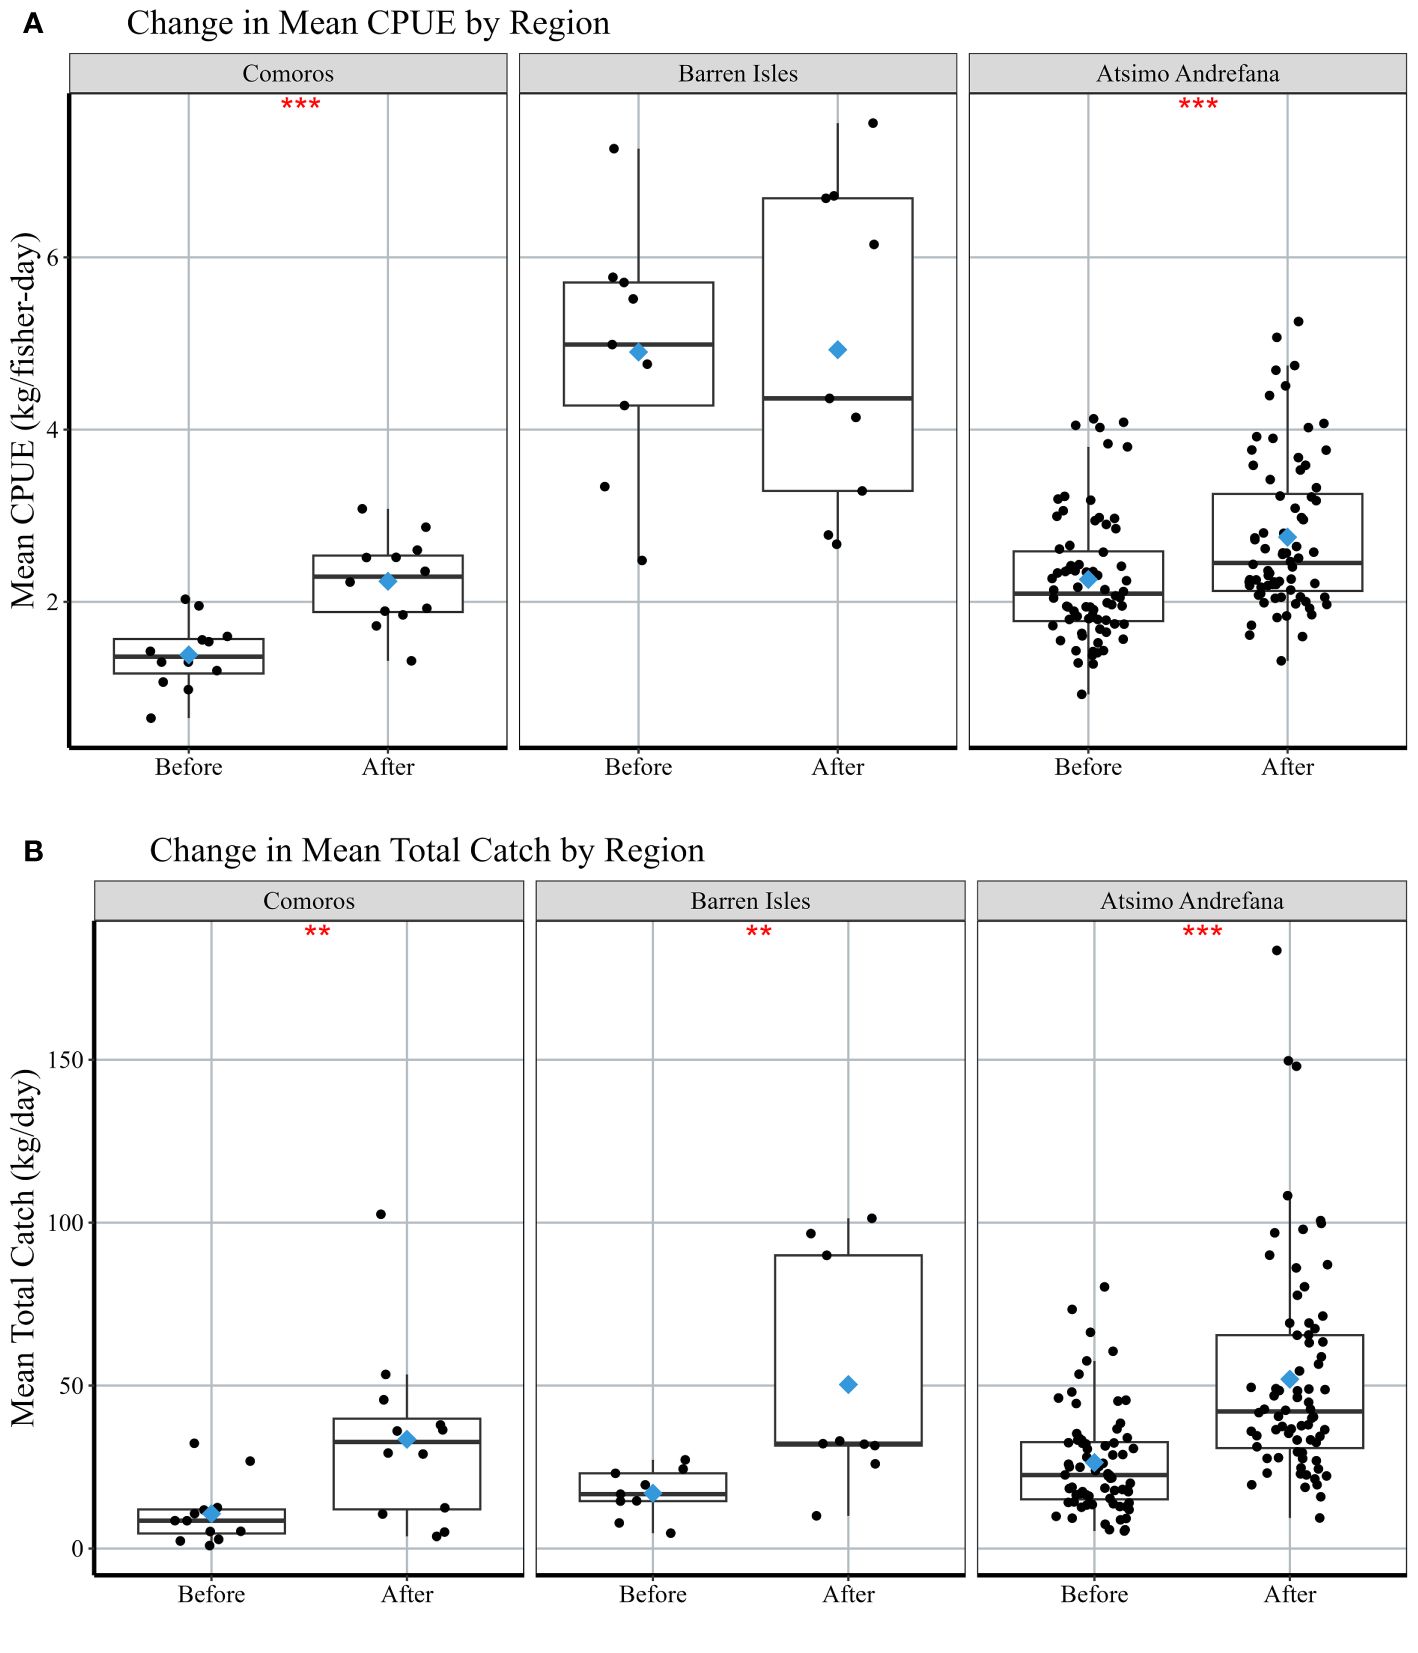
Figure 4 Comparison of mean (A) CPUE (kg/fisher-day) and (B) mean daily total catch by each region in the 30 days before and after a periodic closure. Each box or interquartile range (IQR) extends from the 25th to the 75th percentile; vertical lines (‘whiskers’) represent ±1.5*IQR; bold black lines represent median values; points represent individual village means per closure. Blue diamonds represent the mean values pre/post closure across all regions. Stars represent a significant difference before and after closures using a paired Wilcoxon test, with significant codes: 0; ***, 0.001; **, 0.01; *, 0.05; 0.1; 1.
Pre-closure catch values (i.e., baseline catch), closure duration and month of closure were positively correlated with post-closure CPUE and total catch (Figures 5, 6A–G, Table 3). We observed statistically significant positive relationships between baseline catch and all response variables, duration and all response variables except post-closure daily total catch within 30 days of opening, and closure month and post-closure CPUE within 7 days of opening. None of the predictor variables were negatively associated with closure outcomes. On average, CPUE increased by 0.63 kg/fisher-day in villages with fishers harvesting from closures with baseline CPUE less than 2.4 kg/fisher-day. Conversely, villages linked to closures with higher baseline, or CPUE between 2.5 and 7 kg/fisher-day, observed an increase of 0.22 kg/fisher-day (Supplementary Figure 1).
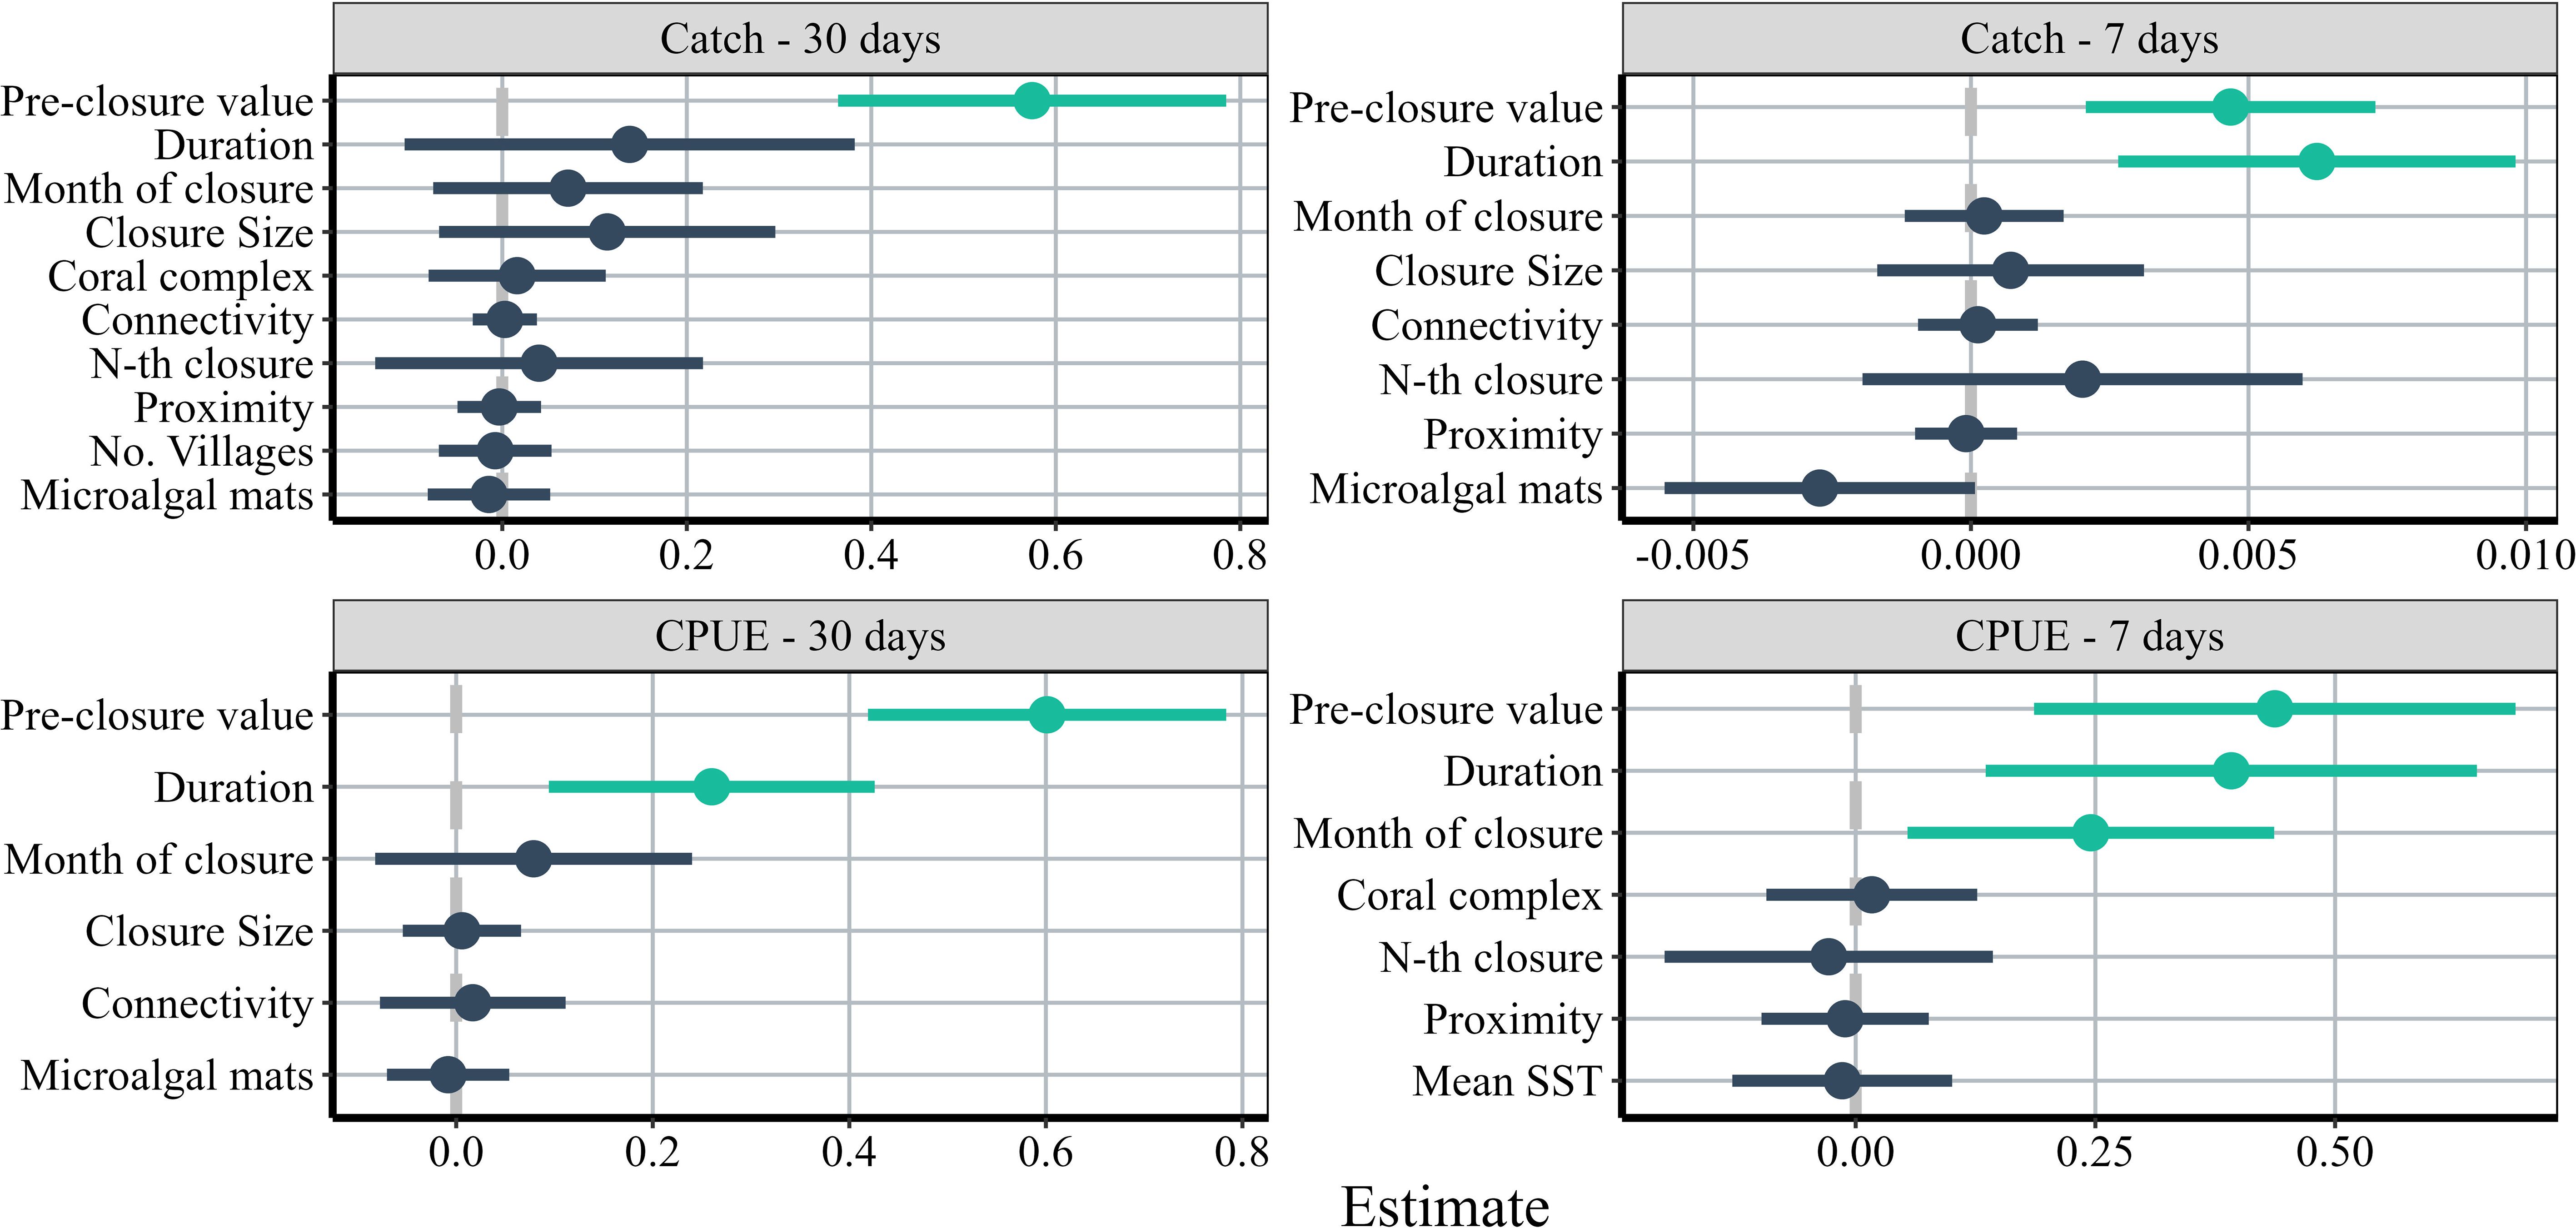
Figure 5 Influence of predictor variables on the post-closure value of catch/CPUE within 7 and 30 days after closure opening. Points represent full averaged coefficient estimates and horizontal lines represent confidence intervals. Positive response estimates are to the right of the ‘0’ and negative responses are to the left. Estimates that are significantly different from zero are colored green if positive and red if negative.
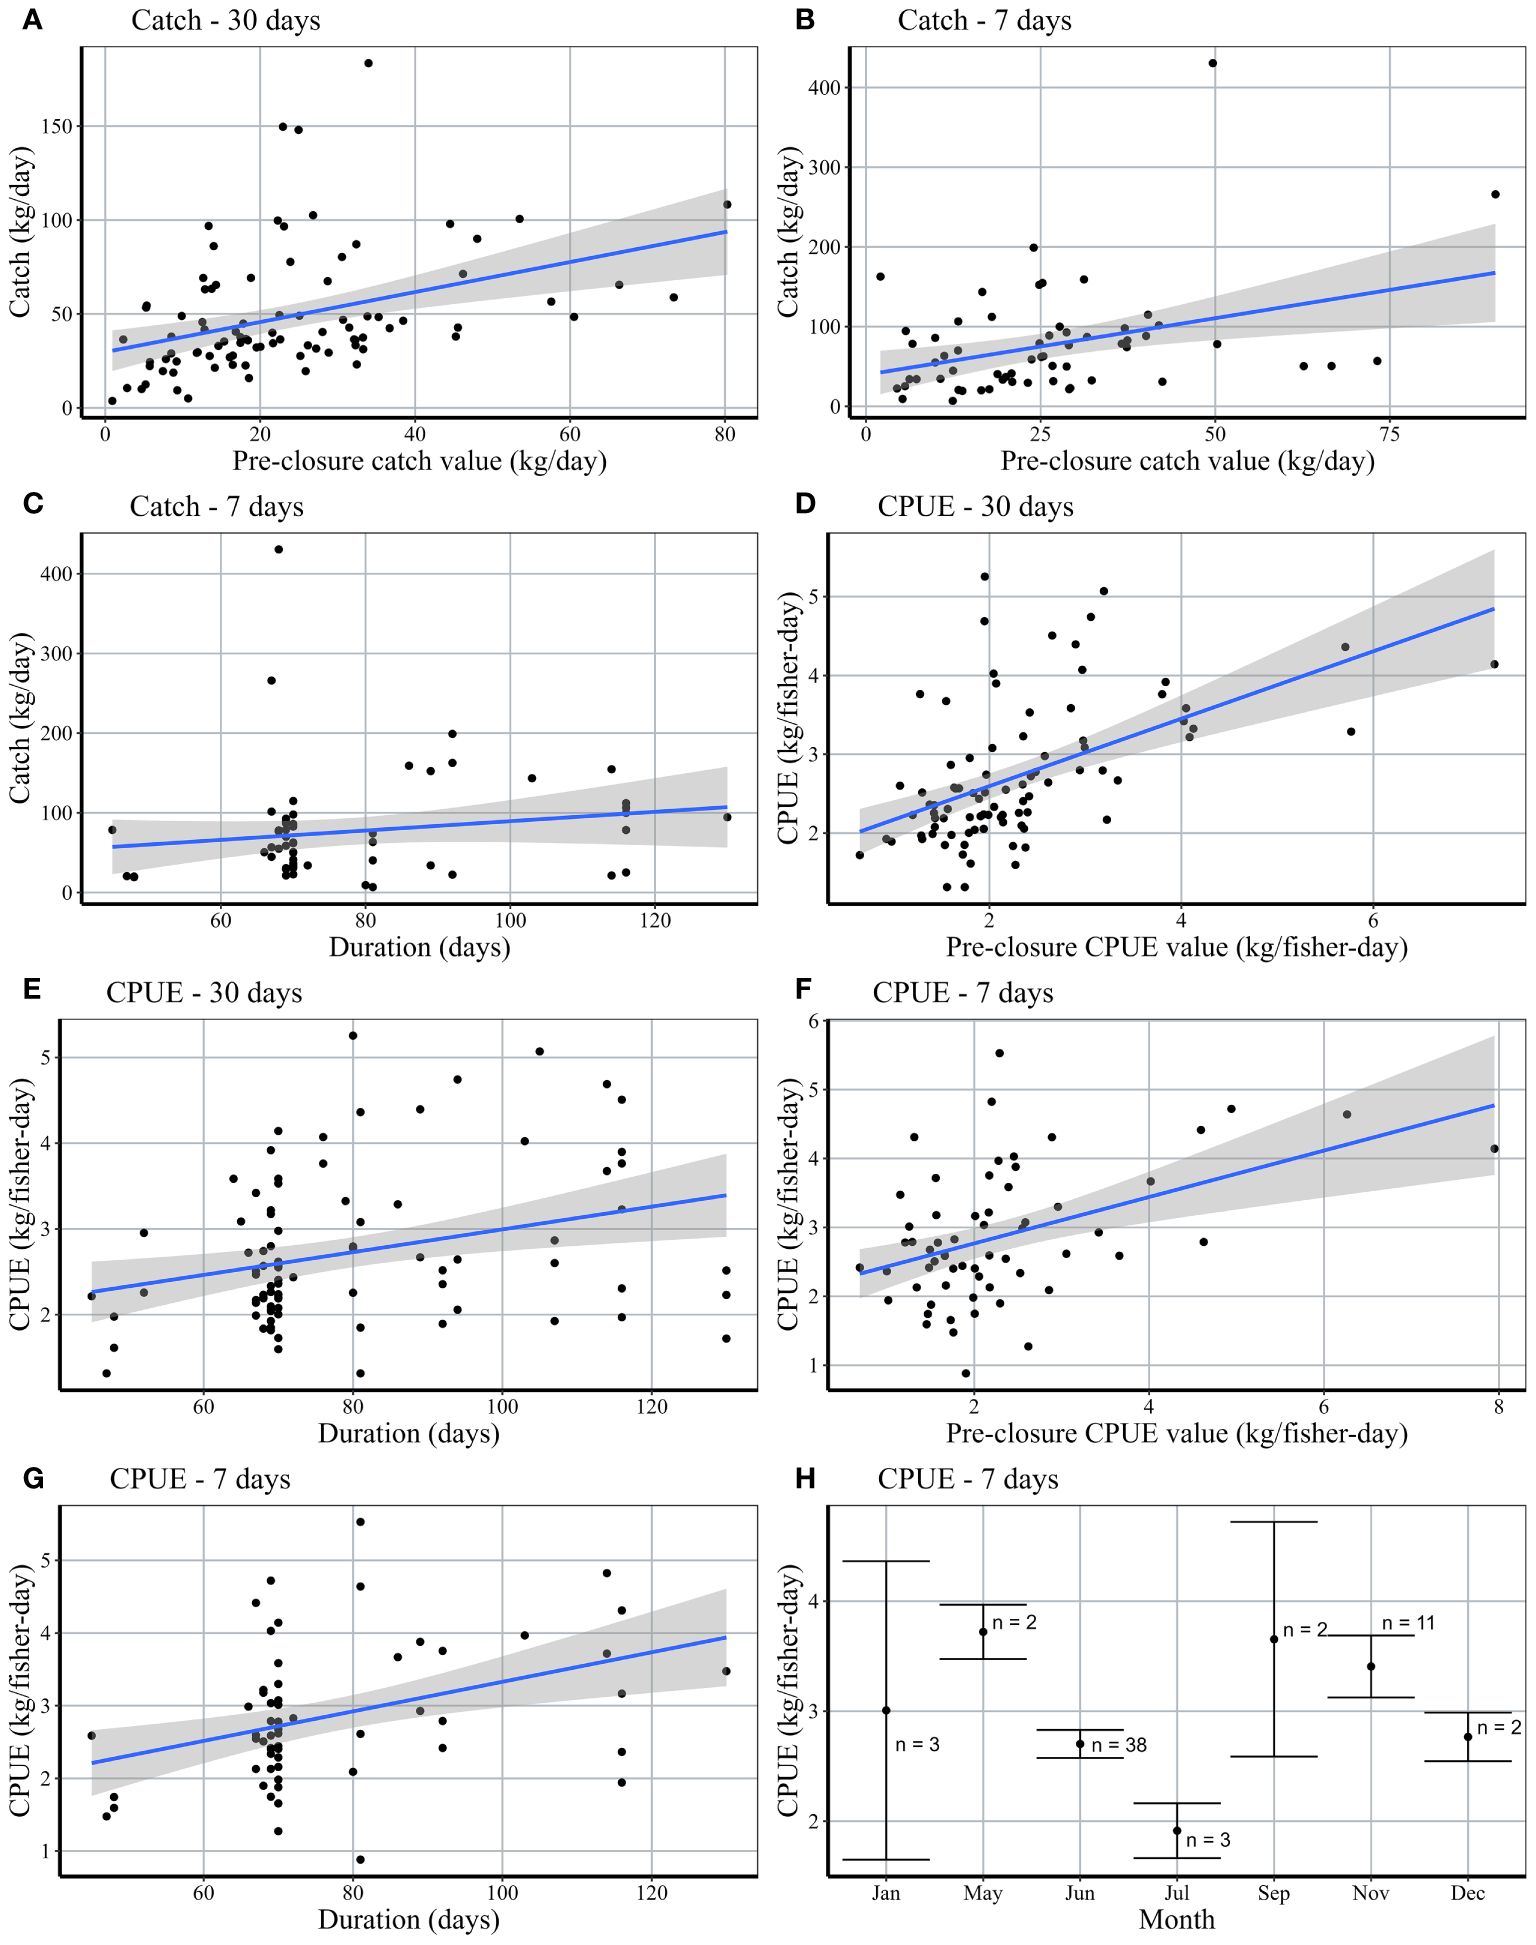
Figure 6 Relationship between response variables (post-closure total catch and CPUE) and covariates. For plots (A–G), black points represent the mean post-closure values for a closure event. Blue lines depict the mean ( ± 95% confidence interval in gray shading) of the predicted linear response variable as a function of a given covariate. Plot G shows the comparison of mean post-CPUE values across different start months.
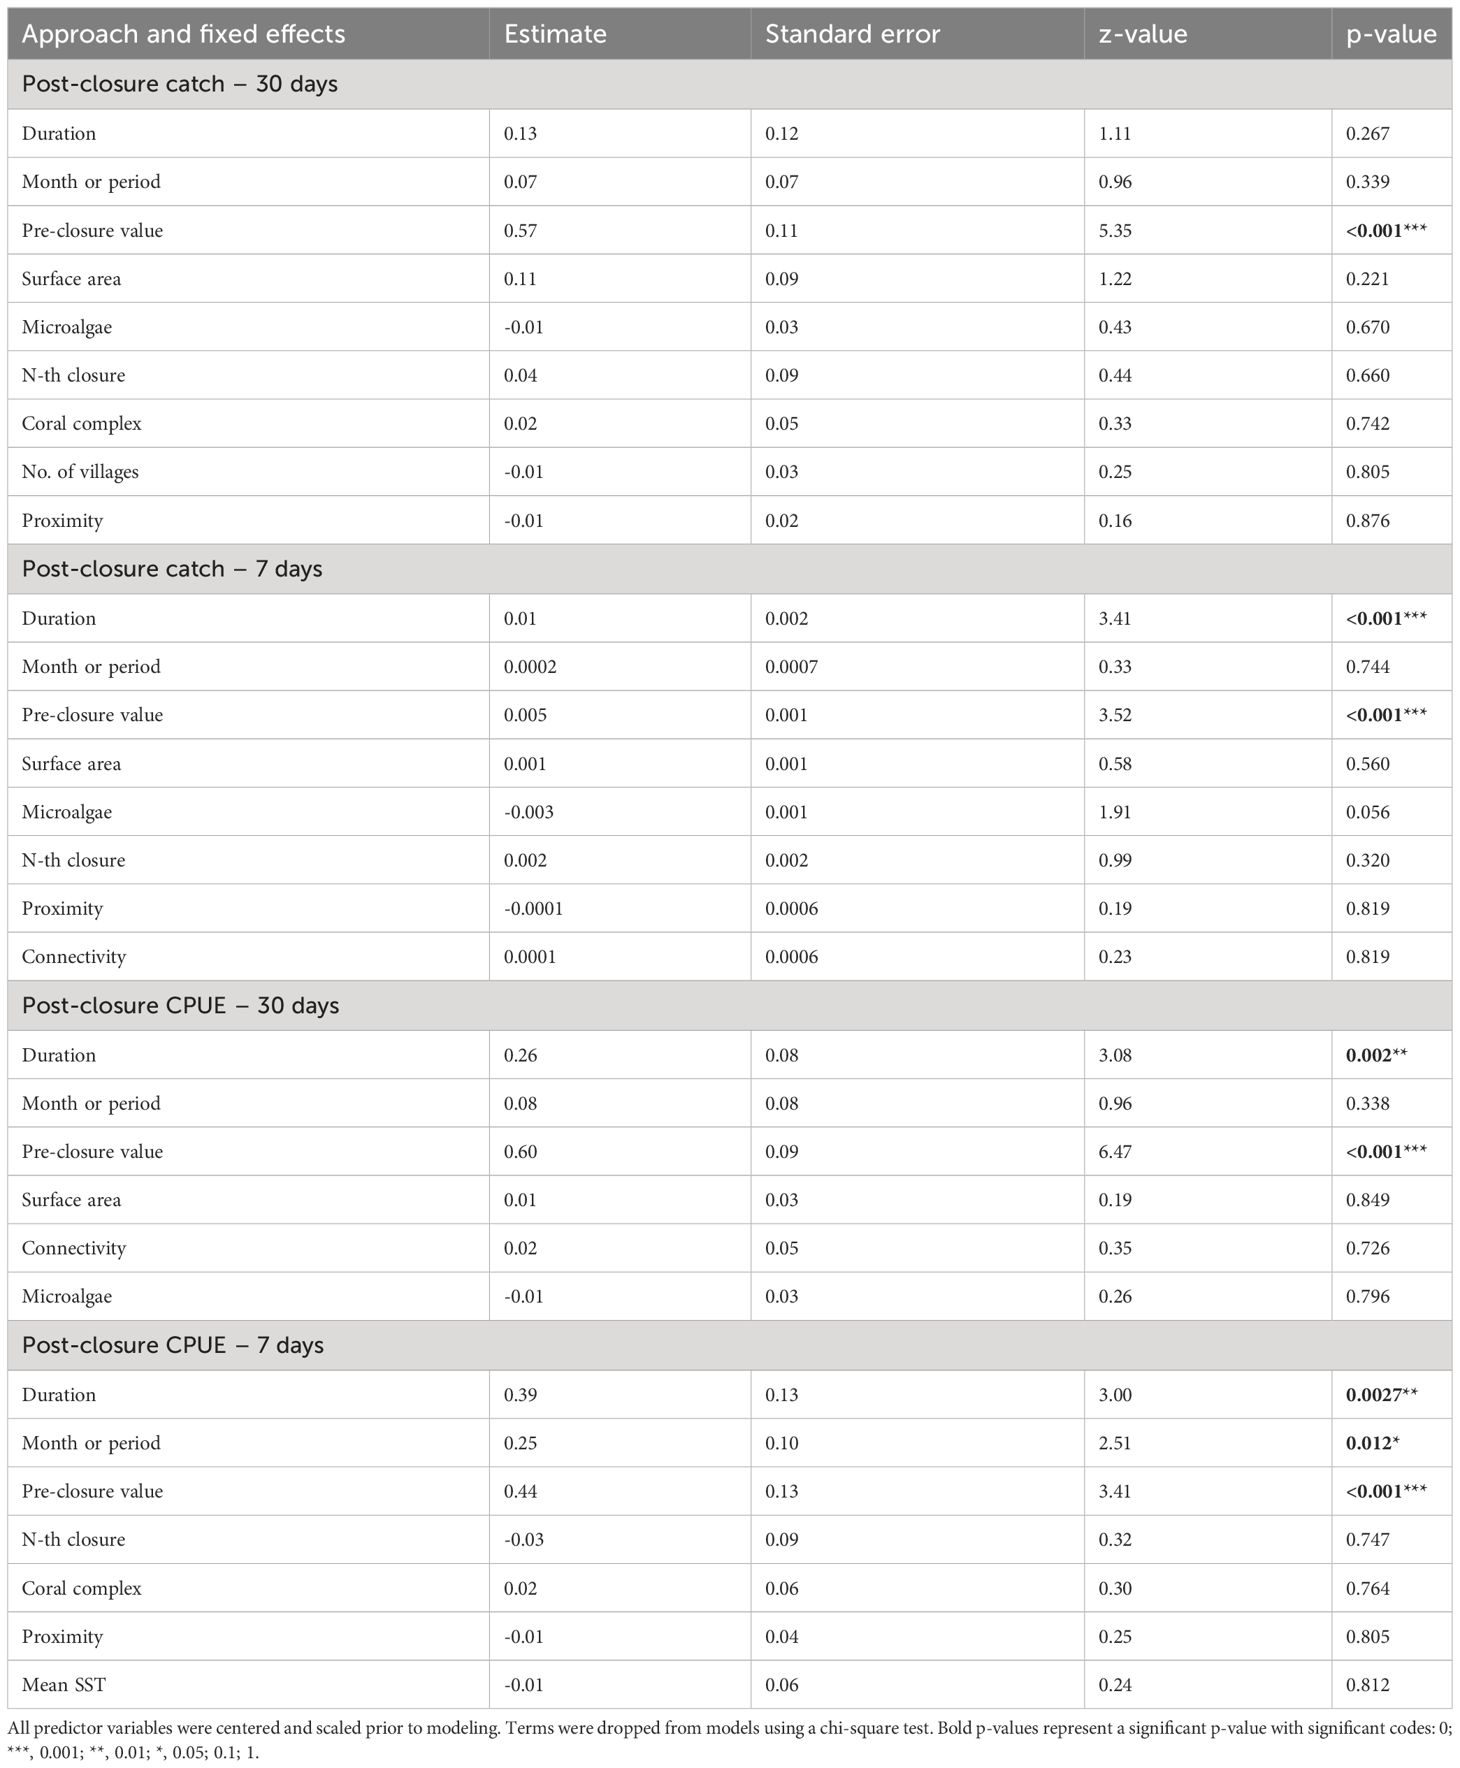
Table 3 Model averaged estimates, standard error, z-value and p-values for each predictor variable.
Seasonality or closure start month was only significantly correlated to CPUE within 7-days post-closure (Figure 6H). Closures beginning in June had an average of 3.0 kg/fisher-day post-closure and closures beginning in November had an average of 3.4 kg/fisher-day (Figure 6H); representing an increase of +13.1% and +101.2%, respectively, from baseline values. We are not able to make inferences about the correlation between seasonality and CPUE for other months, due to the small sample size as a result of either fewer closures or lack of available landings data. Of the 38 closures beginning in June, 5 were in Barren Isles and 33 were in Atsimo Andrefana, with varying results. In the Barren Isles, the average change in CPUE was not significantly different from zero (see Figure 4A). All closures in this region occurred in June, thus, we cannot make inferences about the influence of closure seasonality (Supplementary Figure 2). In Atsimo Andrefana, June closures increased by 18.4% CPUE (kg/fisher-day). No closures in Comoros began in June. Closures beginning in November occurred in both Comoros and Atsimo Andrefana, with an average increase of +115.6% kg/fisher-day and +97.1% kg/fisher-day, respectively (Supplementary Figure 2).
While no statistically significant breakpoints were identified in a segmented regression (Davies test p = 0.83), visual inspection of the trend suggests a change in slope at approximately 87 ± 10.5 days or ~12 weeks (Figure 7A). From this point, we see the largest increase in ΔCPUE from +0.4 kg/fisher-day at ~87 days (~12 weeks) to +1.8 kg/fisher-day at 115 days (~16 weeks). All closures with a duration >95 days (13 weeks) resulted in a net gain in CPUE (n=16). Closures with shorter durations (<87 days) had more mixed results (48 closures with +ΔCPUE, 21 closures with -ΔCPUE).
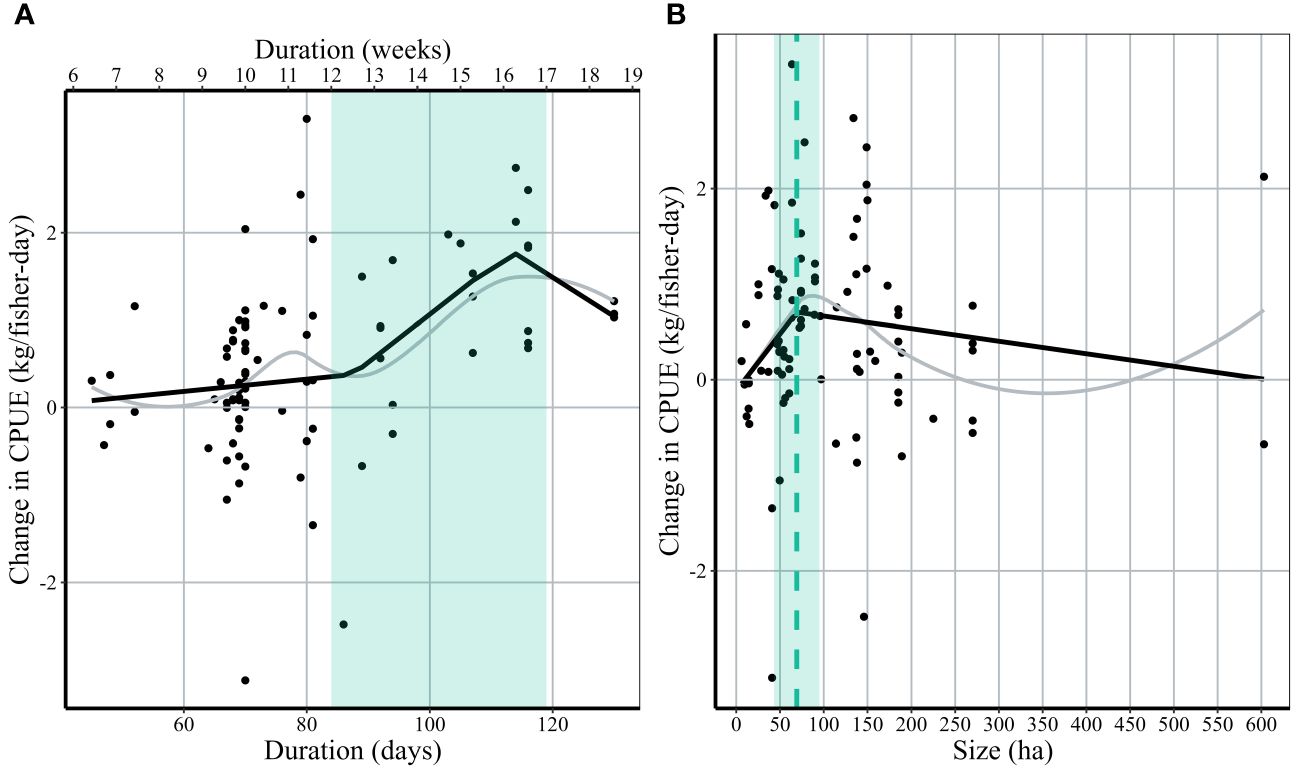
Figure 7 The relationship between the absolute change in CPUE within 30 days of closure and closure duration (A) and size (B). Black points represent the change in CPUE for each closure event. Black lines represent a breakpoint regression with change in slopes identified at the green dotted lines. Gray lines represent Loess-smoothed conditional means. The green shaded bar represents the management recommendations of duration and size based on results from the breakpoint regression.
The relationship between closure size and ΔCPUE was less clear, and again no statistically significant breakpoints were identified in a segmented regression (Davies test p = 0.30). However, visual inspection of the data suggests that ΔCPUE increased with closure size up to approximately 70 hectares (+0.88 kg/fisher-day), which represents the closure size at which mean ΔCPUE peaks (Figure 7B). This increasing trend does not necessarily continue with increasing size; when examining the 52 closures greater than 70 ha in size, 39 experienced a positive net gain (+Δ) in CPUE, 11 did not (ΔCPUE < 0) and 2 had ΔCPUE ~0.
We observed short-term positive effects following periodic octopus closures across our three study regions in Madagascar and Comoros, and positive long-term trends (increasing or maintained landings) across two of our study regions. Significant increases in median CPUE (octopus kg/fisher-day) and daily total catch (kg/day) were observed when examining catch within both 7- and 30-days post-closure. On average, fishers across the three study regions caught 0.5 kg more octopus 30 days after a closure compared to 30 days before a closure (from 2.0 ± 0.12 kg/fisher-day to 2.5 ± 0.12 kg/fisher-day) and 0.7 kg more octopus 7 days after a closure compared to 7 days before a closure (from 2.1 ± 0.16 kg/fisher-day to 2.8 ± 0.17 kg/fisher-day). Change in daily total catch per village diminished over time when comparing 7- and 30-days post-closure. Median daily total catch increased by 156% in the 7-day period and increased by 95% in the 30-day period. This can be explained by an observed decrease in the mean number of fishers recorded per day, from an average of 24 fishers/day to 16 fishers/day.
CPUE recorded from fishers across Comoros showed consistent catch levels from 2017 to 2022 (Figure 2). In comparison to the two study regions in Madagascar, CPUE and daily total catch are notably lower across Comoros. Fishers in these villages rely heavily on the extraction of marine resources, however, absence of an export market and refrigeration facilities keeps the octopus fishery local and subsistence based (Hauzer et al., 2013a). The highest median CPUE was observed in the Barren Isles, where the catch has shown consistent growth since 2018, most likely driven by sales to export markets. The uncompromising weather patterns and geographical location of these islands prohibit human populations from permanently settling and restricts fishing activity to only seven months out of the year (April to November). Thus, a naturally occurring 4-month closure takes place here every year in addition to the austral summer closures, enhancing benefits to fishers and contributing to the high pre-closure values.
Oliver et al. (2015) found that median CPUE increased by approximately 87% in the 30 days after a closure relative to 30 days before (from 2.37 ( ± 0.33) kg/fisher-day to 4.42 ( ± 0.51) kg/fisher-day) across 36 closures implemented between 2004 and 2011 in the Atsimo Andrefana region. We observed a lower pre-closure median CPUE (2.1 ± 0.09 kg/fisher-day) and an approximate increase in CPUE of 19% across 72 closures between the years of 2008 and 2019. Our data indicated that median CPUE across Atsimo Andrefana increased between 2004 and 2006, followed by a consistent decline beginning in 2011 (Figure 2). Thus, while we did not observe a consistent decline in daily total village catch on average, individual fishers caught more between 2006 and 2011 compared to 2022. This is likely due to the 26% increase in the mean number of fishers recorded each day from the periods 2005-2010 to 2015-2020 (Supplementary Figure 3). Our findings are consistent with previous studies, finding that the mean harvestable sizes and weights of octopus landings in the region have declined (Guard and Mgaya, 2002; Guard, 2009; Sauer et al., 2011).
Though periodic closures are suitable for managing short-lived and rapidly growing taxa like octopus, the design of closures is crucial for their effectiveness. We identified three primary drivers of closure success, defined as increased octopus CPUE and total daily catch: 1) baseline conditions, 2) closure duration and 3) seasonality (closure start month). Relationships between each of these closure variables and catch outcomes suggest the potential for maximum benefits when closures are placed in areas with lower baseline catch, have a duration of at least 13 to 16 weeks and commence in June or November. While we observed positive closure effects across all baseline conditions, the villages with lower baseline CPUE (or lower fishing pressure) have the greatest returns (Figure 6D, Supplementary Figure 1). Based on our analyses, we defined lower baseline catch as approximately 2 kg/fisher-day and 20 kg/day at the village level.
Our findings indicate that there is a predominantly positive change in CPUE across villages linked to closure durations of at least 13 weeks, with maximum benefits observed at approximately 16 weeks (Figure 7A). This aligns with findings of previous studies demonstrating benefits from closures with durations ranging from 10 days to 3 months (Guard and Mgaya, 2002; Fernández-Rueda and García-Flórez, 2007; Oliver et al., 2015). Closure duration is closely associated with increased growth capacity in octopuses. An O. cyanea individual can gain 100 to 200 g over a period of approximately two weeks (Van Heukelem, 1973). This implies that conservatively, fishing protection through closures has the potential to contribute an estimated 600-1200 g per octopus in 12 weeks or 800-1600 g in 16 weeks. Longer closure durations may be required if pre-closure fishing pressure is particularly high resulting in low overall octopus biomass.
Managers can also maximize growth potential by aligning closures with reproductive cycles, thereby, providing protection during critical spawning and recruitment periods. In our assessment of post-closure CPUE within the 7 days following a closure opening, 49 out of 61 closures initiated in June (n=38) and November (n=11). In Atsimo Andrefana an increase in CPUE of approximately 97% was observed across villages associated with closures commencing in November; all occurring between the years of 2008 and 2009 with a duration of 12 or more weeks (n = 8). After 2010, most closures in Atsimo Andrefana occurred between the months of June and August in response to studies for a duration of approximately two months. Raberinary and Benbow (2012) also suggested closure periods between September and November. On average, we observed an increase in CPUE of only 18% across villages associated with closures that started in June after 2010. Based on our results, this gain could be maximized by extending the duration of June closures to at least 13 weeks and/or potentially implementing additional closures in November. While our data indicates a more pronounced change in CPUE linked to November closures as opposed to June closures; the imbalance in sample size makes it difficult to conclusively recommend closures start in one month versus another when positive short-term benefits in octopus catch were observed for both.
Although closure size was not identified as a primary factor influencing positive management outcomes in our models, our breakpoint analysis suggests an optimal closure size of 50 to 100 hectares. Within this range the majority of closures exhibit an increase in CPUE after the closure period (Figure 7B). As closure size increased from 100 hectares to approximately 200 hectares, we observed a more varied change in CPUE. Large closure areas may be difficult to enforce, minimizing positive closure effects. However, here in our study region compliance was often successful, with records indicating very few infractions. The impact of closure areas is contingent on the availability of suitable habitat, such as rocky coral reefs. Closures in our analysis that were of the suggested optimal size (50-100 ha) contained on average 68% suitable habitat. Across our study area, closures with at least 50 hectares of suitable habitat were associated with increases in CPUE. O. cyanea has relatively small home ranges compared to other marine resources (e.g., fish) and has been reported to have dens distributed approximately 30 m apart and forage on average 81 m each trip from the den (Forsythe and Hanlon, 1997). Our recommended closure size has the potential to provide protection for octopus as well as other species with similar home ranges. Larval connectivity was also not a major driver of closure success. Mean larval import values across four fish species was used to represent general connectivity and applied to octopus which may underestimate variation in octopus connectivity across our study area. A spatial network of periodic closures that protects key larval source and sink areas would facilitate population connectivity and recovery via the export from brooders and the import of settling larvae (Krueck et al., 2022). In the future, we suggest the development of larval dispersal models for octopus to improve our understanding of how connectivity influences octopus population dynamics and the outcomes of periodic closures.
Periodic closures have demonstrated success in delivering short-term benefits for fishers and fostering engagement in locally led management practices. However, this strategy alone is not likely to ensure the long-term sustainability of the fishery. Our findings underpin the importance of a comprehensive ecosystem-based management approach that optimizes closure duration, season, size and habitat coverage for octopus. In addition, we suggest that minimum size limits, gear restrictions and limited access be considered when areas are open to fishing to support reproduction potential and population growth. Management recommendations derived from the response of O. cyanea fisheries to periodic closures in Madagascar and Comoros can be used to inform comprehensive management approaches that incorporate diverse and complementary strategies for adaptive management, ensuring the long-term sustainability of this highly prized and adaptive invertebrate.
The raw data supporting the conclusions of this article will be made available by the authors, without undue reservation.
MM: Writing – review & editing, Writing – original draft, Visualization, Validation, Supervision, Investigation, Formal analysis, Data curation, Conceptualization. LM: Writing – review & editing, Writing – original draft, Visualization, Validation, Formal analysis, Data curation. TR: Writing – review & editing, Validation, Supervision, Resources, Project administration, Methodology, Investigation, Funding acquisition, Data curation, Conceptualization. NR: Writing – review & editing, Validation, Supervision, Resources, Project administration, Investigation, Data curation. FV: Writing – review & editing, Validation, Supervision, Resources, Project administration, Data curation. RR: Writing – review & editing, Validation, Supervision, Project administration, Investigation, Data curation. FS: Writing – review & editing, Validation, Supervision, Resources, Project administration, Investigation, Data curation. FR: Writing – review & editing, Validation, Supervision, Resources, Project administration, Data curation. TR: Writing – review & editing, Validation, Supervision, Project administration, Investigation, Data curation. SB: Writing – review & editing, Supervision, Resources, Project administration, Funding acquisition, Conceptualization. CC: Writing – review & editing, Writing – original draft, Visualization, Supervision, Resources, Project administration, Funding acquisition, Formal analysis, Conceptualization.
The author(s) declare that financial support was received for the research, authorship and publication of this article. Funding for data collection was provided by private donors to Blue Ventures Conservation and Dahari. Funding in the Comoros included support from the Oak Foundation #OCAY-18-750, the Tusk Trust and the UK Government through “The Darwin Initiative” (Grant #27-006). Special thanks to our partners at WWF via the following grants: 03/CONV/FY19/TNR, 54/CTR/FY19/TNR, 239/CTR/FY20, 174/CTR-SPAC/FY21/TNR.
The authors want to acknowledge our partners in Comoros and Madagascar for collecting and providing the data, which without this research would not be possible. We would also like to thank all the donors that have supported this vital work over the years.
TR, NR, RR, FR, TR and SB work for Blue Ventures, which facilitated the implementation of the community-based management at these sites in Madagascar. FV and FS work for Dahari, which facilitated the implementation of sites in Comoros.
The remaining authors declare that the research was conducted in the absence of any commercial or financial relationships that could be constructed as a potential conflict of interest.
The authors declare that this study received funding from private donors. The funders had the following involvement in the study: support and provision of funding for community-led data collection.
All claims expressed in this article are solely those of the authors and do not necessarily represent those of their affiliated organizations, or those of the publisher, the editors and the reviewers. Any product that may be evaluated in this article, or claim that may be made by its manufacturer, is not guaranteed or endorsed by the publisher.
The Supplementary Material for this article can be found online at: https://www.frontiersin.org/articles/10.3389/fmars.2024.1358111/full#supplementary-material
Ahamada S., Bijoux J., Cauvin B., Hagan A., Harris A., Koonjul M., et al. (2008). “Status of the coral reefs of the South-West Indian Ocean Island States: Comoros, Madagascar, Mauritius, Reunion, Seychelles,” in Status of Coral Reefs of the World (Townsville, Australia: Global Coral Reef Monitoring Network and Reef and Rainforest Research Centre), vol. 2008, 73–86.
Allen Coral Atlas. (2022). Imagery, maps and monitoring of the world’s tropical coral reefs. doi: 10.5281/zenodo.3833242
Anderson S. C., Flemming J. M., Watson R., Lotze H. K. (2011). Rapid global expansion of invertebrate fisheries: Trends, drivers, and ecosystem effects. PloS One 6, 1–9. doi: 10.1371/journal.pone.0014735
André J., Grist E., Semmens J., Pecl G., Segawa S. (2009). Effects of temperature on energetics and the growth pattern of benthic octopuses. Mar. Ecol. Prog. Ser. 374, 167–179. doi: 10.3354/meps07736
Astuti R. (1995). “The Vezo are not a kind of people”. Identity, difference and “ethnicity” among a fishing people of western Madagascar. Am. Ethnol 22, 464–482. doi: 10.1525/ae.1995.22.3.02a00010
Barnes-Mauthe M., Oleson K. L. L., Zafindrasilivonona B. (2013). The total economic value of small-scale fisheries with a characterization of post-landing trends: an application in Madagascar with global relevance. Fish. Res. 147, 175–185. doi: 10.1016/j.fishres.2013.05.011
Bartoń K. (2023) MuMIn: Multi-Model Inference. R package version 1.47.5. Available online at: https://CRAN.R-project.org/package=MuMIn.
Bates D., Maechler M., Bolker B., Walker S. (2015). Fitting linear mixed-effects models using lme4. J. Stat. Software 67, 1–48. doi: 10.18637/jss.v067.i01
Benbow S., Harris A. (2011). “Managing Madagascar’s octopus fisheries. Proceedings of the Workshop on Octopus cyanea Fisheries, 5-6 April 2011, Toliara,” in Blue Ventures Conservation Report. Available at: https://blueventures.org/publications/managing-Madagascars-octopus-fisheries-proceedings-workshop-octopus-cyanea-fisheries-5-6-april-2011-toliara/.
Benbow S., Humber F., Oliver T. A., Oleson K. L. L., Raberinary D., Nadon M., et al. (2014). Lessons learnt from experimental temporary octopus fishing closures in south-west Madagascar: benefits of concurrent closures. Afr. J. Mar. Sci. 36, 31–37. doi: 10.2989/1814232X.2014.893256
Bower J. R., Seki M. P., Young R. E., Bigelow K. A., Hirota J., Flament P. (1999). Cephalopod paralarvae assemblages in Hawaiian Islands waters. Mar. Ecol. Prog. Ser. 185, 203–212. doi: 10.3354/meps185203
Breuil C., Grima D. (2014). Baseline Report Comoros (Ebene, Mauritius: SmartFish Programme of the Indian Ocean Commission, Fisheries Management FAO component, Ebene, Mauritius), 27 pp.
Caamal-Monsreal C., Uriarte I., Farias A., Díaz F., Sánchez A., Re D., et al. (2016). Effects of temperature on embryo development and metabolism of O. maya. Aquaculture 451, 156–162. doi: 10.1016/j.aquaculture.2015.09.011
Caballero-Alfonso A. M., Ganzedo U., Trujillo-Santana A., Polanco J., Santana Del Pino A., Ibarra-Berastegi G., et al. (2010). The role of climatic variability on the short-term fluctuations of octopus captures at the Canary Islands. Fish. Res. 102, 258–265. doi: 10.1016/j.fishres.2009.12.006
Carvalho P. G., Jupiter S. D., Januchowski-Hartley F. A., Goetze J., Claudet J., Weeks R., et al. (2019). Optimized fishing through periodically harvested closures. J. Appl. Ecol. 56, 1927–1936. doi: 10.1111/1365-2664.13417
Casu M., Maltagliati F., Meloni M., Casu D., Cossu P., Binelli G., et al. (2002). Genetic structure of Octopus vulgaris (Mollusca, Cephalopoda) from the Mediterranean Sea as revealed by a microsatellite locus. Ital. J. Zool. 69, 295–300. doi: 10.1080/11250000209356472
Caverivière A., Domain F., Diallo A. (1999). Observations on the influence of temperature on the length of embryonic development in Octopus vulgaris (Senegal). Aquat. Living Resour. 12, 151–154. doi: 10.1016/S0990-7440(99)80024-2
Chamberlain S. (2023) rerddap: General Purpose Client for ‘ERDDAP’ Servers. R package version 1.0.2. Available online at: https://CRAN.R-project.org/package=rerddap.
Chande M. A., Mgaya Y. D., Benno L. B., Limbu S. M. (2021). The influence of environmental variables on the abundance and temporal distribution of Octopus cyanea around Mafia Island, Tanzania. Fish. Res. 241, 105991. doi: 10.1016/j.fishres.2021.105991
Charles C., Pelleter E., Révillon S., Nonnotte P., Jorry S. J., Kluska J. M. (2020). Intermediate and deep ocean current circulation in the Mozambique Channel: new insights from ferromanganese crust Nd isotopes. Mar. Geol. 430, 106356. doi: 10.1016/j.margeo.2020.106356
Cohen P. J., Foale S. J. (2013). Sustaining small-scale fisheries with periodically harvested marine reserves. Mar. Policy 37, 278–287. doi: 10.1016/j.marpol.2012.05.010
Collins C., Hermes J. C., Reason C. J. C. (2014). Mesoscale activity in the Comoros Basin from satellite altimetry and a high-resolution ocean circulation model. J. Geophys. Res. Ocean. 119, 4745–4760. doi: 10.1002/2014JC010008
Cooke A. (2022). “Chapter 7 Marine and coastal ecosystems,” in The New Natural History of Madagascar. Ed. Goodman S. M. (Princeton University Press), 142–160. doi: 10.4324/9781351131599-12
Cripps G., Gardner C. J. (2016). Human migration and marine protected areas: insights from Vezo fishers in Madagascar. Geoforum 74, 49–62. doi: 10.1016/j.geoforum.2016.05.010
Doherty B., Hauzer M., Le Manach F. (2015). “Reconstructing catches for the Union of the Comoros: uniting historical sources of catch data for Ngazidja, Ndzuwani and Mwali from 1950–2010,” in Fisheries catch reconstructions in the Western Indian Ocean 1950–2010. Fisheries Centre Research Reports. Eds. Le Manach F., Pauly D. (Fisheries Centre, University of British Columbia). 23(2), 1–11.
Emery T. J., Hartmann K., Gardner C. (2016). Management issues and options for small scale holobenthic octopus fisheries. Ocean Coast. Manage. 120, 180–188. doi: 10.1016/j.ocecoaman.2015.12.004
Farquhar S., Nirindrainy A. F., Heck N., Saldarriaga M. G., Xu Y. (2022). The impacts of long-term changes in weather on small-scale fishers’ available fishing hours in Nosy Barren, Madagascar. Front. Mar. Sci. 9. doi: 10.3389/fmars.2022.841048
Fernández-Rueda P., García-Flórez L. (2007). Octopus vulgaris (Mollusca: Cephalopoda) fishery management assessment in Asturias (north-west Spain). Fish Res. 83, 351–354. doi: 10.1016/j.fishres.2006.10.006
Forsythe J. W., Hanlon R. T. (1988). Effect of temperature on laboratory growth, reproduction and life span of Octopus bimaculoides. Mar. Biol. 98, 369–379. doi: 10.1007/BF00391113
Forsythe J. W., Hanlon R. T. (1997). Foraging and associated behavior by Octopus cyanea Gray 1849 on a coral atoll, French Polynesia. J. Exp. Mar. Bio. Ecol. 209, 15–31. doi: 10.1016/S0022-0981(96)00057-3
Freed S., Granek E. F. (2014). Effects of human activities on the world’s most vulnerable coral reefs: Comoros case study. Coast. Manage. 42, 280–296. doi: 10.1080/08920753.2014.904261
Goetze J. S., Claudet J., Januchowski-Hartley F., Langlois T. J., Wilson S. K., White C., et al. (2018). Demonstrating multiple benefits from periodically harvested fisheries closures. J. Appl. Ecol. 55, 1102–1113. doi: 10.1111/1365-2664.13047
Guard M. (2009). Biology and fisheries status of octopus in the Western Indian Ocean and the suitability for marine stewardship council certification. United Nations Environment Programme (UNEP) and The Institute for Security Studies (ISS), 1–21.
Guard M., Mgaya Y. D. (2002). The artisanal fishery for Octopus cyanea Gray in Tanzania. Ambio 31, 528–536. doi: 10.1579/0044-7447-31.7.528
Hauzer M., Dearden P., Murray G. (2013a). The effectiveness of community-based governance of small-scale fisheries, Ngazidja island, Comoros. Mar. Policy 38, 346–354. doi: 10.1016/j.marpol.2012.06.012
Hauzer M., Dearden P., Murray G. (2013b). The fisherwomen of Ngazidja island, Comoros: fisheries livelihoods, impacts, and implications for management. Fish. Res. 140, 28–35. doi: 10.1016/j.fishres.2012.12.001
Herwig J. N., Depczynski M., Roberts J. D., Semmens J. M., Gagliano M., Heyward A. J. (2012). Using age-based life history data to investigate the life cycle and vulnerability of Octopus cyanea. PloS One 7(8), e43679. doi: 10.1371/journal.pone.0043679
Humber F., Harris A., Raberinary D., Nadon M. (2006). “Seasonal closures of no-take zones to promote a sustainable fishery for Octopus cyanea (Gray) in South West Madagascar,” in Blue Ventures Conservation Report (London: Blue Ventures). Available at: https://blueventures.org/publications/seasonal-closures-of-no-take-zones-to-promote-a-sustainable-fishery-for-octopus-cyanea-gray-in-south-west-Madagascar/.
Iida T. (2005). The past and present of the coral reef fishing economy in Madagascar: implications for self-determination in resource use. Senri Ethnol. Stud. 67, 237–258. doi: 10.11560/jahp.18.2_16
Johannes R. E. (1982). Traditional conservation methods and protected marine areas in Oceania. Ambio 11, 258–261.
Krueck N. C., Tong C., Cox C., Treml E. A., Critchell K., Chollett I., et al. (2022). Benefits of measurable population connectivity metrics for area-based marine management. Mar. Policy 144, 105210. doi: 10.1016/j.marpol.2022.105210
Loganimoce E. M., Brown K. T., Savou R., Kitolelei J. V., Tukana M., Southgate P. C., et al. (2023). Octopuses in the south-west Pacific region: a review of fisheries, ecology, cultural importance and management. Rev. Fish Biol. Fish. 33, 977–1003. doi: 10.1007/s11160-023-09772-9
Long J. A. (2022) jtools: Analysis and presentation of social scientific data. R package version 2.2.0. Available online at: https://CRAN.R-project.org/package=jtools.
Lüdecke D., Ben-Shachar M., Patil I., Waggoner P., Makowski D. (2021). performance: An R package for assessment, comparison and testing of statistical models. J. Open Source Software 6, 3139. doi: 10.21105/joss.03139
Mendelssohn R. (2022) rerddapXtracto: Extracts Environmental Data from ‘ERDDAP’ Web Services. R package version 1.1.4. Available online at: https://CRAN.R-project.org/package=rerddapXtracto.
Muenzel D., Critchell K., Cox C., Campbell S. J., Jakub R., Suherfian W., et al. (2023). Integrating larval connectivity into the marine conservation decision-making process across spatial scales. Conserv. Biol. 37, e14038. doi: 10.1111/cobi.14038
Muggeo V. M. R. (2017). Interval estimation for the breakpoint in segmented regression: a smoothed score-based approach. Aust. N. Z. J. Stat. 59, 211–322. doi: 10.1111/anzs.12200
Murphy J. M., Balguerías E., Key L. N., Boyle P. R. (2002). Microsatellite DNA markers discriminate between two Octopus vulgaris (Cephalopoda: Octopoda) fisheries along the Northwest African coast. Bull. Mar. Sci. 71, 545–553.
Muttenzer F., Andriamahefazafy M. (2021). From ritual performers to ocean defenders: fisher migrations, identity narratives and resource access in the Barren Isles, West Madagascar. Afr. Identities 19, 375–399. doi: 10.1080/14725843.2021.1937052
Norman M. D. (1991). Octopus cyanea Gray 1849 (Mollusca: Cephalopoda) in Australian waters: description, distribution and taxonomy. Bull. Mar. Sci. 49, 20–38.
Obura D. O., Bandeira S. O., Bodin N., Burgener V., Braulik G., Chassot E., et al. (2018). The northern Mozambique channel. World Seas Environ. Eval. II Indian Ocean to Pacific, 75–99. doi: 10.1016/B978-0-08-100853-9.00003-8
Oliver T. A., Oleson K. L. L., Ratsimbazafy H., Raberinary D., Benbow S., Harris A. (2015). Positive catch & economic benefits of periodic octopus fishery closures: do effective, narrowly targeted actions “catalyze” broader management? PloS One 10 (6), e0129075. doi: 10.1371/journal.pone.0129075
Opsahl T., Agneessens F., Skvoretz J. (2010). Node centrality in weighted networks: Generalizing degree and shortest paths. Soc Netw. 32, 245–251. doi: 10.1016/j.socnet.2010.03.006
Ospina-Alvarez A., De Juan S., Pita P., Ainsworth G. B., Matos F. L., Pita C., et al. (2022). A network analysis of global cephalopod trade. Sci. Rep. 12, 322. doi: 10.1038/s41598-021-03777-9
Quetglas A., Ordines F., Hidalgo M., Monserrat S., Ruiz S., Amores Á., et al. (2013). Synchronous combined effects of fishing and climate within a demersal community. ICES J. Mar. Sci. 70, 319–328. doi: 10.1093/icesjms/fss181
Raberinary D., Benbow S. (2012). The reproductive cycle of Octopus cyanea in southwest Madagascar and implications for fisheries management. Fish. Res. 125–126, 190–197. doi: 10.1016/j.fishres.2012.02.025
Ramanantsoa J. D., Penven P., Krug M., Gula J., Rouault M. (2018). Uncovering a new current: the Southwest Madagascar Coastal Current. Geophys. Res. Lett. 45, 1930–1938. doi: 10.1002/2017GL075900
Rocliffe S., Harris A. (2016). “The status of octopus fisheries in the Western Indian Ocean,” in Blue Ventures Conservation Report. (London: Blue Ventures). Available at: https://blueventures.org/publications/status-octopus-fisheries-western-Indian-ocean.
Rodhouse P. G. K. (2013). Role of squid in the Southern Ocean pelagic ecosystem and the possible consequences of climate change. Deep Sea Res. Part II Top. Stud. Oceanogr. 95, 129–138. doi: 10.1016/j.dsr2.2012.07.001
Rodhouse P. G. K., Pierce G. J., Nichols O. C., Sauer W. H. H., Arkhipkin A. I., Laptikhovsky V. V., et al. (2014). “Environmental effects on cephalopod population dynamics,” in Advances in Marine Biology, ed. Vidal E. A. G.. (Academic Press), 99–233. doi: 10.1016/B978-0-12-800287-2.00002-0
Sauer W. H. H., Gleadall I. G., Downey-Breedt N., Doubleday Z., Gillespie G., Haimovici M., et al. (2021). World octopus fisheries. Rev. Fish. Sci. Aquac. 29, 279–429. doi: 10.1080/23308249.2019.1680603
Sauer W. H. H., Potts W., Raberinary D., Anderson J., Perrine M. J. S. (2011). Assessment of current data for the octopus resource in Rodrigues, western Indian Ocean. Afr J. Mar. Sci. 33, 181–187. doi: 10.2989/1814232X.2011.572386
Scheel D., Leite T., Langford K. (2017). Diversity in the diet of the predator Octopus cyanea in the coral reef system of Moorea, French Polynesia. J. Nat. Hist. 51, 2615–2633. doi: 10.1080/00222933.2016.1244298
Schott F. A., Xie S. P., McCreary J. P. (2009). Indian ocean circulation and climate variability. Rev. Geophys. 47, 1–46. doi: 10.1029/2007RG000245
Semmens J. M., Pecl G. T., Villanueva R., Jouffre D., Sobrino I., Wood J. B., et al. (2004). Understanding octopus growth: patterns, variability and physiology. Mar. Freshw. Res. 55, 367–377. doi: 10.1071/MF03155
Silas M. O., Kishe M. A., Mgeleka S. S., Kuboja B. N., Ngatunga B. P., Matiku P. (2022). The octopus fishing closures positively impact human wellbeing and management success; case of Tanzania. Ocean Coast. Manage. 217, 106022. doi: 10.1016/j.ocecoaman.2021.106022
Silas M. O., Kishe M. A., Mshana J. G., Semba M. L., Mgeleka S. S., Kuboja B. N., et al. (2021). Growth, mortality, exploitation rate and recruitment pattern of Octopus cyanea (Mollusca: Cephalopoda) in the WIO region: a case study from the Mafia Archipelago, Tanzania. West. Indian Ocean J. Mar. Sci. 20, 71–79. doi: 10.4314/wiojms.v20i1.7
Ternon J. F., Bach P., Barlow R., Huggett J., Jaquemet S., Marsac F., et al. (2014). The Mozambique Channel: from physics to upper trophic levels. Deep. Res. Part II Top. Stud. Oceanogr. 100, 1–9. doi: 10.1016/j.dsr2.2013.10.012
Treml E. A., Halpin P. N., Urban D. L., Pratson L. F. (2008). Modeling population connectivity by ocean currents, a graph-theoretic approach for marine conservation. Landsc. Ecol. 23, 19–36. doi: 10.1007/s10980-007-9138-y
Treml E. A., Roberts J. J., Chao Y., Halpin P. N., Possingham H. P., Riginos C. (2012). Reproductive output and duration of the pelagic larval stage determine seascape-wide connectivity of marine populations. Integr. Comp. Biol. 52, 525–537. doi: 10.1093/icb/ics101
Treml E. A., Roberts J., Halpin P. N., Possingham H. P., Riginos C. (2015). The emergent geography of biophysical dispersal barriers across the Indo-West Pacific. Divers. Distrib. 21, 465–476. doi: 10.1111/ddi.12307
Uriarte I., Espinoza V., Herrera M., Zúñiga O., Olivares A., Carbonell P., et al. (2012). Effect of temperature on embryonic development of Octopus mimus under controlled conditions. J. Exp. Mar. Biol. Ecol. 416–417, 168–175. doi: 10.1016/j.jembe.2012.03.003
Van Heukelem W. F. V. (1973). Growth and life-span of Octopus cyanea (Mollusca: Cephalopoda). J. Zool. 169, 299–315. doi: 10.1111/j.1469-7998.1973.tb04559.x
Van Heukelem W. F. (1976). Growth, bioenergetics and life-span of Octopus cyanea and Octopus maya. (Thesis). University of Hawaii.
Van Nieuwenhove A. H. M., Ratsimbazafy H. A., Kochzius M. (2019). Cryptic diversity and limited connectivity in octopuses: recommendations for fisheries management. PloS One 14 (5), e0214748. doi: 10.1371/journal.pone.0214748
Wells M. J., Wells J. (1970). Observations on the feeding, growth rate and habits of newly settled Octopus cyanea. J. Zool. 161, 65–74. doi: 10.1111/j.1469-7998.1970.tb02170.x
White J. W., Morgan S. G., Fisher J. L. (2014). Planktonic larval mortality rates are lower than widely expected. Ecology. 95, 3344–3353. doi: 10.1890/13-2248.1
Willer D. F., Aldridge D. C., Gough C., Kincaid K. (2023). Small-scale octopus fishery operations enable environmentally and socioeconomically sustainable sourcing of nutrients under climate change. Nat. Food 4, 179–189. doi: 10.1038/s43016-022-00687-5
Wood S. N. (2011). Fast stable restricted maximum likelihood and marginal likelihood estimation of semiparametric generalized linear models. J. R. Stat. Soc B. 73, 3–36. doi: 10.1111/j.1467-9868.2010.00749.x
Keywords: periodic closure, octopus, fishery, management, West Indian Ocean, Africa, Comoros, Madagascar
Citation: McCabe MK, Mudge L, Randrianjafimanana T, Rasolofoarivony N, Vessaz F, Rakotonirainy R, Said FA, Rakotoarisoa F, Ratoniherison T, Box S and Cox C (2024) Impacts of locally managed periodic octopus fishery closures in Comoros and Madagascar: short-term benefits amidst long-term decline. Front. Mar. Sci. 11:1358111. doi: 10.3389/fmars.2024.1358111
Received: 19 December 2023; Accepted: 16 April 2024;
Published: 10 May 2024.
Edited by:
Carlo Pipitone, CNR - IAS Institute of Anthropic Impacts and Sustainability in Marine Environment, ItalyReviewed by:
Pablo Pita, University of A Coruña, SpainCopyright © 2024 McCabe, Mudge, Randrianjafimanana, Rasolofoarivony, Vessaz, Rakotonirainy, Said, Rakotoarisoa, Ratoniherison, Box and Cox. This is an open-access article distributed under the terms of the Creative Commons Attribution License (CC BY). The use, distribution or reproduction in other forums is permitted, provided the original author(s) and the copyright owner(s) are credited and that the original publication in this journal is cited, in accordance with accepted academic practice. No use, distribution or reproduction is permitted which does not comply with these terms.
*Correspondence: Mary K. McCabe, katie@barefootocean.org
Disclaimer: All claims expressed in this article are solely those of the authors and do not necessarily represent those of their affiliated organizations, or those of the publisher, the editors and the reviewers. Any product that may be evaluated in this article or claim that may be made by its manufacturer is not guaranteed or endorsed by the publisher.
Research integrity at Frontiers
Learn more about the work of our research integrity team to safeguard the quality of each article we publish.