 Eiseul Kim
 Seung-Min Yang
 Jae-Eun Cha
 Dae-Hyun Jung
 Hae-Yeong Kim
94% of researchers rate our articles as excellent or good
Learn more about the work of our research integrity team to safeguard the quality of each article we publish.
Find out more
ORIGINAL RESEARCH article
Front. Mar. Sci. , 08 April 2024
Sec. Ocean Observation
Volume 11 - 2024 | https://doi.org/10.3389/fmars.2024.1356356
This article is part of the Research Topic Deep Learning for Marine Science, volume II View all 27 articles
The rapid and accurate classification of aquatic products is crucial for ensuring food safety, production efficiency, and economic benefits. However, traditional manual methods for classifying ark shell species based on phenotype are time-consuming and inefficient, especially during peak seasons when the demand is high and labor is scarce. This study aimed to develop a deep learning model for the automated identification and classification of commercially important three ark shells (Tegillarca granosa, Anadara broughtonii, and Anadara kagoshimensis) from images. The ark shells were collected and identified using a polymerase chain reaction method developed in a previous study, and a total of 1,400 images were categorized into three species. Three convolutional neural network (CNN) models, Visual Geometry Group Network (VGGnet), Inception-Residual Network (ResNet), and SqueezeNet, were then applied to two different classification sets, Set-1 (four bivalve species) and Set-2 (three ark shell species). Our results showed that SqueezeNet demonstrated the highest accuracy during the training phase for both classification sets, whereas Inception-ResNet exhibited superior accuracy during the validation phase. Similar results were obtained after developing a third classification set (Set-3) to classify six categories by combining Set-1 and Set-2. Overall, the developed CNN-based classification model exhibited a performance comparable or superior to that presented in previous studies and can provide a theoretical basis for bivalve classification, thereby contributing to improved food safety, production efficiency, and economic benefits in the aquatic products industry.
Ark shells belong to the phylum Mollusca, class Bivalvia, order Arcida, and family Arcidae. Among the various ark shell species, granular ark (Tegillarca granosa (Linnaeus, 1758)), broughton’s ribbed ark (Anadara broughtonii (Schrenck, 1867)), and half-crenate ark (Anadara kagoshimensis (Tokunaga, 1906)) are currently commercially important for the fishery industry (Lee et al., 2022) and can be found throughout the Indo-Pacific region. These ark shell species, which live burrowed into sand or mud mainly within the intertidal zone at a depth of 1 to 2 m, play a crucial role in the community structure of coastal ecosystems and as critical economic resources for the fishery and aquaculture industries (Zhao et al., 2017). They are one of the most popular marine bivalves among consumers given their rich flavor and substantial nutritional benefits. In fact, they provide high-quality protein and vitamins, are low in fat, and contain a considerable amount of iron, which helps prevent anemia (Zha et al., 2022). The worldwide production of ark shells has been estimated to be approximately 591,000 tons per year, representing a value of nearly $600 million (Kong et al., 2020). In Korea, the production of ark shells has been to exceed 12,600 tons in 2019 (https://www.mof.go.kr/). Considering their ecological and economic importance as marine bivalves, they have been the subject of research efforts.
Globally, the aquaculture industry has continued to heavily rely on human judgment, manual labor, and environmental factors, or at most, employs partially automated or mechanized systems (Benjakul and Saetang, 2022). In response to these challenges, various strategies have been proposed to digitize the sector (Simonyan and Zisserman, 2015). Particularly in the distribution stage of aquatic resources, image recognition technology has been employed to leverage smartphones in identifying fish species or assessing their status based on image data (Yang et al., 2021; Knausgård et al., 2022; Li et al., 2023). Traditional image recognition technology has been used to perform contouring and indexing based on the unique characteristics of the object being classified (Deep and Dash, 2019). One of the popular techniques used to categorize aquatic resources is the polygon approximation algorithm, which involves selecting the start and end points of a segment and deciding whether to include a dominant point. Although this approach has allowed for the classification of aquatic resources with distinct outline characteristics, such as fish, shellfish, and starfish, it has some limitations when distinguishing detailed species within the fish or shellfish categories (Villon et al., 2018). Since 2010, the field of artificial intelligence has seen rapid advancements, particularly with regard to deep learning algorithms used in image processing (Rasheed, 2021). Considering their superior performance and broad applicability, deep learning algorithms have been ubiquitously employed across various industry sectors. Numerous examples of their applications can also be found in the fisheries industry (Yang et al., 2021; Saleh et al., 2022). Typically, the datasets used for artificial intelligence models that classify aquatic resources, particularly fish and shellfish, primarily focus on resources with characteristics distinct enough to be identified visually by humans (Zhang et al., 2023). However, for specific granular ark breeds that exhibit three similar phenotypes, a targeted model development focusing specifically on these three types could be considered more appropriate than incorporating them into the existing shellfish classification dataset. Traditionally, experts have relied on the shape and count of radial ribs to visually differentiate these species. However, this approach this method is not only challenging in achieving precise differentiation but also labor-intensive, requiring accurate classification assessment.
Therefore, the primary objective of this study was to validate whether genetic testing, in conjunction with genetic analysis, could be used for the imaging-based classification and differentiation of three distinct ark shell species. More precisely, this study employed a deep learning model, underpinned by a convolutional neural network (CNN) architecture, to classify the three species of ark shells, subsequently comparing the efficacies of the applied models to determine the most proficient one. To accomplish this, a verification group comprising three species of ark shells and four other bivalves was classified with the intent of developing an image classification model. We then determined the performance of the most efficient model and, ultimately, sought to corroborate the differentiation of the three ark shell species through polymerase chain reaction (PCR) testing. This approach aimed to not only enhance the accuracy and efficiency of ark shell classification but also contribute to the broader field of mollusk research and biodiversity conservation.
Reference specimens of granular ark (Tegillarca granosa), broughton’s ribbed ark (Anadara broughtonii), half-crenate ark (Anadara kagoshimensis), scallop (Patinopecten yessoensis), venus mactra (Mactra veneriformis), and venus clam (Cyclina sinensis) were obtained from the National Institute of Biological Resource (Incheon, Korea). The granular ark, broughton’s ribbed ark, and half-crenate ark, scallop, venus mactra, and venus clam samples were collected by fish farms, fish auction markets, and fish markets across Korea. The bivalve species chosen for the experiment were of excellent quality, with no discernible flaws or damage. We opted to use RGB images obtained by smart phone considering their wide availability across various stages in the bivalve industry (Jayasundara et al., 2023). To ensure better generalization, two smartphones, an iPhone 11 Pro Max and a Samsung Galaxy S20+, with different camera were used. The specifications of the smartphone camera used were as follows: dimensions (iPhone, 1,440 × 1,440; Galaxy, 1,440 × 3,200), resolution (iPhone, 96 dpi; Galaxy, 525 ppi), ISO time (iPhone, 100; Galaxy, 100), f-stop (iPhone, f/1.6; Galaxy, f/1.8), and exposure time (iPhone, 1/60 s; Galaxy, 1/60 s). To ensure image consistency and prevent shadows, a background surface was used by fixing the camera at 50 cm above the bivalve samples during the image acquisition process.
The ark shells selected for the experiment were identified using a specific PCR method to accurately classify the samples. First, the shells of the ark shells were removed, after which the genomic DNA of the edible portion was extracted using DNeasy Blood & Tissue Kit (Qiagen, Hilden, Germany) according to the manufacturer’s instructions. Thereafter, T. granosa, A. broughtonii, and A. kagoshimensis were detected using ultrafast PCR with specific primers developed in our previous study (Lee et al., 2022). The primer sequences used for ultrafast PCR are shown in Supplementary Table 1. Based on genetic analysis, each image of ark shell was classified according to species.
When preparing the image dataset for the detailed species classification of ark shells, we initially gathered datasets for four bivalve species, namely scallop, venus mactra, venus clam, and ark shells that resembled ark shells in order to develop a model that could classify these species. Within this framework, we regarded the three species of ark shells as a single data group. The primary dataset used for classifying these four types of bivalves was collected from the top view of the specimens, as depicted in Figure 1. Building upon the results derived from the bivalve classification dataset, image data of specimens identified as ark shell were acquired for further classification into the three detailed ark shell species, as depicted in the following Figure 1. A distinctive physical feature of the ark shells is the presence of radial ribs, which resemble fan-shaped grooves (Figure 2). We aimed to examine the conventional method of ark shell classification based on the count of these radial ribs. To accomplish this, the number of lines in 100 samples of each detailed species was counted.
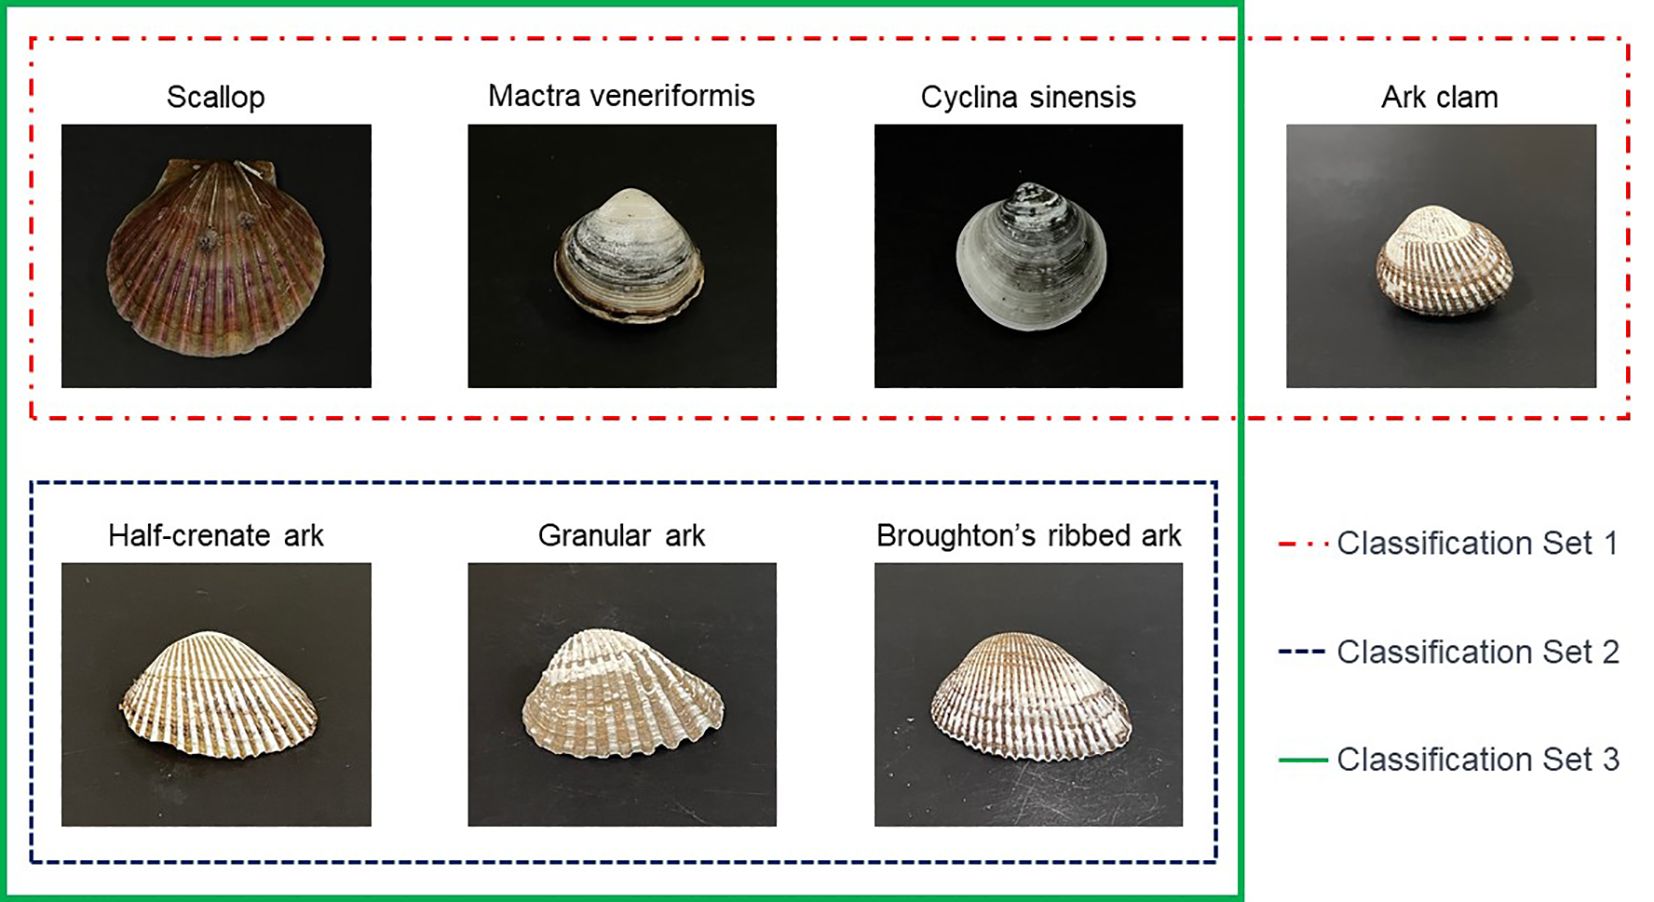
Figure 1 The classification dataset intended for testing the deep learning model applied in this study. Representative images of the dataset for the entire bivalves (scallop, venus mactra, venus clam, and ark shells: in the case of ark clam, all three detailed species are included).

Figure 2 Phenotype characteristics of Anadara kagoshimensis (top), Anadara broughtonii (middle), and Tegillarca granosa (bottom).
Figure 3 depicts the characteristics and inner workings of the VGG16 model. Accordingly, the model commences with an input layer that accommodates an image of a shape (224, 224, 3). The architecture then utilizes 13 convolutional layers designed to extract intricate features from the input images. Though small, the 3 × 3 filters capture localized spatial correlations present within the image data, effectively simplifying the complexity of the image. Nonlinearity, a critical aspect of deep learning networks, is introduced by applying the Rectified Linear Unit activation function after each convolution operation. This process allows the network to model and learn more complex patterns within the data. Max pooling, a downsampling operation, is performed along the spatial dimensions of the image (width and height) through five layers within the model. Not all convolutional layers are followed by max pooling, thereby preserving certain high-resolution features. After the final max pooling layer, the architecture encompasses two fully connected layers, each possessing 4,096 nodes. These layers further model nonlinear combinations of high-level features derived from the output of the convolutional layers. Essentially, these fully connected layers function as classifiers that can be utilized for definitive classification. The architecture concludes with a softmax activation layer comprising 1,000 nodes, one for each possible image class within the model. The softmax function, which represents a probability distribution over the varied possible outcomes, delivers the final class prediction for the given input image.
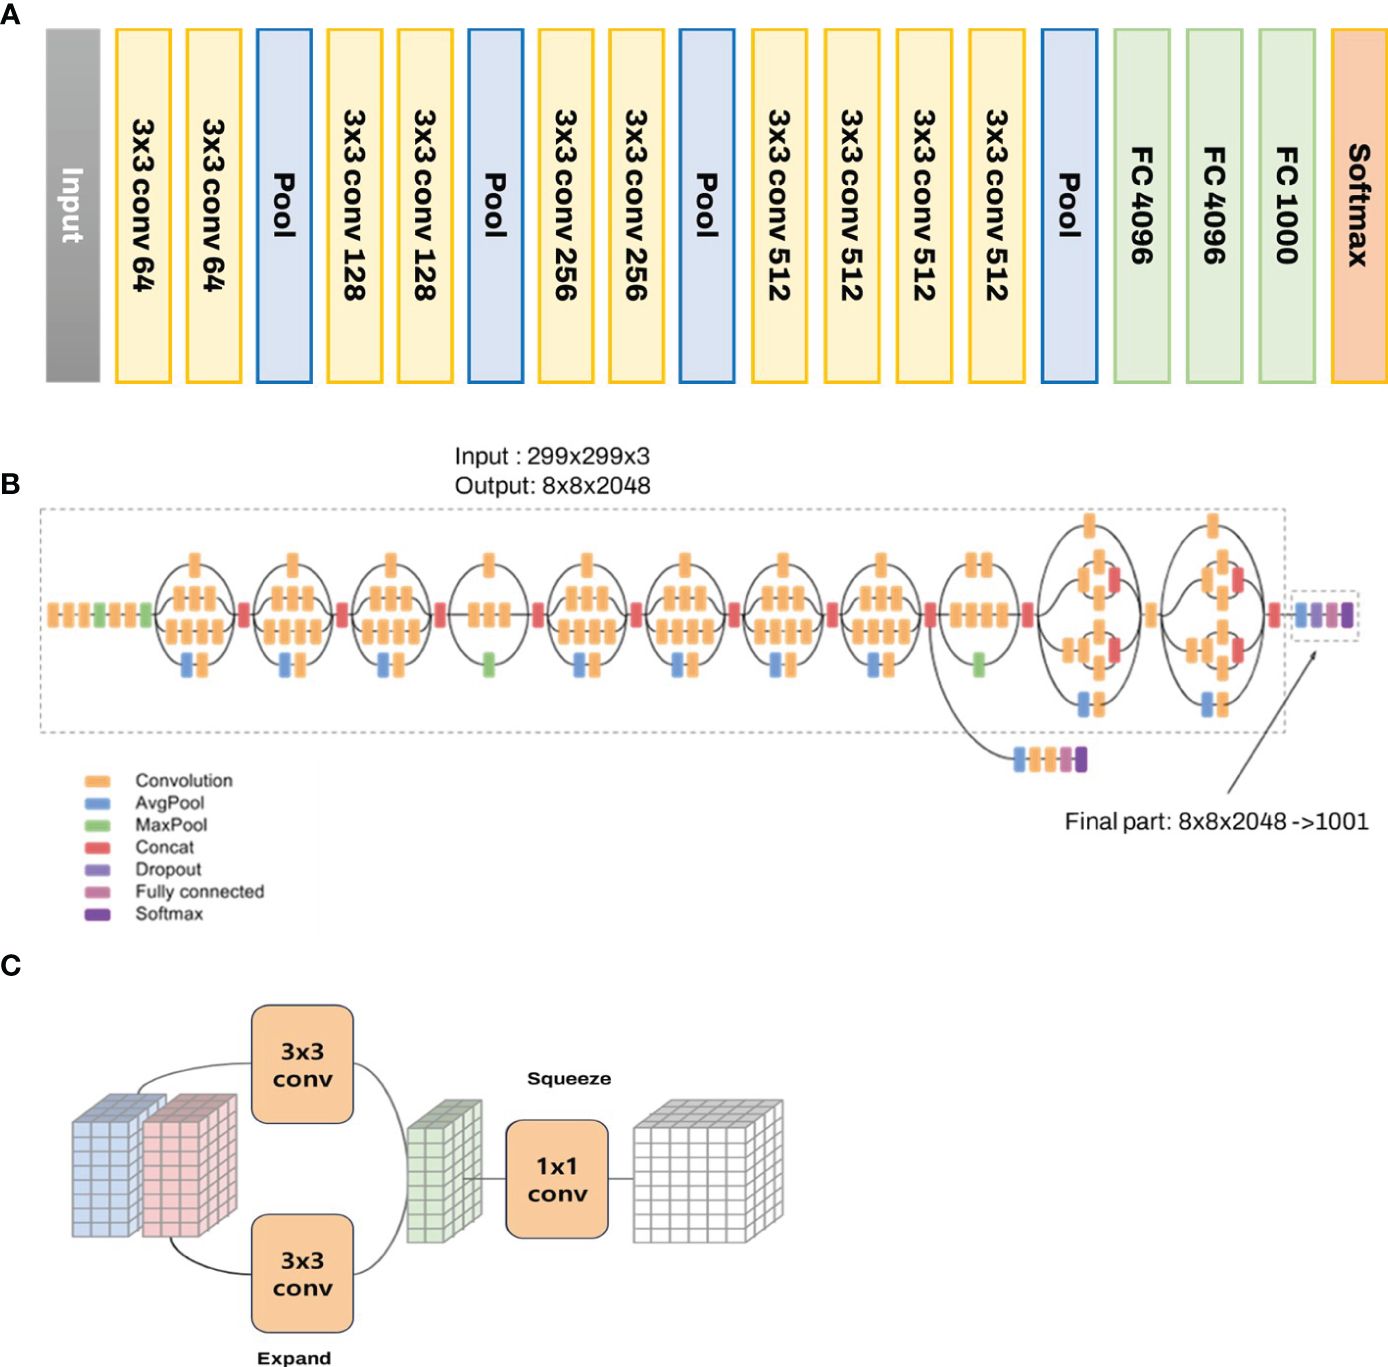
Figure 3 The structure of (A) VGGnet-19, (B) Inception-Resnet, and (C) Squeezenet used to develop the image classification model.
Inception-ResNet, a distinctive architecture within the CNN framework, seamlessly integrates the salient features of two pivotal networks, namely Inception and ResNet (He et al., 2016; Szegedy et al., 2017). The Inception-ResNet architecture amalgamates the advantages of Inception (efficient processing of images at multiple scales) and ResNet (ease of training deep networks) architectures. This is achieved by introducing residual connections within the Inception architecture. The Inception-ResNet architecture can be characterized as a series of stacked Inception modules, each supplemented with a shortcut connection that links the module’s input to its output. Owing to this hybrid combination, the Inception-ResNet architecture has been considered an extraordinarily potent model for various computer vision tasks that is capable of efficiently processing images across diverse scales, courtesy of the incorporated Inception architecture, while ensuring relative ease in training, even for significantly deep networks, due to the integrated ResNet architecture (Figure 3).
SqueezeNet was designed to reduce the number of parameters and amount of memory required to store the model without sacrificing accuracy (Koonce, 2021; Sayed et al., 2021), which can be achieved through several strategies.
Use of 1 × 1 filters: These filters have fewer parameters than 3 × 3 filters and can be used to reduce and increase the number of channels in the network.
Decrease in number of input channels to 3 × 3 filters: SqueezeNet decreases the number of input channels to 3 × 3 filters, which are more computationally expensive than 1 × 1 filters. This is accomplished through squeeze layers, which reduce the depth of the network using 1 × 1 filters.
Downsampling late in the network: Downsampling is a technique used to reduce the spatial dimensions of the data. In SqueezeNet, downsampling is performed late in the network to ensure that the convolutional layers have large activation maps, which can increase the classification accuracy.
The basic building block of SqueezeNet is the Fire module, which consists of a squeeze layer followed by an expand layer (Figure 3). The squeeze layer reduces the number of input channels using 1 × 1 filters, whereas the expand layer increases the number of channels using a combination of 1 × 1 and 3 × 3 filters. Overall, SqueezeNet is an efficient and compact network that is ideal for circumstances in which memory and computational resources are limited but high accuracy is still required.
Based on the classification objectives, the proposed models were categorized into Classification Set-1, Classification Set-2, and Classification Set-3. Set-1 was designed to classify four types of bivalves (scallop, venus mactra, venus clam, and ark shells), whereas Set-2 was specifically engineered to distinguish between three species of the ark shells (granular ark, broughton’s ribbed ark, and half-crenate ark). Finally, Set-3 was designed to amalgamate the classification capabilities of Set-1 and Set-2, thereby aiming to classify a total of six classes, encompassing the three broader bivalve categories and the three specific ark shells species. The development of these models holds the potential to significantly enhance the accuracy and efficiency of bivalve species classification tasks (Figure 1).
The evaluation of the developed models in this study is a crucial component in ensuring their performance and reliability. Classification accuracy is the most straightforward evaluation metric. Accuracy is a metric that accounts for the situation in which the model infers two classification labels and predicts true as true and false as false, which can be expressed as Equation (1):
True Positive (TP) predict the answer that is actually true as true (correct answer). False Positive (FP) predict the answer that is actually false as true (wrong answer). False Negative (FN) predict the answer that is actually true as false (wrong answer). True Negative (TN) predict the answer that is actually false as false (correct answer).
The F1 score is a statistic that defines the classification accuracy and recall rate, which are combined into a single statistic. Here, the harmonic average and not the standard average was determined. This ensures that the F1 score has a low value, comparable to precision and recall, which are close to 0. The equation for the F1 score is as Equation (2):
The models were trained using a substantial dataset of bivalve images and validated using a separate, unseen set of images to ensure an unbiased evaluation. Performance was tested on not only an individual level (Classification Set-1 and Classification Set-2) but also a comprehensive level (Classification Set-3), providing insights into specific and generalized model performance. Notably, the models are not evaluated based solely on these metrics. Qualitative analysis of the predictions, through visual inspection of correctly and incorrectly classified images, can also contribute to the overall assessment of the models’ performance. This comprehensive evaluation methodology ensures the development of reliable and robust classification models that can function effectively in real data sample.
This study collected three ark shells (T. granosa, A. broughtonii, and A. kagoshimensis), which were identified using an ultrafast PCR method developed in our previous study to develop a deep learning model with accurate data. The ultrafast PCR method was applied to ark shells, with each primer showing an amplification plot for each sample (Figure 4). The Ct values of the amplified products from each target species were 18.51, 23.11, and 22.62 for granular ark, half-crenate ark, and broughton’s ribbed ark, respectively. The specific band was also amplified in the electrophoresis image (Supplementary Figure 1). A total of 1,400 images were categorized into three species (T. granosa, A. broughtonii, and A. kagoshimensis) and used to validate deep learning.
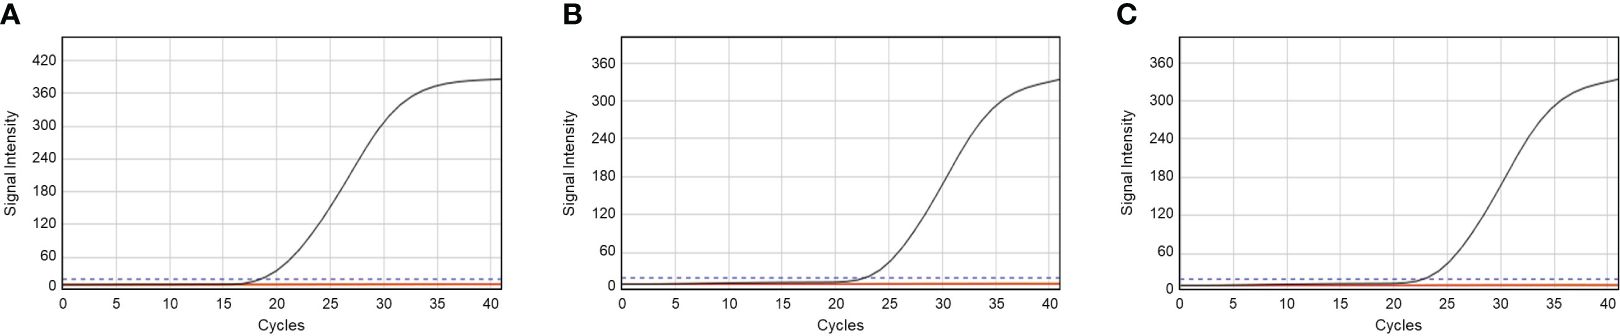
Figure 4 Amplification plot for identifying (A) Tegillarca granosa, (B) Anadara broughtonii, and (C) Anadara kagoshimensis.
This study initially compared the accuracy of the classification of the four bivalves (scallop, venus mactra, venus clam, and ark shells) with the learning and verification accuracy of three CNN models. The results of each deep learning model applied to Classification Set-1 are presented in Figure 5, with the left side delineating the performance metrics obtained from the training data, whereas the right side delineating the corresponding metrics obtained from the test data. This structured presentation of results facilitates a comprehensive and comparative analysis of the model’s performance across training and testing phases (Figure 5A, left), showcasing the changes in accuracy over iterations for three distinct CNN architectures: VGGnet, Inception-ResNet, and SqueezeNet. The accuracy results obtained during the training phase were as follows: VGGnet, 94.32%; Inception-ResNet, 96.55%; SqueezeNet, 97.23% (the highest reported).
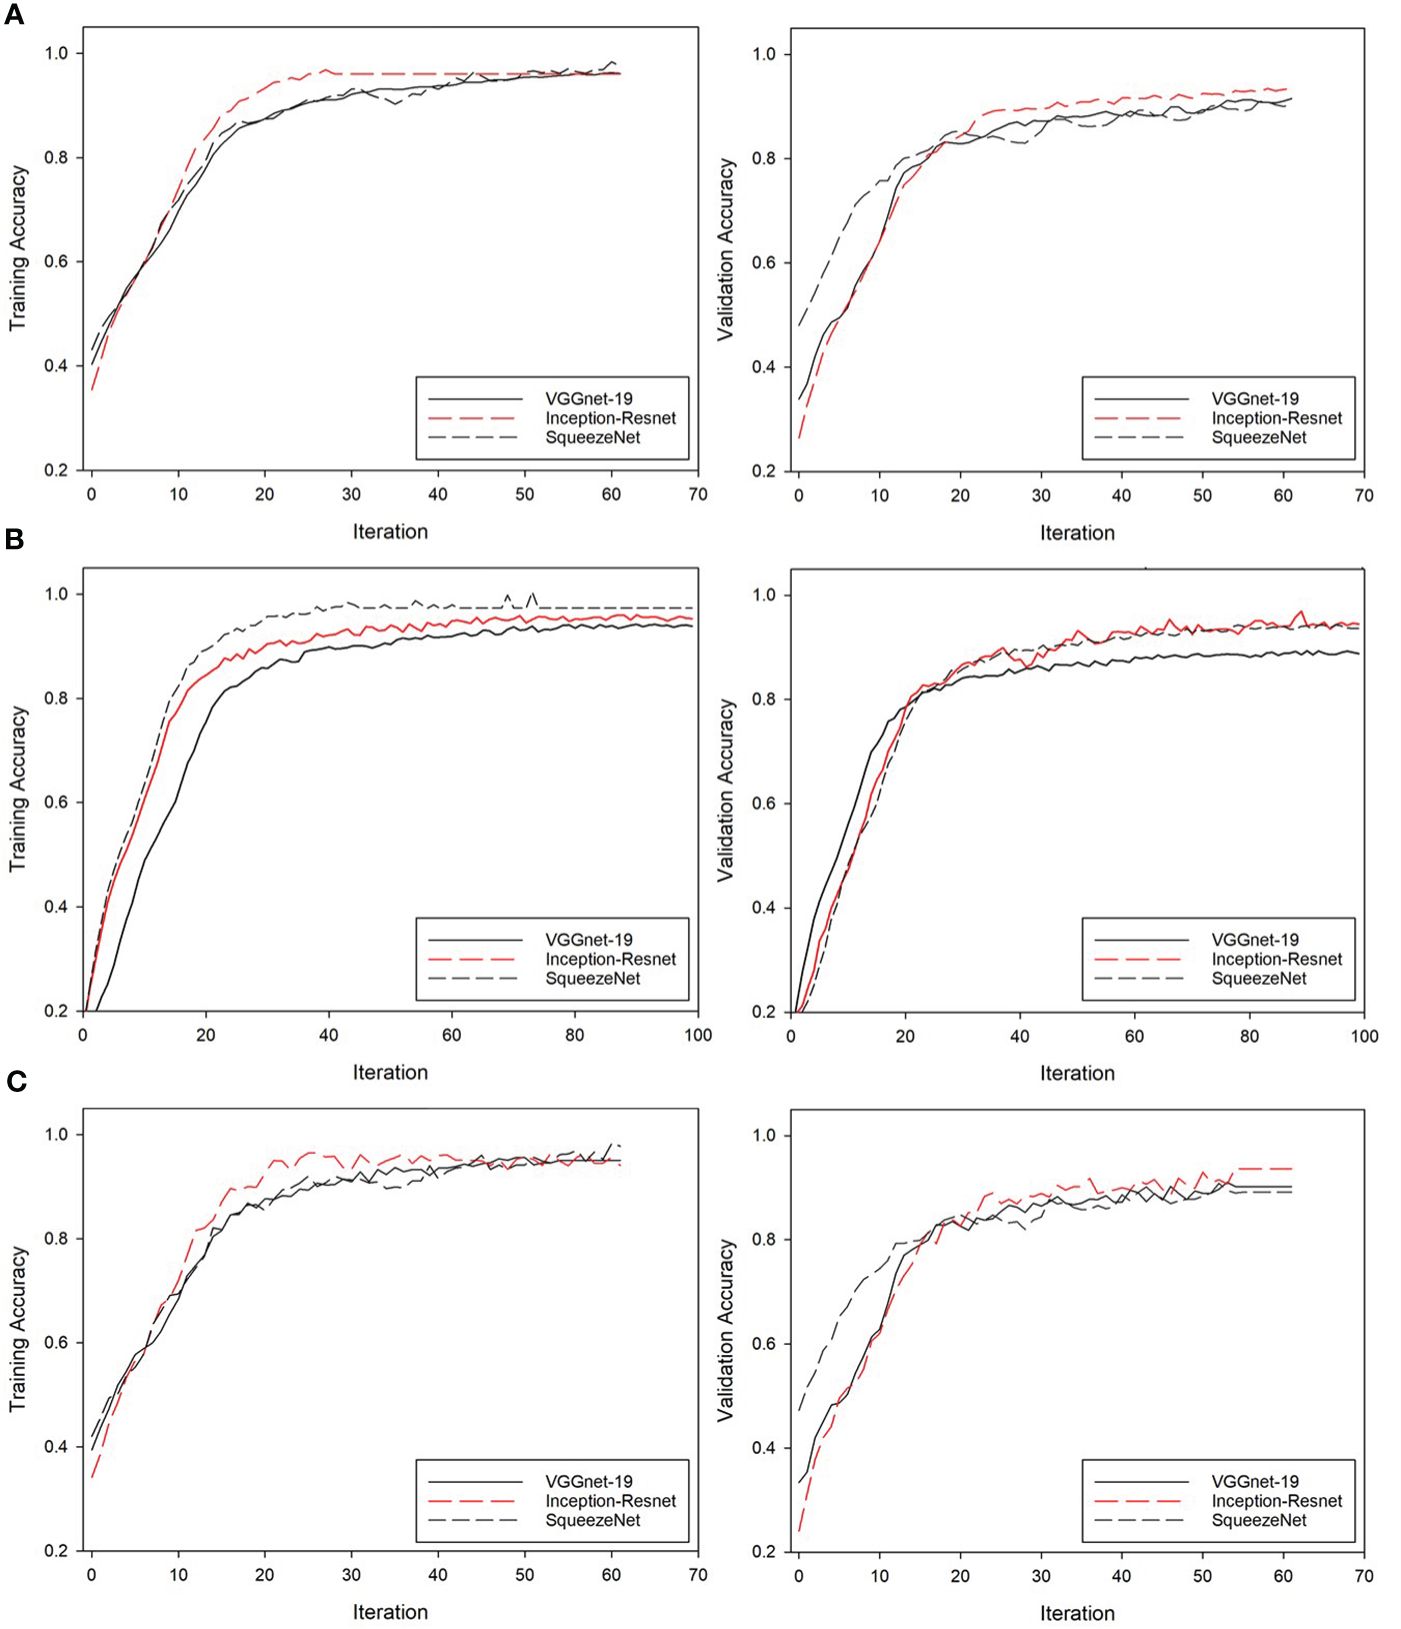
Figure 5 Results of each deep learning model for (A) Classification Set-1, (B) Classification Set-2, and (C) Classification Set-3. The left and right sides represent training data and test data, respectively.
To verify the reliability of the developed model, the test set was utilized for inference and the validation accuracy was subsequently calculated. During this validation phase, VGGnet, Inception-ResNet, and SqueezeNet achieved an accuracy of 91.12%, 95.41%, and 91.03%, respectively (Figure 5A, right). These results confirmed that all three models demonstrated promising performance, with SqueezeNet exhibiting the highest training accuracy and Inception-ResNet showing superior accuracy during the validation phase. This comprehensive performance evaluation provides valuable insights into the models’ capabilities.
Classification Set-2, which was tailored to classify three detailed ark shell species, showed changes in accuracy over iterations for the three utilized CNN models, namely VGGnet, Inception-ResNet, and SqueezeNet, as demonstrated by its training performance in Figure 5B (left). The accuracy values attained by VGGnet, Inception-ResNet, and SqueezeNet during the training phase were 93.22%, 93.51%, 97.11%, respectively, with SqueezeNet outperforming the other two CNN models. Following the approach undertaken with Classification Set-1, the developed Classification Set-2 was also put through an inference process with the test set to ascertain its validation accuracy. The accuracy results for VGGnet, Inception-ResNet, and SqueezeNet obtained during this validation phase were 95.05%, 94.01%, and 97.78%, respectively. These outcomes affirm the proficiency of all three models, with SqueezeNet demonstrating the highest accuracy during the training phase, whereas Inception-ResNet being the most accurate during the validation phase. This extensive performance evaluation highlights the effectiveness of the models while also emphasizing the potential areas for enhancement in future iterations.
Classification Set-3 was developed to classify six classes established by combining the classification classes in Classification Set-1 and Classification Set-2. As exhibited in Figure 5C (left), the performance of Classification Set-3 during training displayed an evolution in accuracy across iterations for the three distinct CNN models, VGGnet, Inception-ResNet, and SqueezeNet. The accuracy attained by VGGnet, Inception-ResNet, and SqueezeNet during the training phase were 89.91%, 92.48%, and 91.75%, respectively.
Similar to its predecessors, Classification Set-3 underwent an inference process with the test set to establish its validation accuracy. During the validation phase, VGGnet, Inception-ResNet, and SqueezeNet achieved an accuracy of 90.23%, 93.67%, and 89.16%, respectively. These results underscore the promising performance of all three models, with SqueezeNet demonstrating the highest training accuracy, whereas Inception-ResNet yielding superior accuracy during the validation phase.
In the evaluation of our deep learning model, accuracy and F1 scores were considered as key performance metrics. Although accuracy is a common measure for model performance, it can be misleading in cases where the dataset is imbalanced given that it does not consider the distribution of false positives and false negatives. Therefore, we also utilized the F1 score, which is a more robust measure for imbalanced datasets, given that it considers false positives and false negatives by calculating the harmonic mean of precision and recall. The SqueezeNet model performed slightly better than the VGGnet and Inception-ResNet models on Classification Set-1 and Set-2, with F1 scores of 0.91 and 0.89, respectively (Table 1). However, on Classification Set-3, the Inception-ResNet model outperformed the other two models with an F1 score of 0.91. Despite the relatively small differences in F1 scores, they can be significant depending on the specific application and the requirements for model performance.
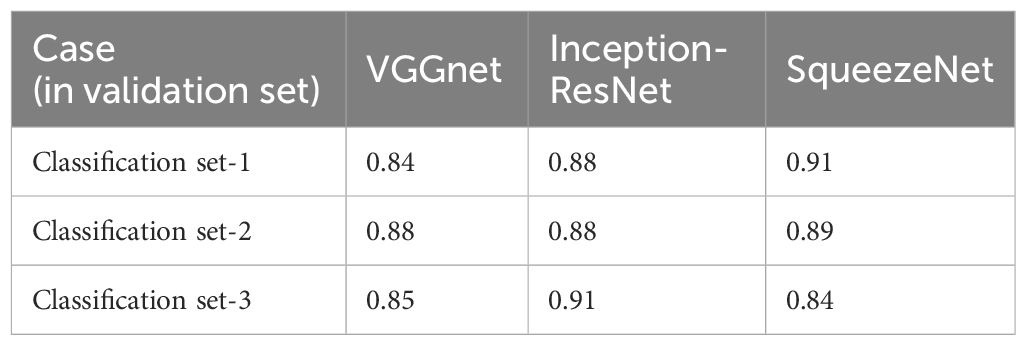
Table 1 F1 scores of the validation sets of deep learning models.
In traditional methods, detailed species of ark shells have been conventionally distinguished based on the count of the radial ribs. To investigate the difference in the number of radial ribs between the three species, the radial ribs in a sample size of 100 ark shells were counted. The half-crenate ark had an average radial rib count of 28.9 ± 1.92, broughton’s ribbed ark exhibited 32.01 ± 1.89 ribs on average, and the granular ark presented an average count of 17.88 ± 1.23 radial ribs. Figure 6 illustrates the distribution of radial rib count for each class. Notably, overlaps in distribution were noted between the half-crenate ark and broughton’s ribbed ark, whereas the granular ark was distinctly differentiated. Although this distinction can be somewhat discerned visually in the images, definitively distinguishing between the half-crenate ark and broughton’s ribbed ark based on visual information alone requires a high level of expertise and judgment.
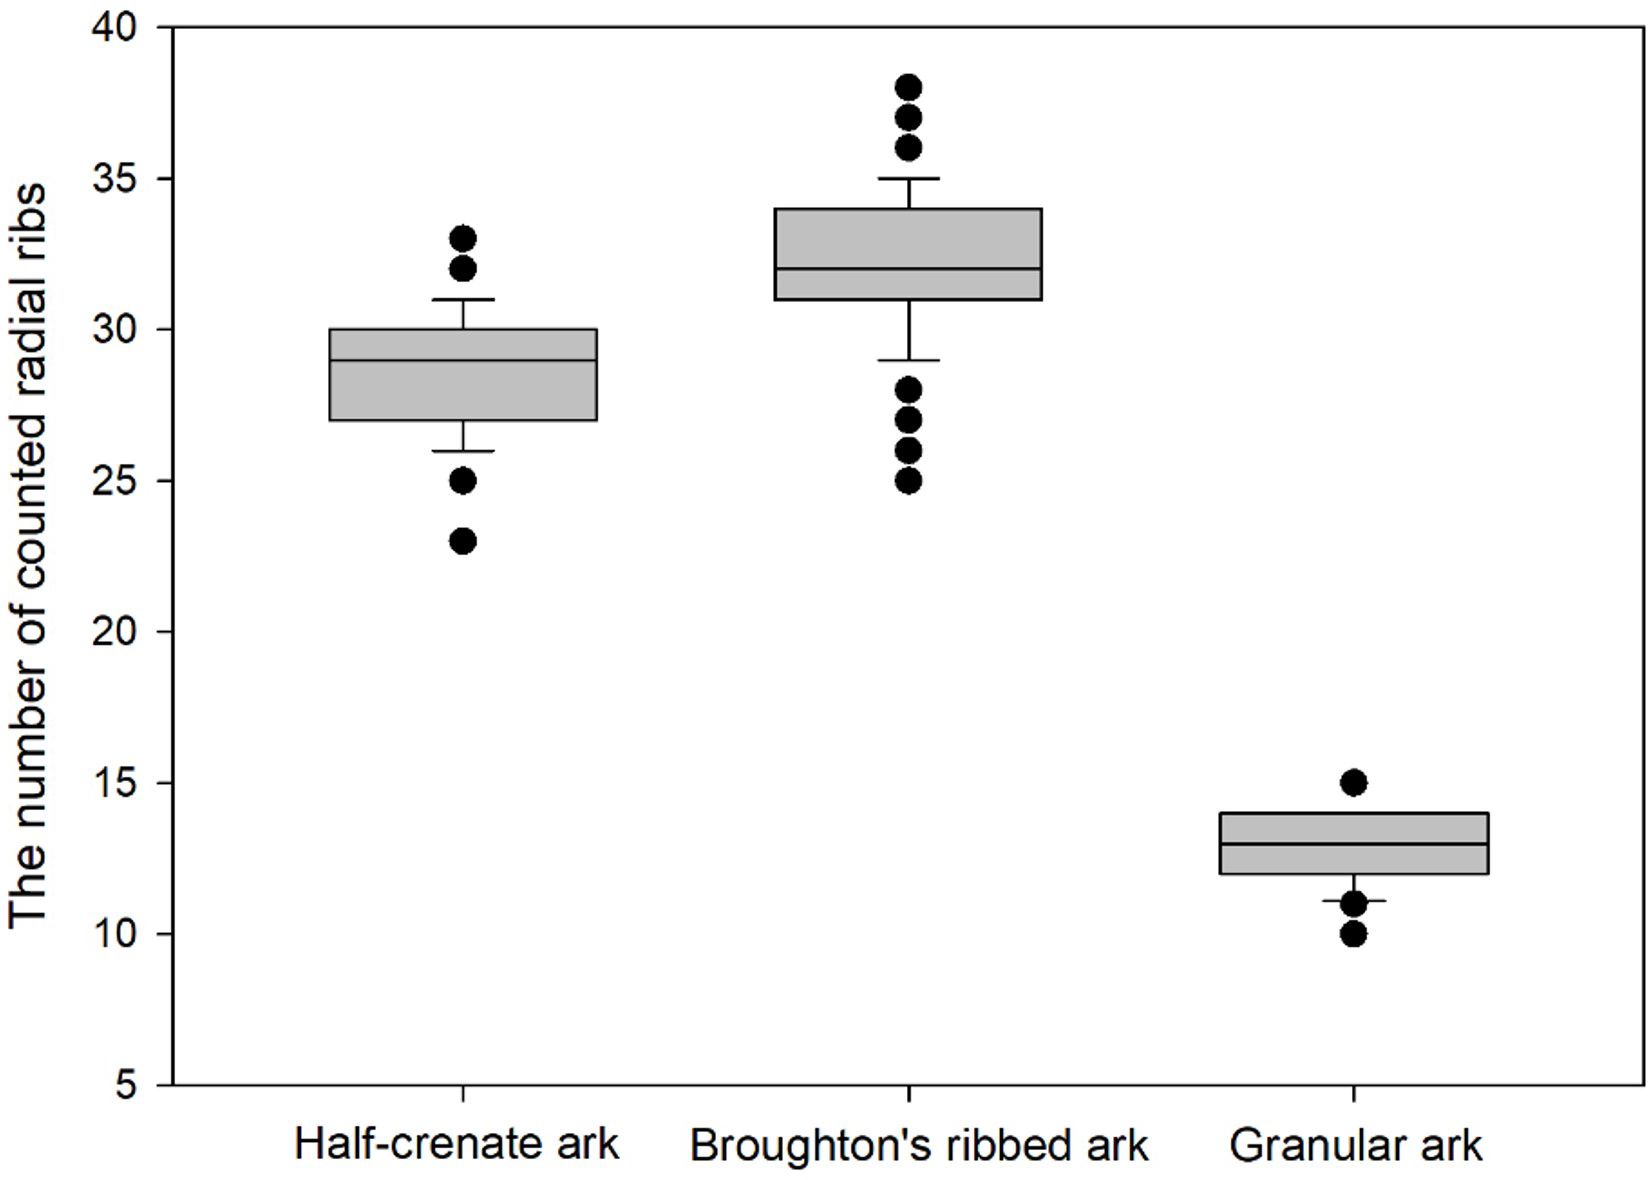
Figure 6 Distribution of radial rib count for the half-crenate ark, broughton’s ribbed ark, and granular ark species. The black dot represents outliers in the data. The median is shown by a line inside the box. The standard deviation is not visually represented in the box plot.
Over the past few decades, consumer demands on the verification of the authenticity of aquatic products, detection of adulteration, and implementation of stricter controls on these issues have increased (Ren et al., 2023). Manual classification of ark shells based on phenotype cannot satisfy the demand created by shellfish production areas during peak seasons given the lack of labor (Ge et al., 2022). Moreover, this problem is compounded by the considerably limited corporate development due to rising labor costs and soaring product prices (Feng et al., 2021). With the demand for quality and efficiently produced aquatic products, more efficient and accurate approaches in sorting fish and shellfish are needed to improve the level of production automation (Feng et al., 2021). In recent years, computer and artificial intelligence technologies have developed rapidly to the point where computer vision has been widely applied in numerous fields of industrial production, including automotive, electrical machinery, food, logistics, and manufacturing industries (Jalal et al., 2020; Singh et al., 2022; Kim et al., 2023). By using computer vision to identify, locate, and subsequently sort scallops, production efficiency can be improved while ensuring the quality of the aquatic products.
This approach has been applied for the automated evaluation of aquatic products because deep learning networks have a strong capacity for learning and can extract deeper information from images acquired in the environment (He et al., 2016; Mukhiddinov et al., 2022). Jayasundara et al. (2023) presented two Neural Network architectures, to classify the quality grading of the Indian Sardinella and the Yellowfin Tuna using images (Jayasundara et al., 2023). Moreover, Vo et al. (2020) used the pre-trained Mask-RCNN model to determine the various attributes of lobsters, such as size, weight, and color, to achieve automated grading of the lobsters (Vo et al., 2020). More interestingly, given the outstanding classification performance of deep learning, researchers have applied the same to the gender classification of aquatic animals. For example, Cui et al. (2020) proposed an improved deep CNN model that can classify Chinese mitten crabs according to gender using images at an accuracy of 99% (Cui et al., 2020).
It is well established that several types of aquatic products share very close similarities among their species, making it difficult to distinguish them based on their morphological characteristics (Li et al., 2023). Although the external characteristics of aquatic products are recognizable, distinguishing them based on such is a time-consuming process. Given the high morphological similarity of fish species, Banan et al. (2020) developed a deep NN model for the identification of four carp species, common carp (Cyprinus carpio Linnaeus, 1758), grass carp (Ctenopharingodon Idella (Valenciennes, 1844)), bighead carp (Hypophthalmichthys nobilis (Richardson, 1845)), and silver carp (Hypophthalmichthys molitrix (Valenciennes, 1844)) (Banan et al., 2020).
Although deep learning technology has achieved remarkable results in the image classification of aquatic products, species classification still remains a major challenge, especially for shellfish species that are very morphologically similar (Banan et al., 2020). In general, broughton’s ribbed ark has more radial ribs than the half-crenate ark. However, smaller specimens of broughton’s ribbed ark may have a number of radial ribs similar to those of the half-crenate ark. In this context, one of the challenging aspects is that it is difficult to distinguish between the three types of ark shells based on the number of radial ribs alone. As shown in Figure 6, the average counts of radial ribs for the half-crenate ark and broughton’s ribbed ark are similar, and there is an overlap in their distributions, making visual discrimination alone challenging. Due to this morphological similarity, distinguishing between these ark shell species based solely on radial rib counts may not be definitive, and it may require a high level of expertise and judgment. Therefore, it can be concluded that a more accurate and effective method is needed to differentiate ark shell species with similar morphology.
For this reason, we developed a deep learning model for the automated identification and classification of three ark shells based on obtained images, thereby overcoming concerns regarding time consumption and inefficiency associated with traditional identification methods. Our experimental results showed that ark shells and other species of bivalves were classified at an accuracy of 95.30%, while the three types of ark shells were classified at an accuracy of 92.4%. Similar to ark shells, squid species share considerable morphological similarities. As such, Hu et al. (2020) proposed an efficient deconvolutional Neural Network to classify three squid species based on images, with the test sample archiving an accuracy of 85.7% (Hu et al., 2020). Our experimental results showed that the classification performance of the CNN model was comparable to or better than that presented in previous studies and that the developed method can be applied to other bivalves that share similar morphological characteristics among their species. Our CNN-based model that classifies images of three ark shells can provide a theoretical basis for bivalve classification and enable the tracking of the entire production process of ark shells from catching to selling with the support of big data, which is useful for improving food safety, production efficiency, and economic benefits.
The original contributions presented in the study are included in the article/Supplementary Material. Further inquiries can be directed to the corresponding authors.
Ethical approval was not required for this study involving animals, as per local legislation and institutional guidelines, because the experiments were conducted only on species that are commonly used as food and intended for human consumption.
EK: Conceptualization, Data curation, Writing – original draft. S-MY: Investigation, Visualization, Writing – review & editing. J-EC: Writing – review & editing. D-HJ: Investigation, Methodology, Writing – original draft. H-YK: Conceptualization, Funding acquisition, Supervision, Writing – review & editing.
The author(s) declare that financial support was received for the research, authorship, and/or publication of this article. This research was supported by a grant (22193MFDS471) from ministry of food and drug safety in 2023.
The authors declare that the research was conducted in the absence of any commercial or financial relationships that could be construed as a potential conflict of interest.
The author(s) declared that they were an editorial board member of Frontiers, at the time of submission. This had no impact on the peer review process and the final decision.
All claims expressed in this article are solely those of the authors and do not necessarily represent those of their affiliated organizations, or those of the publisher, the editors and the reviewers. Any product that may be evaluated in this article, or claim that may be made by its manufacturer, is not guaranteed or endorsed by the publisher.
The Supplementary Material for this article can be found online at: https://www.frontiersin.org/articles/10.3389/fmars.2024.1356356/full#supplementary-material
Banan A., Nasiri A., Taheri-Garavand A. (2020). Deep learning-based appearance features extraction for automated carp species identification. Aquac. Eng. 89, 102053. doi: 10.1016/j.aquaeng.2020.102053
Benjakul S., Saetang J. (2022). Development of loop-mediated isothermal amplification (LAMP) assays for the rapid authentication of three swimming crab species. Foods 11, 2247. doi: 10.3390/foods11152247
Cui Y., Pan T., Chen S., Zou X. (2020). A gender classification method for Chinese mitten crab using deep convolutional neural network. Multimed. Tools Appl. 79, 7669–7684. doi: 10.1007/s11042-019-08355-w
Deep B. V., Dash R. (2019). “Underwater fish species recognition using deep learning techniques,” in 2019 6th International Conference on Signal Processing and Integrated Networks, SPIN 2019. 665–669 (Noida, India: IEEE). doi: 10.1109/SPIN.2019.8711657
Feng Y., Tao X., Lee E. J. (2021). Classification of shellfish recognition based on improved faster R-CNN framework of deep learning. Math. Probl. Eng. 2021, 1–10. doi: 10.1155/2021/1966848
Ge H., Dai Y., Zhu Z., Liu R. (2022). A deep learning model applied to optical image target detection and recognition for the identification of underwater biostructures. Machines 10, 809. doi: 10.3390/machines10090809
He K., Zhang X., Ren S., Sun J. (2016). “Deep residual learning for image recognition,” in Proc. IEEE Comput. Soc. Conf. Comput. Vis. Pattern Recognit, , 2016-Decem. 770–778. (Las Vegas, Nevada, USA). doi: 10.1109/CVPR.2016.90
Hu J., Zhou C., Zhao D., Zhang L., Yang G., Chen W. (2020). A rapid, low-cost deep learning system to classify squid species and evaluate freshness based on digital images. Fish. Res. 221, 105376. doi: 10.1016/j.fishres.2019.105376
Jalal A., Salman A., Mian A., Shortis M., Shafait F. (2020). Fish detection and species classification in underwater environments using deep learning with temporal information. Ecol. Inform. 57, 101088. doi: 10.1016/j.ecoinf.2020.101088
Jayasundara J. M. V. D. B., Ramanayake R. M. L. S., Senarath H. M. N. B., Herath H. M. S. L., Godaliyadda G. M. R. I., Ekanayake M. P. B., et al. (2023). Deep learning for automated fish grading. J. Agric. Food Res. 14, 100711. doi: 10.1016/j.jafr.2023.100711
Kim E., Yang S. M., Jung D. H., Kim H. Y. (2023). Differentiation between Weissella cibaria and Weissella confusa using machine-learning-combined MALDI-TOF MS. Int. J. Mol. Sci. 24, 11009. doi: 10.3390/ijms241311009
Knausgård K. M., Wiklund A., Sørdalen T. K., Halvorsen K. T., Kleiven A. R., Jiao L., et al. (2022). Temperate fish detection and classification: A deep learning based approach. Appl. Intell. 52, 6988–7001. doi: 10.1007/s10489-020-02154-9
Kong L., Li Y., Kocot K. M., Yang Y., Qi L., Li Q., et al. (2020). Mitogenomics reveals phylogenetic relationships of Arcoida (Mollusca, Bivalvia) and multiple independent expansions and contractions in mitochondrial genome size. Mol. Phylogenet. Evol. 150, 106857. doi: 10.1016/j.ympev.2020.106857
Koonce B. (2021). “SqueezeNet,” in Convolutional Neural Networks with Swift for Tensorflow (Apress, Berkeley, CA), 73–85. doi: 10.1007/978-1-4842-6168-2_7
Lee G. Y., Kim E., Yang S. M., Kim H. Y. (2022). Rapid on-site identification for three Arcidae species (Anadara kagoshimensis, Tegillarca granosa, and Anadara broughtonii) using ultrafast PCR combined with direct DNA extraction. Foods 11, 2449. doi: 10.3390/foods11162449
Li J., Xu W., Deng L., Xiao Y., Han Z., Zheng H. (2023). Deep learning for visual recognition and detection of aquatic animals: A review. Rev. Aquac. 15, 409–433. doi: 10.1111/raq.12726
Mukhiddinov M., Muminov A., Cho J. (2022). Improved classification approach for fruits and vegetables freshness based on deep learning. Sensors 22, 8192. doi: 10.3390/s22218192
Rasheed J. (2021). “A sustainable deep learning based computationally intelligent seafood monitoring system for fish species screening,” in Proceedings - International Conference on Artificial Intelligence of Things, ICAIoT 2021. 1–6 (Nicosia, Turkey: IEEE). doi: 10.1109/ICAIoT53762.2021.00008
Ren L., Tian Y., Yang X., Wang Q., Wang L., Geng X., et al. (2023). Rapid identification of fish species by laser-induced breakdown spectroscopy and Raman spectroscopy coupled with machine learning methods. Food Chem. 400, 134043. doi: 10.1016/j.foodchem.2022.134043
Saleh A., Sheaves M., Rahimi Azghadi M. (2022). Computer vision and deep learning for fish classification in underwater habitats: A survey. Fish Fish. 23, 977–999. doi: 10.1111/faf.12666
Sayed G. I., Soliman M. M., Hassanien A. E. (2021). A novel melanoma prediction model for imbalanced data using optimized SqueezeNet by bald eagle search optimization. Comput. Biol. Med. 136, 104712. doi: 10.1016/j.compbiomed.2021.104712
Simonyan K., Zisserman A. (2015). “Very deep convolutional networks for large-scale image recognition,” in 3rd Int. Conf. Learn. Represent. ICLR 2015 - Conf. Track Proc. 14. (San Diego, California, USA).
Singh D., Taspinar Y. S., Kursun R., Cinar I., Koklu M., Ozkan I. A., et al. (2022). Classification and analysis of pistachio species with pre-trained deep learning models. Electron 11, 981. doi: 10.3390/electronics11070981
Szegedy C., Ioffe S., Vanhoucke V., Alemi A. (2017). Inception-v4, Inception-ResNet and the impact of residual connections on learning. Proc. AAAI Conf. Artif. Intell. 31. doi: 10.1609/aaai.v31i1.11231
Villon S., Mouillot D., Chaumont M., Darling E. S., Subsol G., Claverie T., et al. (2018). A Deep learning method for accurate and fast identification of coral reef fishes in underwater images. Ecol. Inform. 48, 238–244. doi: 10.1016/j.ecoinf.2018.09.007
Vo S. A., Scanlan J., Turner P. (2020). An application of convolutional neural network to lobster grading in the southern rock lobster supply chain. Food Control 113, 107184. doi: 10.1016/j.foodcont.2020.107184
Yang X., Zhang S., Liu J., Gao Q., Dong S., Zhou C. (2021). Deep learning for smart fish farming: applications, opportunities and challenges. Rev. Aquac. 13, 66–90. doi: 10.1111/raq.12464
Zha S., Tang Y., Shi W., Liu H., Sun C., Bao Y., et al. (2022). Impacts of four commonly used nanoparticles on the metabolism of a marine bivalve species, Tegillarca granosa. Chemosphere 296, 134079. doi: 10.1016/j.chemosphere.2022.134079
Zhang Y., Yue J., Song A., Jia S., Li Z. (2023). A High-similarity shellfish recognition method based on convolutional neural network. Inf. Process. Agric. 10, 149–163. doi: 10.1016/j.inpa.2022.05.009
Keywords: Anadara kagoshimensis, Tegillarca granosa, Anadara broughtonii, convolutional neural networks, food fraud, image classification
Citation: Kim E, Yang S-M, Cha J-E, Jung D-H and Kim H-Y (2024) Deep learning-based phenotype classification of three ark shells: Anadara kagoshimensis, Tegillarca granosa, and Anadara broughtonii. Front. Mar. Sci. 11:1356356. doi: 10.3389/fmars.2024.1356356
Received: 15 December 2023; Accepted: 26 March 2024;
Published: 08 April 2024.
Edited by:
Haiyong Zheng, Ocean University of China, ChinaReviewed by:
Luigia Donnarumma, University of Naples Parthenope, ItalyCopyright © 2024 Kim, Yang, Cha, Jung and Kim. This is an open-access article distributed under the terms of the Creative Commons Attribution License (CC BY). The use, distribution or reproduction in other forums is permitted, provided the original author(s) and the copyright owner(s) are credited and that the original publication in this journal is cited, in accordance with accepted academic practice. No use, distribution or reproduction is permitted which does not comply with these terms.
*Correspondence: Dae-Hyun Jung, ZGFlaHl1bkBraHUuYWMua3I=; Hae-Yeong Kim, aHlraW1Aa2h1LmFjLmty
Disclaimer: All claims expressed in this article are solely those of the authors and do not necessarily represent those of their affiliated organizations, or those of the publisher, the editors and the reviewers. Any product that may be evaluated in this article or claim that may be made by its manufacturer is not guaranteed or endorsed by the publisher.
Research integrity at Frontiers
Learn more about the work of our research integrity team to safeguard the quality of each article we publish.