 Hongmao Zhang1
 Lei Xing
 Qingjie Zhou
 Kai Liu
- 1Key Laboratory of Submarine Geosciences and Prospecting Techniques, Ministry of Education, College of Marine Geosciences, Ocean University of China, Qingdao, China
- 2Evaluation and Detection Technology Laboratory of Marine Mineral Resources, Qingdao National Laboratory for Marine Science and Technology, Qingdao, China
- 3National Engineering Research Center of Offshore Oil and Gas Exploration, Beijing, China
- 4Key Laboratory of Marine Geophysical Prospecting Technology of Qingdao, Qingdao, China
- 5Key Laboratory of Marine Geology and Metallogeny, First Institute of Oceanography, Ministry of Natural Resources (MNR), Qingdao, China
As the interface between seawater and the seabed, superficial sediments on the seabed are an important part of the marine acoustic field environment and are indispensable for marine resource investigations. Studying sediments several meters to hundreds of meters below the seafloor is highly valuable and important. This study processes and analyses the water depth, topography and bottom data and obtains the shallow bottom profile and topographic map of the northern continental slope of the South China Sea (SCS). The study analyzes the influence of physical parameter (including density, porosity, and grain size) on the acoustic velocity in sediments. Single-parameter and dual-parameter models are established to further examine this influence. The results show that porosity and density have greater influences on the acoustic velocity of sediments than does grain size. Finally, the acoustic properties of several typical stations with water depths are tested to analyze the variations in the acoustic properties of the shallow sediments in the northern SCS. The results show that the influence of each parameter on the prediction of the acoustic velocity of the sediment is in the following order: porosity>density>grain size. This study analyses and reveals the reason why the seafloor sediments in the local area cause the acoustic properties to change greatly. It may be caused by changes in the sediment type, lithology along with the depth. And the other reason is the development of interlayer in the land slope of the northern SCS.
1 Introduction
The seafloor is an important boundary of the underwater acoustic field and is also an object of common concern for the disciplines of ocean acoustics, marine geology and marine geophysics (Jackson and Richardson, 2007). The acoustic properties of seafloor sediments are important factors affecting the propagation of acoustic waves in the ocean, and related research has important application value in the fields of military marine environment safeguarding, seafloor target detection, and seafloor resource exploration (Liu et al., 2019; Zhao et al., 2023). Research on acoustic properties based on sediments in different sea areas has involved the following steps: research on acoustic property testing methods (Wang et al., 2018; Xing et al., 2022a); research on acoustic propagation theory (Gassmann, 1951; Wood, 1964; Stoll, 1977); and research on the correlation between acoustic properties and physical parameters (Endler et al., 2016). Additionally, the acoustic properties of different sea areas (Xing et al., 2022b) and their empirical prediction equations for acoustic velocity have contributed to the progress of sedimentary acoustics.
Since seafloor sediments combine the acoustic properties of both the granular skeleton and pore fluid, their acoustic properties are more complex than those of media, such as seawater and rocks (Wood, 1941; Wang et al., 2018). Biot has created Biot's theory, which can be applied to porous elastic media, and can be used to study the transmission properties of acoustic waves in surface sediments on the seafloor (Biot, 1956a; Biot, 1956b). The Biot–Stoll model was established by Stoll based on the porous elasticity theory (Stoll, 1977); the elasticity theory based on Buckingham’s Viscous Grain Shearing (VGS) model was established by Stoll based on the porous elasticity theory (Stoll, 1977); and the VGS model was established by Buckingham based on the elasticity theory (Buckingham and Richardson, 2002; Buckingham, 2005). These authors also attempted to model the acoustic properties of sediments from different perspectives.
The empirical equations for seafloor sediment acoustics are based on carrying out many actual measurements of the acoustic and physical properties of sediments. And equation determine the interrelationships between the sediments and the relevant parameters, such as physical properties. These relationships are among the main elements of current sediment acoustics research (Lu et al., 2010; Bae et al., 2014). Compared to acoustic propagation theories with many constraints, empirical equations for sediment acoustics have more obvious and outstanding advantages. And empirical equations have the advantages of being more convenient and less expensive to use. Moreover, this approach can be used to invert the values of certain sediment physical property parameters under certain difficult-to-measure conditions or under no conditions to measure sea conditions, which can provide an important basis for marine development and exploration, and national defense science and technology engineering construction. Orsi and Dunn (Orsi and Dunn, 1990, Orsi and Dunn, 1991) also used statistical methods to fit measured values and constructed equations for the prediction of ocean acoustic velocity with respect to porosity. Richardson (Richardson and Briggs, 1996), Fu (Fu et al., 2004) and others have investigated in situ measurement techniques to carry out observational experiments in many foreign waters in the United States and to study the relationship between the acoustic velocity and the physical properties of the seafloor sediments (Richardson et al., 2002; Richardson and Briggs, 2004).
Research and analyses of the relevant elements of China’s coastal waters and many results from empirical equations for acoustics are available (Xing et al., 2021). Lu et al. (Lu and Liang, 1993) applied the Hamilton model (Hamilton, 1985) to study the coastal region of southeastern China and derived an acoustic velocity model for marine sediments on the shallow continental shelf off the coast of southeastern China. It can provide a better understanding of the acoustic properties of seafloor sediments in this region (Liu et al., 2013).
In this study, a combination of measured data and theoretical modeling is used to investigate the acoustic properties of sea floor sediments on the land slope of the northern SCS and the mechanisms influencing the acoustic velocity of the sediments. The acoustic and physical parameters of the samples retrieved from the sampling laboratory from the sea floor sediments are measured, and one-parameter and two-parameter equations applicable to the acoustic velocity-physical parameters are established based on the measured data. The study area is also divided into upper, middle and lower land slopes to fit equations suitable for different regions. Then this study analyzes the characteristics of the lateral distribution of sediment acoustic velocity. Finally, the discussion of the influence mechanism of sediment acoustic properties is carried out by integrating physical parameters and shallow bottom profile.
2 Regional overview and data analysis
2.1 Regional overview
The study area is in the northern part of the SCS within the range of 115°E~115.5°E, 19.2°N~20.1°N (as shown in Figure 1). The shelf of the northern SCS is basically a continuation of the shelf, and the topographic line is approximately parallel to the coastline, roughly spreading in the NNE–WNW direction. There is a gentle inclination from the shore to the sea, with a total area of approximately 2.13×10⁵ km2. Additionally, the total land slope is approximately 1,300 km in length, with widths varying within 126~265 km. Generally, the land slope is in the form of a striped area, which is a shape that is wider in the east than in the west and spreads in the NE direction. It is with a length of 900 km and a width of approximately 143~342 km. In addition, the average slopes are approximately 1.3°~ 2.3°, which are more than ten to dozens of times larger than the slopes of the continental shelf.
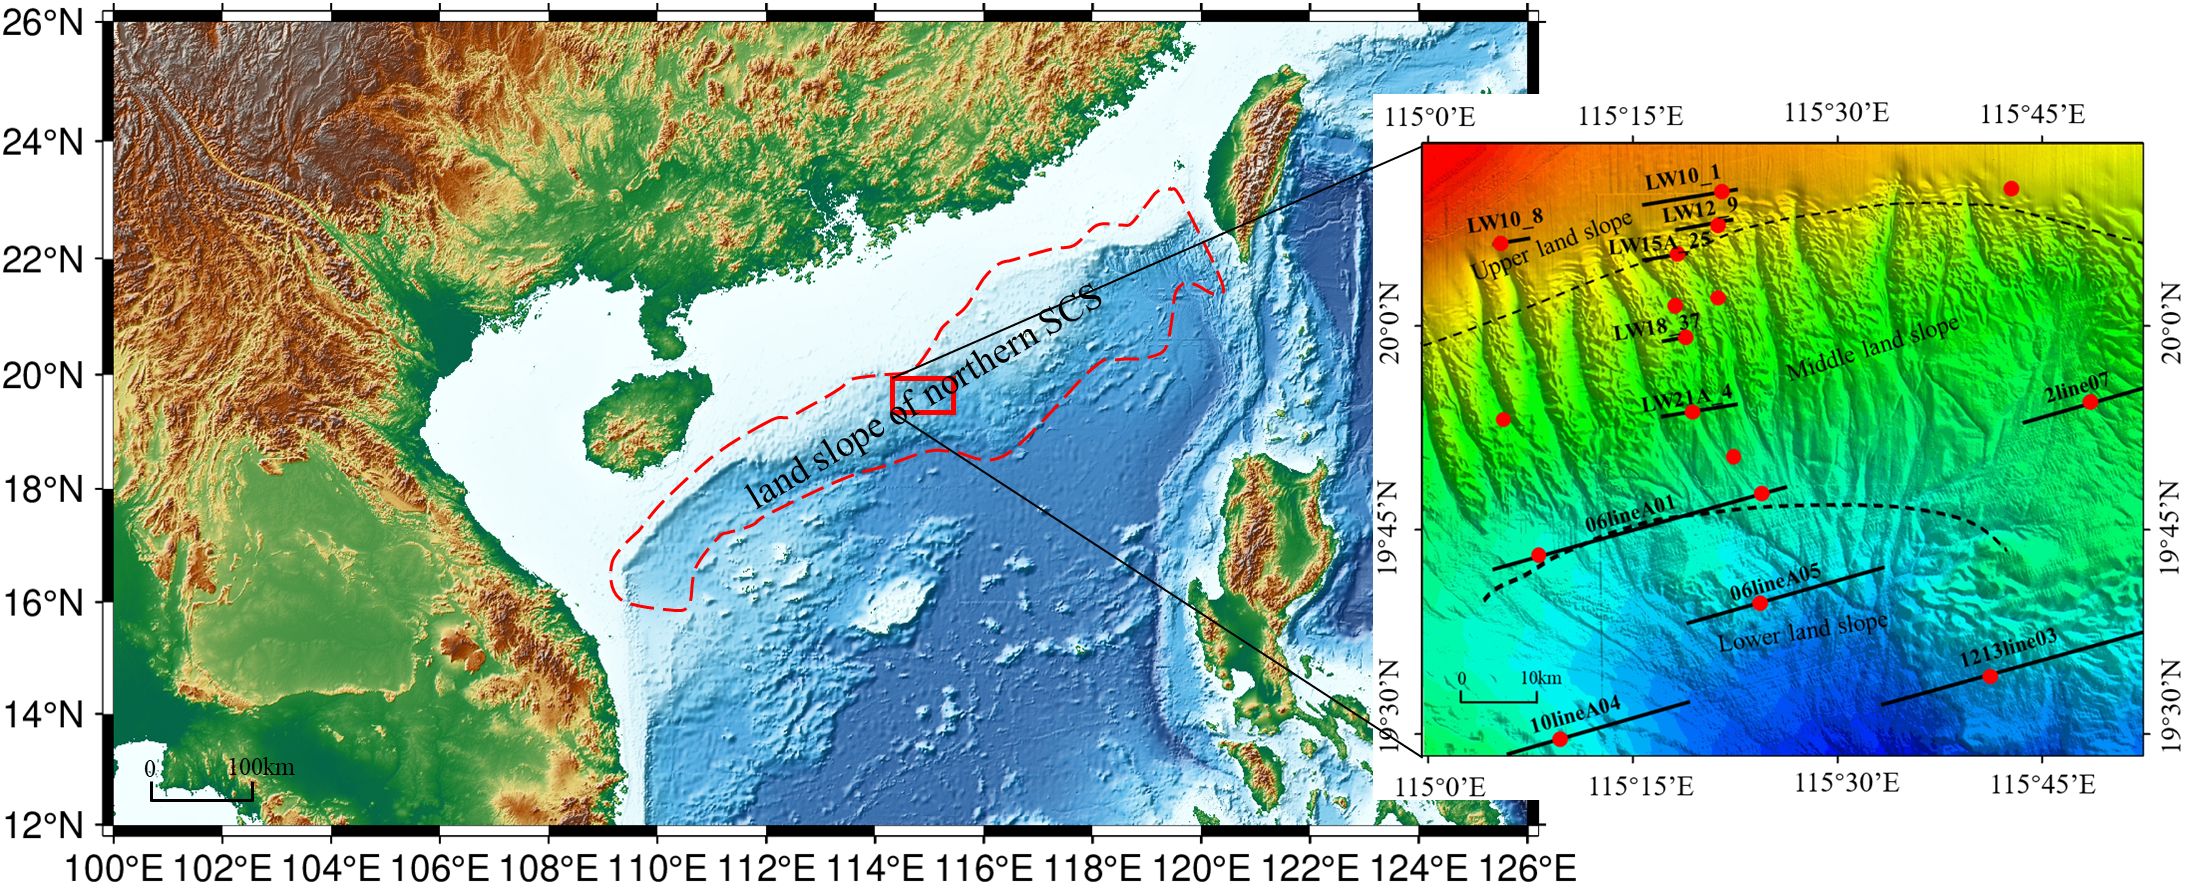
Figure 1 Location of the study area. The red box shows the study area, and the red dashed line is the range of the land slope of the northern SCS. The red dots are the sampling location. The black solid lines are the survey lines of shallow stratigraphic profile. The black dashed lines are the boundary of upper, middle, and lower land slope.
Sediment samples for this study were taken from the land slope of the northern SCS, and a gravity column sampler was used to obtain sediment samples from a total of 17 stations with water depths ranging from 400 to 2500 m. The samples contain two 100 m drill holes, five 40 m drill cores, and 10 gravity column samples. The locations of the sampling sites are shown in Figure 1. The stations are widely distributed in various areas of the land slope.
Based on the slope and typical topographic features of the land slopes of the northern SCS, we can categorize the land slope into three zones: the upper land slope, the middle land slope, and the lower land slope (as shown in Figure 1). The slopes of the upper and middle land slopes range from 1° to 3°, while the lower land slope is in the range of 2° to 4°. Eleven typical shallow stratigraphic profiles are also selected. Specifically, LW10_1, LW10_8, LW12_9, and LW15A_25 are on the upper land slope of the study area. Changes in the topographic relief can be roughly observed in the profiles. The topographic changes in the upper land slope are gradual due to the proximity to the shelf. LW18_37, LW21A_4, 2line_07, and 06lineA01 are on the middle slope of the study area. Similarly, 06lineA05, 10lineA04 and 1213line03 are on the lower slope of the study area, and the middle and lower slope are close to the sea basin. Additionally, the various effects occurring in the area have made the topography of the area more undulating, and the topography and geomorphology are complicated.
2.2 Acoustic velocity measurements
For the indoor acoustic characterization of the sediment samples taken to the laboratory, the WSD-3 digital sonic instrument was used for the acoustic velocity measurements. During the measurement, the axial transmittance method is used. The acoustic waves are propagated through the transmitting and receiving transducers at the two ends of the sediment, and the propagation medium is the sediment between the transducers. The method uses a set of axial measurement devices, including a signal generator, a digital acoustic wave monitor, a test platform, and a transducer. Longitudinal transducers used to excite a single-frequency 3-5 period sinusoidal signal with a sampling rate of 5 MHz or 10 MHz. The acquired acoustic velocity is the average value of the sample in the length direction, and the accuracy of the measurement is ±5 m/s. The platform is measured accurately to 0.1 mm with calipers.
The acoustic velocity V and the acoustic attenuation coefficient α are calculated as Equation (1) and Equation (2):
where is the length of the column sample from the land slope of the northern SCS, in mm. is the travel time of the acoustic signal through the sea floor sediment, in μs. is the transducer zero-time correction, in μs. and are the lengths of the two sediment sections, respectively, in mm. , , and are the amplitudes of the acoustic signals that pass through shallow sediments and water of different lengths. The travel time of the acoustic signal in the sediment is read by the zero-crossing method, and the difference between the travel times of the signals in the two sections of sediment is calculated by the signal correlation method.
3 Data analysis and results for predicting the acoustic velocity sea floor sediments
3.1 Experimental data analysis
After the acoustic velocity of the sediment samples was measured and the sediment column sample was collected, the obtained experimental data were analyzed. A total of 80 sets of data were analyzed from 17 stations located in the study area: DZ01~DZ17. In the experimental process, in addition to unavoidable errors, there may also be manual errors. Some obvious measurement errors in the data are deleted and sorted and the study area is divided again. The following parameters can be obtained in the research area: the physical mechanics of the sediment samples and acoustic parameters. Table 1 shows that the sediment acoustic velocity measured at 100 kHz in the land slope of the northern SCS ranges from 1387 m/s to 1622 m/s. Lu et al (2006) measured the sediment acoustic velocity in the northern SCS to be 1420 m/s to 1880 m/s in 2006. Cheng et al (2011) measured the sediment acoustic velocity in the central part of the South Yellow Sea (SYS) to be 1427.7 m/s to 1594.8 m/s. Kan et al (2020) measured and analysed the sediment acoustic velocity in the sediment area of the middle SYS using an in-situ testing method (Kan et al., 2018) to be approximately 1433.7 m/s ~ 1607.6 m/s. The results of the acoustic velocity measurements in this paper are relatively accurate and reliable. The sediment acoustic impedance is an important parameter for determining the reflection from the seabed and is equal to the value of the acoustic velocity of the sediment multiplied by the sediment density. The values of the sediment acoustic impedance in the study area of this paper range from 1.906×10⁵ g•cm-2•s-1 ~ 3.099×10⁵ g•cm-2•s-1.
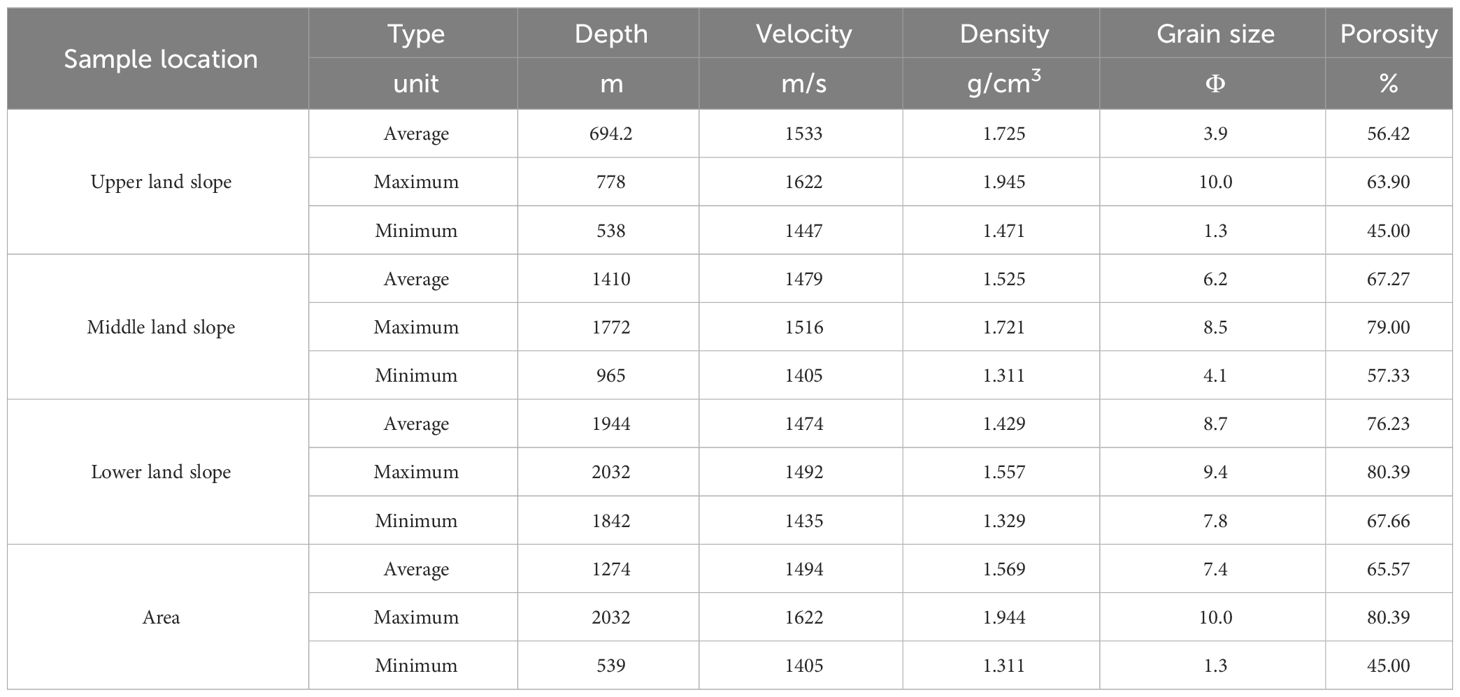
Table 1 Statistical table of the acoustic velocity and physical parameters.
3.2 Correlation between the acoustic velocity and physical parameters
The parameter equations are designed to describe the correlation between the acoustic velocity and a single physical parameter of the sea floor sediments. They can reflect the effect of the physical parameter on the acoustic velocity. Although the different physical parameters of sedimentation can be converted using the corresponding methods, seafloor sediment is a complex mixture. There is no way to accurately describe complex sediment with any one of these parameters. The single-parameter equations have limitations. In addition, there is no single correlation between the physical-mechanical properties of sediments and the longitudinal wave velocity. Therefore, it is necessary to analyze the multiparameter correlation of the sea floor sediments on the land slope of the northern SCS.
3.2.1 Porosity, density and acoustic velocity
The porosity, density, and acoustic velocity measured by sediment samples from 17 stations are used to establish a two-parameter model for the land slope with the porosity and density of the sediment as the independent variables and the acoustic velocity as the dependent variable, as shown in Figure 2. Figure 2 shows that the acoustic velocity of the sediment reaches a larger value when the porosity is lower and the density is greater, and the two-parameter equations are constructed according to the model in Figure 2 with the Equation (3):
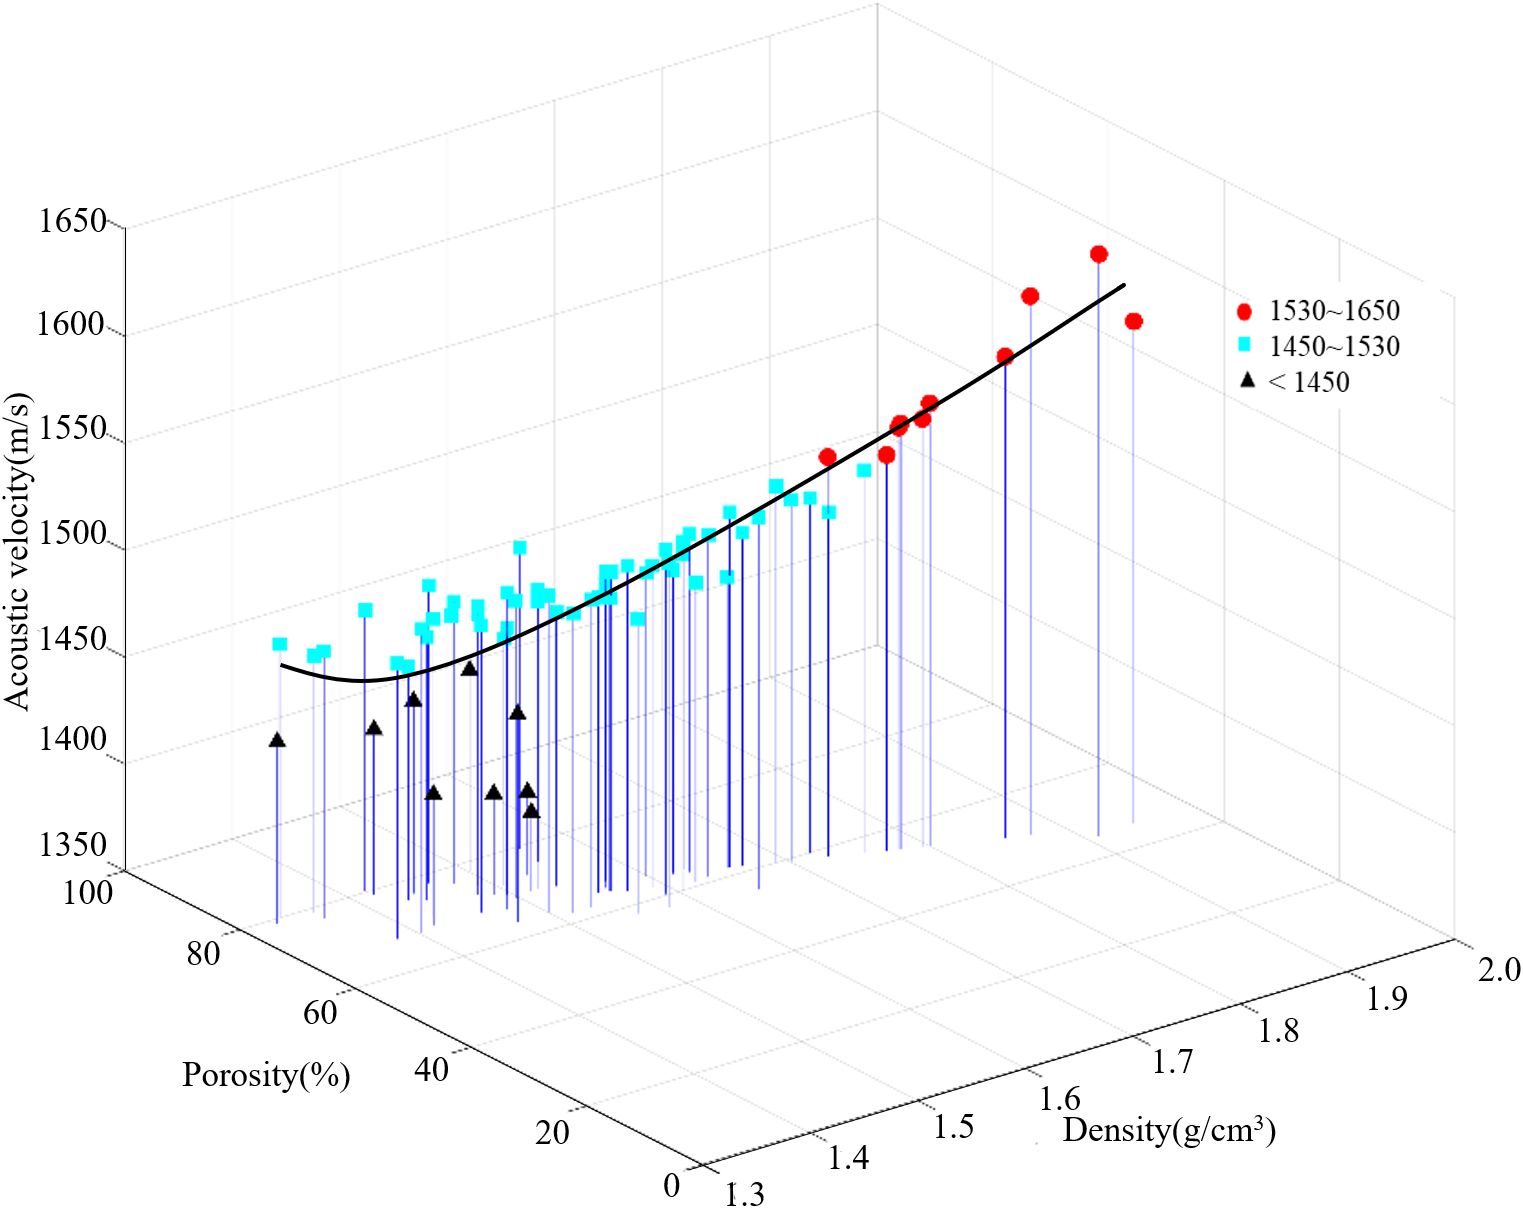
Figure 2 Porosity–density two-parameter acoustic velocity model. The solid line is the result of the two-parameter equation.
where Vp is the acoustic velocity, ρ is the density, and n is the porosity. The correlation coefficient equation is used to calculate the effect of fitting the variables of the prediction equation by using Equation (4):
where X is the predicted data of the fitting equation, Y is the actual data, represents the covariance of X and Y, and σ is the variance. The larger the correlation coefficient is, the smaller the gap between the predicted results and the actual data. The correlation coefficient of this two-parameter equation is 0.9042, and the correlation coefficient is very high. In Figure 2, the black line shows the results of the two-parameter equations of the porosity and density.
3.2.2 Porosity, grain size and acoustic velocity
Using the measured porosity, grain size and acoustic velocity of the samples taken from the sea floor sediments, a two-parameter model is established. It is with the porosity and grain size of the sediments as the independent variables and the acoustic velocity as the dependent variable. The model is shown in Figure 3, and the model shows that when the measured porosity and grain size of the study area are lower, the sediment acoustic velocity reaches larger values. When the sediment acoustic velocity reaches a larger value, the two-parameter equation is constructed according to the model in Figure 3, and its relation is as Equation (5):
Figure 3 Porosity–grain size two-parameter acoustic velocity model. The solid line is the result of the two-parameter equation.
where Mz is the grain size. The correlation coefficient of this two-parameter equation is 0.9102. In Figure 3, the black line shows the results of the two-parameter equations of the porosity and grain size.
3.2.3 Density, grain size and acoustic velocity
Similarly, a two-parameter model of sediments in this study area is established, with density and grain size as the independent variables and acoustic velocity as the dependent variable. The model diagram is shown in Figure 4. The sediment acoustic velocity increases with decreasing porosity and grain size. The two-parameter equations are constructed according to the model in Figure 4, and its relation is as Equation (6):
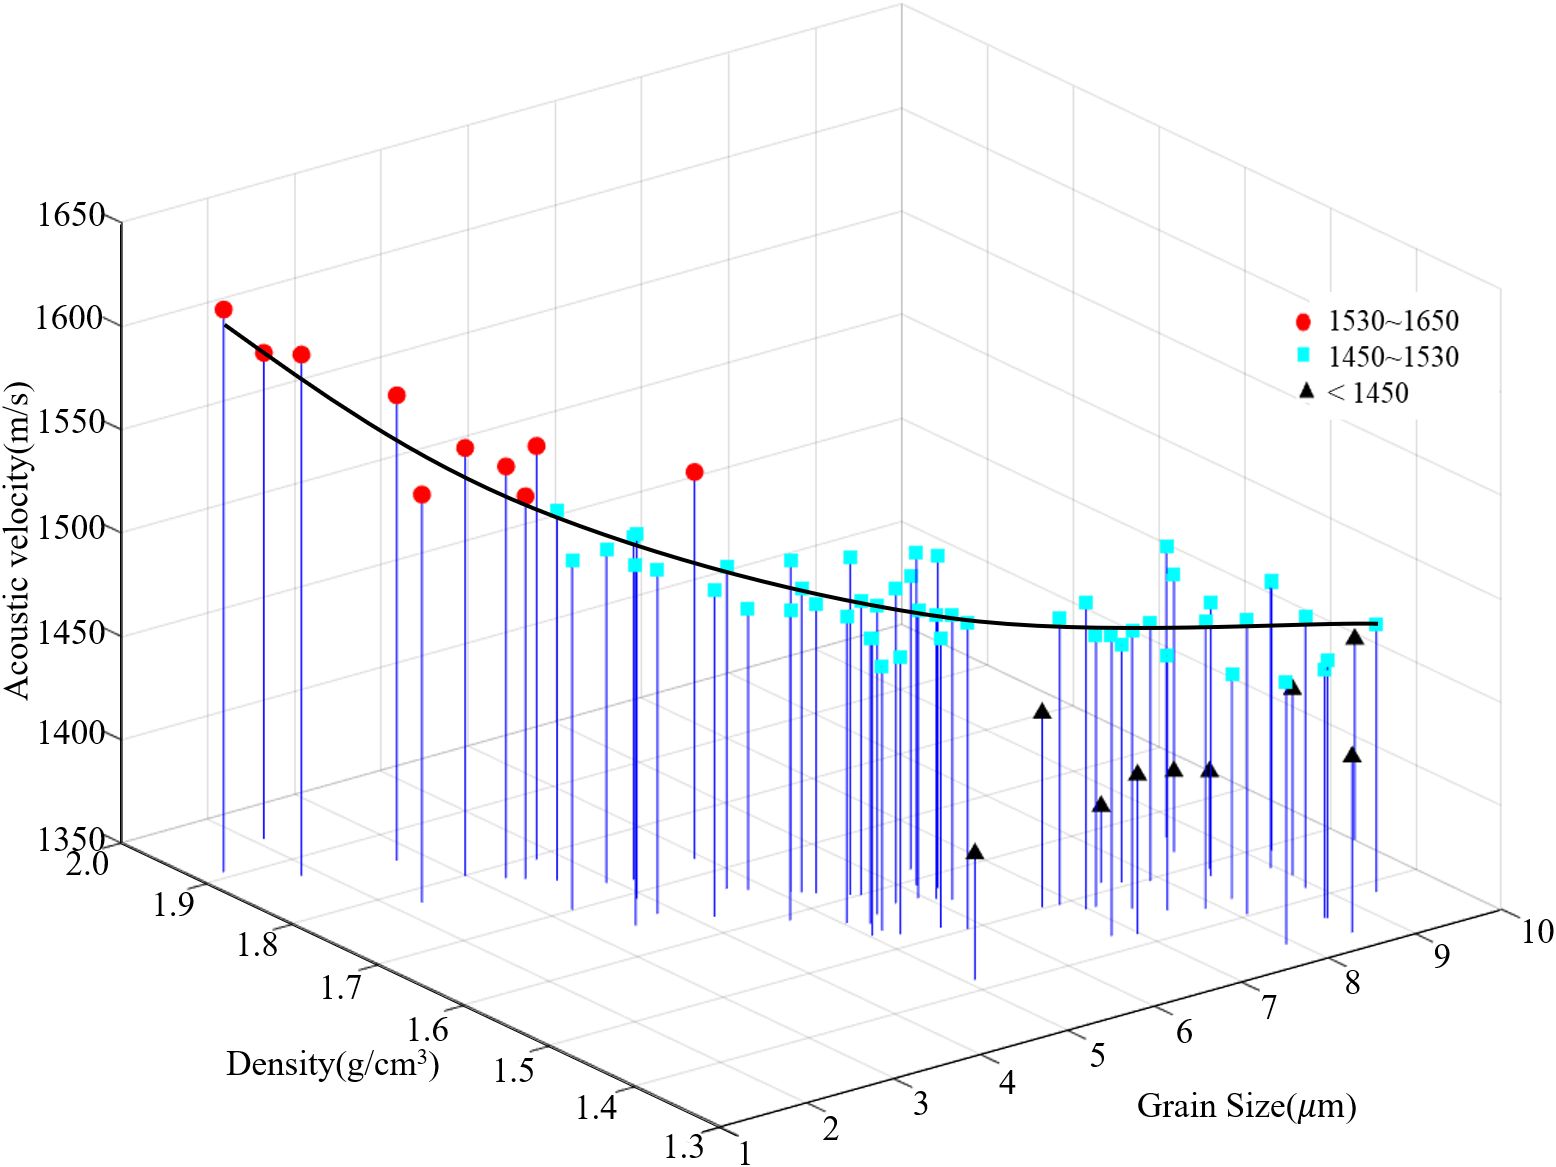
Figure 4 Density–grain-size two-parameter acoustic velocity model. The solid line is the result of the two-parameter equation.
The correlation coefficient of this two-parameter equation is 0.9046, and the correlation coefficient is very high. In Figure 4, the black line shows the results of the two-parameter equations of the density and grain size.
3.3 Prediction equation of the acoustic velocity
Due to the complex topographic conditions on the slope of the northern SCS, this area experiences the greatest changes in water depth, topography, sediment type, and so on. It leads to large differences in the acoustic properties of the sediments in the upper and lower land slopes. The analysis of the study clarifies that the region shows a pattern of changes in the acoustic velocity according to the topography of the landscape. In the area of the upper slope where the water depth is less than 1000 m, the sediments in this area are influenced by the type of sediments on the continental shelf because of their proximity to the shelf, and the type of sediments is similar to that on the shelf. The sediments within the upper land slope are mainly silt and sand, gravels are even present in the sediments in individual areas, and shell fragments and coral fragments may also be present. Sediments on the upper land slope have higher density and acoustic velocity, but there are some areas on the upper land slope that have sediments with low density and velocity.
The middle and lower land slopes with water depths greater than 1000 m are closer to the sea basin and are influenced by the sea basin. Thus, the types and properties of the sediments are similar to those in the sea basin area. The sediment types are mainly clayey silt, and the sediments in the middle and lower land slopes have higher water content, greater porosity, and lower density and acoustic velocity. Within the middle and lower land slopes, the topographic relief is highly variable, and most of the sediment transport occurs mainly in this region. Therefore, there are variations in the acoustic properties of the sediments within this wide area.
To analyze the regional distributions of the acoustic velocity, grain size, density, and water content of sea floor sediments based on the acoustic parameters measured from laboratory sediments and the grain size, porosity, density, and water content of the sediment samples measured by geotechnical tests (as shown in Figure 5). There is a certain pattern of change in the variation in the acoustic velocity and each physical parameter in the whole study area from the northern continental shelf to the southern sea. From north to south, the acoustic velocity varies from 1447~1622 m/s in the upper land slope to 1387~1516 m/s in the middle land slope and then to 1435~1492 m/s in the lower land slope. The variation is caused by the different types of sediment at different water depths. The sediments on the upper land slope in shallow water are generally coarser, less porous, and denser and possess higher acoustic velocities. The sediments on the middle and lower land slopes in deeper water are the opposite of those on the upper land slope. Thus, there is an overall trend toward gradual decreases. The average acoustic velocity on the upper land slope is generally greater than 1447 m/s, which is the high-velocity area in the region. The average acoustic velocities on the lower and middle land slopes are lower than 1447 m/s, and they are the lowest in the whole region. Sediment is composed of solid particles and porous seawater, and acoustic waves propagate between them. In addition, the bulk modulus and shear resistance of solid particles are generally greater than those of porous seawater, so the factor that has a stronger impact on the acoustic velocity is the grain size. It is generally believed that the larger the grain size is, the larger the solid particles in the skeleton of the sediment are and the greater the proportion of the sediment is. Thus, the porous seawater content of the sediments is lower, and the acoustic velocity is higher.
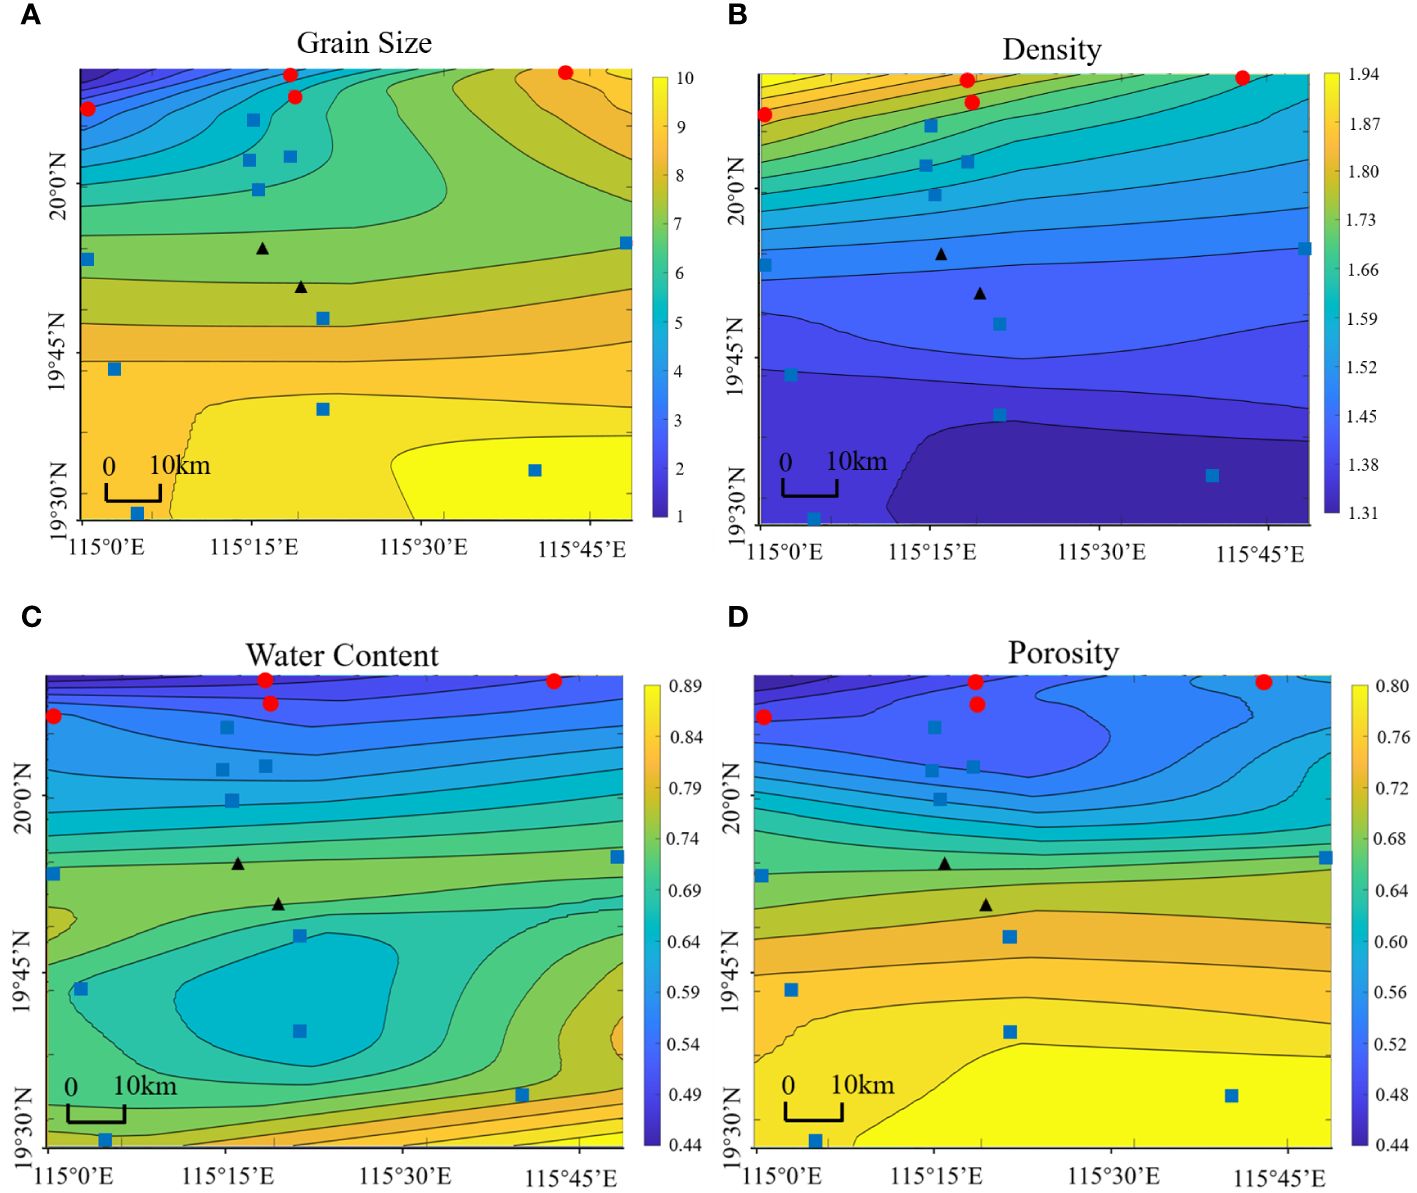
Figure 5 Distribution of parameters of sea floor sediments. (A) grain size, (B) density, (C) water content, and (D) porosity. The red dots are the samples where velocity is more than 1530 m/s. The blue boxes are the samples where velocity is between 1450 m/s and 1530 m/s. The black triangles are the samples where velocity is below 1450 m/s.
There are some differences in the topography and sedimentary layers between divided land slopes. To study the differences in the sediment acoustic velocity in different regions, prediction equations for the sediment acoustic velocity in different regions are constructed. Prediction equations of the acoustic velocity for the land slope of the northern SCS in the study area are established. Similarly, different regional acoustic velocity prediction models for the upper, middle and lower land slopes are established to study the regional acoustic properties of the sediments. In establishing the subregional prediction equations for the sediment acoustic velocity, one-parameter and two-parameter equations are established for the upper, middle and lower land slopes, and the equations and models are as follows.
3.3.1 Upper land slope
The sediments on the upper land slope are generally coarse, less porous, denser and possess higher acoustic velocities. Additionally, the acoustic velocity Vp of the sediments on the upper land slope has the following fitting relationships with porosity n, grain size Mz, and density ρ:
The correlation coefficients of the above single-parameter equations established for each subregion of the land slope are greater than those established for the whole region, which means that the fitting effect is better. Therefore, the subregional single-parameter equations can better reflect the relationship between the acoustic velocity of the sediment in the upper land slope and the physical parameters.
The two physical parameter acoustic velocity equations for the sediments in the upper land slope are established as follows:
Therefore, the two-parameter model of the sediment acoustic velocity established in different zones also has high correlation coefficients and can be more accurately used to forecast the acoustic velocity of seafloor sediments, and the two-parameter equations fitted to different zones are more accurate than the two-parameter equations established for the whole area for practical applications.
3.3.2 Middle land slope
The sediments on the middle land slope are generally finer, more porous, less dense and possess lower acoustic velocities than the sediments on the upper land slope, and the following fitting relationship exists between the acoustic velocity Vp and physical parameters for the sediments on the middle land slope:
The correlation coefficients of the fitted single-parameter prediction equations for the sediment acoustic velocity in the middle land slope are small and may be attributed to the large differences in the samples from the sampling sites on the middle land slope within the study area. Additionally, there are large differences in the porosity, grain size and density of the sediment. Additionally, slightly larger differences in the measurements of the sediment parameters from the same station on the middle land slope are found during the fitting process, which may be caused by measurement errors. The study area has a wide range of middle land slope, so it is possible that these differences are caused by the samples.
A two-parameter equation for the acoustic velocity and physics of the middle land slope sediments is constructed, and each expression is given below:
The correlation coefficients of the two-parameter model of the sediment acoustic velocity in the land slope divided into different areas are greatly improved compared with those of the single-parameter equations. Thus, the two-parameter model can be more accurately used for the prediction of the acoustic velocity of seafloor sediment.
3.3.3 Lower land slope
The sediments on the lower land slope are generally fine, porous, or less dense and possess a lower acoustic velocity than those on the upper land slope. Since there are fewer sampling points on the lower land slope, only DZ12, and DZ15 are considered, and since the sample data are limited, the establishment of single-parameter equations has little reference significance. The two-parameter equations of acoustic velocity Vp and physical parameters of the lower land slope sediment are established for the land slope of the northern SCS, and the expressions of these equations are as follows:
The correlation coefficient of the two-parameter model of the sediment acoustic velocity established for the lower land slope is small and has little reference value for accurately predicting the sediment acoustic velocity. Therefore, importantly, enough sampling points are necessary for comprehensive coverage when establishing equations for predicting the acoustic velocity.
4 Discussion
The sediments on the land slope of the northern SCS become consolidated and compacted as the depth of the sediments increases in the longitudinal direction due to geological movements and a series of changes. Therefore, sediments are characterized by changes in porosity and water content, with a tendency to increase in density, acoustic velocity, and acoustic impedance. However, for actual complex seabed sediments on the land slope, due to the changes in the burial depth, there are large differences in lithology. Thus, the acoustic velocities of the sea floor sediments on the land slope also change, and the distributions of the acoustic velocities in some places greatly differ from the overall distribution. This study examines and analyses the acoustic properties of the shallow sediments in the northern SCS. There are the differences that exist between the geological units of the different sediments through the acoustic properties by analyzing the acoustic properties of a few representative stations and bathymetric data.
4.1 Upper land slope
The upper land slope, where water depths are less than 778 m, is in the upper part of the study area and the land slope, closer to the shelf. The types of seafloor sediments are mainly silt and clayey silt. The seafloor sediments are generally characterized as follows: physical parameters, such as acoustic velocity and density, have a clear tendency caused by water depth, and there is also a clear change in acoustic properties in the vertical direction.
DZ03 is a station on the LW12_9 survey line and on the upper land slope. The seafloor sediments near the station are dominated by silty and clayey silt. As shown in the plot of the variation in each parameter with depth at station DZ03 in Figure 6, the seafloor sediments generally have a high acoustic velocity, a clear trend in density caused by water depth, and a clear change in acoustic properties in the vertical direction. The apparent variation reflects the complex sedimentary changes in the region and the development of coral reefs and coarse-grained detritus on the upper land slope. The presence of it also influences the gradients of the acoustic velocity and other parameters. It is not difficult to determine that the trend in acoustic impedance is similar to that in density from the graph of the trend in each parameter with water depth, and the trend in wave impedance can reflect reflective properties. Therefore, density has a greater influence on the sediment deposit layer in the upper land slope, which is reflected in the graph in which they have similar trends.
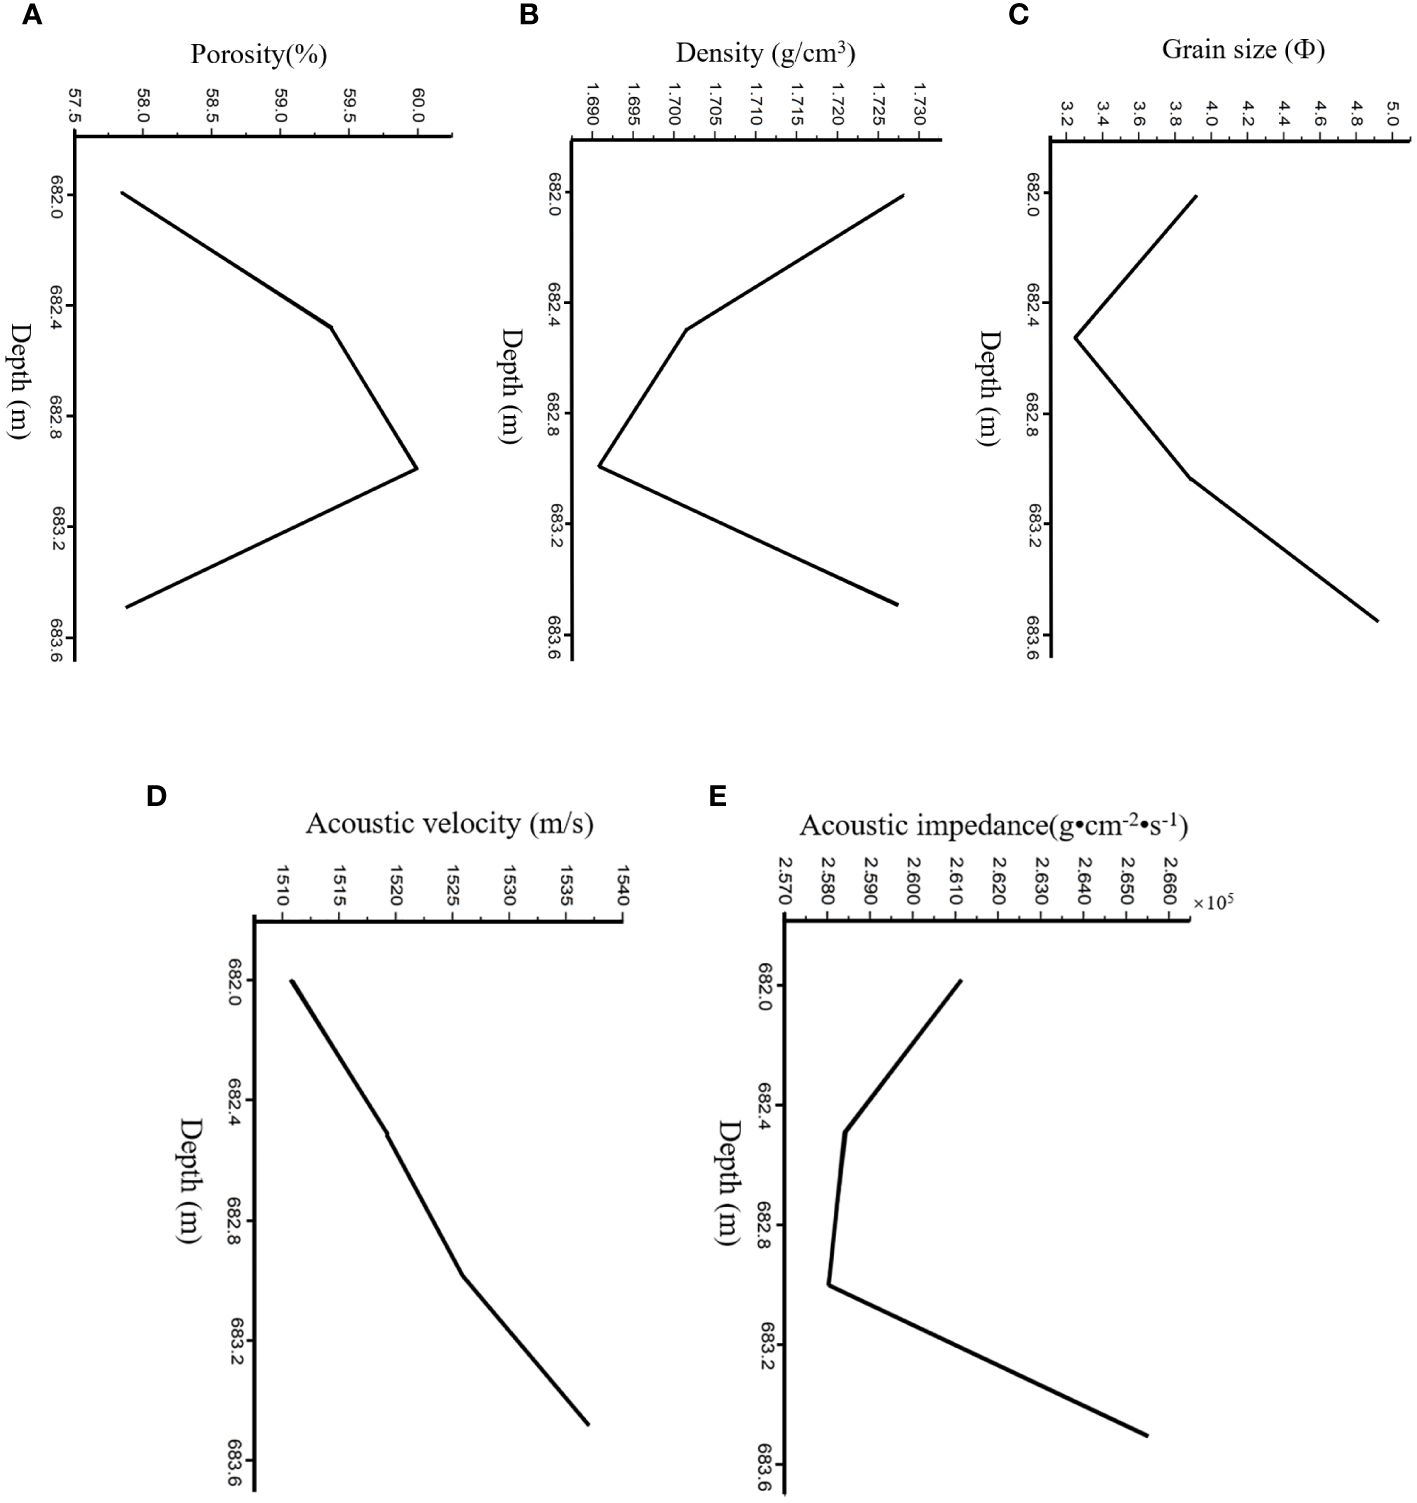
Figure 6 Variation in each parameter with depth at station DZ08. (A) porosity, (B) density, (C) grain size, (D) acoustic velocity, and (E) acoustic impendence.
4.2 Middle land slope
The middle land slope, with water depths less than 1772 m, is in the middle of the study area and is in an intermediate region between the shelf and the basin. The area is more variable and more affected. The type of seafloor sediments in the middle land slope of the northern SCS is mainly silty clay, and the seafloor sediments are generally characterized as follows: parameters such as acoustic velocity and density exhibit small changes caused by water depth. There is a small change in the acoustic properties evident in the vertical direction, and the differences in the acoustic properties of the sediments between the stations are also relatively small.
DZ05 is a station on the LW10_8 survey line and is on the middle land slope. Figure 7 shows the variation in each parameter with depth at station DZ05. The seafloor sediments near this station are predominantly clayey silt. At the inflection point where the trend in the acoustic velocity changes significantly, the corresponding shallow stratigraphic profile is analyzed. Possibly, because of the variation in sediment type and lithology with burial depth, sea floor sediments cause the acoustic properties of the middle land slope to vary clearly with depth, where strata develop.
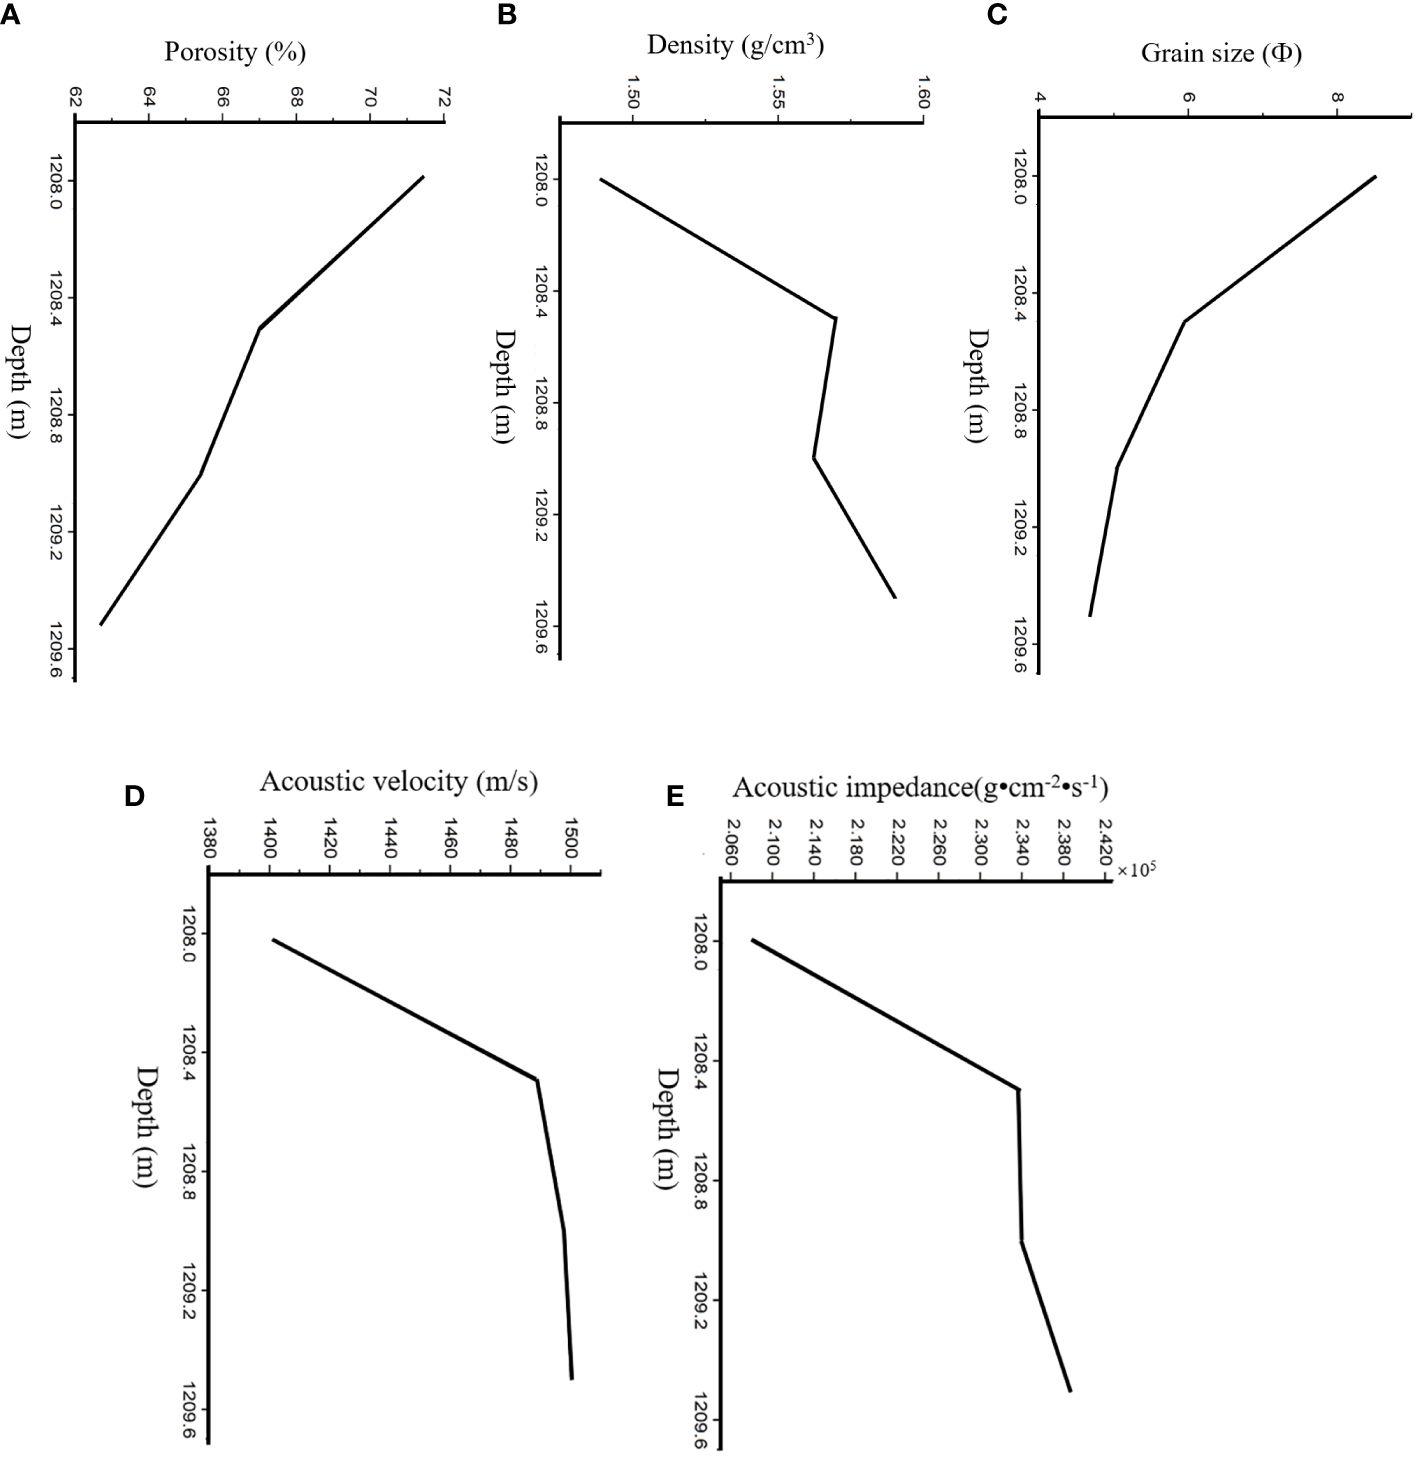
Figure 7 Variation in each parameter with depth at station DZ05. (A) porosity, (B) density, (C) grain size, (D) acoustic velocity, and (E) acoustic impendence.
The trend in acoustic impedance is similar to that in density from the graph of the trend in each parameter with water depth, and the trend in wave impedance can reflect reflective properties. Therefore, density has a greater influence on the sediment deposit layer in the middle land slope, which is reflected in the graph in which they have similar trends.
4.3 Lower land slope
The lower land slope with water depths greater than 1842 m is in the lower part of the study area, closer to the sea basin, and is connected to the upper and middle land slopes. Thus, the variation in each parameter in this area is also more affected. The type of seafloor sediment in the lower land slope of the northern SCS is mainly silty clay, and the seafloor sediments generally have the following characteristics. Parameters such as acoustic velocity and density do not show significant trends caused by water depth. Moreover, there are small variations in the acoustic properties in the vertical direction, and the differences in the acoustic properties of the sediments between stations are also relatively small.
DZ12 is a station on the 06lineA05 survey line and is on the lower land slope. The complex sediment changes in the area are shown in the plot of each parameter with depth at station DZ12 in Figure 8.
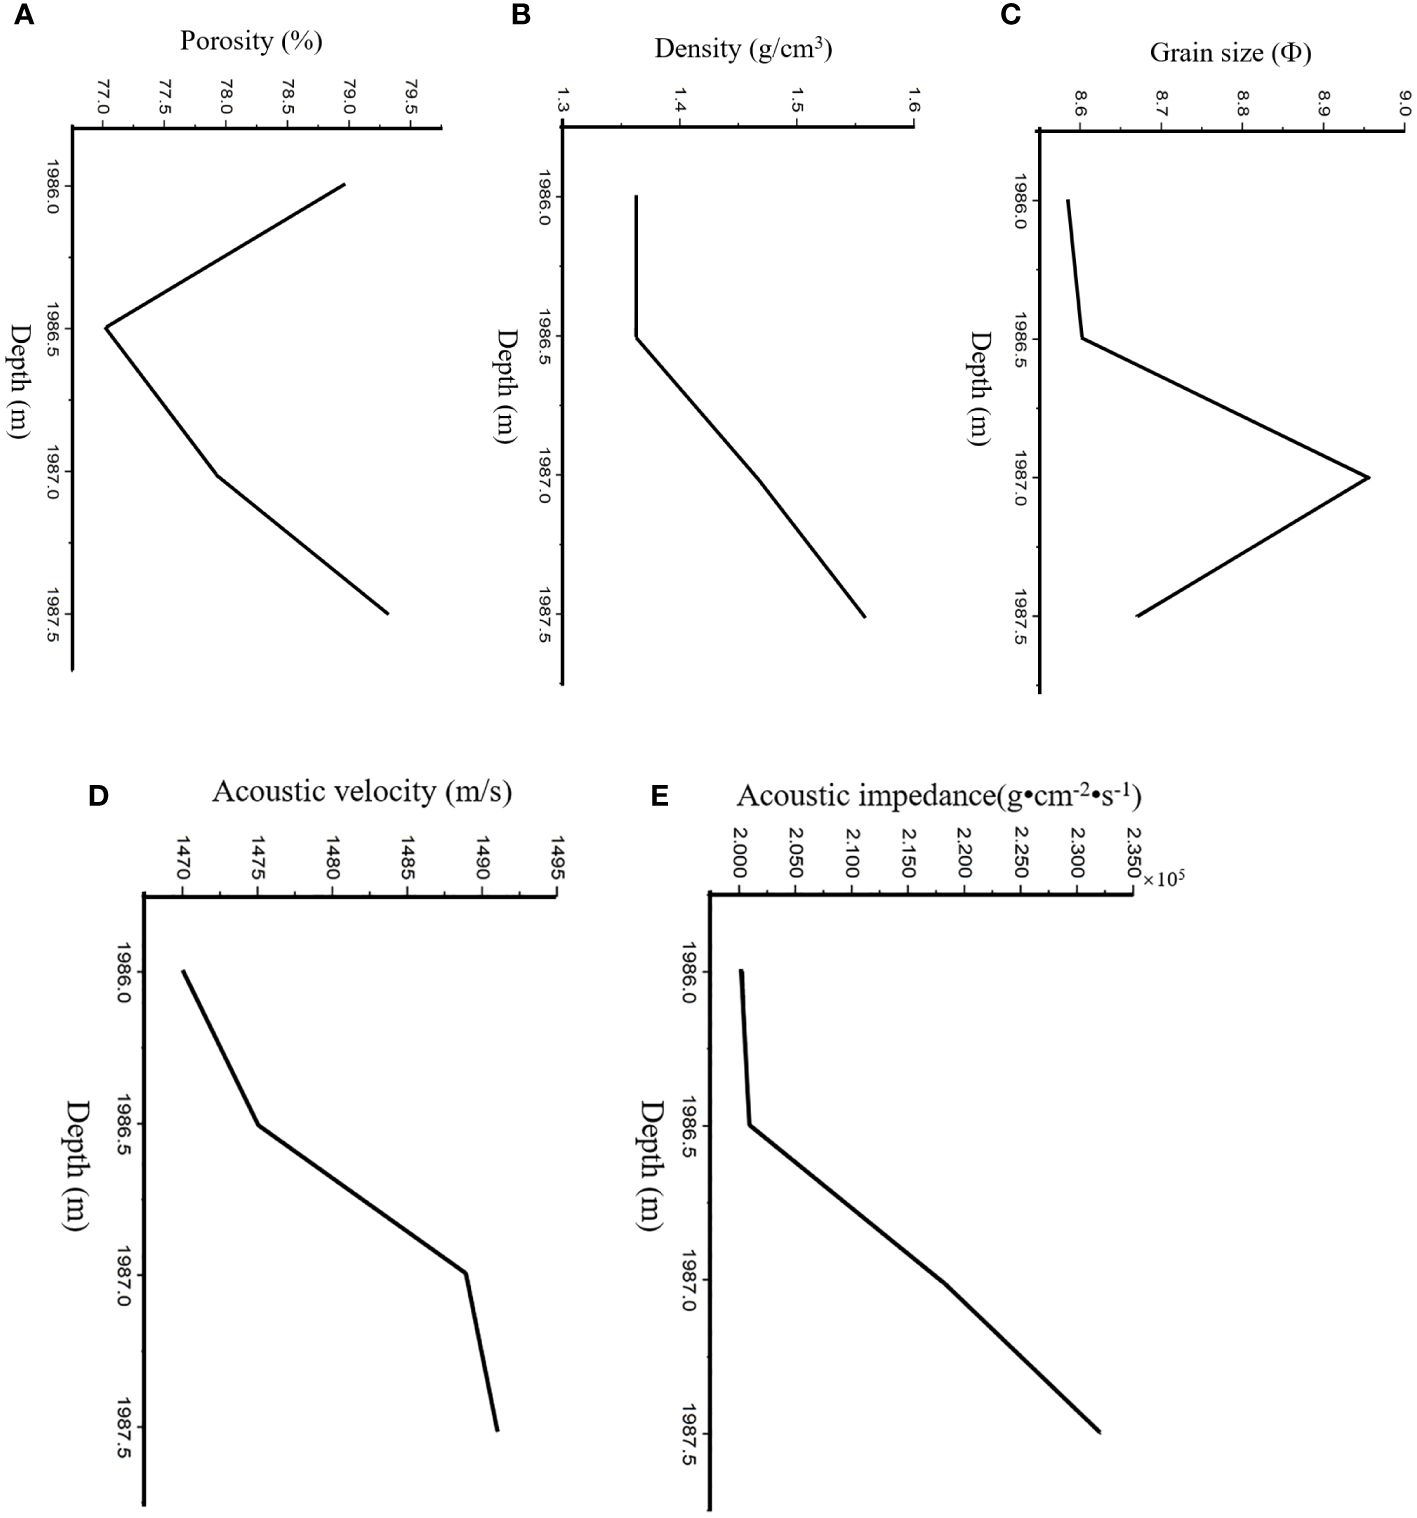
Figure 8 Variation in each parameter with depth at station DZ12. (A) porosity, (B) density, (C) grain size, (D) acoustic velocity, and (E) acoustic impendence.
At the inflection point, the trend of the acoustic velocity changes significantly. Based on the analysis of the depth of the corresponding profile, it is possible that the seafloor sediments still have large water depth variations in acoustic properties of the lower land slope due to local variations in sediment type, and lithology. The trend in acoustic impedance is similar to that in density based on the graph of the trend in each parameter with water depth, and the trend in wave impedance can reflect reflective properties. Therefore, density has a greater influence on the sediment deposit layer in the upper land slope, which is reflected in the graph in which they have similar trends.
5 Conclusion
The sediments of the land slope of the northern SCS are studied by testing and analyzing the acoustic velocity and physical parameters, and the main conclusions are as follows:
(1) The sediments in the study area are complex and include silt and silty clay, and the sediments in the area are generally characterized by a high-water content and high porosity. Overall, the highest acoustic velocity values are found in silt, and the lowest are found in silty clays, with a clear correlation between the sediment acoustic velocity and type.
(2) Correlation analysis of the physical parameters of the land slope sediment samples from the northern SCS with the acoustic properties of the samples from the laboratory tests revealed that the acoustic velocity of the samples from the laboratory tests correlated well with the density and porosity and, to a certain extent, with the grain size. The acoustic velocities at 100 kHz are 1387 m/s ~ 1622 m/s, which is in general agreement with the velocities reported in studies in other Chinese seas but lower than those predicted by the Hamilton model.
(3) To better study the relationships between each parameter (including density, porosity, and grain size) and the acoustic velocity in each subregion, this study also establishes single-parameter correlations and two-parameter equations suitable for the upper, middle and lower land slopes in each subregion. The analysis shows that the two-parameter correlation coefficients are greater than the single-parameter correlation coefficients. The control method is used to study the influence of each parameter on the acoustic velocity, and the results of the analysis show that porosity and density had greater influences on the acoustic velocity of the sediment. The influence of each parameter on the prediction of the acoustic velocity of the sediment is in the following order: porosity>density>grain size.
(4) Finally, several typical stations are selected to test and analyze the data of acoustic properties with water depth, and the changes in the acoustic properties of shallow sediment topography in the northern SCS seabed and the differences between different sedimentary geomorphological units are investigated. The variation in each parameter with depth at the study station to the corresponding position in the corresponding shallow stratigraphic profile shows the complex sediment changes in the region. And it is shown at the inflection points where the trend in the acoustic velocity changes significantly. In local area, acoustic properties changing greatly may be caused by changes in the sediment type, lithology along with the depth. And the interlayer developed the land slope of the northern SCS also may cause this change.
Data availability statement
The original contributions presented in the study are included in the article/supplementary materials, further inquiries can be directed to the corresponding author/s.
Author contributions
HZ: Writing – original draft, Methodology. LX: Funding acquisition, Writing – review & editing, Supervision. QZ: Data curation, Writing – review & editing. JH: Writing – original draft. QL: Writing – review & editing. KL: Writing – review & editing.
Funding
The author(s) declare financial support was received for the research, authorship, and/or publication of this article. This work is supported in part by the National Natural Science Foundation of China under grant 42276055; in part by the National Key Research and Development Program under grant 2022YFC2803503; in part by the Fundamental Research Funds for the Central Universities under grant 202262008; in part by Fujian Provincial Key Laboratory of Marine Physical and Geological Processes, (NO. KLMPG-22-08); and in part by the Natural Science Foundation of Shandong Province under grant ZR2022MD067.
Acknowledgments
The authors thank the reviewers for their constructive comments and suggestions, which significantly improved the quality of this paper.
Conflict of interest
The authors declare that the research was conducted in the absence of any commercial or financial relationships that could be construed as a potential conflict of interest.
Publisher’s note
All claims expressed in this article are solely those of the authors and do not necessarily represent those of their affiliated organizations, or those of the publisher, the editors and the reviewers. Any product that may be evaluated in this article, or claim that may be made by its manufacturer, is not guaranteed or endorsed by the publisher.
References
Bae H. S., Kim D. C., Lee G. S., Kim G. Y., Kim S. P., Seo Y. K., et al. (2014). Physical and acoustic properties of inner shelf sediments in the South Sea, Korea. Quat. Int. 344, 125–142. doi: 10.1016/j.quaint.2014.03.058
Biot M. A. (1956a). Theory of propagation of elastic waves in a fluid-saturated porous solid. I. Low frequency range. Acoust. Soc Am. 28, 168–178. doi: 10.1121/1.1908239
Biot M. A. (1956b). Theory of propagation of elastic waves in a fluid-saturated porous solid. II. Higher frequency range. Acoust. Soc Am. 28, 179–191. doi: 10.1121/1.1908241
Buckingham M. J. (2005). Compressional and shear wave properties of marine sediments: comparisons between theory and data. J. Acoust. Soc. Am. 117 (1), 137–152. doi: 10.1121/1.1810231
Buckingham M. J., Richardson M. D. (2002). On tone-burst measurements of sound speed and attenuation in sandy marine sediments. IEEE J. Ocean. Eng. 27, 429–453. doi: 10.1109/JOE.2002.1040929
Cheng J. J., Fu M. Z., Meng X. M., Liu L. J., Kan G. M., Liu B. H. (2011). Correlation analysis of physical properties and compressional wave velocity of seafloor sediments from the central part of the south Yellow sea. Periodical Ocean Univ. China. 41, 331–336.
Endler M., Endler R., Wunderlich J., Bobertz B., Leipe T., Moros M., et al. (2016). Geo-acoustic modelling of late and postglacial sedimentary units in the Baltic Sea and their acoustic visibility. Mar. Geol. 376, 86–101. doi: 10.1016/j.margeo.2016.03.015
Fu S. S., Tao C. H., Prasad M., Wilkens R. H., Frazer L. N. (2004). Acoustic properties of coral sands, Waikiki, Hawaii. J. Acoust. Soc. Am. 115, 2013–2020. doi: 10.1121/1.1689340
Gassmann F. (1951). Vierteljahrsschrift der Natruforschenden Gesellschaft in Zuric. Uber die elastizitat poroser Medien. Vier. der Natur. Gesellschaft in Zurich, Vol. 96. 1–23.
Hamilton E. L. (1985). Acoustic velocity as a function of depth in marine sediments. J. Acoust. Soc. Am. 78, 1348–1355. doi: 10.1121/1.392905
Jackson D. R., Richardson M. D. (2007). High-frequency seafloor acoustics (New York: Springer Science, Business Media). doi: 10.1007/978-0-387-36945-7
Kan G., Cao G., Wang J., Li G., Liu B., Meng X., et al. (2020). Shear wave speed of shallow seafloor sediments in the northern South China Sea and their correlations with physical parameters. Earth Space Sci. 7, e2019EA000950. doi: 10.1029/2019EA000950
Kan G. M., Liu B. H., Wang J. Q., Meng X. M., Li G. B., Hua Q. F., et al. (2018). Sound speed dispersion characteristics of three types of shallow sediments in the Southern Yellow Sea. Mar. Georesour. Geotechnol. 36, 853–860. doi: 10.1080/1064119X.2017.1392659
Liu B. H., Han T. C., Kan G. M., Liu G. B. (2013). Correlations between the in situ acoustic properties and geotechnical parameters of sediments in the Yellow Sea, China. J. Asian Earth Sci. 77, 83–90. doi: 10.1016/j.jseaes.2013.07.040
Liu B. H., Kan G. M., Li G. B., Yu S. Q., Meng X. M., Wang J. Q., et al. (2019). Seafloor sediments acoustic measurement techniques and application (Beijing: Science Press).
Lu B., Liang Y. B. (1993). Acoustic velocity and physical parameters relationship in marine sediments. Mar. Sci., 06. (in Chinese).
Lu B., Li G. X., Huang S. J., Zhang F. S. (2006). The comparing of seabed sediment acoustic-physical properties in the Yellow Sea, the East China Sea and northern the South China Sea( in Chinese). Ocean Technol. 24, 28–33. doi: 10.3969/j.issn.1003-2029.2005.02.008
Lu B., Liu Q., Li G. X. (2010). Grain and pore factors in acoustic response to seafloor sediments. Mar. Georesour. Geotechnol. 28 (2), 115–129. doi: 10.1080/10641191003780724
Orsi T. H., Dunn D. A. (1990). Acoustic velocity and related physical properties of fine grained abyssal sediments from the Brazil Basin (South Atlantic Ocean). J. Acoust. Soc. Am. 88, 1536–1542. doi: 10.1121/1.400311
Orsi T. H., Dunn D. A. (1991). Correlations between acoustic velocity and related properties of glacio-marine sediments: Barents Sea. Geo-Marine Lett. 11, 79–83. doi: 10.1007/BF02431033
Richardson M. D., Briggs K. B. (1996). In situ and laboratory geoacoustic measurements in soft mud and hard-packed sand sediments: Implications for high-frequency acoustic propagation and scattering. Geo-Marine Lett. 16, 196–203. doi: 10.1007/BF01204509
Richardson M. D., Briggs K. B., Bentley S. J., Walter D. J., Orsi T. H. (2002). The effects of biological and hydrodynamic processes on physical and acoustic properties of sediments off the Eel River, California. Mar. Geol. 182, 121–139. doi: 10.1016/S0025-3227(01)00231-6
Richardson M. D., Briggs K. B. (2004). Empirical predictions of seafloor properties based on remotely measured sediment impedance. High Frequency Ocean Acoustic Conference. Melville, Louisiana, USA: AIP Pres 728, 12–21. doi: 10.1016/S0025-3227(01)00231-6
Stoll R. D. (1977). Acoustic wave in ocean sediments. Geophysics. 42, 715–725. doi: 10.1190/1.1440741
Wang J. Q., Liu B. H., Kan G. M., Li G. B., Zheng J. W., Meng X. M., et al. (2018). Frequency dependence of sound speed and attenuation in fine-grained sediments from 25 to 250 kHz based on a probe method. Ocean Eng. 36, 515–521. doi: 10.1016/j.oceaneng.2018.04.078
Wood A. B. (1941). A Textbook Of Sound: Being An Account Of The Physics Of Vibrations With Special Reference To Recent Theoretical And Technical Developments (USA: Macmillan).
Xing L., Li Q. Q., Meng Q. W., Liu H. S., Wei J., Lu B. R., et al. (2022a). Enlightenment of the mariana fore-arc sedimentary basin evolution to the subduction process. Acta GEOLOGICA SINICA-ENGLISH EDITION. 96, 10. doi: 10.1111/1755-6724.14860
Xing L., Lin H. R., Zhang D., Li Q. Q., Zhou H. W., Liu H. S. (2022b). Facial characteristics of air gun array wavelets in the time and frequency domain under real conditions. J. Appl. Geophys. 199, 104591. doi: 10.1016/j.jappgeo.2022.104591
Xing L., Liu X. Q., Liu H. S., Qin Z. L., Ma B. J. (2021). Research on the construction of a petrophysical model of a heterogeneous reservoir in the hydrate test area in the Shenhu area of the South China sea (SCS). Geofluids 2021, 1–19. doi: 10.1155/2021/5586118
Keywords: the northern South China Sea, physical parameter, acoustic velocity, density, porosity, grain size
Citation: Zhang H, Xing L, Zhou Q, Li Q, Han J and Liu K (2024) Correlation between acoustic velocity and physical parameters of sea floor sediments: a case study of the northern South China Sea. Front. Mar. Sci. 11:1356302. doi: 10.3389/fmars.2024.1356302
Received: 15 December 2023; Accepted: 12 April 2024;
Published: 03 May 2024.
Edited by:
Xingsen Guo, University College London, United KingdomReviewed by:
Xiangchun Wang, China University of Geosciences, ChinaQunshu Tang, Zhejiang University, China
Yifan Huang, Chinese Academy of Sciences (CAS), China
Copyright © 2024 Zhang, Xing, Zhou, Li, Han and Liu. This is an open-access article distributed under the terms of the Creative Commons Attribution License (CC BY). The use, distribution or reproduction in other forums is permitted, provided the original author(s) and the copyright owner(s) are credited and that the original publication in this journal is cited, in accordance with accepted academic practice. No use, distribution or reproduction is permitted which does not comply with these terms.
*Correspondence: Lei Xing, eGluZ2xlaW91Y0BvdWMuZWR1LmNu