 Marine Lebrec
 Maxime M. Grand
95% of researchers rate our articles as excellent or good
Learn more about the work of our research integrity team to safeguard the quality of each article we publish.
Find out more
ORIGINAL RESEARCH article
Front. Mar. Sci., 15 March 2024
Sec. Marine Biogeochemistry
Volume 11 - 2024 | https://doi.org/10.3389/fmars.2024.1354780
High-resolution, autonomous monitoring of phosphate and silicate in the marine environment is essential to understand their complex dynamics and implications for the functioning of marine ecosystems. In the absence of dependable reagent-less sensors for these nutrients, leveraging established colorimetric techniques using miniaturized analyzers, such as programmable Flow Injection (pFI), offers the best immediate solution to meet oceanographic accuracy and precision standards. In this work, we further optimize the phosphomolybdate and silicomolybdate assays recently adapted for use with pFI, laying the groundwork for the technique’s use for long-term, autonomous operations. For both assays, we show that only a narrow range of acidities and molybdate concentrations can maximize sensitivity while minimizing salt effects. In addition, we demonstrate the stability of our optimized colorimetric reagent formulations, ensuring that analytical sensitivity remains within 10% of initial levels for at least 35 days of continuous use. We then applied our optimized protocols to produce oceanographically consistent phosphate and silicate profiles at the Hawaii Ocean Time Series (HOTS) and Southern Ocean Time Series (SOTS), respectively, which compared favorably against a reference method and historical data. Using certified reference materials for nutrients in seawater, we show that our pFI protocols, optimized for long-term operations, achieve a shipboard precision better than 6% and a relative combined uncertainty (k=1) of 4.5% for phosphate (0.45 - 2.95 µmol L-1) and 6.2% for silicate (2.2 to 103 µmol L-1). To demonstrate pFI’s potential as a versatile tool for autonomous monitoring, we report a five-day hourly phosphate time series at a coastal shore station in central California (n=121 analyses), examine phosphate uptake by seaweed at five-minute intervals at a seaweed aquaculture facility (n=103), and discuss a unique, high-resolution surface silicate transect spanning multiple frontal zones in the Australian sector of the Southern Ocean (n=249). These data, obtained using a commercially available pFI analyzer, confirm that pFI is a viable technology for autonomous monitoring of phosphate and silicate, paving the way for more ambitious, long-term deployments in a variety of settings.
The availability and stoichiometric ratios of inorganic macronutrients (N, P and Si) regulate marine phytoplankton productivity and species distribution, both of which influence global carbon cycling (Falkowski et al., 1998; Moore et al., 2013). In most of the ocean, N and P frequently limit primary production (Moore et al., 2013). However, in areas with an abundant supply of N and P, silicate may limit the growth of diatoms, which are responsible for about 40% of marine productivity and particulate organic carbon export (Jin et al., 2006; Tréguer et al., 2018). In some coastal and estuarine regions, enhanced nutrient inputs promote eutrophication, and shifts in nutrient stoichiometry, including the relative supply of silicate, can trigger harmful algal blooms (Glibert and Burford, 2017; Ryan et al., 2017). Accurate and timely nutrient measurements are thus essential for understanding both the local and broader ecosystem responses driven by macronutrient availability.
Nutrient concentrations are controlled by diverse processes spanning various spatial and temporal scales. To predict the response of marine ecosystems to shifting nutrient supply, both natural and anthropogenic, sustained, high-frequency observations using autonomous sensors are needed. Reagent-free ultraviolet (UV) sensors have transformed nitrate monitoring in coastal and open-ocean systems over the past two decades (Johnson and Coletti, 2002; Sakamoto et al., 2017; Sarmiento et al., 2023). However, autonomous observations of phosphate and silicate still lag far behind nitrate, despite their biological relevance and recognition as Essential Ocean Variables of the Global Ocean Observing System (IOCCP, 2017).
While emerging phosphate and silicate electrochemical sensors could mirror the success of UV nitrate sensors due to their reagent-free nature and low power requirements, they remain at the research and development stage and their suitability for long-term operation has yet to be demonstrated (Barus et al., 2017, Barus et al., 2018; Chen Legrand et al., 2021; Chen et al., 2023). As such, the primary approach for autonomous phosphate and silicate monitoring involves adapting established wet chemical colorimetric assays to various flow-based instruments (Vuillemin et al., 2009; Grand et al., 2017; Altahan et al., 2022; Fang et al., 2022a, Fang et al., 2022b). For in situ deployments, whether stationary or on mobile platforms, Lab-On-Chip analyzers stand out for their robustness, low-power consumption, and ability to operate in diverse environments, including the deep-sea (Grand et al., 2017; Birchill et al., 2021; Beaton et al., 2022). However, LOC sensors are limited to single nutrient measurements, work best when submerged and hardware components are not readily serviceable by the user. For benchtop tasks, fixed location monitoring, or shipboard underway applications, several syringe-based analyzers offer multi-nutrient determinations capabilities (Altahan et al., 2022; Fang et al., 2022a, Fang et al., 2022b). Notably, the iSEA-II analyzer is well suited for discrete sample analysis and underway monitoring of P and Si, with analytical performance comparable to state-of-the-art benchtop systems (Fang et al., 2022a). However, iSEA-II is not commercially available, and its potential for long-term unattended deployments awaits validation (Fang et al., 2022a, Fang et al., 2022b).
Programmable Flow Injection (pFI) offers a promising alternative to existing nutrient analyzers, aiming to enhance macronutrient measurement coverage in both coastal and open-ocean settings. Initially conceptualized for trace analysis of Zn in seawater (Grand et al., 2016), the technique was further refined in 2018 when the concept of flow programming was formalized, providing a framework for pFI to accommodate various colorimetric reagent-based assays (Hatta et al., 2018; Ruzicka, 2018; Ruzicka and Chocholouš, 2024). Central to pFI is the synchronized operation of two high-precision pumps connected via holding coils to a selection valve central port, atop which the Lab-On-Valve—a unit for sample and reagent metering—is mounted. This manifold, which is entirely computer controlled, facilitates precise derivatization of sample and reagent(s) at user defined ratios. Following mixing, a specific segment of the reacted sample is positioned within the Lab-On-Valve mounted flow cell for quantification. The adaptability of pFI to various assays within a singular, compact, and commercially available unit, coupled with its automation, minimal maintenance requirements and low reagent consumption rates, makes it particularly well suited for autonomous operations.
While pFI has been successfully applied to nutrient determinations in seawater (Ruzicka et al., 2019; Hatta et al., 2021, 2023), the pFI assays developed thus far were primarily designed for benchtop, discrete sample analysis and a comprehensive oceanographic validation of pFI is still lacking. To fully harness the potential of pFI—beyond discrete sample analysis—the technique needs further optimization for long-term unattended operations. This not only requires optimizing the reagent formulations to maximize longevity but also showcasing pFI’s capabilities in various deployment settings.
Building upon the seminal work of (Hatta et al., 2021, 2023), this paper establishes a blueprint for the application of pFI to autonomous, long-term (~ 30 days) determinations of phosphate and silicate in seawater. After optimizing the reagent formulations for long-term operations and minimal salt effects, we rigorously evaluated the shipboard performance of our newly devised protocols by analyzing vertical profiles from the North Pacific and Southern Ocean and comparing them with established methods and historical data. We then demonstrate the suitability of pFI for unattended deployments through pilot deployments at a shore station in central California, a seaweed aquaculture facility, and as an underway system onboard a global class research vessel along a meridional Southern Ocean transect. This work aims to showcase the versatility and unique benefits of pFI analyzers for autonomous nutrient analysis, setting the stage for long-term deployments, novel instrument configurations (e.g., measuring multiple analytes from a single sample), and other comprehensive evaluations.
In all experiments, we used a miniSIA-2 instrument (GlobalFIA, USA). Unless otherwise specified, this instrument featured two High Flow milliGAT pumps with stainless steel heads, a plexiglass 8-port Lab-On-Valve (LOV) affixed to a selector valve (VICI, USA), two thermostated holding coils set at 25°C, and a 20 cm Linear Light Path (LPP) flow cell mounted to the LOV side (Figure 1). A Tungsten Halogen light source and a VIS-NIR Flame Spectrophotometer (OceanInsight, USA) were connected to the flow cell using 500 µm silica core optical fibers sheltered in 0.8 mm I.D PEEK tubing (GlobalFIA, USA). A 40 psi flow restrictor (Idex Health & Science, USA) was placed at the flow cell outlet to minimize degassing in the light path. Except for the 1.6 mm I.D tubing between the carrier reservoirs and milliGAT pumps, the LOV ports tubing connections and holding coils (1,300 µL) were all 0.8 mm I.D polytetrafluoroethylene (PTFE) and were furnished with ¼-28 fluidic connectors (Idex Health & Science, USA). The reagents, standard solutions and ultra-pure water carrier were stored in sterile, flexible storage bags ranging from 50 mL to 3 L (Flexboy, Sartorius, USA), hung adjacent to the instrument, and connected to the COV ports using ¼-28 fluidic connectors (Idex Health & Science, USA).
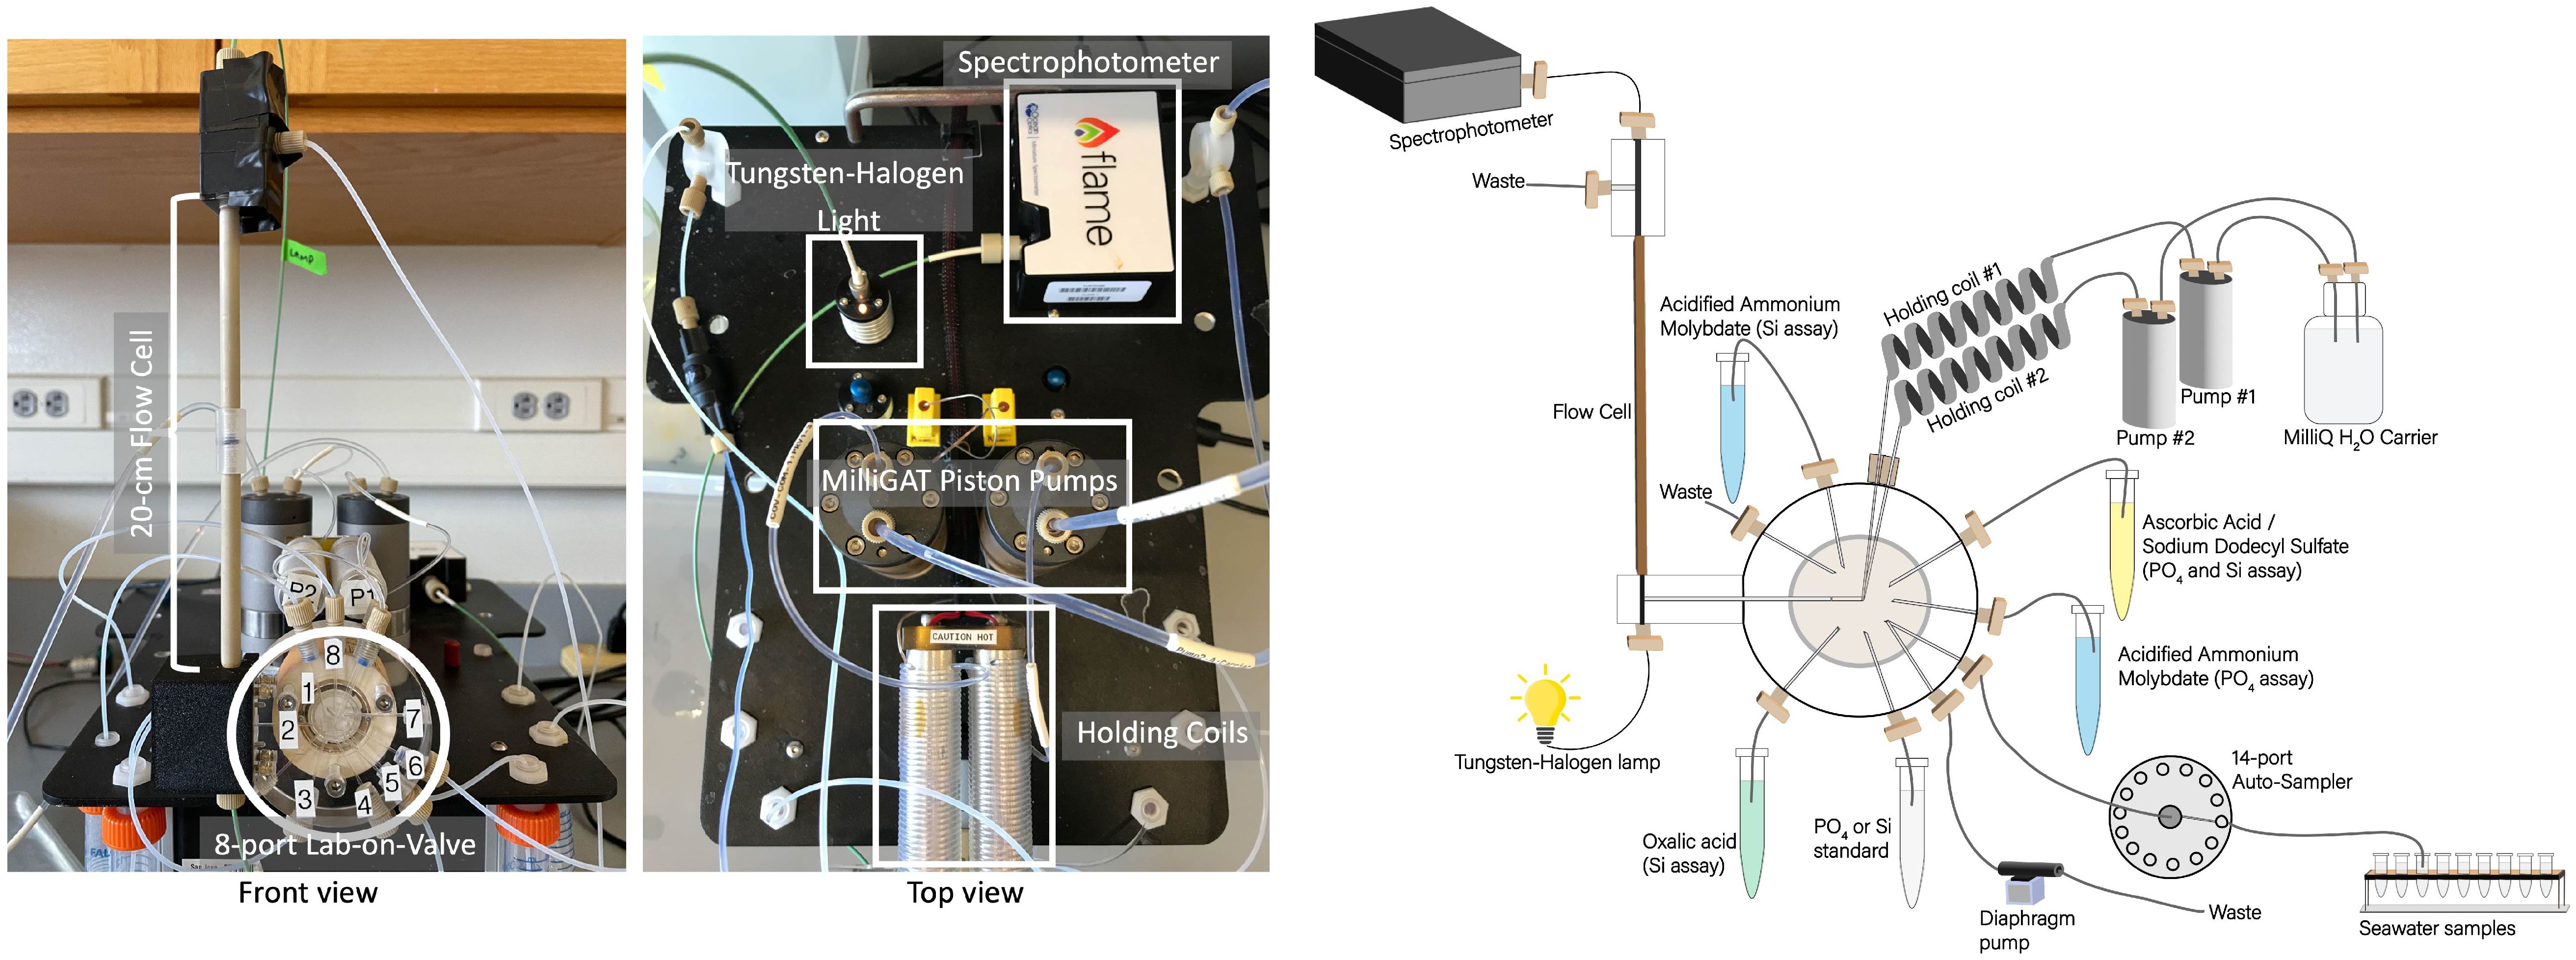
Figure 1 Photographs of miniSIA2 pFI analyzer (left) and schematic diagram of flow manifold components (right).
During the International Nutrient Intercomparison Cruise (INIV), we integrated an external autosampler (GlobalFIA, USA) to the miniSIA-2 for efficient analysis of full depth vertical profiles. This autosampler featured a 14-port selection valve, linked to 14 acid-washed 30 mL screw caps polypropylene vials (Sarstedt, Germany). One end of the LOV flow-through sample port connected directly to the central port of the autosampler selection valve, with the opposite end of the LOV sample port linked to the autosampler’s diaphragm pump (Figure 1). This arrangement ensured sample integrity by preventing the sample from making direct contact with the diaphragm pump. In all experiments, the entire setup, including the miniSIA-2 components and the autosampler, was controlled by FloZF software version 5.2 (GlobalFIA), operating on a Dell Latitude 3590 laptop running Windows 10.
All experiments employed plasticware acid-cleaned for at least 24 hours in a 10% HCl bath (v:v). We made all working reagents and stock standard solutions using high-purity milliQ (MQ) water (> 17 MΩ cm-1). Primary standard salts were dried for 24 hours at 100 °C, then allowed to cool to room temperature in a desiccator before weighing with 0.1 mg precision. Stock standards (1 L) of phosphate (0.7 mM) and silicate (4.97 mM) were prepared by dissolving KH2PO4 (0.0954 g) and Na2SIF6 (0.4718 g, purity 99.4%) in MQ water in class A volumetric flasks. All volumetric flasks and pipettes used for standard preparation were calibrated gravimetrically Becker et al. (2020), and the resulting stock standard solutions were stored refrigerated in opaque High Density Polyethylene (HDPE) bottles.
The working standards, depending on the application, were created by serial dilution of the concentrated stocks in either MQ water or low nutrient seawater (LNSW) collected from the Hawaii Ocean Time-series station ALOHA (22°45 N, 158°00 W). The LNSW was filtered at sea through a 0.45 µm Acropak capsule filter (Pall, USA) and stored in acid-cleaned HDPE cubitainers in the dark at room temperature until use. To prolong stability during unattended deployments (> 5 days), the PO4 working standards should be acidified 13.3 mM using 6 M HCl (reagent grade).
The spectrophotometric determination of phosphate and silicate is based on the reaction of the analytes with molybdate in an acidic medium, followed by the reduction of the resulting molybdic complexes to phosphomolybdenum blue (PMoB) and silicomolybdenum blue (SiMoB) using ascorbic acid as a reductant (Murphy and Riley, 1962; Truesdale and Smith, 1976). The silicate assay includes an extra step with the addition of oxalic acid to prevent the reduction of excess molybdates and, presumably, the decomposition of interfering phosphomolybdic species (Thomsen et al., 1983). The assays measure dissolved orthophosphate and orthosilicic acid. However, they may also detect contributions from colloidal materials and, in the case of phosphate, labile organic phosphates that are reactive to the assay conditions.
The phosphate assay uses two primary reagents: molybdate and ascorbic acid. To prepare the molybdate reagent, we first made a stock potassium antimony tartrate (PAT) solution by dissolving 0.45 g of antimony potassium tartrate trihydrate (Alfa Aesar, CAS 28300-74-5) into 45 mL of MQ water. This solution remained stable for at least six-months when refrigerated. The working molybdate reagent consisted of 3.24 mM ammonium molybdate tetrahydrate, 0.94 M HCl and 0.45 mM PAT, which was prepared by adding 0.2 g of ammonium molybdate tetrahydrate (Fisher Chemicals, CAS 12054-85-2) to ~20 mL MQ water, followed by 1.5 mL of the PAT stock solution and 7.8 mL of 6 M HCl (diluted from concentrated ACS Grade HCl in MQ water). The solution was then brought up to 50 mL with milliQ water. The preparation of the ascorbic acid reagent, which contained 125 mM ascorbic acid and 8.7 mM sodium dodecyl sulfate (SDS), involved first adding 1.1 g of L-ascorbic acid (Fluka, CAS 50-81-7) to approximately 45 mL of MQ water. After complete dissolution of the salts, 0.125 g of ultra-pure Sodium Dodecyl Sulphate (MP Biomedicals, CAS 151-21-3) was added and the solution was brought up to 50 mL with MQ water, shaking gently to mix. The resulting ascorbic acid reagent was left to stand for approximately 30 min before use.
The silicate assay employs three primary reagents: molybdate, oxalic acid and ascorbic acid. The molybdate reagent has a different composition than that of the phosphate assay while the ascorbic acid is identical for both. This approach saves one reagent port on the miniSIA-2 instrument, thereby enabling sequential analysis of phosphate and silicate using the same unit. The molybdate reagent for silicate analysis (4 mM molybdate and 90 mM H2SO4) was prepared by first dissolving 0.25 g ammonium molybdate tetrahydrate in about 40 mL MQ water, followed by 0.75 mL of 6 M H2SO4 (diluted from concentrated Trace Metal Grade H2SO4 in MQ water). The resulting solution was then brought up to 50 mL. The oxalic acid solution was created by dissolving 1.0 g of oxalic acid dihydrate (Fisher Chemical, CAS 6153-56-6) in 50 mL MQ water.
The protocol outlined above provides enough reagents for the analysis of 24 discrete samples in triplicate for both phosphate and silicate including calibration and QA/QC using Certified Reference Materials (CRM). However, since the colorimetric reagents are stable for at least a month when stored in the dark (see below), larger volumes can be prepared, thereby allowing for continued use of the same batch of reagents for either benchtop or unattended deployments.
In a pFI assay protocol, the analyzer (Figure 1), governed by software scripts, mixes the sample and reagents at a user-defined ratio. The ratio is orchestrated by the two pumps, which are connected to the Lab-On-Valve’s central port via the holding coils (HC) and operate synchronously but in opposite directions during mixing. Typically, one pump aspirates the sample into HC1 while the other dispenses reagent previously held in HC2 to HC1. The aspirating pump sets the ratio. For example, if 200 µL of sample is aspirated while 100 µL of reagent is dispensed, a 1:1 ratio is established. The difference between the aspirated and dispensed amounts represents the reagent volume added to HC1 (in this case 100 µL), with the remainder (100 µL) as the sample. A portion of this mixture is then transferred to the flow cell, where it remains until the chemical reaction reaches steady state and the resulting absorbance is recorded (Figure 2B). This step is achieved by positioning the center of the reacting mixture in the flow cell, ensuring that its boundaries are outside the light path, thereby eliminating Schlieren effects (Hatta et al., 2021).
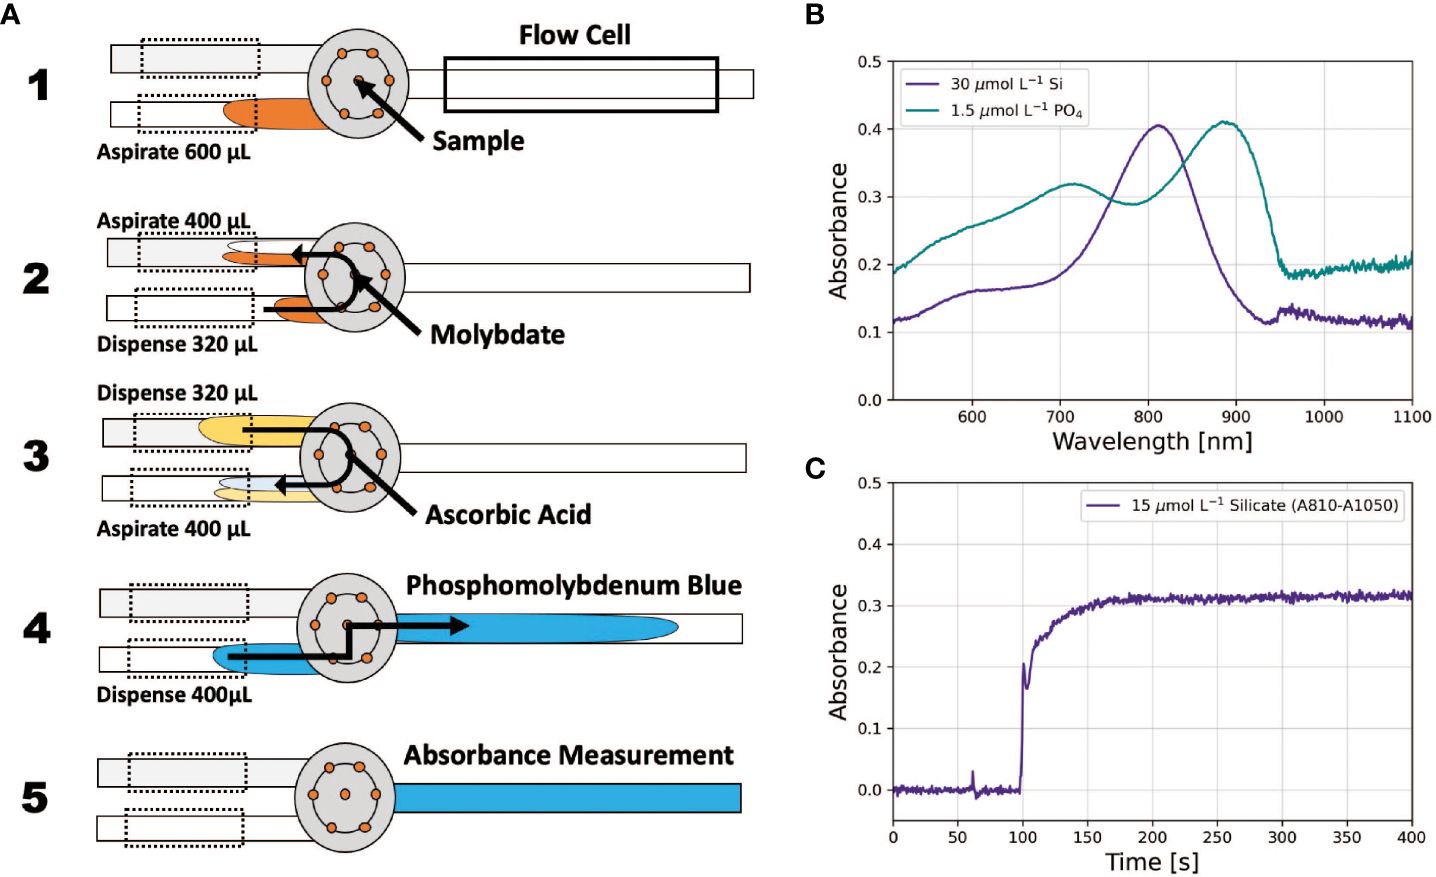
Figure 2 (A) Operational principles of pFI mixing for the phosphate assay, adapted from Hatta et al. (2019). The grey circle represents the Lab-On-Valve. (B) typical absorbance PMoB and SiMoB absorbance spectra. (C) example absorbance time-series for the silicate assay illustrating steady state absorbances ~150 sec after obtaining the reference scan in MQ water.
We developed a new pFI protocol for phosphate analysis (Figure 2A, Supplementary Table S1). First, 600 µL of sample is aspirated into HC1. The sample subsequently mixes with molybdate in a 4:1 ratio in HC2, forming the phosphomolybdic complex. This complex then merges with ascorbic acid, also at a 4:1 ratio. A 400 µL segment of this reacting mixture is then delivered to the flow cell, where the flow is stopped for 60 seconds and the absorbance of the PMoB product is measured. Finally, the system is flushed with 2 mL of MQ water from both pumps, preparing it for the next sample (Supplementary Table S1). Our phosphate protocol provides distinct benefits. Aspirating the sample first allows for online dilution of a concentrated MQ standard, facilitating autonomous system calibration. Moreover, this protocol is advantageous for long-term unattended operations, consuming only 80 µL of molybdate and another 80 µL of ascorbic acid per sample.
For silicate analysis, we adopted the pFI protocol outlined in Hatta et al. (2021), which is detailed in Supplementary Table S2. One key modification was adjusting the holding coils’ temperatures to 25°C instead of the originally specified 50°C. Our decision to use a lower temperature stemmed from concerns regarding equipment wear and potential safety issues when maintaining a holding coil unattended at 50 °C for extended durations. In tandem with this temperature change, the stop flow time in the flow cell was extended to 60 seconds to ensure the absorbance of the SiMoB product reached a steady state (Figure 2C).
The VIS-NIR Flame spectrophotometer was configured with a 30 ms integration time. Using the FloZF software, the resulting counts were smoothed by averaging six consecutive spectral scans and four consecutive pixels. To correct for potential baseline offsets, absorbance values obtained when the flow cell was filled with MQ water were subtracted from reacted sample absorbances.
For phosphate analysis, the absorbance of the PMoB product was computed using the following equation: ABSPMoB = (ABS880 – ABS880baseline) - (ABS1050-ABS1050baseline). Employing a reference wavelength at 1050 nm, as opposed to solely relying on a single measurement wavelength at 880 nm, enhanced the precision of the measurements. To accommodate the analysis of Si samples from full depth ocean profiles (up to 180 µmol L-1) within the constraints of a 20 cm flow cell, a dual measurement wavelength approach was adopted. For low Si samples (< 40 µmol L-1), the difference between the baseline corrected absorbances at 810 nm and the 1050 nm reference was used. For high Si samples (> 40 µmol L-1), a singular, baseline corrected measurement wavelength at 660 nm was employed. This strategy extends the linear range of measurements using the same 20 cm optical path used for phosphate analysis, whilst preserving sensitivity at the lowest Si concentrations. As a result, the same instrument can be used for sequential analysis of phosphate and silicate in all but the most oligotrophic regions of the ocean. Phosphate and silicate concentrations in the samples were calculated using the slope and intercept from calibrations in either MQ or LNSW, contingent on the application (specified below).
We investigated how molybdate concentration and acidity in the reaction mixture influence analytical sensitivity and salt effects of both pFI assays. For the silicate assay, acidities ranging from 1.5 to 30 mM [H+] were tested at molybdate concentrations of 0.5, 0.75 and 1 mM. For phosphate, we tested acidities from 0 to 1 mM at molybdate levels of 0.5, 1.0 and 1.5 mM. Analytical sensitivity was estimated from the slope of 3-point MQ calibration curves for each acidity-molybdate combination. To evaluate salt effects under each condition, LNSW was spiked with known concentrations of the analytes and measured using the corresponding MQ water calibrations. Salt effects were defined as the percentage error between the measured and known spiked LNSW concentrations, with errors greater than 5% indicative of suboptimal conditions for seawater analysis.
To evaluate the long-term stability of our optimized reagents, we tested each reagent solution under a range of temperatures representative of seasonal fluctuations at Moss Landing, CA, our first unattended pFI deployment location. We first generated 3 point-calibration curves for phosphate (0-2 µmol L-1 PO4) and silicate (0-30 µmol L-1 Si) using freshly prepared reagents and standards. The solutions, stored in darkened flexible bags immediately after preparation, were then placed in a water bath at three different temperatures for 36 to over 90 days, depending on the treatment. Temperatures were continuously recorded using a HOBO pendant datalogger during each treatment (Onset Corp, USA). At set times, we connected the aged reagent and standard solutions to the miniSIA-2 pFI and repeated the calibrations. For the phosphate assay, we repeated the calibrations using aged solutions every 3-5 days for 40-50 days at 7, 13 and 24°C. For silicate, the calibrations were only performed initially and after 36-92 days of incubation time at 7, 10 and 24°C.
We defined stability based on the change in calibration slope at time t relative to the initial slope obtained with freshly prepared solutions (t0). If significant degradation occurred, indicated by a >10% change in slope, fresh reagents were prepared in succession and new calibrations were run until the initial slope was re-established. This systematic reagent replacement approach allowed us to identify which reagent or standard had degraded and provided insights into the long-term integrity of each solution under simulated deployment temperature conditions.
We evaluated the shipboard capabilities of the pFI analyzer during two research cruises. In the North Pacific Ocean aboard the RV Kilo Moana in September 2022, we collected unfiltered duplicate samples from a full-depth profile (n=36, 5-4800 m, cruise # HOTS-339). One set was analyzed in triplicate for phosphate using the pFI analyzer calibrated with MQ standards (0-3 µmol L-1). The duplicate samples were frozen, shipped to Scripps Institution of Oceanography (SIO) Ocean Data Facility chemistry laboratory on dry ice and analyzed at SIO’s lab using an AA3 autoanalyzer (Seal Analytical, USA). The resulting pFI and SIO vertical profiles were compared using a Type II linear regression.
During the International Nutrient Intercomparison Cruise (INIV) in the Southern Ocean aboard the RV Investigator in June 2023, the pFI analyzer analyzed seven full-depth profiles for silicate along the SR03 transect and one profile at the Southern Ocean Time Series (SOTS) site. For maximum accuracy, we calibrated the pFI using six working standards prepared in LNSW, and these standards contained both Si (0-119 µmol L-1) and PO4 (0-2.8 µmol L-1). Daily quality control included analyzing a low nutrient seawater blank (LNS30, OSIL, UK) and three Reference Materials for Nutrients in Seawater (RMNS, Kanso Technos Co, Japan) at the beginning of each run. This was followed by the analysis of 12 unfiltered seawater samples. In the autosampler sequence, these samples were arranged with two RMNS bracketing them for quality insurance. This process was repeated three times each day to analyze all 36 samples. We used freshly opened RMNS bottles each day but kept the same bottle of LNS30 throughout the 13-day voyage.
During the five-day return transit of the INIV voyage from 52°S, 142°E to 43°S, 147°E, we deployed a pFI analyzer in continuous underway mode for automated silicate analysis in the RV Investigator underway lab. This instrument was furnished with a 6-port LOV unit, an external HL-2000 Tungsten Halogen light source (Ocean Insight, USA), an auxiliary diaphragm pump (KNF, USA), and a 3 mL sample loop. The reagents were stored in flexible storage bags, including the onboard MQ silicate standard and blank (carrier solution). The system was initially programmed to flush and fill the 3 mL sample loop every 30 min before duplicate analysis of the unfiltered sample for Si. As the ship approached Tasmania, the sampling frequency was increased to 15 min. During this five-day unattended deployment, the system was calibrated every 24 hours through triplicate runs of a MQ blank and MQ standard (39.7 µmol L-1-Si). Quality control included the analysis of one KANSO RMNS (CR, 14.3 µmol L-1-Si) mid-way through the deployment.
We deployed a pFI analyzer at the Central and Northern California Ocean Observing System (CeNCOOS) Moss Landing shore station in February 2022 to demonstrate its capabilities for automated, hourly phosphate analysis at a shore-based observatory. The shore station is a dry building exposed to ambient temperatures, where seawater, pumped from 14 m depth at the head of the Monterey Bay submarine canyon, flows through a series of oceanographic sensors. The instrument was equipped with an auxiliary diaphragm pump (KNF, USA) and sample loop for hourly phosphate analysis of unfiltered samples withdrawn from the station’s seawater intake line. To simulate conditions during long term deployments, the holding coils were not thermoregulated and we implemented a 5-min wait time post mixing to mitigate temperature fluctuations’ effects on reaction kinetics.
During this 6-day deployment, we configured the pFI analyzer to create a four-point calibration curve (0, 0.5, 1.5 and 3.0 µmol L-1 PO4) every 12 hours using a single, acidified (13.3 mM HCl), MQ phosphate standard (3.0 µmol L-1 PO4). In the intervals between these calibrations, the pFI was programmed to withdraw and analyze a sample from the seawater intake line hourly. The calibration procedure involved aspirating a fixed volume of the concentrated standard into one of the holding coils and simultaneously dispensing a variable volume of diluent (MQ carrier) to set the dilution factor. For example, aspirating 600 µL of the 3.0 µmol L-1 PO4 standard while dispensing 500 µL of carrier diluent generated a 0.5 µmol L-1 PO4 working standard, which was then derivatized as described in the pFI assay steps (Supplementary Table S1).
We also deployed our pFI analyzer at the Moss Landing Marine Laboratories (MLML) aquaculture facility to demonstrate its potential for tracking nutrient dynamics under real-work tumble aquaculture conditions and to showcase the technique’s versatility, including its use in controlled mesocosms to conduct biological uptake experiments. Over three non-consecutive days, we examined phosphate uptake by the seaweed Ulva lobata at two different stocking densities (2.5 and 4.5 kg wet weight seaweed per 370 L seawater) and in a control tank without seaweed. For each 4-hour experiment, the pFI was calibrated manually before connecting its intake to the 370 L tank. We then spiked the tank to an initial concentration of ~1.80 µmol L-1-PO4 with a concentrated KH2PO4 standard and configured the pFI system to measure phosphate concentrations every 5 mins.
In both silicate and phosphate assays, the concentration of molybdate and acidity of the reaction mixture greatly influences analytical sensitivity and the magnitude of blank signals. Previous research has extensively covered these effects for phosphate (Nagul et al., 2015; Ruzicka et al., 2019), but similar investigations for silicate are limited. Additionally, the role of molybdate and acidity on salt effects has been underexplored in both assays.
Our data reveal a narrow optimal range of acidity for both assays that optimized sensitivity and reduced salt effects across all molybdate concentrations tested (Figure 3). For silicate, doubling the molybdate from 0.5 to 1 mM improved sensitivity by ~30% but this came at the expense of precision, as illustrated by the larger confidence intervals of the slopes at 1 mM molybdate. Furthermore, we observed that the input molybdate reagent for silicate precipitates within a few days of storage at concentrations exceeding 4 mM (> 0.5 mM in flow cell after mixing, Figure 3), regardless of the paired acid concentration.
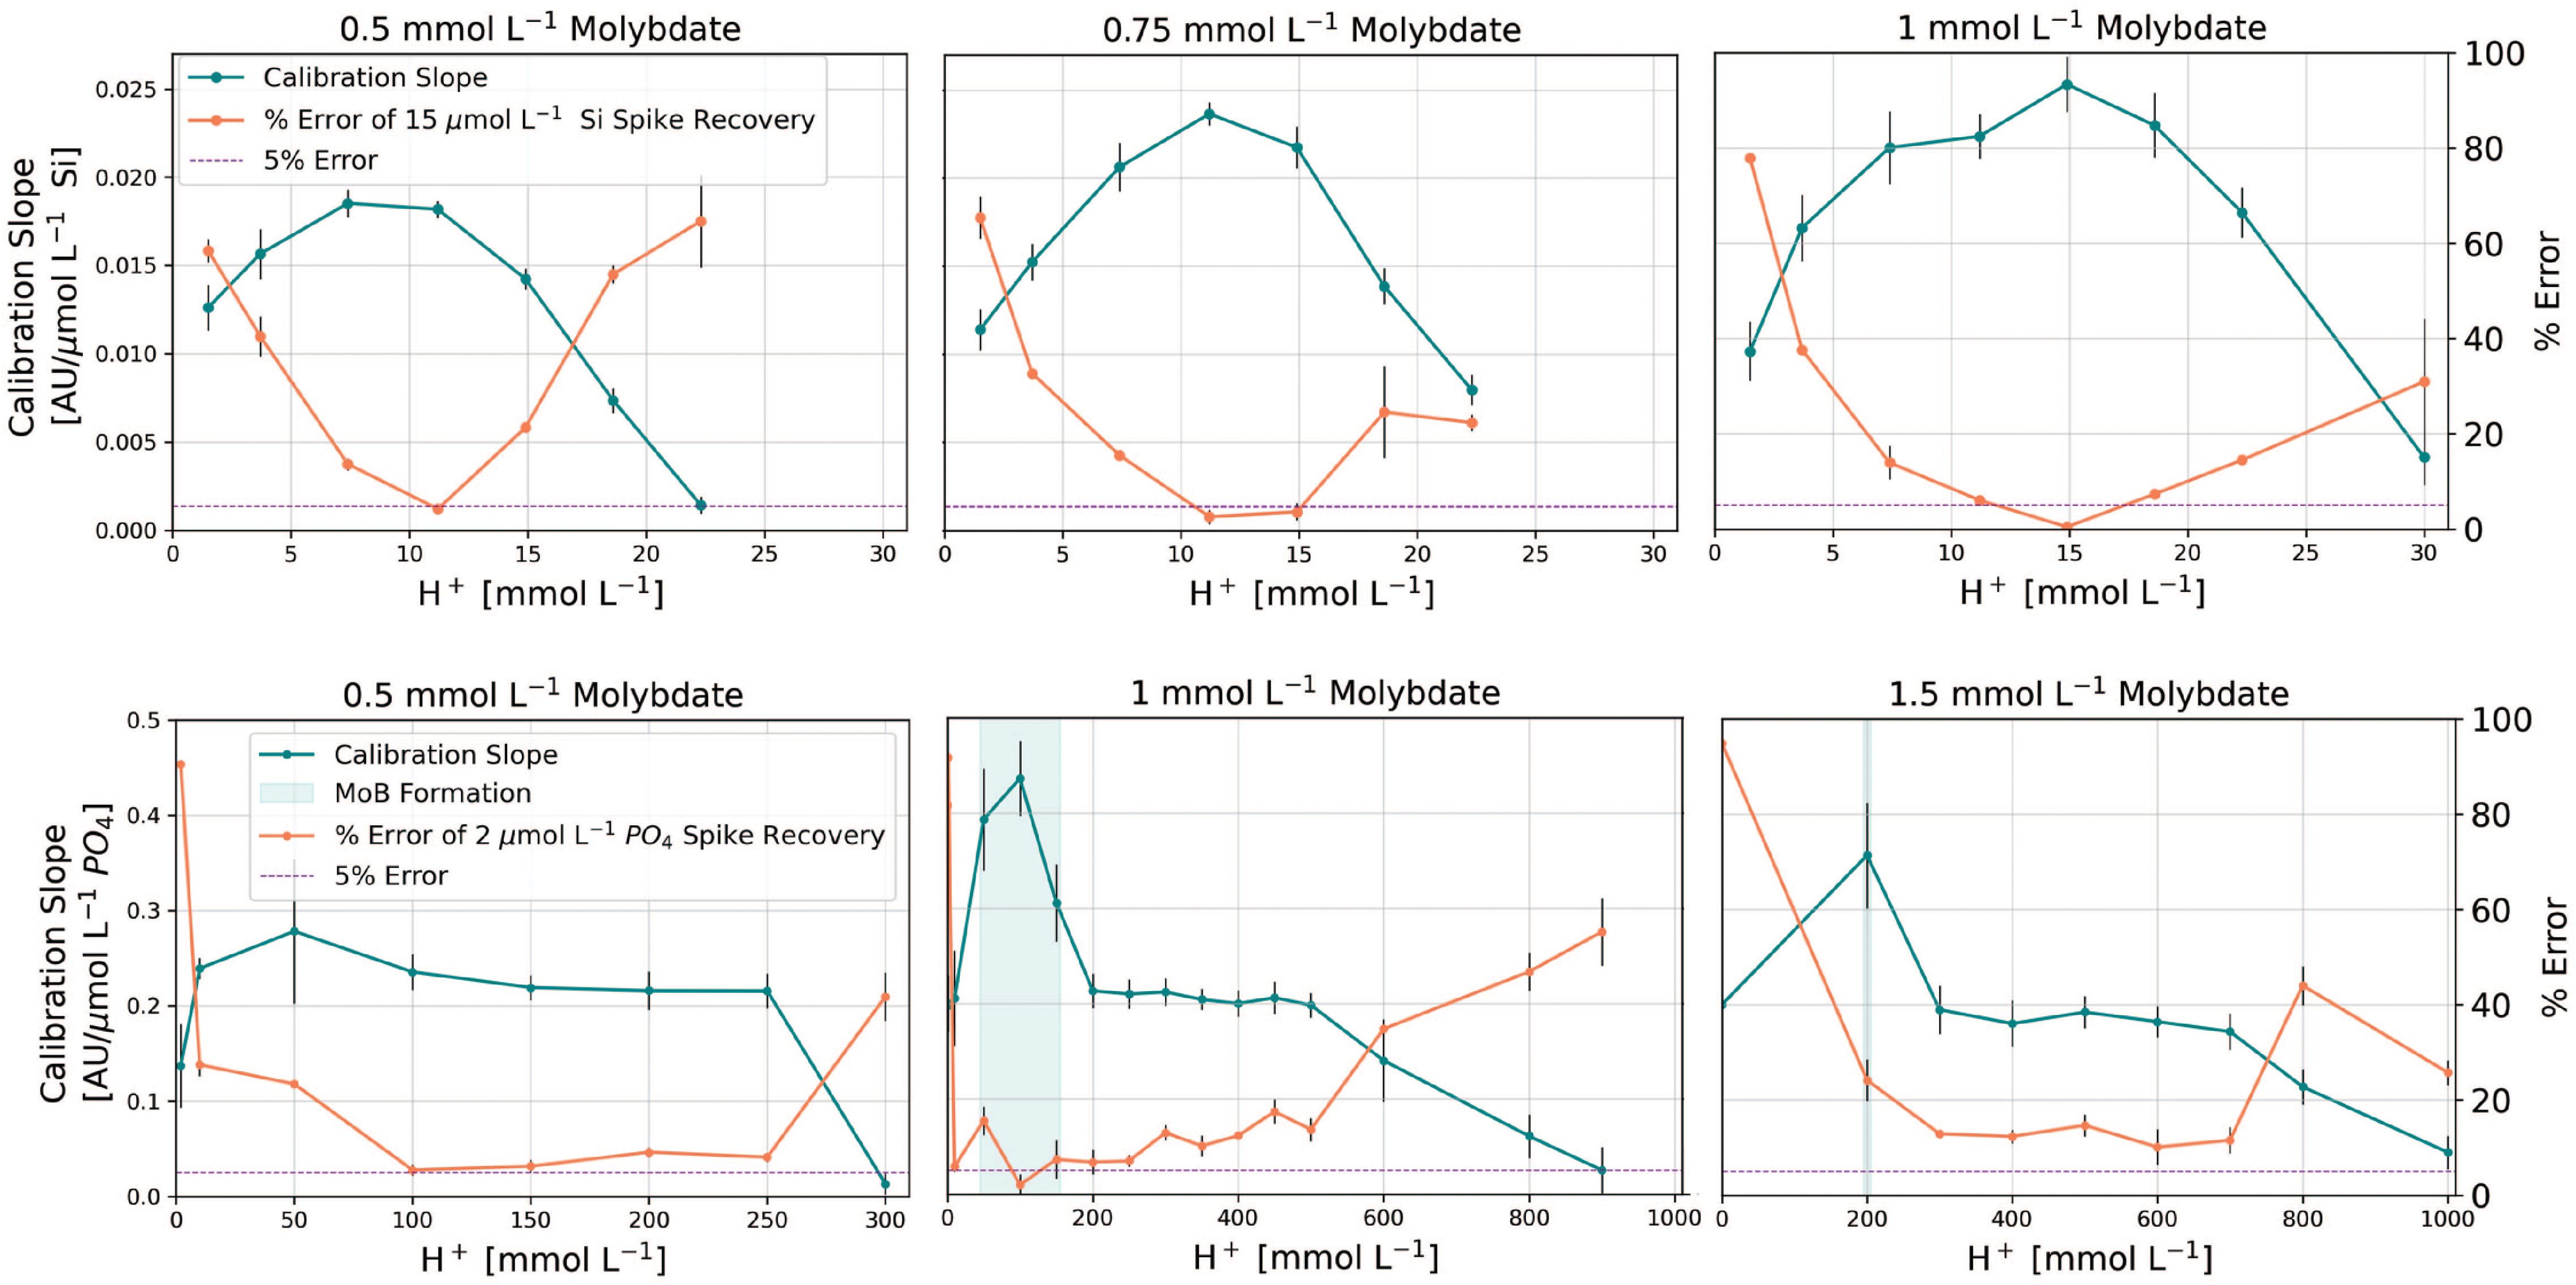
Figure 3 Optimization of molybdate concentration and acidity for silicate (top panel) and phosphate assays (bottom panel). Error bars represent the 95% confidence intervals of calibration slopes and the standard error of replicate spike recoveries. The vertical blue shading in the phosphate panel indicates areas of detrimental molybdenum blue formation. [H+] and molybdate concentration refer to concentrations in the pFI flow cell, after mixing and ignore the acidity contributions from the oxalic and ascorbic acids. Note that Si interferences in the phosphate assay were only evaluated at 0.5 mM molybdate and 150 mM H+.
Given our aim to develop a versatile Si method for diverse applications within the constraints of a 20 cm flow cell, we concluded that 0.5 mM molybdate and 12 mM H+ provided the optimal reaction conditions, striking a balance between sensitivity, input reagent stability and matrix effects (Figure 3). Yet, for benchtop use where the molybdate reagent can be freshly prepared daily, increasing the molybdate concentration in the Si reagent to 0.75 mM would also be appropriate (Figure 3), particularly for samples < 30 µmol L-1- Si. Interestingly and unlike phosphate, we observed that replacing H2SO4 with HCl in the molybdate reagent for silicate amplified the salt error (data not shown).
For the phosphate assay, our results align with Ruzicka et al. (2019) in terms of sensitivity and blank effects when HCl is the source of acidity. However, we newly identify 0.5 mM and 100-150 mM acidity as ideal for reducing salt effects (Figure 3). Notably, any increment in the molybdate concentration beyond 0.5 mM does not enhance sensitivity, instead it merely exacerbates salt errors (Figure 3). In addition, we explored the potential interference from silicate in the phosphate assay, which is particularly sensitive to the concentration of H+ in the reacting mixture (Nagul et al., 2015). We compared the absorbance readings of MQ water standards spiked with 180 µmol L-1 Si to a MQ blank, and the absorbance of a 3.0 µmol L-1 MQ phosphate standard with and without the addition of 180 µmol L-1 Si. The maximum absorbance difference between the treatments containing 3.0 µmol L-1 phosphate with and without 180 µmol L-1 Si added was 0.002 AU at 880 nm (Supplementary Figure S1). This difference corresponds to an apparent phosphate concentration of 0.015 µmol L-1. This value falls within the precision of the assay (4%) and thus does not compromise the accuracy of our phosphate determinations.
Our results further challenge the exclusive use of H+/Mo ratios as an optimization metric for both assays (Nagul et al., 2015; Ruzicka et al., 2019), since various combinations of molybdate and H+ yield the same ratio, yet some combinations are less suitable for seawater analysis. Our optimization work also underscores the previously overlooked role of molybdate and acidity on matrix effects — only a narrow range of acidities result in minimal salt effects. This observation may explain conflicting reports of salt effects in existing methods relying on the molybdenum blue assays for silicate and phosphate analysis (Hansen and Koroleff, 1999; Grand et al., 2017; Deng et al., 2020; Hatta et al., 2021; Fang et al., 2022a), although variations in sample to reagent ratios and analytical configurations undoubtedly contribute.
The optimization work outlined previously identified the most suitable molybdate-acid pairs that minimized salt effects — an important consideration for the analysis of samples of varying salinity. However, this screening process — using LNSW samples with a known analyte concentration against a MQ calibration curve — does not confirm that a MQ calibration curve can be applied to seawater samples. Instead, the decision requires careful inspection of the slopes and intercepts of calibration curves obtained using standards prepared in MQ and LNSW, as depicted in Figure 4.
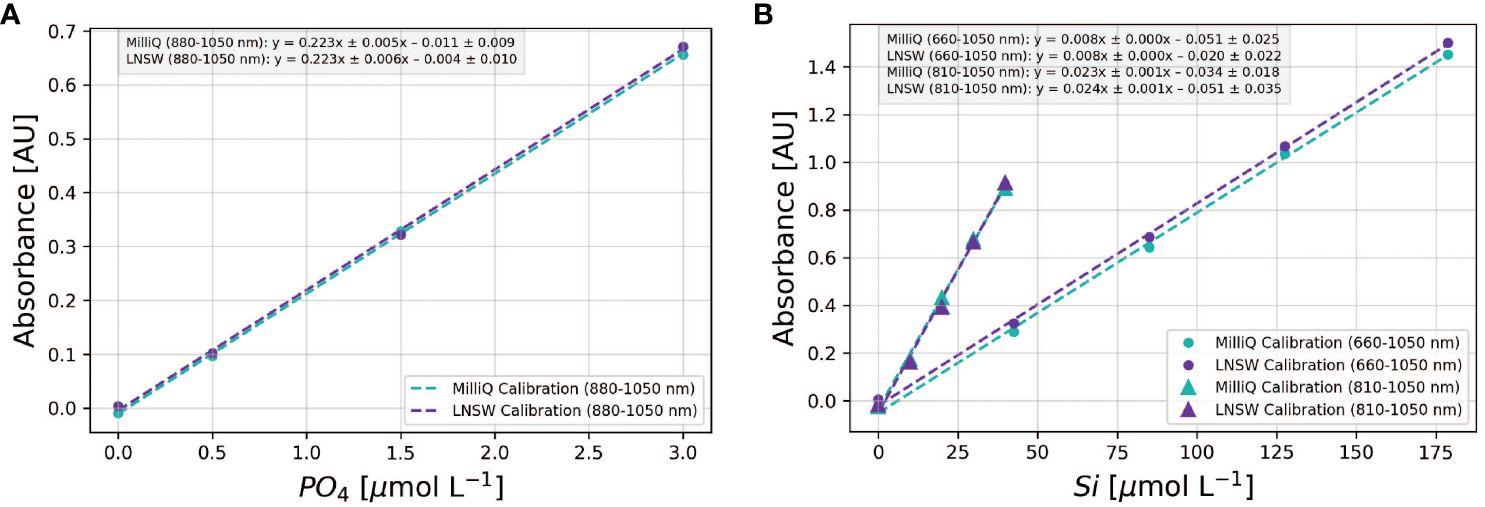
Figure 4 Comparison of MQ vs LNSW calibrations for phosphate (A) and silicate (B). For the Si assay, two wavelengths are employed: 810-1050 nm for [Si] < 40 µmol L-1 and 660-1050 nm for [Si] > 40 µmol L-1. Each symbol denotes the mean absorbance from triplicate standard measurements, and the dashed lines depict the corresponding linear regression fits. The linear regression equations for each calibration curve, along with uncertainties representing the 95% confidence intervals of the slopes and intercepts, are shown in the legend insert.
For phosphate, calibration slopes obtained in MQ and LNSW can be identical, indicating consistent PMoB formation rates in both matrices. Yet, a marked difference was observed in the intercepts, with the MQ calibration from this example showing a significantly lower value (Figure 4A). This difference of 6.1 mAU, termed the matrix blank (Hatta et al., 2021, 2023), will introduce a positive offset of ~0.03 µmol L-1-PO4 when applying the MQ calibration to seawater samples. For silicate, the 95% confidence intervals of the slopes and intercepts in MQ and LNSW overlapped at 880-1050 nm (< 40 µmol L-1- Si). At 660 nm, the calibration intercept in MQ water was significantly lower than in LNSW (Figure 4A), suggesting that a LNSW calibration is preferable when analyzing high Si concentration samples at 660 nm (>40 µmol L-1- Si). Thus, the decision to apply a MQ water calibration for seawater samples hinges on the accuracy requirements of the application and anticipated sample concentrations. While errors stemming from the application of MQ calibrations to seawater samples may be corrected (see Hatta et al. (2021, 2023)), this adjustment assumes constant slopes and intercept ratios between MQ and LNSW calibrations. The long-term validity of this assumption remains to be tested.
The long-term stability of reagents and standards is a critical consideration for long-term autonomous deployments. Although a range of wet chemical analyzers suitable for long-term deployments are commercially available, literature on reagent longevity is limited. To the best of our knowledge, Li et al. (2019) is the only study that evaluated reagent preservation methods for the colorimetric reagents of the phosphomolybdenum blue assay. Their findings, however, may have limited applicability since their input reagents were markedly more concentrated than ours. In addition, the stability of the silicate reagents, including the oxalic acid, has never been reported.
The ascorbic acid reagent is the most susceptible to degradation, since it can be oxidized by light, heat, transition metal ions contaminants and alkaline conditions (Yin et al., 2022). For instruments containing acrylic manifolds (e.g., Grand et al. (2017) and this work), a surfactant must be included in the ascorbic acid reagent to maintain the linearity and sensitivity of the phosphate assay. This requirement presents an additional challenge when input reagents are exposed to ambient temperatures during unattended deployments, since the optimal surfactant for the pFI phosphate assay, Sodium Dodecyl Sulfate (SDS), precipitates at high concentrations and temperatures below 15°C (Adornato et al., 2007; Clinton-Bailey et al., 2017). For this reason, we lowered the SDS concentration in the ascorbic acid input reagent from the 170 mM originally used by Hatta et al. (2021, 2023) to 8.7 mM. This modification effectively prevented SDS precipitation over two months of cold storage in a refrigerator (5-10°C), without compromising analytical performance (data not shown).
After adjusting the SDS concentration in the ascorbic acid reagent, we proceeded to evaluate the stability of the colorimetric reagents across a temperature range of 7-24°C. At all temperatures tested, the calibration slopes obtained using ascorbic acid/SDS reagents incubated for up to 52 days remained within 10% of the initial values (Figure 5A). We note that aged ascorbic acid reagent solutions exhibited signs of oxidation, evident from a yellow coloration that induced a noticeable elevation in absorbance spectra near 400-500 nm. However, since this waveband does not overlap with any of the wavelengths used in both assays (660, 880, 810 and 1050 nm), analytical performance was not compromised. Thus, our experiments suggest that the complex ascorbic acid preservation methods outlined by Li et al. (2019) are unnecessary when the ascorbic acid is combined with SDS and shielded from light in a sealed storage bag within 7-25°C.
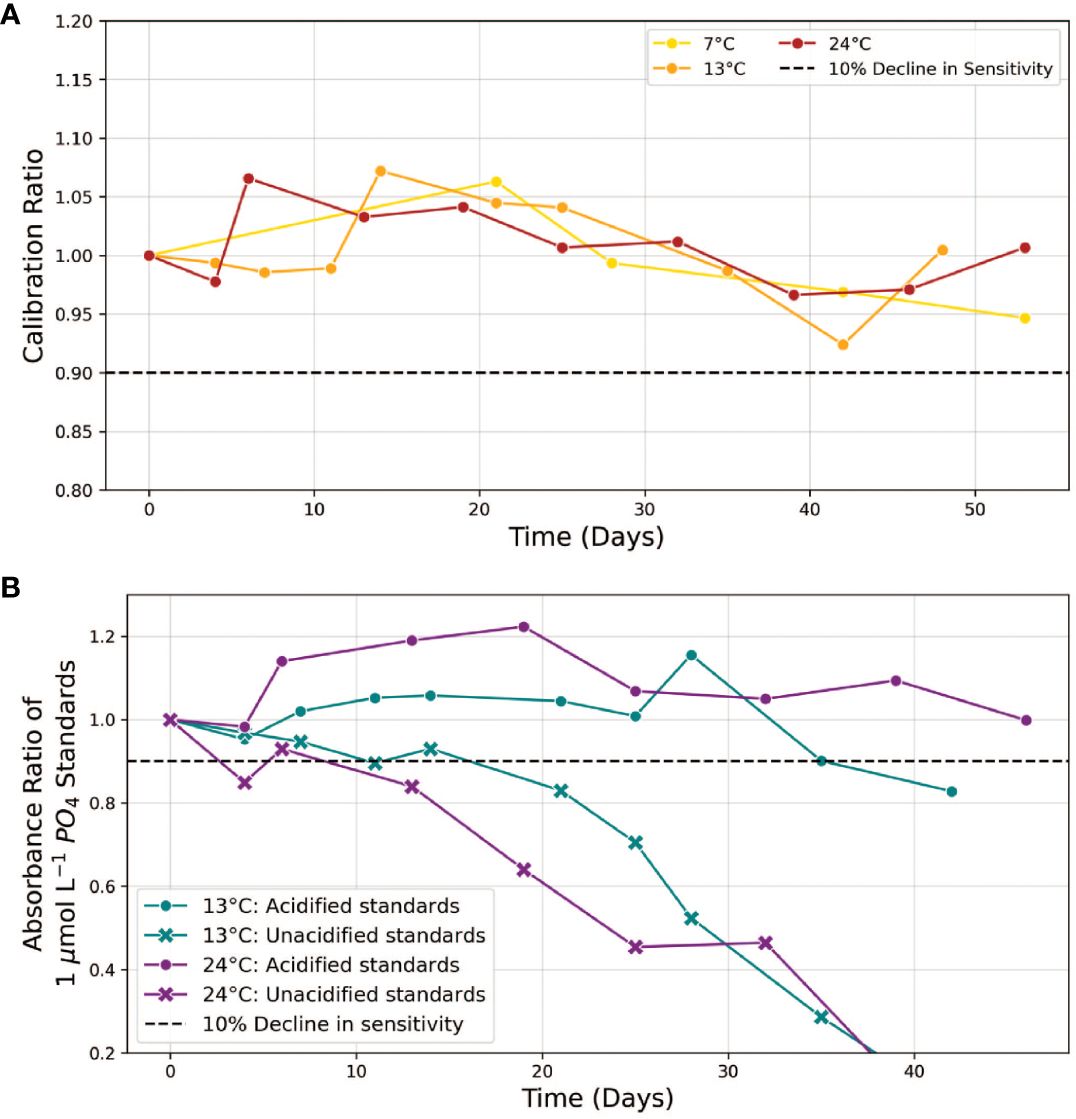
Figure 5 (A) Stability of ascorbic acid/sodium dodecyl sulphate input reagent. The “Calibration Ratio” is defined as the slope of the phosphate calibration curve obtained with the aged solution at a given time point, normalized to the initial slope (t=0) when the reagent was freshly prepared. Measurements were conducted over a period of up to 52 days at temperatures of 7, 13 and 24°C. (B) stability comparison of 1 µmol L-1 phosphate standards, acidified vs unacidified, at 13 and 24°C. The “Absorbance Ratio” refers to the absorbance of aged standards at time t relative to their initial absorbance (t=0). Dashed lines indicate our 10% stability threshold.
Both molybdate solutions, when stored as specified for up to 42 days, maintained analytical sensitivity within 10% of initial values. In fact, in a separate experiment, our optimized formulation for the input molybdate reagent for Si — characterized by a reduced Mo concentration (< 4 mM) to prevent precipitation and complete loss of sensitivity—remained within our 10% threshold at 10°C for up to 92 days and so did the oxalic acid (Supplementary Figure S2). However, because our experiments were primarily focused on analytical sensitivity, we did not evaluate if the aging of oxalic acid affects its ability to prevent the reduction of excess molybdates and/or decomposition of interfering phosphomolybdic complexes.
While the colorimetric reagents met our stability threshold for at least 42 days, the absorbance of 1.0 µmol L-1 phosphate standards prepared in MQ water declined by more than 10% within 5-10 days (Figure 5B). This behavior, which indicates analyte loss from the solution, likely arises from the adsorption of phosphorus anions on the walls of plastic and glass storage bottles (Hassenteufel et al., 1963; Zhu and Ma, 2020). In our study, utilizing flexible storage bags made of ethylene vinyl acetate (EVA), we observed this adsorption loss to occur at a rate of approximately 20 nmol L-1 phosphate per day. An established strategy to reduce these adsorption losses involves acidifying the standards to a pH of 2 (Grand et al., 2017). The addition of acid shifts phosphorus speciation towards the fully protonated phosphoric acid (H3PO4), reducing the proportion of charged, absorbable anions—specifically H2PO4−in the working standards. Figure 5B confirms that acidification to pH 2 effectively minimized adsorption losses at all temperatures tested for up to 35 days. Using acidified standards (13.3 mM H+) to calibrate the instrument does not significantly impact the accuracy of phosphate determinations in unacidified samples (Supplementary Figure S3). This is also supported by the constant level of sensitivity of the phosphate assay at H+ concentrations ranging from 150 to 200 mM in the presence of 0.5 mM molybdate (Figure 3).
In contrast to phosphate, the Si assay’s sensitivity to H+ concentration precludes the use of acidified Si standards. Specifically, any increase in acidity beyond the optimized concentration of 11.2 mM H+ will lead to a significant decrease in analytical sensitivity and greater than 5% errors when applying a MQ calibration curve for seawater sample analysis (Figure 3). However, since the predominant Si species at pH 5.6 (=MQ pH) is uncharged (H4SiO4), silicate standards prepared in MQ water should suffer fewer adsorption losses than phosphate.
In summary, our reagent stability experiments demonstrate the durability of the colorimetric reagents in both pFI assays, including the ascorbic acid, which does not require specific treatment to prolong its reduction efficiency. The longevity of the reagents meets the needs for unattended pFI deployments at mid-latitude shore-stations or underway shipboard applications with monthly servicing intervals. Acidifying the working standards to pH 2 is a practical strategy to minimize adsorption losses for phosphate. However, more work is needed to confirm the stability of unacidified silicate standards.
To evaluate the accuracy of the pFI phosphate assay with MQ calibration, we analyzed four KANSO RMNS (Table 1). This analysis indicated that the pFI phosphate assay achieves acceptable accuracy but exhibits a consistent positive bias of approximately 5% for the most concentrated reference material (~ 3.0 µmol L-1 Kanso CN, Table 1). Following the NordTest™ approach outlined in Birchill et al. (2019), we estimate that the combined uncertainty (uc) of our pFI phosphate assay is approximately 4.5% (k=1) at phosphate concentrations ranging from 0.4-3.0 µmol L-1 (Table 1).
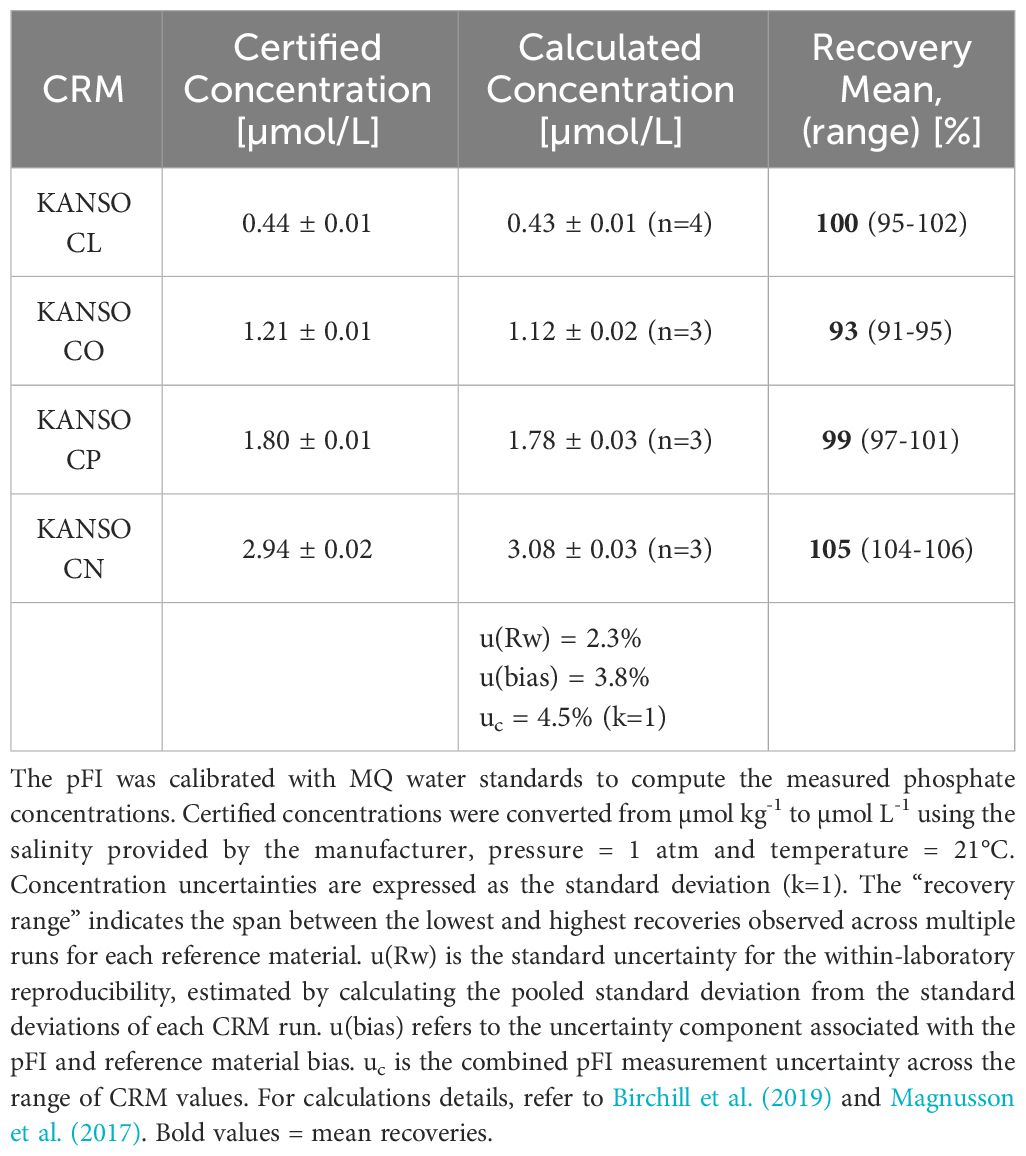
Table 1 Measured and certified phosphate concentrations of certified reference materials analyzed with pFI in the laboratory.
At the HOTS site on the RV Kilo Moana in September 2022, the pFI analyzer—calibrated using MQ water standards—produced an oceanographically consistent phosphate profile that, except for the deepest samples, fell within the range defined by the 5th and 95th quantiles of the 32-year historical data (Figure 6A). Of the 37 discrete samples analyzed, one from 60 m fell below the limit of detection (60 nM). Additionally, three deep water samples showed positive inconsistencies of about 0.1 µmol L-1 relative to their immediate neighboring depths and were therefore considered outliers. The pFI analytical precision, defined as the mean relative standard deviation of triplicate analyses of samples > 0.1 µmol L-1 PO4, was 4.1%.
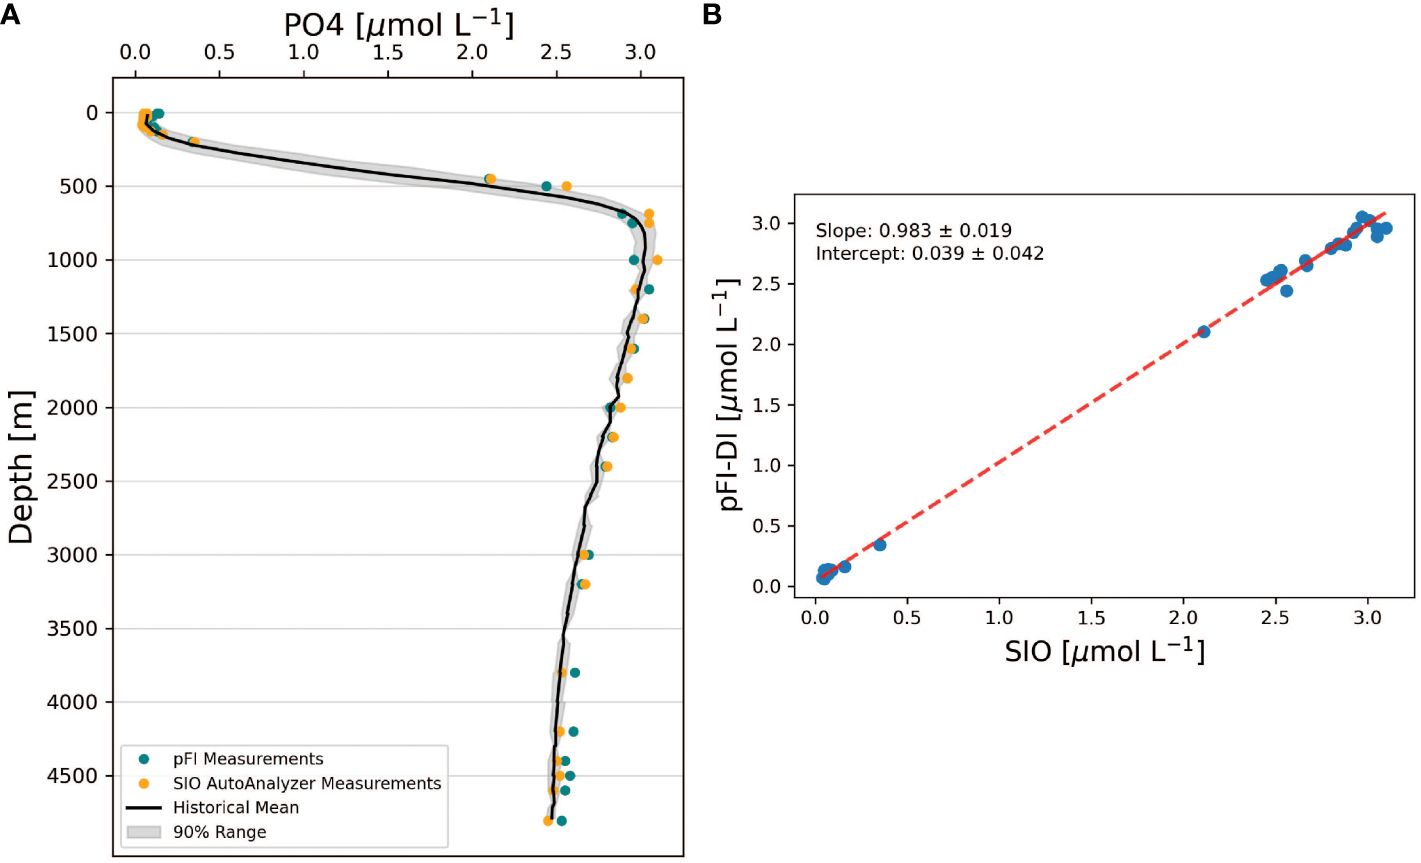
Figure 6 (A) Comparison of pFI and SIO phosphate vertical profiles at HOTS. The black line denotes the 32-year historical mean, binned at 50 m intervals. The grey shading outlines the range between the 5th and 95th percentiles of historical observations, encompassing 90% of the historical range. (B) Correlation analysis between SIO vs pFI data at HOTS. The dashed line represents the Type II linear regression between SIO and pFI. The uncertainties in the slope and intercept of this regression are expressed as the 95% confidence intervals for both parameters. Historical HOTS data retrieved from https://hahana.soest.hawaii.edu/hot/.
The full depth pFI and SIO vertical profiles were statistically undistinguishable since the 95% confidence intervals of the slope and intercept included one and zero, respectively (Figure 6B, n=30 pairs). However, a closer examination at the pFI and SIO profiles reveals two noteworthy differences (Figure 6A). First, the pFI measurements were biased high at depths >3,500 m relative to SIO, with a mean difference of 0.07 µmol L-1 PO4 (paired t-test, t=13.5, p < 0.01, n=6). This bias, which is consistent with the analysis of the most concentrated CRM (Table 1), is unlikely the result of an unidentified Si interference in the pFI phosphate assay. Indeed, the SIO and pFI profile phosphate data were similar at 1,600-3,200 m (paired t-test, t=0.64, p = 0.54, n=7) — a depth range where Si concentrations mirrored those > 3,500 m (~150 µmol L-1 Si). Second, in the upper 125 m, the pFI data exceeded SIO by an average of 0.04 µmol L-1 (paired t-test, t=5.19, p < 0.01, n=8). The surface water bias (< 125 m) likely stems from the previously described matrix blank in MQ calibration curves, but the extent of the deep-water bias (> 3,500 m) observed at HOTS suggests additional factors beyond just MQ calibration errors.
In June 2023 aboard the RV Investigator in the Southern Ocean, the pFI analyzer successfully analyzed eight, 36-depth profiles for PO4 and Si. Here we will focus exclusively on the SOTS Si profile, while the remaining data will be reserved for a separate publication focusing on the International Nutrient Intercomparison Voyage (INIV). Given that INIV’s primary focus on determining global uncertainties in shipboard nutrient measurements, we calibrated the pFI analyzer with LNSW and analyzed all samples in triplicate. Analytical precision was less than 4.8% at 660 nm (>40 µmol L-1 Si) and better than 6.0% at 880-1050 nm (<40 µmol L-1 Si). In the 880-1050 nm dataset, nine replicates were identified as outliers and excluded. These outliers consistently appeared as the first replicate following the analysis of concentrated CRM samples, which were included in the analytical sequence every 13 samples. This pattern indicates a carryover effect that could not be resolved during INIV, as the constant influx of samples from the cruise left us no time to address the issue. However, subsequent laboratory work demonstrated that adding 0.25% (w:v) Sodium Dodecyl Sulphate (SDS) surfactant to the MQ carrier effectively eliminates this carryover (data not shown). Without SDS in the carrier, the ascorbic acid/SDS reagent introduced during the analytical sequence reduces both the silicomolybdic acid in the current sample and any residual silicomolybdic acid that may have adhered to the instrument tubing walls from the previous sample. Adding SDS to the carrier prevents silicomolybdic acid from adhering to the tubing walls, thereby eliminating carryover.
At the time of writing, Si data from a reference method at SOTS, run in parallel with the pFI, were not available. Nevertheless, examining the SOTS historical average (1995-2013, 73 occupations) and the Kanso RMNS results run concurrently with the SOTS samples via pFI, can still provide insights on the shipboard accuracy of the pFI Si assay. The general shape of the pFI Si profile mostly aligned with the historical mean, but 13 out of the 35 pFI-analyzed samples fell outside the 90% historical range at SOTS (Figure 7). Below 2,300 m, where limited temporal variability in Si concentrations is anticipated, the mean difference from the historical mean was 2.3%. In the upper 1,000 m, the pFI data trended below the historical mean. Although inter-annual variability in Si concentrations within the main thermocline makes it challenging to establish the accuracy of the pFI analyzer solely from the historical mean, the RMNS analysis appears to confirm a negative bias of 3-6% at Si concentrations matching those observed in the upper 1,000 m at SOTS (Table 2). Using the Kanso RMNS data obtained concurrently with the Si SOTS profile (Table 2), we estimate a preliminary combined uncertainty (uc) of 6.2% (k=1). As mentioned above, adding SDS surfactant to the MQ carrier solution to eliminate carryover may reduce the within laboratory reproducibility (u(Rw)) and further improve the combined uncertainty.
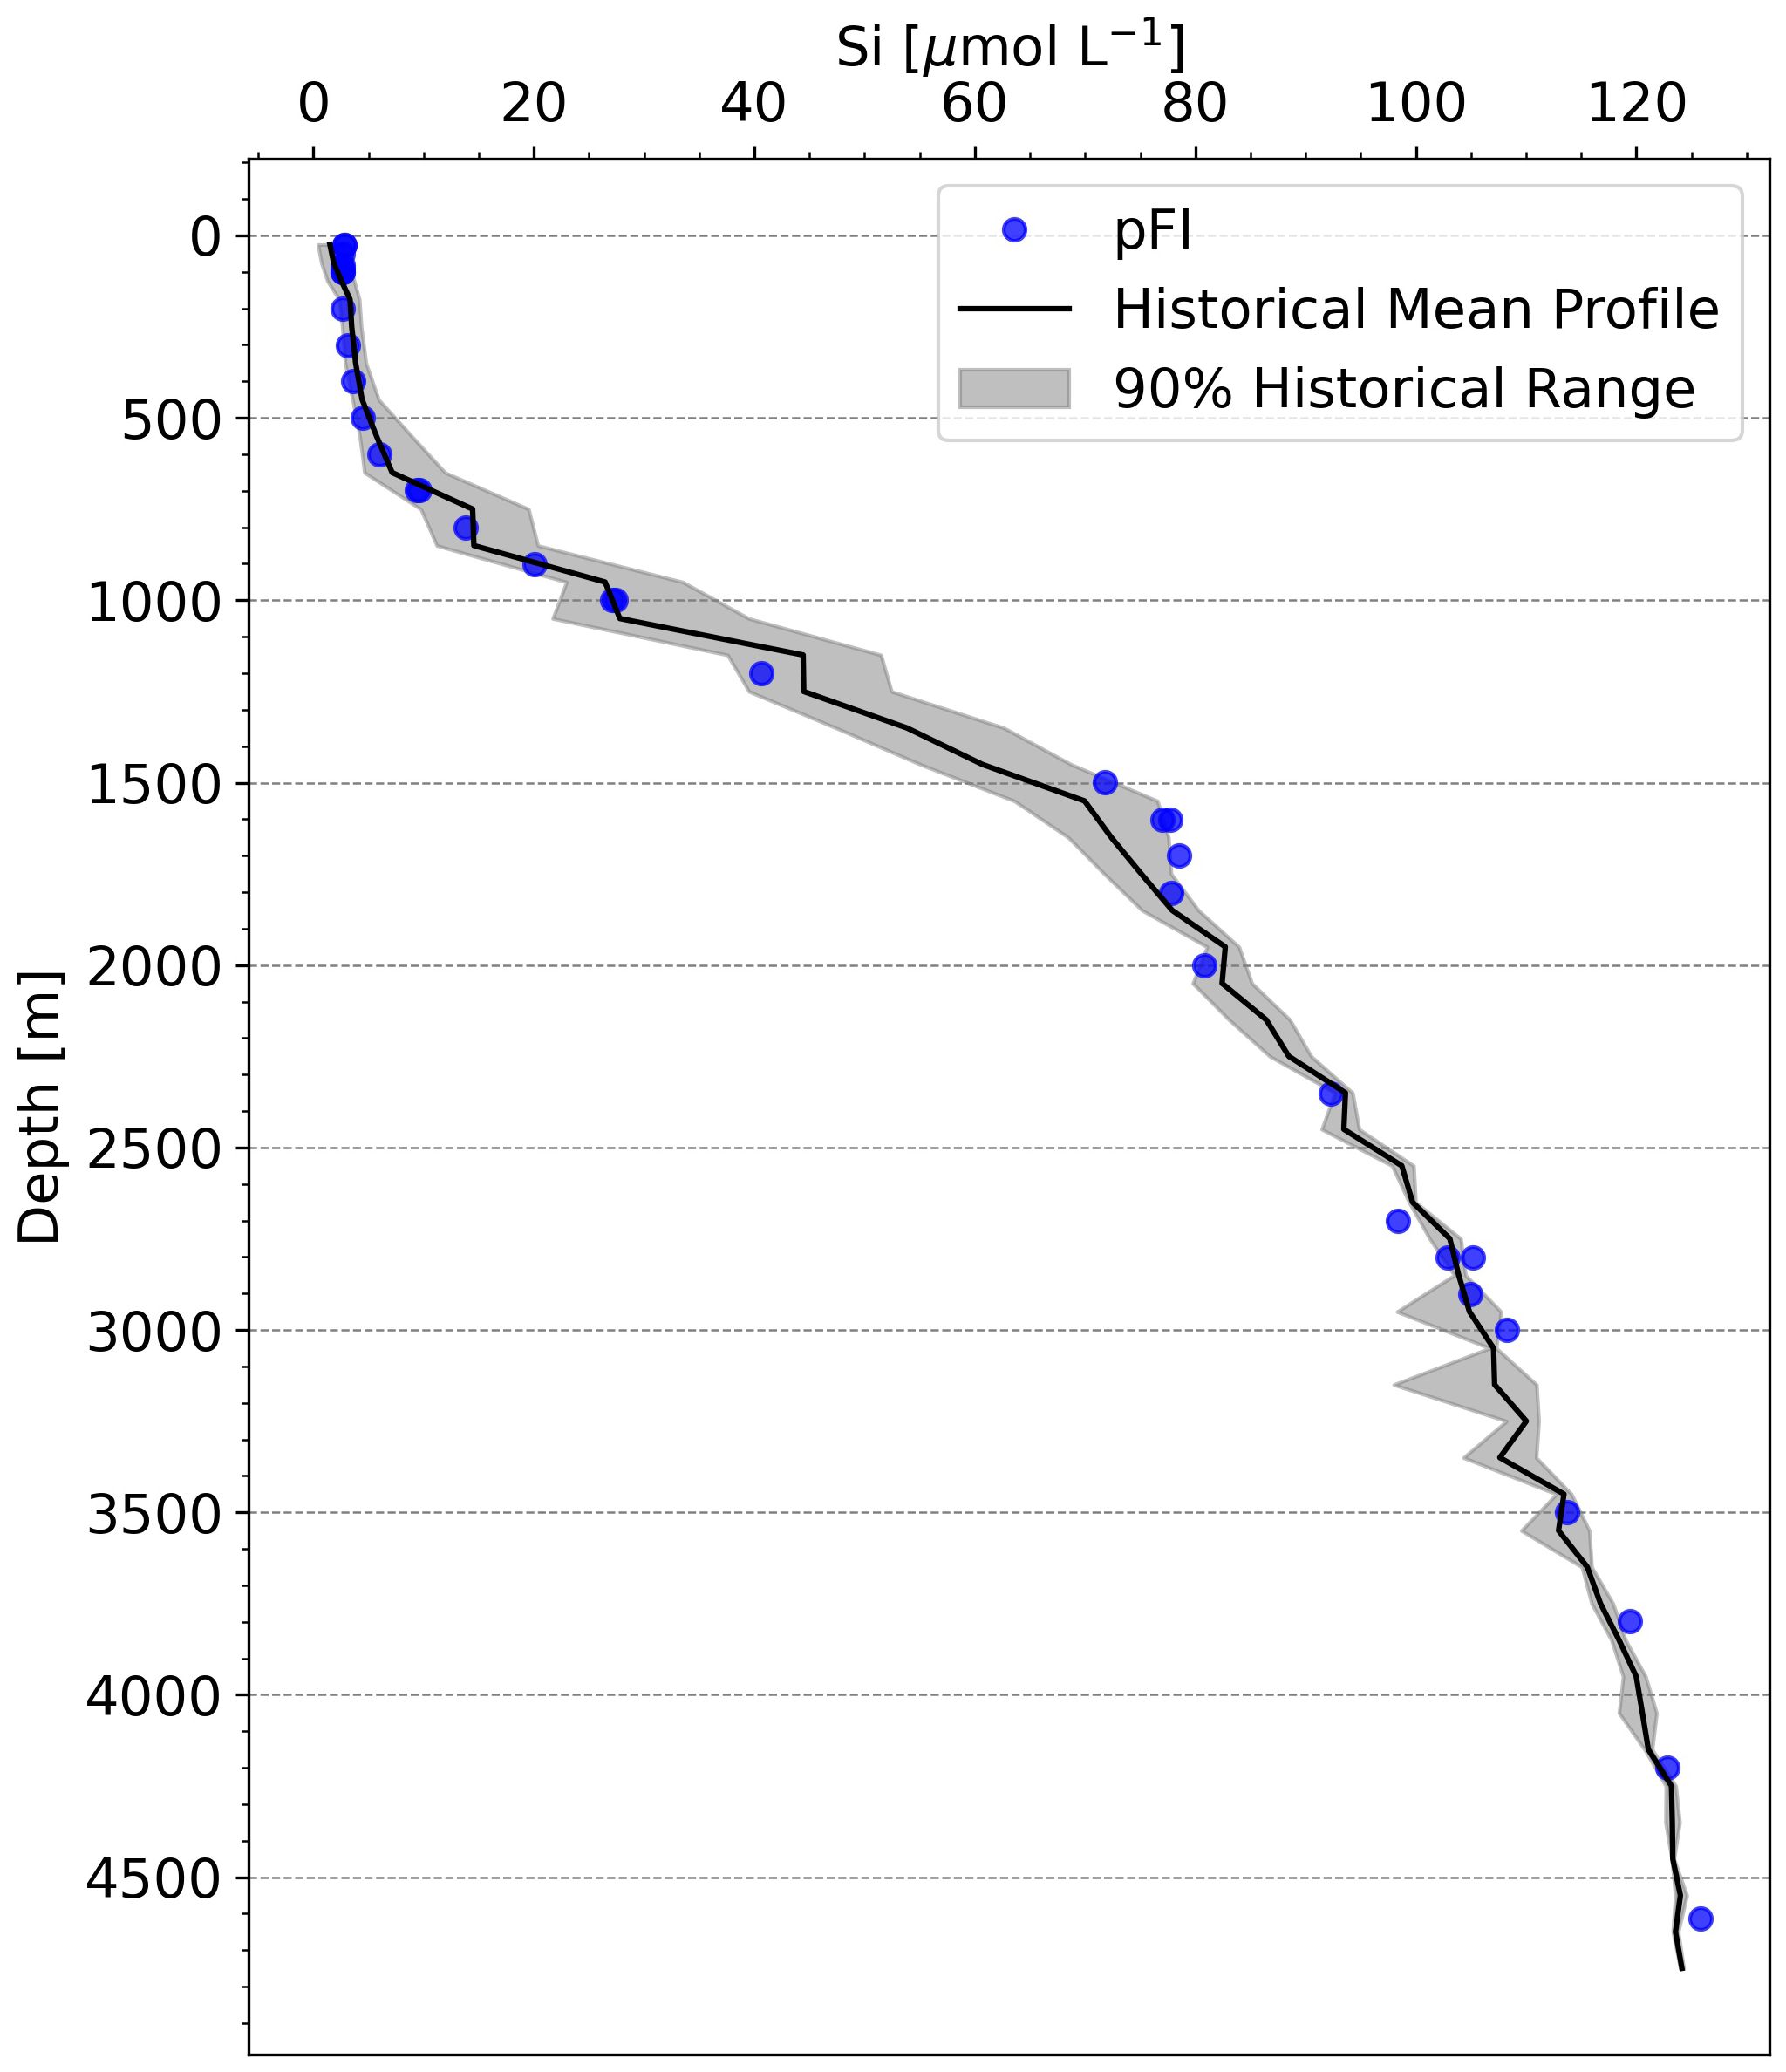
Figure 7 Comparison of pFI and historical Si vertical profiles at SOTS. The black line denotes the 28-year historical mean, with data binned at 50 m intervals in the upper 200 m and at 100 m intervals below this depth. The grey shading indicates the range between the 5th and 95th percentiles of historical observations, representing the spread of 90% of the historical measurements at SOTS. Historical SOTS data retrieved from the CSIRO data portal: https://data.csiro.au.
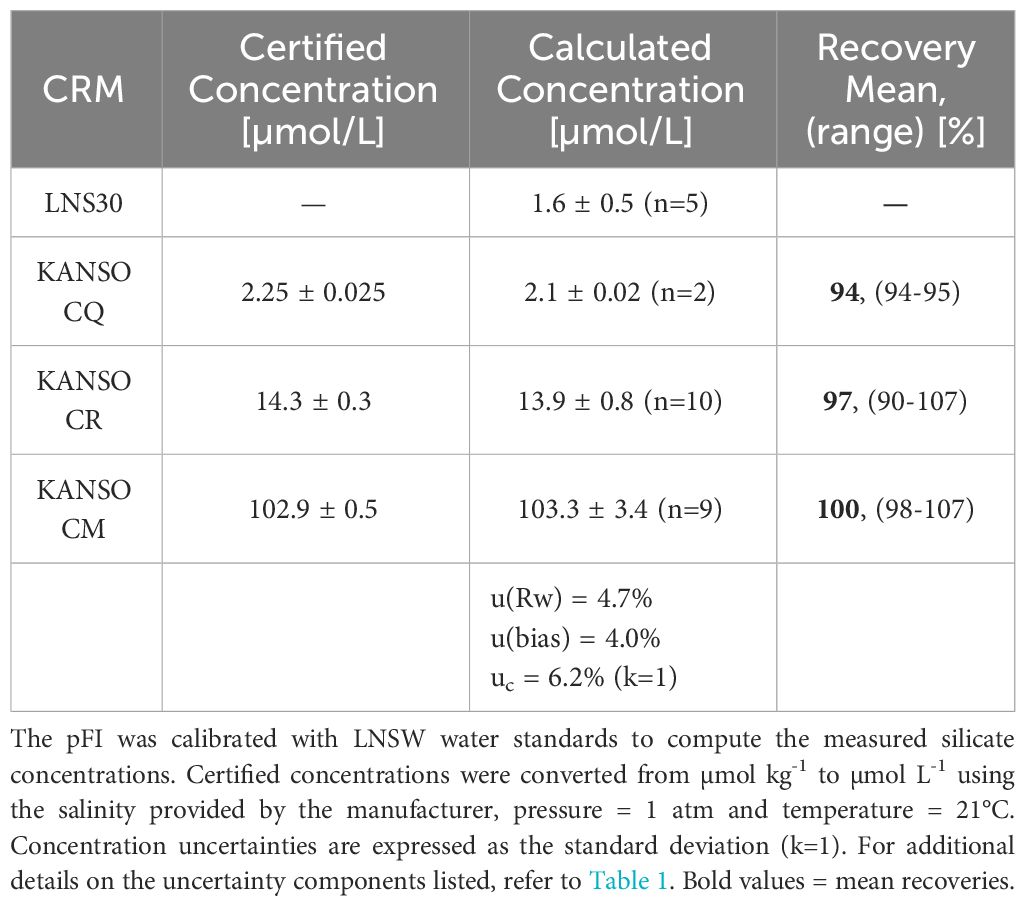
Table 2 Measured and certified silicate concentrations of certified reference materials analyzed during the SOTS profile run on INIV.
Table 3 summarizes the optimized reaction parameters and figures of merit of both pFI assays. The detection limits, defined as three times the standard deviation of LNSW or MQ samples (n=6), were 0.06 µmol L-1 for phosphate and 0.2 µmol L-1 for silicate. These values are comparable to those reported for other portable flow-based nutrient analyzers capable of multi analyte determinations (Thouron et al., 2003; Deng et al., 2020; Zhu and Ma, 2020; Fang et al., 2022a, Fang et al., 2022b). Sample throughput for simultaneous analysis of phosphate and silicate on the same sample is approximately 11 hr-1, with a precision (RSD) < 6% for both analytes across their working range. The relative combined uncertainties of the pFI assays (k=1), which encompass both bias and random errors, were 4.5% and 6.2% for phosphate and silicate, respectively (Tables 1, 2). These values, which are likely underestimated given the limited temporal data span used to estimate within laboratory reproducibility (u(Rw)), are comparable to that obtained with benchtop phosphate Lab-On-Chip analyzers and, unsurprisingly, higher than that of segmented nutrient auto-analyzers characterized with decades worth of use in oceanography (Birchill et al., 2019).
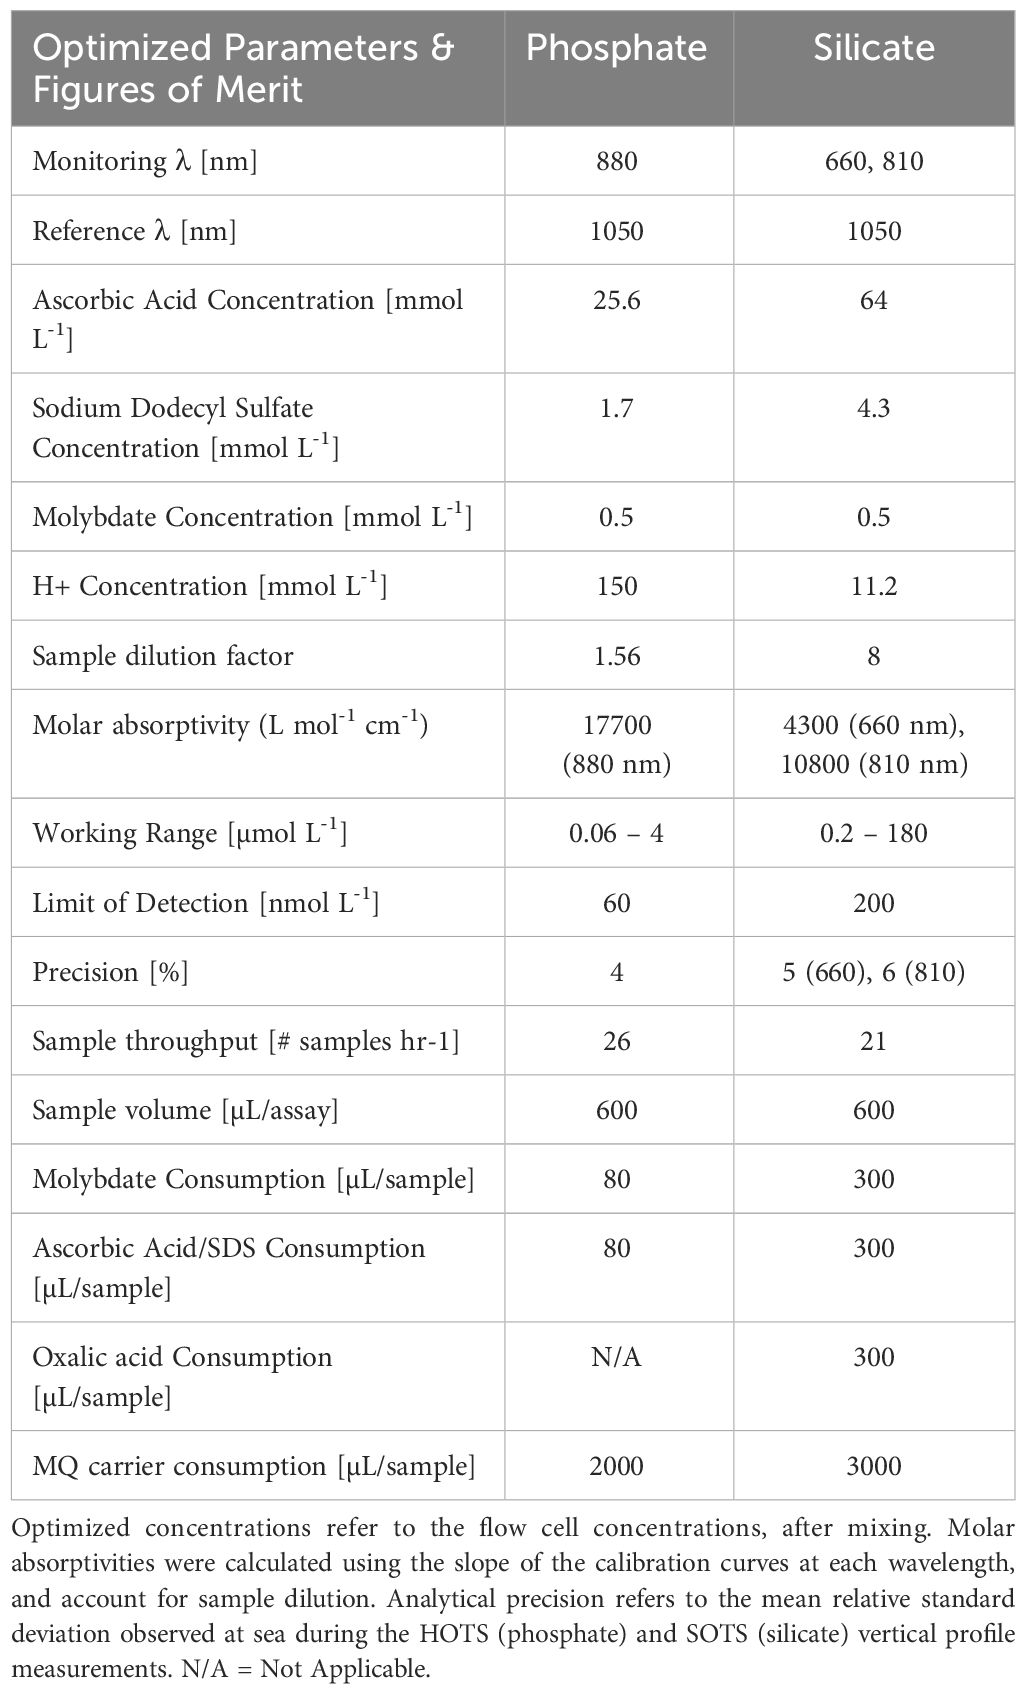
Table 3 Summary of pFI optimized parameters, figures of merit and reagent consumption rates.
Having established the durability of the reagents and the analytical performance of our newly optimized pFI assays under controlled laboratory conditions with human oversight, we performed a series of pilot autonomous deployments to demonstrate the capabilities of pFI for autonomous analysis. These short-term deployments, lasting less than a week, were conducted at a coastal shore station, a commercial seaweed aquaculture facility and aboard a research vessel as a “FerryBox” type system. Our intention is not to provide a rigorous evaluation of the long-term capabilities of pFI analyzers. Rather, we aim to showcase the versatility and unique benefits of pFI analyzers for autonomous nutrient analysis, setting the stage for future, more ambitious autonomous deployments and comprehensive performance evaluations.
Throughout the 6-day deployment, the pFI analyzer operated without interruptions, successfully analyzing 121 samples with concentrations ranging from 1.0 to 2.4 µmol L-1 PO4. Three samples were flagged and excluded from the time series presented in Figure 8 due to the occasional presence of air in the station seawater intake pipe. The relative standard deviation of the slopes of the calibration curves was 4.7% without a consistent temporal trend, suggesting minimal drift or temperature effects on analytical sensitivity throughout the deployment.
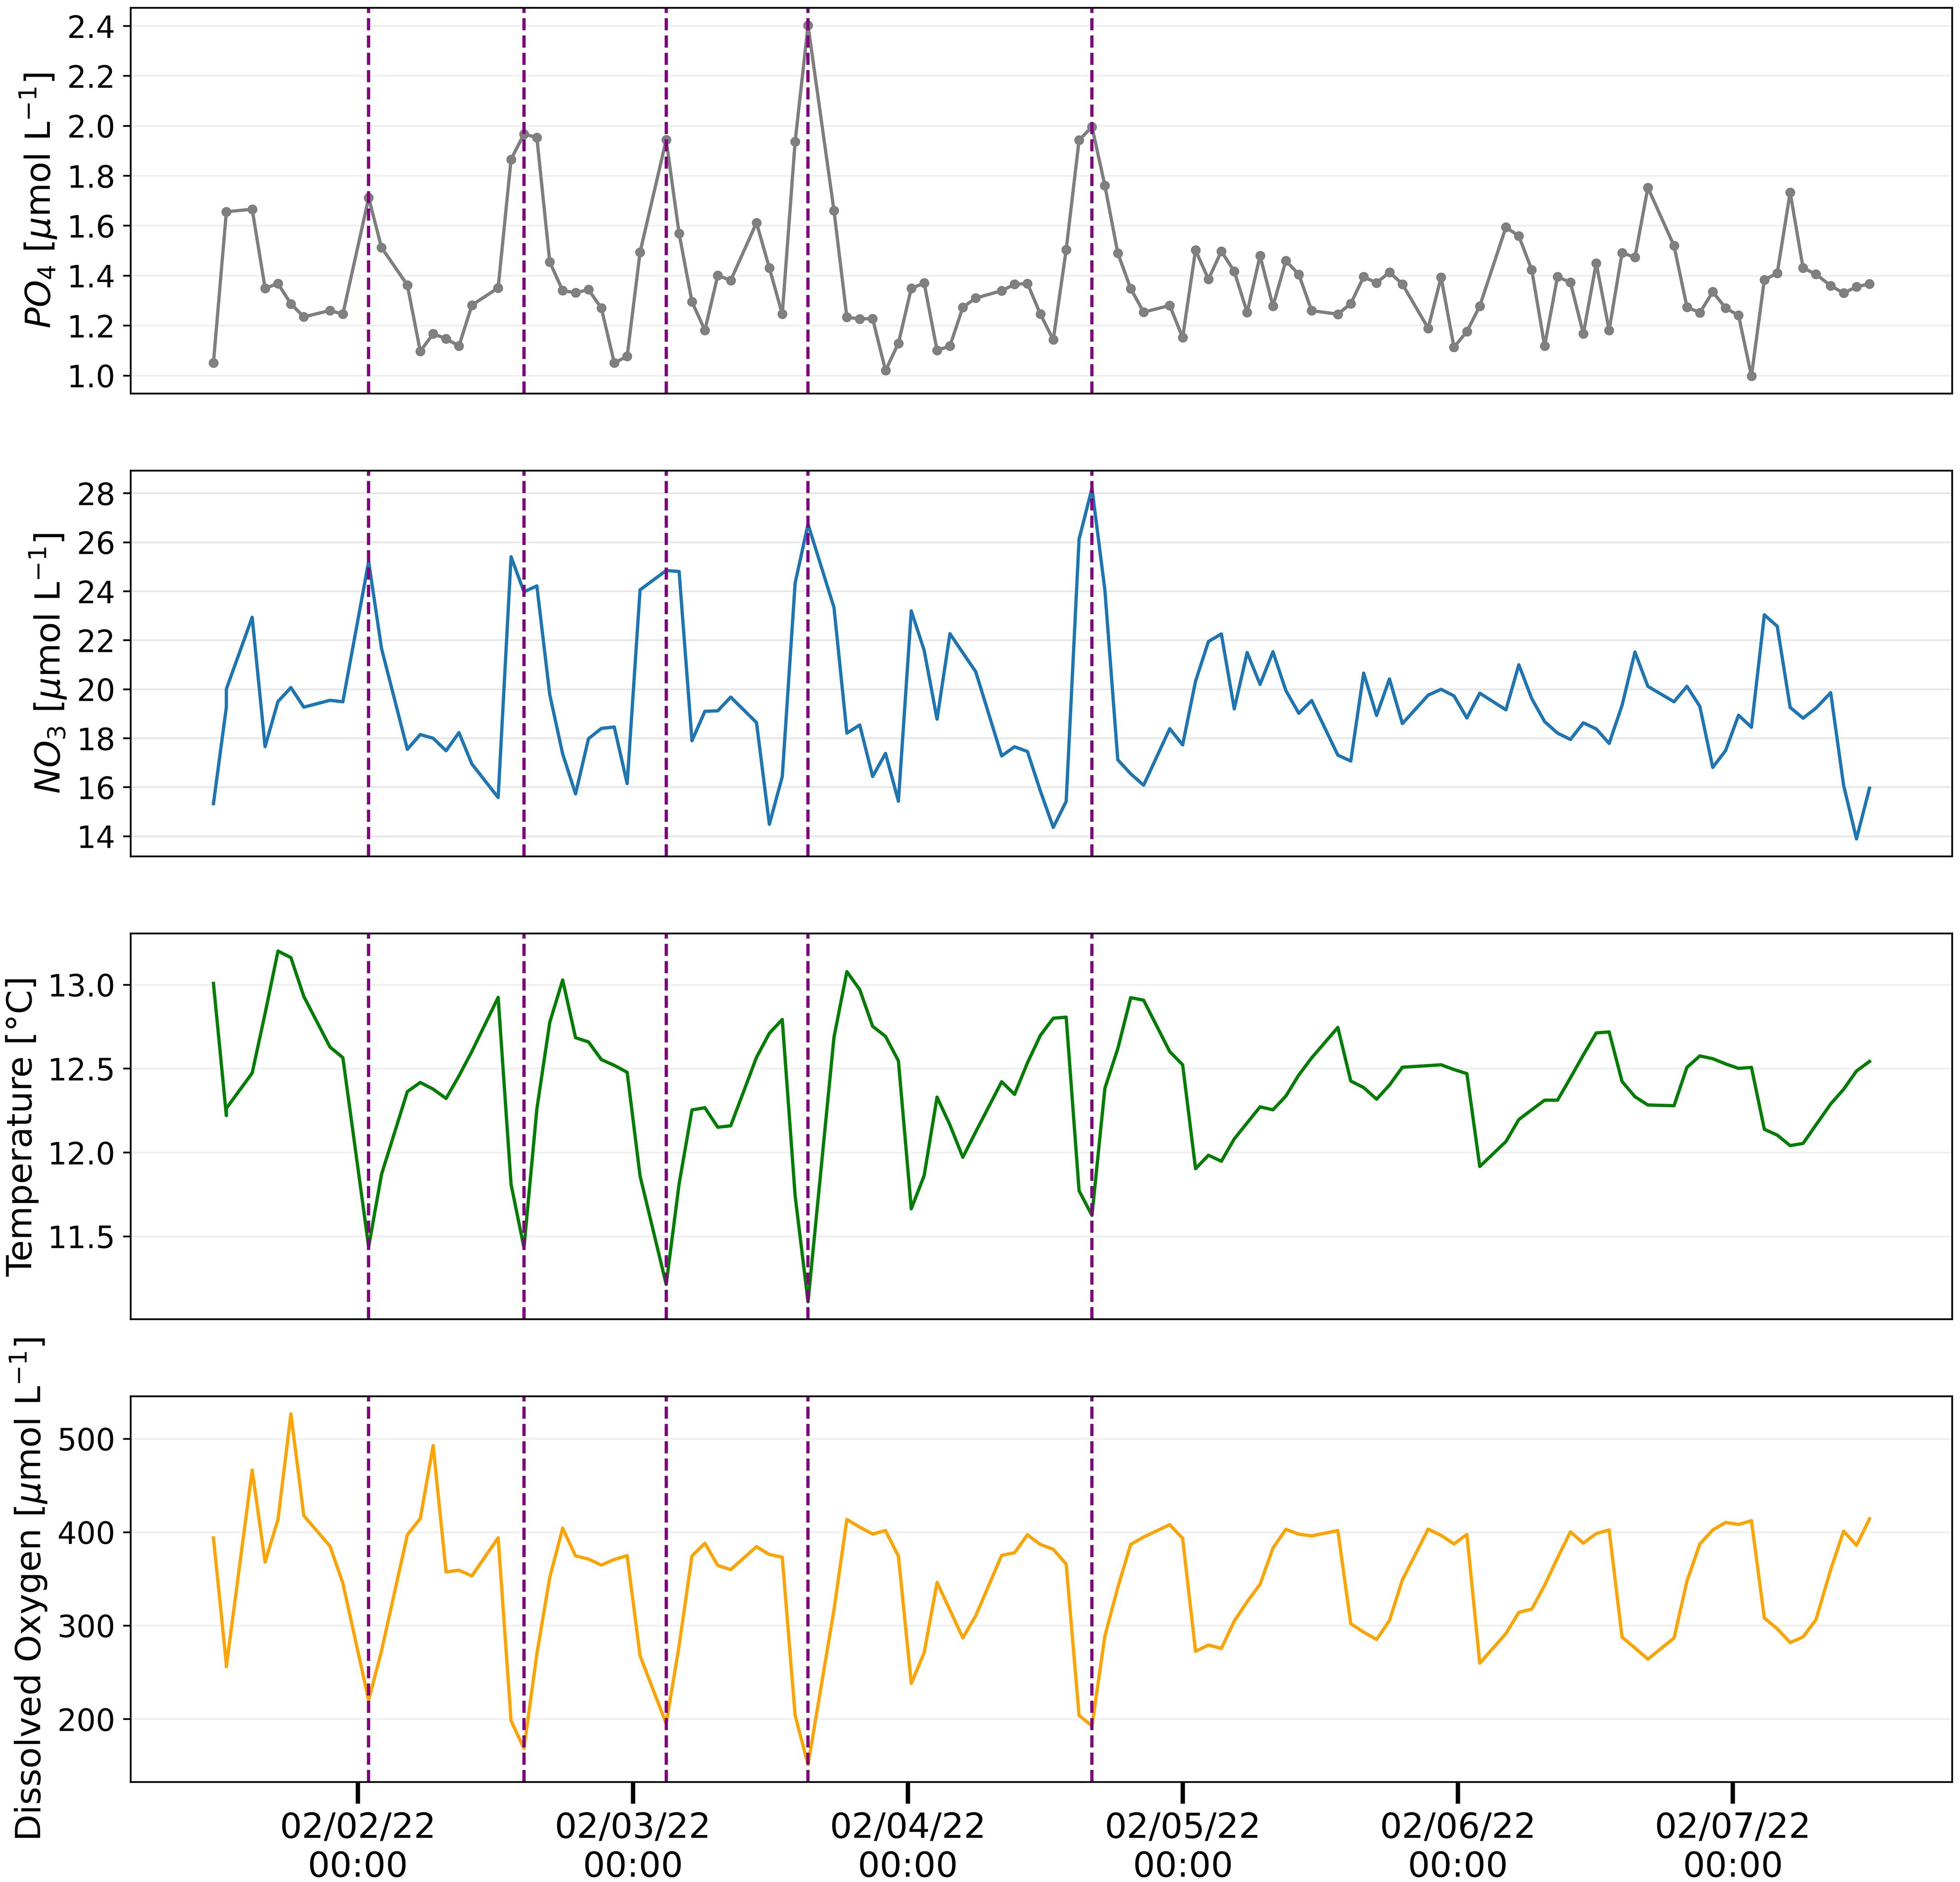
Figure 8 Hourly phosphate measurements analyzed using pFI (top panel) and associated parameters measured at the Moss Landing Marine Laboratories (MLML) shore station in February 2022. Vertical dashed lines are used to visually indicate instances when pronounced spikes in phosphate match changes in nitrate, temperature and dissolved oxygen signals.
The resulting pFI phosphate time-series displayed a pronounced semi-diurnal periodicity, most evident in the first four days of the deployment (Figure 8). Notably, the variability in phosphate concentrations corresponded with concurrent UV-NO3 observations and was anticorrelated with oxygen and temperature records (Figure 8). These observations are consistent with the advection of cold, oxygen poor and nutrient rich deep waters onto the Monterey Bay shelf. These waters are funneled by semi-diurnal tides at the head of the Monterey Bay Canyon (Kunze et al., 2002), where the Moss Landing shore station intake pipe is located.
Although this pilot deployment was relatively short, the oceanographic consistency of the signals observed demonstrates the strong potential of autonomous pFI analyzers to study nutrient dynamics in coastal systems. Moreover, the success of this deployment validates the single standard online dilution calibration that we implemented. This calibration technique (see methods for details), which leverages the negligible salt effects of our optimized pFI phosphate assay, permits a robust evaluation of the instrument performance throughout the deployment, which, compared to the single standard calibration adopted with Lab-On-Chip analyzers (Grand et al., 2017), is better suited to dynamic settings characterized with fluctuating nutrient concentrations.
Our optimized pFI phosphate and silicate assays operate with 600 µL of sample per assay. This low sample volume requirement is advantageous to monitor nutrient concentrations in small volume cultures, such as those of seaweed and phytoplankton. It also provides a convenient means to quantify short-term or pulsed nutrient uptake rates in seaweed aquaculture settings, a common metric in seaweed bioremediation studies (Forbord et al., 2021). To explore the latter capability of autonomous pFI analyzers, we conducted a phosphate uptake experiment using 370 L tanks stocked with Ulva lobata at the MLML seaweed aquaculture facility. During the successive four-hour experiments — which included two different Ulva lobata stocking densities and a control without seaweed added — 103 successful phosphate analyses were performed at five-minutes intervals. Gaps in the time-series result from the exclusion of samples (n=41) due to the presence of air in the sample line (Figure 9), an issue that arose from the vigorous aeration of the tanks to maintain seaweed in suspension in tumble aquaculture settings.
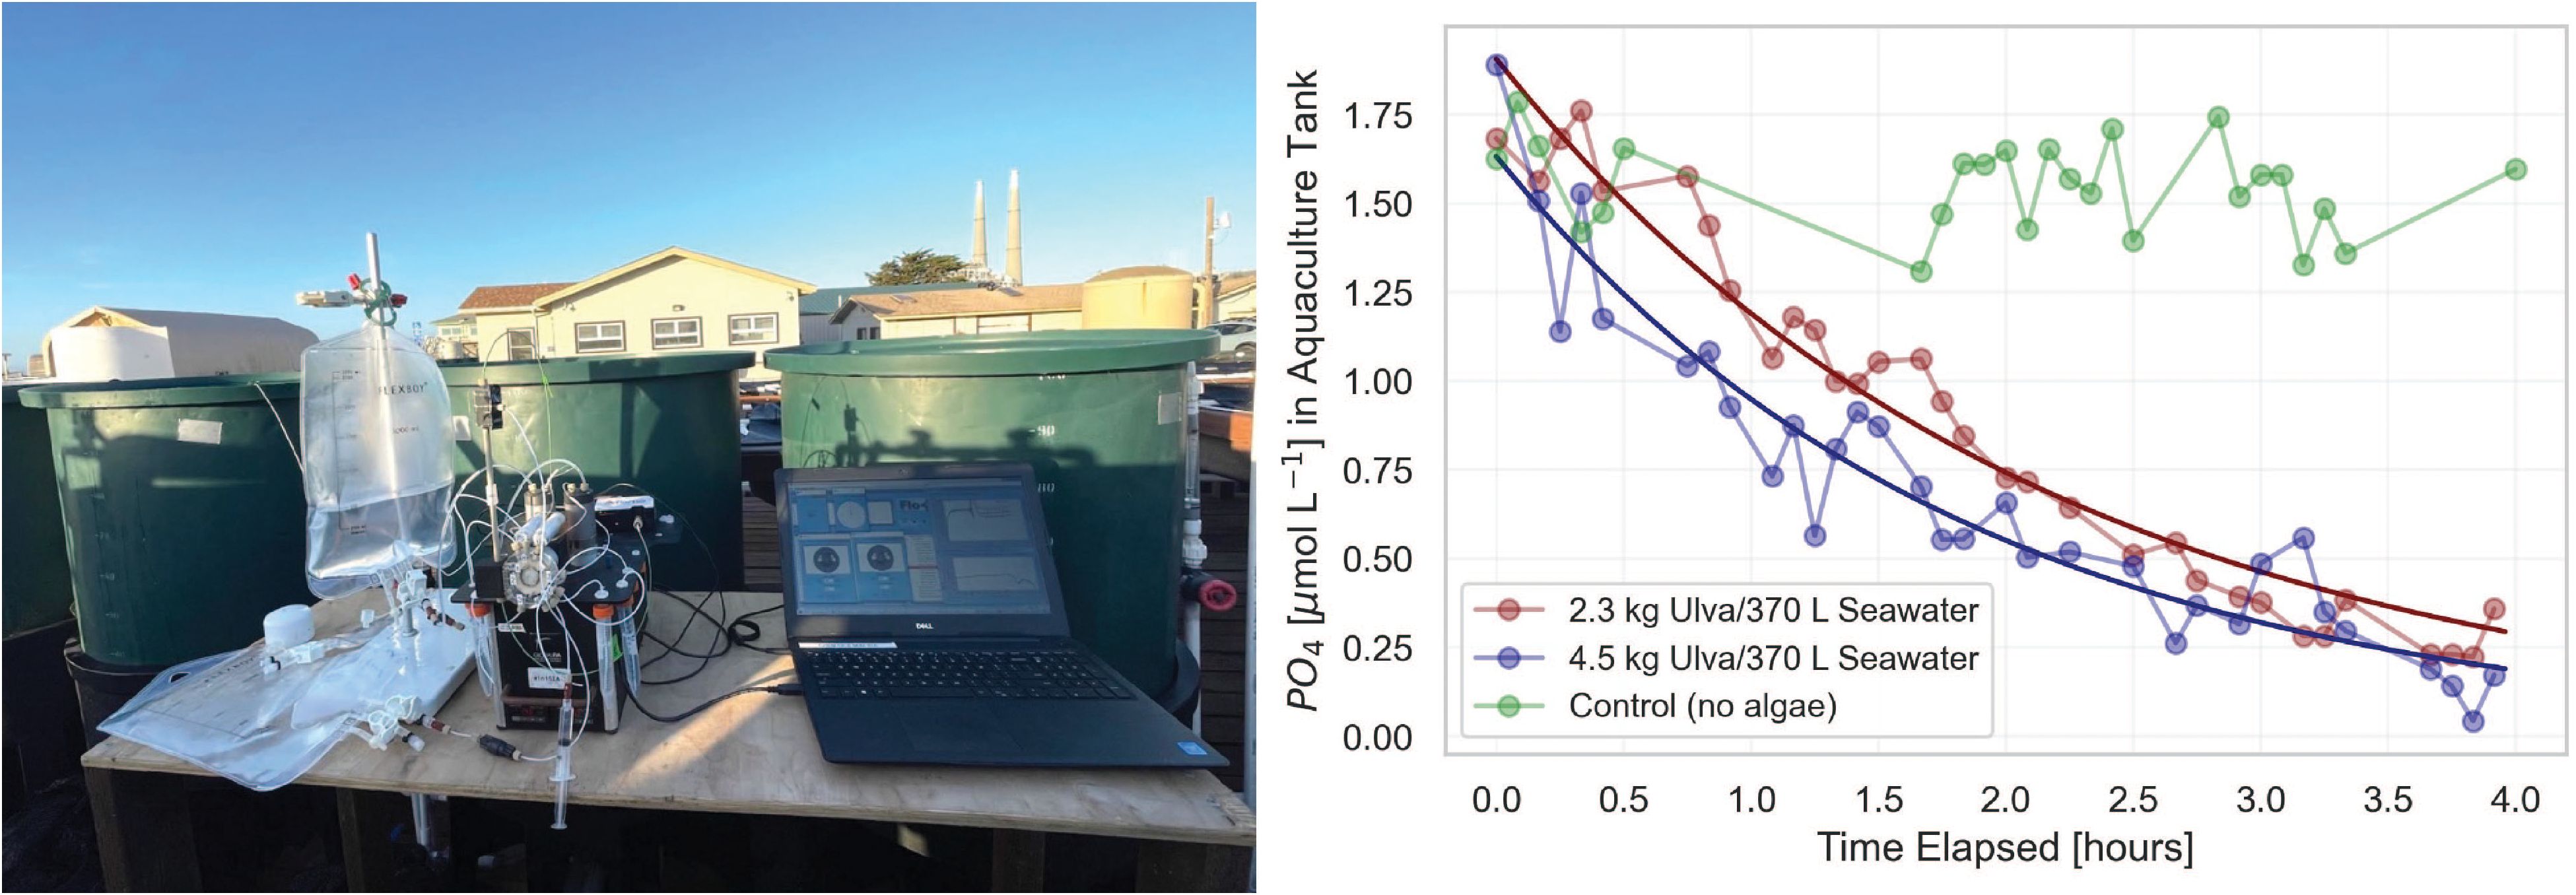
Figure 9 pFI phosphate uptake experiment at the Moss Landing Marine Laboratories (MLML) seaweed aquaculture facility. Left: Photograph of the miniSIA-2 setup on site. Right: time-series of phosphate concentrations following the initial phosphate spike for each Ulva lobata treatment.
At both seaweed stocking densities, phosphate removal followed a second order polynomial fit, with the final phosphate concentrations approximately 85% lower than initial levels (Figure 9). The relatively constant concentrations of phosphate observed in the control tank confirm active phosphate uptake by Ulva lobata as opposed to uncontrolled factors. While a detailed analysis of these data falls beyond the scope of this manuscript, specific phosphate uptake rates that ranged from 6-10 µmol L-1 PO4 kg FW-1 hr-1 at a concentration of ~1.0 µmol L-1 PO4, fall within the range of values reported in a similar study involving Ulva spp (Jansen et al., 2022). This was achieved at a much higher temporal resolution than can be achieved with discrete sampling and opens the door for more complex seaweed nutrient uptake rate evaluations using pFI.
The compact design, robustness, and straightforward installation of pFI systems make them well-suited for autonomous shipboard underway analysis. During the return transit of INIV, the pFI analyzer, connected to the RV Investigator underway system, successfully analyzed 249 individual samples for silicate in duplicate at 30 min intervals. The instrument operated autonomously for five days, and the resulting surface Si data covered a region spanning from the Polar Frontal Zone (PFZ ~ 52°S) of the Australian sector of the Southern Ocean to the vicinity of Hobart Harbor in the Derwent River (Figure 10). In contrast to the time-consuming 4-point calibration implemented at the MLML shore station, the instrument calibrated itself with a MQ blank and a single MQ Si standard every 12 hours throughout the deployment to minimize data collection interruptions. The relative standard deviation of the resulting calibration slopes (n=12) was 6%. The average surface Si concentration across the transect was 2.4 µmol L-1 and analytical precision, defined as the mean relative standard deviation of the 249 duplicate samples was 9%. A mid-deployment analysis of the KANSO CR RMNS yielded a recovery of 99 ± 7% (measured value: 14.1 ± 1.1 µmol L-1 against a certified value of 14.3 ± 0.2 µmol L-1 Si). These analytical performance metrics indicate that any Si concentration gradients exceeding 10% along the transect can be confidently attributed to genuine spatial variability rather than analytical noise.
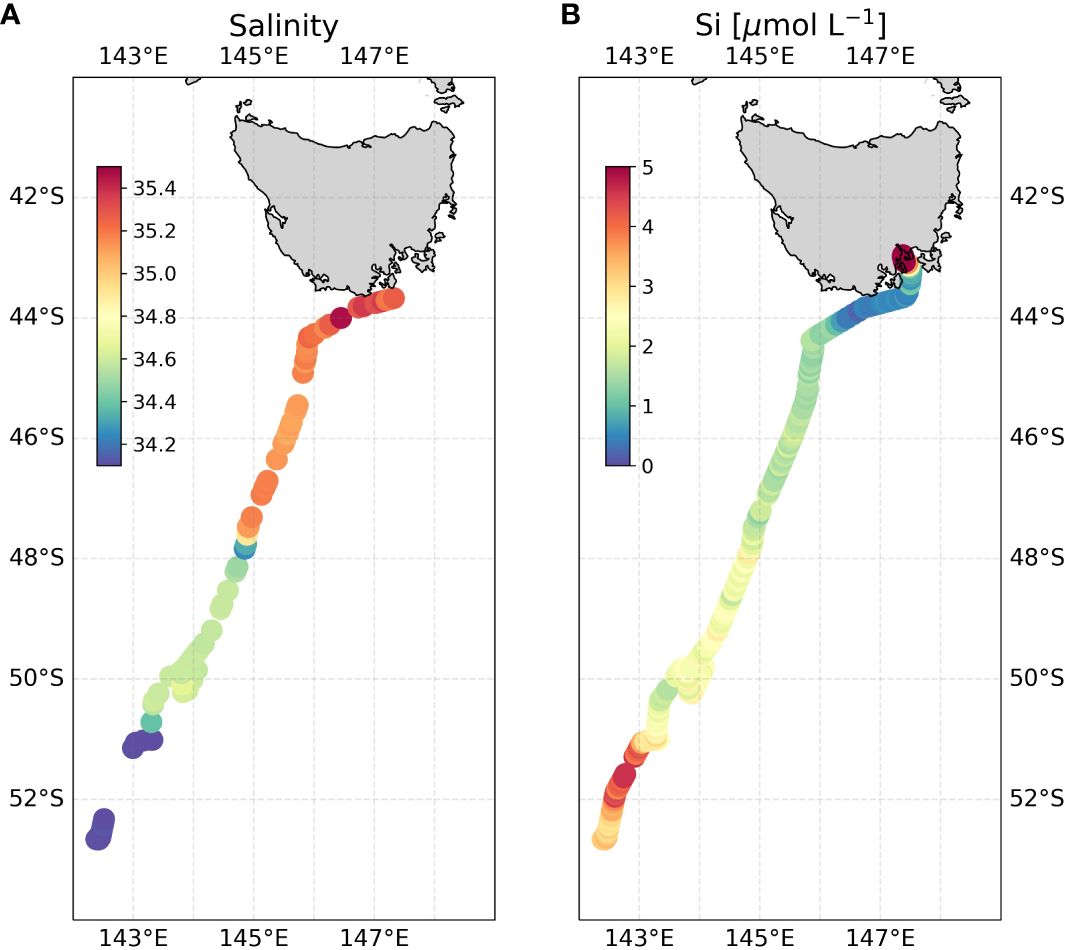
Figure 10 Underway pFI surface Si data along the return INIV voyage track. (A) underway salinity (B) underway surface pFI silicate. To highlight spatial gradients in the low silicate surface Southern Ocean, note that areas with dark red coloring, such as the Derwent River near Hobart, correspond to ~10 µmol L-1 Si, even though the color bar is scaled up to only 5 µmol L-1. For zoomed in underway transect near Tasmania, refer to Supplementary Figure S4.
The high-resolution surface silicate transect generated by the pFI revealed a remarkable stepwise decrease in concentrations from south to north (Figure 10A). This pattern is consistent with the hydrography of the Southern Ocean where the Antarctic Circumpolar Current (ACC) frontal jets create distinct meridional property gradients. Starting at the southern end of the transect, we observed elevated surface silicate concentrations (3.4 ± 0.6 µmol L-1, n=54) coupled with low sea surface salinity values (< 34). These features terminated abruptly at the approximate position of the Polar Front (PF) near 51°S on SR03 (Rintoul and Bullister, 1999; Pardo et al., 2017), a known boundary separating the silicate-rich waters of the Antarctic and the silicate-poor waters of the Polar Frontal Zone (Pollard et al., 2002; Sarmiento et al., 2004). This meridional silicate gradient reflects the upwelling and mixing of Upper Circumpolar Deep Waters to the south of the PF, and biological uptake of Si across the Polar Frontal zone (Freeman et al., 2018).
In the Polar Frontal Zone (PFZ ~51°S to 48°S), sea surface salinity and silicate concentrations (2.3 ± 0.3 µmol L-1, n=73) were both relatively uniform until a marked shift at the Subantarctic Front (SAF) near 48°S (Figure 10). The Subantarctic Zone (SAZ: 48°S to 44°S) displayed uniformly low silicate concentrations (1.6 ± 0.2 µmol L-1, n=68), which further decreased to 0.7 ± 0.2 µmol L-1 (n=38) in a narrow band extending from the Subtropical Front (STF) to the vicinity of Bruni Island in the Derwent estuary. These low silicate values reflect the presence of silicate-poor subtropical waters channeled via the East Australian Current (EAC) and Tasman Outflow (Pardo et al., 2017). Beyond this point, silicate concentrations gradually increased, peaking at 13.1 µmol L-1 at the northernmost point of the transect, reflecting the increasing influence of the Derwent River (Supplementary Figure S4).
To the best of our knowledge, the high-resolution surface silicate dataset obtained through this five-day pFI underway deployment represents an unprecedented level of detail in this sector of the Southern Ocean. In fact, the number of silicate measurements in this single transect exceeds the number of historical observations used to define the position of the Southern Ocean Silicate Front in the region (Freeman et al., 2018). This high-resolution dataset enabled us to delineate subtle shifts in surface silicate concentrations across the ACC fronts, showcasing the value of underway pFI systems for in-depth studies of biogeochemical dynamics in the Southern Ocean and beyond. Moreover, the success of this underway deployment underscores the suitability of pFI systems for integration into FerryBox-like setups. Such configurations could enable high-resolution surface measurements on ships of opportunity or targeted process studies, entirely autonomously and for durations that fit with the typical intervals between port stops. This advancement would offer a new analytical technology for acquiring crucial time series observations along frequently navigated transects (for e.g., Munro et al. (2015)) to quantify both spatial and temporal variability in surface nutrient concentrations.
Miniaturized wet chemical analyzers operating standard colorimetric assays currently represent the most practical solution for enhancing the spatial and temporal coverage of phosphate and silicate measurements in the marine environment. This work builds upon foundational programmable Flow Injection (pFI) research, taking a significant step towards enabling month-long, unattended observations at coastal shore stations and ships of opportunity. In addition, the insights gained from our investigation of the role of acidity and molybdate concentration in reducing salt effects, as well as the stability of the reagents, will benefit other systems implementing similar Si and PO4 assays, offering a framework for enhancing assay performance in diverse analytical platforms.
Our evaluation of pFI’s shipboard capabilities at the HOTS and SOTS sites, using assay parameters optimized for long-term use, demonstrates a reasonable agreement with historical data and a reference method. Although the accuracy and precision are not yet matching the performance of established segmented nutrient autoanalyzers, both pFI assays are robust enough for detecting spatial and short-term variability (as opposed to decadal trends) in all but the most oligotrophic regions of the ocean. Future efforts will focus on improving analytical precision and addressing the biases observed at high phosphate concentrations.
Provided that the phosphate working standards are acidified, we show that our newly optimized reagent formulations maintain the analytical sensitivity of both pFI assays within 10% of initial levels for up to 35 days across a temperature range from 7-25°C. Careful selection of the molybdate concentration and acidity in both assays results in minimal salt effects, ensuring accurate measurements in samples of varying salinities and enabling system calibration with MQ standards when low nutrient seawater is unavailable. For a 30-day deployment with hourly phosphate and silicate analyses, our reagent consumption rates would be comparable to Lab-On-Chip analyzers, despite the substantial MQ water carrier requirement (~5 L), which remains to be optimized. We also demonstrate that pFI analyzers can easily self-calibrate using two distinct approaches which both rely on a single concentrated standard: either by online dilution with MQ carrier to produce a multi-point calibration curve or, by analyzing a single concentrated standard and an aliquot of the MQ carrier as blank.
A key advantage of the pFI analyzer is its versatility. All experiments and pilot deployments in this study were conducted using the same commercially available manifold, requiring only software script modifications for deployment and calibration in various settings, including a coastal shore station, a seaweed aquaculture facility, and an underway system on a global-class research vessel. This versatility, combined with the reagent stability and flexible calibration options outlined in this work, positions pFI as a promising tool for autonomous nutrient analysis. Our next steps involve validating the long-term capabilities of the instrument and making its underlying software open-source while using more cost-effective hardware components, thereby broadening its potential for more widespread use in nutrient analysis and other chemical oceanography applications.
The raw data supporting the conclusions of this article will be made available by the authors, without undue reservation. All field data leading to this publication are available at this link: https://www.bco-dmo.org/project/815753.
ML: Data curation, Formal analysis, Investigation, Methodology, Validation, Visualization, Writing – review & editing. MG: Conceptualization, Data curation, Funding acquisition, Investigation, Methodology, Project administration, Supervision, Validation, Writing – original draft, Writing – review & editing, Formal analysis, Resources.
The author(s) declare that financial support was received for the research, authorship, and/or publication of this article. This work was funded by NSF-OCE 1924539 to MG and a California State University (CSU) Council on Ocean Affairs, Science & Technology (COAST) Graduate Student Award to ML. This research was supported by a grant of sea time on RV Investigator from the CSIRO Marine National Facility.
We thank the captains and crew of the RV Kilo Moana and RV Investigator as well as Angela White (UH) and chief scientist Andreas Marouchos (CSIRO) for their support during the HOTS-339 and INIV cruises, respectively. Thanks are due to Mariko Hatta (JAMSTEC) for providing the miniSIA2 instrument used to generate the underway Si dataset aboard the RV Investigator, to Madi Davis (UH) and Chris Measures (UH) for offering lab space and reagents before the HOTS cruise, and to Seamus Jameson (MLML) for his thorough analysis of the factors impacting the precision of the pFI Si assay. We are also indebted to the hydrochemistry group at CSIRO (Hobart) for their invaluable assistance with the logistics leading to and during the International Nutrient Intercomparison Voyage (INIV).
The authors declare that the research was conducted in the absence of any commercial or financial relationships that could be construed as a potential conflict of interest.
All claims expressed in this article are solely those of the authors and do not necessarily represent those of their affiliated organizations, or those of the publisher, the editors and the reviewers. Any product that may be evaluated in this article, or claim that may be made by its manufacturer, is not guaranteed or endorsed by the publisher.
The Supplementary Material for this article can be found online at: https://www.frontiersin.org/articles/10.3389/fmars.2024.1354780/full#supplementary-material
Adornato L. R., Kaltenbacher E. A., Greenhow D. R., Byrne R. H. (2007). High-resolution in situ analysis of nitrate and phosphate in the oligotrophic ocean. Environ. Sci. Technol. 41, 4045–4052. doi: 10.1021/es0700855
Altahan M. F., Esposito M., Achterberg E. P. (2022). Improvement of on-site sensor for simultaneous determination of phosphate, silicic acid, nitrate plus nitrite in seawater. Sensors 22, 3479. doi: 10.3390/s22093479
Barus C., Chen Legrand D., Striebig N., Jugeau B., David A., Valladares M., et al. (2018). First deployment and validation of in situ silicate electrochemical sensor in seawater. Front. Mar. Sci. 5. doi: 10.3389/fmars.2018.00060
Barus C., Romanytsia I., Striebig N., Garcon V. (2017). Toward an in situ electrochemical sensor measuring phosphate concentration in seawater. Meet. Abstr MA2017-01, 1875. doi: 10.1149/MA2017-01/41/1875
Beaton A. D., Schaap A. M., Pascal R., Hanz R., Martincic U., Cardwell C. L., et al. (2022). Lab-on-chip for in situ analysis of nutrients in the deep sea. ACS Sens. 7, 89–98. doi: 10.1021/acssensors.1c01685
Becker S, Aoyama M, Woodward EMS, Bakker K, Coverly S, Mahaffey C, et al. (2020). GO-SHIP Repeat Hydrography Nutrient Manual: The Precise and Accurate Determination of Dissolved Inorganic Nutrients in Seawater, Using Continuous Flow Analysis Methods. Front. Mar. Sci. 7:581790. doi: 10.3389/fmars.2020.581790
Birchill A. J., Beaton A. D., Hull T., Kaiser J., Mowlem M., Pascal R., et al. (2021). Exploring ocean biogeochemistry using a lab-on-chip phosphate analyzer on an underwater glider. Front. Mar. Sci. 8. doi: 10.3389/fmars.2021.698102
Birchill A. J., Clinton-Bailey G., Hanz R., Mawji E., Cariou T., White C., et al. (2019). Realistic measurement uncertainties for marine macronutrient measurements conducted using gas segmented flow and Lab-on-Chip techniques. Talanta 200, 228–235. doi: 10.1016/j.talanta.2019.03.032
Chen C., Wiorek A., Gomis-Berenguer A., Crespo G. A., Cuartero M. (2023). Portable all-in-one electrochemical actuator-sensor system for the detection of dissolved inorganic phosphorus in seawater. Anal. Chem. 95, 4180–4189. doi: 10.1021/acs.analchem.2c05307
Chen Legrand D., Mas S., Jugeau B., David A., Barus C. (2021). Silicate marine electrochemical sensor. Sensors Actuators B: Chem. 335, 129705. doi: 10.1016/j.snb.2021.129705
Clinton-Bailey G. S., Grand M. M., Beaton A. D., Nightingale A. M., Owsianka D. R., Slavik G. J., et al. (2017). A lab-on-chip analyzer for in situ measurement of soluble reactive phosphate: improved phosphate blue assay and application to fluvial monitoring. Environ. Sci. Technol. 51, 9989–9995. doi: 10.1021/acs.est.7b01581
Deng Y., Li P., Fang T., Jiang Y., Chen J., Chen N., et al. (2020). Automated determination of dissolved reactive phosphorus at nanomolar to micromolar levels in natural waters using a portable flow analyzer. Anal. Chem. 92, 4379–4386. doi: 10.1021/acs.analchem.9b05252
Falkowski P. G., Barber R. T., Smetacek V. (1998). Biogeochemical controls and feedbacks on ocean primary production. Science 281, 200–206. doi: 10.1126/science.281.5374.200
Fang T., Bo G., Ma J. (2022a). An automated analyzer for the simultaneous determination of silicate and phosphate in seawater. Talanta 248, 123629. doi: 10.1016/j.talanta.2022.123629
Fang T., Bo G., Zhang Z., Ma J. (2022b). Real-time underway mapping of nutrient concentrations of surface seawater using an autonomous flow analyzer. Anal. Chem. 94, 11307–11314. doi: 10.1021/acs.analchem.2c02000
Forbord S., Etter S. A., Broch O. J., Dahlen V. R., Olsen Y. (2021). Initial short-term nitrate uptake in juvenile, cultivated Saccharina latissima (Phaeophyceae) of variable nutritional state. Aquat. Bot. 168, 103306. doi: 10.1016/j.aquabot.2020.103306
Freeman N. M., Lovenduski N. S., Munro D. R., Krumhardt K. M., Lindsay K., Long M. C., et al. (2018). The variable and changing southern ocean silicate front: insights from the CESM large ensemble. Global Biogeochemical Cycles 32, 752–768. doi: 10.1029/2017GB005816
Glibert P., Burford M. (2017). Globally changing nutrient loads and harmful algal blooms: recent advances, new paradigms, and continuing challenges. Oceanog 30, 58–69. doi: 10.5670/oceanog.2017.110
Grand M. M., Chocholouš P., Růžička J., Solich P., Measures C. I. (2016). Determination of trace zinc in seawater by coupling solid phase extraction and fluorescence detection in the Lab-On-Valve format. Analytica Chimica Acta 923, 45–54. doi: 10.1016/j.aca.2016.03.056
Grand M. M., Clinton-Bailey G. S., Beaton A. D., Schaap A. M., Johengen T. H., Tamburri M. N., et al. (2017). A lab-on-chip phosphate analyzer for long-term in situ monitoring at fixed observatories: optimization and performance evaluation in estuarine and oligotrophic coastal waters. Front. Mar. Sci. 4. doi: 10.3389/fmars.2017.00255
Hansen H. P., Koroleff F. (1999). “Determination of nutrients,” in Methods of Seawater Analysis. Eds. Grasshoff K., Kremling K., Ehrhardt M. (Weinheim, Germany: Wiley), 159–228. doi: 10.1002/9783527613984.ch10
Hassenteufel W., Jagitsch R., Koczy F. F. (1963). Impregnation of glass surface against sorption of phospiiate traces. Limnology Oceanography 8, 152–156. doi: 10.4319/lo.1963.8.2.0152
Hatta M., Measures C. I., Ruzicka J. (2018). Programmable Flow Injection. Principle, methodology and application for trace analysis of iron in a sea water matrix. Talanta 178, 698–703. doi: 10.1016/j.talanta.2017.10.007
Hatta M., Ruzicka J., Measures C. I., Davis M. (2021). Programmable flow injection in batch mode: Determination of nutrients in sea water by using a single, salinity independent calibration line, obtained with standards prepared in distilled water. Talanta 232, 122354. doi: 10.1016/j.talanta.2021.122354
Hatta M., Ruzicka J., Measures C., Davis M. (2023). Automated calibration by a single standard solution prepared in deionized water by flow programming eliminates the schlieren and salinity effects and is applied to the determination of phosphate in sea water of different salinities. Talanta 253, 124041. doi: 10.1016/j.talanta.2022.124041
IOCCP (2017) EOV specification sheet: nutrients [WWW document]. The global ocean observing shystem. Available online at: https://www.goosocean.org/index.php?option=com_oe&task=viewDocumentRecord&docID=17474 (Accessed 12.6.23).
Jansen H. M., Bernard M. S., Nederlof M. A. J., van der Meer I. M., van der Werf A. (2022). Seasonal variation in productivity, chemical composition and nutrient uptake of Ulva spp. (Chlorophyta) strains. J. Appl. Phycol 34, 1649–1660. doi: 10.1007/s10811-022-02708-z
Jin X., Gruber N., Dunne J. P., Sarmiento J. L., Armstrong R. A. (2006). Diagnosing the contribution of phytoplankton functional groups to the production and export of particulate organic carbon, CaCO3, and opal from global nutrient and alkalinity distributions. Global Biogeochemical Cycles 20. doi: 10.1029/2005GB002532
Johnson K. S., Coletti L. J. (2002). In situ ultraviolet spectrophotometry for high resolution and long-term monitoring of nitrate, bromide and bisulfide in the ocean. Deep Sea Res. Part I: Oceanographic Res. Papers 49, 1291–1305. doi: 10.1016/S0967-0637(02)00020-1
Kunze E., Rosenfeld L. K., Carter G. S., Gregg M. C. (2002). Internal waves in monterey submarine canyon. J. Phys. Oceanogr. 32, 1890–1913. doi: 10.1175/1520-0485(2002)032<1890:IWIMSC>2.0.CO;2
Li Q., Zhao W., Miao H., Han X. (2019). Effects and improvements of different reagents preservation methods on the determination of phosphate in seawater by phosphomolybdenum blue spectrophotometric method. Mar. pollut. Bull. 139, 136–140. doi: 10.1016/j.marpolbul.2018.12.011
Magnusson B., Ab T., Näykki T., Hovind H., Krysell M., Sahlin E. (2017). Handbook for calculation of measurement uncertainty, Nordtest Report (Danemark: Nordtest).
Moore C. M., Mills M. M., Arrigo K. R., Berman-Frank I., Bopp L., Boyd P. W., et al. (2013). Processes and patterns of oceanic nutrient limitation. Nat. Geosci 6, 701–710. doi: 10.1038/ngeo1765
Munro D. R., Lovenduski N. S., Stephens B. B., Newberger T., Arrigo K. R., Takahashi T., et al. (2015). Estimates of net community production in the Southern Ocean determined from time series observations, (2002–2011) of nutrients, dissolved inorganic carbon, and surface ocean pCO2 in Drake Passage. Deep Sea Res. Part II: Topical Stud. Oceanography South. Ocean Dynamics Biogeochemistry Changing Climate 114, 49–63. doi: 10.1016/j.dsr2.2014.12.014
Murphy J., Riley J. P. (1962). A modified single solution method for the determination of phosphate in natural waters. Analytica Chimica Acta 27, 31–36. doi: 10.1016/S0003-2670(00)88444-5
Nagul E. A., McKelvie I. D., Worsfold P., Kolev S. D. (2015). The molybdenum blue reaction for the determination of orthophosphate revisited: Opening the black box. Analytica Chimica Acta 890, 60–82. doi: 10.1016/j.aca.2015.07.030
Pardo P. C., Tilbrook B., Langlais C., Trull T. W., Rintoul S. R. (2017). Carbon uptake and biogeochemical change in the Southern Ocean, south of Tasmania. Biogeosciences 14, 5217–5237. doi: 10.5194/bg-14-5217-2017
Pollard R. T., Lucas M. I., Read J. F. (2002). Physical controls on biogeochemical zonation in the Southern Ocean. Deep Sea Res. Part II: Topical Stud. Oceanography South. Ocean II: Climatic Changes Cycle Carbon 49, 3289–3305. doi: 10.1016/S0967-0645(02)00084-X
Rintoul S. R., Bullister J. L. (1999). A late winter hydrographic section from Tasmania to Antarctica. Deep Sea Res. Part I: Oceanographic Res. Papers 46, 1417–1454. doi: 10.1016/S0967-0637(99)00013-8
Ruzicka J. (2018). Redesigning flow injection after 40 years of development: Flow programming. Talanta 176, 437–443. doi: 10.1016/j.talanta.2017.08.061
Ruzicka J., Chocholouš P. (2024). Next generation of flow analysis is based on flow programming. Talanta 269, 125410. doi: 10.1016/j.talanta.2023.125410
Ruzicka J. J., Marshall G. D., Measures C. I., Hatta M. (2019). Flow injection programmed to function in batch mode is used to determine molar absorptivity and to investigate the phosphomolybdenum blue method. Talanta 201, 519–526. doi: 10.1016/j.talanta.2019.04.015
Ryan J. P., Kudela R. M., Birch J. M., Blum M., Bowers H. A., Chavez F. P., et al. (2017). Causality of an extreme harmful algal bloom in Monterey Bay, California, during the 2014–2016 northeast Pacific warm anomaly. Geophysical Res. Lett. 44, 5571–5579. doi: 10.1002/2017GL072637
Sakamoto C., Johnson K., Coletti L., Maurer T., Massion G., Pennington J. T., et al. (2017). Hourly in situ nitrate on a coastal mooring: A 15-year record and insights into new production. Oceanog 30, 114–127. doi: 10.5670/oceanog.2017.428
Sarmiento J. L., Gruber N., Brzezinski M. A., Dunne J. P. (2004). High-latitude controls of thermocline nutrients and low latitude biological productivity. Nature 427, 56–60. doi: 10.1038/nature02127
Sarmiento J. L., Johnson K. S., Arteaga L. A., Bushinsky S. M., Cullen H. M., Gray A. R., et al. (2023). The Southern Ocean carbon and climate observations and modeling (SOCCOM) project: A review. Prog. Oceanography 219, 103130. doi: 10.1016/j.pocean.2023.103130
Thomsen J., Johnson K. S., Petty R. L. (1983). Determination of reactive silicate in seawater by flow injection analysis. Anal. Chem. 55, 2378–2382. doi: 10.1021/ac00264a039
Thouron D., Vuillemin R., Philippon X., Lourenço A., Provost C., Cruzado A., et al. (2003). An autonomous nutrient analyzer for oceanic long-term in situ biogeochemical monitoring. Anal. Chem. 75, 2601–2609. doi: 10.1021/ac020696+
Tréguer P., Bowler C., Moriceau B., Dutkiewicz S., Gehlen M., Aumont O., et al. (2018). Influence of diatom diversity on the ocean biological carbon pump. Nat. Geosci 11, 27–37. doi: 10.1038/s41561-017-0028-x
Truesdale V. W., Smith C. J. (1976). The automatic determination of silicate dissolved in natural fresh water by means of procedures involving the use of either α- or β-molybdosilicic acid. Analyst 101, 19–31. doi: 10.1039/an9760100019
Vuillemin R., Sanfilippo L., Moscetta P., Zudaire L., Carbones E., Maria E., et al. (2009). “Continuous nutrient automated monitoring on the Mediterranean Sea using in situ flow analyzer,” in OCEANS 2009, 1–8. doi: 10.23919/OCEANS.2009.5422405
Yin X., Chen K., Cheng H., Chen X., Feng S., Song Y., et al. (2022). Chemical stability of ascorbic acid integrated into commercial products: A review on bioactivity and delivery technology. Antioxidants (Basel) 11, 153. doi: 10.3390/antiox11010153
Keywords: programmable flow injection, pFI, nutrients, phosphate, silicate, Southern Ocean, chemical sensors, IOOS
Citation: Lebrec M and Grand MM (2024) Programmable flow injection: a versatile technique for benchtop and autonomous analysis of phosphate and silicate in seawater. Front. Mar. Sci. 11:1354780. doi: 10.3389/fmars.2024.1354780
Received: 12 December 2023; Accepted: 26 February 2024;
Published: 15 March 2024.
Edited by:
Claire Mahaffey, University of Liverpool, Liverpool, United KingdomReviewed by:
Kunning Lin, State Oceanic Administration, ChinaCopyright © 2024 Lebrec and Grand. This is an open-access article distributed under the terms of the Creative Commons Attribution License (CC BY). The use, distribution or reproduction in other forums is permitted, provided the original author(s) and the copyright owner(s) are credited and that the original publication in this journal is cited, in accordance with accepted academic practice. No use, distribution or reproduction is permitted which does not comply with these terms.
*Correspondence: Maxime M. Grand, bWF4aW1lLmdyYW5kQHNqc3UuZWR1
†Present address: Marine Lebrec, Monterey Bay Aquarium Research Institute, Moss Landing, CA, United States
‡These authors have contributed equally to this work and share first authorship
Disclaimer: All claims expressed in this article are solely those of the authors and do not necessarily represent those of their affiliated organizations, or those of the publisher, the editors and the reviewers. Any product that may be evaluated in this article or claim that may be made by its manufacturer is not guaranteed or endorsed by the publisher.
Research integrity at Frontiers
Learn more about the work of our research integrity team to safeguard the quality of each article we publish.