
94% of researchers rate our articles as excellent or good
Learn more about the work of our research integrity team to safeguard the quality of each article we publish.
Find out more
ORIGINAL RESEARCH article
Front. Mar. Sci. , 23 February 2024
Sec. Marine Affairs and Policy
Volume 11 - 2024 | https://doi.org/10.3389/fmars.2024.1352598
 Ernest Czermański1*
 Jacek Zaucha2,3
 Aneta Oniszczuk-Jastrząbek1Joanna Pardus4
 Adam Kiersztyn5Dariusz Czerwiński5
As part of the progressive process of extending spatial plans to cover an increasing number of marine areas, with the aim of objectively balancing the interests of various users of the marine area, it has become necessary to establish the value of marine areas as a yardstick or determinant of the user group for which a given marine area is of greater value. This study seeks to fill a research gap by attempting to develop a method to calculate the value of marine areas for the commercial shipping industry. This is done to make it possible in the future to prepare the ground for policy regulating the spatial rent of the sea, whose most important users are shipowners and their ships. We use the homogeneous basin of the Polish Marine Areas (PMA) in the Baltic Sea. Based on a literature review, we conclude that such a method does not exist, posing a significant challenge in the process of marine/maritime spatial planning (MSP) and maritime policy formulation. Conducting an in-depth analysis of 2020 data on ship traffic in the basin noted above, combined with a financial analysis of shipowners’ operating costs and profitability indicators, we can determine the value of marine areas both in aggregate for all shipping in the studied basin and for each of the five segments of shipping – the bulk cargo, ro-ro cargo, container, tanker, and passenger segments. In addition, through a dynamic analysis of ship traffic, it is possible to determine the value of sea area in Polish seawaters per unit of area (1 km²) at the average level and for the five specified market segments. The obtained values show that the total profits of shipowners in the Polish Marine Areas, which are at the level of more than EUR 103 million per year, and the average value of profits per 1 km² of marine area used by a ship provide future decision-makers with an objective point of reference to shape future policies for the fiscalization of public space, including the sea.
Until recently, marine areas were commonly perceived as abundant and devoid of conflicts, capable of accommodating diverse human activities without incurring opportunity costs for their utilization (Convention on the High Seas, 1958). However, the paradigm has shifted in recent years, witnessing various marine sectors vying for the same sea space. Consequently, the assessment of the opportunity cost associated with the use of marine areas has become paramount for both marine research and decision-makers. This holds particular significance in small, enclosed sea basins such as the North Sea and the Baltic Sea, irrespective of the freedoms guaranteed by the United Nations Convention on the Law of the Sea (UNCLOS).
This paper addresses the existing research gap by proposing a methodology for calculating the value of marine areas for the shipping industry. The innovation lies in two primary aspects. Firstly, it provides a comprehensive framework for identifying and quantifying the benefits of utilizing marine space for shipping, referred to as marine spatial rent. This constitutes a pioneering effort on a global scale. Secondly, it explores the potential application of such an indicator in various governance processes, with a specific focus on marine/maritime spatial planning (MSP). Thus, this article is exploratory, aiming to propose a method for calculating shipping rent and testing it using collected information on the Polish Marine Areas (PMA) (Spatial development plan for internal marine waters, 2021). The ultimate objective is to strengthen the shipping sector’s position in national and EU-level MSP processes, aligning with the key principle of MSP, which relies on the most recent and reliable data and information (Zaucha, 2014).
The aspiration is that this article will instigate a broader discussion on how the shipping industry should address the scarcity or limited availability of marine space for its purposes. As noted, marine areas have undergone substantial transformations in recent years as part of the Blue Growth initiative (Schultz-Zehden et al., 2019). A discernible trend is the proliferation of permanent structures in marine areas with lifespans of 20 years or more, leading to an escalation in the scale and intensity of spatial conflicts at sea. Consequently, the need to manage and mitigate these conflicts has given rise to MSP, a novel process in the first decade of the 21st century, integral to maritime governance (Tuda et al., 2014; Ehler et al., 2019; Vince and Day, 2020).
These shifts, particularly tensions between new and existing users of marine areas (Barbesgaard, 2019), occasionally pose challenges for spatial planners (Tafon et al., 2023). The productivity of marine areas, representing the net effect of their use on economic processes, serves as a valuable tool for discussion (Star and Griesemer, 1989; Carlile, 2002) in planning deliberations (Studium, 2015). The marine spatial rent (Zaucha et al., 2020) expresses the willingness of an economic user to pay for the opportunity to use marine areas. Understanding this rent facilitates more informed decisions in the public choice process, as the opportunity cost of using the area for economic purposes becomes apparent. Calculating this rent for specific marine area uses, such as fishing (Psuty et al., 2021), is straightforward, while for others, such as shipping, it presents significant complexities (Zaucha, 2018).
Considering this context, the research aims to establish a method for calculating the economic value of spatial rent (within the context of Ricardo’s theory of spatial rent; (Ricardo, 1966) for commercial shipping derived from the use of marine areas for shipping. To achieve this, the PMA is adopted as the research area within the realm of realized marine transportation by commercial vessels in the 2016-2020 period.
The valuation of marine areas for shipping is encapsulated by the advantages accrued by shipowners through the utilization of these areas for shipping services, primarily driven by sea access. In specific instances, charges are levied for such access, exemplified by fees associated with port infrastructure or maritime channels, which form integral components of spatial rent. Authorities overseeing ports and shipping channels, through the implementation of tariffs, effectively govern the value of marine spatial rent within their purview. Conversely, regions such as internal marine waters, the territorial sea, the contiguous zone, and the exclusive economic zone lack comparable mechanisms, typically affording ships unimpeded access (Act of March 21, 1991).
The shipping sector, centered on the transportation of goods and/or passengers, deems access to sea areas a pivotal facet of its commercial shipping endeavors. This characterization specifically excludes non-commercial vessels such as warships, recreational and fishing boats, offshore units, and those deployed for purposes such as research or search and rescue.
Shipping spatial rent is delineated as the disparity between revenue generated from a transportation service on a specific body of water and the costs incurred in utilizing that water. It represents the shipowner’s willingness to pay for the privilege of navigating through a given sea area during a voyage, assuming unimpeded access to the seas in accordance with international conventions. However, this definition excludes regions like port basins, canals, and locks, where fees are imposed.
The estimation of spatial rent for shipping poses challenges due to its inherent mobility. In contrast to the rent from fixed structures, a ship’s trajectory comprises numerous discrete segments, necessitating estimation of the rent for each segment, assuming the optimal sailing route. This process entails the computation of profits for a typical voyage of a specific vessel type, with adjustments made to a given sea area used based on route length, ship speed and ship size. All these introduce intricacies to the estimation process.
The valuation principles underpinning the assessment of public spaces are rooted in economic theory, with a particular emphasis on real estate valuation methodologies (Real Estate Valuation, 2000; Jarecki, 2020). According to prevailing definitions in real estate markets, the value ascribed to public spaces is reflective of the potential market prices these spaces could command (Adamus and Przygodzki, 2022). Three predominant approaches are conventionally employed to appraise such values: the comparative, income, and cost methodologies (Blaug, 2000). It is noteworthy that Polish legislation also accommodates a mixed approach to real estate valuation, as stipulated in the Law of August 21, 1997, on Real Estate Management.
The comparative approach, a methodological staple, derives market value through the juxtaposition of sales prices of analogous properties. However, its applicability diminishes when assessing sea spaces, characterized as non-tradable entities with negligible market activity.
Conversely, the income approach posits that the revenue generated by a property is a primary determinant of its value (Jarecki, 2020). This method is particularly germane when evaluating properties facilitating income generation, as is the case in shipping, where it computes the revenue accrued by shipowners from specific voyages, owing to access to marine areas. However, its limitation lies in its susceptibility to global economic dynamics, as shipowners’ profit margins are contingent upon prevailing market forces.
The cost approach encompasses methodologies such as the replacement cost method (RCM), delineating the replacement value of the property, and the component replacement cost method, quantifying the cost of substituting components with analogous functions and characteristics (Adamus and Przygodzki, 2022). This approach assumes relevance in sea spaces, especially concerning alterations in shipping routes attributable to external factors such as the installation of wind farms.
The mixed approach amalgamates facets of the comparative or income methodologies but is deemed less germane for computing spatial rent in the context of shipping.
The distinctive attributes of sea space, characterized by near-impossibility of exclusion and concurrent utilization by multiple stakeholders, necessitate novel valuation methodologies due to the absence of a conventional market for sea usage in the shipping domain (Fausold and Lilieholm, 1999). The valuation of non-market goods first found systematic consideration in the United States during the 1950s. According to Price (2003), the following methods of determining the monetary value of non-market goods can be considered:
a) market priced benefits that, due to the impact of non-market goods, have been created or lost elsewhere;
b) saving on financial costs or making investments elsewhere;
c) comparisons of the price of non-market goods that are traded elsewhere;
d) voluntary contributions, which are transferred due to the availability of a non-market good;
e) the willingness of consumers and customers, as well as policymakers and experts, to pay for access to a non-market good or the willingness to accept (WTA) compensation for the loss of a non-market good;
f) obtaining assumed benefits or avoiding certain costs based on past decisions; and
g) the willingness to pay (WTP) for market goods that enable access to non-market goods.
The literature identifies two basic groups of methods for valuing non-market goods: direct and indirect ones.
Direct valuation methods are grounded in stated preference methods (SPMs), where potential consumers make choices in a hypothetical market that does not exist and is not subject to market exchange (Przygodzki, Waleski, 2021). These methods encompass the contingent valuation (CV) method, including the Willingness to Pay (WTP) and Willingness to Accept (WTA) methods, and the contingent choice/choice experiment (CE) method (de Groot, 2006; Champ et al., 2017). The CV method collects information about WTP for benefits or WTA compensation for losses through surveys (Bogdani, 2015), widely applied in environmental valuation (Boyle, 2017), air quality protection (Sun et al., 2016; Akhtar et al., 2017; Ligus, 2018), rare species conservation (Richardson and Loomis, 2009), and cultural heritage (Noonan, 2003). The CE method, similar to the CV method, employs surveys to assess respondents’ preferences, especially suitable for goods with many dimensions (Marks-Bielska and ZIelińska, 2014), and is applied in marketing, transportation, and environmental protection, including climate change mitigation (Layton and Brown, 2000), water quality (Abou-Ali, Carlsson, 2004), and biodiversity valuation (Christie et al., 2006).
Indirect methods pertain to revealed preference methods (RPMs) and involve surrogate markets, where preferences are observed by analyzing prices of other goods and services in the market (Żylicz, 2017). These methods include travel cost models (TCMs), hedonic pricing method (HPM), averting behavior analysis (ABA), substitution methods, and the benefit transfer method (BTM).
Hedonic pricing models establish a link between the price of a market product and its characteristics, often employed to analyze the impact of environmental goods, sea access, or open space on the real estate market (Liebelt et al., 2018; Czechowski et al., 2023).
The travel cost method assumes that the more people visit a place, the more valuable it is (Giergiczny, 2016), primarily used to value recreation sites linked with natural assets (Zhang et al., 2015).
Averting behavior analysis pertains to the value of actions taken to protect against environmental hazards, assessing risks related to pollution or potential pollution (Lloyd-Smith et al., 2018).
Substitution methods, in contrast to consumer-focused approaches, rely on supply data and production costs to estimate the value of a service/good of interest, with examples including the replacement cost method (RCM) and resource equivalency analysis (REA) (Brown, 2017; Freeman et al., 20214).
The benefit transfer method is employed when constraints prevent the conduct of empirical field research (Brouwer, 2000). It estimates the value of non-market goods by leveraging results from previous surveys (Plummer, 2009; Bartczak, 2013), involving unit value transfer (UVT) and benefit function transfer (BFT) (Rosenberger and Loomis, 2017) modes of analysis.
As the literature analysis shows, there is no single ideal method for valuing public space (Table 1).
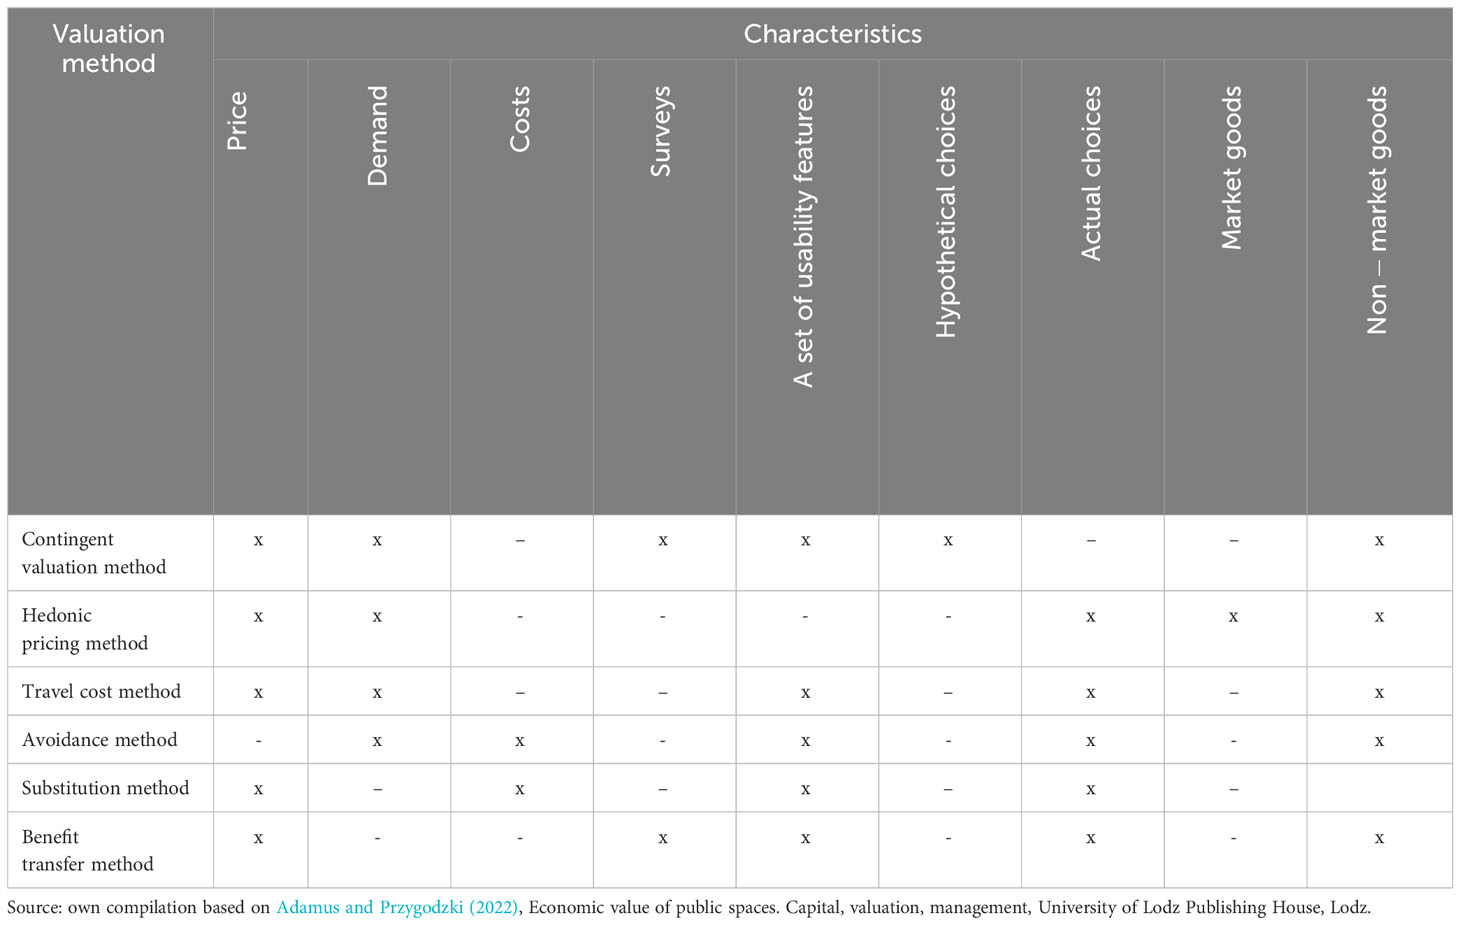
Table 1 Matrix of the characteristics of spatial valuation methods.
Table 1 illustrates the diversity among alternative valuation methods. These methods vary, some relying on observations of actual behavior, while others estimate value through surveys and claimed behavior. The distinctions highlight that no single method is universally applicable for all valuation needs. Therefore, the selection of a method should be context-dependent, considering the nature of the good being valued.
When evaluating the value of marine areas for their use as natural transportation infrastructure, several conventional valuation methods face limitations. The income approach, though suitable in principle, encounters challenges in valuing the income derived from utilizing sea space. The contingent valuation (CV) method, relying on user surveys, often yields biased results with users displaying zero willingness to pay (WTP) and excessively high willingness to accept (WTA).
Hedonic pricing is unsuitable due to the intricate impact of shipping on the prices of other goods and services, while the contingent choice/choice experiment (CE) method is hindered by established and optimal shipping routes that shipowners are reluctant to alter.
A viable alternative is the substitute/alternative cost method, which determines the value of a marine area by calculating the additional costs shipowners would incur if the area were closed to shipping. This includes additional costs like fuel, oils, consumables, wages, depreciation, and fixed plant costs. However, a drawback of this method is the substantial cost variations among different types of ships, resulting in differing values for the same marine area.
For instance, the recent blockade of Russian trade due to geopolitical events highlights the challenges in applying this method. Despite the blockade, creative legal maneuvers are employed to bypass restrictions, underscoring the complexity of assessing the economic impact on the Russian economy.
In conclusion, the discussion underscores the absence of a readily applicable method for calculating the value of marine areas in economic theory. The income approach appears to be the most promising direction for valuation, although challenges persist in developing a comprehensive and universally applicable methodology.
To determine the factors affecting the value of marine area and the value of shipping spatial rent, the following assumptions were made at the outset:
a) It is impossible for more than one user to use the same marine area at the same time.
b) On the other hand, it is possible to measure the difference in intensity of the use of marine area over the study period (year).
c) A vessel’s marine area occupancy in a voyage is derived from static factors such as the voyage distance (measured in Nm) and the width of the vessel, including the mandatory safety zone on both sides, and dynamic factors such as the vessel’s service speed, wind strength and direction, and water direction and speed.
d) Given the enormous amount of data describing ship traffic at sea (billions of records per month), it is necessary to narrow the analysis to one body of water and for one period – a full calendar year.
e) Every sea area frequented by commercial vessels has recorded data informing all voyages in the Automatic Identification System (AIS) database.
f) It is possible to determine at an average level the size of shipowners’ operating costs and the average level of margins in commercial shipping in each segment of the shipping industry.
The analysis began with the utilization of Automatic Identification System (AIS) data, which serve to identify ships and convey crucial information such as their type, current position, course, and speed. Obtained from the Helsinki Commission (HELCOM) AIS network collection, the data for 2020 were accessed, representing the traffic volume of all International Maritime Organization (IMO)-registered vessels in the Baltic Sea. The data were categorized by ship types and recorded using a 1 km2 resolution raster grid.
The AIS data, operated by HELCOM since 2006, were retrieved from the Baltic Sea AIS data bank through the following link: https://maps.helcom.fi/website/mapservice/ (accessed on 6/12/2022). These data provided comprehensive insights into ship movements, enabling the analysis of maritime traffic intensity over different time spans. To ensure compatibility with future results and maintain consistency with the original HELCOM data, spatial analyses retained the grid layout corresponding to the HELCOM schema and the European Terrestrial Reference System (ETRS) Lambert Azimuthal Equal Area (LAEA).
ArcGIS software (version 10.2.2) was employed for spatial analyses, using basic tools for processing. The study area encompassed the Polish marine region, excluding specific lagoons, with a focus on smaller seaports to capture their significance in vessel traffic analysis. A raster masking layer was crafted to define the spatial scope and facilitate map algebra functions.
Raster AIS data from 2020, obtained from the HELCOM database, formed the basis for spatial analysis. Map algebra tools were employed to prepare 10 rasters, each corresponding to the traffic volume of selected vessel types. The raster values were sequentially assigned to the center point of each pixel.
Upon completion of the information extraction and conversion to a vector object class, the entire dataset, comprising 30,161 records, was exported to the tabular format of the Microsoft database (MDB), which is predestined to mixed-version environment. These records encapsulated the location details for all raster pixels within the Polish marine areas and included essential AIS data for the subsequent research on valuing marine areas.
The Margin Profit (MP) method has been employed for the valuation of marine areas dedicated to commercial shipping, facilitating the subsequent determination of spatial rent derived from them. The underlying principle asserts that the profitability realized by a user, such as a shipowner, through the movement of a vessel within a specific marine area is a pivotal factor in establishing the value of spatial rent.
The methodology involves establishing a correlation between a shipowner’s daily profits and the spatial unit of one square kilometer. Additionally, through the computation of the average distance covered by a ship within this specified area, the Margin Profit method facilitates the determination of spatial rent per 1 km² for the shipowner. This approach provides a quantitative foundation for assessing the economic value associated with the use of marine areas for commercial shipping activities.
This calculation was executed through the following sequence of research steps:
1. Establishment of the study area and collection of dynamic AIS vessel traffic data.
The marine area of Poland was selected based on the accessibility of comprehensive AIS data, which covers the entirety of ship traffic. The data, sourced from HELCOM (as mentioned earlier), comprises the ordinal number of the record, the total count, and the number of various types of commercial ships (see Table 2) registered in a specific ‘pixel’ area. The dataset also includes the geographic coordinates of the upper leftmost point and the lower rightmost point of the pixel.
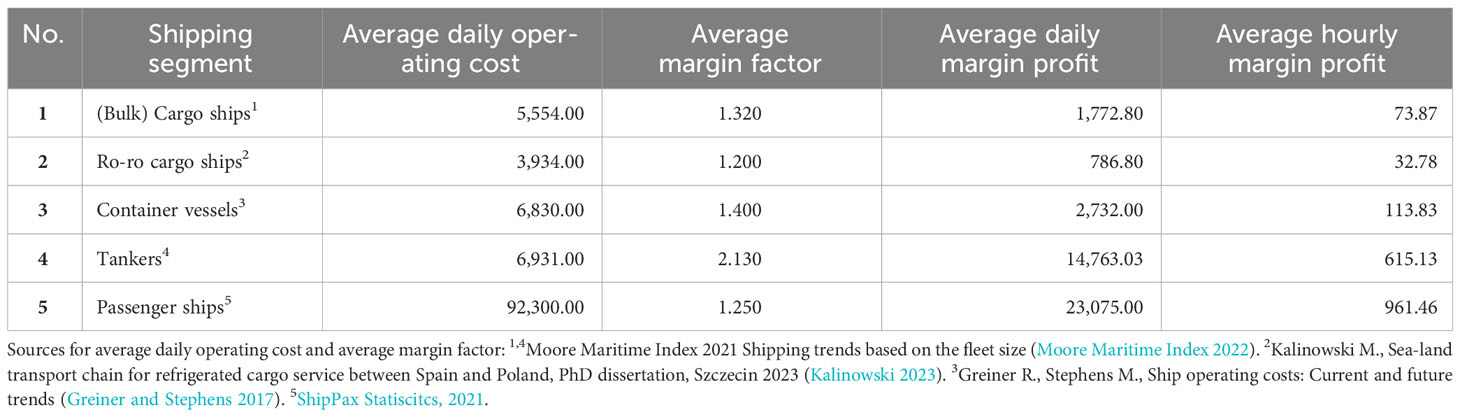
Table 2 Average operating costs and margin profits in selected shipping segments [EUR].
2. Determination of the average daily profit values of a shipowner based on the margin on operating costs in commercial shipping by 5 types of ships.
Shipowners, predominantly private companies, are not obligated to publicly disclose data on the economic efficiency of individual voyages. However, a common practice for estimating shipowner profits involves calculating margins based on projected operating costs. Consequently, the initial challenge was to determine a shipowner’s operating costs over a given period (day), enabling subsequent calculation of the shipowner’s profit as a percentage of these costs. While this approach simplifies the calculation, it’s worth noting that economic models of shipping vary notably between tramp and liner shipping, where prices are determined by liner tariffs rather than freight rates. Nonetheless, with the available data, it is feasible to retrospectively determine the margin level of a specific shipowner based on their overall revenues and operating costs.
Financial data were gathered from various sources, with a crucial emphasis on obtaining operating cost values in a consistent format. This included manning costs, stores and lubricants, repairs and maintenance, as well as insurance and general costs (Stopford, 2009), while excluding other expenses such as travel, capital, and port fees. The exclusion of these costs is significant as the margin assumed in shipowning company calculations typically pertains specifically to operating costs. Consequently, the results obtained from the margin indicators allow for meaningful comparisons across all five segments of commercial shipping.
To ensure methodological accuracy, it would be appropriate to utilize the complete financial data of shipowners—both revenues and costs—to calculate their operating profits, recalibrated to a unit of time (day, year) per ship. This relationship is elucidated by the Equation 1.
where:
MPtk – average daily margin profit in period t for k type of vessel/shipping segment.
Itk – revenues of shipowning activities in period t for k type of vessel/shipping segment.
Ctk – activity costs for k type of vessel/shipping segment in period t.
Vtk – k type vessel’s/fleet’s utilization factor (share of the days at sea) in period t.
Nonetheless, there are instances where secondary sources (Greiner and Stephens, 2017) explicitly provide research-determined values of margin profits for specific segments of commercial shipping. In such cases, the computation of margin profits can be omitted.
In practical business scenarios, navigating an environment with restricted access to financial information, particularly when analyzing a sea area frequented by thousands of ships owned by numerous shipowners, presents challenges. Consequently, a simplification approach has been employed, entailing the determination of the average level of margin profits charged on a shipowner’s operating costs. A specified percentage of these costs is then used as a proxy for profits. This relation can be formulated as Equation 2.
where: Mk is an average margin factor for k type of vessel/shipping segment (see Table 2).
Real values (average daily operating costs and average margin factor) in the analyzed shipping segments were sourced from verified market studies or consultancy reports, as referenced in Table 2. The actual data on the average level were adopted based on the specific shipping segment, each reporting different daily costs and margin factors. The average daily margin profit results from multiplying these two values, while the average hourly margin profit has been calculated by dividing the average daily margin profit by 24.
For this purpose, it was necessary to determine, based on the full AIS vessel traffic database, the average speeds of vessel traffic based on the specified 5 types of vessels (shipping segments). The results of the measurements were as follows:
1. Cargo ships (including bulk and ro-ro) – 10.4 kn
2. Container vessels – 15.50 kn
3. Tankers – 10.43 kn
4. Passenger ships – 13.26 kn
These velocities have been used to determine the residence time of each ship in each pixel (i.e. square kilometer of sea space) at an average level. For simplicity of calculation, it was assumed that each ship travelled a given area corresponding to a pixel at 1.2071 km (0.6497 Nm). This is a theoretical assumption derived from averaging the minimum (1.0 km) and maximum (1.4142 km) distances that a ship can hypothetically travel in each pixel assuming its logical shortest distance. The result is therefore a weighted average of these two distances.
For the valuation of the average value of one square kilometer of PMA for shipping by, utilizing the margin profit method, the study incorporated the following data: shipping time for each type of ship in PMA throughout the year, the average hourly margin profit for each segment, and the average breadth of the respective ship types, as presented in Table 3.
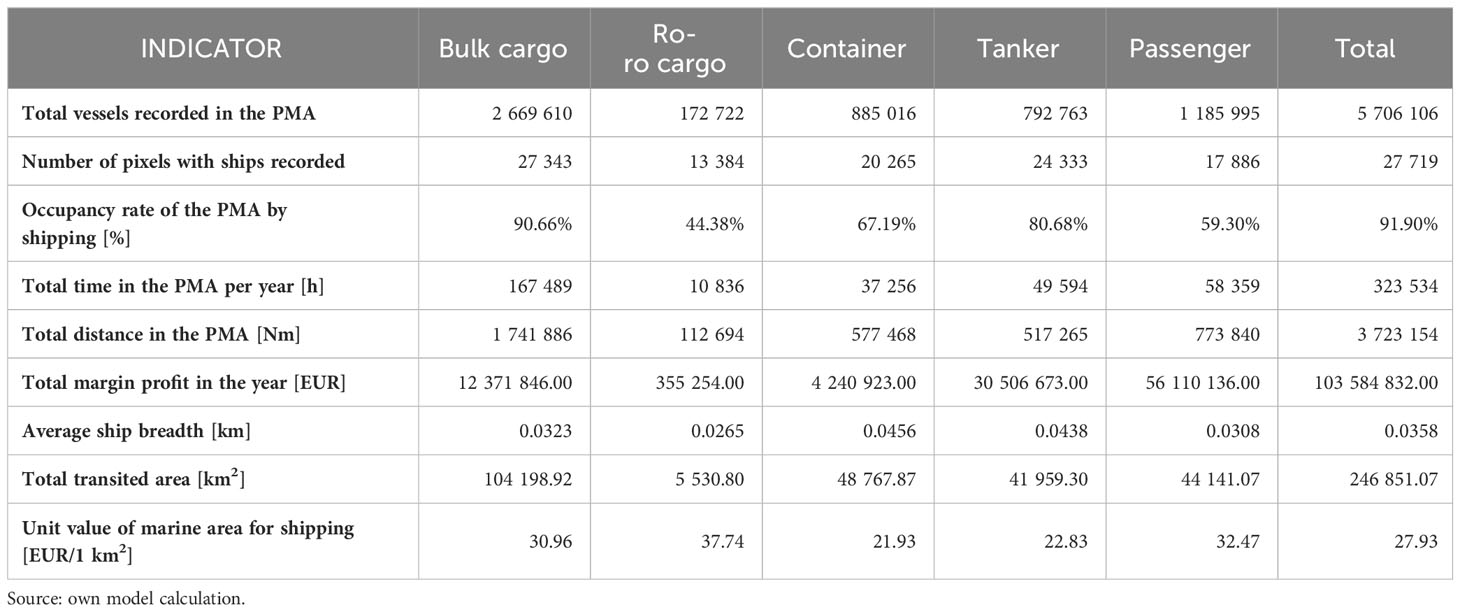
Table 3 Scoreboard of marine area utilization factors of the PMA (2020).
The estimation of the total value of a given pixel for shipping has been derived from the summation of all margin profits for all ships (from five shipping segments) transiting the area within a given period (year). The transited area At is determined by multiplying the total yearly voyage distance (performed by all ships in the given sector) by the breadth of the ships in transit.
It is imperative to account for the disparity in units, as maritime data often employs different units than the standard International System of Units (SI). Specifically, AIS results are presented in kilometers of transit, the ship’s breadth is measured in meters, and speed is given in knots (nautical miles transited in 1 hour). Consideration of these differences is crucial for accurate and consistent valuation. On average, the valuation can be computed as indicated in the Equation 3.
where:
VMA – average value of square kilometer of PMA in the given period [in currency unit],
MPt – margin profits of all shipowners for the given period in PMA [in currency unit/km2],
MPt = ∑k average hourly margin profit for a given shipping segment x time (in hours) spent for shipping in PMA in a given period of ships from a given shipping segment,
At – area occupied by all ships in the given period [km2].
The value of the margin profit for all shipping sectors is elucidated by Formula 1. For the specified period, it represents the aggregate of all margin profits accrued by shipowners engaged in all voyages within the designated area and time frame, encompassing all their vessels. Simultaneously, the transited area is calculated as the sum of the product of the total length of the route covered by the vessels (in kilometers) and their width (also measured in kilometers).
To present the results of the conducted calculations in a clear manner, a method based on listing descriptors according to the three-sigma (3-sigma) rule, described by Equation 4, was employed.
The introduced descriptors, derived from the three-sigma rule, enable the grouping of objects and their representation by a single value. This approach helps mitigate the impact of outliers that might otherwise distort the visualization significantly. While the fuzzy version of the rule is commonly utilized for anomaly detection (Kiersztyn et al., 2020; Kiersztyn et al., 2021; Kiersztyn and Kiersztyn, 2022), it is also applicable for visualization purposes.
For this paper, a matrix transformation was employed:
The computations conducted in accordance with the outlined methodology have yielded insights into crucial characteristics pertaining to the utilization of the Polish Marine Areas (PMA) by the shipping sector. Despite the study’s temporal constraint, limited to the year 2020, and its focus on the relatively modest sea expanse covering 30,161 km², several noteworthy conclusions have been drawn:
1. Shipping exhibits a pronounced and intensive use of the PMA, with an average utilization rate of 91.9%. This signifies that nearly 92% of the PMA experienced at least one voyage throughout the year, aligning with expectations given the substantial maritime traffic in the Baltic Sea. Such high utilization rates are less probable in larger bodies of water, such as open seas or oceans.
2. Consequently, only 8% of Poland’s marine area remains unutilized by shipping.
3. Segment-specific analysis reveals that bulk cargo demonstrates the highest degree of marine area utilization (90.7%), while ro-ro cargo exhibits the lowest (44.4%). These results underscore segment-specific behaviors, emphasizing that bulk tramp shipping adapts routes based on current demand, whereas ro-ro lines adhere to predefined, navigationally optimal corridors. Passenger shipping and container shipping segments display similar utilization patterns.
4. The findings are corroborated by the absence of specific shipping segments in certain pixels.
5. Varied traffic volumes per pixel were identified, with ro-ro cargo shipping registering the lowest value (419 ships per pixel) and passenger shipping the highest (6,847 ships per pixel). Dry bulk shipping also presented a substantial result (4,511).
6. Evaluation of the average level of ship traffic intensity revealed that ro-ro cargo shipping had the lowest values (13 ships on average), while passenger shipping and bulk cargo shipping recorded 66 and 98, respectively. Despite bulk cargo shipping exhibiting higher total shipping intensity and average ships per pixel, it occupies more space due to spatial dispersion.
7. In terms of time spent in Polish marine areas, bulk cargo fleets surpassed other segments, accumulating 167,489 hours in a year, nearly three times more than the second-ranked passenger shipping (58,359 hours). Ro-ro shipping recorded the shortest time.
8. The distance covered by ships in each segment within the PMA showcased bulk cargo shipping with the highest result, covering over 1.74 million nautical miles in 2020. Passenger shipping ranked second with 0.77 million nautical miles, while ro-ro shipping reported the lowest result (112 thousand nautical miles).
Transitioning to the critical matter of valuing marine areas for commercial shipping, Table 3 presents a comparative analysis of calculated values of operating costs and margin profits for each segment and collectively for all shipping. The ensuing results were obtained:
1. The bulk cargo segment exhibited the highest aggregate operating costs, surpassing EUR 38.7 million, whereas ro-ro cargo shipping reported the lowest at nearly EUR 1.8 million. Cumulatively, the total annual operating costs for shipowners in the Polish Marine Areas (PMA) amounted to EUR 87.9 million.
2. Evaluating the profitability of the operator business within the PMA across shipping segments unveiled passenger shipping as the most lucrative, generating an excess of EUR 56.1 million in margin profit for the year. Tanker shipping, falling within the spectrum of average space utilization rates, secured the second position. Bulk cargo shipping claimed the third position with an annual profit exceeding EUR 12.3 million. Container shipping, characterized by lower profit margins, yielded a profit of EUR 4.2 million in 2020. Ro-ro shipping recorded the lowest profit at just over EUR 355,000.
3. The aggregate value of margin profits exceeded EUR 103.58 million annually, positioning the shipping sector at the forefront in comparison to other blue economy industries, notably fisheries (Ciołek et al., 2018). A study by Psuty et al. (2021) demonstrated that only the offshore wind sector surpasses the shipping sector in generating a higher value of spatial rent.
4. The computation of average values for a square kilometer of PMA based on average vessel widths in each shipping segment resulted in an average unit value of EUR 27.93 per 1 km², with significant variation ranging from EUR -6.00/km² to EUR 9.81/km². The observed relationship between the average width of ships and the corresponding value of the occupied marine area unit indicates that, as the size of a ship increases, the value of the utilized unit of marine area tends to decrease. However, this relationship is nuanced and necessitates further in-depth analysis.
Table 3 succinctly summarizes the results of the computations leading to the aforementioned conclusions, while Figures 1–6 present visualizations for individual shipping segments and overall, for all shipping.
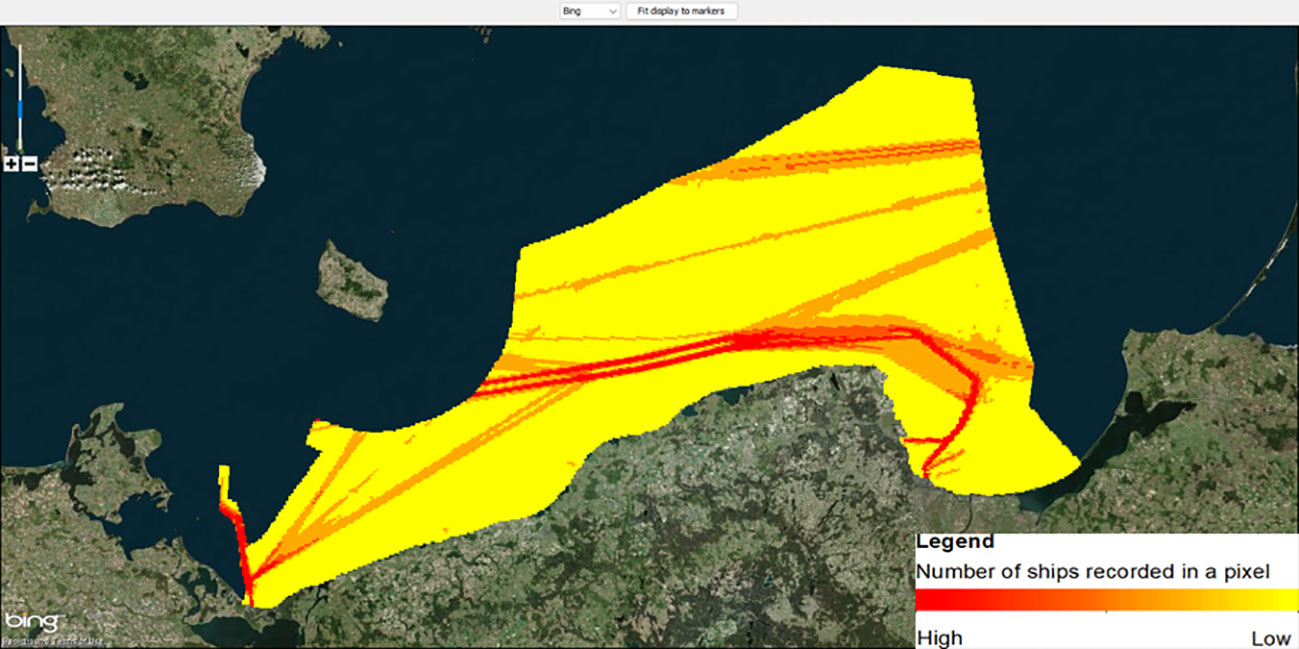
Figure 1 Polish marine area utilization by the generated margin profit of bulk cargo shipping.
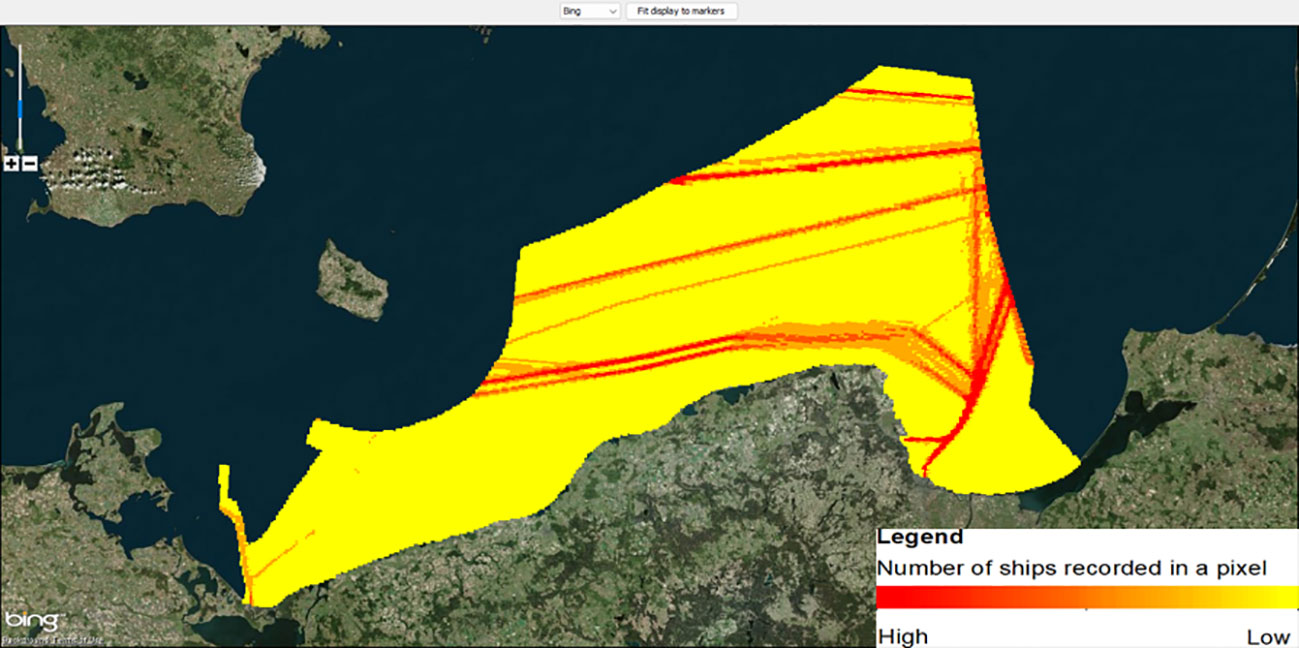
Figure 2 Polish marine area utilization by the generated margin profit of ro-ro cargo shipping.

Figure 3 Polish marine area utilization by the generated margin profit of container shipping.
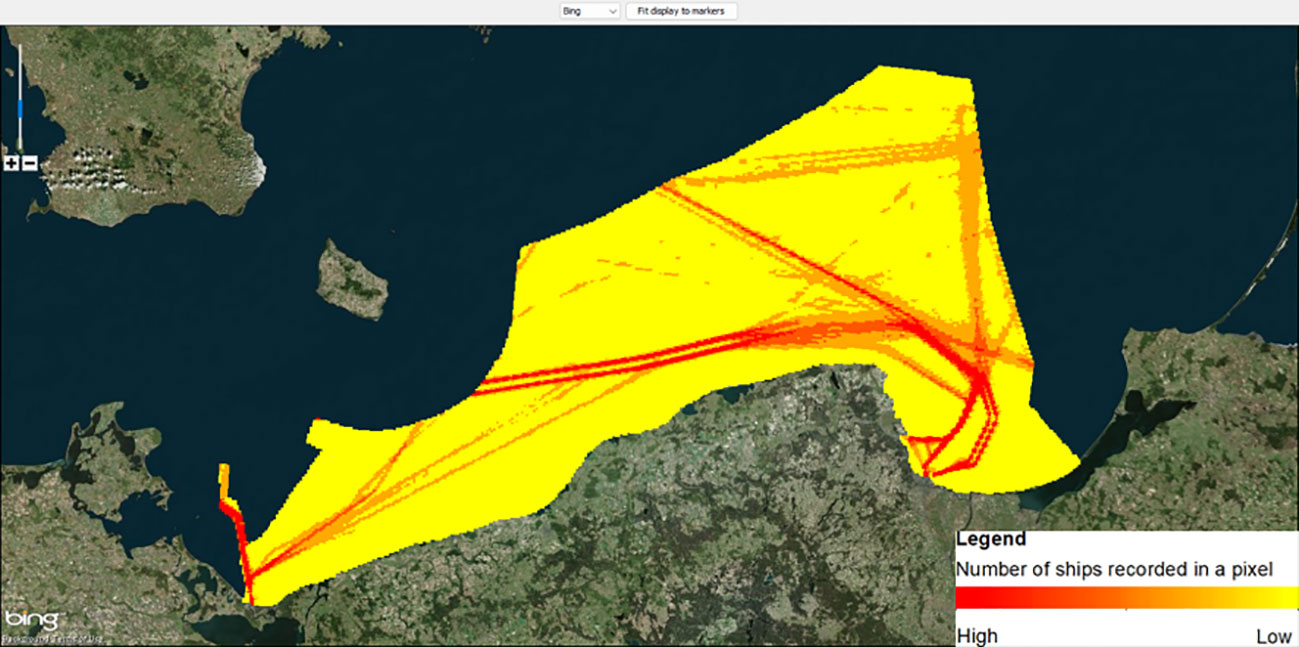
Figure 4 Polish marine area utilization by the generated margin profit of tanker shipping.

Figure 5 Polish marine area utilization by the generated margin profit of passenger shipping.

Figure 6 Polish marine area utilization by the generated margin profit of all merchant shipping segments.
Despite the mentioned simplifications, the value of marine areas (pixels) fluctuates due to factors such as shipping intensity and the types of ships calling each pixel. Therefore, considering the maximum values of marine areas for shipping segments is necessary, as presented in Table 4.
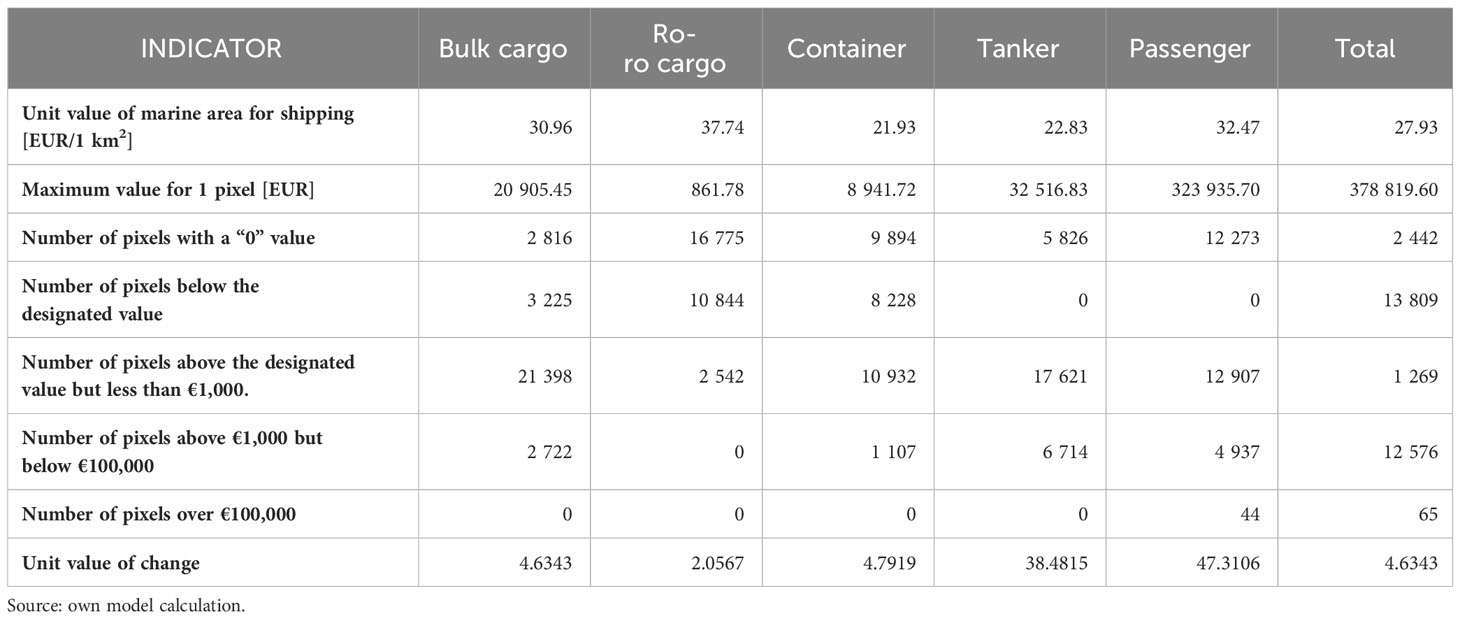
Table 4 Summarized values of PMA indicators.
In the passenger segment, the highest value that one pixel takes EUR 323,935.70, representing 85.5% of the value of the most valuable pixel for all segments of commercial shipping. This result highlights the significant density of passenger ship routes, as the incremental increase in the value of 1 pixel brought by an additional passenger ship is only EUR 4.63. The distribution of values is relatively similar, with a comparable number of pixels having values higher than the determined average (EUR 32.47/km2), and a similar number having values below this average.
Tanker shipping also shows high results, with the highest value of 1 pixel reaching EUR 32,526.83 and a leap value of EUR 38.48/km2. However, most records in this segment are in the group above the average pixel value (EUR 22.83/km2).
In contrast, ro-ro shipping has a maximum value per pixel of only EUR 861.78, with the lowest leap value of one ship per 1 pixel in the entire surveyed fleet, at only EUR 2.06/km2.
Larger maximum values were recorded for container shipping (EUR 8,941.72) and bulk cargo (EUR 20,905.45) for 1 pixel, with very similar leap values, approximately EUR 4.63-4.79 for one additional vessel.
Determining the leap value allows for estimating how much profit was generated by a given type of vessel passing through 1 pixel.
The theoretical methodologies employed in calculating spatial rent, particularly in the context of marine areas, warrant further research and refinement to enhance precision and account for a broader spectrum of influencing factors. Subsequent endeavors aimed at endorsing or computing this rent will necessitate legislative initiatives to establish a robust legal framework for implementation and enforcement. This framework will define the authority of the maritime administration, integrating it seamlessly into the national maritime policy structure.
The consideration of whether marine areas should be valued, regulated, and subject to any form of fiscalization that categorizes them as transport infrastructure may give rise to social dilemmas. Analogies to airspace rent systems can be contemplated, prompting questions regarding the payment for resources without associated financial costs.
Challenges arise from the variable extents of marine area utilization during voyages. Safety considerations, such as evading storms, may result in extended routes, thereby impacting the calculation of spatial rent. The introduction of fiscalization may also influence navigation decisions, potentially compromising safety (i.e. preferences to the shortest even riskier crossings).
The choice between static units (occupied area in m²) and dynamic units (occupied area at a given time in m²/h) for measuring marine area utilization requires careful consideration. Concerns also emerge from methodologies reliant on AIS data for valuation, where the imposition of fees in frequented corridors might induce route alterations to circumvent charges.
The results achieved are significantly influenced by the adopted value of the breadth of the vessel(s) for which the sea area used for the voyage is counted. Each additional meter of ship breadth with an unchanged margin value will reduce the computed value for the shipowner and potentially reduces the fiscalization capacity. A sensitivity analysis showed that by increasing the breadth of a ship by 1%, the value of sea space per 1 km2 decreases by 0.99% and this applies to each shipping segment. By decrease of the breadth, we observe in turn an increasing value of the marine area.
However, this rule cannot be applied arbitrarily, as vessel breadth largely determine the size (class) of the vessel, and therefore also the daily charter rate and, further, the daily margin profit. It is not possible to indicate a precise type and class of the vessel only by the breadth, to be able to assign them to a specific group of charter rates and margin profit generation capacity. Therefore, the only way to minimalize (or eliminate) the error risk is to eliminate data gaps by implementing real data for all vessels reported in the given period, in the given area for the purpose of marine area valuation. It can be therefore postulated to AIS operators to extend the database by additional dynamic indicator called “area used” as the multiplication of the breadth of the ship and her voyage (in a given time) distance passed.
Market fluctuations in a given basin each year pose a risk to historical AIS data-based methods. Verification over an extended period, including periods affected by pandemics, becomes crucial to maintain method objectivity.
The issue of marine area substitutability adds complexity to valuation, given the myriad alternative routing options. The role of shipping in broader economic growth and development, particularly in maritime spatial development scenarios, necessitates consideration beyond the private shipowner benefits. This involves incorporating multiplier effects on the entire national economy.
Moreover, the modest average value of spatial rent prompts contemplation on the necessity of adopting a broader perspective regarding the role of shipping in growth and development processes. In an extreme scenario where accessibility to ports is obstructed due to ongoing maritime spatial development, it could instigate catastrophic implosion processes, impeding the functioning of the entire national economy. Presently, the valuation of marine areas for shipping is primarily monetized through the lens of the benefits accrued to private shipowners. However, there is a burgeoning need to consider the multiplier effects of this transportation on the development of the entire national economy. This is a complex matter, particularly given the use of the PMA for transit purposes.
As progressively larger portions of the PMA will be excluded from shipping activities in favor of permanent structures such as wind farms, floating photovoltaic installations, and mariculture, the concentration of shipping in specific areas will lead to a rapid escalation in the value of shipping spatial rent. Economic equilibrium models suggest that the process of expanding sea areas occupied by renewable energy should culminate in the equalization of spatial rents per km² for both types of uses. The question arises as to whether maritime spatial development policy should be structured based on such a mechanism, or whether shipping routes should be regarded as a public good (like roads on land) essential for the overall functioning of the economy. Nevertheless, a dilemma surfaces regarding which routes should be designated for protection.
Future sensitivity analyses should explore changes in marine area value concerning alterations in model indicators such as the number of ships, ship speed, breadth, freight rates, operating costs, and fuel costs. This analytical approach is indispensable for informed policymaking regarding marine area fiscalization.
In terms of the toolbox optimization of the methodology, there are also possible directions for optimization. one of these could be the method of measuring the trajectory of vessels from sources other than AIS. Chen et al. proposed in 2023 an AI-based speed extraction option via port-like videos, but strictly related to the terminal AGV movements (Chen et al., 2023). It is the question of time, when AI will interfere on the vessels traffic, also including predictions. In marine areas with particularly heavy traffic can be predicted by the scientometric methods, social network analysis, and Stochastic Actor-oriented Model (SAOM) or in hybrid version with the Subject-Action-Object (SAO) structural information (Xiao et al., 2023).
Special attention should be given in the future also to the issue of time representativeness of marine traffic taken for the fiscalization method. As Xu et al. (2022) proved via the Baltic Dry Index (BDI), COVID-19 has had a strong impact on the bulk shipping market towards drastically decrease. This leads to the statement, that the longer the time taken to measure the movement of vessels (years) in a given area, the more precise the calculation of the value of that area will be. The same index with their volatility could be implemented as the indicator for costs-revenues of a shipping owner relation, proving the instability of the base for marine area valuation, especially when other, external factors (like oil prices changes, wars, locks or strikes). This, however, requires before a correlation measurement to the margin profits to avoid inconsistencies in the computation (Baumol and Bowen, 1965).
The conclusions derived from the research are outlined as follows:
1. The absence of a universally accepted method for valuing shipping spatial rent is evident. The method proposed in this article serves as a methodological suggestion, and its applicability can be compared with other approaches, such as the Contingent Valuation (CV) method and Replacement Cost Method (RCM).
2. The effective valuation of marine areas and, specifically, shipping routes as public goods currently lacks a standardized method. Further exploration in this direction is recommended, considering the externalities of maritime transport and multiplier effects, particularly those associated with value creation on land through port activities.
3. Marine areas exhibit variations in economic potential, accessibility (navigable bodies vs. shipping lanes), and management systems (free access to open seas vs. paid use of port basins). The exploration of charging users for marine area utilization, as observed in costs for owners of offshore wind energy facilities, is deemed necessary.
4. The utilization of marine areas, encompassing both navigable and non-navigable bodies (constituting 8% in the Polish Marine Areas - PMA), varies among shipowners, prompting inquiries into how fees should align with the attractiveness of a specific marine area to different users.
5. Despite obvious simplifications, the Margin Profit Method offers an objective means to ascertain the value of a water body for the shipping industry and its segments, mitigating subjective evaluations by market participants. The method, however, requires further refinement.
6. Precision in determining values necessitates a comprehensive data collection system on ship movements and parameterization, encompassing ship type, breadth, service speed, total time in a water body, and trajectory. Overcoming challenges may involve accessing shipowners’ financial results for each voyage.
7. Quantifying the unit increment of marine area utilization for 1 pixel with an additional ship can provide insights into potential policies for fiscalizing marine areas, representing a shipowner’s unit charge for its use.
8. In the current stage of MSP, inquiries of this nature should be employed in an ex-post manner to avoid disrupting existing shipping patterns. They can serve as boundary-spanning objects, fostering cross-sectoral discussions on the effectiveness of MSP (Saunders et al., 2020). Despite imperfections, these estimates contribute to discussions on distributive justice in MSP, addressing the allocation of costs and benefits.
The data analyzed in this study is subject to the following licenses/restrictions: Dataset purchased on commercial rules and cannot be published. Requests to access these datasets should be directed to ZXJuZXN0LmN6ZXJtYW5za2lAdWcuZWR1LnBs.
EC: Conceptualization, Methodology, Writing – original draft, Writing – review & editing. JZ: Funding acquisition, Project administration, Supervision, Validation, Writing – review & editing. AO: Data curation, Formal analysis, Investigation, Resources, Software, Validation, Writing – original draft. AK: Formal analysis, Investigation, Software, Visualization, Writing – original draft. JP: Data curation, Formal analysis, Investigation, Software, Writing – original draft. DC: Formal analysis, Investigation, Software, Visualization, Writing – original draft.
The author(s) declare financial support was received for the research, authorship, and/or publication of this article. This work was supported by the Polish National Science Centre, grant 2018/31/B/HS4/03890, “Multiplier effects of marine area”.
The authors are grateful to the supportive staff from the University of Gdansk, Gdynia Maritime University and Lublin University of Technology for assisting with administrative elements between the institutions and for organizing the fieldwork support.
The authors declare that the research was conducted in the absence of any commercial or financial relationships that could be construed as a potential conflict of interest.
All claims expressed in this article are solely those of the authors and do not necessarily represent those of their affiliated organizations, or those of the publisher, the editors and the reviewers. Any product that may be evaluated in this article, or claim that may be made by its manufacturer, is not guaranteed or endorsed by the publisher.
(2015). Studium Uwarunkowań Zagospodarowania Spatialnego Polskich Obszarów Morskich wraz z analizami przestrznymi (Gdańsk: Maritime Institute in Gdańsk). Available at: www.umgdy.gov.pl/plan_morski/studium-uwarunkowan-zagospodarowania-przestrzennego-polskich-obszarow-morskich/.
Act of March 21. (1991). On maritime areas of the Republic of Poland and maritime administration (consolidated text Dz.U. @ of 2023 No. 960).
Abou-Ali H., Carlsson F. (2004). “Evaluating the welfare effects of improved water quality using the choice experiment method,” in Working Papers in Economics (Gothenburg: University of Gothenburg, Department of Economics).
Adamus J., Przygodzki Z. (2022). Economic value of public spaces. Capital, valuation, management (Lodz: University of Lodz Publishing House).
Akhtar S., Saleem W., Nadeem V. M., Shahid I., Ikram A. (2017). Assessment of willingness to pay for improved air quality using contingent valuation method. Global J. Environ. Sci. Manage. 3 (3), 279–286. doi: 10.22034/gjesm.2017.03.03.005
Barbesgaard M. (2019). Ocean and land control-grabbing: The political economy of landscape transformation in Northern Tanintharyi, Myanmar. J. Rural Stud. 69, 195–203. doi: 10.1016/j.jrurstud.2019.01.014
Bartczak A. (2013). “Benefit transfer (BT) method,” in Values of non-market benefits from forests. Methods of valuation and application of results in economic analysis (Warsaw: Warsaw Center for Ecological Economics), 65–73.
Baumol W. J., Bowen W. G. (1965). On the performing arts: the anatomy of their economic problems. Am. Economic Rev. 55 (1/2), 495–502.
Bogdani M. (2015). “Value of a monument - a look from the perspective of the real estate market,” in Systems of valuing heritage. State of research and problems. Ed. Szmigina B. (Warsaw-Lublin: Lublin University of Technology, Polish National Committee of ICOMOS), 9–24.
Boyle K. J. (2017). “Contingent valuation in practice,” in A Primer on Nonmarket Valuation. Eds. Champ P. A., Boyle K. J., Brown T. C. (Dordrecht: Springer), 83–132. doi: 10.1007/978-94-007-7104-8_4
Brouwer R. (2000). Environmental value transfer: state of the art and future prospects. Ecol. Economics 32 (32), 137–152. doi: 10.1016/S0921-8009(99)00070-1
Brown T. C. (2017). “Substitution methods,” in A Primer on Nonmarket Valuation. Eds. Champ P. A., Boyle K. J., Brown T. C. (Dordrecht: Springer), 347–390. doi: 10.1007/978-94-007-7104-8_4
Carlile P. R. (2002). A pragmatic view of knowledge and boundaries: Boundary objects in new product development. Organ Sci. 13, 442–455. doi: 10.1287/orsc.13.4.442.2953
Champ P. A., Boyle K. J., Brown T. C. (Eds.) (2017). A Primer on Nonmarket Valuation (Dordrecht: Springer).
Chen X., Wang Z., Hua Q., Shang W.-L., Luo Q., Yu K. (2023). “AI-empowered speed extraction via port-like videos for vehicular trajectory analysis,” in IEEE Transactions on Intelligent Transportation Systems, Vol. 24. 4541–4552. doi: 10.1109/TITS.2022.3167650
Christie M., Hanley N., Warren J., Murphy K., Wright R., Hyde T. (2006). Valuing the diversity of biodiversity. Ecol. Economics 58 (2), 304–317. doi: 10.1016/j.ecolecon.2005.07.034
Ciołek D., Matczak M., Piwowarczyk J., Rakowski M., Szefler K., Zaucha J., et al. (2018). The perspective of Polish fishermen on maritime spatial planning. Ocean & Coastal Management 116, 113–124. doi: 10.1016/j.ocecoaman.2018.07.001
Czechowski P. O., Romanowska A., Czermanski E., Oniszczuk-Jastrząbek A., Wanagos M. (2023). An attempt to determine the relationship between air pollution and the real estate market in 2010-2020 on the example of Gdańsk using GLM and GRM statistical models. Sustainability 15, 2471. doi: 10.3390/su15032471
de Groot R. (2006). Function-analysis and valuation as a tool to assess land use conflicts in planning for sustainable, multi-functional landscapes. Landscape Urban Plann. 75, 182. doi: 10.1016/j.landurbplan.2005.02.016
Ehler C., Zaucha J., Gee K. (2019). “Maritime/marine spatial planning at the interface of research and practice,” in Maritime Spatial Planning. Eds. Zaucha J., Gee K. (Cham: Palgrave Macmillan). doi: 10.1007/978-3-319-98696-8_1
Freeman III A.M., Herriges J. A., Kling C. L. (2014). “Resource evaluation and public policy,” in Measurement of Environmental and Resource Values. Theory and Methods (New York: Routledge).
Giergiczny M. (2016). “Recreational value of bialowieza national park,” in Economics and Environment (Białystok, Poland; Białystok University Of Technology), vol. 2. , 116–128.
Greiner R., Stephens M. (2017). Ship operating costs: current and future trends (London, UK: Moore Stephens).
Jarecki P. (2020). Selected behavioral aspects of real estate valuation (Lodz: University of Lodz Publishing House).
Kalinowski M. (2023). Sea-land transport chain for handling refrigerated cargo between Spain and Poland (Szczecin, Poland: doctoral dissertation).
Kiersztyn A., Karczmarek P., Kiersztyn K., Pedrycz W. (2020). “The concept of detecting and classifying anomalies in large data sets on a basis of information granules,” in 2020 IEEE International Conference on Fuzzy Systems (FUZZ-IEEE). 1–7, IEEE. doi: 10.1109/FUZZ48607.2020.9177668
Kiersztyn A., Karczmarek P., Kiersztyn K., Pedrycz W. (2021). Detection and classification of anomalies in large datasets on the basis of information granules. IEEE Trans. Fuzzy Syst. 30 (8), 2850–2860. doi: 10.1109/TFUZZ.2021.3076265
Kiersztyn K., Kiersztyn A. (2022). “Fuzzy rule-based outlier detector,” in 2022 IEEE International Conference on Fuzzy Systems (FUZZ-IEEE). 1–7, IEEE. doi: 10.1109/FUZZ-IEEE55066.2022.9882567
Layton D. F., Brown G. (2000). “Heterogeneous preferences regarding global climate change,” in The Review of Economics and Statistics (Massachusetts, USA, MIT), vol. 82. , 616–624. doi: 10.1162/003465300559091
Liebelt V., Bartke S., Schwarz N. (2018). “Hedonic pricing analysis of the influence of urban green spaces onto residential prices: the case of Leipzig,” in European Planning Studies, vol. 26. (Germany: Taylor & Francis), 133–157. doi: 10.1080/09654313.2017.1376314
Ligus M. (2018). Measuring the willingness to pay for improved air quality: A contingent valuation survey. Polish J. Environ. Stud. 27 (2), 763–771. doi: 10.15244/pjoes/76406
Lloyd-Smith P., Schram C., Adamowicz W., Dupont D. (2018). “Endogeneity of risk perceptions in averting behavior models,” in Environmental and Resource Economics (Springer Nature, The Netherlands), vol. 69. , 217–246. doi: 10.1007/s10640-016-0075-6
Marks-Bielska R., Zielińska A. (2014). The non-Productive functions of forests. Economics Environ. 1 (48), 34–45.
Moore Maritime Index (2022). 2021 Shipping Trends based on the fleet size (Piraeus, Greece: Moore Stephens Chartered Accountants).
Noonan D. S. (2003). Contingent valuation and cultural resources: A meta-Analytic review of the literature. J. Cultural Economics 27 (3-4), 159–176. doi: 10.1023/A:1026371110799
Plummer M. L. (2009). Assessing benefit transfer for the valuation of ecosystem services. Front. Ecol. Environ. 7 (1), 38–45. doi: 10.1890/080091
Price C. (2003). “Quantifying the aesthetic benefits of urban forestry,” in Urban Forestry and Urban Greening (Amsterdam, The Netherlands), vol. 1. , 123–133. doi: 10.1078/1618-8667-00013
Przygodzki Z., Waleski I. (2003). Estimating the value of dissonant cultural heritage. valuation of non-market goods using the stated preference methods on the example of a modernistic office and commercial complex. Acta Universitatis Lodziensis. Folia Oeconomica 1 (352), 7–23. doi: 10.18778/0208-6018.352.01
Psuty I., Zaucha J., Mytlewski A., Suska M., Szymanek L. (2021). The use of the contribution margin on the valorisation of Polish fisheries for maritime spatial planning. Ocean Coast. Manage. 211, 105751. doi: 10.1016/j.ocecoaman.2021.105751
Ricardo D. (1966). The Principles of Political Economy and Taxation. 3rd Edition (New York: E.P. Dutton), 1821.
Richardson L., Loomis J. (2009). “The total economic value of threatened, endangered and rare species: An updated meta-analysis,” in Ecological Economics (Elsevier), vol. 68. , 1535–1548. doi: 10.1016/j.ecolecon.2008.10.016
Rosenberger R. S., Loomis J. B. (2017). Benefit Transfer, “A primer on nonmarket valuation”, Springer Netherlands, pp. 431–462. Available at: https://link.springer.com/chapter/10.1007/978-94-007-7104-8_11.
Saunders F., Gilek M., Ikauniece A., Tafon R. V., Gee K., Zaucha J. (2020). Theorizing social sustainability and justice in marine spatial planning: democracy, diversity, and equity. Sustainability 12 (6), 2560. doi: 10.3390/su12062560
Schultz-Zehden A., Weig B., Lukic I. (2019). “Maritime spatial planning and the EU's blue growth policy: past, present and future perspectives,” in Maritime Spatial Planning. Eds. Zaucha J., Gee K. (Cham: Palgrave Macmillan). doi: 10.1007/978-3-319-98696-8_6
Spatial development plan for internal marine waters, territorial sea and exclusive economic zone at a scale of 1:200,000, Ordinance of the Council of Ministers of April 14, 2021. (Journal of Laws of 2021, item 935).
Star S. L., Griesemer J. R. (1989). Institutional ecology, 'translations,' and boundary objects: Amateurs and professionals in Berkeley's Museum of Vertebrate Zoology 1907_1939. Soc. Stud. Sci. 19, 387–420. doi: 10.1177/0306312890190030
Stopford M. (2009). Maritime Economics. 3rd Edition (London and New York: Routledge Tylor & Francis Group).
Sun Ch., Yuan X., Xu M. (2016). The public perceptions and willingness to pay: from the perspective of the smog crisis in China. J. Cleaner Production 112 (2), 1635–1644. doi: 10.1016/j.jclepro.2015.04.121
Tafon R., Saunders F., Zaucha J., Matczak M., Stalmokaite I., Gilek M., et al. (2023). Blue justice through and beyond equity and participation: a critical reading of capability-based recognitional justice in Poland's marine spatial planning. J. Environ. Plann. Manage. 66, 1–23. doi: 10.1080/09640568.2023.2183823
Tuda A. O., Stevens T. F., Rodwell L. D. (2014). Resolving coastal conflicts using marine spatial planning. J. Environ. Manage. 133, 59–68. doi: 10.1016/j.jenvman.2013.10.029
Vince J., Day J. C. (2020). Effective integration and integrative capacity in marine spatial planning. Maritime Stud 19, pp. 317–332. doi: 10.1007/s40152-020-00167-1
Xiao G., Chen L., Chen X., Jiang Ch., Ni A., Zhang Ch. And Zong F. (2023). “A hybrid visualization model for knowledge mapping: scientometrics, SAOM, and SAO,” in IEEE Transactions on Intelligent Transportation Systems. doi: 10.1109/TITS.2023.3327266
Xu L., Zou Z., Zhou S. (2022). The influence of COVID-19 epidemic on BDI volatility: An evidenve from GARCH-MIDAS model. Ocean Coast. Manage. 229, 106330. doi: 10.1016/j.ocecoaman.2022.106330
Zaucha J. (2018). The perspective of Polish fishermen on maritime spatial planning Ciołek Dorota, Matczak Magdalena, Piwowarczyk Joanna. Ocean & Coastal Management 116, 113–124. doi: 10.1016/j.ocecoaman.2018.07.001
Zaucha J. (2014). The key to governing the fragile Baltic Sea. Maritime spatial planning in the Baltic Sea (Riga, VASAB: Region and Way Forward).
Zaucha J., Matczak M., Witkowska J., Szczęch A., Mytlewski A., Pardus J. (2020). Maritime spatial rent for modelling maritime spatial development. Regional Local Stud. 1 (79), 5–29. doi: 10.7366/1509499517901
Zhang F., Wang X. H., Nunes P., Chunbo Ch. (2015). The recreational value of gold coast beaches, Australia: An application of the travel cost method. Ecosystem Serv. 11 (11), 106–114. doi: 10.1016/j.ecoser.2014.09.001
Keywords: marine area valuation, marine area rent, shipping, margin profit method, AIS data
Citation: Czermański E, Zaucha J, Oniszczuk-Jastrząbek A, Pardus J, Kiersztyn A and Czerwiński D (2024) Valuation of marine areas for merchant shipping: an attempt at shipping spatial rent valuation based on Polish Marine Areas. Front. Mar. Sci. 11:1352598. doi: 10.3389/fmars.2024.1352598
Received: 08 December 2023; Accepted: 18 January 2024;
Published: 23 February 2024.
Edited by:
Tsz Leung Yip, Hong Kong Polytechnic University, Hong Kong SAR, ChinaReviewed by:
Guangnian Xiao, Shanghai Maritime University, ChinaCopyright © 2024 Czermański, Zaucha, Oniszczuk-Jastrząbek, Pardus, Kiersztyn and Czerwiński. This is an open-access article distributed under the terms of the Creative Commons Attribution License (CC BY). The use, distribution or reproduction in other forums is permitted, provided the original author(s) and the copyright owner(s) are credited and that the original publication in this journal is cited, in accordance with accepted academic practice. No use, distribution or reproduction is permitted which does not comply with these terms.
*Correspondence: Ernest Czermański, ZXJuZXN0LmN6ZXJtYW5za2lAdWcuZWR1LnBs
Disclaimer: All claims expressed in this article are solely those of the authors and do not necessarily represent those of their affiliated organizations, or those of the publisher, the editors and the reviewers. Any product that may be evaluated in this article or claim that may be made by its manufacturer is not guaranteed or endorsed by the publisher.
Research integrity at Frontiers
Learn more about the work of our research integrity team to safeguard the quality of each article we publish.