 Stephanie R. Schneider1*
 Sharon H. Kramer1
 Sophie B. Bernstein1Scott B. Terrill1David G. Ainley1
 Shari Matzner2
- 1H. T. Harvey & Associates, Los Gatos, CA, United States
- 2Pacific Northwest National Laboratory, Sequim, WA, United States
Planning is underway for placement of infrastructure needed to begin offshore wind (OSW) energy generation along the West Coast of the United States and elsewhere in the Pacific Ocean. In contrast to the primarily nearshore windfarms currently in the North Atlantic, the seabird communities inhabiting Pacific Wind Energy Areas (WEAs) include significant populations of species that fly by dynamic soaring, a behavior dependent on wind and in which flight height increases steeply with wind speed. Therefore, a more precise and detailed assessment of their 3D airspace use is needed to better understand the potential collision risks that OSW turbines may present to these seabirds. Toward this end, a novel technology called the ThermalTracker-3D (TT3D), which uses thermal imaging and stereo vision, was developed to render high-resolution (on average within ±5 m) flight tracks and related behavior of seabirds. The technology was developed and deployed on a wind-profiling LiDAR buoy in the Humboldt WEA, located 34 to 57 km off California’s coast. During the at-sea deployment between 24 May and 13 August 2021, the TT3D successfully tracked birds moving between 10 and 500 m from the device, around the clock, and in all weather conditions; a total of 1407 detections and their corresponding 3D flight trajectories were recorded. Mean altitudes of detections ranged 6-295 m above sea level (asl). Considering the degree of overlap with anticipated rotor swept zones (RSZ), which extend 25-260 m asl, 79% of detected birds (per m3 of airspace) moved below the RSZ, 21% moved at heights overlapping the RSZ, and another 0.04% occurred at heights exceeding the RSZ. The high-resolution tracks provided valuable insight into seabird space use, especially at heights that make them vulnerable to collision during various environmental conditions (e.g., darkness, strong winds). Observations made by the TT3D will be useful in filling critical knowledge gaps related to estimating collision and avoidance between seabirds and OSW facilities in the Pacific and elsewhere. Future research will focus on enhancing the TT3D’s identification capabilities to the lowest taxon through validation studies and artificial intelligence, further contributing to seabird conservation efforts associated with OSW.
1 Introduction
Offshore wind (OSW) is a non-carbon energy source that, if captured, would help achieve national goals for transitioning away from fossil fuels. OSW energy generation in U.S. coastal waters has only recently been initiated along the East Coast. However, actions to expand to the West Coast are underway, with several Wind Energy Areas (WEAs) delineated by the Bureau of Ocean Energy Management (BOEM) off California and Oregon in the California Current System (CCS). The CCS is characterized by wind-driven upwelling that brings nutrient-rich water to the surface (Lynn and Simpson, 1987; Bograd et al., 2009; Checkley and Barth, 2009). This results in an elevated and diverse community of marine fauna, such as cetaceans, sea turtles, and seabirds, many of which travel across the Pacific Ocean to capitalize on the foraging opportunities in the CCS (Block et al., 2011). While the CCS has the wind needed to support a robust wind energy industry, uncertainties remain about the potential magnitude of impacts of OSW facilities to the region’s unique marine community, especially seabirds (Kelsey et al., 2018; Leirness et al., 2021; Croll et al., 2022).
Information on seabirds present in the CCS collected since the 1980s using at-sea aerial and vessel surveys is extensive and these data indicate approximately 50 regularly occurring marine bird species, including coastal ducks, grebes, gulls, terns and auks, but also albatrosses, shearwaters, petrels and storm-petrels in more offshore environments (Ainley, 1976; Briggs et al., 1987; Howell, 2012; Leirness et al., 2021). Several species known to occur in outer continental shelf waters off the West Coast, e.g. small albatross, gadfly petrels, have no analogous counterparts regularly present within existing OSW leases in the Atlantic Ocean. The differences in seabirds present are a result of WEAs being positioned in outer shelf break waters that are characterized by enhanced productivity. Owing to the narrow shelf, deeper-water habitats are much closer to shore than in many other ocean areas, such as the U.S. East Coast. Importantly, because OSW facilities have not yet been constructed in these deeper-water habitats, this represents the first situation where seabird species with an affinity for deep-water will regularly encounter turbines at sea.
Seabirds that fly at altitudes that vertically overlap rotor swept zones (RSZs), which begin no lower than 25 m and extend to at least 260 m above sea level (asl) for the current OSW turbine reference design, are vulnerable to collision with the rotating turbine blades (Band, 2012; McGregor et al., 2018; Croll et al., 2022). Seabird flight behaviors (including flight height) are known to vary as a function of wind speed, especially in the CCS, with the exact functional relationship varying according to the morphology and flight style of the various seabird species (Spear and Ainley, 1997; Ainley et al., 2015). Furthermore, wind speeds vary considerably within and across days. While many coastal and nearshore seabird species rely on a flapping flight style and tend to remain relatively close to the sea surface (under 10 m; Ainley et al., 2015) to minimize the energetic cost of flight, various species with an affinity for deep-water “open ocean” habitats (e.g., shearwaters, petrels, and albatrosses) minimize energy expenditure by engaging in a flight style called dynamic soaring. During dynamic soaring, seabirds harness the power of wind to repeatedly “swoop” up to substantial altitudes and make forward progress during an accelerated descent (Pennycuick, 1987a, 1987b, 2002). Consequently, these birds repeatedly enter airspace that overlaps RSZs (Richardson et al., 2018). Although much has been learned about the capabilities of terrestrial and marine birds to detect and avoid collision with turbine blades, generalizing findings to these untested deep-water seabirds may not be appropriate. It is possible that unique aspects of the dynamic soaring species’ behavior and physiology may compromise their ability to successfully navigate around and through turbine arrays relative to other previously studied species. For example, many dynamic soarers remain active at night (Bonnet-Lebrun et al., 2021), can travel for days without landing on the water (Weimerskirch et al., 2016) and even sleep on the wing (Rattenborg et al., 2016). Moreover, their circular flight trajectories require them to make decisions to change direction far earlier than would seabirds in flapping flight.
Threatened and endangered species are generally afforded more rigorous levels of protection to prevent further population decline. Dynamic soaring seabirds are currently among the most threatened birds on Earth (>30% of shearwaters, petrels, and albatross are classified as globally threatened; Dias et al., 2019). This means that OSW developers and regulatory agencies will need a priori estimates of the potential for turbine blade collisions (hereafter, “collisions”) over their permitted term of operation (typically >20 years) with sufficient levels of certainty. This will likely be required for at least a subset of impacted species to complete the pre-construction environmental review and permitting process. Following permitting and construction, these estimates will also likely need to be validated to ensure that actual collisions do not exceed the permitted limits.
Collision Risk Models (CRMs) have become widely adopted for environmental impact assessments as the standard approach for setting expectations of collisions between birds and wind facilities (e.g., Band, 2012; Brabant et al., 2015; Masden and Cook, 2016; McGregor et al., 2018; Masden et al., 2021; Croll et al., 2022). CRMs depend upon numerous inputs in order to provide accurate pre-construction prediction of collision rates; many of these inputs require addressing critical knowledge gaps regarding activity patterns of different seabirds in space and time. Aside from avoidance rates, the most critical piece of information is species-specific passage rates through RSZs. These rates provide the number of individual birds passing through the RSZ over a given time period and thus the theoretical number of birds at risk. Passage rates through RSZs can be affected by offshore wind turbine size and spacing, as well as species-specific behaviors including flight speed, flight height and flight style. Logistical challenges associated with collecting passage rate data of sufficient quality are likely to be much greater for the West Coast relative to what has been encountered elsewhere, owing to the windscape and related ocean conditions, and likely would require a shift from more traditional aerial- and ship-board survey methods to more innovative approaches such as LiDAR, GPS tracking, and newer radar technologies (Cook et al., 2018; Jenkins et al., 2018; van Erp et al., 2021, 2023; van Bemmelen et al., 2024). Specific challenges include: 1) the often inhospitable (to humans) conditions of offshore waters, which severely limit the times when surveys can be safely conducted; and 2) the diminishing ability of human vision to detect birds with increasing vertical distance above sea level (Harwood et al., 2018) and at night (e.g., Furness et al., 2018).
One potential solution to acquire the data to develop CRMs is to use remote sensing technology that can reliably detect flying birds, record data continuously, both day and night, and operate effectively in the harsh offshore environment. To that end, the Pacific Northwest National Laboratory (PNNL), with funding from the U.S. Department of Energy, has spent the last decade engineering and testing a thermal camera-based system known as the ThermalTracker-3D (TT3D). The autonomous detection and tracking performance of the TT3D has previously been evaluated on land (Matzner et al., 2015, 2020).
Here, we report on findings from the first at-sea deployment of the TT3D (Matzner et al., 2022) and evaluate its ability to 1) track seabird activity and passage rates across the entire vertical extent of a typical offshore RSZ; 2) assess seabird activity patterns at different timescales and at different windspeeds; 3) collect bird- and wind-specific parameters required for CRMs; and 4) establish which species are present and flying at collision risk heights. From this, we recommend actions to continue advancing the TT3D’s ability to provide such information.
2 Materials and methods
2.1 Study area
This study was conducted within the Humboldt WEA, a prime wind-energy site along the U.S. West Coast that has been leased by BOEM to two developers for commercial energy development (BOEM, 2022). At its nearest point, this WEA is situated 34 km offshore of Eureka in northern California (Figure 1) and encompasses 534 km2 of outer continental shelf habitat; waters range 500-1100 m deep (BOEM, 2022). The Humboldt WEA is located within the CCS, a highly productive eastern boundary current system in the Pacific Ocean extending from British Columbia, Canada, to Baja California, Mexico (Lynn and Simpson, 1987; Checkley and Barth, 2009). Eastern boundary currents sustain a remarkable diversity and abundance of marine life. Persistent winds along the eastern margins of ocean basins, in conjunction with the inertial force due to the Earth’s rotation, push surface waters away from the shoreline and pull deeper, nutrient-rich waters to the surface (Rykzaczewski and Checkley, 2008; Checkley and Barth, 2009). This wind-driven influx of nutrients fuels phytoplankton growth and determines the amount of consumable energy (i.e., food) that can be transferred upward in the food web (Eddy et al., 2021). The productivity of the CCS regularly supports roughly 50 marine bird species, attracting many from far away (Fernández et al., 2001; Shaffer et al., 2006; Block et al., 2011). Overall avifaunal composition of the more abundant species has been summarized recently (Leirness et al., 2021; Russell et al., 2023); there have been a total of 120 species observed off northern California in recent history (eBird, 2023).
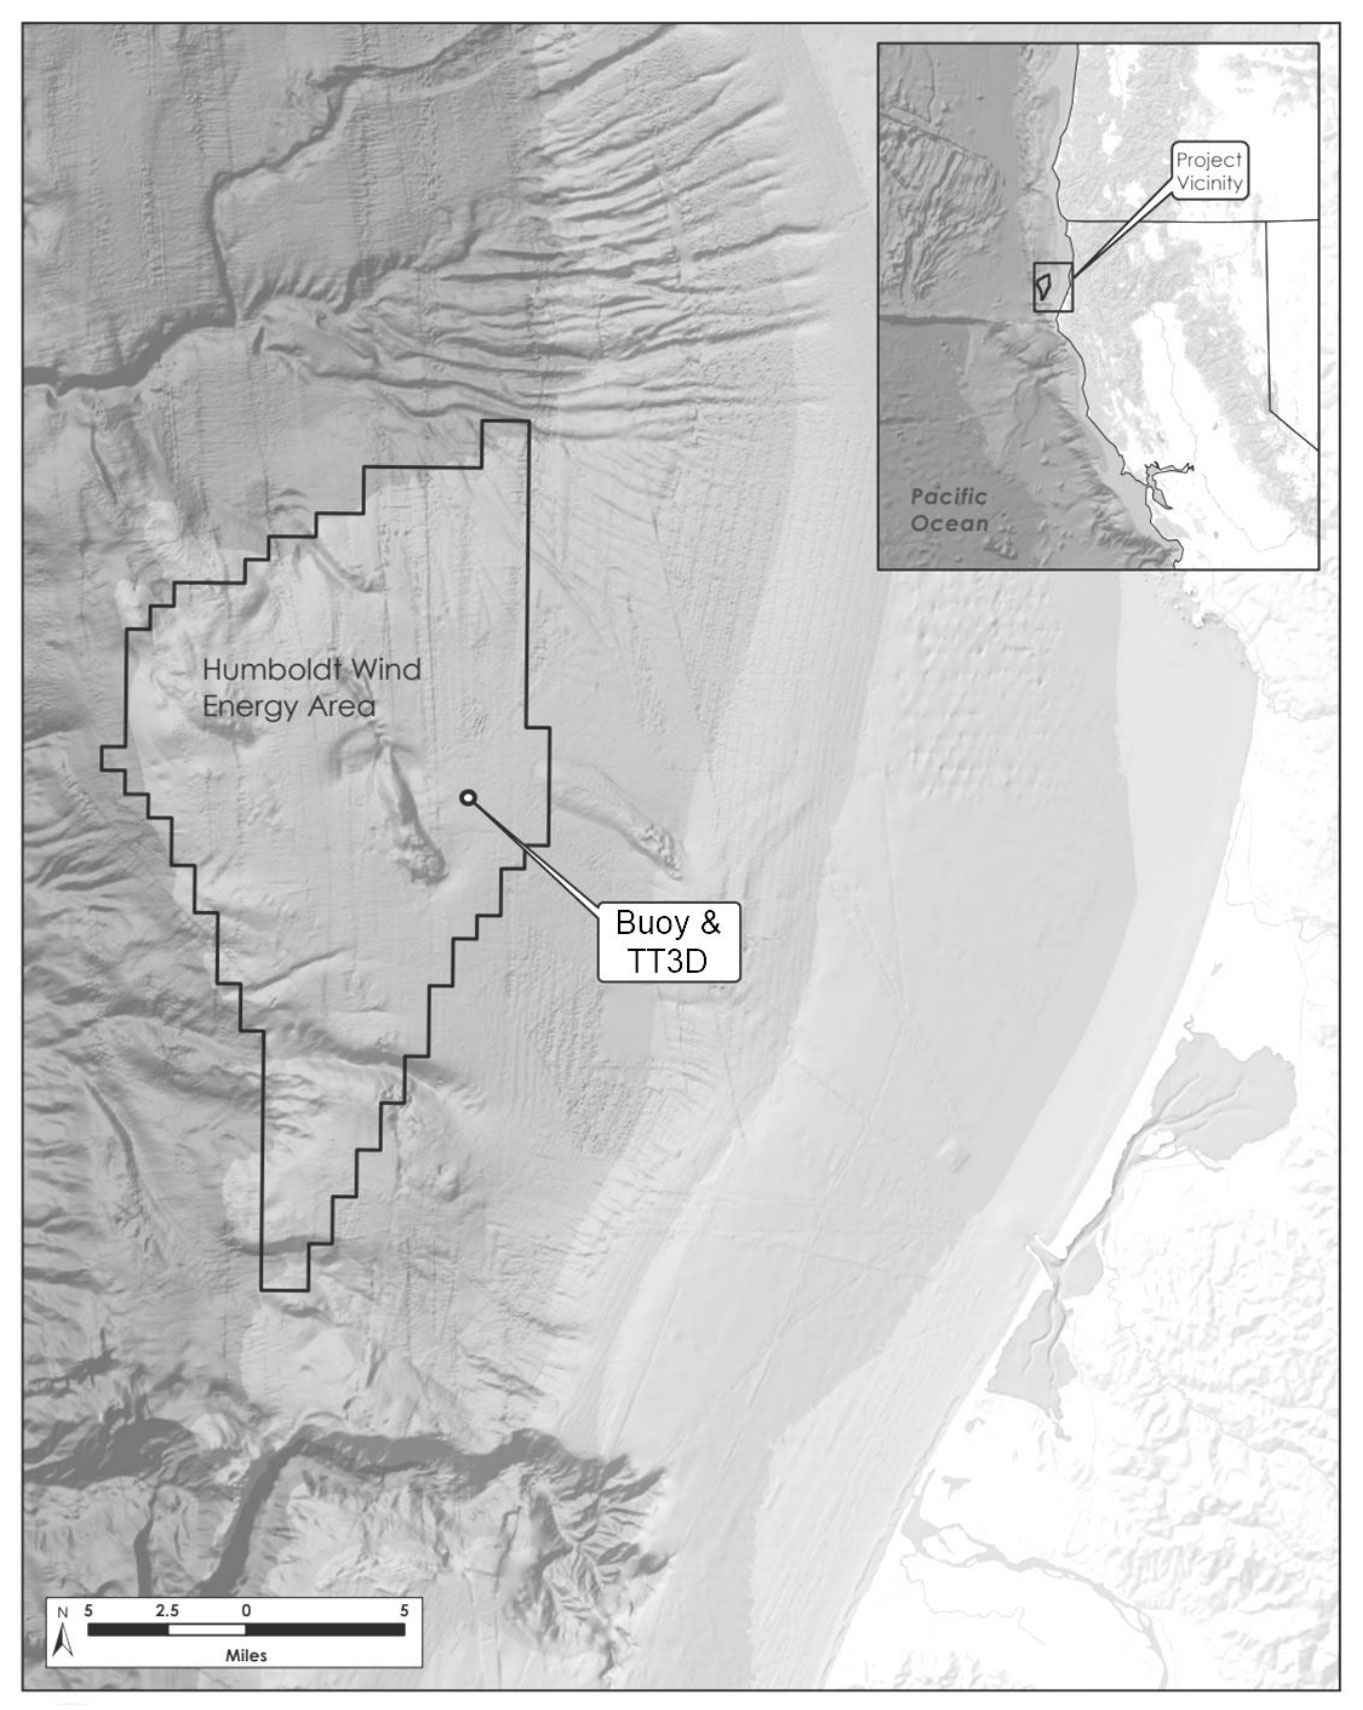
Figure 1 Location of the WindSentinel™ buoy, which provided a platform for the ThermalTracker-3D offshore prototype system, at 40.9708°N, 124.5902°W, within the Humboldt Wind Energy Area (outlined in black) 35 km off Eureka, California, USA.
2.2 ThermalTracker-3D buoy deployment
The TT3D offshore prototype system (Figure 2A) consisted of a stereo pair of thermal cameras (Flir A65, 7.5-13 μm wavelength, 25 mm lens, 640 x 512 pixels), an optical camera (Lucid Triton 2.8 MP with Fujinon 12 mm lens), orientation sensors for each camera (Yost 3-Space Sensor), a microcontroller (PJRC Teensy 4.0), a GPS (SkyTraq Venus 838LPx-T), and a computer (OnLogic Karbon 700 with an Intel Core i7 2.4 GHz processor and 32 GB of RAM). The computer ran the TT3D software developed by PNNL. The software processed the video streams from each thermal camera in parallel at 30 frames per second, detecting flying animals and recording their 3D flight tracks in real time. The detection algorithm used the thermal contrast between birds and bats and the (typically cooler) background to reliably detect them in a wide range of conditions. The detections from both cameras were combined using stereo vision (OpenCV) to generate the 3D tracks. When an animal was detected by the thermal cameras, video from the color camera was saved, to be reviewed post-deployment to aid in taxonomic identification. The GPS and orientation sensor data were used in post-processing to transform the raw x-y-z coordinates output by the system into georeferenced coordinates (longitude, latitude, altitude).
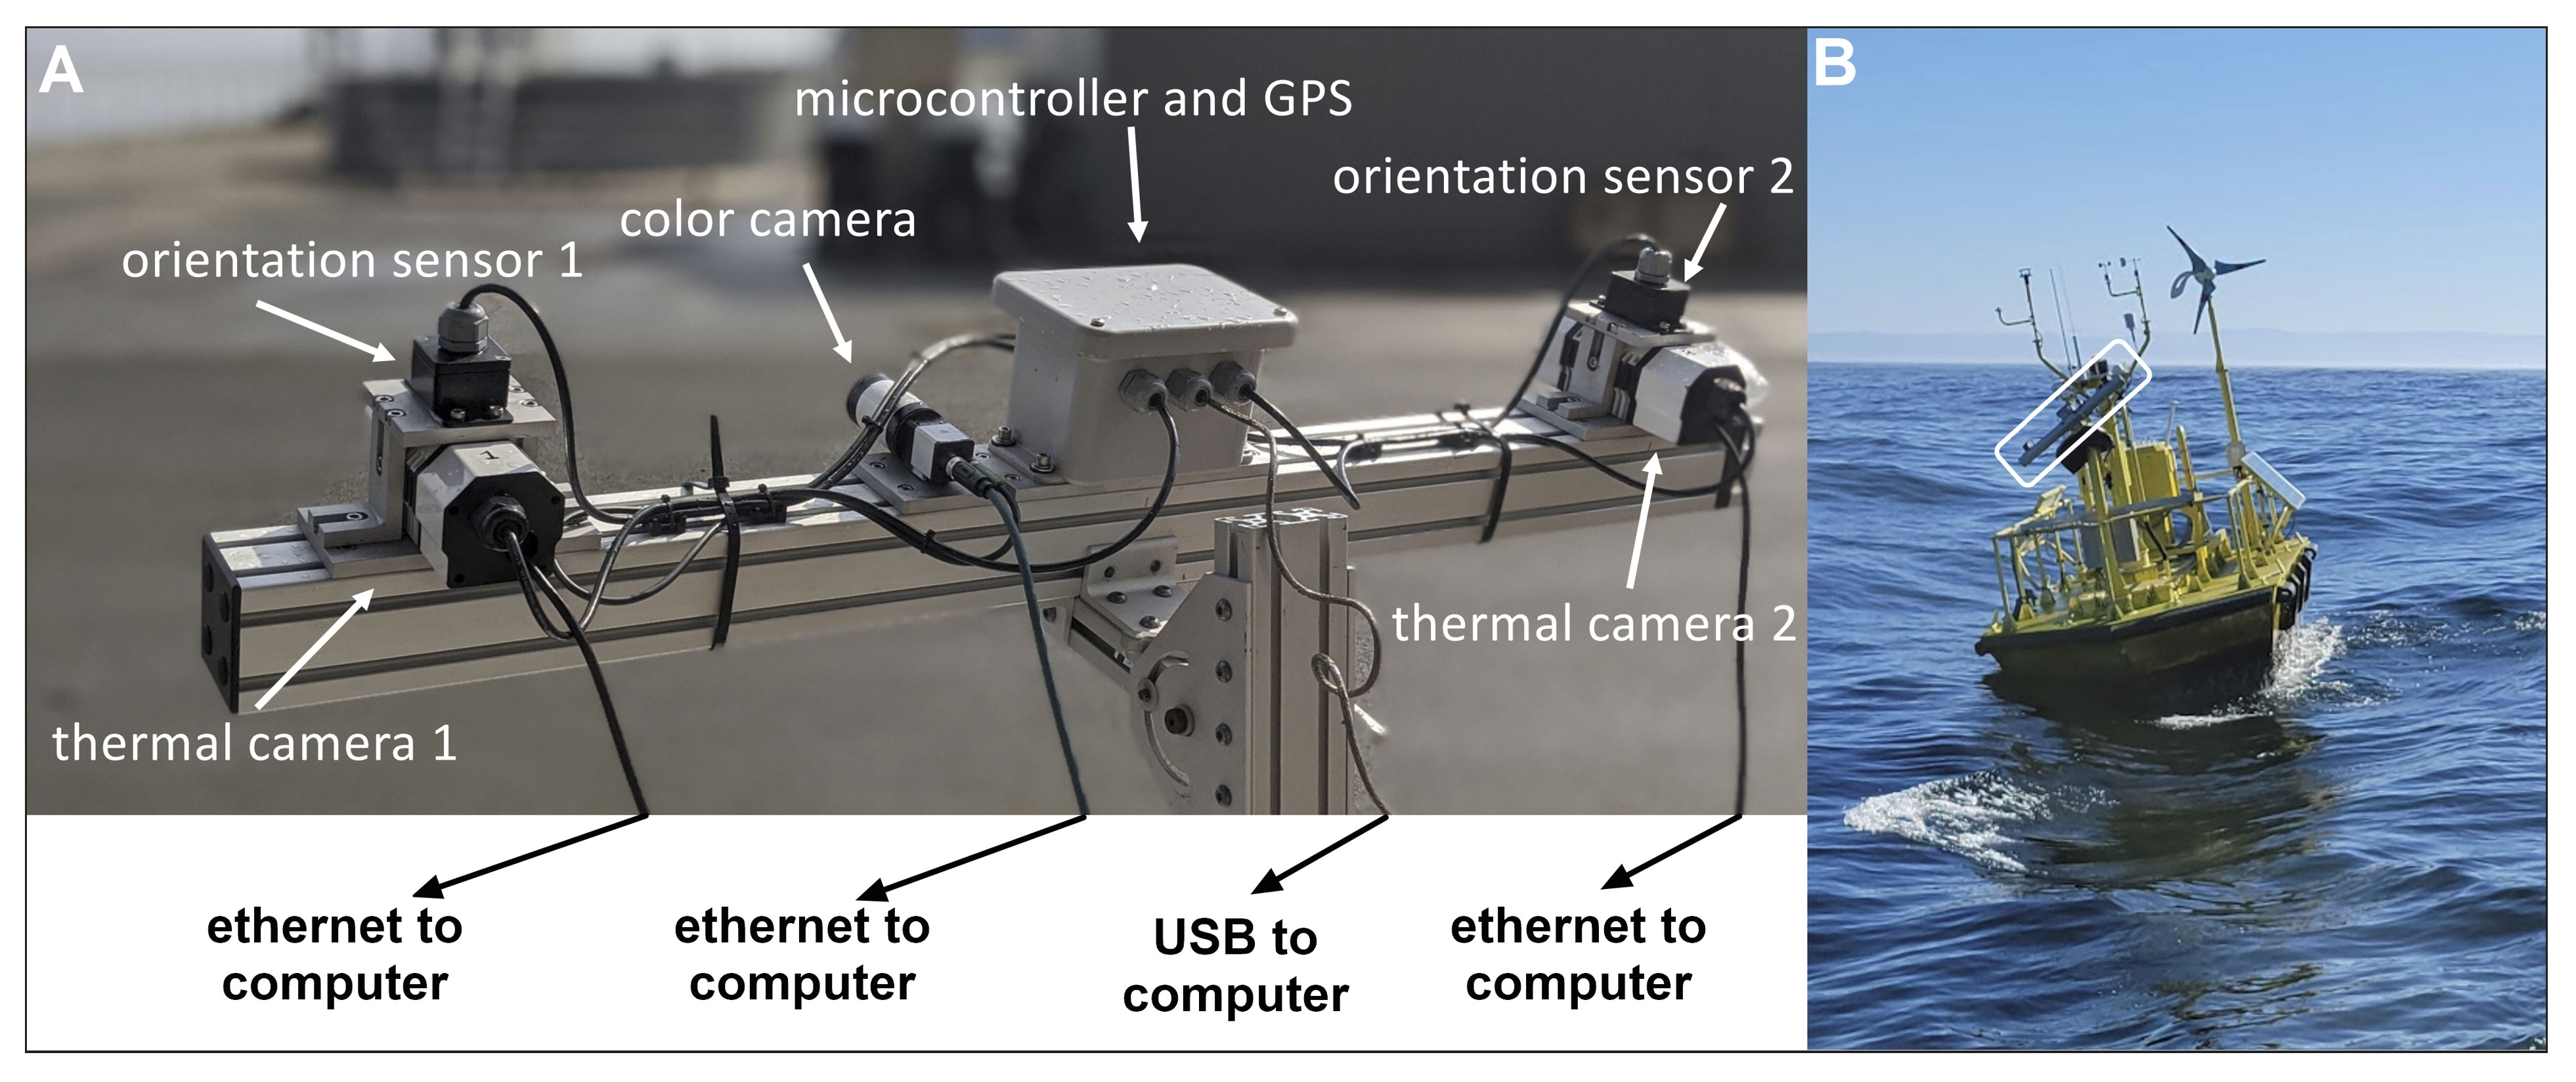
Figure 2 Close-up of ThermalTracker-3D offshore prototype system sensors (A) and a depiction of this system during deployment in 2021 on a WindSentinel™ buoy (outlined in a white bounding box) (B).
Previously, the TT3D system tracking accuracy was evaluated on land using a GPS-equipped drone (Matzner et al., 2020). The TT3D position estimates were, on average, within 5 m in each dimension of the drone GPS-reported positions. And although the TT3D estimates did not appear to be biased towards over- or under-estimation in any direction, the variance between the estimates and the GPS positions increased with distance due to the relatively low resolution of the thermal cameras.
The offshore TT3D prototype was installed on a WindSentinel™ buoy (AXYS Technologies) and mounted on a 1.5 m tall mast at the bow (Figure 2B). A two-axes stabilization system (Perfect Horizon) was integrated between the camera assembly and the mast to stabilize the cameras by correcting for pitch and roll motion. The cameras were oriented to look approximately 60° above the horizon to maximize the coverage of the area corresponding to future RSZs. The thermal cameras had a field of view (FOV) of approximately 25° horizontally and 20° vertically.
The buoy was deployed on behalf of BOEM. Its primary mission was to characterize the wind energy resource using a wind-profiling LiDAR system. Wind speed and direction were measured at 10 m increments 40-240 m asl (Severy et al., 2021). Other sensors on the buoy measured surface wind speed and direction, air temperature, water temperature, humidity, and barometric pressure (PNNL 2023). All sensors, including the TT3D, were synchronized to GPS time, allowing information on seabird flight behavior to be evaluated in relation to environmental conditions at the site. Data from all sensors were transmitted to shore via a satellite link throughout the deployment and stored on the DOE’s Atmosphere to Electrons Data Archive and Portal (DAP). TT3D data were transmitted hourly to shore and stored with the other buoy data, except for the color image data which was stored onboard because the images were too large to transmit.
2.3 Data post-processing
The raw TT3D data were downloaded from the DAP and processed to generate the dataset used for this study. The processing consisted of the following steps: 1) track validation and noise removal, 2) conversion to geo-referenced coordinates, 3) wingspan and body length estimation, and 4) track statistics summarization. The processing was implemented in Python.
2.3.1 Track validation
The raw flight-track data were in the x-y-z coordinate frame of the thermal cameras, where the z dimension was perpendicular to the image plane and gave the distance between the target and the camera assembly. Based on the separation between the two thermal cameras (approximately 1 m) and the resolution of the cameras, targets could be reliably detected starting at 10 m away from the camera assembly and out to 500 m. A track was considered valid if the z values were within this range. The valid ranges for the x (Equation 1) and y (Equation 2) values were then determined by the z values and the FOV angles of the camera:
Positions in the flight track with invalid x, y or z coordinate values were discarded. If all the positions were invalid, the entire track was excluded from the dataset. The time-series of valid positions was then smoothed using cubic spline interpolation as implemented in the SciPy interpolate module. The smoothing reduced the uncertainty in the position data due to the limited spatial resolution of the thermal data, which depends on the distance of a target from the camera (Matzner et al., 2015).
2.3.2 Geo-referenced coordinates
The validated x-y-z coordinates of each flight track were then converted to geo-referenced coordinates using the GPS and IMU data. The GPS data gave the location of the camera assembly, and the IMU data gave the camera orientation relative to the earth. The x-y-z coordinates of the flight tracks were transformed into azimuth and elevation angles relative to the camera. Then the pymap3d module was used to perform the conversion to latitude, longitude and altitude.
2.3.3 Wingspan and body length estimation
The wingspan and body length estimates were calculated from the thermal images of the detected birds using the method developed by Li and Song (2013). The method uses the periodicity of the animal’s shape in a video sequence to determine the orientation of the wings; no assumption is made as to the bird’s orientation relative to the camera.
2.4 Analyses
For this analysis, the flight tracks were summarized to generate a single record in the dataset for each track, here on referred to as a “detection.” Each detection record included the following fields:
● A unique identifier,
● The date and time of the initial detection,
● The duration of the flight through the field of view in seconds,
● The minimum and maximum straight-line distance from the camera,
● The wingspan estimate in meters,
● The body length estimate in meters,
● The latitude and longitude of the start of the flight track, and
● The minimum and maximum altitude asl in meters.
We assumed that all detections were either birds or bats since those are the only warm-bodied targets that should be moving through the airspace in the study area; to confirm this assumption, a companion study (Matzner et al., 2022) reported that 80% of a random sample of 180 detections were confirmed to be birds and the remaining 20% were not identifiable due to motion blurring but may also have been birds; a different way to look at these data are to say that every detection with valid flight tracks was determined to be a bird.
Each detection represented a single individual. However, there was no way to track an individual’s movements beyond the FOV so if one individual were to repeatedly enter and exit the FOV, these would be represented in the database as separate detections. All downstream data filtering, processing, and analysis of detection-level data were achieved using R (Version 4.2.2, R Core Team, 2022) and relied on ‘dplyr’ (Wickham et al., 2023) and ‘ggplot2’ (Wickham, 2016).
2.4.1 Seabird movement dynamics
Passage rates are key to quantifying spatiotemporal movement dynamics of various objects, including birds and bats. In general, passage rates are generated by counting targets passing through either a 3D volume of space and/or 2D area over a known time interval. If 3D cubic passage rates are calculated, the associated 2D planar passage rates can be derived using the cross-sectional area through which volumetric flow occurs. Here we will present TT3D detections partitioned in various ways across space, in time, and relative to environmental conditions (e.g., ambient light and wind conditions) that may be important to enhancing understanding of seabird movement dynamics. Importantly, thermal sensors operate equally well across a full spectrum of light conditions as well as in most weather conditions (exceptions include heavy rain or dense fog).
2.4.1.1 Spatial
Spatial-only patterns of all detections made across the study period were investigated in two ways. First, the distribution of detections was visualized in 2D space relative to the position of the TT3D as a way of understanding their overlap with the vertical extent of the offshore reference turbine’s RSZ. To do this, the average distance between the target and the TT3D device was plotted against the average altitude of each target for each detection. Second, because the cone of the TT3D’s viewshed became broader with increasing distances (e.g., height asl) from the thermal sensors, counts of detections occurring at different heights asl had to be normalized by the volume of airspace being observed to calculate passage rate across the vertical extent of a RSZ. To accomplish this, we first divided the vertical airspace encompassed by the FOV into 10-m increments between 0 and 500 m. We then calculated the volume of each cone segment using the formula for a partial cone (Equation 3) and tallied counts within each height bin to generate the passage rate at each 10-m incremental increase in height strata.
where r is the smaller radius of the cone section and R is the larger radius.
2.4.1.2 Temporal
First, we assessed how daily activity varied across the entire study period by tallying the number of detections occurring in each 24-h interval. Next, variation in activity relative to the daily fluctuation of ambient light levels was assessed by partitioning each 24-h period into four categories: dawn, day, dusk, and night. To further explore variation in activity during the darkest period of the daily cycle, detections occurring at night were further separated based on the moon status (absent, present). If the moon was above the horizon at the location of the TT3D at the time of each nightly detection, the fraction of illumination was also noted and variability in detection as a function of moon illumination was also explored. Finally, because the altitudes of each detection were known, detections were standardized by the volume and hours of observation for each 10-mincrease in height asl to visualize differences in the magnitude and vertical distribution of passage rates across each of these periods.
Some definitions were required to achieve the desired partitioning. Dawn was defined as the transition period between night and day, encompassing the full period of twilight (i.e., astronomical, nautical, and civil) associated with the sun being positioned between 18° and 0° below the eastern horizon. Day was defined as the time between dawn and dusk, when the sun was fully visible and daily light levels reached their maximum. Dusk was defined as the transition period between day and night, encompassing the full period of twilight progressing in the reverse order of dawn as sun position moved from 0° to 18° below the western horizon. The remainder of the 24-h cycle was defined as night, the time when daily light levels reached their minimum. After dividing the daily cycle in this way, the date and time of each detection could be used to assign one of the ambient light conditions and tallied as appropriate for each analysis.
At the latitude of the Humboldt WEA, the timing and duration of each of these four periods (dawn, day, dusk, night) differed each day relative to known seasonal cycles. As such, accurately partitioning each 24-h period into these four periods must account for the specific geographic location and date. Daily start and end times for each of the four periods of the daily cycle at the location of the buoy in the Humboldt WEA were obtained using the ‘getSunlightTimes’ function of the ‘suncalc’ package (Thieurmal and Elmarhraoui, 2022) and accounts for the exact GPS coordinates of the TT3D deployment location. A lookup table defining the daily start and end times of dawn, day, night, and dusk was used to label each detection based on its date and timestamp. Moon-specific metrics also differed in ways that were predictable based on date, time, and location; a manual approach was used to assign moon status and illumination to each detection based on its time using information obtained for the Humboldt WEA (U.S. Navy, 2023).
2.4.1.3 Across wind speeds
To better understand how seabird activity patterns varied in response to the windscape, we linked detections metrics generated by the TT3D to simultaneous measures of wind conditions made by the adjacent wind profiling LiDAR on the WindSentinel™ buoy. This wind profiling LiDAR made motion-compensated measurements of wind speed at 20 m intervals 40-240 m asl, and these measures were provided as 10-min averages for the duration of deployment. Wind speed and direction data from 160 m asl, the approximate hub height of the current OSW turbine reference design, were integrated with TT3D data using the 10-min date and time stamp during which targets (and wind measurements) were detected.
To assess whether the observed frequency of target detections matched what would be expected if they were proportional to the wind speeds available, wind speeds were binned into four categories relevant to the power production curves for a generic offshore wind turbine (Severy and Garcia, 2020; Younes et al., 2022). Wind speeds between 0 and 3 m/s were associated with zero power production due to an absence of rotation below “cut-in” wind speed (Category 1). Wind speeds between 3 and 11 m/s were associated with increasing power production (Category 2). Wind speeds between 11 and 25 m/s were associated with stable power production at a rated wind speed of 12,000 kW (Category 3). Wind speeds above 25 m/s were associated with zero power production due to an absence of rotation above cut-out wind speed (Category 4).
Counts of both the 10-min averaged wind speeds and the TT3D target detections were partitioned according to each of these wind-speed categories and a Chi-square Goodness of Fit Test was used to assess whether the distribution of detections deviated from the availability of winds to understand if birds might be moving about during certain wind conditions in preference to others. Additionally, a linear regression was used to explore the functional relationship between wind speed and the mean flight altitude of all targets.
2.4.2 Species identification
Visible-spectrum sensors were triggered to capture a series of optical images whenever targets were detected by the thermal sensors. There was limited bandwidth for transmitting data back to shore in real-time, so all optical imagery was stored as ‘.png’ files onto the computer’s hard drive using the timestamp of capture as the file name and retrieved once the buoy returned to shore (Matzner et al., 2022). Initial screening was done by scanning through entire image sequences to select all images of sufficient quality to potentially support identification to family, genus or species level by subject matter experts. For targets that could be identified to the family level from optical imagery, associated thermal flight tracks were further inspected by subject matter experts to evaluate if, independent of optical imagery, the thermal tracks contained information useful for identifying targets to the lowest taxon possible and preferably to species level.
2.4.3 Additional parameters for collision risk models
Assessing rates of bird collisions with wind turbines requires a comprehensive consideration of diverse parameters relating species-specific features, turbines and wind facility features, and environmental features that impact how birds detect and move through the turbine array. The most widely used CRM originated through efforts supported by the Scottish Government in the early 2000s (Band et al., 2007, SNH, 2000) and, as its use in a variety of real-world applications has been expanded over the decades, iterative refinements have been ongoing (Band, 2012; Masden, 2015a, 2015b, Trinder, 2017; McGregor et al., 2018). The most recent iteration of this CRM (McGregor et al., 2018) was made available as an interactive ShinyApp online (Donovan, 2017), and we used this to compile a list of all features needed for input in the “Species features” component to do a side-by-side comparison with data that can be gathered by the TT3D.
3 Results
The WindSentinal™ Buoy, along with the integrated TT3D offshore prototype, was moored in the Humboldt WEA at 40.9708°N, 124.5902°W on 24 May 2021 and remained there until successful retrieval on 30 June 2022 (Figures 1, 2). The WindSentinal™ Buoy was fully operational until 13 August 2021, when the power system was compromised due to a failure of the diesel generator. Following diesel generator failure, all systems on the buoy were powered by the backup renewable-energy system and, to conserve energy and prioritize operation of wind profiling instrumentation, the TT3D system was only operated intermittently after this date. Consequently, the 23.4 million cubic meters of airspace encompassed by the TT3D’s FOV was monitored for approximately 1968 uninterrupted hours and observations made during this truncated operational period provide foundation of everything presented herein.
3.1 Movement dynamics revealed
3.1.1 Passage across the FOV
Over the 82-d period of continuous operation, the TT3D successfully tracked 1407 targets ranging 6-295 m asl; targets were never observed above 316 m asl. The orientation angle of the TT3D successfully overlapped with the full vertical extent of airspace expected to be occupied in offshore RSZs (Figure 3). Because of how the TT3D was oriented at ~55° angle relative to the sea surface, the volume of airspace observed increased with height asl (Figure 3). Once the total detections for each 20 m height stratum were standardized based on observed airspace, activity was found to be concentrated in the first 30 m of airspace, which is below the standard OSW RSZ (78.9% of passage occurred in this airspace, based on the average altitude of individual flight trajectories). Most activity was concentrated in the first 10 m asl, with a passage rate of 32 targets per km3 across the study period (0.39 targets/km3/day) (Figure 4). Passage was detected across full vertical extent of a RSZ up to 320 m where targets were not detected (Figure 4). Within the RSZ, activity concentrated 140-180 m asl, coinciding with the rotor hub heights (~160 m asl). Only 1% of passages occurred above the standard OSW RSZ at 230 m asl (Figure 4).
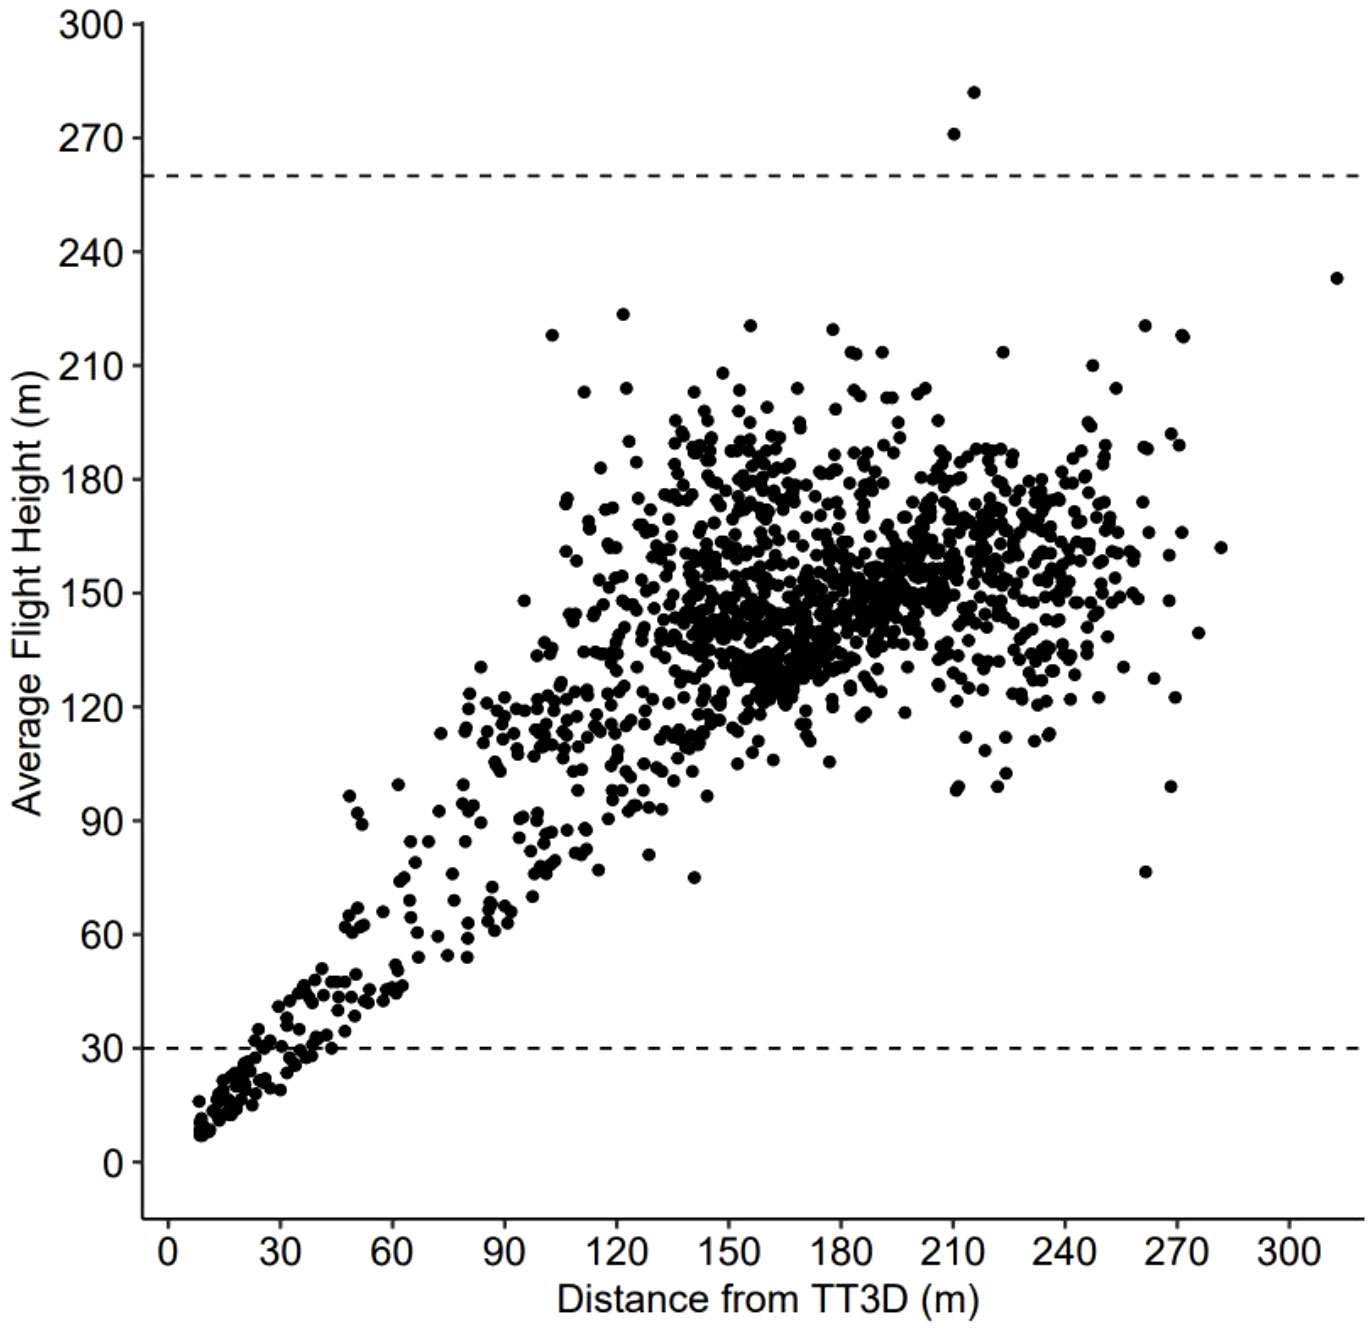
Figure 3 The 2-dimensional position of all 1407 detections made by the ThermalTracker-3D between 24 May and 13 Aug 2021. Positions here represent the horizontal and vertical midpoint coordinates of the 3D track associated with each detection. Their extent in 2D space allows for inferences to be made regarding thermal sensor angle and the overlap between the field of view and the vertical extent of a standard offshore wind turbine’s rotor swept zone (~30 and 260 m above sea level). The lower and upper extents of this zone are delineated with horizontal dashed lines.
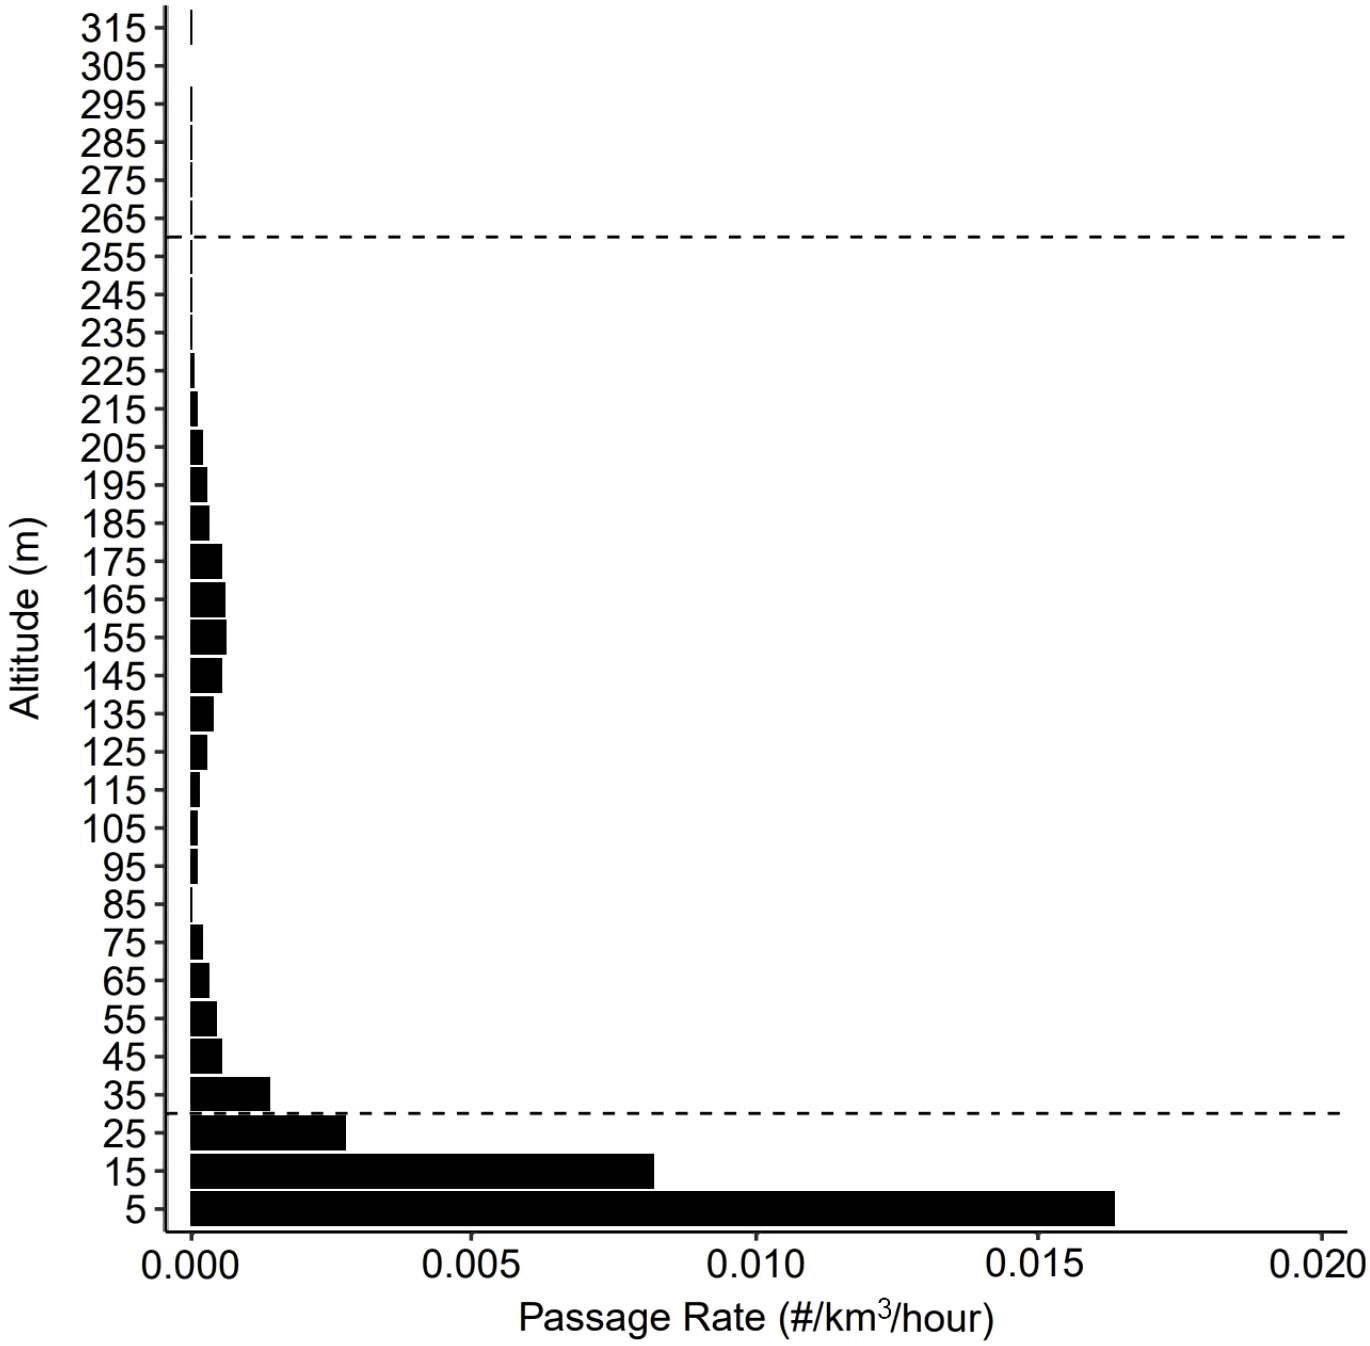
Figure 4 Volumetric passage rate based on all 1407 targets as a function of height above sea level, depicted in 10 m increments and inclusive of all detections within the valid detection distance of the ThermalTracker-3D (10 to 500 m) made over the 82-d operational window (24 May and 13 Aug 2021). Targets were not observed above 320 m. The average altitudes were used to represent each detection, where a detection is a flight trajectory through the thermal cameras’ field of view.
3.1.2 Variations in time
Daily activity varied across the study period, ranging from zero targets on 35% of days (n = 29 d) to a maximum of 197 targets in one 24-h period passing through TT3D’s FOV (Figure 5). The TT3D successfully quantified detections during all ambient light conditions. The greatest percentage of detections occurred during the day (Figures 6A, B), but detections also occurred at night, more so on nights with moonlight and with > 60% moon illumination (Figure 6C). By calculating passage rates partitioned according to time of day, differences in both the magnitude and distribution of heights were discernable during dawn, day, dusk, and nights with and without moonlight (Figure 7).
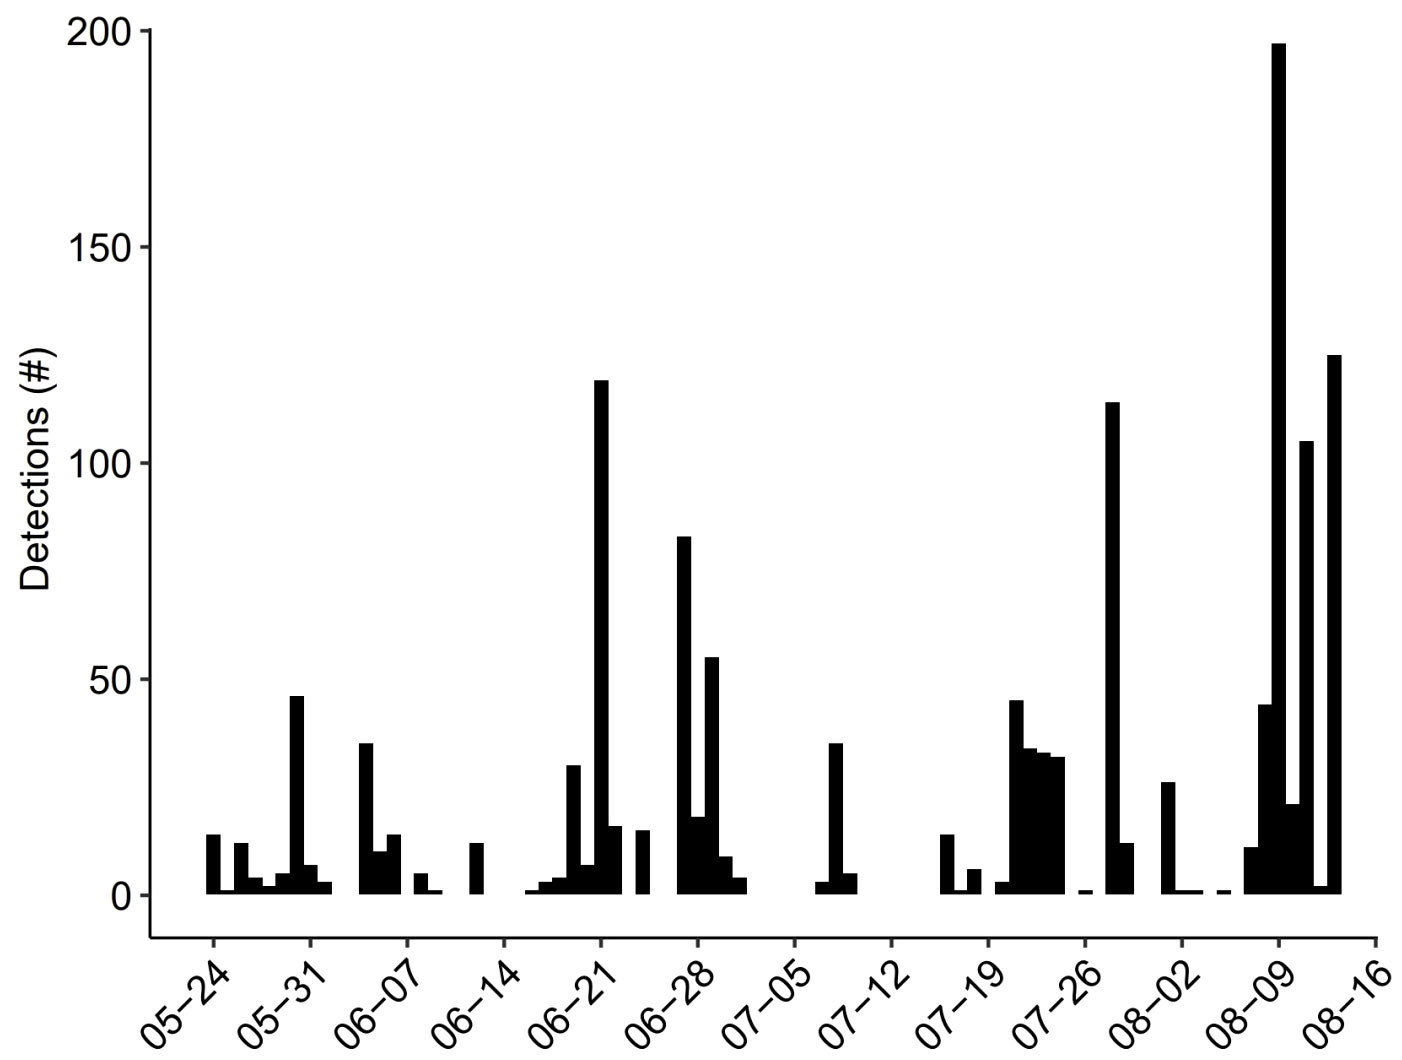
Figure 5 Daily tally of detections made by the ThermalTracker-3D for each 24-h period between 24 May and 13 Aug 2021.
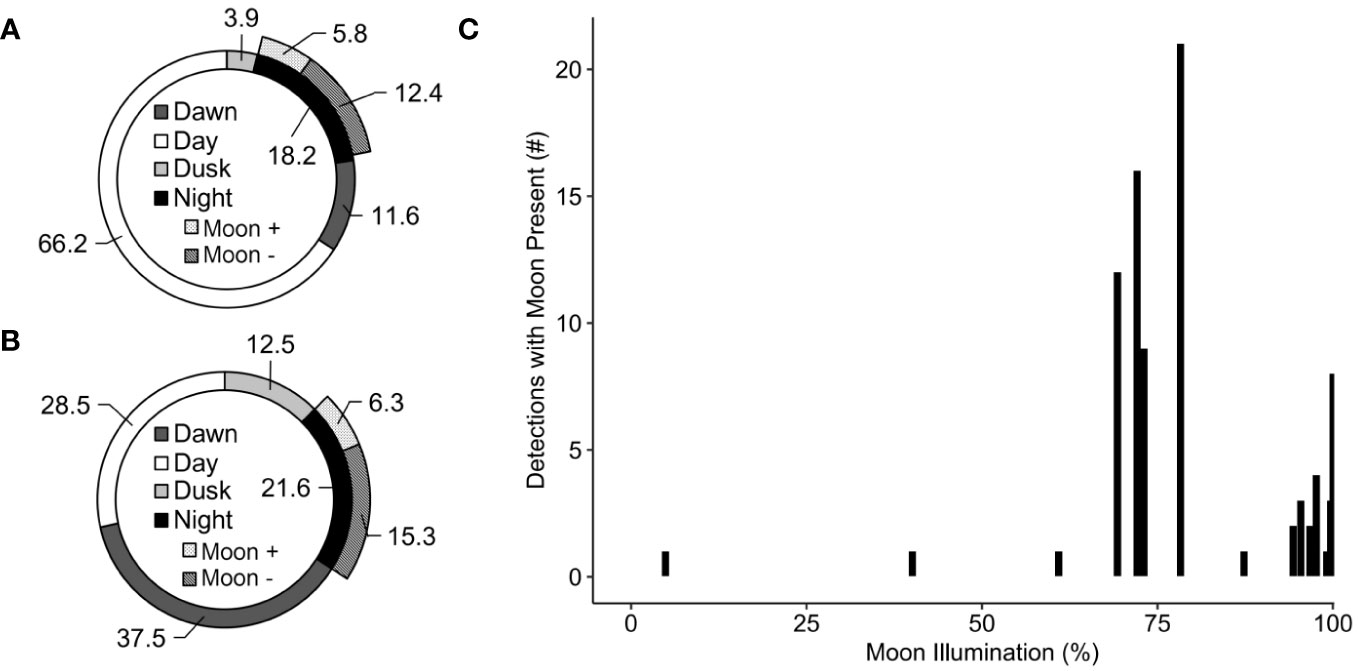
Figure 6 Percent of TT3D detections during dawn, day, dusk, and night periods between 24 May and 13 August 2021, with the night period being further subdivided into nights with (+) and without (-) the moon. Dawn, day, dusk, and night were defined by distinct ambient light conditions and the length of each period varied considerably, with dawn and dusk being relatively short compared to night and day. As such, the percentage of counts by period are presented in terms of absolute counts without respect to the duration over which counts could be made (A) and in terms of counts standardized by the duration over which counts could be made (B). For the subset of detections occurring during nights where the moon was present (n = 82), patterns of activity were related to the percent of moon illuminated (C).
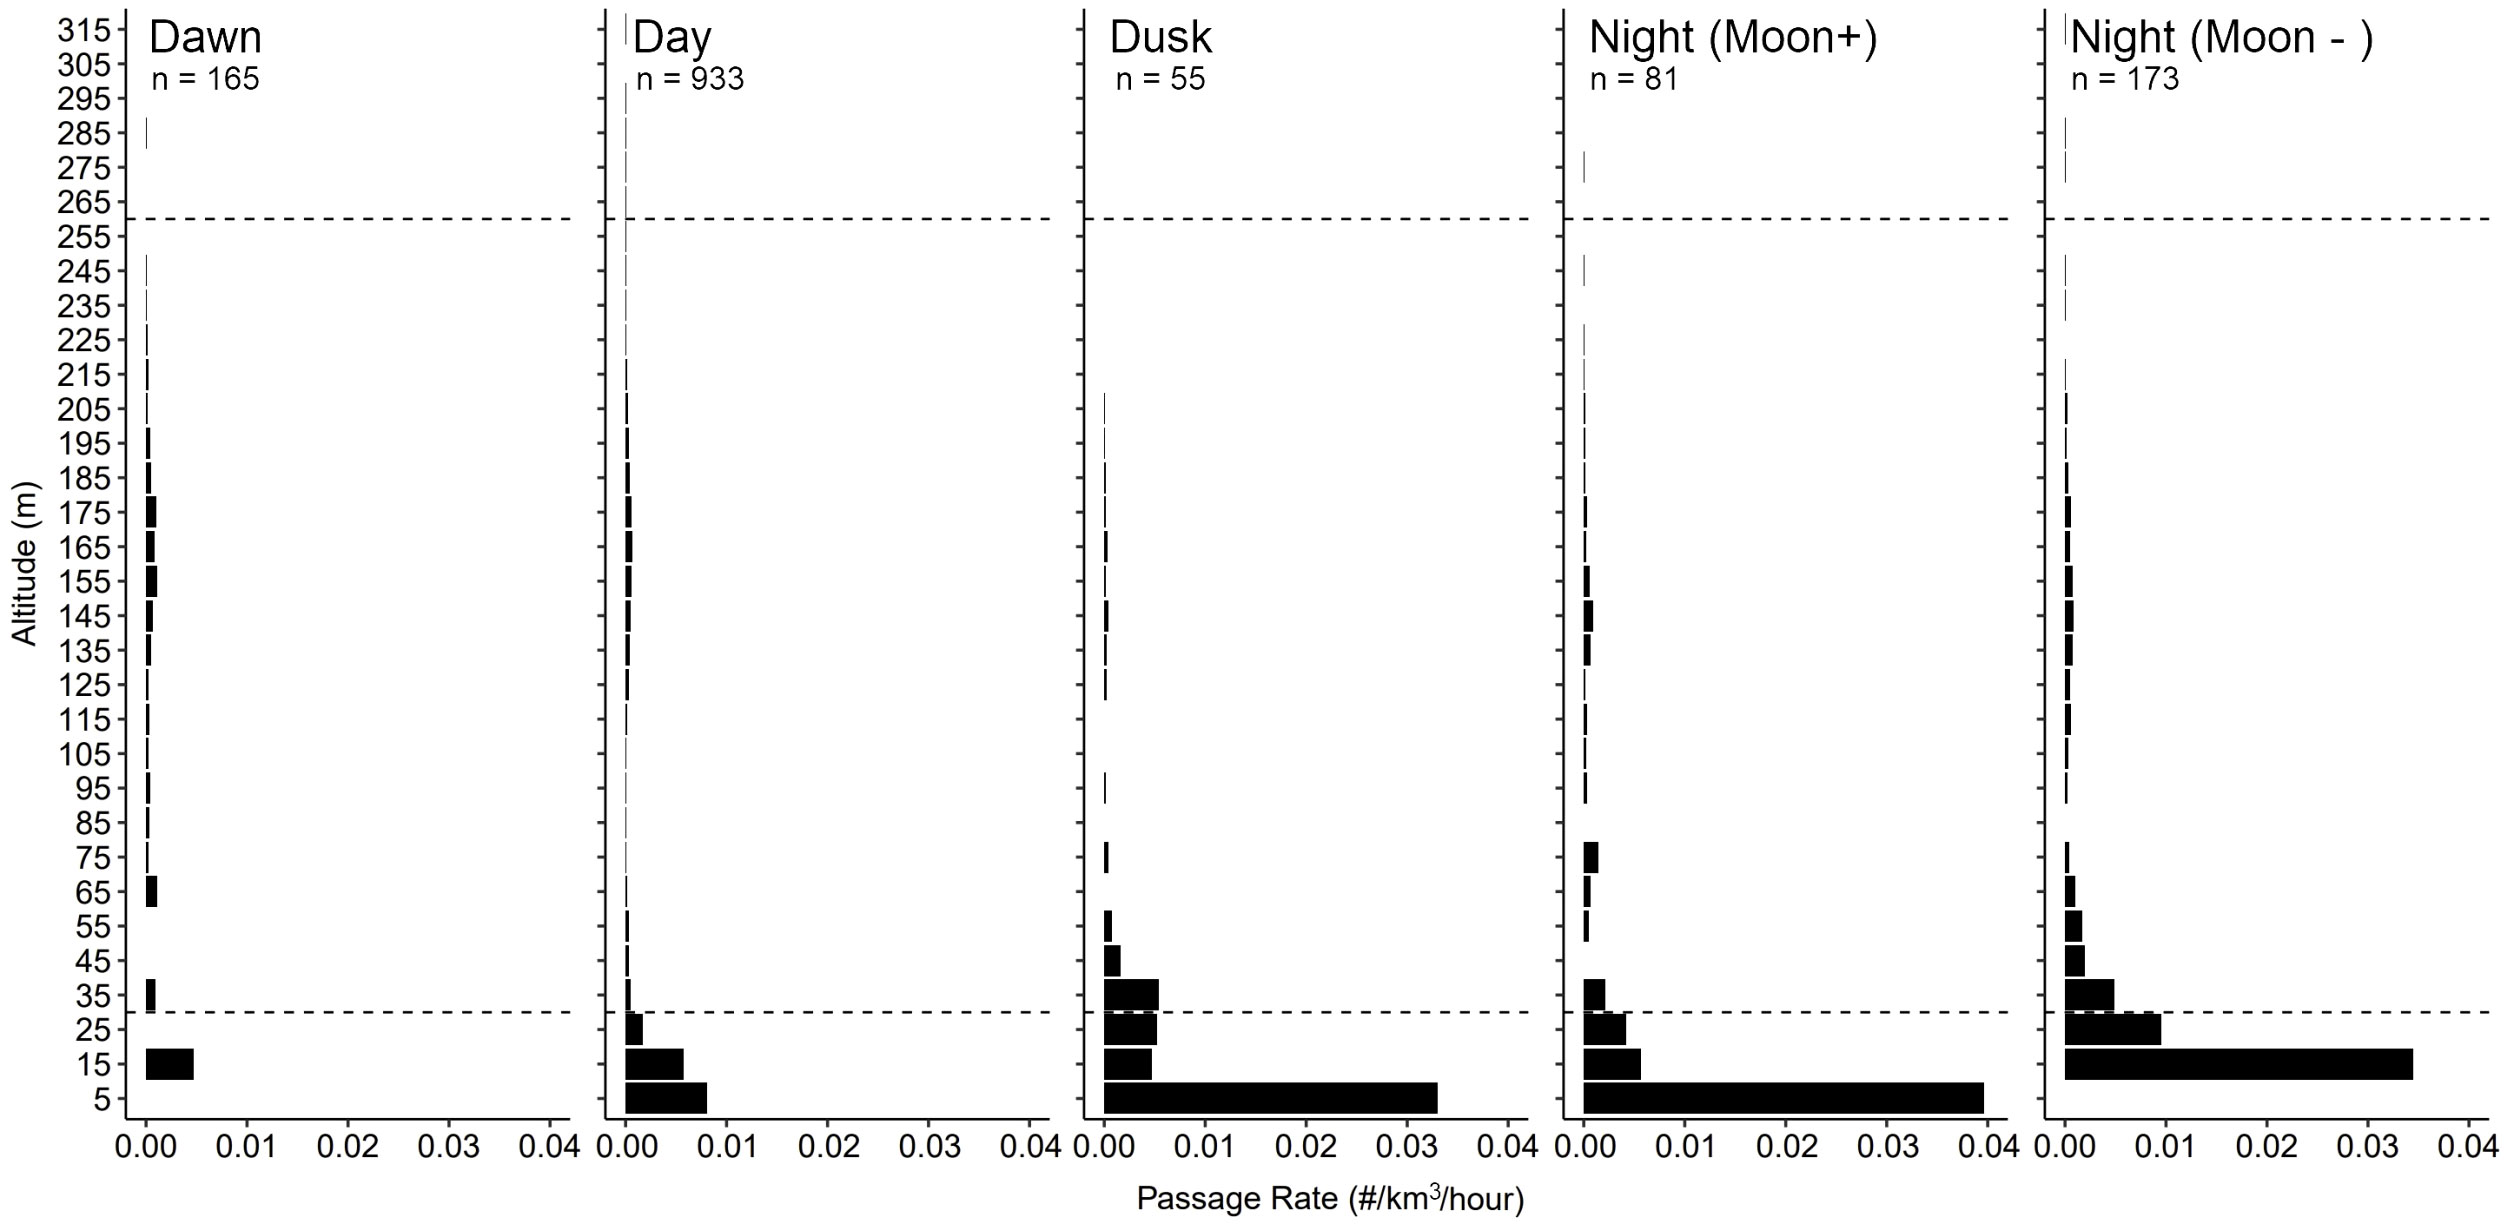
Figure 7 Cubic passage rates calculated for each distinct ambient light condition typical of a daily cycle based on all detections made between 24 May and 13 Aug 2021.
3.1.3 Association with wind conditions
During the study period, winds at turbine hub-height (~160 m asl were successfully estimated by the LiDAR for 11,490 of the 11,808 available 10-min intervals encompassed by the 82-d study period. Winds during this period ranged 0.6-33.6 m/s, and for most of these intervals (92.9%) winds were at speeds needed to generate energy via wind turbine rotation (i.e., above 3 m/s and below 25 m/s; Figure 8A) and a similar proportion of targets (91.9%) were detected during these winds (Figure 8B). Thus, turbines would have only been stationary for 7.1% of 10-min intervals and a similarly low proportion of birds (8.1%) would have been moving about at this time (Figure 8). Although birds were detected flying across the full spectrum of wind speeds, there were more detections than expected during wind speeds in the 3-11 m/s range and fewer detections than expected during wind speeds in the 12-25 m/s range (X23,1407 = 50.85, p< 0.001); Figure 8). When all detections were considered collectively, without any consideration of species or other potential groupings or vertical changes in the volume of the FOV, flight height and wind speed at hub height were found to be unrelated (r2 = 0.0006, F1,1402 = 0.878, p = 0.35).
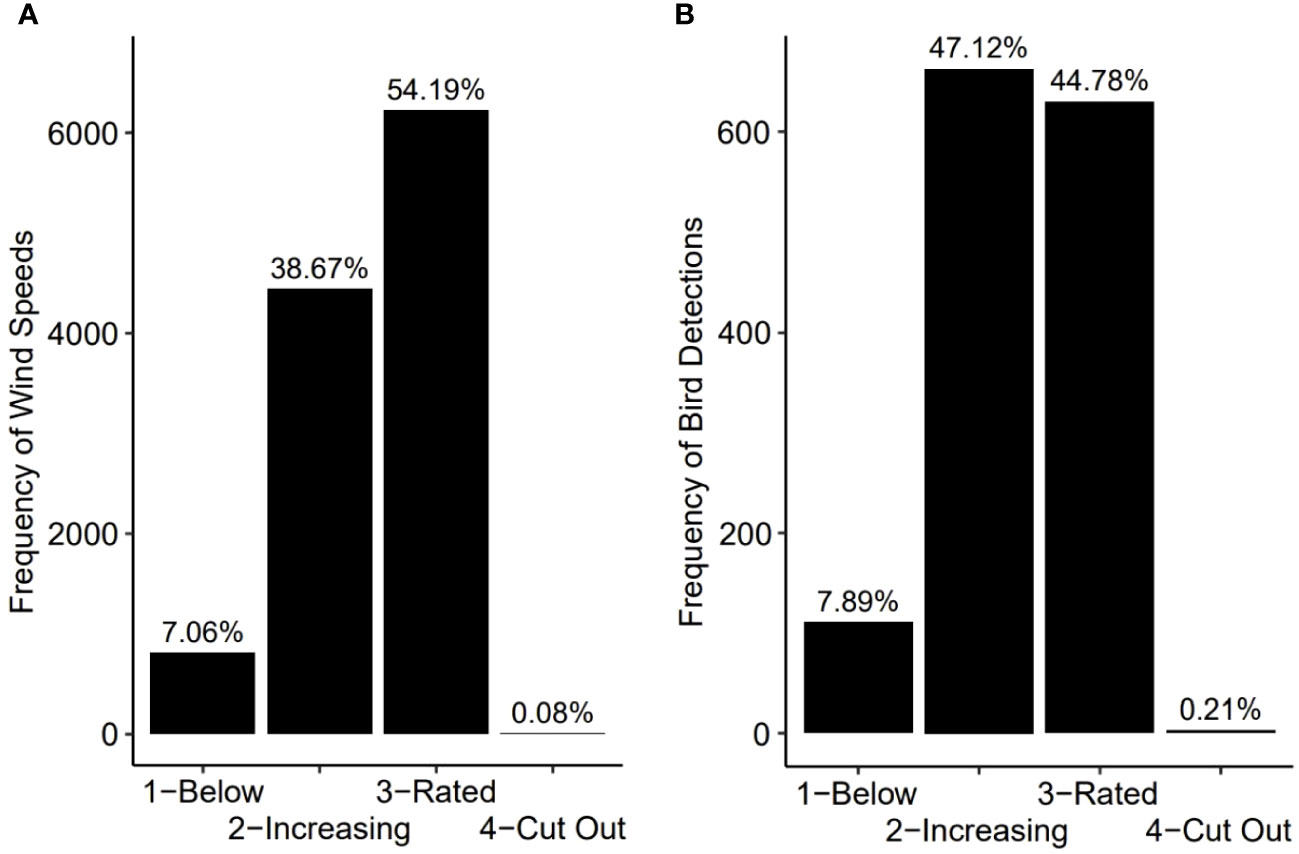
Figure 8 The frequency distribution of wind speeds measured at 160 m asl, the approximate altitude of the hub of the standard offshore wind turbine, as measured by a wind profiling LiDAR for each 10-min interval between 24 May and 13 Aug 2021 (A) and the corresponding frequency distribution of all 1407 bird detections (B). Data are binned according to four turbine-specific wind speed categories where categories 1 and 4 represent periods where the winds are too slow (1) or too fast (4) for turbine rotation, and categories 2 and 3 where the rotation rate of the turbine is either increasing with increased winds (2) or stabilized at speeds maximizing power generation (3).
3.2 Species identification
To maximize efforts to ID species, approximately 60,000 color images generated in association with thermal-sensor detections were reviewed from the TT3D’s period in the WEA, including a few additional detections occurring after generator failure between14 August to 21 September. Identification from optical imagery proved to be challenging; only six of the detections could be assigned an identification beyond taxonomic class Aves by subject matter experts. A total of five birds were identified as part of the family Laridae (gulls) and one bird of the family Stercorariidae (skuas). For the gulls, 80% could be identified beyond family as large gulls in the genus Larus and one of these could be further identified as a Glaucous-winged Gull (Larus glaucescens) based on that species being abundant in the area, and it being a relatively large, heavy-bodied gull with unmarked, pale primary feathers on the outer wing. For the single skua detection, the presence of long central tail feathers suggested it was either a Long-tailed Jaeger (Stercorarius longicaudus) or Parasitic Jaeger (S. parasiticus) and based on overall structure, likely a Long-tailed Jaeger.
For targets successfully identified using optical imagery, subject matter experts reviewed the corresponding thermal flight tracks to determine whether they could have reached the same taxonomic identification using the thermal flight tracks alone. However, they could only assign identification to taxa of the family level. These assignments were determined based on wing shape, apparent size, species expected to be in the region, and flight characteristics appropriate for existing wind speeds. An example of paired thermal and optical imagery has been provided as a representative example of imagery sufficient to support some level of identification (Figure 9).
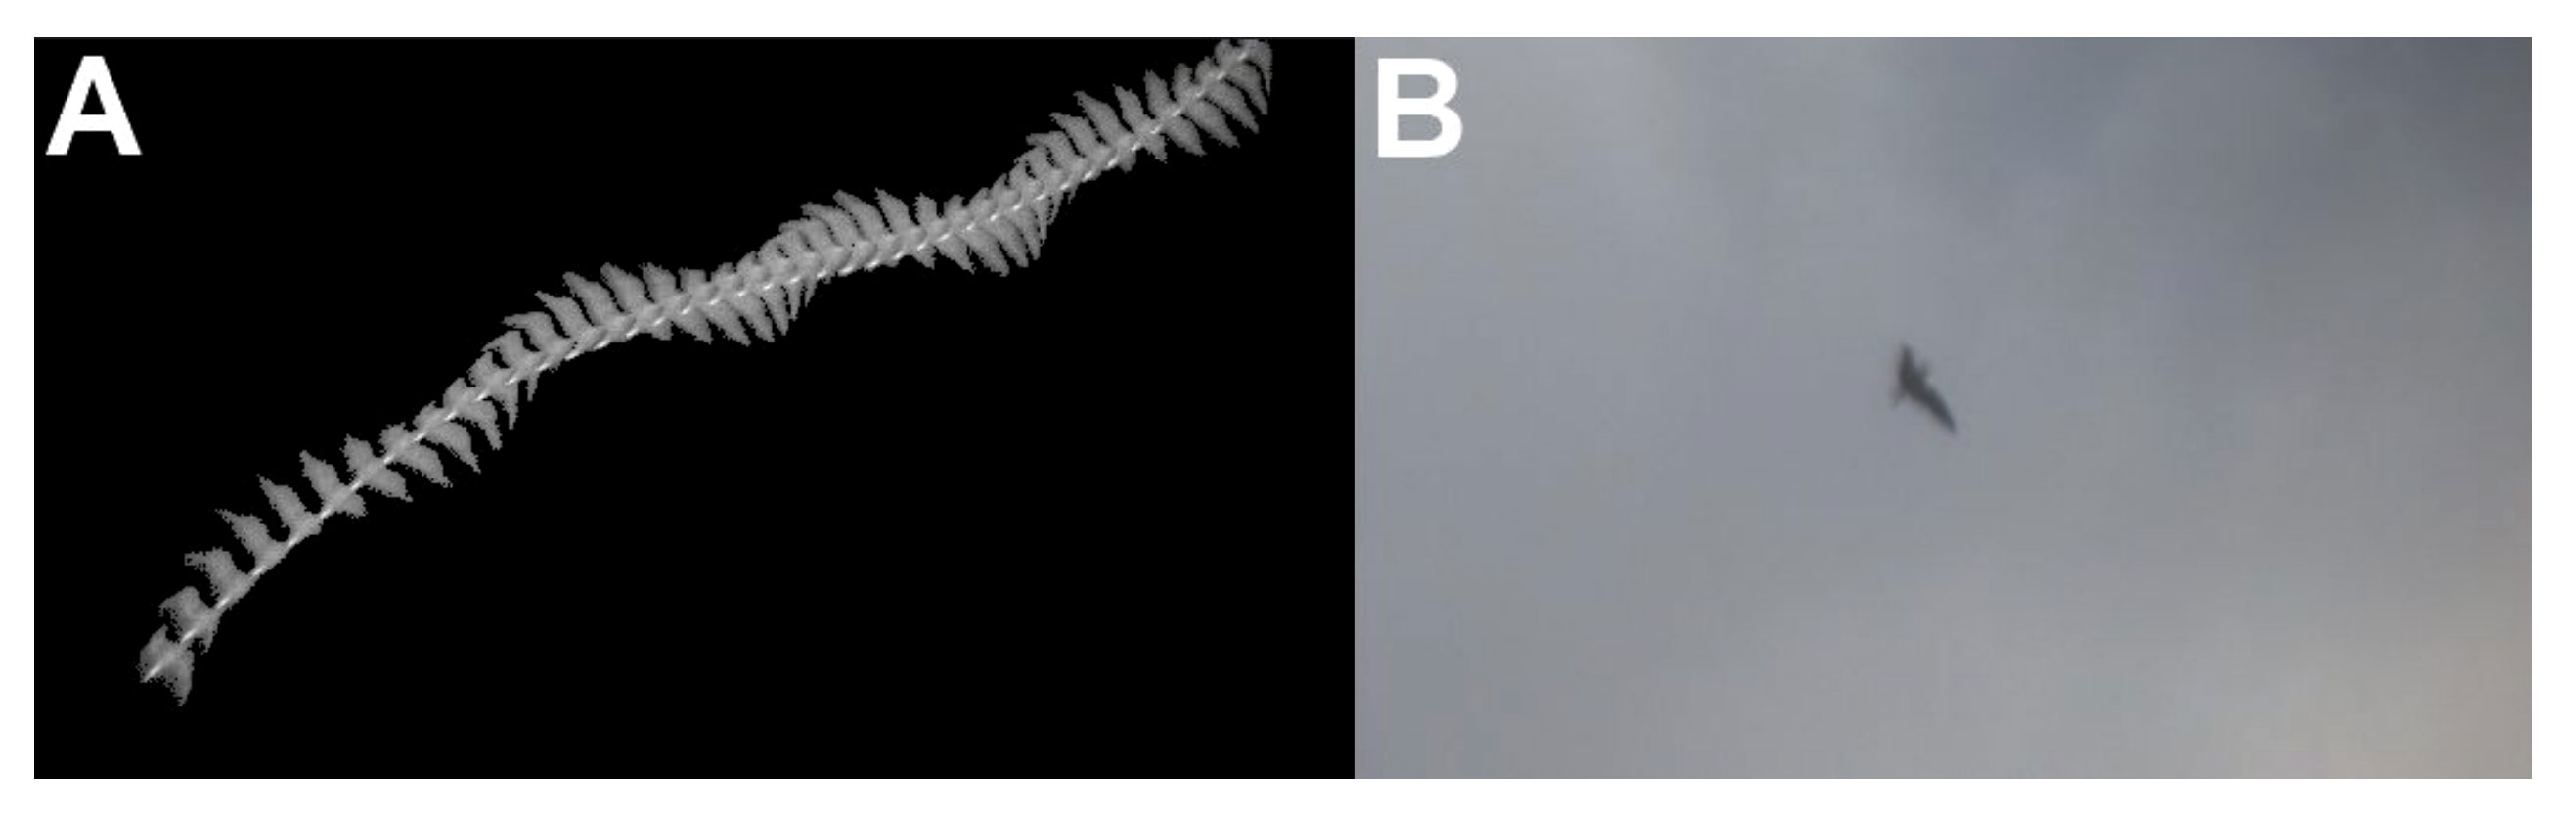
Figure 9 Paired thermal (A) and optical (B) imagery of a single flight track as it was sensed, recorded, and compiled by the various components of the ThermalTracker-3D system for further analysis and species identification purposes. This target was successfully identified as a large gull of the genus Larus.
3.3 Additional parameters for collision risk models
Based on the inputs needed to populate the online stochastic CRM developed with support from the Scottish Government since the early 2000s, all the requisite inputs can be generated with the TT3D either as is, with enhancements, or by integrating this device with additional sensors (Table 1). Additional sensors that could improve the inputs from the TT3D to CRMs include pairing with LiDAR or radar, enhanced optical camera/s for species identification, and including sensors (e.g., vibration, acoustic) to detect actual blade collision (Table 1).
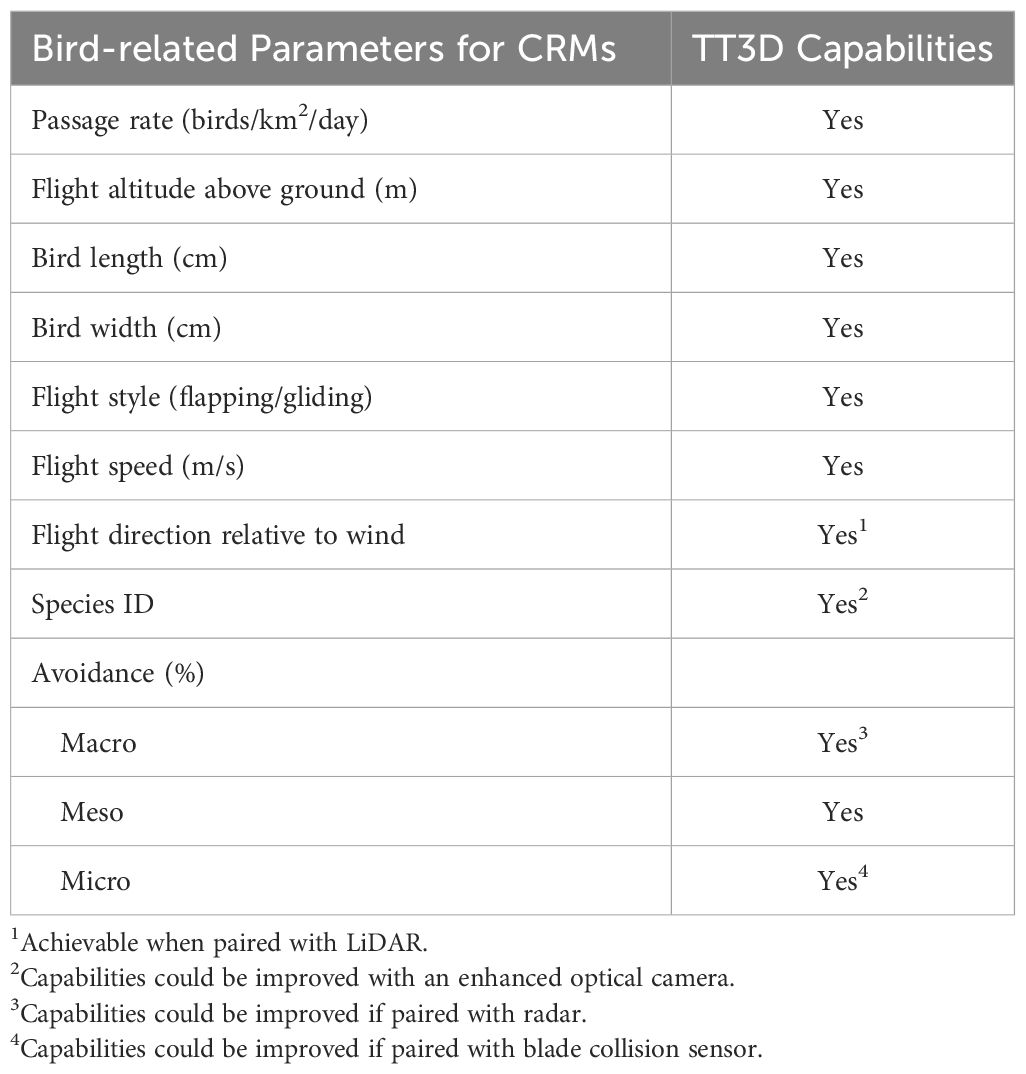
Table 1 Comparison of bird-related parameters essential for developing Collision Risk Models (CRMs) for estimating the magnitude of expected collisions compared to the capabilities of the ThermalTracker-3D, indicated by ‘Yes’.
4 Discussion
This initial at-sea deployment of the TT3D, and the data collected, complements what we know of seabird activity in space and time, in a range of weather conditions in the study area. The TT3D prototype withstood the at-sea conditions in Humboldt WEA across a yearlong deployment (i.e., winds to 33.6 m/s and consequent seas). Sensors and electronics remained functional even though the operation was interrupted due to failure of the buoy’s power system (Matzner et al., 2022). While powered and operational, the TT3D performed continuously and confirmed the software’s reliability, improved understanding of effects of motion, and collected information on rates of seabird detection, and flight tracks including height asl. Failure of the stabilization system early during the deployment did not impact data in a meaningful way. These findings suggest that logistical challenges associated with implementing robust and timely pre- and post-construction surveys in deepwater offshore environments can be overcome using the TT3D. This deployment verified that LiDAR buoys used to profile winds in OSW development areas can provide a suitable pre-construction platform to gather other environmental data, despite the relatively large range of motion and instability of such platforms relative to what is expected for actual floating OSW platforms.
The TT3D provided estimates of a bird’s position in 3D space as the bird flies through the TT3D field of view. There is error in the individual position estimates that make up the time series of positions that constitutes a flight track reported by the TT3D. The error in the estimates can be attributed to two sources: 1) uncertainty and precision limits in the stereo vision processing, and 2) the motion of the buoy. The stereo vision position error of the TT3D was characterized using a GPS-equipped drone and the TT3D position estimates were found to be within ±10 m of the GPS-derived positions in the x (horizontal) and y (vertical) dimensions, and within ±20 m in the z (range) dimension for 90% of the data points; on average, the TT3D estimated positions were within +-5 m of the GPS-derived position (Matzner et al., 2020). For the purposes of this study, the individual position estimates of a track were smoothed to reduce the noise (uncertainty, error) and then the average of the min and max of the resulting flight height estimates was used to represent the flight height of the detected animal. The buoy was subject to waves and swell during the deployment that induced angular rotation – pitch, roll, yaw – and linear translation – surge, sway, heave – of the buoy. This wave-induced motion is generally sinusoidal. Over the course of a bird’s flight through the TT3D field of view, the buoy motion will increase and decrease the apparent flight height of the bird. By using the average of the flight height over the course of the bird flight observation period, the buoy motion effects were effectively cancelled out.
Traditional vessel and aerial at-sea survey data have been used successfully to predict locations of activity “hotspots” but typically do not incorporate flight height asl (e.g., Nur et al., 2011; Bradbury et al., 2014; Leirness et al., 2021; Russell et al., 2023). Incorporation of flight height is critical, especially for the CCS in which the avifauna includes a number of species, some abundant at certain times of the year, that fly by dynamic soaring when winds are suitable for wind energy generation, e.g., large diving shearwaters, albatrosses, large gadfly petrels. Efforts to model or document the vertical component of seabird flight are based on visual estimates of flight height (Ainley et al., 2015), with precision often limited when collected from platforms close to the sea surface (Cook et al., 2018; Harwood et al., 2018; Largey et al., 2021). Flight height data have also been obtained via LiDAR deployed from aircraft. Both methods are limited because they are only feasible during daylight. GPS tracking of individual birds can be used to obtain flight height data, e.g., van Bremmelen et al., 2024). However, this method provides extensive information from just a small number of individuals, usually adults tracked from colonies (Largey et al., 2021). Ignored generally would be the non-breeding visitors to the CCS, which contribute disproportionately to the West Coast avifauna (e.g., Leirness et al., 2021; Russell et al., 2023), including the several dynamic soaring species that breed at locations in the Southern Hemisphere. The TT3D successfully provided site-specific seabird flight height and vertically explicit passage rates during the night as well as the day.
Seabird activity in or around European offshore wind farms has been evaluated using radar and optical approaches. Such efforts were carried out to develop methods and technologies to improve understanding of seabird interactions with moving turbine blades (Largey et al., 2021). Unlike radar, the TT3D can be deployed locally in an offshore floating wind farm or at its periphery and provides optical and thermal imaging. In order eventually to develop CRMs, the TT3D can be used to reduce uncertainty about passage (and related avoidance and collision) rates. The system successfully generated height-specific measures of passage at necessary spatial and temporal scales and across a full spectrum of environmental conditions. The TT3D also provided sophisticated synchronization across sensors enabling simultaneous measures of bird and wind parameters (e.g., flight tracks and wind speed at height asl), particularly at RSZ elevations. Although not analyzed in this paper, there are potential benefits of using volumetric versus planar passage rates available from the TT3D, and these can vastly improve current CRMs that rely on numerous assumptions including rotor entry angles and accurate heights.
Upon emplacement of a wind farm, the TT3D could be used to monitor collision rates. Because the TT3D can operate continuously, even rare events are far more likely to be realized. Depending on placement of TT3D units within a windfarm, changes in passage rates, and validation of avoidance rates, could be documented. Future TT3D deployments within windfarms need to consider how to partition and analyze passage rates between sensors relative to their resolution. Redundancies and/or compensatory strategies would be considered to minimize interruptions to data gathering from component failures (internal/external). Real-time processing of TT3D tracks can provide awareness of bird activity in and around RSZs that could be used for targeted collision avoidance and for informing adaptive management strategies addressing collision risk.
In future applications of the TT3D, it will be important to identify seabird flight tracks to the lowest taxonomic level. This would be important from a regulatory perspective, especially for species listed as threatened or endangered under state and federal endangered species acts. Efforts to develop automated species identification are in early development, and field studies involving experienced seabird observers identifying birds as they are detected by the TT3D in real time have been planned to help “train” the TT3D system to enhance accurate identification to the lowest taxon possible. This development will include using data obtained from the TT3D on morphology and flight behavior, in combination with other synchronized sensors such as radar, acoustics, optical imagery, and vibration sensors to improve data quality and resolution. Future uses could include other difficult-to-observe activity patterns with thermal signatures across a wider variety of species and/or scenarios.
Technologies capable of autonomously monitoring the 3D airspace use of seabirds around-the-clock in remote marine environments, especially those having inclement weather, are not readily available. We here show that the TT3D can perform in these conditions and address critical knowledge gaps related to seabirds’ flight behavior. Its ability to operate over 24-h periods in conditions that human observers would find difficult demonstrates some of its promise. We conclude that this technology is essential for developing OSW capability in the CCS, and elsewhere.
Data availability statement
The datasets presented in this study can be found in online repositories. The names of the repository/repositories and accession number(s) can be found in the article/supplementary material.
Ethics statement
Approval by an animal ethics committee was not needed for the subset of research presented in the submitted manuscript because all data were generated by passive observation.
Author contributions
SS: Writing – original draft, Writing – review & editing. SK: Writing – original draft, Writing – review & editing. SB: Writing – original draft, Writing – review & editing. ST: Writing – review & editing, Writing – original draft. DA: Writing – original draft, Writing – review & editing. SM: Writing – original draft, Writing – review & editing.
Funding
The author(s) declare financial support was received for the research, authorship, and/or publication of this article. This work was funded by the Wind Energy Technologies Office within the U.S. Department of Energy’s Office of Energy Efficiency and Renewable Energy under Contract DE-AC05-76RL01830.
Acknowledgments
We are grateful to the many individuals who contributed data to this effort. The buoy integration work was performed by AXYS Technologies, Inc. of Sidney, BC, Canada. We also thank Nhi Ly who, as an undergraduate of San Jose State University, was a recipient of the 2022 SEED Internship Program where she was paired with H. T. Harvey & Associates for a position in which her primary focus was assisting with aspects of preliminary data analysis for this project.
Conflict of interest
Authors SS, SK, SB, ST, and DA were employed by the company H.T. Harvey & Associates.
The remaining author declares that the research was conducted in the absence of any commercial or financial relationships that could be construed as a potential conflict of interest.
Publisher’s note
All claims expressed in this article are solely those of the authors and do not necessarily represent those of their affiliated organizations, or those of the publisher, the editors and the reviewers. Any product that may be evaluated in this article, or claim that may be made by its manufacturer, is not guaranteed or endorsed by the publisher.
References
Ainley D. G. (1976). The occurrence of seabirds in the coastal region of California. Western Birds 7, 33–68.
Ainley D. G., Porzig E., Zajanc D., Spear L. B. (2015). Seabird flight behavior and height in response to altered wind strength and direction. Mar. Ornithol. 43, 25–36.
Band B. (2012). “Using a collision risk model to assess bird collision risks for offshore wind farms,” in Strategic Ornithological Support Services Steering Group Report (The Crown Estate, Edinburgh, Scotland), 62.
Band W., Madder M., Whitfield D. P. (2007). “Developing field and analytical methods to assess avian collision risk at wind farms,” in Birds and wind farms: risk assessment and mitigation. Eds. de Lucas M., Janss G. F. E., Ferrer M.(Madrid: Quercus/Libreria Linneo), 259–271.
Block B. A., Jonsen I. D., Jorgensen S. J., Winship A. J., Shaffer S. A., Bograd S. J., et al. (2011). Tracking apex marine predator movements in a dynamic ocean. Nature 475, 86–90. doi: 10.1038/nature10082
BOEM Bureau Ocean Energy Management (2022). "Final Environmental Assessment - Commercial Wind Lease and Grant Issuance and Site Assessment Activities on the Pacific Outer Continental Shelf Humboldt Wind Energy Area, California" (Camarillo, CA: Prepared by the U.S. Department of the Interior, Bureau of Ocean Energy Management, Pacific OCS Region).
Bograd S. J., Schroeder I., Sarkar N., Qiu X., Sydeman W. J., Schwing F. B. (2009). Phenology of coastal upwelling in the California Current. Geophysical Res. Lett. 36, 1–5. doi: 10.1029/2008GL035933
Bonnet-Lebrun A.-S., Dias M. P., Phillips R. A., Granadeiro J. P., Brooke M. L., Chastel O., et al. (2021). Seabird migration strategies: flight budgets, diel activity patterns, and lunar influence. Front. Mar. Sci. 8. doi: 10.3389/fmars.2021.683071
Brabant R., Vanermen N., Stienen E. W. M., Degraer S. (2015). Towards a cumulative collision risk assessment of local and migrating birds in North Sea offshore wind farms. Hydrobiologia 756, 63–74. doi: 10.1007/s10750-015-2224-2
Bradbury G., Trinder M., Furness B., Banks A. N., Caldow W. G., Hume D. (2014). Mapping seabird sensitivity to offshore wind farms. PloS One 12, 1–17. doi: 10.1371/journal.pone.0106366
Briggs K. T., Tyler W. G., Lewis D. B., Carlson D. R. (1987). Bird communities at sea off California: 1975-1983 (Berkeley, CA: The Cooper Ornithological Society, Studies in Avian Biology No. 11.).
Checkley D. M., Barth J. A. (2009). Patterns and processes in the California current system. Prog. Oceanogr. 83, 49–64. doi: 10.1016/j.pocean.2009.07.028
Cook A. S. C. P., Ward R. M., Hansen W. S., Larsen L. (2018). Estimating seabird flight height using LiDAR. Scottish Mar. Freshw. Sci. 9 (14), 1–59. doi: 10.7489/12131-1
Croll D., Aspen A. E., Adams J., Cook A. S. C. P., Garthe S., Goodale M. W., et al. (2022). Framework for assessing and mitigating the impacts of offshore wind energy development on marine birds. Biol. Conserv. 276, 109795. doi: 10.1016/j.biocon.2022.109795
Dias M. P., Martin R., Pearmain E. J., Burfield I. J., Small C., Philips R. A., et al. (2019). Threats to seabirds: a global assessment. Biol. Conserv. 237, 525–537. doi: 10.1016/j.biocon.2019.06.033
Donovan C. (2017). “Stochastic Band CRM – GUI user manual”, in Marine Scotland Draft V1.0 Document (Edinburgh, Scotland: Marine Scotland), 26.
eBird (2023) eBird: An online database of bird distribution and abundance—offshore Humboldt County, California hotspot (Ithaca, New York: eBird, Cornell Lab of Ornithology). Available online at: https://ebird.org/hotspot/L889860 (Accessed 29 November 2023).
Eddy T. D., Bernhardt J. R., Blanchard J. L., Cheung W. W. L., Colleter M., du Pontavice H., et al. (2021). Energy flow through marine ecosystems: confronting transfer efficiency. Trends Ecol. Evol. 36, 78–86. doi: 10.1016/j.tree.2020.09.006
Fernández P., Anderson D. J., Sievert P. R., Huyvaert K. P. (2001). Foraging destinations of three low-latitude albatross (Phoebastria) species. J. Zool. 254, 391–404. doi: 10.1017/S0952836901000899
Furness R. W., Garthe S., Trinder M., Matthiopoulos J., Wanless S., Jeglinski J. (2018). Nocturnal flight activity of northern gannets Morus bassanus and implications for modelling collision risk at offshore wind farms. Environ. Impact Assess. Rev. 73, 1–6. doi: 10.1016/j.eiar.2018.06.006
Harwood A. J., Perrow M. R., Berridge R. J. (2018). Use of an optical rangefinder to assess the reliability of seabird flight heights from boat-based surveyors: implications for collision risk at offshore wind farms. J. Field Ornithol. 89, 1–12. doi: 10.1111/jofo.12269
Howell S. N. G. (2012). Petrels, Albatrosses and Storm-Petrels of North America (Princeton, New Jersey: Princeton University Press). doi: 10.1515/9781400839629
Jenkins A. R., Reid T., du Plessis J., Colyn R., Benn G., Millikin R. (2018). Combining radar and direct observation to estimate pelican collision risk at a proposed wind farm on the Cape west coast, South Africa. PloS One 13, e0192515. doi: 10.1371/journal.pone.0192515
Kelsey E. C., Felis J. J., Czapanskiy M., Pereksta D. M., Adams J. (2018). Collision and displacement vulnerability to offshore wind energy infrastructure among marine birds of the Pacific Outer Continental Shelf. J. Environ. Manage. 227, 229–247. doi: 10.1016/j.jenvman.2018.08.051
Largey N., Cook A. S. C. P., Thaxter C. B., McCluskie A., Stokke B. G., Wilson B., et al. (2021). Methods to quantify avian airspace use in relation to wind energy development. Ibis 163, 747–764. doi: 10.1111/ibi.12913
Leirness J. B., Adams J., Ballance L. T., Coyne M., Felis J. J., Joyce T., et al. (2021). Modeling At-Sea Density of Marine Birds to Support Renewable Energy Planning on the Pacific Outer Continental Shelf of the Contiguous United States (Camarillo, California: Bureau of Ocean Energy Management).
Li W., Song D. (2013). “Automatic bird species detection using periodicity of salient extremities,” in Proceedings of the 2013 IEEE International Conference on Robotics and Automation, 6-10 May 2013, Karlsruhe, Germany. 5775–5780 (IEEE). doi: 10.1109/ICRA.2013.6631407
Lynn R. J., Simpson J. J. (1987). The California Current system: The seasonal variability of its physical characteristics. J. Geophysical Res.: Oceans 92, 12947–12966. doi: 10.1029/JC092iC12p12947
Masden E. (2015a). “Developing an avian collision risk model to incorporate variability and uncertainty,” in Scottish Marine and Freshwater Science Report, vol. 6. (Edinburgh, Scotland: Marine Scotland Science). doi: 10.7489/1659-1
Masden E. (2015b). Developing an avian collision risk model to incorporate variability and uncertainty, R computer code.
Masden E. A., Cook A. S. C. P. (2016). Avian collision risk models for wind energy impact assessments. Environ. Impact Assess. Rev. 56, 43–49. doi: 10.1016/j.eiar.2015.09.001
Masden E. A., Cook A. S. C. P., McCluskie A., Bouten W., Burton N. H., Thaxter C. B. (2021). When speed matters: The importance of flight speed in an avian collision risk model. Environ. Impact Assess. Rev. 90, 106622. doi: 10.1016/j.eiar.2021.106622
Matzner S., Cullinan V. I., Duberstein C. A. (2015). Two-dimensional thermal video analysis of offshore bird and bat flight. Ecol. Inf. 30, 20–28. doi: 10.1016/j.ecoinf.2015.09.001
Matzner S., Warfel T. E., Hull R. (2020). ThermalTracker-3D: A thermal stereo vision system for quantifying bird and bat activity at offshore wind energy sites. Ecol. Inf. 57, 101069. doi: 10.1016/j.ecoinf.2020.101069
Matzner S., Warfel T. E., Hull R., Williams N. (2022). ThermalTracker-3D Offshore Validation Technical Report (Richland, Washington: Pacific Northwest National Laboratory Technical Report).
McGregor R. M., King S., Donovan C. R., Caneco B., Webb A. (2018). A Stochastic Collision Risk Model for Seabirds in Flight". Marine Scotland Document Number: HC0010-400-001 (Edinburgh, Scotland: Marine Scotland).
Nur N., Jahncke J., Herzog M. P., Howar J., Hyrenbach K. D., Zamon J. E., et al. (2011). Where the wild things are: Predicting hotspots of seabird aggregations in the California Current System. Ecol. Appl. 21, 2241–2257. doi: 10.1890/10-1460.1
Pennycuick C. J. (1987a). “Flight of Seabirds,” in Seabirds: Feeding Biology and Role in Marine Ecosystems. Ed. Croxall J. P. (Cambridge, UK: Cambridge University Press), 43–62.
Pennycuick C. J. (1987b). Flight of auks (alcidae) and other northern seabirds compared with southern Procellariiformes: ornithodolite observations. J. Exp. Biol. 128, 335–347. doi: 10.1242/jeb.128.1.335
Pennycuick C. J. (2002). Gust soaring as a basis for the flight of petrels and albatrosses (Procellariiformes). Avian Sci. 2, 1–12.
Rattenborg N. C., Voirin B., Cruz S. M., Tisdale R., Dell'Omo G., Lipp H., et al. (2016). Evidence that birds sleep in mid-flight. Nat. Commun. 7, 1–9. doi: 10.1038/ncomms12468
R Core Team (2022). R: A language and environment for statistical computing (Vienna, Austria: R Foundation for Statistical Computing). Available at: https://www.R-project.org/.
Richardson J., Wakefield E. D., Philips R. A. (2018). Flight speed and performance of the wandering albatross with respect to wind. Movement Ecol. 6, 2–15. doi: 10.1186/s40462-018-0121-9
Russell T. M., Szesciorka A. R., Joyce T., Ainley D. G., Ballance L. T. (2023). National Marine Sanctuaries capture enhanced abundance and diversity of the California Current Ecosystem avifauna. J. Mar. Syst. 240, 1–16. doi: 10.1016/j.jmarsys.2023.103887
Rykzaczewski R. R., Checkley D. M. (2008). Influence of ocean winds on the pelagic ecosystem in upwelling regions. Proc. Natl. Acad. Sci. United States America 105, 1965–1970. doi: 10.1073/pnas.0711777105
Severy M. A., Garcia T. (2020). “Description of Study Assumptions,” in California North Coast Offshore Wind Studies. Eds. Severy M., Alva Z., Chapman G., Cheli T., Garcia T., Ortega C., Salas N., Younes A., Zoellick J., Jacobson A.(Humboldt, CA: Pacific Northwest National Laboratory).
Severy M. A., Gorton A. M., Krishnamurthy R., Levin M. S. (2021). Lidar Buoy Data Dictionary for the 2020-2021 California Deployments (Richland, Washington: Pacific Northwest National Laboratory Technical Report PNNL-30947). doi: 10.2172/1987710
Shaffer S. A., Tremblay Y., Weimerskirch H., Scott D., Thompson D. R., Sagar P. M., et al. (2006). Migratory shearwaters integrate ocean resources across the Pacific Ocean in an endless summer. Proc. Natl. Acad. Sci. 103, 12799–12802. doi: 10.1073/pnas.0603715103
SNH [Scottish Natural Heritage] (2000). “Windfarms and birds: Calculating a theoretical collision risk assuming no avoiding action,” in Guidance Note Series, Scottish Natural Heritage(Edinburgh, Scotland: Scottish National Heritage).
Spear L. B., Ainley D. G. (1997). Flight behaviour of seabirds in relation to wind direction and wing morphology. Ibis 139, 221–233. doi: 10.1111/j.1474-919X.1997.tb04620.x
Thieurmal B., Elmarhraoui A. (2022). Suncalc: Compute Sun Position, Sunlight Phases, Moon Position and Lunar Phase in R. R Package version 0.5.0. Available at: https://cran.r-project.org/web/packages/suncalc/index.html.
Trinder M. (2017). Incorporating Uncertainty in Collision Risk Models: a test of Masden. Final Draft dated 28/04/2017 (Glasgow, UK: McArthur Green).
U.S. Navy (2023) Data Services. Available online at: https://aa.usno.navy.mil/data/ (Accessed 29 November 2023).
van Bemmelen R. S. A., Leemans J. J., Collier M. P., Green R. M. W., Middelveld R. P., Thaxter C. B., et al. (2024). Avoidance of offshore wind farms by Sandwich Terns increases with turbine density. Ornithological Appl. 126, 1–10. doi: 10.1093/ornithapp/duad055
van Erp J., Sage E., Bouten W., van Loon E., Camphuysen K. C. J., Shamoun-Baranes J. (2023). Thermal soaring over the North Sea and implications for wind farm interactions. Mar. Ecol. Prog. Series: WINDav4 723, 185–200. doi: 10.3354/meps14315
van Erp J. A., van Loon E. E., Camphuysen K. J., Shamoun-Baranes J. (2021). Temporal patterns in offshore bird abundance during the breeding season at the Dutch North Sea coast. Mar. Biol. 168, 150. doi: 10.1007/s00227-021-03954-4
Weimerskirch H., Bishop C., Jeanniard-Du-Dot T., Prudor A., Sachs G. (2016). Frigate birds track atmospheric conditions over months-long transoceanic flights. Science 353, 74–78. doi: 10.1126/science.aaf4374
Wickham H., Chang W., Henry L., Pedersen T. L., Takahashi K., Wilke C., et al. (2016). ggplot2: Create Elegant Data Visualisations Using the Grammar of Graphics. R package version 3.4.4. (Comprehensive R Archive Network). Available at: https://cran.r-project.org/web/packages/ggplot2/index.html.
Wickham H., Francois R., Henry L., Müller K., Vaughan D. (2023). dplyr: A Grammer of Data Manipulation. R package version 1.1.2. (Comprehensive R Archive Network). Available at: https://cran.r-project.org/web/packages/dplyr/index.html.
Keywords: avoidance, collision risk modeling, dynamic soaring, flight height, offshore wind, seabirds, thermal tracking system
Citation: Schneider SR, Kramer SH, Bernstein SB, Terrill SB, Ainley DG and Matzner S (2024) Autonomous thermal tracking reveals spatiotemporal patterns of seabird activity relevant to interactions with floating offshore wind facilities. Front. Mar. Sci. 11:1346758. doi: 10.3389/fmars.2024.1346758
Received: 01 December 2023; Accepted: 14 March 2024;
Published: 24 April 2024.
Edited by:
Mark Jessopp, University College Cork, IrelandReviewed by:
Sara M. Maxwell, University of Washington Bothell, United StatesIan R. Cleasby, Royal Society for the Protection of Birds (RSPB), United Kingdom
Copyright © 2024 Schneider, Kramer, Bernstein, Terrill, Ainley and Matzner. This is an open-access article distributed under the terms of the Creative Commons Attribution License (CC BY). The use, distribution or reproduction in other forums is permitted, provided the original author(s) and the copyright owner(s) are credited and that the original publication in this journal is cited, in accordance with accepted academic practice. No use, distribution or reproduction is permitted which does not comply with these terms.
*Correspondence: Stephanie R. Schneider, c3NjaG5laWRlckBoYXJ2ZXllY29sb2d5LmNvbQ==