 Suvra Roy1†
 Bijay Kumar Behera1*†
 Ramya V. L.2
 Ajay Kumar Rout1
 Vikash Kumar1
 Pranay Kumar Parida1Asim Kumar Jana1
 Pronob Das3Dharmendra Kumar Meena4Dibakar Bhakta4,5
 Absar Alam6
 Basanta Kumar Das4*Joykrushna Jena7
- 1Aquatic Environmental Biotechnology (AEB) Division, ICAR-Central Inland Fisheries Research Institute (CIFRI), Barrackpore, India
- 2Regional Centre of ICAR-CIFRI, Bangalore, India
- 3Regional Centre of ICAR-CIFRI, Guwahati, India
- 4ICAR-Central Inland Fisheries Research Institute (ICAR-CIFRI), Barrackpore, India
- 5Vadodara Research Centre of ICAR-CIFRI, Vadodara, India
- 6Regional Centre of ICAR-CIFRI, Allahabad, India
- 7Division of Fisheries Science, Krishi Anusandhan Bhawan - II, New Delhi, India
India is the habitat of many freshwater fish species that make a significant contribution to endemism. However, the native species population is declining at a very fast rate due to pollution, habitat loss or degradation, new species introduction, hydrologic alterations, and overfishing. The minor carp, Labeo gonius, is one of the important fish species in the Indian river systems and holds enormous potential in culture fisheries. Therefore, the precise status of population structure is a prerequisite for the management of the species. In the present study, we assessed the potential of mtDNA ATPase 6/8 and D-loop regions as markers to determine the genetic diversity and phylogeography of L. gonius from Indian rivers. We have selected five major Indian rivers for investigation which could represent geographically distant populations of the studied fish. A total of 210 ATPase 6/8 sequences (842 bp) and 203 D-loop region sequences (683 bp) of L. gonius from the five major Indian rivers were submitted to NCBI. Results revealed that ATPase 6/8 has 17 haplotypes and 70 polymorphic sites with an overall haplotype diversity of 0.560 ± 0.036 and nucleotide diversity of 0.00347 ± 0.00. Furthermore, D-loop analysis revealed 58 haplotypes, 67 polymorphic sites, 0.954 ± 0.006 overall haplotype diversity, and 0.01914 ± 0.00 nucleotide diversity. The hierarchical AMOVA analysis indicated that a high proportion of the genetic variation (76.46% and 70.22% for the D-loop and ATPase 6/8 regions, respectively) was attributed to among-population variation under gene pool-1 (considering all the stocks from Ganga, Brahmaputra, Teesta, Narmada, and Mahanadi as a single pool). Furthermore, in gene pool-2, samples were divided into two groups: group 1 (Himalayan rivers)—Ganga, Brahmaputra, and Teesta; and group 2 (peninsular rivers)—Narmada and Mahanadi. Genetic variations in the D-loop and ATPase 6/8 regions were found among populations within groups at 70.65% and 53.48%, respectively. Haplotype network analysis revealed that there were significant differences in distributions and frequencies. The observed unique haplotypes might be useful for differentiating the stocks. In brief, the present study suggested that the D-loop and ATPase 6/8 regions are potential markers and represent a significant contribution to the genetic characterization of the minor carp L. gonius from major Indian rivers. Moreover, the L. gonius population along the east coast especially in the Himalayan rivers (Ganga, Brahmaputra, and Teesta river basin) is found to be genetically more diverse. The results would provide a scientific basis for the assessment of fisheries resources and management of this important species.
Introduction
India is endowed with a vast network of rivers and tributaries, which play crucial roles in inland fisheries, agriculture, hydroelectricity, transportation, and livelihoods for a vast number of people. Riverine resources provide essential ecological services that contribute to overall health, supporting biodiversity and productivity of the environment. Some of the major rivers in India include the Ganges, Brahmaputra, Teesta, Mahanadi, and Narmada. The river Ganga/Ganges is the largest river in India and the fifth longest in the world and has high cultural and religious value (Das et al., 2023). The river Ganga originates from the western Himalayas “Gaumukh” and discharges into the Bay of Bengal. The Brahmaputra is another major river that originated from the Himalayas, which flows through three countries, viz., China, India, and Bangladesh. The river Teesta is a tributary of the Brahmaputra; historically, the orientation of the Teesta River has shifted several times, and it has intermittently flowed into both of the major rivers (Ganga and Brahmaputra) (Richards et al., 2021; Chaubey et al., 2023). The river Mahanadi is a major rainfed peninsular river in East Central India, and it is very vulnerable to climate change and seasonal variability (Jin et al., 2018; Gunjan et al., 2020). The Narmada is another important peninsular river that rises on the Amarkantak Plateau in Madhya Pradesh and discharges into the Arabian Sea, making it the fifth biggest river in India. India is also home to many freshwater fishes contributing a high degree of endemism to the world’s biological resources (Mogalekar et al., 2017). However, the riverine ecosystem of India is suffering from intense human intervention resulting in habitat loss/degradation, pollution, and hydrologic alterations, and as a result, many freshwater fish species are at risk and are declining (Sarkar et al., 2012; Das et al., 2023). Moreover, with the global climate change scenario, the diversity and populations of many species will have to adapt or will go extinct (Peñuelas et al., 2013; Scheffers et al., 2016).
Genetic diversity is important for the long-term survival of species and, thus, is of high conservation concern (Funk et al., 2019). In this context, there is an urgent need to understand the genetic variation of freshwater fish species for the conservation of genetic resources (Weitemier et al., 2021). Genomics technologies have aided population characterization using species-specific markers, and an appropriate marker must be selected to determine genetic diversity in a population. Molecular genetic markers have become valuable tools in population genetics, conservation biology, and evolutionary studies. Among the different available DNA markers, mitochondrial DNA (mtDNA) markers have been widely and effectively used for the assessment of population genetic analysis, genetic diversity, gene flow, population structure, phylogeography, evolutionary studies, and stock characterization (Habib et al., 2012; Sati et al., 2015). The mtDNA markers are generally variable within populations and widely used to determine the variation at interspecific and intraspecific levels. This has been attributed to its maternal inheritance, lack of recombination, high rate of evolution, and practical advantages such as simpler operation, universal primer, and quick and comparable results (Satoh et al., 2016; Forcina et al., 2021). Moreover, mtDNA markers are cost-effective and easy to develop in comparison to microsatellite and single nucleotide polymorphism (SNP) markers (Zimmerman et al., 2020). Several mtDNA regions such as the control region (D-loop), ATPase 6/8, COI, Cyt b, and 16S RNA have been employed for population genetic characterization of many fish species (Swain et al., 2014; Fang et al., 2022; He et al., 2022). Among these markers, the D-loop is a non-coding region and exhibits generally higher genetic variations relative to coding regions. The D-loop control region is the marker of choice and has important value for investigating intraspecific genetic differentiation (Mandal et al., 2012; Sahoo et al., 2020; Zhang et al., 2020), and it has been the most widely used mtDNA marker in many phylogenetic genetic studies in fish (Xie et al., 2006; Paixão et al., 2018; Jiang et al., 2019; Gao et al., 2020; Sahoo et al., 2020). In addition, another important mitochondrial region ATPase 6/8 also mutates at a faster rate compared with the nuclear genes and is a potential marker analyzed for both phylogeny and phylogeography; hence, it is very useful in genetic diversity, population genetics, and evolution studies (Divya et al., 2015; Singh et al., 2016; Balasubramaniam et al., 2022). The ATPase 6/8 gene has been used successfully in many fish species (Behera et al., 2015, 2018a, 2018b; Mandal et al., 2012; Paixão et al., 2018).
The minor carp fish species Labeo gonius (Hamilton, 1822), commonly known as “ghonia” or “kuria labeo” (belonging to the Order Cypriniformes, Family Cyprinidae), is widely distributed in Indian rivers. The genus “Labeo” represents the dominant group in cyprinids comprising 103 fish species around the world. Though freshwater aquaculture is dominated by major carps in India, the minor carp L. gonius holds enormous potential as a new candidate species for diversification in aquaculture, due to its higher consumer preference, better taste, and high market value (Mohanta et al., 2008; Jayasankar, 2018). In many areas throughout the country, L. gonius trades for more money than Indian major carps (IMCs). The fish can be cultured for short periods (two crops in a year), along with IMCs in composite fish culture and integrated fish culture systems, and can be grown in cages or pens in open water bodies. As an herbivorous bottom feeder, the fish can be substituted for Cirrhinus mrigala in a grow-out carp culture system without reducing productivity, giving farmers the option to diversify their culture techniques (Das et al., 2010). Similar to rohu, L. gonius is a high-fecund fish between 245,000 (800–900 g fish) and 540,000 (1.5–1.6 kg fish). It breeds naturally in riverine environments during the monsoon season; however, captive breeding can be induced using pituitary gland extract and synthetic hormones. Since L. gonius possesses culture potential, introducing the species into the culture system along with the IMCs would help in the diversification of culture practices. Earlier, the species was listed under the Lower risk-Near threatened (LR-nt) category (CAMP 1998: IUCN 2010); however, after management efforts from farmers, policymakers, and researchers, this fish now falls under the Least-concern (LC) category (Mogalekar et al., 2017). To facilitate in-situ conservation as well as aquaculture prospects, active research is being conducted on the artificial propagation, captive breeding, and seed production of this species (Behera et al., 2009). For the implementation of any effective conservation and management programs, it is desirable to obtain the genetic background of this species. There are also efforts to increase the production of the species through genetic improvement programs; however, it requires proper evaluation of stocks in terms of measuring genetic variability within and among populations. Nevertheless, very limited research has been done on genomics, genetic diversity, and population structure for the genetic management of this species.
Therefore, in the present study, the genetic diversity and structure of the important minor carp species (L. gonius) were assessed by analyzing the two mtDNA markers, D-loop region and ATPase 6/8 gene, after collecting the individuals from five major Indian rivers (namely, Ganga, Brahmaputra, Teesta, Mahanadi, and Narmada). These results are particularly important given the paucity of evidence available on the genetic diversity and structure of L. gonius. The knowledge gained from this study will provide future work having conservation management and marker-assisted selection implications for the studied fish.
Materials and methods
Study area and sampling
The L. gonius fish specimens (juvenile as well as maturing and mature) were collected from the five designated major Indian rivers (Ganga, Brahmaputra, Teesta, Mahanadi, and Narmada) situated in different geographical areas in India with multiple samplings from each location (Figure 1; Supplementary Table 1). Labeo gonius is identified with the taxonomic keys of Talwar and Jhingran (1991) and Rahman (2005). Fifty milligrams of tissue and fin samples were obtained from each specimen and stored in 95% ethanol until genomic DNA extraction.
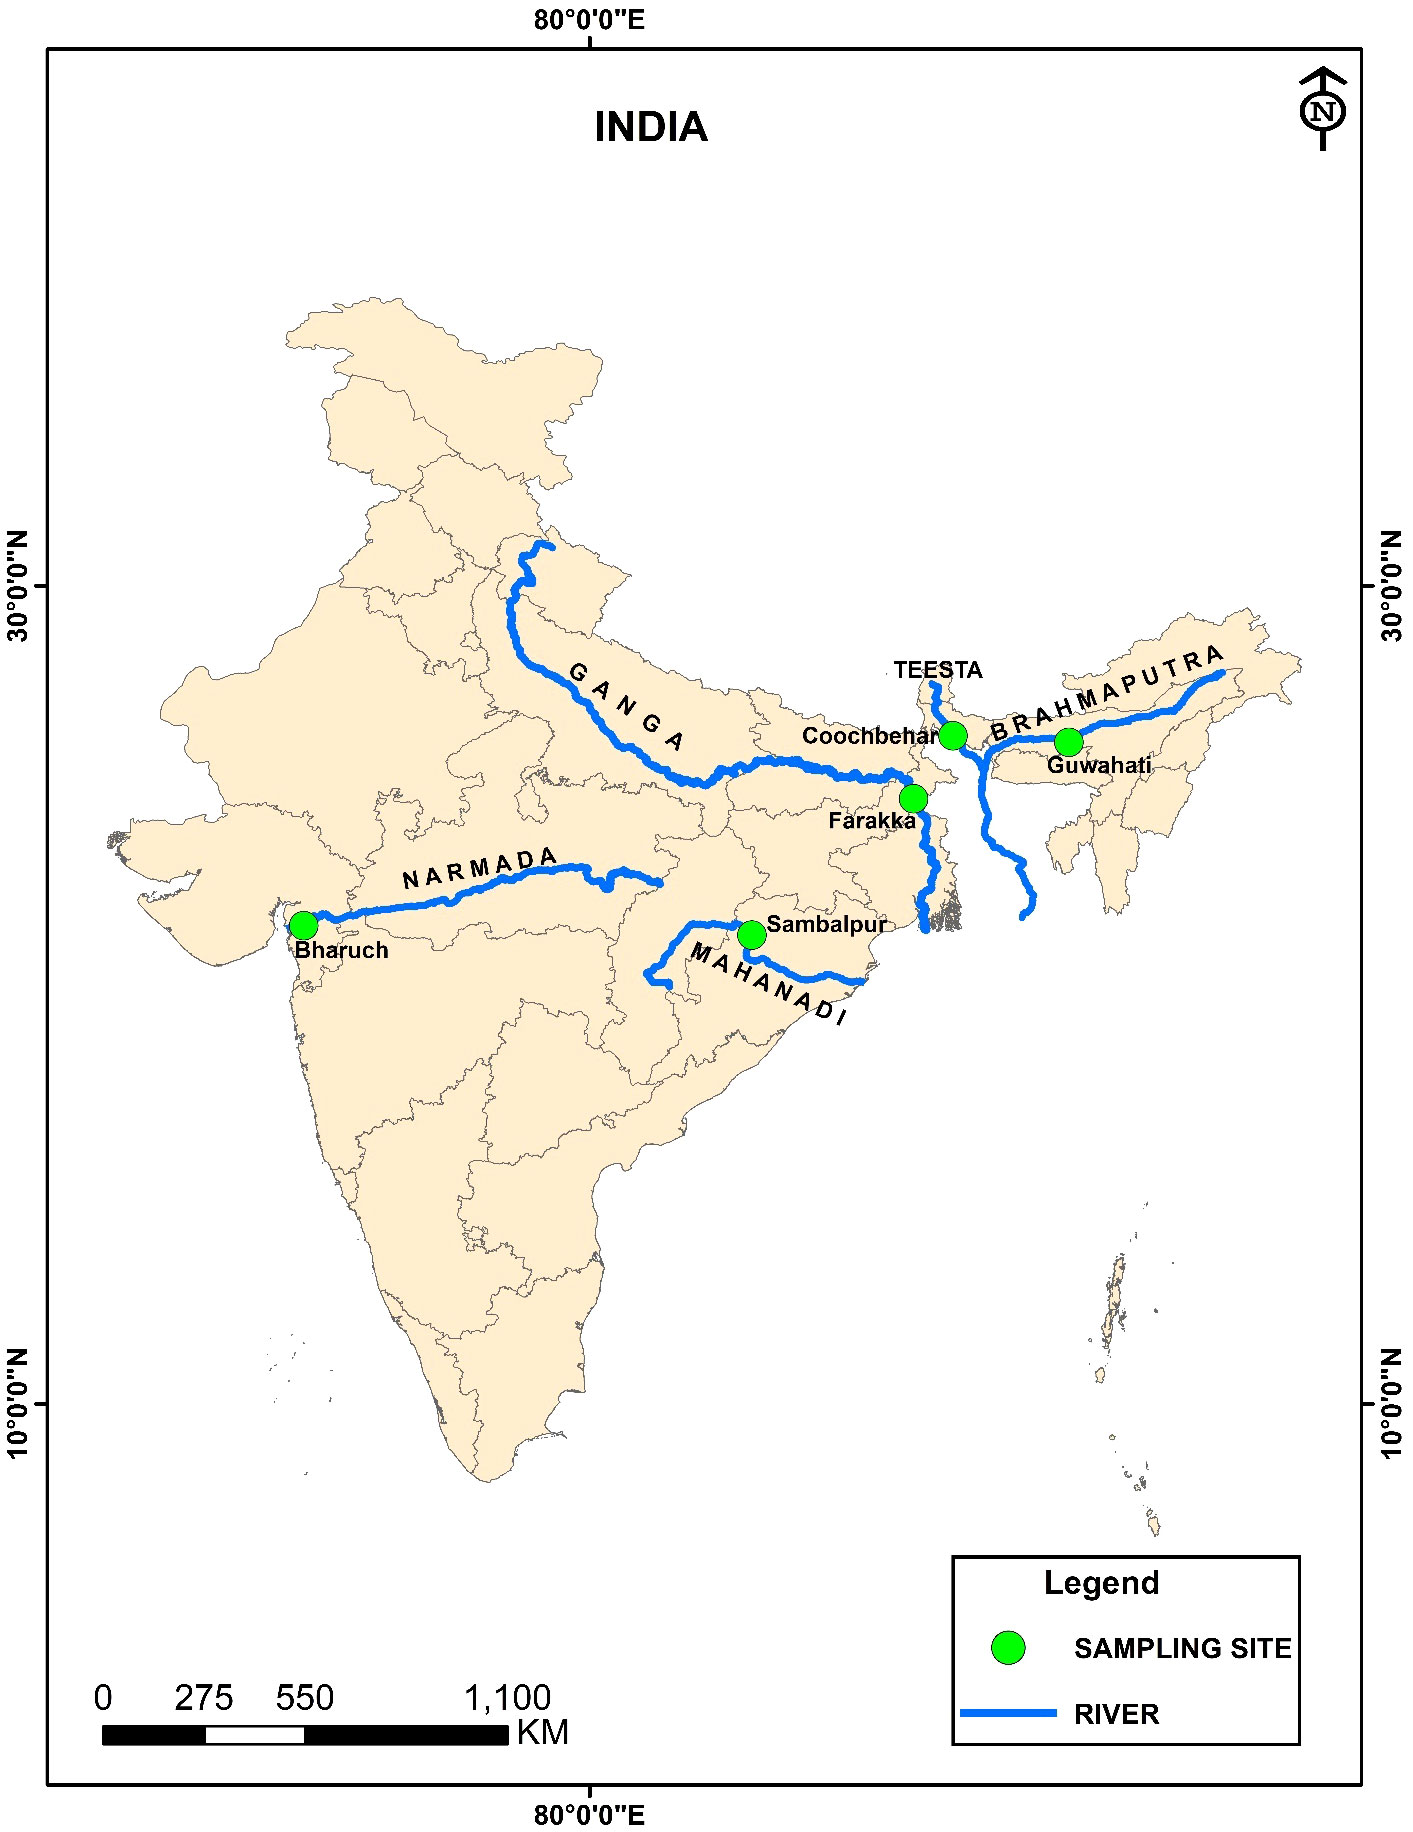
Figure 1 Map showing the sampling locations of Labeo gonius individuals during the present study.
Genomic DNA extraction and amplification of the mitochondrial ATPase 6/8 and D-loop region
Total genomic DNA was isolated from each tissue and fin samples/individuals using the phenol–chloroform method with slight modifications. The isolated genomic DNA from each sample was resuspended in TE buffer (10 mM of Tris–HCl, 0.1 mM of EDTA, pH 8.0), and its quality and concentration were estimated using a UV spectrophotometer. Then, the isolated genomic DNA was diluted to 25 ng/ml and stored at −20°C until use for further PCR analysis. Individuals/samples were amplified through PCR for the mitochondrial ATPase 6/8 gene (using primer forward: 5′AAAGCRTYRGCCTTTTAAGC3′ and reverse: 5′GTTAGTGGTCAKGGGCTTGGRTC3 ′) and D-loop gene (using primer forward: 5′CATCGGTCTTGTAATCCGAAGAT3 ′ and reverse: 5′GTTTCGGGGTTTGACAAGGATA3′) (Sivasundar et al., 2001). PCR amplification was carried out in 25 ml of reaction mixture, containing PCR reaction buffer (10 mM of Tris–HCl, pH 9.0, 50 mM of KCl, and 0.01% gelatine), 1.5 mM of MgCl2, 0.2 mM of each dNTP, 20 pmol of each primer, 1.5 U of Taq polymerase, and 100 ng of template DNA. PCR was performed using the thermal cycler Gene Amp PCR System 9700 (Applied Biosystems, Foster City, CA, USA) with following the procedure: initial denaturation at 94°C for 5 min followed by 35 cycles of 94°C for 30 s and at 56°C annealing temperature for 1 min, elongation at 72°C for 2 min, with a final elongation at 72°C for 5 min. The PCR-amplified products were checked through 1.8% agarose gel electrophoresis and were purified using the QIAquick PCR purification kit (Qiagen, UK).
Data analysis
The PCR-amplified products of the two mitochondrial genes—ATPase 6/8 and D-loop—from each sample/individual of the five rivers were sequenced bidirectionally using an ABI 3730xl capillary sequencer (Applied Biosystems, Foster City, CA, USA). A total of 210 ATPase 6/8 sequences and 203 D-loop control region sequences from L. gonius samples taken from the five main rivers in India have been submitted to NCBI (Supplementary Table 2). The sequences were aligned with ClustalW, and evolutionary analysis was conducted in MEGA11 software (Felsenstein, 1985; Tamura et al., 2021). A phylogenetic tree was inferred by using the maximum likelihood method based on the general time reversible model in the MEGA11 software with 1,000 bootstrap replicates in the phylogeny test to represent the consensus tree. DnaSP 6.1 (Rozas et al., 2017) was used to determine the molecular indices such as the number of polymorphic sites, haplotype diversity (Hd), nucleotide diversity (π), and pairwise FST within and between the populations to assess the population structure of L. gonius. To determine the population genetic structure within and between populations, a hierarchical analysis of molecular variance (AMOVA) was performed for L. gonius populations based on the mtDNA ATPase and D-loop control region using Arlequin v3.5.1.3 (Excoffier and Lischer, 2010). The pairwise population comparison (FST), Tajima’s D, and mismatch distributions were estimated using Arlequin v3.5.1. The sum of squared deviation (SSD) and Harpending’s raggedness index (Hri) were used to test the mismatch distribution under the population expansion model (Harpending, 1994). The phylogeographic haplotype network was constructed using NETWORK 4.612 (Bandelt et al., 1999).
Results
Sequence composition and variation
ATPase region
The ATPase genes of L. gonius (842 bp) from the five major rivers of India were analyzed, and the 210 total sequences were submitted to NCBI with gene accession numbers KT005344–KT005384 for Ganga River; KU686247–KU686276, KU686297–KU686302, KU686360–KU686363, and KX244995–KX244997 for the river Brahmaputra; KT001131–KT001151, KU686232–KU686246, KU686294–KU686295, and KX244994 for the river Teesta; KU686222–KU686231, KU686303–KU686333, and KX244992–KX244993 for the river Mahanadi; and KU686277–KU686293, KU686296, and KU686334–KU686359 for the river Narmada (Supplementary Table 2). The average nucleotide frequencies of the mtDNA ATPase region for all the 210 samples of L. gonius were adenine (A): 31.80%, thymine (T): 26.08%, guanine (G): 12.50%, and cytosine (C): 29.62%, and the region was rich in A+T content (57.88%). There were 16 parsimony informative sites (site positions: 54, 185, 197, 209, 219, 410, 515, 602, 609, 650, 653, 734, 803, 821, 824, and 825) and 54 singleton variable sites.
D-loop region
The D-loop region of L. gonius (683 bp) from the five major rivers of India was analyzed, and the 203 total sequences were submitted to NCBI with gene accession numbers KP676818–KP676860 for the river Ganga; KP676861–KP676883 and KY488396–KY488411 for the river Teesta; KX943249–KX943289 for the river Mahanadi; KY488354–KY488395 for the river Brahmaputra; and KY646046–KY646048 and KY488412–KY488449 for the river Narmada (Supplementary Table 2). The average nucleotide frequencies of mtDNA for the D-loop region in all the 203 samples of L. gonius were adenine (A): 31.80%, thymine (T/U): 26.08%, guanine (G): 12.50%, and cytosine (C): 29.62%, and the region was rich in A+T content (57.88%). There were 6 singleton variable sites (site positions: 104, 231, 287, 321, 430, 575), 69 polymorphic sites, and 64 parsimony informative sites.
Genetic diversity and genetic differentiation
ATPase region
The genetic variability indices based on polymorphic site, haplotype diversity (Hd), and nucleotide diversity (π) are presented in Table 1. Overall, the sequence analysis of the ATPase 6/8 region of L. gonius revealed 70 polymorphic sites, with the highest polymorphic sites observed in the river Mahanadi (58). Based on the nucleotide variations, a total of 17 haplotypes were identified among the five rivers, with Brahmaputra having the highest number of haplotypes (8), followed by Mahanadi (6). The haplotype diversity (Hd) from all the major river sampling stations ranged from 0.095 ± 0.095 (Ganga) to 0.594 ± 0.072 (Mahanadi), whereas nucleotide diversity (π) was relatively low for all the studied populations ranging between 0.000117 ± 0.00 (Ganga) and 0.00407 ± 0.00285 (Mahanadi). The overall average number of nucleotide differences (K) for the ATPase 6/8 gene was found to be 2.918, with the river Mahanadi having the highest number and Ganga having the lowest number (Table 1). Hierarchical AMOVA analysis was carried out for the L. gonius ATPase 6/8 region among and within populations based on the two principal clusters (Table 2). The populations were analyzed as gene pool-1 (considering all the stocks from Ganga, Brahmaputra, Teesta, Narmada, and Mahanadi as a single pool) and gene pool-2 [where samples were grouped into two groups: group 1 (Himalayan rivers)—Ganga, Brahmaputra, and Teesta; and group 2 (peninsular rivers)—Narmada and Mahanadi]. This analysis provided insights into the proportion of genetic variation attributable to within-population (FST), within-group (FSC), and among-group (FCT) differences. The FST values were significant for the ATPase 6/8 region in both comparisons, with the highest value (FST: 0.724; p = 0.000) observed in gene pool-2 in comparison to gene pool-1 (FST: 0.702; p = 0.000). Under gene pool-1, the percentage of variation among populations (70.22%) was greater than within populations (29.78%), whereas in gene pool-2, a maximum percentage of variation was observed among populations within groups (53.48%). These results indicate that the genetic divergence both between populations and groups was significant. In the pairwise comparison of the genetic differentiation indices (FST), among all the five Indian major rivers, the highest genetic differentiation was exhibited between groups from Ganga and Narmada (FST = 0.917) followed by groups from Teesta and Narmada (FST = 0.896) and the lowest between groups from Brahmaputra and Teesta (0.035) followed by Ganga and Brahmaputra (0.048), respectively. The results were in agreement with the fact that there was greater genetic differentiation among populations than within populations (Table 3). The p-distance evaluation depicts that the groups between Narmada and Mahanadi recorded the highest value. Estimates of genetic differentiation between all five river populations of L. gonius using the sudden expansion model (τ, θ0, θ1, SSD, and RI) and execution of neutrality are given in Table 4. For both Tajima’s D (Tajima, 1989) and Fu’s Fs statistics (Fu, 1997), Mahanadi, Brahmaputra, and Teesta river populations exhibited moderate to high negative values. Moreover, the Narmada population showed the lowest non-significant Tajima’s D and Fs values. However, the Ganga population depicted non-significant positive Tajima’s D and Fs values.
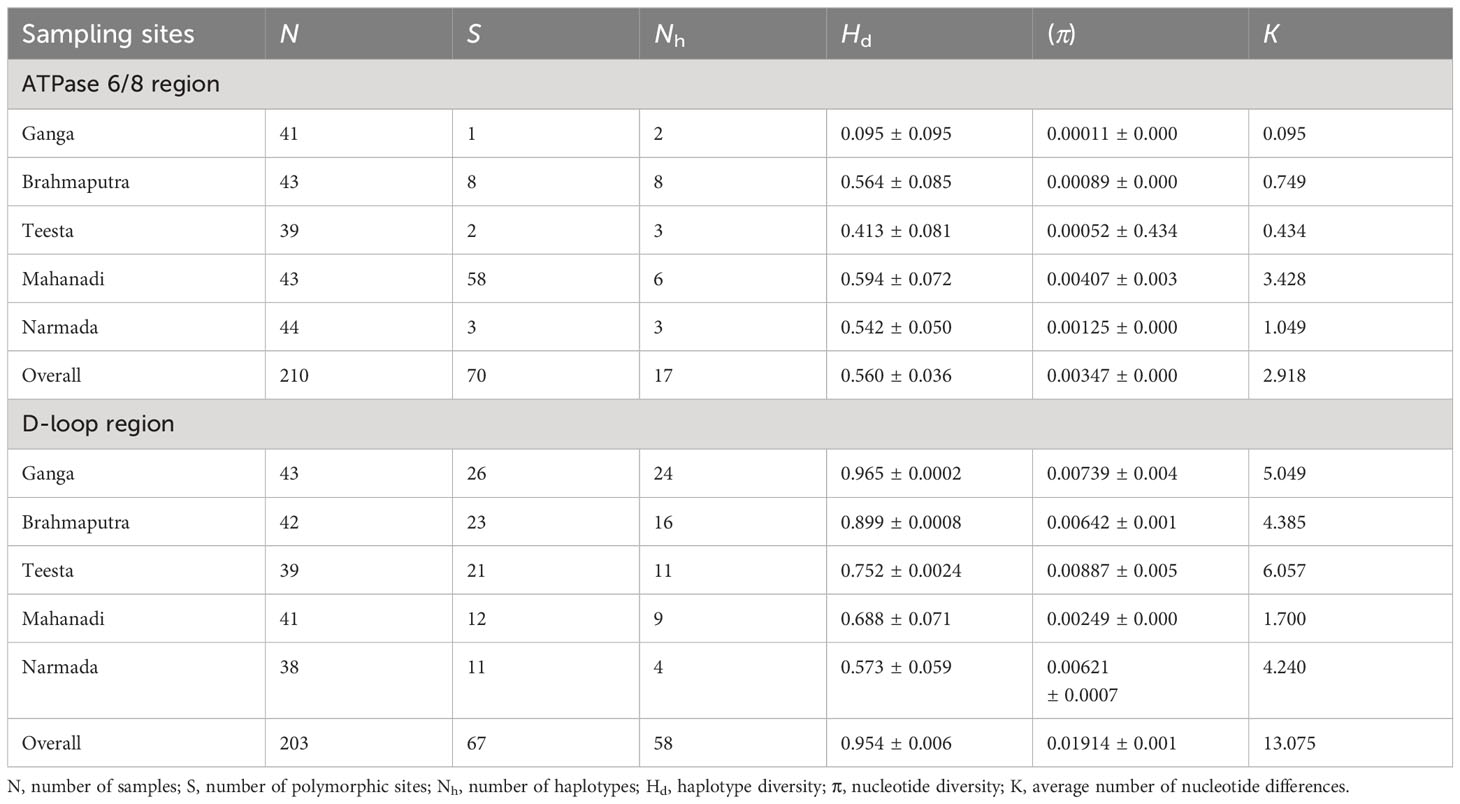
Table 1 Genetic diversity of Labeo gonius from the major rivers of India estimated using the mtDNA ATPase and D-loop control regions.
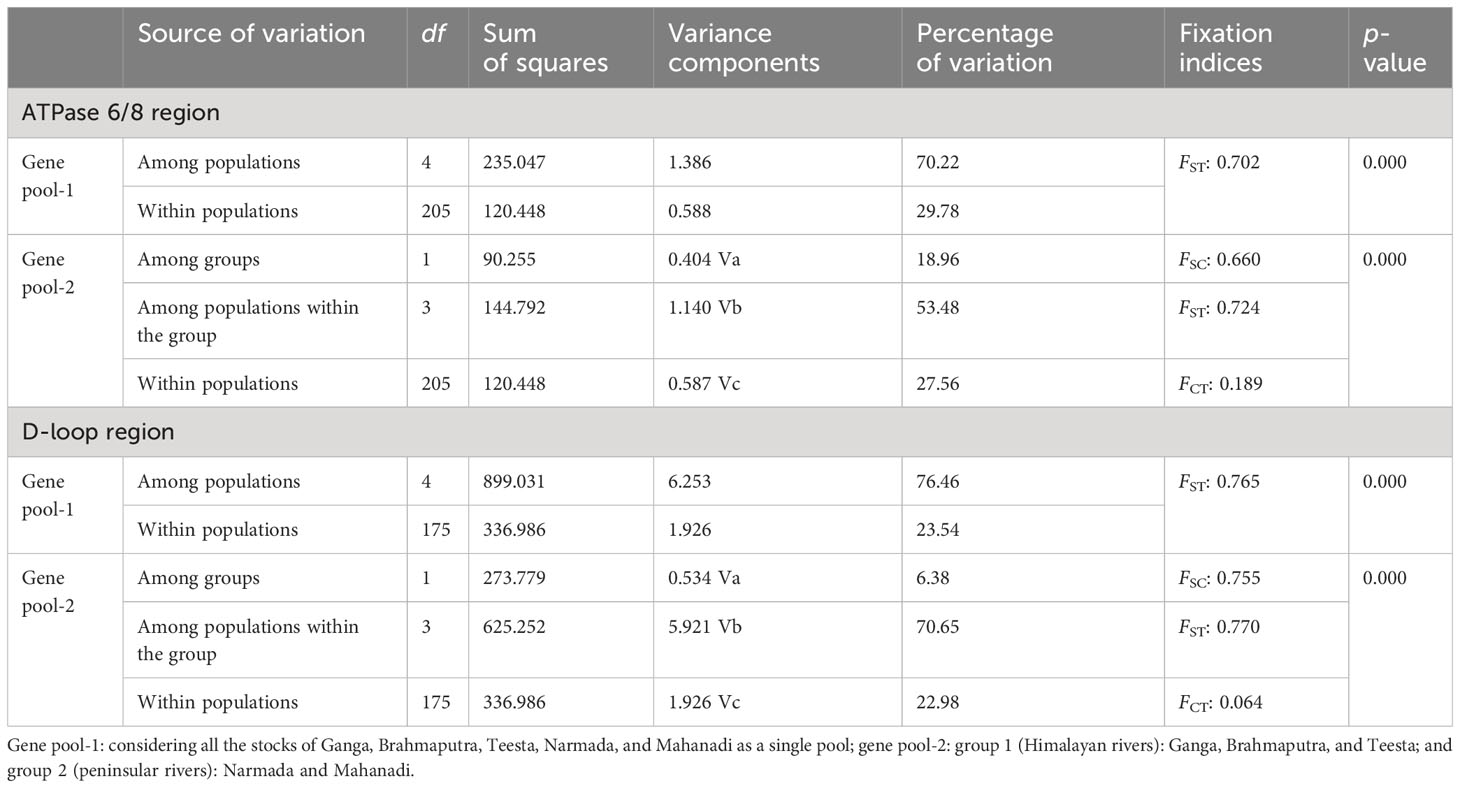
Table 2 Results of the hierarchical analysis of molecular variance (AMOVA) of populations of Labeo gonius based on the mtDNA ATPase and D-loop control regions.
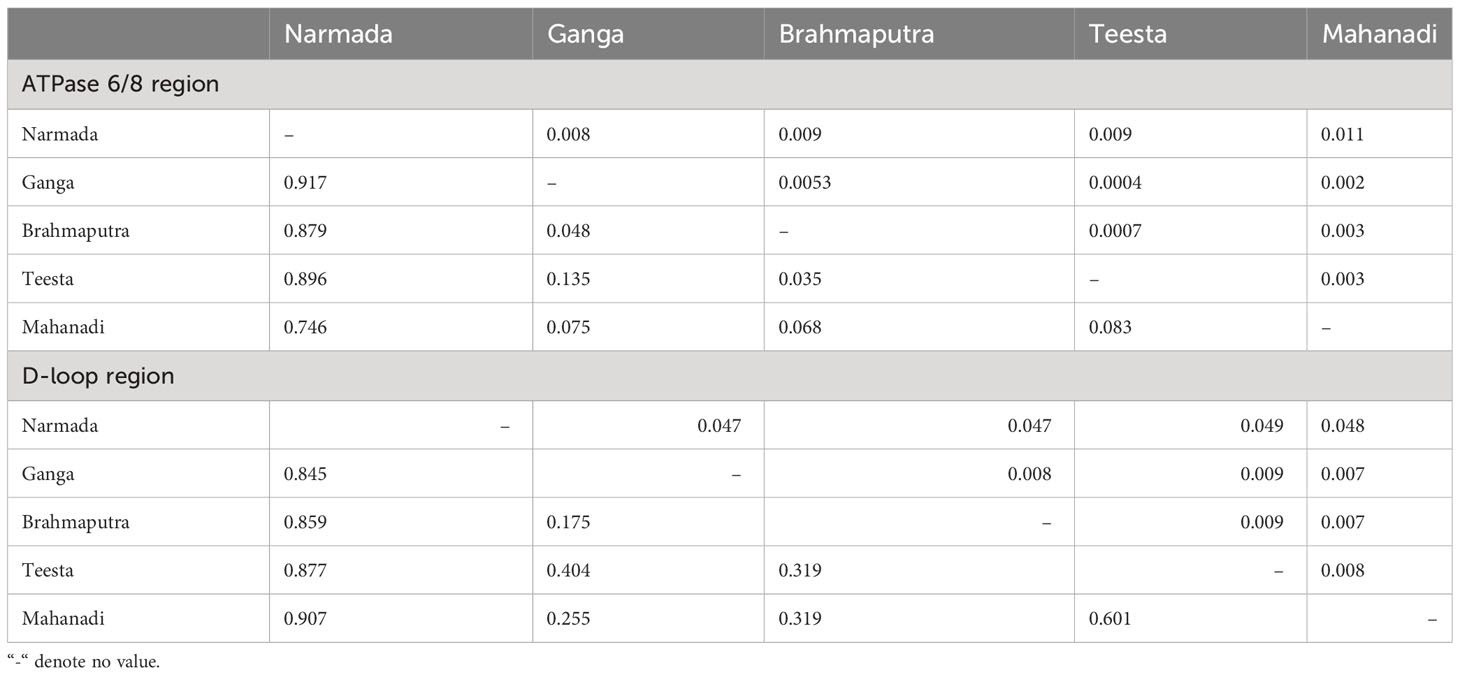
Table 3 Pairwise difference FST value (below) and p-distance value (above) diagonals of Labeo gonius from the major rivers of India (significant at p < 0.05).
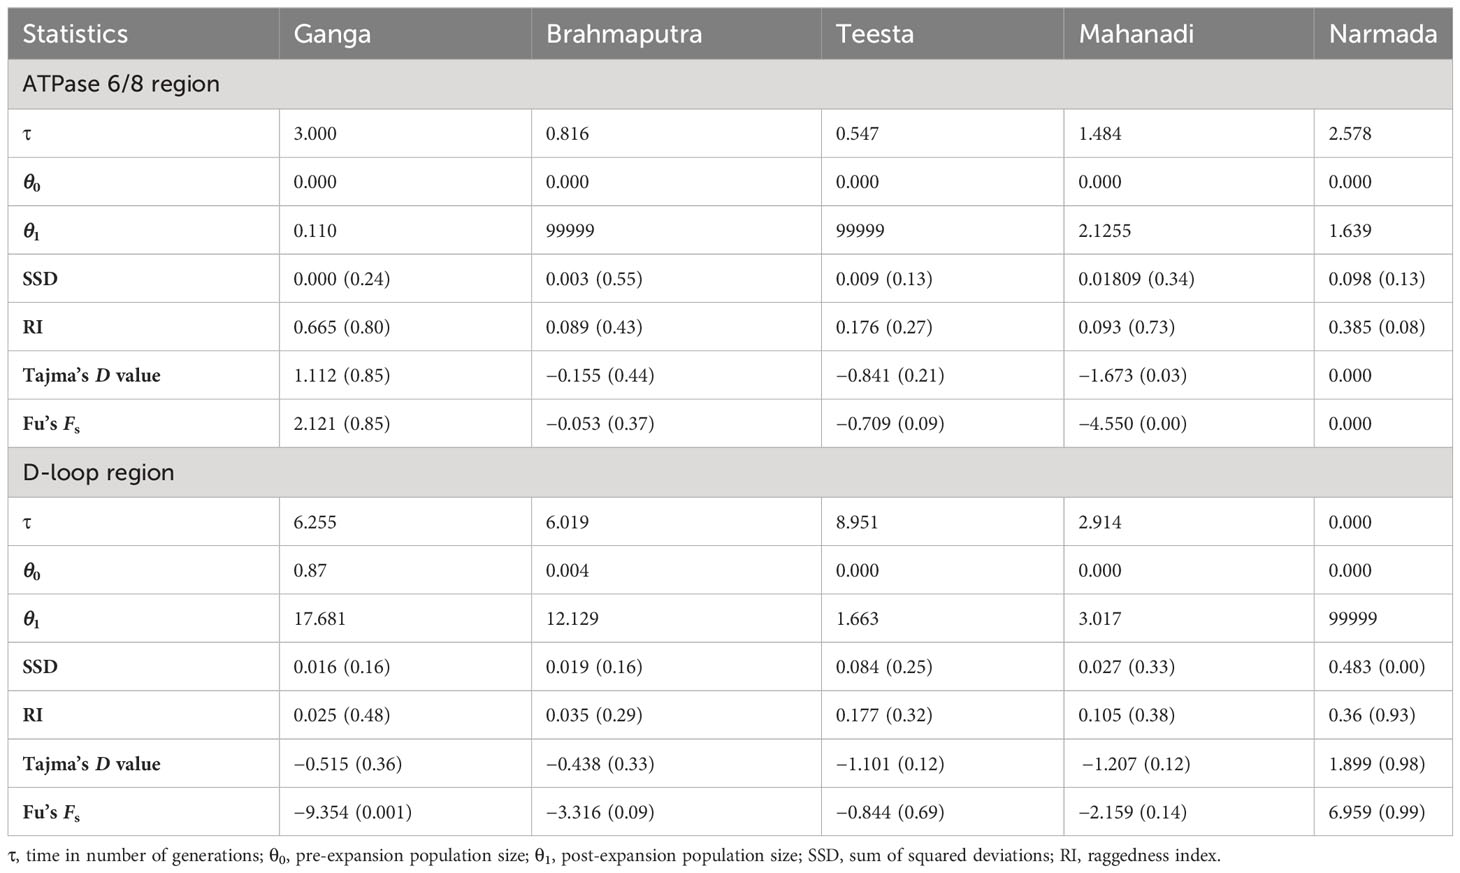
Table 4 Parameters of the sudden expansion model and execution of neutrality of Labeo gonius sampled from the major rivers of India.
D-loop region
The genetic variability indices based on polymorphic site, haplotype diversity (Hd), and nucleotide diversity (π) are presented in Table 1. Overall, the sequence analysis of the mitochondrial D-loop region of L. gonius revealed 67 polymorphic sites, with the highest polymorphic sites observed in the Ganga River (26) followed by Brahmaputra (23) and Teesta (21). Altogether, based on nucleotide variations, 58 haplotypes were identified, while the Ganga River had the highest number of haplotypes with 24 haplotypes, followed by the rivers Brahmaputra with 16 haplotypes and Teesta with 11 haplotypes, respectively. The haplotype diversity (Hd) ranged from 0.573 ± 0.059 to 0.965 ± 0.00015, with the Ganga River population having the highest diversity and the Narmada river population having the lowest diversity. Furthermore, the overall haplotype diversity was 0.954 ± 0.006. Nucleotide diversity from all the major rivers ranged from 0.00249 ± 0.000 to 0.00887 ± 0.005, with the river Teesta having the highest diversity and the river Mahanadi having the lowest diversity. Moreover, an overall nucleotide diversity (π) was observed (0.01914 ± 0.001). The overall average number of nucleotide differences (K) was found to be 13.075, with the river Mahanadi having the lowest number and the Teesta River having the highest (Table 1). AMOVA analysis of hierarchical gene diversity for the D-loop region of L. gonius was also carried out among and within populations based on the two principal clusters: gene pool-1 and gene pool-2 (Table 2). The FST values were significant for the ATPase 6/8 region in both comparisons, with the highest value (FST: 0.770; p = 0.000) observed in gene pool-2 in comparison to gene pool-1 (FST: 0.765; p = 0.000). Under gene pool-1, the percentage of variation among populations (76.46%) was greater than within populations (23.54%), whereas in gene pool-2, a maximum percentage of variation was observed among populations within groups (70.65%). These results indicate that there is genetic divergence in both between populations and groups. In the pairwise comparison of the genetic differentiation indexes (FST), the highest genetic differentiation was observed between Narmada and Mahanadi (FST = 0.907), followed by Narmada and Teesta (FST = 0.877) and Narmada and Brahmaputra (FST = 0.859), respectively, and the lowest genetic differentiation was observed between Ganga and Brahmaputra (FST = 0.175) (Table 3). Estimates of genetic differentiation between all five river populations of the L. gonius D-loop region using the sudden expansion model (τ, θ0, θ1, SSD, and RI) and execution of neutrality are given in Table 4. Tajima’s D and Fs values for the L. gonius D-loop region were found to be negative in all the river sample populations except the Narmada population.
Evolutionary and phylogeographic relationships
ATPase region
The phylogenetic tree showed that haplotypes were clustered into four principal clusters (Figure 2A; Supplementary Table 3). Haplotypes H1–H3 belonging to the river Narmada were grouped into one principal clade and in another principal clade subdivided into two more subgroups with a mixture of haplotypes belonging to all the studied rivers including the most common haplotype H5 except from the river Narmada. However, haplotype H17 (Mahanadi) was observed to be clustered with two other L. rohita haplotypes. The haplotype median-joining network from sequences of the ATPase region is presented in Figure 3A. The haplotype network revealed that there were significant differences in distributions and frequencies and H5 was the most common and extensively distributed haplotype observed in the studied rivers. The most common haplotype H5 represents individuals from the rivers Ganga, Brahmaputra, Teesta, and Mahanadi, except from the river Narmada. The next common haplotypes are H4 and H6, which were present in the rivers Brahmaputra and Teesta. Some haplotypes were observed to be exclusive or river-specific, such as H1–H3 haplotypes found in the river Narmada, H7 in the river Ganga, H8–H12 in the river Brahmaputra, and H13–H17 in the river Mahanadi (Figure 3A; Supplementary Table 3).
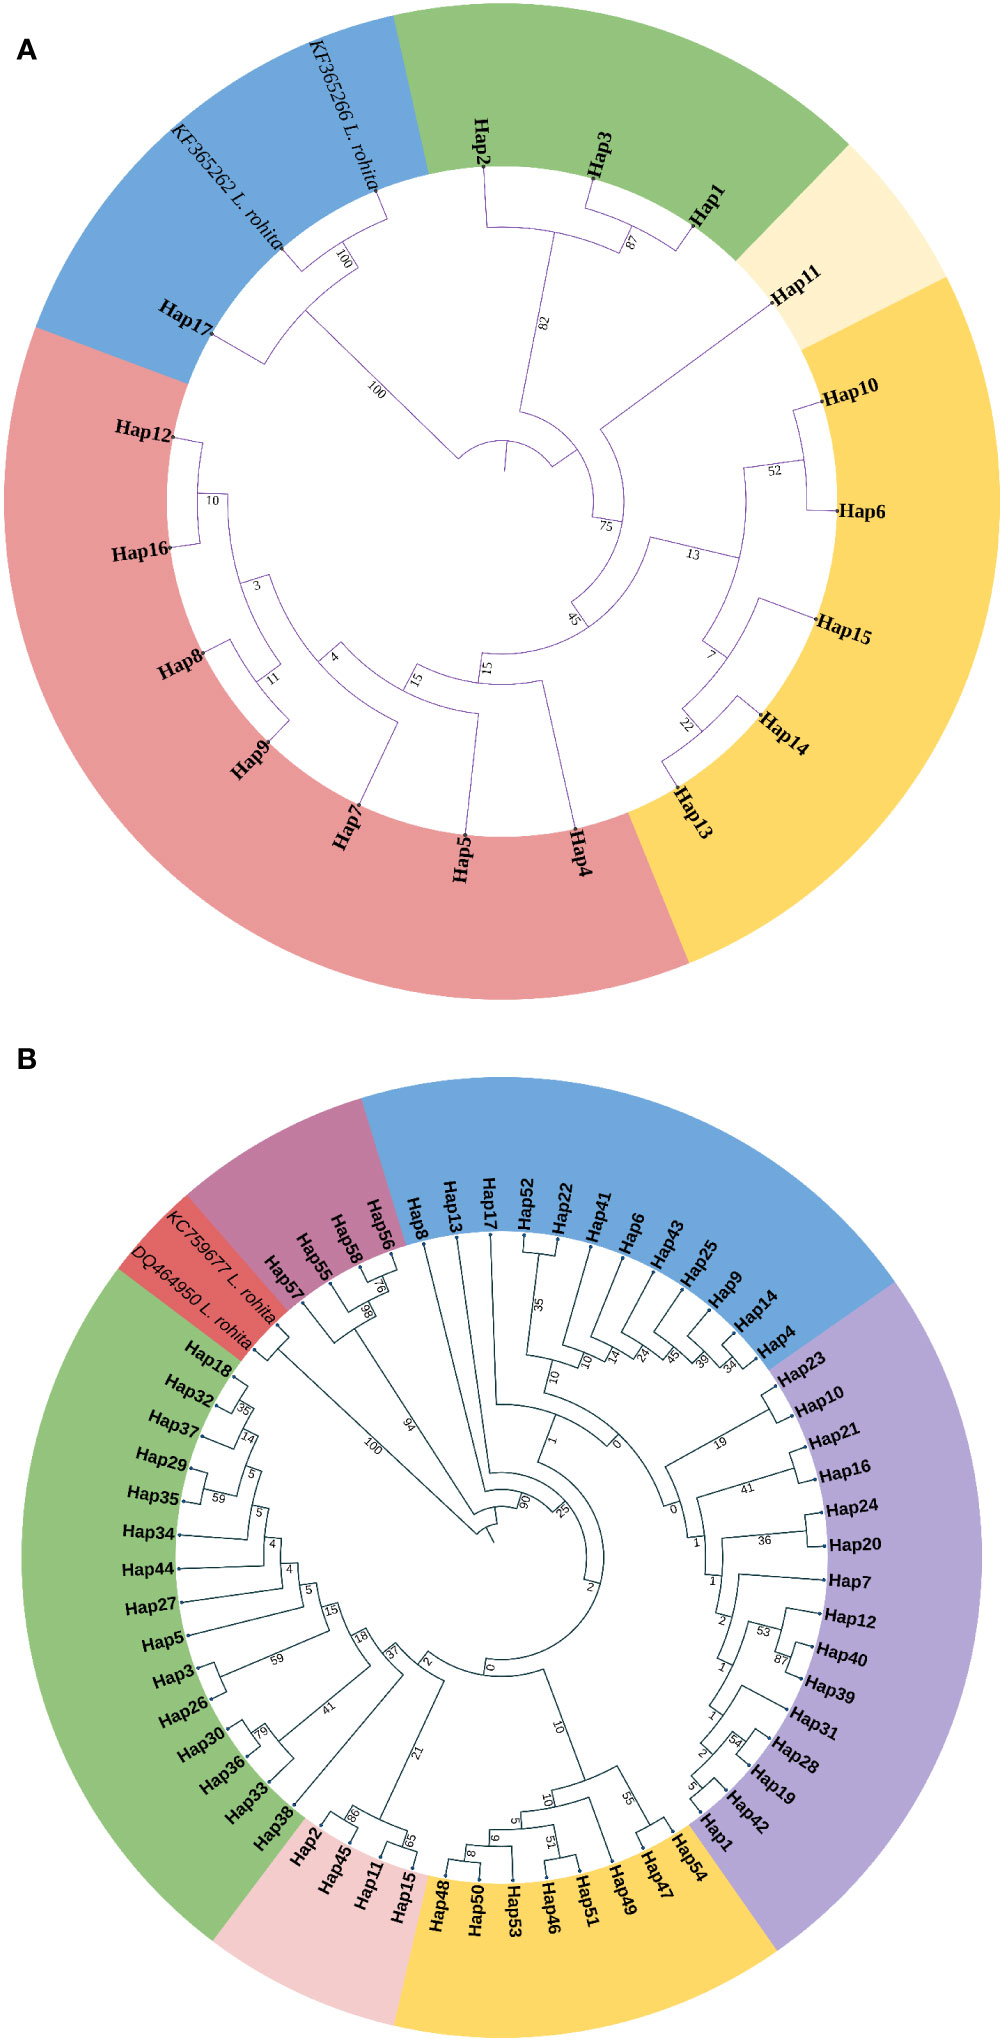
Figure 2 Phylogenetic tree of Labeo gonius by taking representatives of haplotypes of the (A) ATPase and (B) D-loop control regions. The sympatric species Labeo rohita is the outgroup here. The evolutionary history was inferred using the maximum likelihood method, and evolutionary distances were computed using the general time reversible method in MEGA11 software. The number at the nodes indicates bootstrap values based on 1,000 replications. The circular phylogenetic tree was better visualized using the iTOL software (https://itol.embl.de/), and different colors represent the clusters.
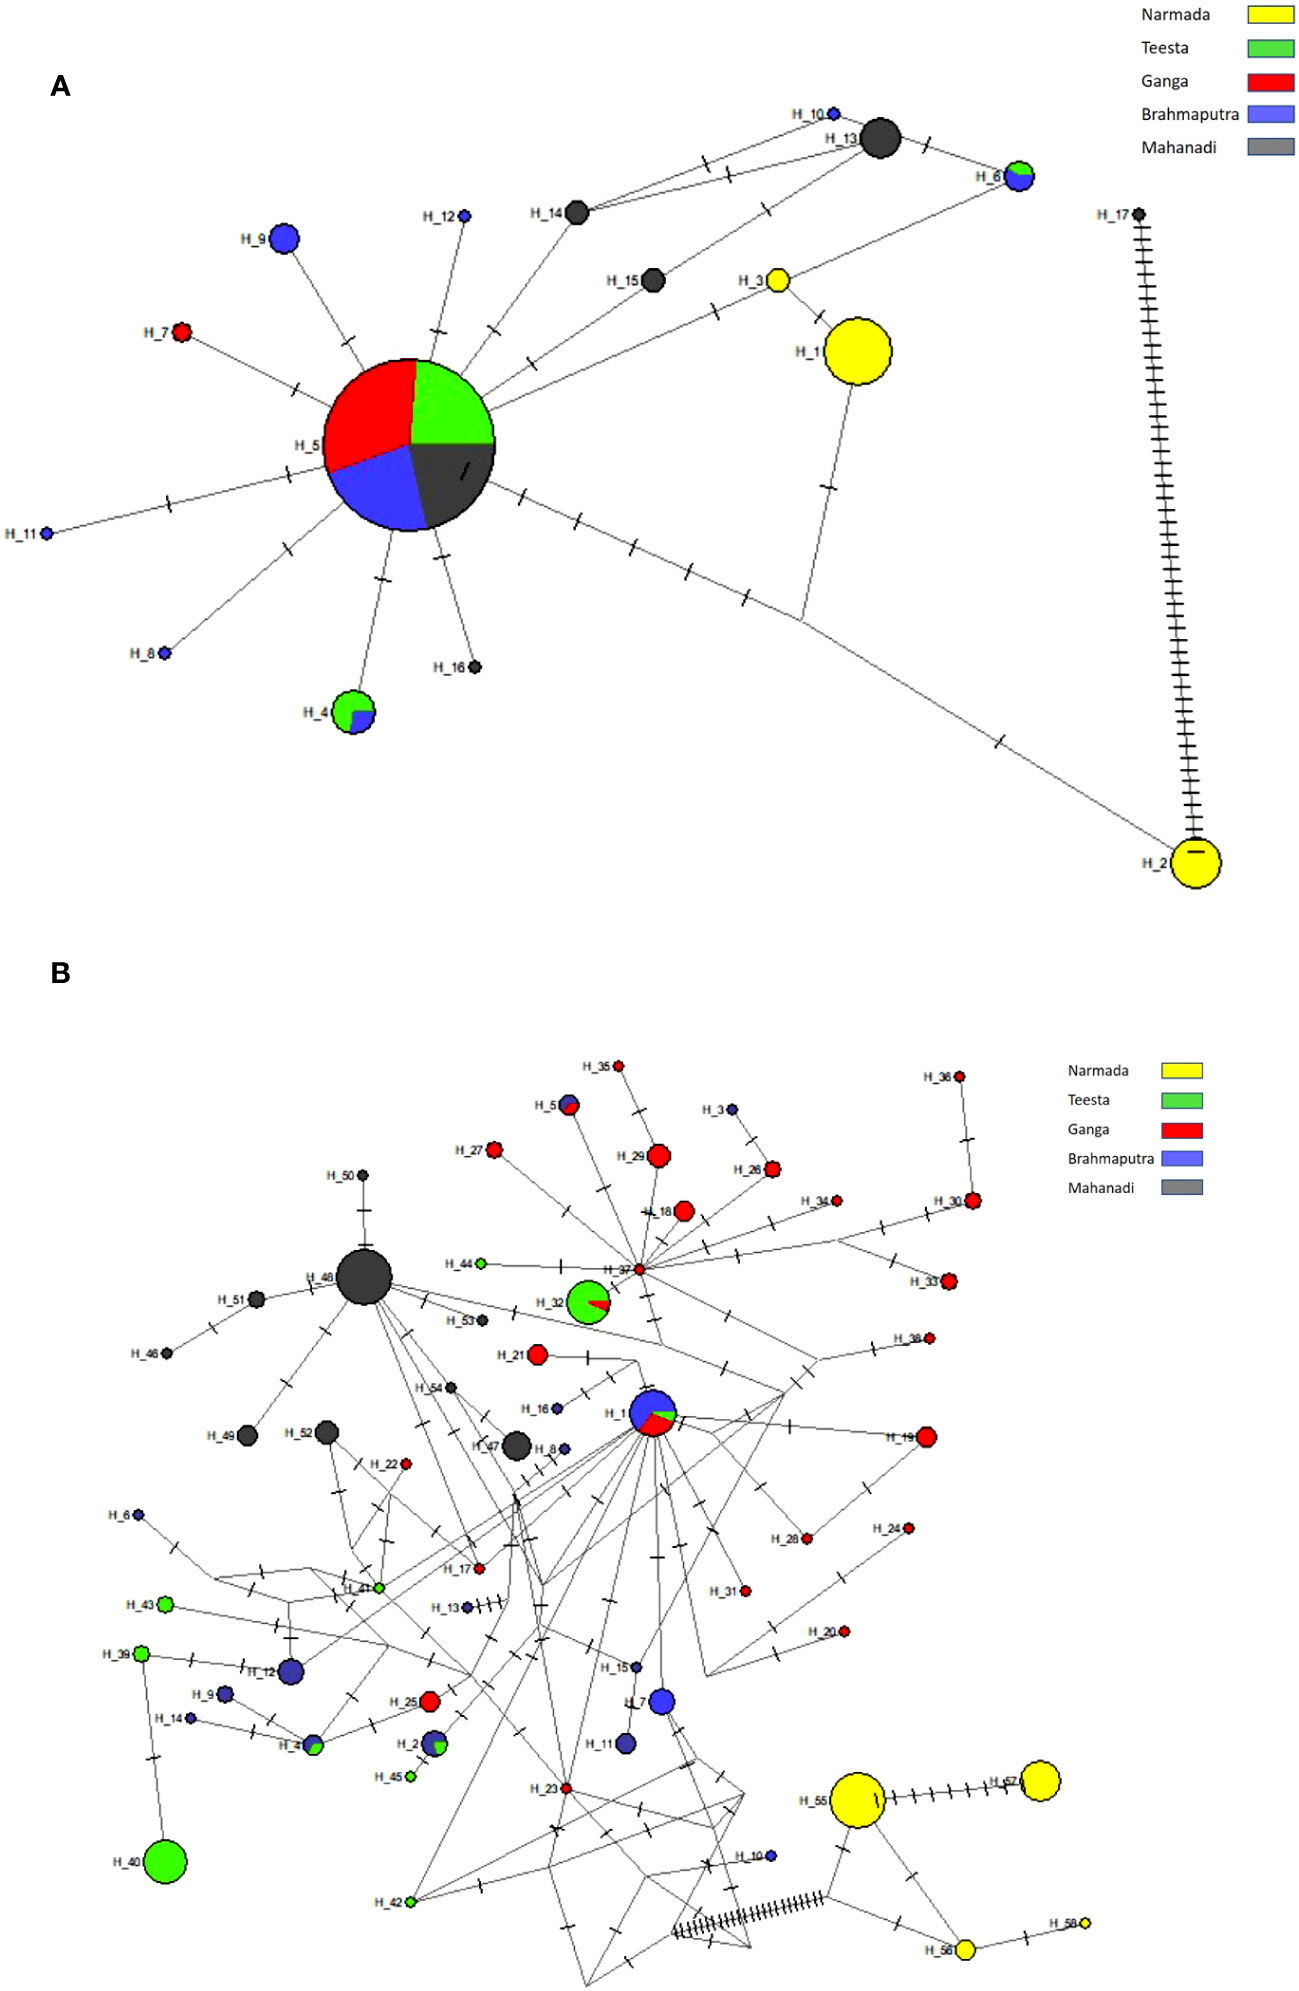
Figure 3 The median-joining network of Labeo gonius, based on haplotypes of the mtDNA (A) ATPase region and (B) D-loop region. Each circle represents a haplotype and circle size is proportional to the haplotype frequency. The colors indicate locality according to the legend, and hatch marks represent the number of mutations by which haplotypes differ.
D-loop region
The phylogenetic tree showed that haplotypes were clearly clustered into two principal branches. One principal clade was again subdivided into three subgroups, wherein one group is exclusive to the other two branches containing H55–H58 from the river Narmada; the second subgroup has haplotypes from Ganga, Brahmaputra, and Teesta; and the third subgroup has haplotypes from Brahmaputra, Ganga, and Teesta and only sharing one haplotype from Mahanadi. Another principal clade was subdivided into three more subgroups, where one subgroup has haplotypes from Brahmaputra and Teesta, the second subgroup has haplotypes only from Mahanadi, and the third subgroup has haplotypes from Ganga and Brahmaputra and one haplotype from Teesta. In addition, L. rohita haplotypes clustered together separately (Figure 2B; Supplementary Table 3).
The haplotype median-joining network from sequences of the D-loop region is presented in Figure 3B. The haplotype network showed that haplotypes were observed to be exclusive or river-specific: H1–H16 in the river Brahmaputra, H17–H38 in the river Ganga, H39–H45 in the river Teesta, H46–H54 in the river Mahanadi, and H55–H58 in the river Narmada (Figure 3B, Supplementary Table 3).
Discussion
The maintenance of genetic diversity is crucial for both an individual’s probability of survival and a population’s capacity for evolution (Sahoo et al., 2019). The population structure analysis and understanding of fish species genetic diversity can provide us with vital information and a scientific basis for developing conservation and management strategies for fish populations (Pallavi et al., 2012; Jayasankar, 2018). The goal of the present study was to generate information on genetic diversity, population structure, and evolutionary relationships of L. gonius within and among populations from the selected five major rivers of India based on the mitochondrial D-loop and ATPase 6/8 analysis (Paixão et al., 2018; Sahoo et al., 2020; Balasubramaniam et al., 2022). Since mitochondrial genes have a high rate of evolution, it allows for distinguishing between haplotypes in small sample sizes and threatened species (Habib et al., 2012; Das et al., 2024). The observed nucleotide frequencies of both the mtDNA D-loop and ATPase 6/8 regions were rich in A+T content (57.88%), which is in accordance with many other cyprinids and Labeo sp., e.g., L. fimbriatus (Swain et al., 2014), L. calbasu (Singh et al., 2016), L. rohita (Luhariya et al., 2012), and Chitala chitala (Mandal et al., 2012). The low percentage of GC content and the least representation of nucleotide G (12.50%) were reported in other fish species as well (Swain et al., 2014; Sahoo et al., 2019), and these might be due to anti-G bias, which is characteristic for the mitochondrial genome (Kathirvelpandian et al., 2014; Balasubramaniam et al., 2022). In the present study, the D-loop region generated 58 haplotypes, with the Ganga River population having the highest number of haplotypes (24) followed by the river Brahmaputra (16), whereas the ATPase 6/8 region generated 17 haplotypes, with the Brahmaputra River population having the most haplotypes (8). Furthermore, haplotype (Hd) and nucleotide diversity (π) were considered indicators of within-population genetic variation and higher genetic variation in the group which depicts higher genetic diversity (Zhao et al., 2006; Zhang et al., 2017; Zhang et al., 2020; Liu, 2017; Zhang et al., 2017; Fang et al., 2022). In the current study, an overall haplotype diversity of 0.954 was observed as revealed by the D-loop analysis with the highest haplotype diversity in the river Ganga (0.965), followed by the river Brahmaputra, and the lowest diversity was found in the river Narmada. In the ATPase 6/8 region, the highest haplotype diversity was observed in the river Mahanadi followed by Brahmaputra. Overall, moderate to high haplotype diversity was observed for all river populations (Zhang et al., 2017; Zhang et al., 2020; Das et al., 2024). Due to a high number of haplotypes, haplotype diversity, and polymorphic sites, the Ganga River population could be considered a highly divergent population. Nevertheless, low nucleotide diversity was detected in all of the studied river populations except for the river Mahanadi population. In parallel, the characteristic higher haplotype diversity rather than nucleotide diversity was also observed in other freshwater fish species (Luhariya et al., 2012; Mandal et al., 2012; Gupta et al., 2013; Dutta et al., 2020). Genetic diversity can be influenced by many factors such as anthropogenic activity and habitation. Low nucleotide diversity in a species shows the characteristic of rapid population expansion after a period of small effective population size. This suggests that rapid population growth increased the accumulation of mutations where expansion time was enough to accumulate haplotype diversity, but the expansion time was insufficient to increase nucleotide diversity (Behera et al., 2018a; Behera et al., 2018b; Sahoo et al., 2020; Das et al., 2024). The D-loop region has more haplotypes and nucleotide diversity than the ATPase region, and this could be explained by the fact that the D-loop region has a high mutational rate and is an evolving region than the ATPase region (Guo et al., 2014). The combined mitochondrial region analysis has proven to be very useful in delineating genetic diversity and differentiation in many fish species (Sharma et al., 2019; Sahoo et al., 2020).
In a relatively rapid evolving genome within a population, haplotype diversity will generally reach 1.0 as many individuals will tend to have unique haplotypes (Freeland et al., 2010). Furthermore, it needs special mention that the populations along the east coast, especially the Ganga, Brahmaputra, and Mahanadi river basin populations, are genetically more diverse than the other river populations as evidenced by the high haplotype and nucleotide diversity. The Ganga and Brahmaputra river populations might be carrying the original founder population of the parental population, and the Mahanadi population resides in habitats that are less exploited and less impacted by destructive human activities. This may potentially account for the higher genetic diversity of the Ganga–Brahmaputra and Mahanadi river basin populations. This also indicates that other river populations might have experienced a population bottleneck followed by a rapid population growth (Bowen et al., 2001; Meng et al., 2015). The mismatch distribution and neutral test analysis helps us to investigate demographic history (Guo et al., 2014; Lau et al., 2018). Tajima’s D value of low significance indicates that a population is deviating from the neutral expectations, and negative Fs values signify deviation from neutrality, which may be due to the effect of population expansion and/or selection. In the present study, Tajima’s D and Fu’s Fs values were found to be negative in the studied river populations; however, these were only significant in the Mahanadi population (for ATPase 6/8) and Ganga population (Fu’s Fs value, for D-loop). Negative and insignificant Fu’s Fs and Tajima’s D values indicate the presence of more rare nucleotide variants and haplotypes than what would be predicted from neutrality. Altogether, the high values of haplotype diversity, the low values of nucleotide diversity, and the negative values of Tajima’s D and Fu’s Fs imply a recent population expansion following a bottleneck or small effective population size.
Several evolutionary forces, which either act as locus-specific (selection and mutations) or at the genome-wide level (genetic drift and gene flow), influence the variation patterns of genomes and populations. The hierarchical AMOVA analysis for the D-loop region indicated that a high proportion of genetic variation was attributed to differences by among-population variation, i.e., 76.46% under gene pool-1 (considering all the stocks from Ganga, Brahmaputra, Teesta, Narmada, and Mahanadi as a single pool), and among populations within groups, 70.65% under gene pool-2 [where samples were grouped into two groups: group 1 (Himalayan rivers)—Ganga, Brahmaputra, and Teesta; and group 2 (peninsular rivers)—Narmada and Mahanadi]. Similar results were obtained in the ATPase 6/8 region analysis, where 70.22% of the variation among populations was found under gene pool-1 and 53.48% of the variation was found among populations within groups in gene pool-2 (Habib et al., 2012; Balasubramaniam et al., 2022). It has been reported that non-migratory fish species have higher variation among the populations and low variation within populations (Vrijenhoek, 1998). In the present study, within- and among-population variation is similar to that reported for non-migratory and freshwater fishes such as L. fimbriatus, C. catla, and Clarias magur (Swain et al., 2014; Behera et al., 2018b; Sahoo et al., 2020). Significant genetic differentiation (FST) was observed for the D-loop and ATPase 6/8 regions in both comparisons, with the highest FST value observed in gene pool-2 in comparison to gene pool-1, suggesting that there is a geographical structure between groups, and similar results were also reported from other freshwater fishes (Mohindra et al., 2012; Sahoo et al., 2020). Limited gene flow, widespread geographic distribution, and the occurrence of distinct haplotypes may all be contributing factors to the significant genetic differentiation (Behera et al., 2018a). Comparing populations of freshwater fish to estuary or marine fishes, freshwater fish typically show higher degrees of genetic differentiation among populations (Ward et al., 1994). Similarly, in terms of ecological traits and breeding practices, riverine populations differ considerably from populations that migrate frequently, forming a unique ecological group (Wagh and Ghate, 2003). The pairwise comparison of the genetic differentiation indexes of allele frequency FST results also supports the fact regarding the presence of greater genetic divergence between populations than within subspecies. There may be several factors such as geographic segregation, habitat differences, and migration which play significant roles in the genetic divergence of different fish populations. In the present study, genetic differentiation between populations determined by pairwise FST was moderate to high, which is perhaps attributed to high gene flow (Guo et al., 2014). Despite being from different river basins which are fragmented, the studied fish populations were observed to have moderate to high levels of genetic differentiation, which might indicate a common ancestry in the prehistoric period as observed in other cyprinid fishes (Singh et al., 2010, 2016). However, the low differentiation in the Ganga, Brahmaputra, and Teesta river populations might possibly be due to the ancestral proximity or some gene flow since flood plains of the Ganga River basin possibly serve as the source of dispersal of brood fishes and young ones across the tributaries.
Haplotype phylogeny may differ along the genome regions due to recombination and the process of swapping genome regions between haplotypes during the process of meiosis (Selle et al., 2021). Our aim was to find out haplotype effects by leveraging phylogenetic relationships between haplotypes. The haplotype networks helped us to predict the evolutionary relationship among unique haplotypes and the genealogical history of individuals. In the current study, the haplotype network based on the ATPase 6/8 analysis revealed that H5 is present in the majority of individuals, as evidenced by the median-joining network, which is positioned in the center of the network and has the most connecting nodes. It suggests that H5 is probably the ancestral haplotype from which all the other haplotypes might have originated directly or through subsequent mutations. H5 was shared among all the studied river populations of L. gonius (Ganga, Brahmaputra, Teesta, and Mahanadi except Narmada), suggesting a common ancestral origin and subsequent gene flow among these river populations (Das et al., 2018). Some haplotypes were observed to be exclusive or river-specific such as H1–H3 haplotypes observed in the river Narmada, H7 in the river Ganga, H8–H12 in the river Brahmaputra, and H13–H17 in the river Mahanadi. The unique and river-specific haplotypes of the river Narmada population may have arisen due to environmental changes or independent mutation events (Balasubramaniam et al., 2022). Haplotype median-joining network analysis from the D-loop region revealed that haplotypes are exclusively population-specific and not shared by other populations such as H1–H16 in the river Brahmaputra, H17–H38 in the river Ganga, H39–H45 in the river Teesta, H46–H54 in the river Mahanadi, and H55–H58 in the river Narmada. The prevalence of population-specific haplotypes may have evolved due to environmental changes at various sites through mutation or dispersal (Sahoo et al., 2019), as well as the absence of population admixture (Sharma et al., 2019), or independent mutation events (Das et al., 2024). These unique or private haplotypes could be used as a population-specific marker for stock identification. However, certain haplotypes, such as H25, are not closely related to the cluster formed by congeneric species in a haplotype network, implying probable genetic divergence and a distinct evolutionary history for the individual haplotype. The haplotype distribution in the phylogenetic tree based on both ATPase 6/8 and D-loop analyses showed that haplotypes from four river populations (Ganga, Brahmaputra, Teesta, and Mahanadi) did not cluster into distinct branches, but rather mixed clusters, with the exception of the Narmada population. This indicates that the phylogenetic tree did not show a clear relationship between geographic areas and haplotypes. It could potentially signify considerable genetic divergence in the L. gonius population. With respect to phylogeography, our results suggested that L. gonius population from the river Narmada has genetic divergence with other studied rivers, and this is in accordance with our previous findings in L. gonius using Cyt b analysis (Behera et al., 2018c). Moreover, the haplotype distribution patterns are based on the Indian geographical region, since the rivers Ganga, Brahmaputra, and Teesta that rise from the Himalayas and flow through eastern India are mostly clustered together. The west-flowing peninsular Narmada river population clustered separately from the other river populations. However, in the ATPase 6/8 analysis, H17 was clustered with an outgroup species, and one probable explanation is that H17 underwent a distinct mutational history. Nevertheless, the mitochondrial D-loop region generated more mutations and genetic variation than the ATPase region as reported in earlier studies (Mandal et al., 2012; Lau et al., 2018). Mutation rates in the D-loop and ATPase regions are different in different river populations; therefore, it is logical to analyze genetic diversity using multiple mitochondrial sequences. It is also suggested that the D-loop and ATPase mtDNA regions were effective markers for assessing population genetic diversity (Sivasundar et al., 2001; Divya et al., 2015; Paixão et al., 2018; Sahoo et al., 2020; Balasubramaniam et al., 2022; Fang et al., 2022).
In our previous study, L. gonius mitochondrial Cyt b gene analysis exhibited 12 haplotypes with 14 variables from four major Indian river populations (Ganga, Mahanadi, Brahmaputra, Narmada) and one hatchery population (Behera et al., 2018c). In the present study, the analysis of L. gonius population with the mitochondrial control region gene from five major Indian rivers revealed 17 haplotypes and 70 polymorphic sites for the ATPase 6/8 region and 58 haplotypes and 67 polymorphic sites for the D-loop region. So, the results clearly demonstrated that the present study on the mitochondrial control region generated more information on mutations and genetic variation. The nucleotide sequences of L. gonius were found to be AT-rich as revealed by all mtDNA Cyt b, ATPase 6/8, and D-loop analyses, which is evident in other freshwater fishes and Labeo species (Luhariya et al., 2012; Swain et al., 2016; Sahoo et al., 2020). The AMOVA results were also in accordance with the previous findings in Cyt b analysis (Behera et al., 2018c), which also showed significant genetic differentiation among populations. Because of the fragmented populations of fishes especially those that live in freshwater, high genetic differentiation is observed.
In conclusion, the present study demonstrated the utility of the D-loop and ATPase 6/8 regions of mtDNA as potential markers for studying the genetic diversity and population structure of L. gonius across major Indian rivers. More specifically, the D-loop region gives a better and more reliable indication for genetic differentiation. Furthermore, specific haplotypes found in the current study may be useful for differentiating the stocks. The current study rejected the null hypothesis that single panmictic populations of L. gonius are present in Indian river water. Moreover, L. gonius populations along the east coast especially in Himalayan rivers (Ganga, Brahmaputra, and Teesta river basin) are found to be genetically more diverse. However, the present study revealed that the Narmada population was found to be isolated and genetically divergent from other river populations. Lastly, the study represents a basic understanding of the genetic diversity and phylogeographic features of L. gonius, which provides a scientific foundation for the assessment of fisheries resources and the development of management strategies for conservation. The highly divergent Himalayan rivers—Ganga and Brahmaputra—can serve as conservation units. Furthermore, looking at the significance of L. gonius for aquaculture, the information produced may additionally be utilized in scientific planning to start a genetic improvement model that includes the stocks from all the sampled areas to form a synthetic population that can then serve as the foundation for long-term selection.
Data availability statement
The datasets presented in this study can be found in online repositories. The names of the repository/repositories and accession number(s) can be found in the article/Supplementary Material.
Author contributions
SR: Conceptualization, Data curation, Investigation, Software, Validation, Writing – original draft. BKB: Conceptualization, Funding acquisition, Project administration, Writing – review & editing. RVL: Data curation, Formal analysis, Investigation, Writing – review & editing. AR: Methodology, Software, Writing – review & editing. VK: Data curation, Writing – review & editing. PP: Methodology, Writing – review & editing. AK: Data curation, Writing – review & editing. PD: Methodology, Writing – review & editing. DK: Formal analysis, Writing – review & editing. DB: Data curation, Investigation, Writing – review & editing. AA: Formal analysis, Writing – review & editing. BKD: Funding acquisition, Validation, Visualization, Writing – review & editing. JJ: Funding acquisition, Visualization, Writing – review & editing.
Funding
The author(s) declare financial support was received for the research, authorship, and/or publication of this article. The financial assistance provided by the Indian Council of Agricultural Research (ICAR), New Delhi, India for carrying out this research work under the Fish Genetic Stock-Outreach activity (OR/ER/08/09/02) and institute fund sub-project 2 (FREM/20-23/17).
Acknowledgments
The authors are thankful to the Director, ICAR-Central Inland Fisheries Research Institute (ICAR-CIFRI) for the support. The authors are thankful to the technical assistants for the fish sample collection from different sites in India and acknowledge Ms. Tania for assisting in GIS map preparation.
Conflict of interest
The authors declare that the research was conducted in the absence of any commercial or financial relationships that could be construed as a potential conflict of interest.
The editor, TC, declared a past co-authorship with authors, SR, VK, BKB, and BKD.
Publisher’s note
All claims expressed in this article are solely those of the authors and do not necessarily represent those of their affiliated organizations, or those of the publisher, the editors and the reviewers. Any product that may be evaluated in this article, or claim that may be made by its manufacturer, is not guaranteed or endorsed by the publisher.
Supplementary material
The Supplementary Material for this article can be found online at: https://www.frontiersin.org/articles/10.3389/fmars.2024.1345649/full#supplementary-material
References
Balasubramaniam S., Soman M., Katneni V. K., Tomy S., Gopalapillay G., Vijayan K. K. (2022). Mitochondrial DNA based diversity studies reveal distinct and sub-structured populations of pearlspot, Etroplus suratensis (Bloch 1790) in Indian waters. J. Genet. 101, 3. doi: 10.1007/s12041-021-01341-y
Bandelt H. J., Forster P., Röhl A. (1999). Median-joining networks for inferring intraspecific phylogenies. Mol. Biol. Evol. 16, 37–48. doi: 10.1093/oxfordjournals.molbev.a026036
Behera B. K., Baisvar V. S., Kunal S. P., Meena D. K., Panda D., Pakrashi S., et al. (2018a). Population structure and genetic diversity of Indian Major Carp, Labeo rohita (Hamilton 1822) from three phylo-geographically isolated riverine ecosystems of India as revealed by mtDNA cytochrome b region sequences. Mitochondrial DNA Part A 29, 199–205. doi: 10.1080/24701394.2016.1267156
Behera B. K., Baisvar V. S., Rout A. K., Pakrashi S., Kumari K., Panda D., et al. (2018c). The population structure and genetic divergence of Labeo gonius (Hamilton 1822) analyzed through mitochondrial DNA cytochrome b gene for conservation in Indian waters. Mitochondrial DNA Part A 29, 543–551. doi: 10.1080/24701394.2017.1320992
Behera B. K., Das P., Singh N. S., Sahu A. K. (2009). Breeding and seed production of Labeo gonius (Hamilton) under captive condition in Manipur. J. Aquaculture 17, 1–6. doi: 10.61885/joa.v17.2009.15
Behera B. K., Kunal S. P., Baisvar V. S., Meena D. K., Panda D., Pakrashi S., et al. (2018b). Genetic variation in wild and hatchery population of Catla catla (Hamilton 1822) analyzed through mtDNA cytochrome b region. Mitochondrial DNA Part A 29, 126–131. doi: 10.1080/24701394.2016.1253072
Behera B. K., Kunal S. P., Paria P., Das P., Meena D. K., Pakrashi S., et al. (2015). Genetic differentiation in Indian Major Carp, Cirrhinus mrigala (Hamilton 1822) from Indian Rivers, as revealed by direct sequencing analysis of mitochondrial Cytochrome b region. Mitochondrial DNA 26, 334–336. doi: 10.3109/19401736.2015.1028048
Bowen B. W., Bass A. L., Rocha L. A., Grant W. S., Robertson D. R. (2001). Phylogeography of the trumpetfishes (Aulostomus): ring species complex on a global scale. Evolution 55, 1029–1039. doi: 10.1554/0014-3820(2001)055[1029:POTTAR]2.0.CO;2
Chaubey P. K., Mall R. K., Srivastava P. K. (2023). Changes in extremes rainfall events in present and future climate scenarios over the teesta river basin, India. Sustainability 15, 4668. doi: 10.3390/su15054668
Das B. K., Ray A., Johnson C., Verma S. K., Alam A., Baitha R., et al. (2023). The present status of ichthyofaunal diversity of river Ganga India: Synthesis of present v/s past. Acta Ecologica Sin. 43, 307–332. doi: 10.1016/j.chnaes.2021.10.008
Das G., Das S. P., Sahoo L., Swain S. K., Raghavendra C. H., Sahoo S. K., et al. (2024). High Genetic Differentiation and Genetic Diversity in Endangered Mahseer Tor khudree (Sykes 1839) as Revealed from Concatenated ATPase 6/8 and Cyt b Mitochondrial Genes. Biochem. Genet., 1–17. doi: 10.1007/s10528-023-10623-2
Das P., Saharan N., Pal A. K., Sahu N. P., Prakash C., Tiwari V. K. (2010). Labeo gonius (Hamilton 1822): A potential candidate species for diversification of Indian aquaculture. Aquaculture Europe 35, 13–16.
Das S. P., Swain S., Jena J., Das P. (2018). Genetic diversity and population structure of Cirrhinus mrigala revealed by mitochondrial ATPase 6 gene. Mitochondrial DNA Part A 29, 495–500. doi: 10.1080/24701394.2017.1310852
Divya P. R., Gopalakrishnan A., Basheer V. S., Swaminathan R., Mohitha C., Joy L., et al. (2015). Mitochondrial ATPase 6/8 genes to infer the population genetic structure of silver pomfret fish Pampus argenteus along the Indian waters. Mitochondrial DNA 26, 189–194. doi: 10.3109/19401736.2013.879655
Dutta N., Singh R. K., Pathak A., Mohindra V., Mandal S., Kaur G., et al. (2020). Mitochondrial DNA markers reveal genetic connectivity among populations of Osteoglossiform fish Chitala chitala. Mol. Biol. Rep. 47, 8579–8592. doi: 10.1007/s11033-020-05901-w
Excoffier L., Lischer H. E. (2010). Arlequin suite ver 3.5: a new series of programs to perform population genetics analyses under Linux and Windows. Mol. Ecol. Resour. 10, 564–567. doi: 10.1111/j.1755-0998.2010.02847.x
Fang D. A., Luo H., He M., Mao C., Kuang Z., Qi H., et al. (2022). Genetic diversity and population differentiation of naked carp (Gymnocypris przewalskii) Revealed by cytochrome oxidase subunit I and d-loop. Front. Ecol. Evol. 10, 827654. doi: 10.3389/fevo.2022.827654
Felsenstein J. (1985). Confidence limits on phylogenies: an approach using the bootstrap. evolution 39, 783–791. doi: 10.2307/2408678
Forcina G., Camacho-Sanchez M., Tuh F. Y., Moreno S., Leonard J. A. (2021). Markers for genetic change. Heliyon 7 (1). doi: 10.1016/j.heliyon.2020.e05583
Freeland J. R., Biss P., Conrad K. F., Silvertown J. (2010). Selection pressures have caused genome-wide population differentiation of Anthoxanthum odoratum despite the potential for high gene flow. J. evolutionary Biol. 23, 776–782. doi: 10.1111/j.1420-9101.2010.01947.x
Fu Y. X. (1997). Statistical tests of neutrality of mutations against population growth, hitchhiking and background selection. Genetics 147, 915–925. doi: 10.1093/genetics/147.2.915
Funk W. C., Forester B. R., Converse S. J., Darst C., Morey S. (2019). Improving conservation policy with genomics: a guide to integrating adaptive potential into US Endangered Species Act decisions for conservation practitioners and geneticists. Conserv. Genet. 20, 115–134. doi: 10.1007/s10592-018-1096-1
Gao T., Ying Y., Yang Q., Song N., Xiao Y. (2020). The mitochondrial markers provide new insights into the population demographic history of Coilia nasus with two ecotypes (anadromous and freshwater). Front. Mar. Sci. 7, 576161. doi: 10.3389/fmars.2020.576161
Gunjan P., Mishra S. K., Lohani A. K., Chandniha S. K. (2020). The study of morphological characteristics for best management practices over the Rampur watershed of Mahanadi River Basin using prioritization. J. Indian Soc. Remote Sens. 48, 35–45. doi: 10.1007/s12524-019-01061-y
Guo S. S., Zhang G. R., Guo X. Z., Wei K. J., Yang R. B., Wei Q. W. (2014). Genetic diversity and population structure of Schizopygopsis younghusbandi Regan in the Yarlung Tsangpo River inferred from mitochondrial DNA sequence analysis. Biochem. Systematics Ecol. 57, 141–151. doi: 10.1016/j.bse.2014.07.026
Gupta A., Lal K. K., Punia P., Singh R. K., Mohindra V., Sah R. S., et al. (2013). Characterization of polymorphic microsatellite markers and genetic diversity in wild bronze featherback, Notopterus notopterus (Pallas 1769). Mol. Biol. Rep. 40, 6625–6631. doi: 10.1007/s11033-013-2776-z
Habib M., Lakra W. S., Mohindra V., Lal K. K., Punia P., Singh R. K., et al. (2012). Assessment of ATPase 8 and ATPase 6 mtDNA sequences in genetic diversity studies of Channa marulius (Channidae: Perciformes). Proc. Natl. Acad. Sciences India Section B: Biol. Sci. 82, 497–501. doi: 10.1007/s40011-012-0061-x
Hamilton F. (1822). “An account of the fishes found in the river Gangas and its branches”, Edinburgh 292, 387.
Harpending H. C. (1994). Signature of ancient population growth in a low-resolution mitochondrial DNA mismatch distribution. Hum. Biol. 66 (4), 591–600.
He W., Dong Z., Ma T., Yan H., Chen Z., Yao W., et al. (2022). Three mitochondrial markers reveal genetic diversity and structure of rock carp (Procypris rabaudi) endemic to the upper yangtze: implications for pre-release genetic assessment. Front. Mar. Sci. 9, 939745. doi: 10.3389/fmars.2022.939745
Jayasankar P. (2018). Present status of freshwater aquaculture in India-A review. Indian J. Fisheries 65, 157–165. doi: 10.21077/ijf.2018.65.4.81300-20
Jiang B., Fu J., Dong Z., Fang M., Zhu W., Wang L. (2019). Maternal ancestry analyses of red tilapia strains based on D-loop sequences of seven tilapia populations. PeerJ 7, e7007. doi: 10.7717/peerj.7007
Jin L., Whitehead P. G., Rodda H., Macadam I., Sarkar S. (2018). Simulating climate change and socio-economic change impacts on flows and water quality in the Mahanadi River system, India. Sci. Total Environ. 637, 907–917. doi: 10.1016/j.scitotenv.2018.04.349
Kathirvelpandian A., Gopalakrishnan A., Lakra W. S., Krishna G., Sharma R., Divya P. R., et al. (2014). Mitochondrial ATPase 6/8 genes reveal genetic divergence in the Coilia dussumieri (Valenciennes 1848) populations of north east and northwest coasts of India. Mol. Biol. Rep. 41, 3723–3731. doi: 10.1007/s11033-014-3237-z
Lau J. S., Ransangan J., Rodrigues K. F. (2018). Genetic diversity and population structure of the asian green mussel (Perna viridis) in the waters of sabah, MalaysiaBased on mitochondrial DNA D-loop sequences. Turkish J. Fisheries Aquat. Sci. 18, 109–117. doi: 10.4194/1303-2712-v18_1_12
Liu B. H. (2017). Statistical genomics: linkage, mapping, and QTL analysis (CRC press). doi: 10.1201/9780203738658
Luhariya R. K., Lal K. K., Singh R. K., Mohindra V., Punia P., Chauhan U. K., et al. (2012). Genetic divergence in wild population of Labeo rohita (Hamilton 1822) from nine Indian rivers, analyzed through MtDNA cytochrome b region. Mol. Biol. Rep. 39, 3659–3665. doi: 10.1007/s11033-011-1140-4
Mandal A., Mohindra V., Singh R. K., Punia P., Singh A. K., Lal K. K. (2012). Mitochondrial DNA variation in natural populations of endangered Indian Feather-Back Fish, Chitala chitala. Mol. Biol. Rep. 39, 1765–1775. doi: 10.1007/s11033-011-0917-9
Meng W., Yang T., Hai S., Ma Y., Cai L., Ma X., et al. (2015). Extensive genetic divergence among Diptychus maculatus populations in northwest China. Chin. J. Oceanology Limnology 33, 577–584. doi: 10.1007/s00343-015-4137-3
Mogalekar H. S., Canciyal J., Ansar C. P., Bhakta D., Biswas I., Kumar D. (2017). Freshwater fish diversity of West Bengal, India. J. Entomology Zoology Stud. 5, 37–45.
Mohanta K. N., Subramanian S., Komarpant N., Saurabh S. (2008). Alternate carp species for diversification in freshwater aquaculture in India. Aquaculture Asia 13, 11.
Mohindra V., Singh A., Patangia R., Tripathi. R. K., Singh R. K., Sah R. S., et al. (2012). Characterization of 27 novel gene-associated SSR markers in Indian catfish, Clarias batrachus (Linnaeus 1758) and their application in genetic diversity analysis. Mol. Ecol. Resour. 12, 1196–1197. https://krishi.icar.gov.in/jspui/handle/123456789/4799.
Paixão R. V., Ribolli J., Zaniboni-Filho E. (2018). Genetic variation of the endangered neotropical catfish Steindachneridion scriptum (Siluriformes: Pimelodidae). Front. Genet. 9, 48. doi: 10.3389/fgene.2018.00048
Pallavi, Goswami M., Nautiyal P., Malakar A. K., Nagpure N. S. (2012). Genetic divergence and molecular phylogenetics of Puntius spp. based on the mitochondrial cytochrome b gene. Mitochondrial DNA 23, 477–483. doi: 10.3109/19401736.2012.710209
Peñuelas J., Sardans J., Estiarte M., Ogaya R., Carnicer J., Coll M., et al. (2013). Evidence of current impact of climate change on life: a walk from genes to the biosphere. Global Change Biol. 19, pp.2303–2338. doi: 10.1111/gcb.12143
Richards K., Brammer H., L Saunders P. (2021). The historical avulsion of the Tista River, and its relationship to the Brahmaputra: Map and archive evidence from 1750 to 1835. Geographical J. 187, 253–268. doi: 10.1111/geoj.12391
Rozas J., Ferrer-Mata A., Sánchez-DelBarrio J. C., Guirao-Rico S., Librado P., Ramos-Onsins S. E., et al. (2017). DnaSP 6: DNA sequence polymorphism analysis of large data sets. Mol. Biol. Evol. 34, 3299–3302. doi: 10.1093/molbev/msx248
Sahoo L., Barat A., Sahoo S. K., Sahoo B., Das G., Das P., et al. (2020). Genetic diversity and population structure of endangered Indian catfish, Clarias magur as revealed by mtDNA D-loop marker. Turkish J. Fisheries Aquat. Sci. 21, 09–18. doi: 10.4194/1303-2712
Sahoo L., Mohanty M., Meher P. K., Murmu K., Sundaray J. K., Das P. (2019). Population structure and genetic diversity of hatchery stocks as revealed by combined mtDNA fragment sequences in Indian major carp, Catla catla. Mitochondrial DNA Part A 30(2), 289–295. doi: 10.1080/24701394.2018.1484120
Sarkar U. K., Pathak A. K., Sinha R. K., Sivakumar K., Pandian A. K., Pandey A., et al. (2012). Freshwater fish biodiversity in the River Ganga (India): changing pattern, threats and conservation perspectives. Rev. Fish Biol. Fisheries 22, 251–272. doi: 10.1007/s11160-011-9218-6
Sati J., Kumar R., Sahoo P. K., Patiyal R. S., Ali S., Barat A. (2015). Genetic characterization of Golden mahseer (Tor putitora) populations using mitochondrial DNA markers. Mitochondrial DNA 26, 68–74. doi: 10.3109/19401736.2013.823170
Satoh T. P., Miya M., Mabuchi K., Nishida M. (2016). Structure and variation of the mitochondrial genome of fishes. BMC Genomics 17, 1–20. doi: 10.1186/s12864-016-3054-y
Scheffers B. R., De Meester L., Bridge T. C., Hoffmann A. A., Pandolfi J. M., Corlett R. T., et al. (2016). The broad footprint of climate change from genes to biomes to people. Science 354, paaf7671. doi: 10.1126/science.aaf7671
Selle M. L., Steinsland I., Lindgren F., Brajkovic V., Cubric-Curik V., Gorjanc G. (2021). Hierarchical modelling of haplotype effects on a phylogeny. Front. Genet. 11, 531218. doi: 10.3389/fgene.2020.531218
Sharma L., Ali S., Barat A., Kumar R., Pande V., Laskar M. A., et al. (2019). Molecular identification and genetic diversity analysis of Chocolate mahseer (Neolissochilus hexagonolepis) populations of Northeast India, using mitochondrial DNA markers. Mitochondrial DNA Part A 30, 397–406. doi: 10.1080/24701394.2018.1526929
Singh R. K., Lal K. K., Mohindra V., Punia P., Sah R. S., Mishra A. K., et al. (2010). Assessing genetic differentiation in geographic populations of Labeo calbasu using allozyme markers. Biochem. Genet. 48, 760–778. doi: 10.1007/s10528-010-9358-8
Singh R. K., Lal K. K., Mohindra V., Sah R. S., Kumar R., Jena J. K. (2016). Characterization of mitochondrial ATPase 6/8 genes in wild Labeo calbasu (Hamilton 1822) and mapping of natural genetic diversity. Mitochondrial DNA Part A 27, 3078–3081. doi: 10.3109/19401736.2014.1003917
Sivasundar A., Bermingham E., Ortí G. (2001). Population structure and biogeography of migratory freshwater fishes (Prochilodus: Characiformes) in major South American rivers. Mol. Ecol. 10, 407–417. doi: 10.1046/j.1365-294X.2001.01194.x
Swain S. K., Bej D., Das S. P., Sahoo L., Jayasankar P., Das P. C., et al. (2016). Genetic variation in Labeo fimbriatus (Cypriniformes: Cyprinidae) populations as revealed by partial cytochrome b sequences of mitochondrial DNA. Mitochondrial DNA Part A 27, 1–1990. doi: 10.3109/19401736.2014.971315
Tajima F. (1989). Statistical method for testing the neutral mutation hypothesis by DNA polymorphism. Genetics 123, 585–595. doi: 10.1093/genetics/123.3.585
Talwar P. K., Jhingran A. G. (1991). Inland fishes of India and adjacent countries (Vol. 2) (CRC press), 560–561.
Tamura K., Stecher G., Kumar S. (2021). MEGA11: molecular evolutionary genetics analysis version 11. Mol. Biol. Evol. 38, 3022–3027. doi: 10.1093/molbev/msab120
Vrijenhoek R. C. (1998). Conservation genetics of freshwater fish. J. fish Biol. 53, 394–412. doi: 10.1111/j.1095-8649.1998.tb01039.x
Wagh G. K., Ghate H. V. (2003). Freshwater fish fauna of the rivers Mula and Mutha, Pune, Maharashtra. Zoos’ Print J. 18, 977–981. doi: 10.11609/JoTT
Ward R. D., Woodwark M., Skibinski D. O. F. (1994). A comparison of genetic diversity levels in marine, freshwater, and anadromous fishes. J. fish Biol. 44, 213–232. doi: 10.1111/j.1095-8649.1994.tb01200.x
Weitemier K., Penaluna B. E., Hauck L. L., Longway L. J., Garcia T., Cronn R. (2021). Estimating the genetic diversity of Pacific salmon and trout using multigene eDNA metabarcoding. Mol. Ecol. 30, 4970–4990. doi: 10.1111/mec.15811
Xie Z. Y., Du J. Z., Chen X. Q., Wang Y. X., Murray B. W. (2006). The significance of mitochondria control region (D-Loop) in intraspecific genetic differentiation of fish. Yi Chuan= Hereditas 28, 362–368.
Zhang J. J., Duan J. R., Zhou Y. F., Peng J. Y., Fang D. A. (2017). Genetic diversity of mitochondrial control region (D-loop) polymorphisms in Coilia ectenes taihuensis inhabiting Taihu Lake, China. Genet. Mol. Res. 16, gmr16019457. doi: 10.4238/gmr16019457
Zhang Q., Sun C., Zhu Y. (2020). Genetic diversity and structure of the round-tailed paradise fish (Macropodus ocellatus): Implications for population management. Glob Ecol. Conserv. 21, e00876. doi: 10.1016/j.gecco.2019.e00876
Zhao Z., Yu N., Fu Y. X., Li W. H. (2006). Nucleotide variation and haplotype diversity in a 10-kb noncoding region in three continental human populations. Genetics 174, 399–409. doi: 10.1534/genetics.106.060301
Keywords: genetic diversity, Labeo gonius, ATPase, D-loop, Indian rivers
Citation: Roy S, Behera BK, V. L. R, Rout AK, Kumar V, Parida PK, Jana AK, Das P, Meena DK, Bhakta D, Alam A, Das BK and Jena J (2024) Genetic characterization of minor carp (Labeo gonius) from Indian rivers revealed through mitochondrial ATPase 6/8 and D-loop region analysis: implications for conservation and management. Front. Mar. Sci. 11:1345649. doi: 10.3389/fmars.2024.1345649
Received: 28 November 2023; Accepted: 20 February 2024;
Published: 12 March 2024.
Edited by:
Tapas Chakraborty, Kyushu University, JapanReviewed by:
Shaharior Hashem, Bangladesh Agricultural University, BangladeshAparna Chaudhari, Central Institute of Fisheries Education (ICAR), India
Copyright © 2024 Roy, Behera, V. L., Rout, Kumar, Parida, Jana, Das, Meena, Bhakta, Alam, Das and Jena. This is an open-access article distributed under the terms of the Creative Commons Attribution License (CC BY). The use, distribution or reproduction in other forums is permitted, provided the original author(s) and the copyright owner(s) are credited and that the original publication in this journal is cited, in accordance with accepted academic practice. No use, distribution or reproduction is permitted which does not comply with these terms.
*Correspondence: Bijay Kumar Behera, YmlqYXkuYmVoZXJhQGljYXIuZ292Lmlu; Basanta Kumar Das, YmFzYW50YS5kYXNAaWNhci5nb3YuaW4=
†These authors have contributed equally to this work