 Brijonnay C. Madrigal
 Anke Kügler
 Eden J. Zang
 Marc O. Lammers
 Leila T. Hatch
 Aude F. Pacini
95% of researchers rate our articles as excellent or good
Learn more about the work of our research integrity team to safeguard the quality of each article we publish.
Find out more
ORIGINAL RESEARCH article
Front. Mar. Sci. , 06 March 2024
Sec. Ocean Observation
Volume 11 - 2024 | https://doi.org/10.3389/fmars.2024.1342454
Passive acoustic monitoring is an effective technique for long-term monitoring of the soundscape in marine protected areas. Ocean noise is a key concern for the U.S. Office of National Marine Sanctuaries and has been identified as a research priority. The Sanctuary Soundscape Monitoring Project (“SanctSound”) was implemented to support efforts to address ocean noise across seven U.S. sanctuaries using a comprehensive and standardized approach. In this study, acoustic recordings were collected in the Hawaiian Islands Humpback Whale National Marine Sanctuary during the humpback whale seasons (November-May) from 2018-2022. Data encompassed 14 deployments across four sites in the main Hawaiian Islands: Hawaiʻi, Maui, O’ahu, and Kauaʻi. The soundscape was dominated by biological sources, most prominently the seasonal detection of humpback whale song. Third octave level monthly medians ranged from 70.4-105 dB re 1 µPa across sites with distinct peaks from January to April particularly at both Hawaiʻi and Maui sites. Overall, we reported relatively low vessel detection rates, with Maui having the highest daily average of vessel detections (x = 19.16). No COVID-19 impact could be observed acoustically using soundscape metrics which was likely due to the dominance of humpback whale chorusing. However, vessel detections and AIS data revealed a reduction in vessel activity after the onset of the pandemic at the Maui and Hawaiʻi sites. This study demonstrates that standardized metrics are a useful tool for obtaining long-term, baseline soundscape levels to understand the various contributions to the underwater soundscape and potential changes within marine protected areas in Hawaiʻi.
The underwater soundscape is a dynamic environment composed of biological, geophysical, and anthropogenic sound sources (Pijanowski et al., 2011). Anthropogenic noise has been shown to elicit behavioral, acoustic, and physiological responses in marine mammals, fish, and coral reef communities, which can impede vital functions such as foraging, mating/spawning, and communication (Lyamin et al., 2011; Parks et al., 2011; Rolland et al., 2012; Goldbogen et al., 2013; Nedelec et al., 2017; Popper and Hawkins, 2019; Ferrier-Pagès et al., 2021). Due to the potential detrimental effects on marine life, anthropogenic noise has been acknowledged as a major issue on an international scale (EU, 2008; United Nations General Assembly, 2017). Due to ongoing concerns about ocean noise in U.S. waters and the potential effects on marine species, the US National Oceanic and Atmospheric Administration (NOAA) developed an Ocean Noise Strategy (Strategy) to address ocean noise through 2026 (Gedamke et al., 2016). This guidance provided an agency-wide, comprehensive framework for integrating efforts across multiple line offices and formulated recommendations for approaching noise monitoring and mitigation efforts. The Strategy identified passive acoustic monitoring (PAM) as an effective technique for holistically understanding the underwater soundscape in key management areas (Hatch et al., 2016). A key component of the Strategy was to implement a monitoring effort focused on marine protected areas (MPAs) aligned with key NOAA goals for addressing the protection of species and habitat (Gedamke et al., 2016).
PAM has been used to study MPAs globally to monitor the habitat use of endangered species (Rayment et al., 2009; Mussoline et al., 2012; Gridley et al., 2020), improve surveillance efforts to assess compliance (Kline et al., 2020) and monitor anthropogenic activity (Casale et al., 2016) to promote conservation, maintain healthy ecosystems, and mitigate human impact. Soundscape analysis has allowed international managers to establish baseline sound levels, detect temporal patterns, quantify vessel presence, and identify biological sources to monitor biodiversity (Buscaino et al., 2016; Sanchez-Gendriz and Padovese, 2016; Haver et al., 2018; Picciulin et al., 2019; Prawirasasra et al., 2021). The Sanctuary Soundscape Monitoring Project (“SanctSound”) established a system-wide PAM effort across seven national marine sanctuaries and one marine national monument: Stellwagen Bank, Gray’s Reef, Florida Keys, Olympic Coast, Monterey Bay, Channel Islands, Papahānaumokuākea Marine National Monument (PMNM), and Hawaiian Islands Humpback Whale (HIHWNMS). Moored acoustic recorders were deployed at 30 locations1 across the eight sites from 2018-2022 with the goal of near continuous data collection during that period, except for HIHWNMS where data were only collected during the winter season when humpback whales (Megaptera novaeangliae) are present between December and May. The primary objective of SanctSound was to implement a uniform approach to data collection and analysis to produce standardized data products that could be used to evaluate the soundscape and make system-wide comparisons of spatial, spectral, and temporal variability in ambient underwater sound levels. Recently published soundscape studies in and around HIHWNMS and PMNM have provided valuable insights into humpback whale abundance trends (Kügler et al., 2020, 2021; Merkens et al., 2021; Lammers et al., 2023a) and patterns in archipelago-wide distribution (Lammers et al., 2023a). Thus, soundscape monitoring in the Hawaiian Islands provides managers with valuable insight into the soundscape at this remote location in the Central Pacific.
HIHWNMS was designated in 1992 to protect the North Pacific humpback whale population that migrates to Hawaiʻi each winter, and humpback whale habitat including the breeding and calving ground (ONMS, 2020a). HIHWNMS supports approximately 50% of the total North Pacific population (Calambokidis et al., 2008). The sanctuary boundaries include five non-contiguous areas that encompass ~3.626 x 10⁹ m2 of habitat within the main Hawaiian Islands (Figure 1), specifically designated to target regions of high whale density (ONMS, 2010a). The sanctuary includes shallow (<183 m depth), fringed reef habitat (ONMS, 2010a). HIHWNMS is unique within the U.S. sanctuary system as it is the only single-species sanctuary, one of the few non-contiguous sanctuaries, and is co-managed through a NOAA-State Cooperative partnership between the NOAA ONMS and the Hawaiʻi Department of Land and Natural Resources (ONMS, 2020a). Unlike Monterey Bay, Gulf of Farallones and Stellwagen Bank National Marine Sanctuary where major shipping traffic lanes traverse the sanctuary, there are no commercial ports and small boat harbors within HIHWNMS boundaries (ONMS, 2009; ONMS, 2010b; ONMS, 2020b).
Figure 1 Geographic locations of the four SanctSound sites. The non-contiguous Hawaiian Islands Humpback Whale National Marine Sanctuary (HIHWNMS) waters are indicated by the hatched area.
The 2020-2021 coronavirus (COVID-19) pandemic led to global shutdowns and travel restrictions on the public’s movement described as the “anthropause,” which resulted in a reduction in marine traffic on a global scale (March et al., 2021). The onset of the COVID-19 pandemic in March 2020 led to state-wide action in Hawaiʻi. As an isolated island chain in the middle of the Pacific, the State of Hawaiʻi implemented the most severe restrictions in the nation to mitigate transmission rates state-wide by enforcing strict stay-at-home orders beginning on 23 March 2020. The State of Hawaiʻi implemented a 14-day mandatory quarantine period on 26 March 2020 for all travelers arriving into the state, which significantly decreased the number of visitors to the islands. Pre-pandemic, 10,386,673 visitors traveled to Hawaiʻi in 2019, which declined to 2,708,258 visitors (a 74% decrease) in 2020 (State of Hawaiʻi DBEDT, 2022). The State of Hawaiʻi is supported by a blue economy dominated by the marine cargo industry (State of Hawaiʻi DBEDT, 2019), pelagic longline fishery, alongside charter and recreational fishing (Kalberg and Pan, 2016; Rollins and Lovell, 2019) and ecotourism. Hawaiʻi has a prominent whale watch industry that attracts many visitors and continues to increase in economic impact (Barr et al., 2000; NOAA, 2017; Wiener et al., 2020). Given these various vessel types on the water and the strong influence of the tourism industry on vessel presence, COVID-19 may have influenced vessel traffic patterns during the pandemic.
This study leverages SanctSound datasets to compare the soundscape in four different regions of HIHWNMS representing the four main Hawaiian Islands of Hawaiʻi, Oʻahu, Maui, and Kauaʻi. Multi-year trends in the soundscape during the humpback whale season (Nov-May) are described and sound levels compared. To assess the influences of COVID-19 on the soundscape, we compared acoustic vessel detections at each site, and automatic tracking system (AIS) data, to provide information on changes in vessel traffic trends during COVID-19. By considering the potential effects of the COVID-19 pandemic on the underwater soundscape, we can determine if soundscape metric analysis can aid managers in detecting changes of importance for MPA management. The SanctSound data provides a unique opportunity to understand how ambient noise varies spatially and temporally to support strategic management.
As part of the SanctSound project, SoundTrap 500 STD (Ocean Instruments, Auckland, New Zealand) recorders were deployed during the winter and spring months of 2018-2022 at four sites within HIHWNMS: Hawaiʻi (HI06), Oʻahu (HI03), Maui (HI01), and Kauaʻi (HI04) (Figure 1). Recorders were suspended five meters off the seafloor from a mooring at depths ranging from 52 to 90 meters (Figure 2; Supplementary Table 1). SoundTraps recorded on a continuous duty cycle at a sampling rate of 48 kHz (16-bit). Deployments spanned from November to July (deployment dependent) to encompass the humpback whale migration season (Figure 3). Instrumentation failure resulted in some deployments not successfully recording for the full duration of the deployment or data integrity issues caused the data to be compromised. SoundTrap 500 contained detachable hydrophones. Recorder gain was -1.8 or -1.9 dB and hydrophone sensitivity ranged between -176 to -179.5 dB re 1 µPa/v (hydrophone dependent) with a flat frequency response (3 dB) from 20 Hz to 60kHz. Recordings (.wav files) were downloaded using the SoundTrap host software2.
Figure 2 Example of a hydrophone mooring deployed within the HIHWNMS. SoundTrap ST500 recorders were suspended 3m off the seafloor. A sub-surface float maintained vertical placement in the water column. An acoustic release was used to retrieve recorders. (Photograph: HIHWNMS, Marc Lammers).
Figure 3 Distribution of SanctSound data from 2018-2022 used in this study. Periods when data is available are depicted in black. Grey represents when the SoundTraps were deployed but data was not being recorded due to an intentional delayed recording start time or battery depletion at the end of the deployments. Pink denotes periods when the recorder either failed to record or the data was compromised during that period and was deemed unusable for analysis. Note: the primary goal of these deployments was to record in the HIHWNMS during humpback whale season (November to May; green).
Long Term Spectral Average (LTSA) plots were generated using the MATLAB (Mathworks, Natick, MA, USA) software package Triton3 (Scripps Institution of Oceanography, UC San Diego). Sound level metrics were calculated using the Triton Remora (a user-developed MATLAB software routine) Soundscape Metrics. Soundscape LTSAs were generated for 1 Hz frequency bin size and 1 s time increments over a 3-day period (length of LTSA). A bandpass filter of 20-24000 Hz was applied to calculate soundscape metrics. Power Spectral Density (PSD, units = dB re 1 µPa2/Hz) and One-Third Band Octave Sound Pressure Levels (TOL, units = dB re 1 µPa) were two SanctSound metrics included in this analysis. PSD values were calculated using Welch’s method in MATLAB as the median of the mean square pressure amplitude every hour. Hourly TOLs were calculated as the integration of the PSD of mean square pressure over 1/3 octave bands with nominal center frequencies in bins from 25-20000 Hz. A range of TOL were used to represent a diverse set of frequencies to potentially capture typical shipping levels (63 Hz and 125 Hz), humpback whales (500 Hz), and toothed whales (6300 Hz and 12500 Hz). The data were calibrated by calculating the sum of the individual SoundTrap sensitivity and hydrophone sensitivity (provided by Ocean Instruments) that corresponded to each instrument to derive the system sensitivity (dB) applied to soundscape metric values. The date of the COVID-19 pandemic onset was considered to be 19 March 2020. All compromised data from instrumentation malfunction were excluded from this analysis. Due to sound propagation differences across sites, intra-islands soundscape comparisons are based on qualitative trends rather than absolute level differences.
Vessels were detected using the Ship Detector remora in Triton. Settings were input into the Batch run detector tool and run on a LTSA with a bin size of 5 s at 48 Hz for each deployment (see Solsona-Berga et al., 2020 for additional details) (Supplementary Table 2). Vessel detection was dependent on three conditions: Condition 1 - Exceeds a time-dependent amplitude threshold, computed from a mean of the upper and lower limits of a histogram of the average PSD; Condition 2 - Lower (Hz), medium (Hz) and high (Hz) frequency band limits were delineated in the ship detector batch settings (refer to Supplementary Table 2 for frequency band limits). To trigger a detection, the event duration above the amplitude threshold (specified in Condition 1), was required to be longer than a defined time, refer to as the close passage duration (s), in all three frequency bands or longer than the defined time of distant passage duration (s), in the lower two frequency bands (Supplementary Table 2). To prevent false positives from dolphin and sperm whale echolocation clicks, the high frequency band duration had to be shorter than the medium frequency band and the medium frequency band duration had to be shorter than the low frequency band, respectively; Condition 3 - The received level threshold (%) in the low frequency band had to exceed the background noise in the window to distinguish a vessel detection from ambient noise (Supplementary Table 2). In this study, humpback whale song was often misclassified as vessel passes by the vessel detector, as song units overlapped in frequency with vessel detections. Due to the nature of the detector, it was triggered if the receiving level threshold in the low band (100 - 5,000 Hz - Supplementary Table 2) exceeded background level noise to distinguish the vessel from ambient noise. This condition was likely violated as humpback whale song overlaps the 100 - 5,000 Hz range. Therefore manual verification was necessary to eliminate false positives. Detector settings varied based on each HIHWNMS site due to site specific differences in bathymetry, deployment depth, weather patterns, and oceanographic conditions (Supplementary Table 2). Trained analysts (AK, EJZ, BCM) used the Remora’s Evaluate detections tool to manually verify detections and modify labels to remove false positives. In this stage, specific sources of vessel noise (e.g., shipping, whale watching tour boats) were not further described and all sources were combined into one category as a cumulative “vessel” category.
Trained analysts (GC, EJZ) used the LTSAs to manually verify mid-frequency active (MFA) sonar (<5 kHz) detections using the Logger remora in Triton. The start and end time of events were recorded for the HI04_02 deployment. A cumulative sum of event durations was calculated to assess presence/absence of sonar off Kauaʻi.
Automatic Identification System (AIS) data has been used as a proxy for trends in vessel traffic, to verify vessel detections in passive acoustic recordings for management (Hatch et al., 2008; Haver et al., 2020, 2021), and to assess the influence of the pandemic on vessel traffic, as in this study (March et al., 2021; Ryan et al., 2021). AIS records were compiled by the Bureau of Ocean Energy Management (BOEM), NOAA, and the U.S. Coast Guard (MarineCadastre.gov). Daily AIS data from 2018-2022 were filtered by latitude and longitude of the location (e.g., island) and vessel type. Vessel type was indicated by globally recognized numeric vessel codes: 30 (fishing), 60-69 (passenger – including whale watch vessels), 70-79 (cargo), and 80-89 (tanker). Cargo and tankers were combined into a ‘shipping’ category. AIS data were mapped using Esri ArcGIS Pro version 3.1.0. Listening ranges4,5 for each site were calculated using propagation modeling (Margolina, 2022; Lammers et al., 2023b). The signal-to-noise ratio (SNR) was calculated based on the difference between the hydrophone received level and the wind-induced noise level. The listening range statistic represents the median distance over which predicted received levels were exceeding the wind-induced sound level. For this study, SNR ranges calculated for a 185 dB source at 65-121 m depth (site dependent) in the month of January were applied to estimate listening ranges at 125 Hz. Listening ranges were used as the median radius within which vessels could be acoustically detected for each site (Maui – 23.5 km; Oʻahu – 40.3 km; Kauaʻi – 15.8 km; Hawaiʻi – 37 km). Within the main Hawaiian Islands region (22.54182 N, -160.766612 W and 18.505087 N, -154.4039 W), AIS GPS positions were summed within the listening ranges to show overall trends in vessel presence pre- and during-COVID-19.
Soundscape PSD levels (median hourly dB re 1uPa/Hz between 20 and 24000 Hz) over the entire deployment were computed as the cumulative median of all medians in 24-hour bins to calculate daily values. A 14-day moving median was calculated from daily cumulative median values to assess overall trends (Haver et al., 2021). Using the “wilcox.test” built-in function in R (R Core Team, 2021), Mann-Whitney U Tests were used to compare vessel detections pre- and during COVID-19 periods across deployment years and sites. Tests with a p < 0.05 were considered statistically significant.
In total, approximately 47,600 hours, or 67.39 months (2,122 days), of recordings were included in this analysis. Due to recording failure across five deployments, an additional 373 days of data were compromised and therefore deemed unusable for these analyses. The least amount of data were recorded from the Maui and Hawaiʻi (10,567 and 9,035 hours respectively) sites due to instrumentation malfunctions and lack of deployment years, respectively. The greatest amount of data were recorded from the Oʻahu and Kauaʻi sites (13,956 and 14,048 hours respectively).
HIHWNMS soundscape is dynamic, with contributions from many biological and anthropogenic sources. Humpback whale song was the dominant soundscape contributor at these sites, as SanctSound deployments were intentionally conducted during the humpback whale season (Nov-May) (Figure 4). Other biological sources included species such as toothed whales as represented by detected clicks and whistles and snapping shrimp (Figures 4, 5). The dominant anthropogenic noise source detected was vessel noise. MFA sonar was detected in the SanctSound recordings, notably at the Kauaʻi site, but represented a minor part of the soundscape. For example, over the five month 2019-2020 deployment period, MFA sonar was detected on 14 days, spanning a cumulative duration of approximately 22 hours.
Figure 4 Example of a Long-Term Spectral Average (LTSA) of one deployment off Maui that recorded from December 2019 to March 2020. Examples of humpback whale song, snapping shrimp, vessel passage and toothed whales are included showcasing the diverse composition of signal types that comprise the soundscape in the HIHWNMS.
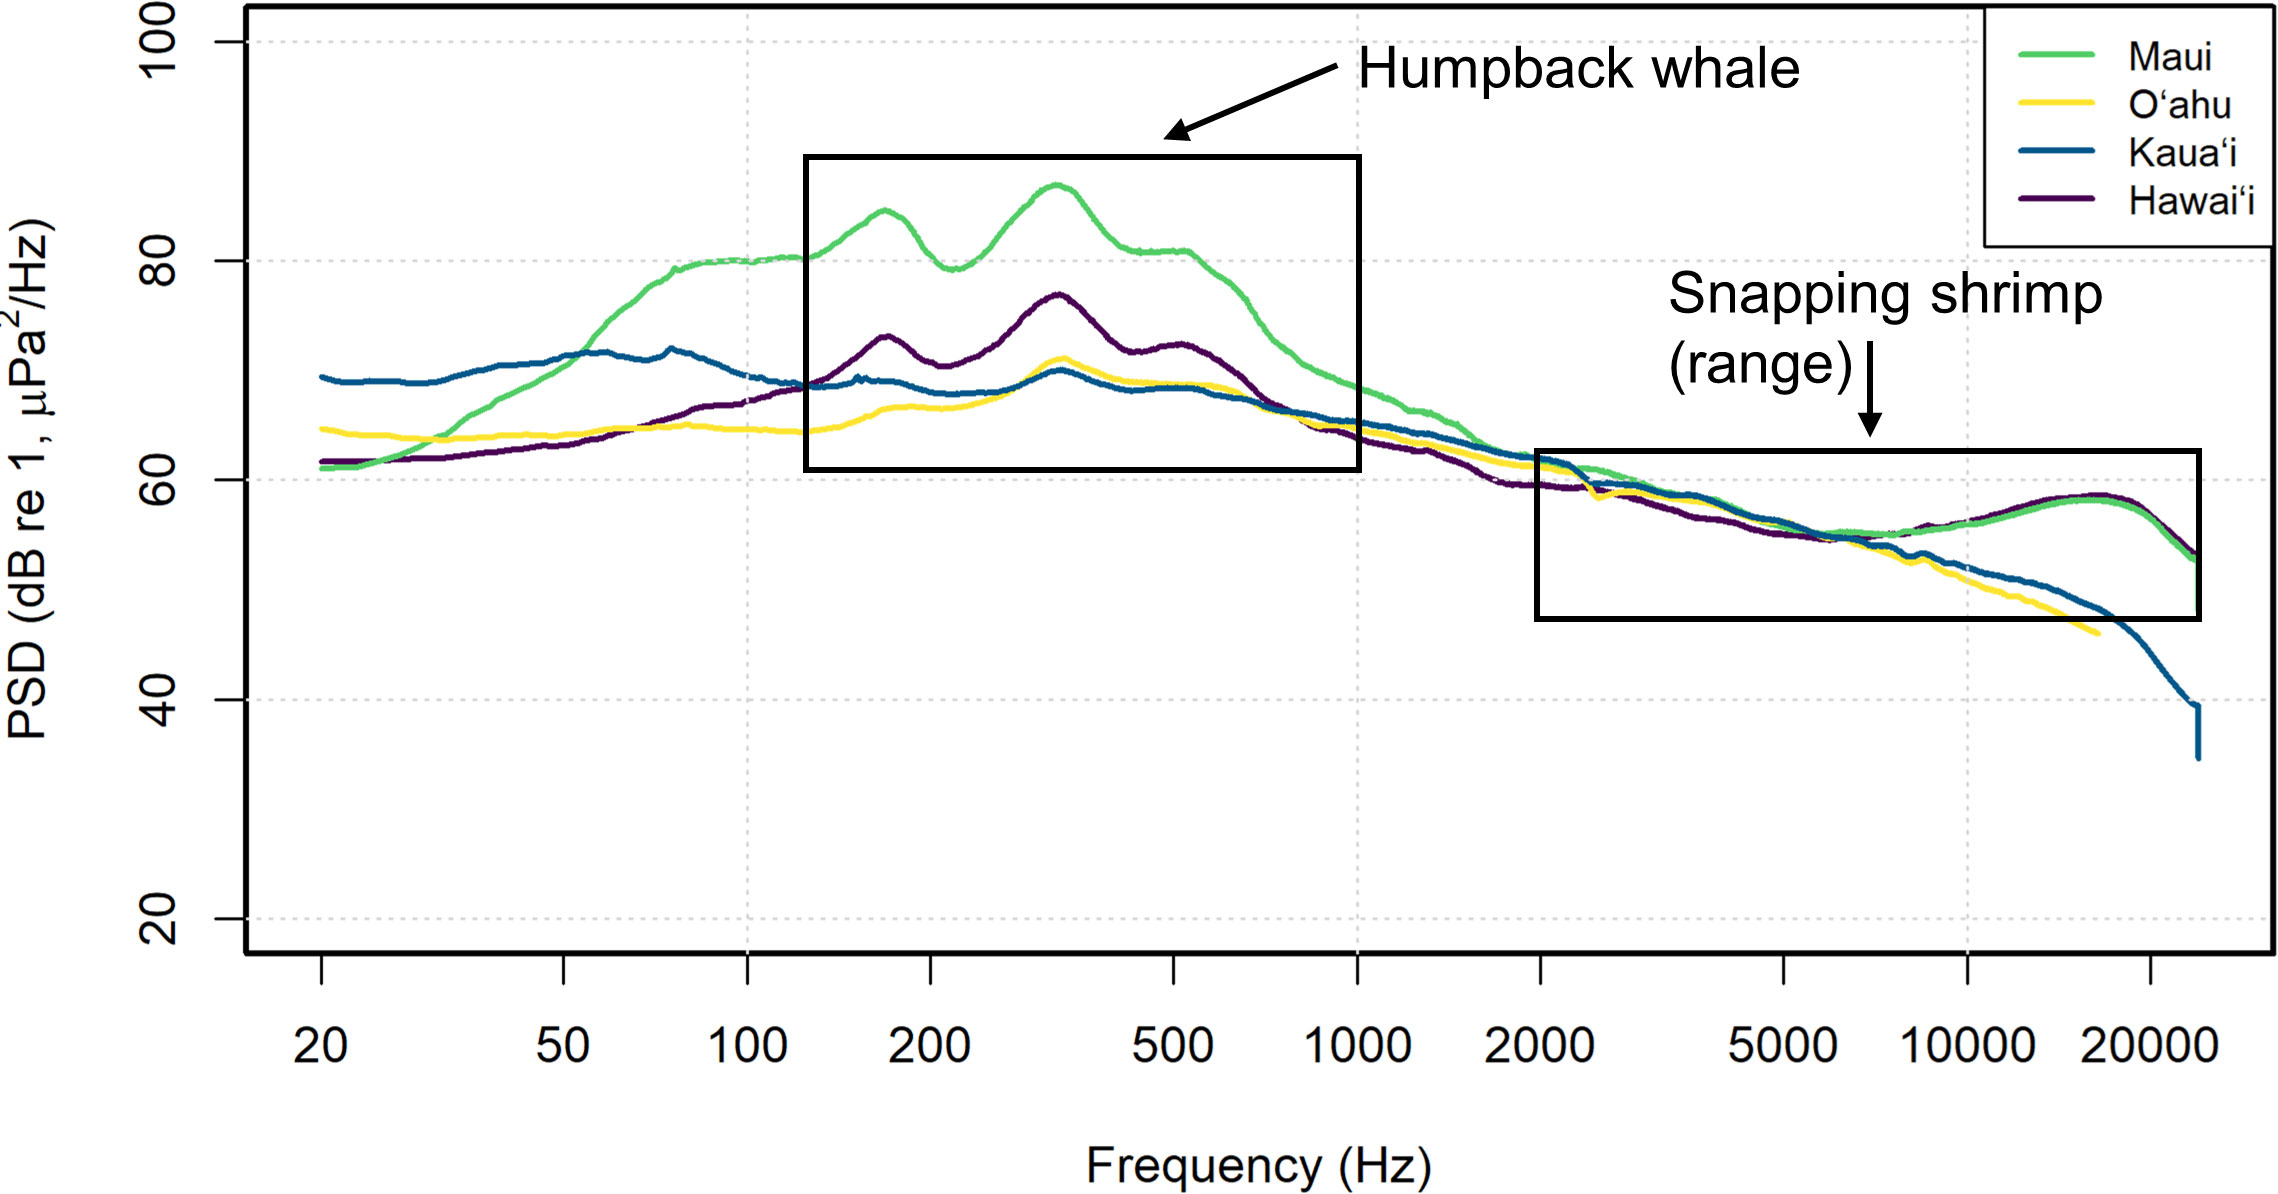
Figure 5 Representative spectrum of the median PSD levels from 1-month (February 2020) comparing island specific soundscapes. Biological sound sources are detonated in the boxed regions.
A moving median (14-days) of third octave levels (TOL) showed that the monthly medians across islands ranged from 70.4-105 dB re 1 µPa with an overall median for Hawaiʻi of 85.6 dB re 1 µPa (Figure 6). Overall TOLs were highest at the Maui site across most frequency bands and Oʻahu was characterized by the lowest sound levels. TOL varied across frequency bands. The lower TOL frequency bands (63125 and 500 Hz) contain a distinct peak from January to April predominantly at both Hawaiʻi and Maui sites (Figure 6A-F). This is consistent with the occurrence of the humpback whale season, which is correlated with elevated levels of humpback song chorusing that dominated the lower frequencies and notably the 500 Hz bin (Figure 6E, F). Inter-island comparisons in this study showed similar findings to McKenna et al. (2021) that described humpback whale song dominating the 500 Hz octave band and snapping shrimp dominating the 16000 Hz octave level. The highest monthly medians were recorded in February, which is considered the peak humpback whale season. The higher TOL frequency bands (6300, 12500 Hz) contained the least amount of variation between sites and were the most stable (Figure 6G-J). Overall, the 6300 Hz bin had the least amount of variation across sites (Figure 6G, H). In the 12500 bins, the sites diverged, and Hawaiʻi and Maui contained consistently higher TOL by up to ~ 10 dB re 1 µPa than the Kauaʻi and Oʻahu sites (Figure 6I, J). Excluding Maui (due to levels being consistently higher in the lower frequencies), in the 63 Hz band, Kauaʻi had higher TOL monthly medians than Oʻahu and Hawaiʻi by a median of 7.60 and 8.40 dB re 1 µPa in 2019-2020 and 4.50 and 8.30 dB re 1 µPa in 2020-2021, respectively. Given the periodicity of this low frequency sound, these elevated sound levels are likely caused by flow noise at the hydrophone from tidal currents.
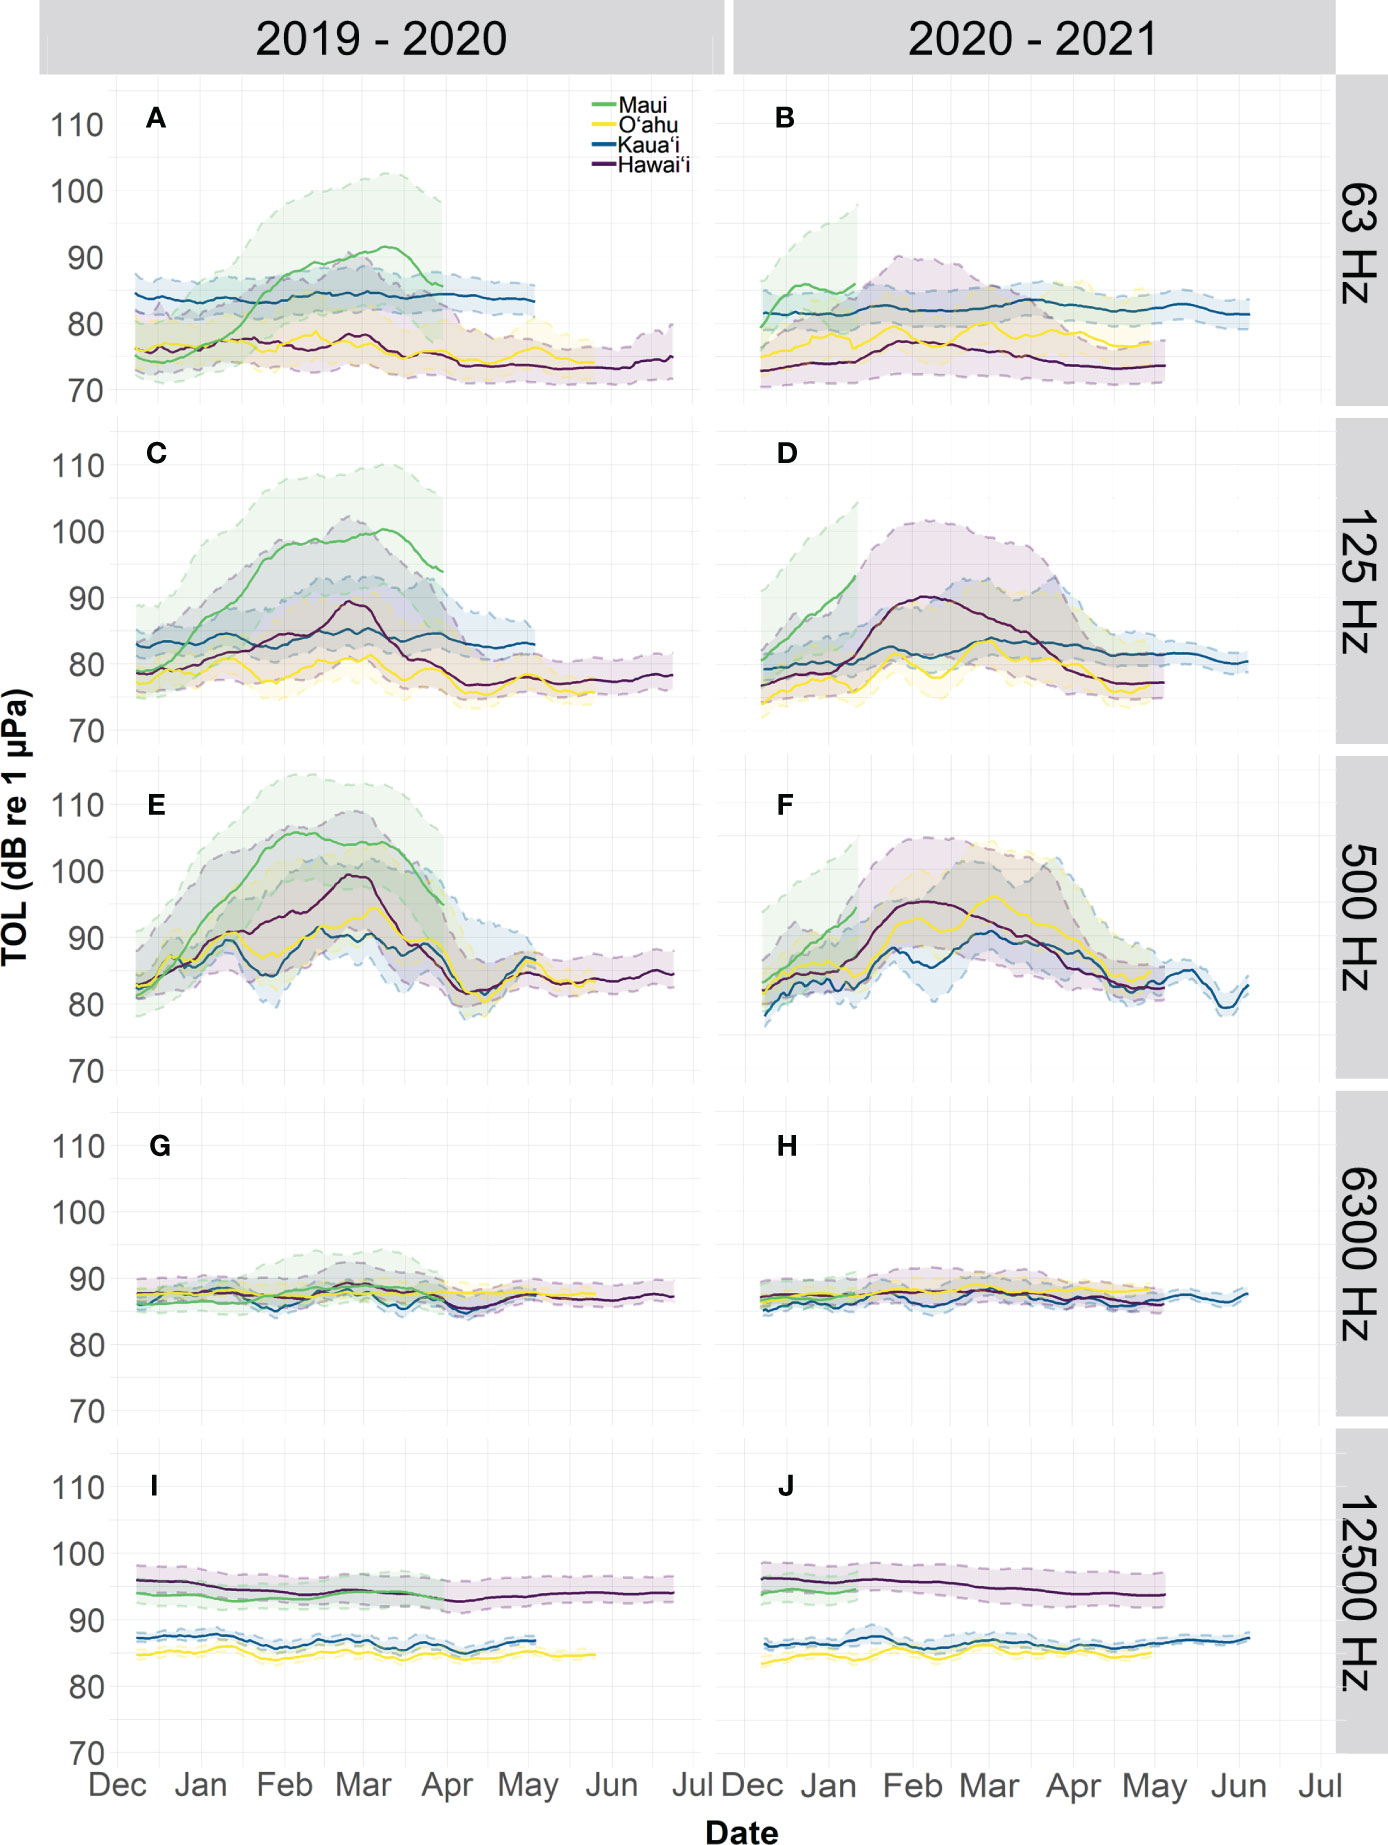
Figure 6 Third octave levels (TOLs) from the 2019-2020 deployment across six bands including (A, B) 63, (C, D) 125, (E, F) 500, (G, H) 6300, and (I, J) 12500 Hz. A 14-day moving median of the TOL was plotted across the four sites (Maui – green, Oʻahu - yellow, Kauaʻi – blue, and Hawaiʻi – purple). Percentile values in the 90th and 10th percentile are plotted in the shaded corresponding color.
Overall, Maui yielded the highest average daily vessel detection rate of 19.16 detections per day, which exceeded Kauaʻi, Oʻahu, and Hawaiʻi sites by a 3-fold order of magnitude (Figure 7). Kauaʻi had the lowest average daily vessel detection rate (4.50 detections per day) (Figure 7C). AIS data from the recording period (December 2018 to May 2019) plotted within the listening ranges of each hydrophone, showed that the composition of vessel types was predominately passenger vessels (e.g., whale watch boats) at the Kauaʻi (Figure 7C), Maui (Figure 7A) and Hawaiʻi (Figure 7D) sites. These passenger vessels correspond with whale watch vessels that are consistently operating in sanctuary waters during humpback whale season. Fishing and shipping vessel presence was negligible (0-4% of total AIS positions) at these sites. Since AIS is voluntary for small vessels (< 65 ft.), acoustic detection of vessels was attributed to local, recreational, or small charter fishing. Oʻahu AIS data was primarily comprised of fishing vessels due to the proximity between Honolulu Harbor (home of the offshore long-line fishing fleet) and the recording site (Figure 7B).
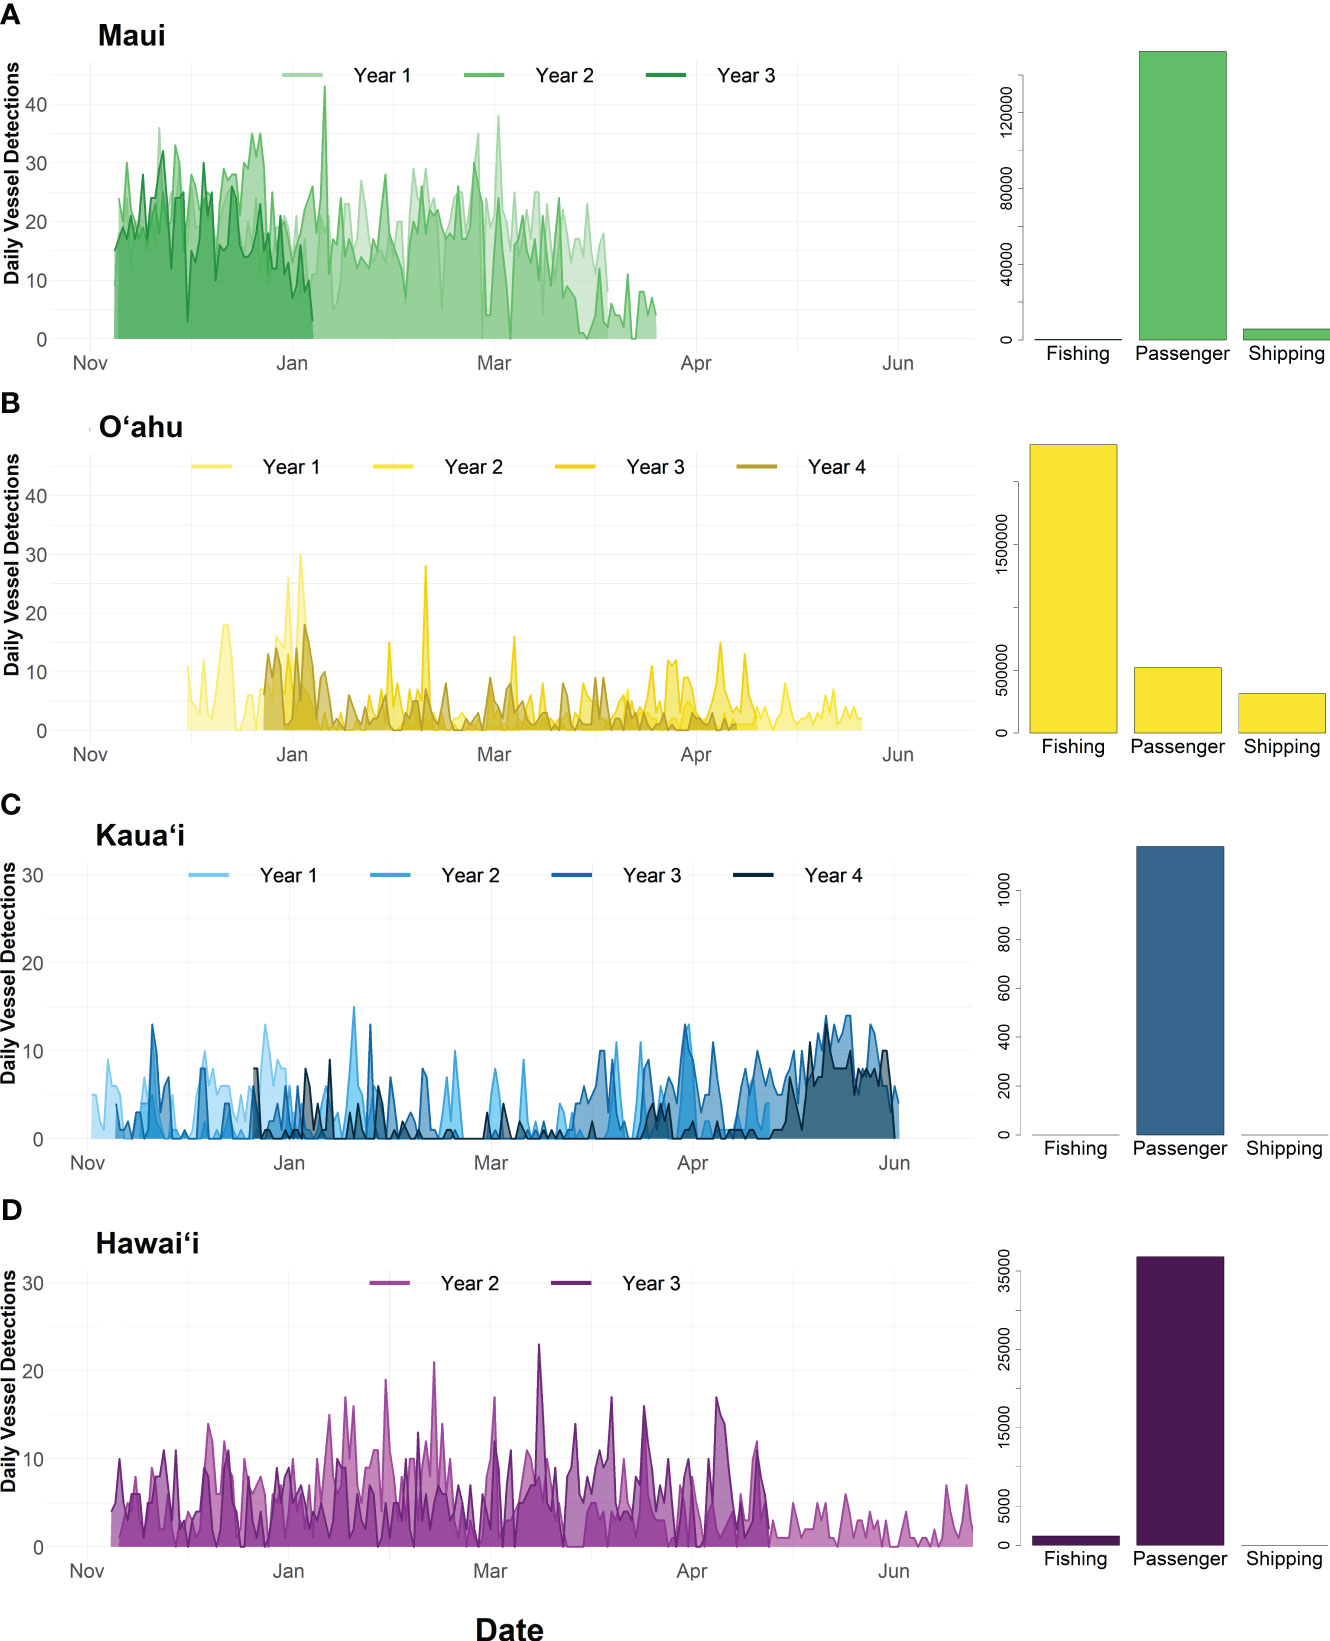
Figure 7 Daily vessel detections per site (A) Maui, (B) Oʻahu, (C) Kauaʻi, and (D) Hawaiʻi across four deployment years: (2018-2019, 2019-2020, 2020-2021, 2021-2022. X-axis varies by site. Bar graphs in the upper right-hand corner show the distribution of AIS position points for each site across one year (2020) in three vessel categories: fishing, passenger, and shipping. Data was included within the hydrophone listening range at 125 Hz (Maui – 23.5 km; Oʻahu – 40.3 km; Kauaʻi – 15.8 km; Hawaiʻi – 37 km) included in the SanctSound portal.
The most favorable propagation conditions were predicted off Hawaiʻi6 and Oʻahu7 and the least favorable conditions were predicted off Maui8 and Kauaʻi9. Given the asymmetrical nature of sound propagation across the Hawaiian Islands due to obstruction from nearby islands and shallow bathymetry between islands, vessels transiting in certain directions were often predicted to fall far short of the median listening range statistic. Wind induced sound levels ranged from a median of 79-81 dB re 1 µPa across all sites. Kauaʻi had the lowest median listening range from 24,368 m – 8,487 m in the 125 Hz band. Since smaller listening ranges may decrease detectability of vessels, the lower vessel detection rates off Kauaʻi may be related to less favorable propagation at the recording location. However, Maui had a smaller listening range than Hawaiʻi and Oʻahu but the most daily vessel detections indicating that propagation may not be a driving factor. There were negligible seasonal differences in SNR levels within sites.
The onset of the COVID-19 pandemic was considered 19 March 2020 for maritime activity. Although differences between sites were observed, changes in the sound levels were dominated by humpback whale chorusing therefore, COVID-19 influences could not be measured using PSD or TOL metrics. Vessel detections decreased significantly after the onset of the COVID-19 closures at both the Maui (Figure 8A - U = 148, p < 0.001) and Hawaiʻi (Figure 8C - U = 2725, p < 0.001) sites during 2020. Maui vessel detections decreased from an average of 19.77 detections pre-COVID-19 in 2020 to 5.52 detections immediately post-COVID-19 (Figure 8A). The year prior (2018-2019 deployment) demonstrates the baseline levels at this site only decreased from 19.07 prior to 19 March 2020 to 16 detections in the same period (during-COVID-19) in 2020 (Figure 8A). This likely reflects the decrease in tourism activities as whale watching vessels (passenger vessels) ceased operations during the pandemic. Hawaiʻi vessel detections decreased from 6.49 detections to 2.9 detections in 2020 (Figure 8C). However, Hawaiʻi detections increased in 2021 from 5.13 to 6.83 detections showing a potential recovery in activity in the following year (Figure 8C). AIS data supported this decrease and demonstrated the reduction in vessel traffic around these two sites during-COVID-19 (Figure 8B, D). Oʻahu and Kauaʻi did not experience a significant difference (U= 3871, p = 0.573 and U = 2187, p = 0.05184, respectively) in vessel detections between pre- and during-COVID-19 in 2020. AIS positions in the main Hawaiian Islands region showed an overall reduction in AIS positions of passenger vessels (whale watch vessels). AIS data of passenger vessels provided 173,648 positions in April 2019, 102,865 positions in April 2020 and 121,290 in April 2021. Based on the AIS positions, passenger vessel presence decreased by 40.8% (between 2019 and 2020) and 30.1% (between 2019 and 2021). Maui experienced the largest decrease in AIS positional data by up to 88% in the months following the onset of COVID-19 (April and May 2020).
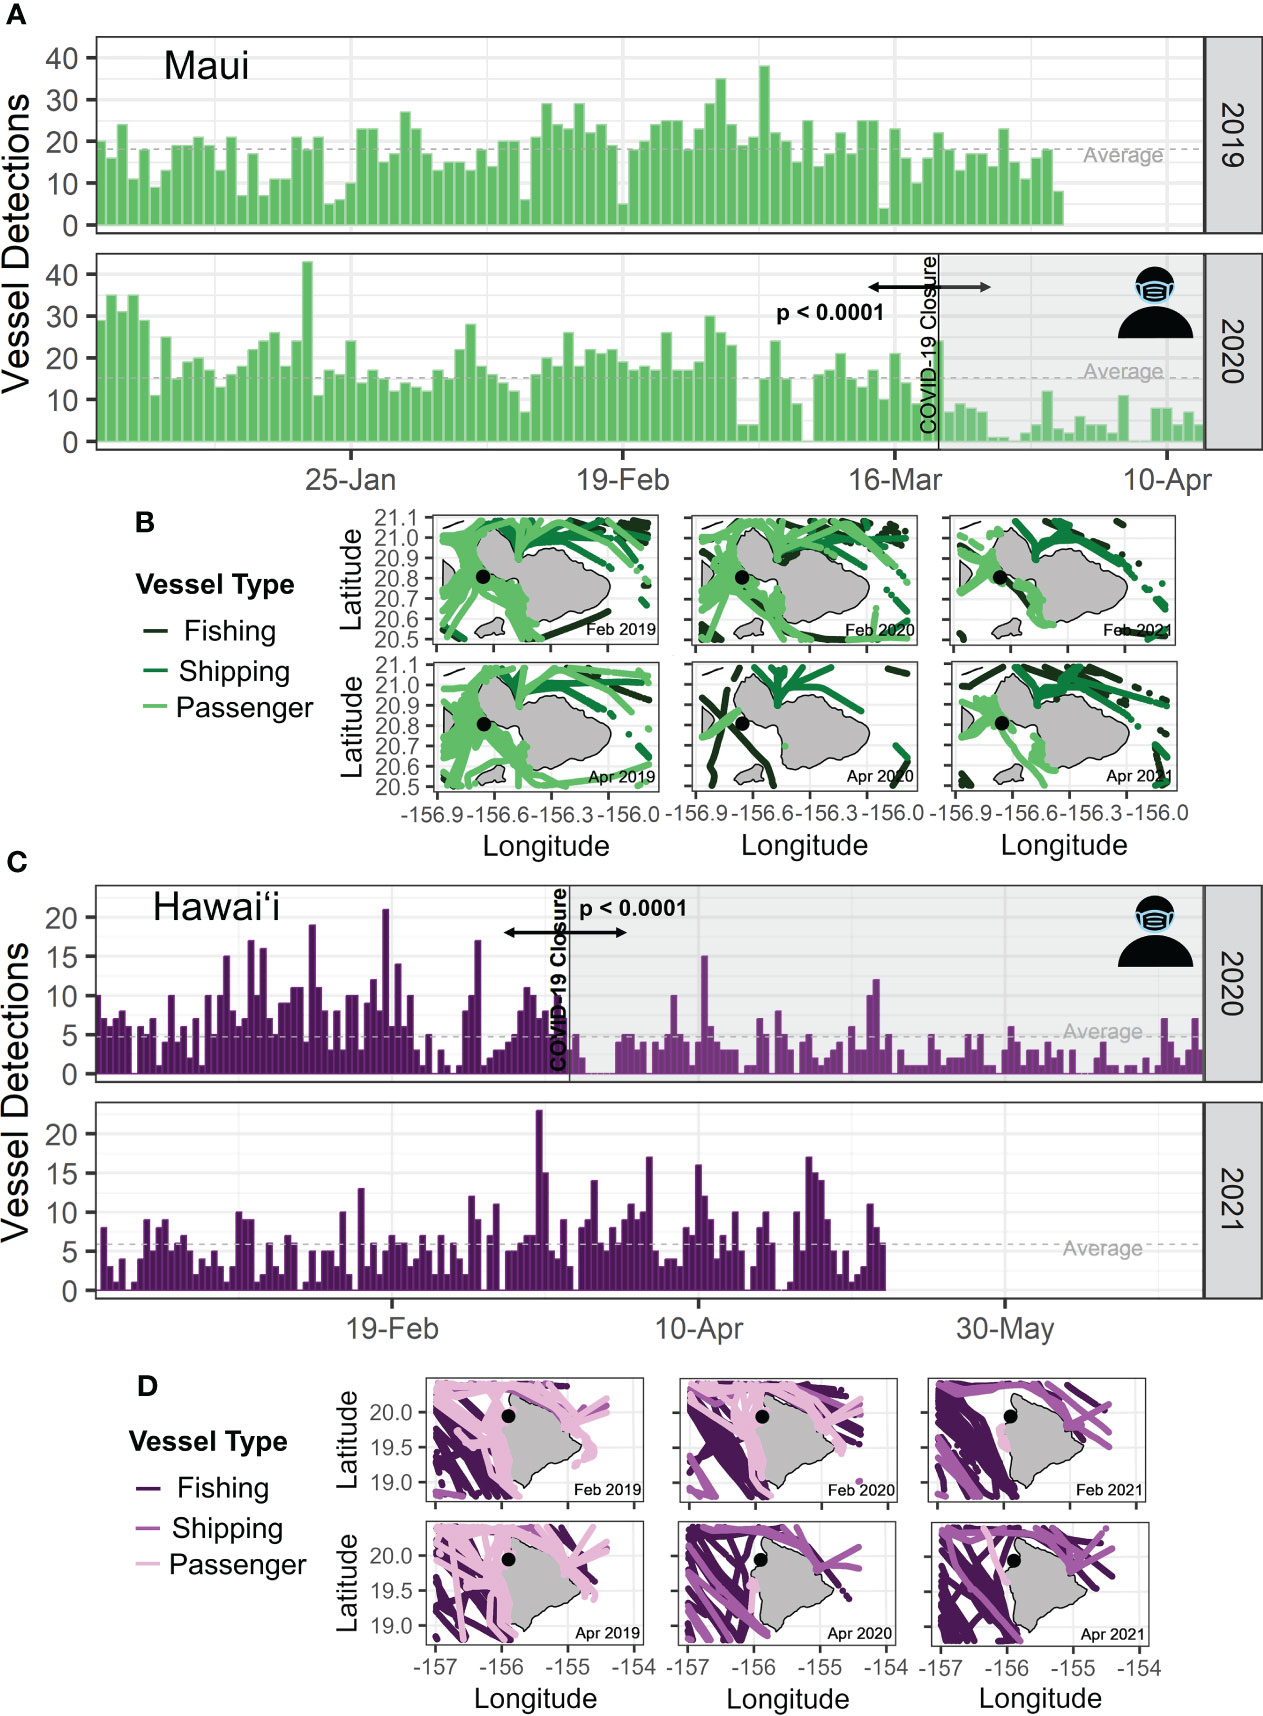
Figure 8 Number of vessel detections across deployments off (A) Maui and (C) Hawai’i island. AIS data mapped off (B) Maui and (D) Hawai’i incorporated three vessel types (fishing, shipping, passenger) over a 1-month period in February and April. Data from 2019, 2020, and 2021 were included to incorporate pre- and during-COVID-19 periods. Arrows denote significance between the pre- and during-COVID-19 periods.
This study shows the presence of inter and intra-island variations in the soundscape of HIHWNMS, which fluctuate annually due primarily to changes of biological sources (Kaplan et al., 2018; Kügler et al., 2020; Merkens et al., 2021). In temperate and tropical waters with relatively shallow reef environments, biological sources are often the primary drivers of temporal sound level fluctuations (e.g. Buscaino et al., 2016; Haver et al., 2019; McCordic et al., 2021; McKenna et al., 2021; Lillis and Mooney, 2022). Seasonal patterns in Hawaiian waters are dominated by biological sources including snapping shrimp (higher frequencies above 2 kHz) and humpback whales (lower frequencies below 2 kHz) (Au and Banks, 1998; Au et al., 2000, 2006; Lillis and Mooney, 2022), which can mask other soundscape contributors (e.g., fish chorusing, vessel noise) (Kaplan et al., 2018). Snapping shrimp are a major contributor to the shallow water soundscape in Hawaiʻi and produce high frequency, broadband sounds (2- 20 kHz range) through bubble cavitation during rapid claw closure (Au and Banks, 1998; Versluis et al., 2000; Kaplan et al., 2015; Freeman and Freeman, 2016). The timing of the humpback chorusing levels (denoted in the 125 and 500 Hz TOL), characterized by the onset in December and January followed by a peak in February and March, was consistent with patterns reported by Au et al. (2000) and Kügler et al. (2020). Humpback whale annual presence fluctuates throughout the Hawaiian Islands and intra-island variability in the amplitude of song production is primarily correlated with humpback whale abundance and the number of singers on the breeding ground (Kügler et al., 2020, 2021; Frankel et al., 2022; Lammers et al., 2023b). Low frequency (<1 kHz) sound levels recorded from Ecological Acoustic Recorders (EARs), increased during the 2019-2020 season, which correlated with a higher humpback whale abundance than the preceding and succeeding seasons (2018-2019, 2020-2021) off Maui (Zang and Lammers, 2021; Lammers et al, 2023b). The winter-focused data in this study demonstrated that humpback chorusing TOL (125 and 500 Hz) recorded off Maui in 2019-2020 were higher than other deployment years, which is consistent with abundance trends observed by Zang and Lammers (2021) using vessel based transect surveys and PAM (Lammers et al., 2023a) efforts in the Maui Nui region.
In this study, overall trends in intra-island variability remained relatively stable inter-annually compared to inter-island differences. Inter-island differences were more distinct and can be attributed to multiple site-specific factors including depth, proximity to the reef, and humpback whale densities. The inter-island difference in high TOL was likely due to depth and habitat differences across sites. The shallow water sites (Maui and Hawaiʻi; ~48m/56m) with closer proximity to the reef, exhibited a more pronounced peak in the higher frequencies likely attributed to snapping shrimp compared to the deeper sites (O‘ahu and Kauaʻi; ~78 m). Although not the focus of this study, the general diel differences observed in these data were consistent with other studies in tropical reef areas like the U.S. Virgin Islands (Kaplan et al., 2015) and Hawaiʻi (Kaplan et al., 2018) where higher frequency sound levels increased before dawn and after dusk and sound levels were higher at night than during the day.
Humpback whale densities differ across the main Hawaiian Islands with a higher concentration of whales in the Maui Nui region (Mobley et al., 1999, 2023). Maui sound levels can increase by up to 20 dB re 1 µPa during whale season compared to the off season (Au et al., 2000; Kaplan et al., 2018). In Kügler et al. (2020), at the Olowalu site, most closely resembling the Maui site included in this study, sound levels were reported to fluctuate by up to 9.7 dB re 1 μPa2 across the season (November-April) annually. In comparison, Širović et al. (2013) reported a 6 dB increase in spectrum levels of ambient levels attributed to humpback whale song off Hawaiʻi and Kauaʻi. In this study, TOL 500 Hz levels were the highest for Maui, which was consistent with previously reported sound levels (Lammers et al., 2023a). Annual variation within each site was mainly driven by humpback whale chorusing, but was less influential for non-Maui sites where lower humpback whale densities (using chorusing as a proxy for density) have been reported (Lammers et al., 2023a). Consequently, higher frequencies consistently exhibited little deviation in sound levels compared to the lower frequencies, which reflected the ubiquitous contributions of snapping shrimp to the soundscape compared to the highly variable, seasonal nature of humpback whale song. These data demonstrate that within a non-contiguous sanctuary, diverse soundscapes exist and HIHWNMS provides a unique opportunity to describe the diversity of island-associated soundscapes.
To our knowledge, this is one of the first studies to acoustically document vessel activity across the main Hawaiian Islands. Overall, vessel detection rates were lower than other sanctuary sites (Hatch et al., 2008; Cholewiak et al., 2018; Haver et al., 2020, 2021; Stanley et al., 2021). Site location and proximity to major ports heavily influenced vessel detection rates in this study. Despite O‘ahu being the most populated island, the recording site was far from Honolulu Harbor, the principal seaport of the State of Hawaiʻi, and was consequently less frequented, yielding fewer vessel passes than other sites (e.g., Maui). Higher monthly detection averages were reported in this study than those reported in Haver et al. (2021) for north of O‘ahu island (14 transits per month), due to the distance from the harbor. While there were some shipping detections off O‘ahu, the recorder was not within any major shipping lanes likely explaining the fewer shipping vessel detections. Similarly, Kauaʻi has historically been characterized by limited marine traffic due to the island’s lower population size (Richlen, 2018) and light shipping levels (Širović et al., 2013). TOL frequency bands (63 Hz and 125 Hz) have been commonly used as a proxy to quantify shipping activity in other studies (Merchant et al., 2014; Haver et al., 2021; Ryan et al., 2021). However, due to the relatively low shipping activity throughout the main Hawaiian Islands (Širović et al., 2013; Haver et al., 2021), TOL do not accurately represent shipping presence because these frequencies are heavily masked by humpback whale chorusing so we relied on vessel detectors and AIS data to capture vessel presence.
High vessel detection rates off Maui were likely influenced by the whale watch industry, concentrated in the Maui Nui region. AIS data supported vessel composition dominated by passenger (presumably whale watch) vessels. Although AIS data can provide an overview of vessel passes, we recognize that AIS data does not fully capture total vessel presence (O’Hara et al., 2023). Voluntary participation in AIS by smaller vessels likely results in a lower estimate of the actual vessel presence. In Hawaiʻi, fishing vessels have been found to be the most common vessel type (Haver et al., 2021). Across the main Hawaiian Islands, the Maui and Hawaiʻi island communities have a high percentage of the household engaging in recreational fishing and a high rate of non-commercial (recreational, subsistence, cultural harvest) boat-based fishing, largely from smaller vessels (McCoy et al., 2018). Small fishing vessels do not typically operate AIS. Therefore, a large sector of vessel presence in Hawaiʻi is not accurately captured through AIS data alone. Vessel detectors aid in obtaining more accurate vessel presence information particularly for smaller vessels. Due to the unique environment of the Hawaiian Islands, the vessel detector settings used in this study were designed to be inclusive resulting in a high false positive rate, which required manual verification, but captured as many vessels as possible. A caveat is that humpback whale chorusing can mask vessel noise, which affects detector performance. Therefore, the detections are likely an underrepresentation of the total vessel presence particularly off Maui where chorusing is highest. Another limiting factor was the listening ranges of the hydrophones that varied by site and were non-uniform directionally around the locations, and are expected to have limited the detectability of vessels. Although adjusting our findings to account for detectability of vessels in the sanctuary was outside the scope of this study, the probability of a vessel being detected is further dependent on vessel-specific characteristics (e.g. size, traveling speed, engine type). As the majority of vessels detected did not carry AIS, those parameters are not available, making it challenging to further define detectability.
In HIHWNMS, although vessels were detected on most days for the duration of the deployment, they did not have a significant influence on the soundscape patterns observed since humpback whale song dominates the lower frequencies. This pattern was consistent with previous soundscape work in two Australia Marine Parks (McCordic et al., 2021). This contrasts with other reports of vessel passages having a significant influence on the soundscape in MPAs (Buscaino et al., 2016; Haver et al., 2020). For example, Buscaino et al. (2016) reported a mean of 13 vessel passages per hour annually in a Mediterranean Sea MPA, which far exceeded that of Hawaiʻi sanctuary sites demonstrating that vessel activity can vary across MPAs (Kline et al., 2020).
Prior studies in other areas have shown that low frequency noise decreased by a mean of 1.2-1.9 dB after the onset of COVID-19 and this was attributed to a reduction in commercial shipping traffic during the pandemic (Thomson and Barclay, 2020; Basan et al., 2021; Dahl et al., 2021; Ryan et al., 2021). Although COVID-19 trends can be observed through vessel presence (primarily shipping activity) at other locations, these trends may not be evident at sites with relatively low shipping activity. In the main Hawaiian Islands, the soundscape is less influenced by low frequency noise associated with shipping traffic (Haver et al., 2021), therefore changes in shipping activity as a result of the pandemic were not detected in the soundscape metrics. Additionally, two sites in this study were characterized by low overall vessel presence and no changes were observed. The State of Hawaiʻi relies on shipping for goods arriving to the islands and despite delays experienced by mainland states during COVID-19, shipping services continued uninterrupted to Hawaiʻi (Ige and Anderson, 2020). For example, Matson, Inc., the predominant shipping company in Hawaiʻi, maintained a normal schedule (three arrivals per week to Honolulu Harbor and twice a week barge service to neighbor islands) and therefore there was no decrease in shipping activity (Ige and Anderson, 2020).
The impact from the pandemic on the tourism and recreational vessel sectors was greater than any other sectors in Hawaiʻi, with slower recovery rates to pre-COVID-19 levels (March et al., 2021). Therefore, we expected a greater impact to the soundscape, considering the dominance of the tourism and recreational vessel sectors in Hawaiʻi. In this study, we were able to capture the reduction in whale watch activity during COVID-19, using vessel detection data paired with the available AIS data to help illuminate higher resolution differences. Laute et al. (2022) found a 69% reduction in whale watch industry traffic in Skjálfandi Bay, Iceland during the COVID-19 pandemic. In this study, although passenger vessel AIS positional data in Hawaiʻi decreased by 40.8% during COVID-19 compared to the previous year, this is likely an underestimate of the decrease in vessel presence experienced across the islands. Maui experienced the largest decrease in passenger vessels due to the whale watching industry ceasing operations during COVID-19. The change in the reduction from 40.8% (2020) to 30.1% (2021) indicates that although the decrease in vessel presence was most severe immediately following the onset of the pandemic in 2020, the effects of COVID-19 persisted the following year.
Bertucci et al. (2021) documented a “rebound period” in the Guadeloupe Archipelago where human activity resumed to pre-COVID-19 sound levels in May 2020. Although we were unable to determine the rebound period in 2020 based on sound levels due to data limitations and humpback whale chorusing, the Hawaiʻi site appeared to rebound in the following year (2020-2021) based on the number of vessel detections, indicating that vessel activity returned to pre-COVID-19 vessel detection averages. The differences in rebound period length were likely attributed to the timing of the lifting of restrictions. The May 2020 rebound period described in Bertucci et al. (2021) coincided with the lifting of the government-imposed lockdown in France on 21 May 2020. In Hawaiʻi, the potential delay in the rebound period, as exhibited in the Hawaiʻi island vessel data, was likely due to the extended shut-down periods and strict travel restrictions imposed by the State of Hawaiʻi that lasted until summer 2021. Globally, the effects of COVID-19 are thought to have increased the communication range for some marine mammals (Pine et al., 2021), which led to an increase in humpback whale calling (Laute et al., 2022) and an increase in the detection of delphinid whistles (Gagne et al., 2022). Laute et al. (2022) found that the decrease in whale watch vessels in Iceland during the pandemic correlated with an increase in the humpback whale calling rate on the foraging ground. Similarly, the reduction in whale watch vessels off Maui could potentially have caused humpback whale chorusing to increase in response or whales could simply have extended their presence in Maui.
Previous soundscape work in the main Hawaiian Islands has been predominantly island-specific with studies off Hawaiʻi (Heenehan et al., 2017), Maui (Au et al., 2000; Kaplan et al., 2018; Kügler et al., 2020, 2021), and Kauaʻi (Richlen, 2018), which reported similar sound level values to those reported in this study for similar locations. A previous Pacific regional soundscape comparison reported low frequency sound levels within the range of sound levels measured in this study off Kauaʻi and Kona, Hawaiʻi (Širović et al., 2013). Humpback whale song was a significant contributor to the soundscape and during peak humpback whale season, Širović et al. (2013) reported higher ambient noise levels off Kauaʻi than Kona, Hawaiʻi which they attributed to more animals near Kauaʻi. In this study, we observed the opposite trend at the Hawaiʻi site which had higher sound levels corresponding with humpback whale chorusing which likely reflects the variability in animal presence across islands annually. More recent long-term, broadband soundscape work off Kona, Hawaiʻi revealed more subtle seasonal trends in the deep-water soundscape, with sound levels within the Hawaiʻi range reported in this study but exhibited low frequency seasonality in the winter driven by humpback whales (Merkens et al., 2021). With the inclusion of consecutive years of data, this study expands on the comprehensive Hawaiian Archipelago wide soundscape analyses conducted in Lammers et al. (2023a) within the sanctuary and monument.
The U.S. sanctuary system represents a range of habitats characterized by acoustically diverse drivers of sound levels (McKenna et al., 2021). Biological sources dominate the soundscape at many SanctSound sites. Similar to HIHWNMS, across sanctuaries, baleen whales are a large contributor to the soundscape seasonally (DeAngelis et al., 2022). Each sanctuary experiences different seasonal and diel patterns, with varying baseline levels that can fluctuate intra- and inter-annually, making it challenging to compare across sanctuaries nationally given the diversity in methods that may influence sound levels, including instruments, settings (e.g., sampling rate, duty cycle), and the sound level metrics reported by the authors (McKenna et al., 2021). SanctSound sought to overcome these challenges by using standardized metrics to improve the accuracy of sanctuary comparisons. Despite attempts to minimize biases through the utilization of SanctSound standardized metrics and protocols, there are limitations to the trends we can assess given the data gaps that exist with a seasonally limited dataset, instrumentation failures, and data quality issues. Future annual recordings may provide higher temporal resolution to monitor seasonal changes, assess inter- and intra-annual spatial and temporal variability, and illuminate other soundscape sources.
Currently, there is no globally implemented standard for soundscape analysis and reporting. As publicly available databases and archives containing passive acoustic data, such as the National Centers for Environmental Information (NCEI) database, become larger and more readily available (Wall et al., 2021), the necessity for standardization becomes essential. Over the last decade there have been efforts to develop standardized metrics and implement methods to describe the soundscape through software development (Wiggins and Hildebrand, 2007; Miksis-Olds et al., 2021), observatory networks (Heaney et al., 2020), and best practice guidelines for soundscape data collection and processing (Boyd et al., 2011; Martin et al., 2021; Wilford et al., 2021). SanctSound is one of the first studies to report sound propagation modeling for all monitoring locations, providing opportunities to incorporate understanding of detectability in presence findings. We recommend that future soundscape studies calculate and report acoustic propagation at each site and integrate sound propagation modeling with acoustic detections to promote accurate and comparable presence estimates, which serves as a future step for this study. Standardization is imperative for informing future management and mitigation efforts related to the implementation of renewable energy solutions in response to climate change (Van Parijs et al., 2021).
This study established comprehensive, baseline-levels for HIHWNMS. Although soundscape work has been conducted in Hawaiʻi previously, to our knowledge no studies of this magnitude targeting sanctuary waters have ever been conducted. The soundscape in Hawaiʻi is dominated by biological sound sources in the sanctuary especially during the humpback whale season. The results in this study reveal that COVID-19-induced impacts to the soundscape could not be captured using traditionally used soundscape metrics given the unique soundscape that was dominated by biological sources. Although overall, Hawaiʻi sites experienced relatively low vessel presence, vessel data quantified a reduction in vessel presence and AIS data tracked the pause in the whale watch industry in Hawaiʻi during the pandemic. We recommend future studies in the sanctuary implement standardized reporting to enable cross study comparisons and include both the humpback whale season and off season to characterize year-round contributors to the soundscape. PAM should continue to serve as an important tool to monitor changes in the soundscape to inform future management and conservation efforts in the Hawaiian Archipelago.
Over the last decade, MPA managers have sought to monitor the underwater acoustic habitat to assess implications for management (Hatch et al., 2016). Although sanctuaries have federally mandated boundaries, due to the characteristics of sound propagation, sound can penetrate these boundaries, so PAM is imperative for soundscape assessment to improve the management of MPAs (Hatch and Fristrup, 2009). NOAA does not regulate underwater noise in the context of soundscapes directly, but rather is mandated to reduce or eliminate noise-induced injury from federal actions or permitted activities to marine life, including endangered and protected species (Endangered Species Act and Marine Mammal Protection Act) and sanctuary resources (National Marine Sanctuary Act) (Gedamke et al., 2016; Hatch et al., 2016). The continued implementation of federally led, nation-wide studies like SanctSound will inform future noise management efforts, both by NOAA and by other federal agencies that directly manage noise-contributing activities, in and around sanctuaries.
All raw audio data presented in this study can be accessed at: https://data.noaa.gov/metaview/page?xml=NOAA/NESDIS/NGDC/MGG/passive_acoustic//iso/xml/NOAA-Navy-SanctSound_Raw_Data.xml&view=getDataView Sound levels output are available per site per deployment for each HI sampling location through the map viewer: https://data.noaa.gov/metaview/page?xml=NOAA/NESDIS/NGDC/MGG/passive_acoustic//iso/xml/NOAA-Navy-SanctSound_HI06_01_BB_1h.xml&view=getDataView Vessel detection output: https://data.noaa.gov/metaview/page?xml=NOAA/NESDIS/NGDC/MGG/passive_acoustic//iso/xml/NOAA-Navy-SanctSound_HI03_02_ships.xml&view=getDataView Sound propagation modeling output: https://data.noaa.gov/metaview/page?xml=NOAA/NESDIS/NGDC/MGG/passive_acoustic//iso/xml/NOAA-Navy-SanctSound_Sound_Propagation_Models.xml&view=getDataView.
BM: Conceptualization, Formal analysis, Investigation, Visualization, Writing – original draft, Writing – review & editing, Validation. AK: Data curation, Investigation, Methodology, Validation, Writing – review & editing. EZ: Data curation, Investigation, Writing – review & editing, Methodology, Validation. ML: Funding acquisition, Investigation, Project administration, Resources, Supervision, Writing – review & editing, Conceptualization. LH: Conceptualization, Funding acquisition, Project administration, Resources, Writing – review & editing. AP: Supervision, Writing – review & editing.
The author(s) declare financial support was received for the research, authorship, and/or publication of this article. This work was completed as part of the SanctSound project, which is a collaboration between NOAA and the U.S. Navy to better understand underwater sound within the National Marine Sanctuary System. This work was supported by the Office of National Marine Sanctuary (ONMS) and the Dr. Nancy Foster Scholarship Program (BCM). Additional resources were provided by the Marine Mammal Research Program and the Hawaiʻi Institute of Marine Biology.
This project would not have been possible without the field staff who conducted all boat-based operations including the deployments and retrievals of the hydrophones. Personnel included Sara Wood, Ted Gruppenhoff, Kirtley Mann, Ed Lyman, Jason Leonard, Keolohilani Lopes, Terril Efird, Luke Evancoe, Brian Hauk, Beth Goodwin, Adam Taufmann, Patrick Conley, Kimberly Jeffries, and Mark Mohler. The authors would like to thank Karlina Merkens for her valuable insight into the vessel detector and metrics used in this study. The authors would also like to thank Ernest F. Hollings scholar, Grace Collins (GC) for her manual analysis of sonar detections in the SanctSound data. This is Contribution No. 1947 from the Hawaiʻi Institute of Marine Biology and School of Ocean and Earth Science and Technology (SOEST) Contribution No. 11775. We would like to thank the two reviewers for their helpful comments on this manuscript.
The authors declare that the research was conducted in the absence of any commercial or financial relationships that could be construed as a potential conflict of interest.
All claims expressed in this article are solely those of the authors and do not necessarily represent those of their affiliated organizations, or those of the publisher, the editors and the reviewers. Any product that may be evaluated in this article, or claim that may be made by its manufacturer, is not guaranteed or endorsed by the publisher.
The Supplementary Material for this article can be found online at: https://www.frontiersin.org/articles/10.3389/fmars.2024.1342454/full#supplementary-material
Au W. W., Banks K. (1998). The acoustics of the snapping shrimp Synalpheus parneomeris in Kaneohe Bay. J. Acoust. Soc Am. 103, 41–47. doi: 10.1121/1.423234
Au W. W. L., Mobley J., Burgess W. C., Lammers M. O., Nachtigall P. E. (2000). Seasonal and diurnal trends of chorusing humpback whales wintering in waters off west Maui. Mar. Mamm. Sci. 16, 530–544. doi: 10.1111/j.1748-7692.2000.tb00949.x
Au W. W., Pack A. A., Lammers M. O., Herman L. M., Deakos M. H., Andrews K. (2006). Acoustic properties of humpback whale songs. J. Acoust. Soc Am. 120, 1103–1110. doi: 10.1121/1.2211547
Barr B., Utech D., Hoagland P. (2000). The economic contribution of whale watching to regional economies: Perspectives from two National Marine Sanctuaries (Silver Spring, MD: Marine Sanctuaries Conservation Series MSD-00-2).
Basan F., Fischer J. G., Kühnel D. (2021). Soundscapes in the German Baltic Sea before and during the COVID-19 Pandemic. Front. Mar. Sci. 8. doi: 10.3389/fmars.2021.689860
Bertucci F., Lecchini D., Greeven C., Brooker R. M., Minier L., Cordonnier S., et al. (2021). Changes to an urban marina soundscape associated with COVID-19 lockdown in Guadeloupe. Environ. pollut. 289, 117898. doi: 10.1016/j.envpol.2021.117898
Boyd I. L., Frisk G., Urban E., Tyack P., Ausubel J., Seeyave S., et al. (2011). An international quiet ocean experiment. Oceanography 24, 174–181. doi: 10.5670/oceanog.2011.37
Buscaino G., Ceraulo M., Pieretti N., Corrias V., Farina A., Filiciotto F., et al. (2016). Temporal patterns in the soundscape of the shallow waters of a Mediterranean marine protected area. Sci. Rep. 6, 34230. doi: 10.1038/srep34230
Calambokidis J., Falcone E. A., Quinn T. J., Burdin A. M., Clapham P. J., Ford J. K., et al. (2008). SPLASH: Structure of populations, levels of abundance and status of humpback whales in the North Pacific. Unpublished report AB133F-03-RP-0078 submitted by Cascadia Research Collective to USDOC (Seattle, WA: U.S. Dept of Commerce).
Casale A., Brunoldi M., Grosso D., Alessi J., Cappanera V., Taiuti M. (2016). “ARION System for coastal dolphin conservation: A tool for real-time dolphin passive acoustic monitoring in the Portofino Marine Protected Area,” in Proc. Meet. Acoust. 4ENAL, 27. 070009. doi: 10.1121/2.0000283
Cholewiak D., Clark C. W., Ponirakis D., Frankel A., Hatch L. T., Risch D., et al. (2018). Communicating amidst the noise: modeling the aggregate influence of ambient and vessel noise on baleen whale communication space in a national marine sanctuary. Endanger. Species Res. 36, 59–75. doi: 10.3354/esr00875
Dahl P. H., Dall’Osto D. R., Harrington M. J. (2021). Trends in low-frequency underwater noise off the Oregon coast and impacts of COVID-19 pandemic. J. Acoust. Soc Am. 149, 4073–4077. doi: 10.1121/10.0005192
DeAngelis A. I., Van Parijs S. M., Barkowski J., Baumann-Pickering S., Burger K., Davis G. E., et al. (2022). Exploring marine mammal presence across seven US national marine sanctuaries. Front. Remote sens. 3. doi: 10.3389/frsen.2022.970401
EU. (2008). Directive 2008/56/EC of the European Parliament and of the council of 17 June 2008 establishing a framework for community action in the field of marine environmental policy (Marine Strategy Framework Directive). Off. J. Eur. Commun. L164, 19–40.
Ferrier-Pagès C., Leal M. C., Calado R., Schmid D. W., Bertucci F., Lecchini D., et al. (2021). Noise pollution on coral reefs?—A yet underestimated threat to coral reef communities. Mar. Pollut. Bull. 165, 112129. doi: 10.1016/j.marpolbul.2021.112129
Frankel A. S., Gabriele C. M., Yin S., Rickards S. H. (2022). Humpback whale abundance in Hawai‘i: Temporal trends and response to climatic drivers. Mar. Mammal Sci. 38, 118–138. doi: 10.1111/mms.12856
Freeman L. A., Freeman S. E. (2016). Rapidly obtained ecosystem indicators from coral reef soundscapes. Mar. Ecol. Prog. Ser. 561, 69–82. doi: 10.3354/meps11938
Gagne E., Perez-Ortega B., Hendry A. P., Melo-Santos G., Walmsley S. F., Rege-Colt M., et al. (2022). Dolphin communication during widespread systematic noise reduction-a natural experiment amid COVID-19 lockdowns. Front. Remote Sens. 3. doi: 10.3389/frsen.2022.934608
Gedamke J., Harrison J., Hatch L., Angliss R., Barlow J., Berchok C., et al. (2016) Ocean Noise Strategy Roadmap. Available online at: http://cetsound.noaa.gov/road-map (Accessed August 6, 2023).
Goldbogen J. A., Southall B. L., DeRuiter S. L., Calambokidis J., Friedlaender A. S., Hazen E. L., et al. (2013). Blue whales respond to simulated mid-frequency military sonar. Proc. R. Soc B. 280, 20130657. doi: 10.1098/rspb.2013.0657
Gridley T., Martin M. J., Slater J., Roux J. P., Swift R. J., Elwen S. H. (2020). Towed passive acoustic monitoring complements visual survey methods for Heaviside’s dolphins Cephalorhynchus heavisidii in the Namibian Islands Marine Protected Area. Afr. J. Mar. Sci. 42, 495–506. doi: 10.2989/1814232X.2020.1848925
Hatch L., Clark C., Merrick R., Van Parijs S., Ponirakis D., Schwehr K., et al. (2008). Characterizing the relative contributions of large vessels to total ocean noise fields: a case study using the Gerry E. Studds Stellwagen Bank National Marine Sanctuary. Environ. Manage. 42, 735–752. doi: 10.1007/s00267-008-9169-4
Hatch L. T., Fristrup K. M. (2009). No barrier at the boundaries: implementing regional frameworks for noise management in protected natural areas. Mar. Ecol. Prog. Ser. 395, 223–244. doi: 10.3354/meps07945
Hatch L. T., Wahle C. M., Gedamke J., Harrison J., Laws B., Moore S. E., et al. (2016). Can you hear me here? Managing acoustic habitat in US waters. Endang. Species Res. 30, 171–186. doi: 10.3354/esr00722
Haver S. M., Adams J. D., Hatch L. T., Van Parijs S. M., Dziak R. P., Haxel J., et al. (2021). Large vessel activity and low-frequency underwater sound benchmarks in United States waters. Front. Mar. Sci 8, 669528. doi: 10.3389/fmars.2021.669528
Haver S. M., Fournet M. E., Dziak R. P., Gabriele C., Gedamke J., Hatch L. T., et al. (2019). Comparing the underwater soundscapes of four US national parks and marine sanctuaries. Front. Mar. Sci. 6. doi: 10.3389/fmars.2019.00500
Haver S. M., Gedamke J., Hatch L. T., Dziak R. P., Van Parijs S., McKenna M. F., et al. (2018). Monitoring long-term soundscape trends in US Waters: the NOAA/NPS Ocean noise reference station network. Mar. Policy. 90, 6–13. doi: 10.1016/j.marpol.2018.01.023
Haver S. M., Rand Z., Hatch L. T., Lipski D., Dziak R. P., Gedamke J., et al. (2020). Seasonal trends and primary contributors to the low-frequency soundscape of the Cordell Bank National Marine Sanctuary. J. Acoust. Soc Am. 148, 845–858. doi: 10.1121/10.0001726
Heaney K., Martin B., Miksis-Olds J., Ainslie M., Moore T., Warren J. (2020) ADEON Data Processing Specification, Version 1.0 FINAL. Technical report by Applied Ocean Sciences for Prime Contract No. M16PC00003. Available online at: https://adeon.unh.edu/sites/default/files/user-uploads/ADEON_Data%20Processing_Specification_FINAL.pdf (Accessed July 1, 2023).
Heenehan H. L., Van Parijs S. M., Bejder L., Tyne J. A., Southall B. L., Southall H., et al. (2017). Natural and anthropogenic events influence the soundscapes of four bays on Hawaii Island. Mar. pollut. Bull. 124, 9–20. doi: 10.1016/j.marpolbul.2017.06.065
Ige D. Y., Anderson B. S. (2020) COVID-19 DAILY UPDATE MARCH 13, 2020 (State of Hawaii Department of Health). Available online at: https://health.hawaii.gov/news/covid-19/covid-19-daily-update-march-13-2020/ (Accessed March 22, 2023).
Kalberg K. O., Pan M. (2016). 2012 Economic cost earnings of pelagic longline fishing in Hawaii (Honolulu, HI: U.S. Dep. Commer., NOAA Tech. Memo., NOAA-TM-NMFS-PIFSC-56). 60p. doi: 10.7289/V5/TM-PIFSC-56
Kaplan M. B., Lammers M. O., Zang E., Aran Mooney T. (2018). Acoustic and biological trends on coral reefs off Maui, Hawaii. Coral Reefs. 37, 121–133. doi: 10.1007/s00338-017-1638-x
Kaplan M. B., Mooney T. A., Partan J., Solow A. R. (2015). Coral reef species assemblages are associated with ambient soundscapes. Mar. Ecol. Prog. Ser. 533, 93–107. doi: 10.3354/meps11382
Kline L. R., DeAngelis A. I., McBride C., Rodgers G. G., Rowell T. J., Smith J., et al. (2020). Sleuthing with sound: Understanding vessel activity in marine protected areas using passive acoustic monitoring. Mar. Policy. 120, 104138. doi: 10.1016/j.marpol.2020.104138
Kügler A., Lammers M. O., Zang E. J., Kaplan M. B., Mooney T. A. (2020). Fluctuations in Hawaii’s humpback whale Megaptera novaeangliae population inferred from male song chorusing off Maui. Endanger. Species Res. 43, 421–434. doi: 10.3354/esr01080
Kügler A., Lammers M. O., Zang E. J., Pack A. A. (2021). Male humpback whale chorusing in Hawai‘i and its relationship with whale abundance and density. Front. Mar. Sci. 8. doi: 10.3389/fmars.2021.735664
Lammers M. O., Goodwin B., Kügler A., Zang E. J., Harvey M., Margolina T., et al. (2023). The occurrence of humpback whales across the Hawaiian archipelago revealed by fixed and mobile acoustic monitoring. Front. Mar. Sci. 10. doi: 10.3389/fmars.2023.1083583
Lammers M. O., Zang E. J., Kügler A., Mooney T. A. (2023b). “Measuring fluctuation in Humpback whale presence in Hawaii based on song chorusing levels,” in Effects of Noise on Aquatic Life: Principles and Practical Considerations. Eds. Popper A. N., Sisneros J., Hawkins A., Thomsen F. (New York, NY: Springer), 1–9. doi: 10.1007/978-3-031-10417-6_88-1
Laute A., Grove T. J., Rasmussen M. H., Smith A., Loisa O., Fournet M. E. (2022). Impact of whale-watching vessels on humpback whale calling behavior on an Icelandic foraging ground during the Covid-19 pandemic. Mar. Ecol. Prog. Ser. 701, 159–173. doi: 10.3354/meps14202
Lillis A., Mooney T. A. (2022). Sounds of a changing sea: Temperature drives acoustic output by dominant biological sound-producers in shallow water habitats. Front. Mar. Sci. 9. doi: 10.3389/fmars.2022.960881
Lyamin O. I., Korneva S. M., Rozhnov V. V., Mukhametov L. M. (2011). Cardiorespiratory changes in beluga in response to acoustic noise. Doklady Akademii Nauk. 440, 704–707. doi: 10.1134/S0012496611050218
March D., Metcalfe K., Tintoré J., Godley B. J. (2021). Tracking the global reduction of marine traffic during the COVID-19 pandemic. Nat. Commun. 12, 1–12. doi: 10.1038/s41467-021-22423-6
Margolina T. (2022) Naval Postgraduate School. Sound Propagation Models, Sanct Sound Data Products (NOAA National Centers for Environmental Information). (Accessed November 19, 2023).
Martin S. B., Gaudet B. J., Klinck H., Dugan P. J., Miksis-Olds J. L., Mellinger D. K., et al. (2021). Hybrid millidecade spectra: A practical format for exchange of long-term ambient sound data. JASA Express Lett. 1, 011203. doi: 10.1121/10.0003324
McCordic J. A., DeAngelis A. I., Kline L. R., McBride C., Rodgers G. G., Rowell T. J., et al. (2021). Biological sound sources drive soundscape characteristics of two Australian marine parks. Front. Mar. Sci. 8. doi: 10.3389/fmars.2021.669412
McCoy K. S., Williams I. D., Friedlander A. M., Ma H., Teneva L., Kittinger J. N. (2018). Estimating nearshore coral reef-associated fisheries production from the main Hawaiian Islands. PloS One 13, e0195840. doi: 10.1371/journal.pone.0195840
McKenna M. F., Baumann-Pickering S., Kok A. C., Oestreich W. K., Adams J. D., Barkowski J., et al. (2021). Advancing the interpretation of shallow water marine soundscapes. Front. Mar. Sci. 8. doi: 10.3389/fmars.2021.719258
Merchant N. D., Pirotta E., Barton T. R., Thompson P. M. (2014). Monitoring ship noise to assess the impact of coastal developments on marine mammals. Mar. Pollut. Bull. 78, 85–95. doi: 10.1016/j.marpolbul.2013.10.058
Merkens K., Baumann-Pickering S., Ziegenhorn M. A., Trickey J. S., Allen A. N., Oleson E. M. (2021). Characterizing the long-term, wide-band and deep-water soundscape off Hawaiʻi. Front. Mar. Sci. 8. doi: 10.3389/fmars.2021.752231
Miksis-Olds J. L., Dugan P. J., Martin S. B., Klinck H., Mellinger D. K., Mann D. A., et al. (2021). Ocean sound analysis software for making ambient noise trends accessible (MANTA). Front. Mar. Sci. 8. doi: 10.3389/fmars.2021.703650
Mobley J. R., Bauer G. B., Herman L. M. (1999). Changes over a ten-year interval in the distribution and relative abundance of humpback whales (Megaptera novaeangliae) wintering in Hawaiian waters. Aquat. Mamm. 25, 63–72.
Mobley J. R. Jr., Deakos M. H., Pack A. A., Bortolotto G. A. (2023). Aerial survey perspectives on humpback whale resiliency in Maui Nui, Hawaiʻi, in the face of an unprecedented North Pacific marine warming event. Mar. Mammal Sci 39, 842–857. doi: 10.1111/mms.13018
Mussoline S. E., Risch D., Hatch L. T., Weinrich M. T., Wiley D. N., Thompson M. A., et al. (2012). Seasonal and diel variation in North Atlantic right whale up-calls: implications for management and conservation in the northwestern Atlantic Ocean. Endanger. Species Res. 17, 17–26. doi: 10.3354/esr00411
National Oceanic and Atmospheric Administration (2017) Hawaiian Islands Humpback Whale NedeleNational Marine Sanctuary and Papahānaumokuākea Marine National Monument Socioeconomic factsheet. Available online at: https://nmssanctuaries.blob.core.windows.net/sanctuaries-prod/media/archive/science/socioeconomic/pdfs/hi_papa_final.pdf (Accessed March 13, 2023).
Nedelec S. L., Radford A. N., Pearl L., Nedelec B., McCormick M. I., Meekan M. G., et al. (2017). Motorboat noise impacts parental behaviour and offspring survival in a reef fish. Proc. R. Soc B Biol. Sci. 284, 20170143. doi: 10.1098/rspb.2017.0143
Office of National Marine Sanctuaries (ONMS). (2009). Monterey Bay National Marine Sanctuary Condition Report 2009 (Silver Spring, MD: U.S. Department of Commerce, National Oceanic and Atmospheric Administration, Office of National Marine Sanctuaries), 63.
Office of National Marine Sanctuaries (ONMS). (2010a). Hawaiian Islands Humpback Whale National Marine Sanctuary Condition Report 2010 (Silver Spring, MD: U.S. Department of Commerce, National Oceanic and Atmospheric Administration, Office of National Marine Sanctuaries), 63.
Office of National Marine Sanctuaries (ONMS). (2010b). Gulf of the Farallones National Marine Sanctuary Condition Report 2010 (Silver Spring, MD: U.S. Department of Commerce, National Oceanic and Atmospheric Administration, Office of National Marine Sanctuaries), 97.
Office of National Marine Sanctuaries (ONMS). (2020a). Hawaiian Islands Humpback Whale National Marine Sanctuary Management Plan 2020 (Silver Spring, MD: U.S. Department of Commerce, National Oceanic and Atmospheric Administration, Office of National Marine Sanctuaries), 38.
Office of National Marine Sanctuaries (ONMS). (2020b). 2020 Stellwagen Bank National Marine Sanctuary Condition Report: Findings of Status and Trends for 2007-2018 (Silver Spring, MD: U.S. Department of Commerce, National Oceanic and Atmospheric Administration, Office of National Marine Sanctuaries), 263.
O’Hara P. D., Serra-Sogas N., McWhinnie L., Pearce K., Le Baron N., O’Hagan G., et al. (2023). Automated identification system for ships data as a proxy for marine vessel related stressors. Sci. Total Environ. 865, 160987. doi: 10.1016/j.scitotenv.2022.160987
Parks S. E., Johnson M., Nowacek D., Tyack P. L. (2011). Individual right whales call louder in increased environmental noise. Biol. Lett. 7, 33–35. doi: 10.1098/rsbl.2010.0451
Picciulin M., Kéver L., Parmentier E., Bolgan M. (2019). Listening to the unseen: passive acoustic monitoring reveals the presence of a cryptic fish species. Aquat Conserv. Mar. Freshw. Ecosyst. 29, 202–210. doi: 10.1002/aqc.2973
Pijanowski B. C., Farina A., Gage S. H., Dumyahn S. L., Krause B. L. (2011). What is soundscape ecology? An introduction and overview of an emerging new science. Lands Ecol. 26, 1213–1232. doi: 10.1007/s10980-011-9600-8
Pine M. K., Wilson L., Jeffs A. G., McWhinnie L., Juanes F., Scuderi A., et al. (2021). A Gulf in lockdown: how an enforced ban on recreational vessels increased dolphin and fish communication ranges. Glob. Change Biol. 27, 4839–4848. doi: 10.1111/gcb.15798
Popper A. N., Hawkins A. D. (2019). An overview of fish bioacoustics and the impacts of anthropogenic sounds on fishes. J. Fish Biol. 94, 692–713. doi: 10.1111/jfb.13948
Prawirasasra M. S., Mustonen M., Klauson A. (2021). The underwater soundscape at gulf of riga marine-protected areas. J. Mar. Sci. Eng. 9, 915. doi: 10.3390/jmse9080915
Rayment W., Dawson S., Slooten L. (2009). Use of T-PODs for acoustic monitoring of Cephalorhynchus dolphins: a case study with Hector’s dolphins in a marine protected area. Endanger. Species Res. 10, 333–339. doi: 10.3354/esr00189
R Core Team (2021). R: A language and environment for statistical computing (Vienna, Austria: R Foundation for Statistical Computing). Available at: https://www.R-project.org/.
Richlen M. (2018). Underwater Passive Acoustic Monitoring Around Kauaʻi, Hawaiʻi. [Doctoral dissertation]. Honolulu, HI: University of Hawaii at Mānoa.
Rolland R. M., Parks S. E., Hunt K. E., Castellote M., Corkeron P. J., Nowacek D. P., et al. (2012). Evidence that ship noise increases stress in right whales. Proc. R. Soc B Biol. Sci. 279, 2363–2368. doi: 10.1098/rspb.2011.2429
Rollins E., Lovell S. (2019). Charter fishing in Hawaii: A multi-region analysis of the economic linkages and contributions within and outside Hawaii. Mar. Policy. 100, 277–287. doi: 10.1016/j.marpol.2018.11.032
Ryan J. P., Joseph J. E., Margolina T., Hatch L. T., Azzara A., Reyes A., et al. (2021). Reduction of low-frequency vessel noise in Monterey Bay National Marine Sanctuary during the COVID-19 pandemic. Front. Mar. Sci. 8. doi: 10.3389/fmars.2021.656566
Sánchez-Gendriz I., Padovese L. R. (2016). Underwater soundscape of marine protected areas in the south Brazilian coast. Mar. Pollut. Bull. 105, 65–72. doi: 10.1016/j.marpolbul.2016.02.055
Širović A., Wiggins S. M., Oleson E. M. (2013). Ocean noise in the tropical and subtropical Pacific Ocean. J. Acoust. Soc Am. 134, 2681–2689. doi: 10.1121/1.4820884
Solsona-Berga A., Frasier K. E., Baumann-Pickering S., Wiggins S. M., Hildebrand J. A. (2020). DetEdit: A graphical user interface for annotating and editing events detected in long-term acoustic monitoring data. PloS Comput. Biol. 16, e1007598. doi: 10.1371/journal.pcbi.1007598
Stanley J. A., Van Parijs S. M., Davis G. E., Sullivan M., Hatch L. T. (2021). Monitoring spatial and temporal soundscape features within ecologically significant US National Marine Sanctuaries. Ecol. Appl. 31, e02439. doi: 10.1002/eap.2439
State of Hawaiʻi Department of Business, Economic Development & Tourism (2019) Marine Cargo and Waterborn Commerce in Hawaiʻi Economy: Trends and Patterns in Hawaii Marine Cargo 2001 - 2016. Available online at: https://files.hawaii.gov/dbedt/economic/reports/Marine_Cargo_Study_Final.pdf (Accessed April 14, 2023).
State of Hawaiʻi Department of Business, Economic Development & Tourism (2022) Visitor Statistics. “Tourism Data Warehouse”. Available online at: http://dbedt.Hawaii.gov/visitor/tourismdata/ (Accessed April 14, 2023).
Thomson D. J., Barclay D. R. (2020). Real-time observations of the impact of COVID-19 on underwater noise. J. Acoust. Soc Am. 147, 3390–3396. doi: 10.1121/10.0001271
United Nations General Assembly (2017). Resolution A/RES/72/73, Part XI of the Omnibus Resolution for Oceans and the law of the sea. Res 61/222, 77th sess, Agenda Item 72(a), para 107. Available at: https://undocs.org/en/a/res/72/73. (Accessed September 15, 2023)
Van Parijs S. M., Baker K., Carduner J., Daly J., Davis G. E., Esch C., et al. (2021). NOAA and BOEM minimum recommendations for use of passive acoustic listening systems in offshore wind energy development monitoring and mitigation programs. Front. Mar. Sci. 1575. doi: 10.3389/fmars.2021.760840
Versluis M., Schmitz B., Von der Heydt A., Lohse D. (2000). How snapping shrimp snap: through cavitating bubbles. Science 289, 2114–2117. doi: 10.1126/science.289.5487.2114
Wall C. C., Haver S. M., Hatch L. T., Miksis-Olds J., Bochenek R., Dziak R. P., et al. (2021). The next wave of passive acoustic data management: how centralized access can enhance science. Front. Mar. Sci. 8. doi: 10.3389/fmars.2021.703682
Wiener C., Bejder L., Johnston D., Fawcett L., Wilkinson P. (2020). Cashing in on spinners: revenue estimates of wild dolphin-swim tourism in the Hawaiian Islands. Front. Mar. Sci. 7, 660. doi: 10.3389/fmars.2020.00660
Wiggins S. M., Hildebrand J. A. (2007). “High-frequency Acoustic Recording Package (HARP) for broad-band, long-term marine mammal monitoring,” in Int. Symp. Underw. Technol. 2007 Int. Workshop Sci. Use Submar. Cables Relat. Technol. 2007, 551–557 (Tokyo: IEEE). doi: 10.1109/UT.2007.370760
Wilford D. C., Miksis-Olds J. L., Martin S. B., Howard D. R., Lowell K., Lyons A. P., et al. (2021). Quantitative soundscape analysis to understand multidimensional features. Front. Mar. Sci. 8. doi: 10.3389/fmars.2021.672336
Zang E., Lammers M. (2021). Estimated density and abundance of humpback whales (Megaptera novaeangliae) off Maui, Hawaiʻi: Results from 2018-21 vessel-based surveys. National Marine Sanctuaries Conservation Series ONMS-21-09 (Kihei, HI: U.S. Department of Commerce, National Oceanic and Atmospheric Administration, National Ocean Service, Office of National Marine Sanctuaries).
Keywords: soundscape, passive acoustic monitoring, anthropogenic noise, marine protected areas, COVID-19
Citation: Madrigal BC, Kügler A, Zang EJ, Lammers MO, Hatch LT and Pacini AF (2024) Comparing the underwater soundscape of the Hawaiian Islands Humpback Whale National Marine Sanctuary and potential influences of the COVID-19 pandemic. Front. Mar. Sci. 11:1342454. doi: 10.3389/fmars.2024.1342454
Received: 21 November 2023; Accepted: 19 February 2024;
Published: 06 March 2024.
Edited by:
Won Sang Lee, Korea Polar Research Institute, Republic of KoreaReviewed by:
Tyler A. Helble, Naval Information Warfare Center Pacific, United StatesCopyright © 2024 Madrigal, Kügler, Zang, Lammers, Hatch and Pacini. This is an open-access article distributed under the terms of the Creative Commons Attribution License (CC BY). The use, distribution or reproduction in other forums is permitted, provided the original author(s) and the copyright owner(s) are credited and that the original publication in this journal is cited, in accordance with accepted academic practice. No use, distribution or reproduction is permitted which does not comply with these terms.
*Correspondence: Brijonnay C. Madrigal, YmNtMkBoYXdhaWkuZWR1
†Present address: Anke Kügler, Bioacoustics and Behavioral Ecology Lab, Syracuse University, Syracuse, NY, United States
Disclaimer: All claims expressed in this article are solely those of the authors and do not necessarily represent those of their affiliated organizations, or those of the publisher, the editors and the reviewers. Any product that may be evaluated in this article or claim that may be made by its manufacturer is not guaranteed or endorsed by the publisher.
Research integrity at Frontiers
Learn more about the work of our research integrity team to safeguard the quality of each article we publish.