
94% of researchers rate our articles as excellent or good
Learn more about the work of our research integrity team to safeguard the quality of each article we publish.
Find out more
ORIGINAL RESEARCH article
Front. Mar. Sci., 26 June 2024
Sec. Marine Megafauna
Volume 11 - 2024 | https://doi.org/10.3389/fmars.2024.1336455
 Chelsi Napoli1*
 Nathan Hirtle2
 Julia Stepanuk1
 Fredrik Christiansen3
 Eleanor I. Heywood4
 Thomas J. Grove5Alyssa Stoller5Flordespina Dodds5
 Maria Glarou6
 Marianne H. Rasmussen6Gina L. Lonati7
 Kimberley T.A. Davies7Simone Videsen3
 Malene J. Simon8
 Tenna K. Boye8Ann Zoidis9,10Sean K. Todd10
 Lesley H. Thorne1,2
Baleen whales are key consumers in marine ecosystems and can serve as ecosystem sentinels. Body condition, defined as an individual’s energy stores relative to its structural size, can provide a useful proxy for health in baleen whales. As capital breeders, important life history events in baleen whales such as seasonal migrations and reproduction depend on having sufficient energy stores. Spatiotemporal variability of body condition of baleen whales can reflect differences in energy accumulated during the foraging season. Here we assess and compare the body condition and mass of humpback whales (Megaptera novaeangliae) across four different foraging areas from the West Indies distinct population segment in the Northwest Atlantic. Morphometric measurements of humpback whales were obtained using unoccupied aerial systems (UAS, or drones) from the New York Bight, the Gulf of Maine, Iceland, and Greenland. Uncertainty in morphometric estimates was incorporated and propagated using a bootstrapping approach. Measurements were used to estimate body volume and calculate a body condition index (BCI) for each individual whale. Since body mass is a key parameter for understanding animal physiology and bioenergetics, we further compared whale body mass to body size between foraging areas by converting body volume to body mass using estimates of tissue density from tagging studies. BCI showed significant differences between foraging areas with a large effect size (ANCOVA: mean η2 = 0.168; all p< 0.001) when incorporating day of year and year as covariates. Humpback whales in the Gulf of Maine showed significantly higher BCI than those in the New York Bight, Iceland, and Greenland. Standardized Major Axis (SMA) regressions comparing log-log relationships of both body volume and body mass, respectively, to total length reinforced these results. Humpback whales in the Gulf of Maine showed significantly higher elevation in the SMAs than those in the other study regions (p<0.001), implying that humpback whales foraging in the Gulf of Maine accumulated greater energy reserves for a given body size. Estimates of body mass indicate that for a given body length, humpback whales in the Gulf of Maine have an 18% greater body mass than those in the New York Bight, Iceland, or Greenland. Regional differences in prey availability or anthropogenic threats could contribute to the observed patterns in body condition. Our findings highlight the importance of regional environmental factors to the nutritional health of baleen whales.
Baleen whales are important predators in marine ecosystems that require dense aggregations of prey for efficient feeding, and consume immense quantities of prey over annual timeframes (Piatt and Methven, 1992; Savoca et al., 2021). Variability in the health and habitat use of baleen whales can provide insight into changes to ecosystem processes, and thus these species can serve as effective ecosystem and climate sentinels (Moore, 2008; Bossart, 2011; Fleming et al., 2016; Fossi and Panti, 2017; Bengston Nash et al., 2018; Hazen et al., 2019). Studying baleen whale health has historically been very challenging as they are large-bodied, highly mobile, and spend much of their life underwater (Moore et al., 2021). However, in recent years, aerial imagery derived from unoccupied aerial systems (UAS), or drones, has provided a minimally invasive means of assessing certain health metrics in these species (Christiansen et al., 2016b; Domínguez-Sánchez et al., 2018; Horton et al., 2019; Johnston, 2019; Torres et al., 2022; Fernandez Ajó et al., 2023). Body condition, defined as an individual’s energy stores relative to its structural size, provides a useful proxy for health in baleen whales that can be assessed for a large number of individuals over short periods of time using UAS (Christiansen et al., 2016a, 2020; Torres et al., 2022). Baleen whales are capital breeders that have separate feeding and breeding grounds, and a whale in greater body condition will have greater energy stores available for fasting during the breeding season, which will positively affect it reproductive success (Stephens et al., 2009). Greater body condition among individuals correlates with the health of the population (Christiansen et al., 2020; Torres et al., 2022). Previous studies have linked body condition with fecundity, fetal growth, body length, and overall fitness (Christiansen et al., 2014, 2018, 2020; Williams et al., 2013; Stewart et al., 2022). Body condition has also been linked to temporal changes within a foraging season (Lemos et al., 2020; Bierlich et al., 2022). Quantifying spatial patterns in the body condition of these sentinel species could improve our ability to understand variability in whale health and underlying ecosystem changes that are otherwise difficult to detect, and could inform wildlife management decisions (Bossart, 2011; Christiansen et al., 2020; Torres et al., 2022; Barlow et al., 2023).
A variety of metrics have been used to quantify the body condition of cetaceans (Castrillon and Bengston Nash, 2020). Prior to the widespread use of UAS for field studies of marine mammals, studies of body condition relied on visual assessments of body condition from boat-based photo-identification images (Bradford et al., 2012) or examinations of deceased whales (eg. measurements of girth, blubber thickness, and percent lipid) (Lockyer et al., 1985; Haug et al., 2002; Fearnbach et al., 2020). The use of UAS-derived morphometrics of body condition have become increasingly common in recent years and rely on two primary approaches to characterize body condition. One approach focuses on quantifying dorsal body area or body width relative to body length, typically in the region where energy is accumulated along the body axis (Noren et al., 2019; Fearnbach et al., 2020; Lemos et al., 2020; Bierlich et al., 2022; Torres et al., 2022). An alternative approach is to quantify the body condition across the whole animal, by quantifying body volume relative to body length (Christiansen et al., 2018, 2020, 2021; Arranz et al., 2022; Russell et al., 2023). While the specific objectives of a particular study may favor one approach over the other, an advantage of the body volume approach is that is allows body mass, a key life history trait, to be estimated by combining body volume and body density estimates (Christiansen et al., 2019; Glarou et al., 2023; Christiansen et al., 2023).
Humpback whales (Megaptera novaeangliae) are a good candidate species to study spatiotemporal patterns in. Compared to many other baleen whale species in the North Atlantic, they are easy to study because they are abundant, conspicuous, easily identifiable at an individual level, and occur frequently in nearshore waters (Katona and Whitehead, 1981; Swingle et al., 1993; Stepanuk et al., 2021; Zoidis et al., 2021). Globally, humpback whales have been classified into fourteen distinct population segments (DPS) reflecting their breeding grounds (National Oceanic and Atmospheric Administration, 2016), and each DPS uses foraging grounds across a broad spatial extent. Humpback whales are generalist consumers that show variability in diet among foraging areas, from schooling fish to invertebrates (Weinrich, 1998; Friedlaender et al., 2009; Hazen et al., 2009). Humpback whales in different foraging regions are influenced by habitat-specific prey availability and anthropogenic pressures (Palsbøll et al., 1995; Stevick et al., 2006). The West Indies DPS is comprised of humpback whales that migrate from the breeding grounds near the West Indies to foraging grounds across the North Atlantic. Currently, humpback whales in the West Indies DPS use feeding grounds in the New York Bight, the Gulf of Maine, the Eastern Canadian Shelf, western Greenland, eastern Greenland, Iceland, and Norway (Katona and Whitehead, 1981; Baker et al., 1990; Hansen et al., 2019; National Oceanic and Atmospheric Administration, 2020; Brown et al., 2022; Kettemer et al., 2022; Heide-Jørgensen et al., 2023). The West Indies DPS exhibits strong site fidelity to specific foraging grounds, meaning that a whale seen in the Gulf of Maine will likely return to the Gulf of Maine, as documented in photo-identification and genetic studies (Palsbøll et al., 1995; Stevick et al., 2006). Humpback whales foraging in Iceland have also been connected to the Cape Verde DPS, which breeds off Northwest Africa (Wenzel et al., 2020).
The foraging habitat for West Indies humpback whales in the western North Atlantic has been impacted by climate-driven warming. Warming has been particularly rapid in the Gulf of Maine (Pershing et al., 2015), and has been documented across the Northwest Atlantic Shelf due to Gulf Stream intrusions (Gonçalves Neto et al., 2021; Seidov et al., 2021; Todd and Ren, 2023), as well as in regions farther north in Iceland and Greenland (Straneo and Heimbach, 2013; Våge et al., 2018; Karmalkar and Horton, 2021). Climate-driven changes in prey availability have been linked with phenological changes in habitat use for humpback whales (Ramp et al., 2015) and with both habitat use and reproductive success in North Atlantic right whales (Eubalaena glacialis), which rely on copepod prey in this region to accumulate energy reserves (Pendleton et al., 2012; Meyer-Gutbrod and Greene, 2014; Meyer-Gutbrod et al., 2015; Ganley et al., 2019; Meyer-Gutbrod et al., 2021). North Atlantic right whales have significantly poorer body condition than their Southern Ocean congeners, likely due to the combined effects of climate-associated changes in their prey and anthropogenic stressors (Christiansen et al., 2020; Stewart et al., 2022).
Assessing spatial variability in humpback whale body condition in the Northwest Atlantic could provide insight into regional differences impacting whale health for a population that has shown substantial recovery in recent decades (Best, 1993; National Oceanic and Atmospheric Administration, 2020). Historically, the whaling industry decimated humpback populations until the International Whaling Commission (IWC) banned harvest of North Atlantic humpback whales in 1955, in part due to dwindling populations, diminishing demand, and public pressure to conserve whales (Best, 1993). Since the decline of commercial whaling, humpback populations have recovered significantly enough that 10 of the 14 DPS, including the West Indies DPS, were delisted from the United States Endangered Species list in 2016. The West Indies DPS is increasing with an annual growth rate of approximately 3% (Stevick et al., 2003), and whales in this DPS have been observed foraging in new regions in recent years (Brown et al., 2018), possibly in association with population growth. However, the cumulative impacts of entanglement in fishing gear and vessel strikes, as well as other anthropogenic activities, continue to threaten humpback whales globally (Van Der Hoop et al., 2013, 2016, 2017). Elevated numbers of strandings prompted NOAA to declare an Unusual Mortality Event (UME) for humpbacks along the Atlantic coast of the U.S. in the same year that the DPS was delisted (National Oceanic and Atmospheric Administration, 2016, 2022). Fishing pressure and climate-driven changes have altered the abundance of baleen whale prey in the Northwest Atlantic, specifically Iceland, Greenland and the Gulf of Maine (Nye et al., 2009; Mills et al., 2013; Pershing et al., 2015; Edwards et al., 2021), but the population-level impacts on baleen whales are not yet well understood.
Comparing body condition for humpback whales at foraging grounds across the Northwest Atlantic could determine whether whales are accumulating more energy reserves in certain foraging areas. These areas can serve as spatially comparative microcosms of rapid climate-driven change and anthropogenic use occurring in North Atlantic. Here we assess how the body condition, and body mass of humpback whales from the West Indies DPS vary across foraging grounds in the western North Atlantic, using morphometric measurements obtained by UAS from the New York Bight, the Gulf of Maine, Iceland, and Greenland.
For any observed differences in body condition between regions, we assessed those differences in mass (kg) by incorporating density estimates from recent tagging studies to provide a meaningful and easily interpretable metric with direct relevance for physiology and bioenergetics.
UAS images of humpback whales were obtained to measure the body condition of individual whales. Aerial videos and photographs for humpback whales were taken using UAS under marine mammal scientific research permits and flown by licensed FAA or Transport Canada UAS pilots where required, in study sites representing four foraging areas for humpback whales in the western North Atlantic: the New York Bight, the northern Gulf of Maine, Greenland, and Iceland (Figure 1). We note that data collection specifically occurred along the southeastern coast of Long Island in the New York Bight, the northern Gulf of Maine near the southern Bay of Fundy, western Greenland, and the north and western fjord systems in Iceland (Figure 1). For simplicity, we further refer to these regions as the New York Bight, the Gulf of Maine, Greenland, and Iceland. Data collection occurred between 2018 and 2022 using the UAS and camera models shown in Table 1. In each location, UAS were flown from small research vessels and/or from land during daylight hours with minimal wind (< 15 knots) so that clear images of whales at the surface could be obtained. Altitudes at which the UAS were flown (Table 1) are expected to have minimal behavioral impact on whales (Christiansen et al., 2016b; Laute et al., 2023). Lateral photographs of each measured humpback whale’s flukes and/or dorsal fins were taken from a boat and used for photo-identification to determine if individual whales were re-sighted and/or had been measured previously (Katona and Whitehead, 1981). Aerial identification of body scars was also used to verify re-sighting of individual whales.
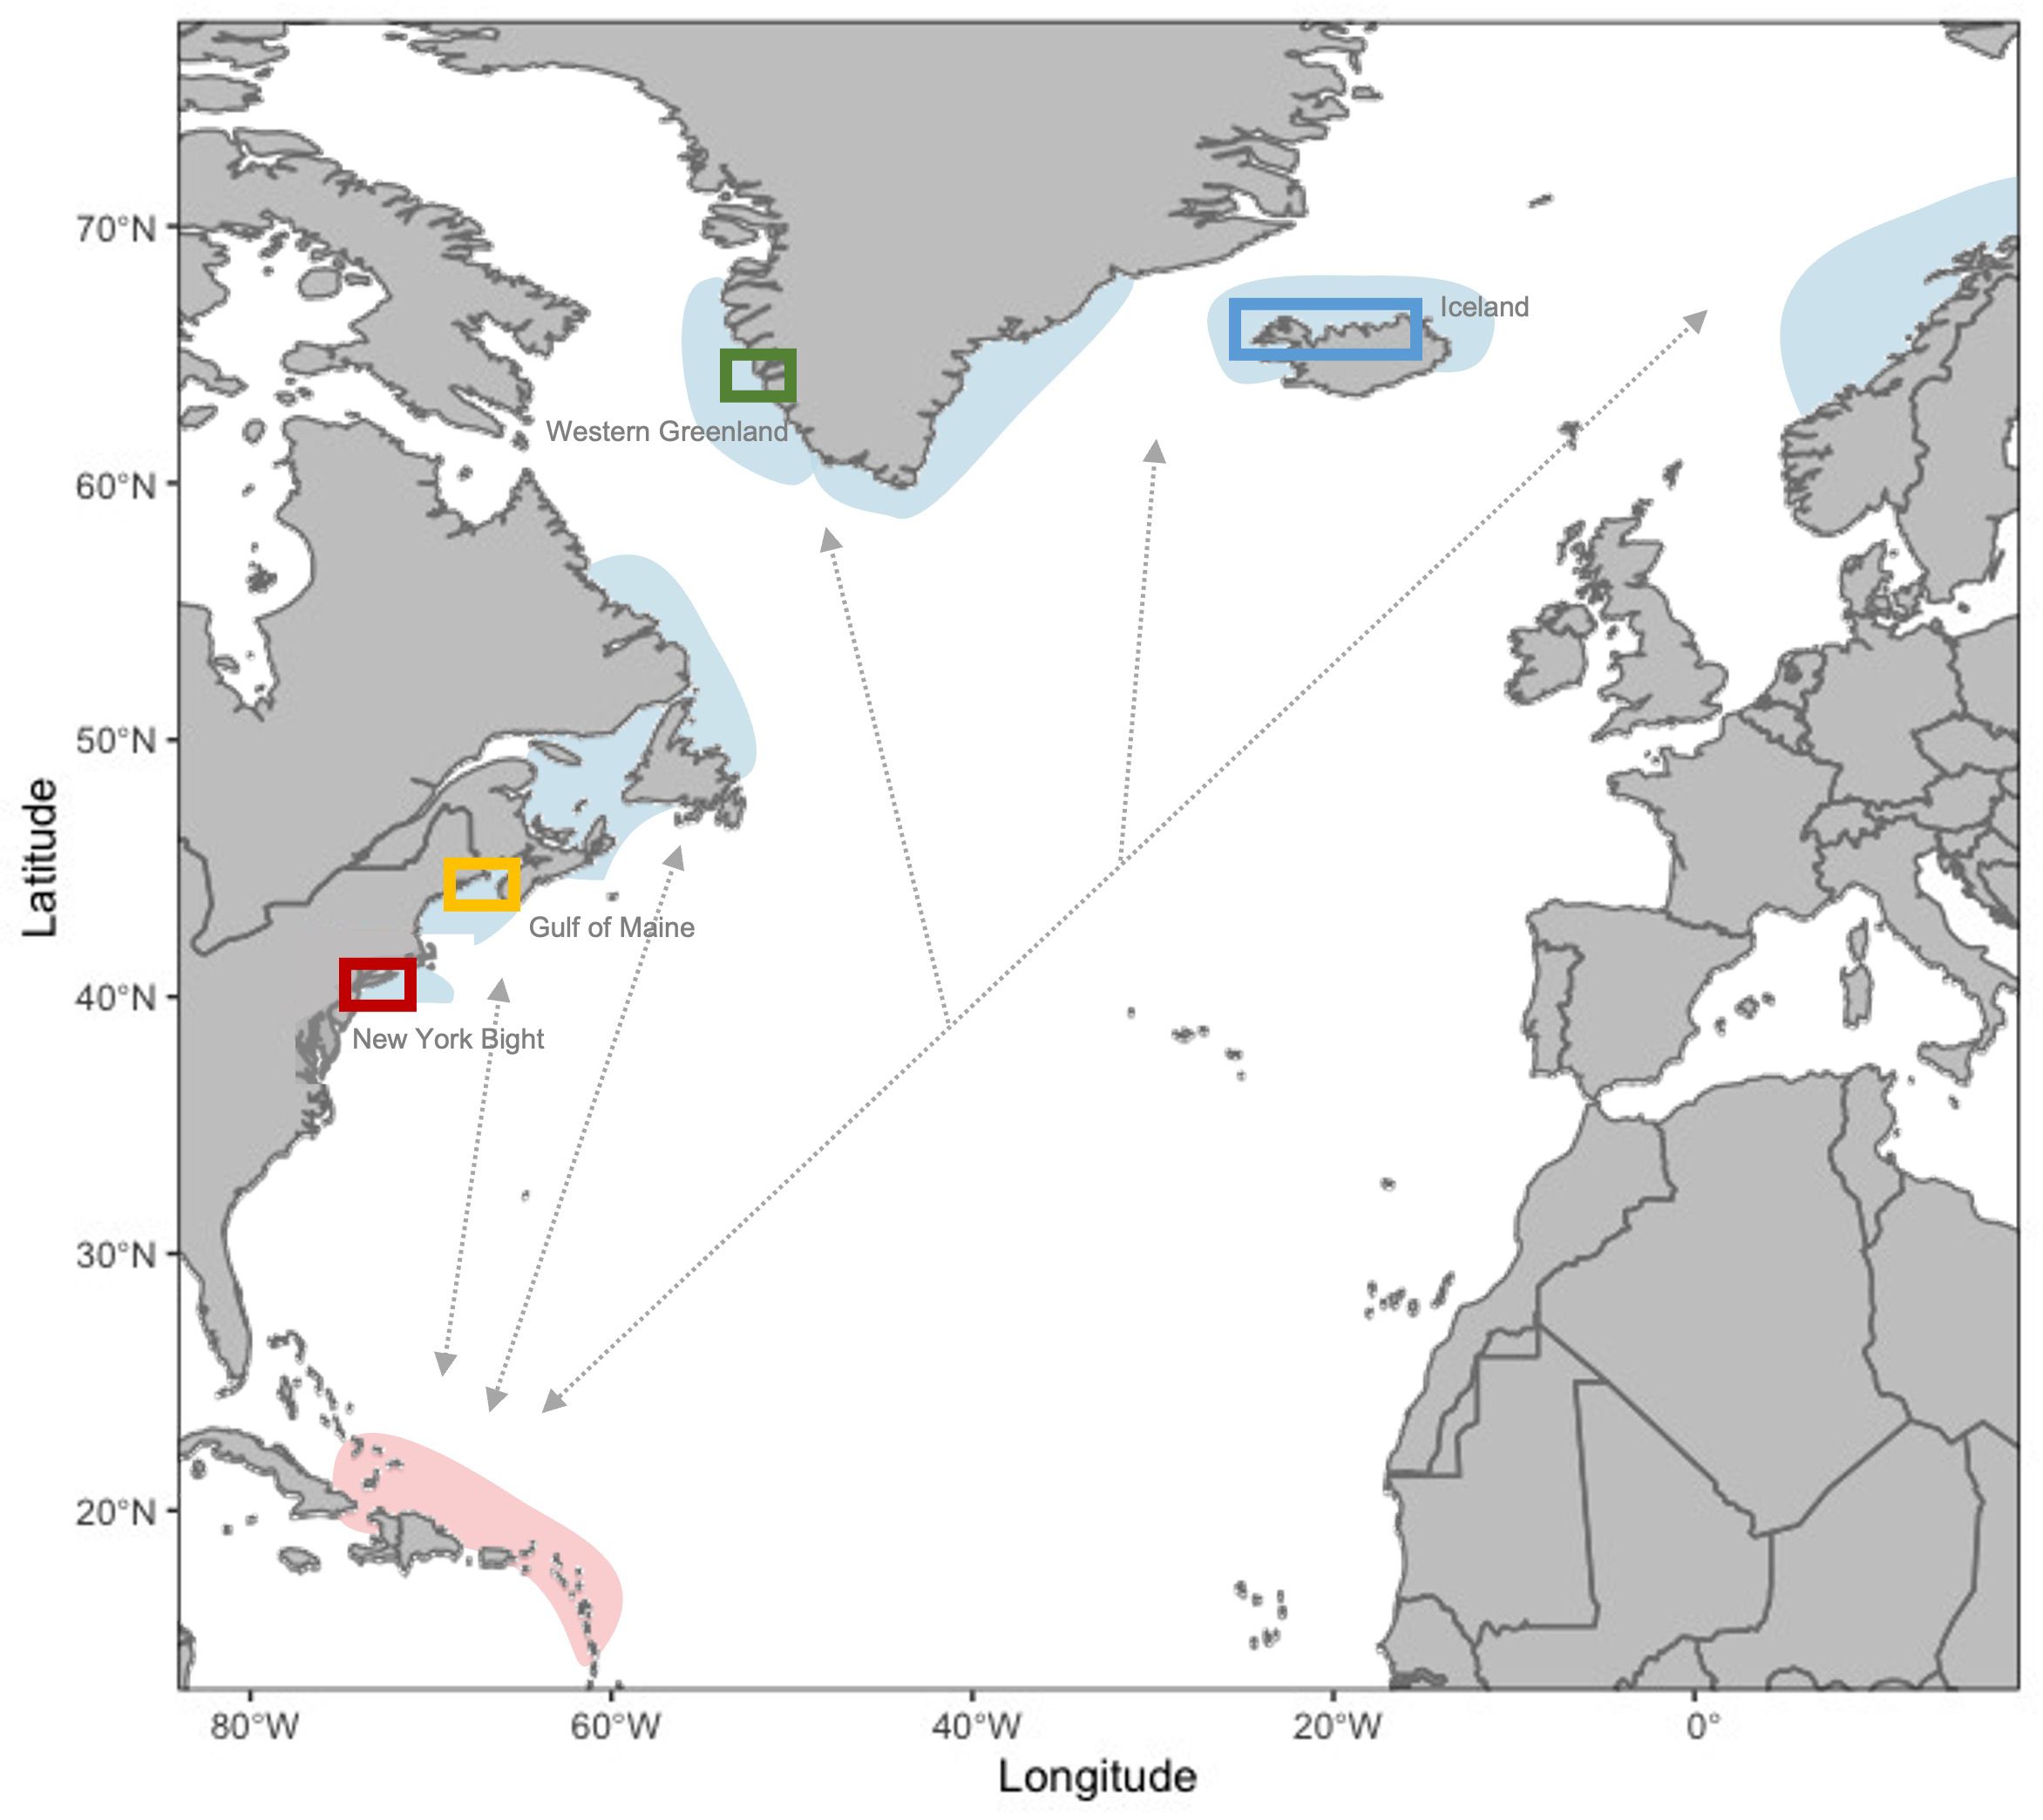
Figure 1 Map of known foraging grounds (blue shading, representative of general area) and the breeding ground (red shading, representative of general area) for the West Indies Distinct Population Segment of humpback whales relative to general areas where UAS imagery and whaling data were collected (colored polygons). Gray arrows are representative of population connectivity but do not indicate known migratory pathways. Study sites indicated in polygons are as follows: New York Bight (red box), Gulf of Maine (yellow), Greenland (green), and Iceland (blue). [Figure adapted from MacKay (2015)].
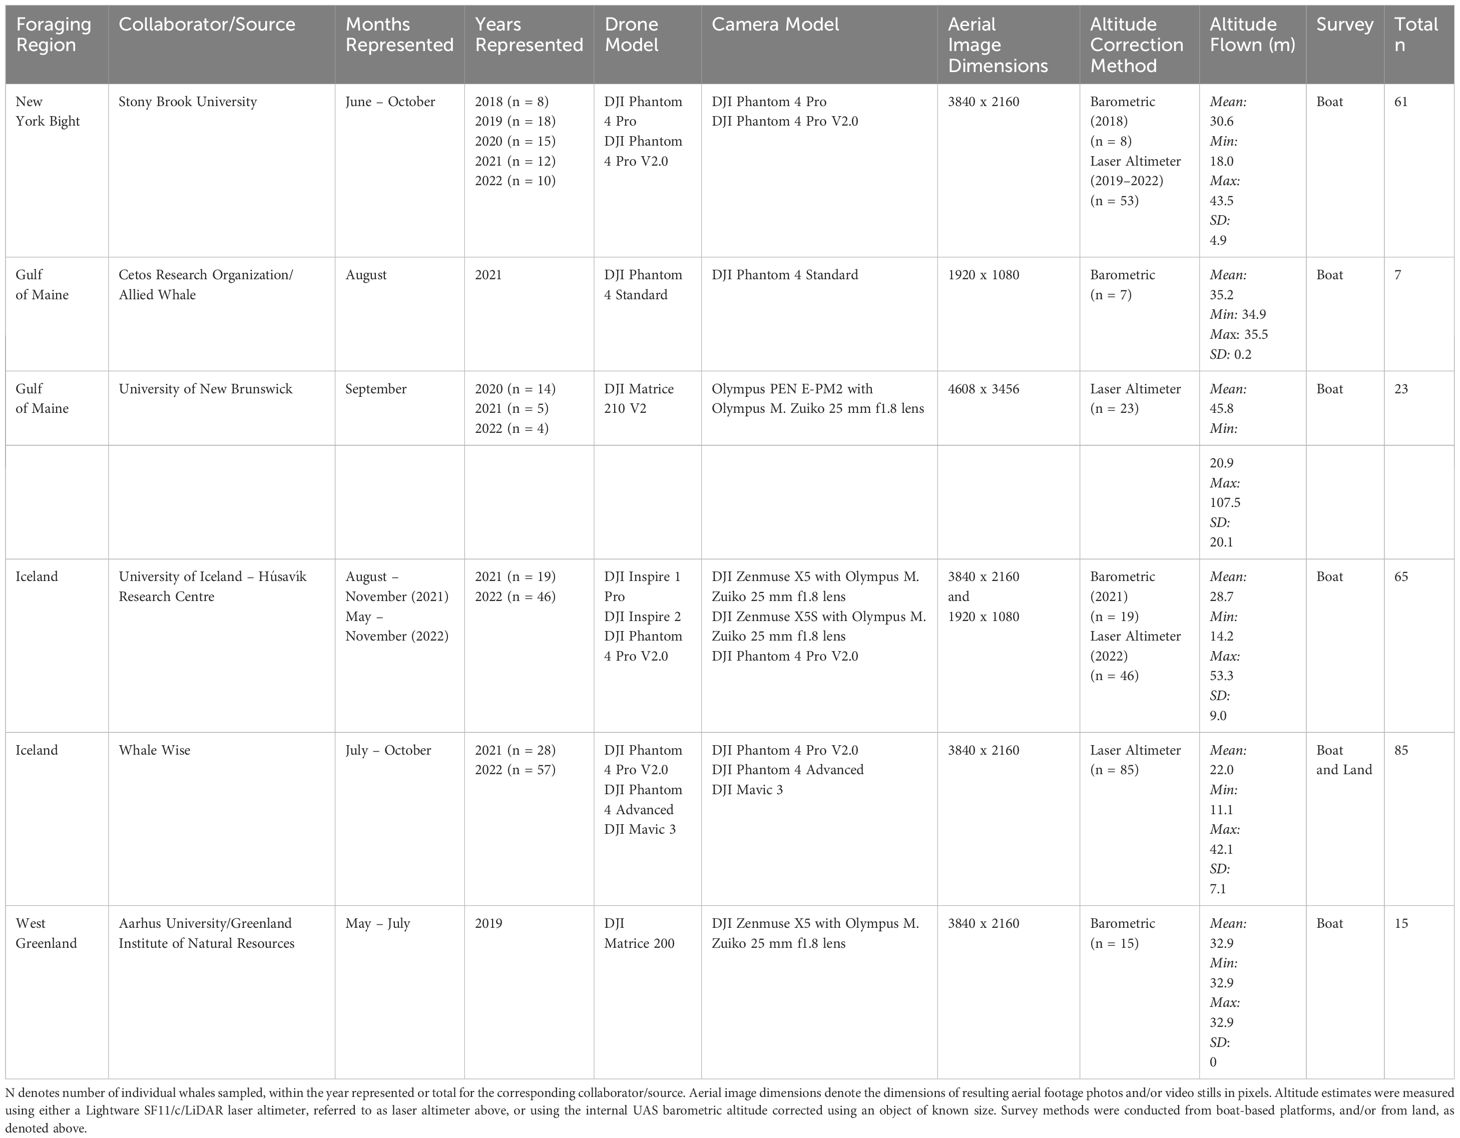
Table 1 Summary of North Atlantic UAS Data Sources.
Accurate altitude measurements are key to obtaining reliable measurements of humpback whale morphometrics used to assess body condition (Torres et al., 2022; Barlow et al., 2023; Bierlich et al., 2023). Altitudes were estimated using either a Lightware SF11/c/LiDAR laser altimeter or using the internal UAS barometric altitude corrected by the graphical user interface Collatrix using objects of known size (Table 1; Section 2.2; Durban et al., 2015; Dawson et al., 2017; Burnett et al., 2018; Bird and Bierlich, 2020). Methods for incorporating uncertainty from different drone models and means of measuring altitude are described in 2.2.1.
Aerial footage (photos and/or video) was compiled for comparative analyses of body condition across foraging areas. When videos were provided, video frames/stills were taken in which the whale was in focus and positioned near the surface with a straight body, minimal pitch, minimal roll, and minimal arch with a clearly visible body width and length (Christiansen et al., 2016a; Stepanuk et al., 2021). Video frames and still aerial images (collectively referred to hereafter as aerial images) were evaluated for adequate quality on a scale of 1 to 3 according to criteria defined by Christiansen et al. (2018). Two analysts scored images; images with a score of 1 (good) or 2 (medium) for all categories were used for further analysis, while images with a score of 3 (poor) in any category were excluded from further analysis. Image scores were summed; the highest quality image representing an individual from all sightings was selected for measurement. There were no whales within the dataset that were photo-identified in more than one foraging ground. When individual whales were observed more than once on a foraging ground, a single image for each individual was selected to preserve independence of measurements in statistical analyses. If two images of the same individual whale had the same tied score, the final image was randomly selected. If two analysts’ scores disagreed as to whether an image could be used for analysis, a third analyst evaluated the images as a tie-breaker. After quality scoring, each whale (N=256) was measured as described below. Lens distortion within an image was not explicitly corrected, as Bierlich et al. (2021b) found it introduced negligible error in pixels.
MorphoMetriX, a graphical user interface (v1.0.2, accessed May 31, 2022) (Torres and Bierlich, 2020), was used to measure total body length and widths along the body axis. Using altitude, pixel pitch, and focal length inputs, MorphoMetriX calculates ground sampling distance and scales pixels measured to meters using a modified equation from Burnett et al. (2018):
in which GSD is ground sampling distance, d is pixel pitch (pixel dimension), H is altitude, f is camera focal length, ϵh is the distance between the ocean surface and lens (Burnett et al., 2018; Torres and Bierlich, 2020). Altitudes were obtained from either UAS equipped with a Lightware SF11/c/LiDAR laser altimeter, in which the aerial image was matched to altimeter data by aligning video time to flight time or flagging laser altimeter data when an image was taken, or UAS barometric altitude, which was corrected by graphical user interface Collatrix using objects of known size, further referred to as corrected barometric altitude (Dawson et al., 2017; Burnett et al., 2018; Bird and Bierlich, 2020). Camera focal length (f) was determined by manufacturer camera specifications (Table 1).
Many UAS systems, particularly the DJI Phantom 4 Pro and the DJI Inspire 1, do not utilize the entire sensor width when capturing video footage, resulting in a slight crop of the image (this can be seen with the naked eye when switching from photo to video mode on the UAS remote controller screen). To quantify this crop factor in video collection, 3 flights were conducted over a known object (a wooden plank) in a flat area (a football field) at altitudes ranging from 10 to 100 m at increments of 5 meters using the DJI Phantom 4 Pro and the DJI Inspire 1. Both photographs and video footage of the known object were collected during the flights. Possible pixel pitch values, determined by adding/subtracting from the manufacturer-provided pixel pitch value, were tested to calculate the smallest measurement error when scaling video stills. The pixel pitch for the full sensor width is 0.0034375 for the DJI Phantom 4 Pro, and 0.004505 for the DJI Inspire 1 according to manufacturer camera specifications. Pixel pitch (d) adjusted for the crop factor was found to be 0.0033 and 0.0037 respectively. The adjusted pixel width value was verified by measuring other objects of known size (research boat swim platform), and subsequently used to scale whale measurements collected by applicable drone models.
Using MorphoMetriX, the total body length, measured from the tip of the rostrum to the notch of the tail fluke, of each whale was quantified. Body widths were measured at 5% intervals along the body axis of the animal from the rostrum to the peduncle (Figure 2; 0–85% of total body length; Christiansen et al., 2016a). For some aerial images with suitable image quality, certain body widths could not be measured reliably due to factors such as obstruction from a whale blow, water ripples, glare, or low-contrast areas obscuring one part of the animal’s body. Widths could not be measured for these reasons in 18 individuals. Obstructed widths were excluded, and estimated using the 3D model described below. For all individuals, at least 14 of 17 widths could be measured (8 whales had 1 width not measured, 9 whales had 2 widths not measured, 1 whale had 3 widths not measured).
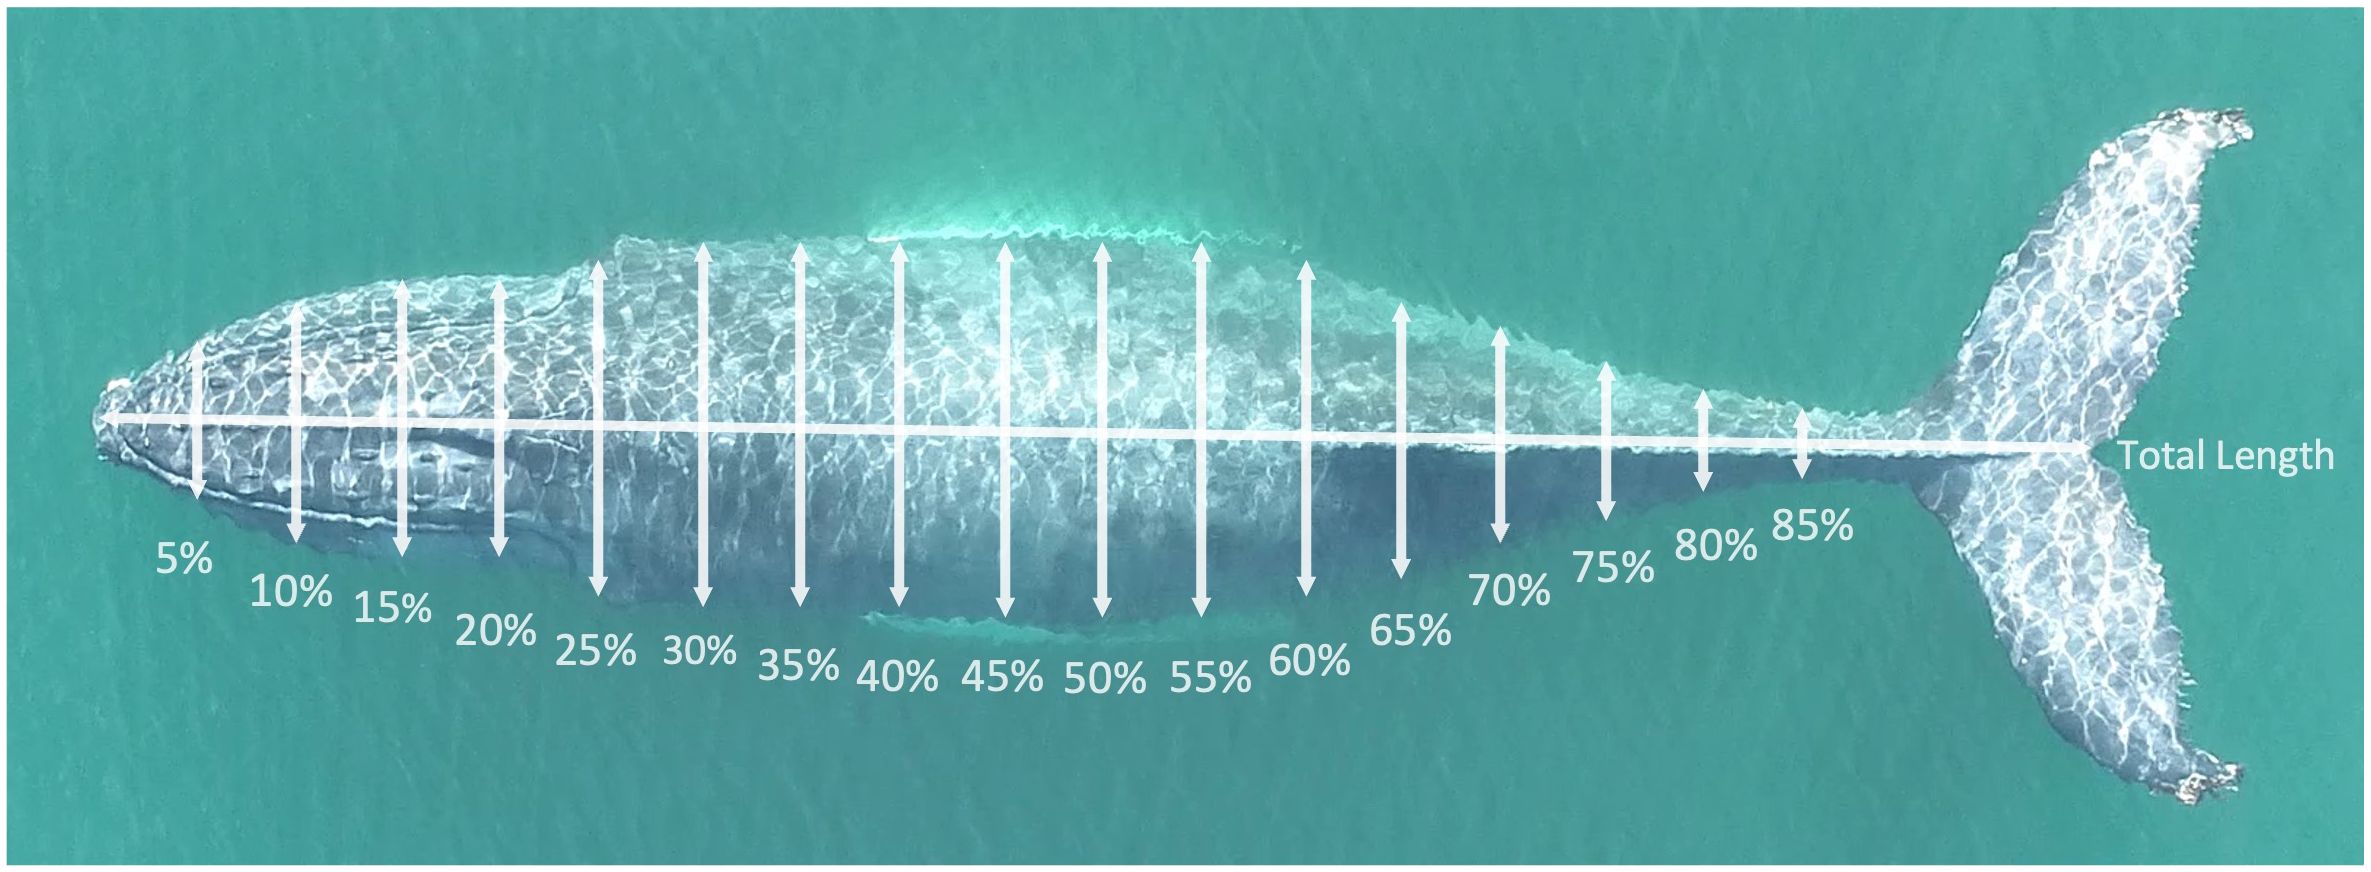
Figure 2 Width measurement locations along the body axis of a humpback whale photographed in the New York Bight. Photo credit to Stony Brook University Thorne Lab.
Measurements of body length and widths for each whale were used to scale a 3D model of a humpback whale to estimate the total body volume of each individual (Hirtle et al., 2022). Body volume provides a holistic metric of energy stores across the body. 3D models conserve external morphology and can thus be used to estimate body volume with minimal error using a small number of width measurements (Hirtle et al., 2022).
Error in UAS-derived morphometric measurements can be introduced at, and propagated through, several points in the measurement process. Error can be introduced by analyst bias when measuring lengths and widths. Variation between images, whether in image quality or position of a whale, can also introduce measurement error (Christiansen et al., 2018; Bierlich et al., 2021a). Poor image quality can obscure key pixels for measurement such as the rostrum or fluke notch, and deviations in whale body posture such as rolling, arching, or pitching can distort width measurements (Christiansen et al., 2018). Pixels measured from UAS images are scaled using ground sampling distance Equation (1) (Burnett et al., 2018). Inaccuracies in ground sampling distance parameters, particularly altitude, can introduce error in scaling from pixels to real-world units (Bierlich et al., 2021a).
To minimize analyst bias, a single analyst measured all images used throughout the study.
To account for variation among multiple images for an individual, and variation in drone model altitude estimation, we incorporated and propagated both sources of error by using a bootstrapping analysis as described below (similar to Christiansen et al., 2018).
We estimated the error introduced from variation among images by measuring multiple images of the same individual whale. Of the 256 individual whales with suitable images, 90 had multiple images that fit scoring criteria (Section 2.1, Christiansen et al., 2018). Of the 90 individuals with multiple images, 53 individuals had 2–4 additional images, and 37 individuals had 1 additional image. A total of 262 images were used to estimate image variation error. All foraging regions, and all drone models except the DJI Mavic 3 were represented within the multiple images dataset. The Lightware SF11/c/LiDAR laser altimeter was used to estimate the altitude for 189 images, and the corrected barometric altitude method (Burnett et al., 2018; Bird and Bierlich, 2020) was used for 73 images. Each individual in an image was measured as described in 2.1. The differences in total length and width measurements between the best scoring image and additional images of each whale were calculated (Figure 2). Measurement difference was sampled with replacement 1000 times to form an error distribution for the total length and each 5% width for each drone model, except the DJI Mavic 3, DJI Inspire 1, and DJI Inspire 2 in which multiple measurements were not available or sufficient to form an error distribution (n = 0, 1, and 2, respectively). Supplementary Table 1 details mean errors for total length and all 5% widths for each drone model. To incorporate and propagate this error into morphometric measurements, image error from each respective length and width distribution was randomly sampled with replacement 1000 times, assuming a normal distribution for each error. This randomly sampled error, derived from the error distribution corresponding to the drone model used, was added to an individual whale’s respective measurements from the best-scoring image, resulting in 1000 estimated measurements for each of the 256 whales. Multiple measurements from the DJI Mavic 3 were not available, and an insufficient number of measurements were available for the Inspire 1 and Inspire 2, so an error distribution calculated from the pooled multiple measurement data was used for morphometric measurements collected using the aforementioned models.
The use of different UAS models within a study may contribute to variation in image quality (addressed above), as well as to altitude estimation. With the continuous advancement of commercially available UAS technology and progressing knowledge, long term morphometric datasets that cover multiple study sites or time periods are likely to incorporate a variety of drone models (Christiansen et al., 2018; Barlow et al., 2023, 2020; Glarou et al., 2023; Torres et al., 2022). It is important to address and consider the uncertainty associated with the use of different models to enhance the robustness of the study’s findings (Christiansen et al., 2018; Barlow et al., 2023; Glarou et al., 2023; Torres et al., 2022).
For each UAS model used in the study (Table 1), we assessed measurement accuracy using an object of known size. We treated the DJI Phantom 4 Pro with a Lightware SF11/c/LiDAR laser altimeter and the DJI Phantom 4 Pro without a laser altimeter as two different UAS models, totaling to 8 UAS models (DJI Inspire 1, DJI Inspire 2, DJI Matrice 200, Matrice 210, DJI Mavic 3, DJI Phantom 4 Pro with laser altimeter, DJI Phantom 4 Pro with barometric altimeter, DJI Phantom 4 Standard).
To assess altitude measurement accuracy for each UAS model, we used each UAS model to collect images of an object of known size at relevant altitudes (Supplementary Table 2). For UAS models that had the Lightware SF11/c/LiDAR laser altimeter attached, an object of known size was measured using the corresponding laser altimeter value. These models include the DJI Inspire 2, DJI Matrice 210, DJI Mavic 3, and DJI Phantom 4 Pro with the laser altimeter. For UAS using barometric altitude (DJI Inspire 1, DJI Matrice 200, DJI Phantom 4 Pro with barometric altimeter, DJI Phantom 4 Standard), barometric altitude was first corrected using Collatrix (Burnett et al., 2018; Bird and Bierlich, 2020) to better approximate and correct altitude. Bierlich et al. (2021b) found that altitude error does not necessarily scale linearly, and therefore is a limitation of the Burnett et al. (2018) correction method, but it does reduce some uncertainty in barometric altitude estimates.
The known-size object in each image was measured in pixels first and scaled to meters using the altitude derived from the respective laser altimeter or Burnett et al. (2018) corrected barometric altitude, and the focal length and adjusted pixel dimension to each UAS model as described in Equation (1). We calculated the true UAS altitude using an algebraically rearranged ground sampling distance equation and inputs of the true object’s length (m), the pixels measured, focal length, and adjusted pixel dimension. Altitude error was determined by calculating the difference in true UAS altitude and altimeter-derived altitude. A distribution of measurement error for each drone model, hereafter referred to as the altitude error distribution, was constructed by randomly sampling with replacement 1000 times. Altitude error distribution for each drone model is described in Supplementary Table 2. Importantly, the altitude error is the distance (m) in which the altitude of the UAS varies, which is then scaled using the GSD Equation (1). The altitude error is not the distance in which measurement of the known object varies (measurement error), though both are provided in Supplementary Table 2 for full comprehension of the error.
For each whale, altitude error was randomly sampled from the altitude error distribution corresponding to the UAS model in which the whale was initially measured. Randomly sampled altitude error was added to the respective laser altimeter or Burnett et al. (2018) corrected barometric altitude, and hereafter referred to as the adjusted altitude. The adjusted altitude, focal length, and pixel dimension was used to scale the measured pixels for each whale to meters. By scaling all measurements with the adjusted altitude, altitude error is incorporated into measurements which altered the absolute size, but not the shape (width) of the whale. Note that randomly sampled errors were both positive and negative.
All bootstrapped morphometric measurements were then used to scale a 3D model to estimate body volume, effectively propagating altitude error to volume error. These measurements were then randomly sampled with replacement for each individual to form 1000 bootstrapped populations of 256 whales, hereafter referred to bootstrapped populations.
To assess how body condition varies by foraging ground across the North Atlantic for the West Indies DPS, we constructed the allometric relationship between total length and total body volume (Christiansen et al., 2018, 2020) for each of the 1000 bootstrapped populations. The expected log-log relationship between total length and total body volume of humpback whales is represented by Equation (2):
in which BVexp,I is the expected body volume of whale i (m3), BLi is the body length of whale i, and are the intercept and slope of all measured whales (Christiansen et al., 2020). We used this relationship to calculate an individual whale’s body condition index (BCI), quantified as the residual of the expected value above for a given individual, divided by the expected body volume [from all individuals, Equation (3)] (Christiansen et al., 2018).
Where BCIi is the BCI for ith whale, BVobs,i is the observed (measured) body volume of whale i (m3), and BVexp,i is the expected (average) body volume for whale i (Christiansen et al., 2018). BCI provides a holistic metric of body condition that accounts for changes with body volume relative to body size, and therefore allows body condition to be compared across whales of different sizes (lengths). BCI is a metric that assesses an individual’s body condition relative to other whales within the sample population, which makes it appropriate for comparison of multiple groups (in this case, foraging regions) within a single population (the West Indies DPS, or combined North Atlantic foraging grounds data). A positive value of BCI indicates that an individual whale has a better body condition relative to the average whale of the same length in the sample population (the combined North Atlantic foraging grounds); a negative BCI indicates lower than average body condition for an individual. Importantly, because BCI is standardized to total length, BCI will not inherently be greater for a longer individual. BCI will only be a greater value if the relative volume to length relationship is higher than the population average. Individuals with a better body condition would have more energy stores available for critical, energy-intensive processes such as migration, growth, and reproduction (Christiansen et al., 2018, 2020).
We quantified body mass in order to describe any observed differences in body condition between foraging areas in terms of a bioenergetically meaningful metric. Estimating whale body mass has traditionally been very challenging due to their large body size, but recently a small number of studies have estimated body mass of large whales by incorporating body volume estimates with estimates of body density (Christiansen et al., 2019, 2023, 2024; Glarou et al., 2023). Recent tagging studies provided an estimate of average humpback whale body density in the West Indies DPS (1037.2 ± 3.0 kg/m3; mean ± 95% CI) (Aoki et al., 2021). We derived the standard deviation (SD = 11.75) from their given confidence interval using the margin of error formula. Body tissue density was randomly sampled with replacement, which incorporated variability on density estimates by assuming a normal distribution. We estimated body mass (kg) for individual humpback whales by multiplying body volume values (m3) produced by integrating morphometric measurements with the 3D model, and randomly sampled body tissue density as in Glarou et al. (2023).
For each of the 1000 bootstrapped populations, we used standardized major axis (SMA) regression to assess regional differences in the log-log relationships between the total length and total body volume of humpback whales, and the goodness of fit for each foraging region. SMA is a line-fitting method which assesses how two variables scale, rather than testing the ability of one variable to predict another (Warton et al., 2006). While BCI provides a metric that can be compared across whales of different body sizes, SMA allows the relationship between body volume and total length to be compared across foraging regions. A significant difference in slope between SMAs would reflect different relationships between body volume and body size between regions, which would imply that whales in different foraging areas were accumulating energy reserves differently relative to their body size. If there is no significant difference in slope between SMAs, a common slope can be used to test for differences in elevation (Warton and Weber, 2002; Warton et al., 2006). In this case, a significant difference in elevation would indicate higher body condition (higher body volume for a given body size) in one of the foraging regions. SMAs were constructed using the “smatr” package in R (Warton et al., 2012, 2018; R Core Team, 2021).
For each of the 1000 bootstrapped populations, we used SMA to assess regional differences in mass (kg) using log-log relationships between body mass and total length. For bootstrapped populations with a common slope and significant differences in elevation amongst foraging regions, we used differences in elevation to quantify differences in body mass. Specifically, we obtained the mean vertical shift in the log-log allometric relationships and exponentiated it to derive the percent difference in mass among foraging areas. Due to the common slope of the log-log allometric relationships, the proportional change in elevation was consistent across all total lengths (Warton et al., 2018). This indicates that the body mass in one of the foraging areas was proportionally higher in comparison to the other foraging areas.
In addition, we assessed differences in the BCI among foraging regions for each of the 1000 bootstrapped populations. We first assessed whether there were differences in energy reserve accumulation due to age class (juvenile vs. adult) in each study site using a Welch’s t-test. Whales measured to be a total length of 11.47 meters or less were categorized as juveniles, and whales with a total length greater than 11.47 m were considered adults (Bierlich et al., 2022) (Supplementary Figure 3). Note that in the absence of specific length-at-age data from the West Indies DPS, the 11.47 m threshold for juveniles is derived from a notably longer population of humpback whales from the Western Antarctic Peninsula, and thus could be an overestimate. We further assessed age class using an mixed-effects model – an Analysis of Variance (ANOVA) with foraging region as a random effect to test for a difference in BCI between age classes [BCI ~ Age Class + Random (Foraging Region)]. Based on results, we did not consider age class in further analyses.
Histograms and Q-Q plots indicated that the data were normally distributed, and we therefore assessed differences in BCI between foraging areas using an Analysis of Covariance (ANCOVA). We included a covariate for Julian day, further referred to as day of year (DOY) to account for the potential effects of the seasonal accumulation of energy reserves, and year as a second covariate to account for potential interannual differences in BCI between 2018 and 2022.
We identified significant differences between foraging areas and corrected for multiple comparisons using a post hoc Tukey Honestly Significant Difference (HSD) test. We interpreted effect size as in Cohen (1988), wherein values of η2 less than 0.010 represent no effect, those between 0.010 and 0.060 represent a small effect, those between 0.060 and 0.14 represent a moderate effect, and those greater than 0.14 represent a large effect.
To further assess effects of temporal variability in sampling between foraging areas, we conducted an analysis of BCI using only data from August and September from all bootstrapped populations (n = 131; Table 2). This analysis excluded Greenland, as data were not collected in the region during August and September.
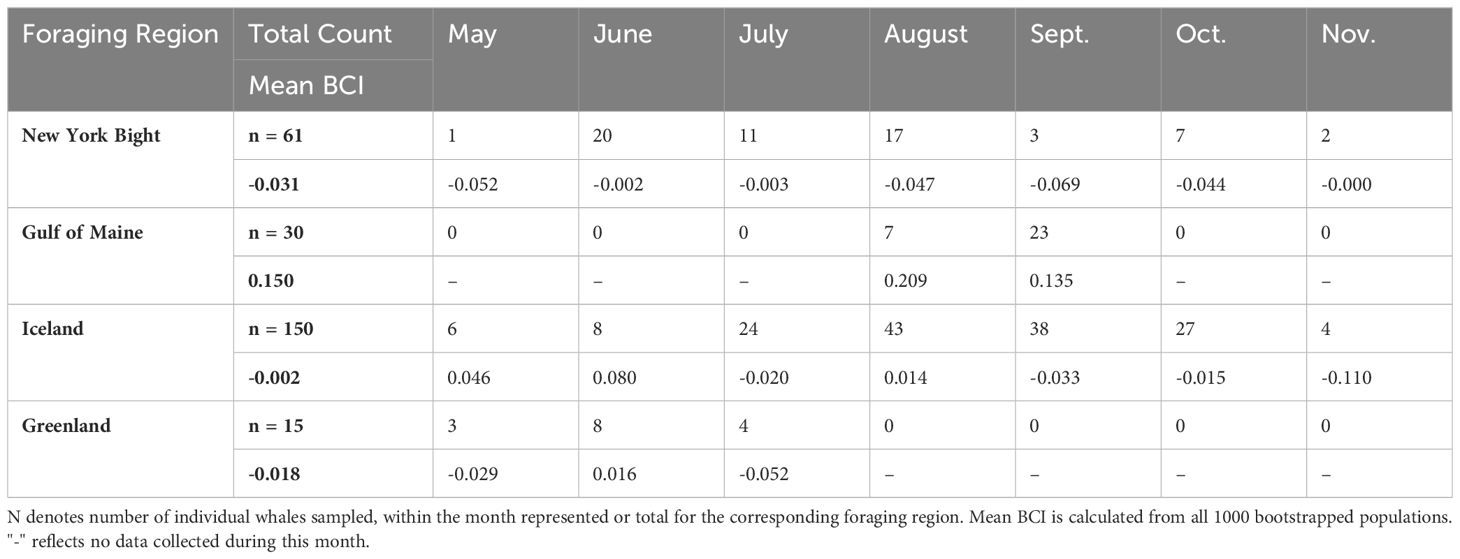
Table 2 Summary of UAS Data Collected with Mean BCI By Region and Month.
We conducted an additional analysis using raw pixel measurements not scaled with UAS-model ground sampling distance parameters to further validate that our results were not due to uncertainty introduced by various UAS models. BCI was calculated from a log-log relationship between total length (pixels) and scaled body volume estimates (pixels3). We assessed differences in BCI between foraging areas using an Analysis of Covariance (ANCOVA) with DOY and year as covariates. This secondary assessment of body condition validated results in the primary analysis (Supplementary Table 3, Supplementary Figures 1, 2).
We measured the total length and body volume of 256 West Indies DPS humpback whales in 4 foraging regions in the Northwest Atlantic (Figures 1, 3A, B; Tables 1, 2) using aerial imagery from UAS obtained between 2018 and 2022. We incorporated image variation and altitude error by randomly sampling with replacement, resulting in analyses on 1000 bootstrapped populations.
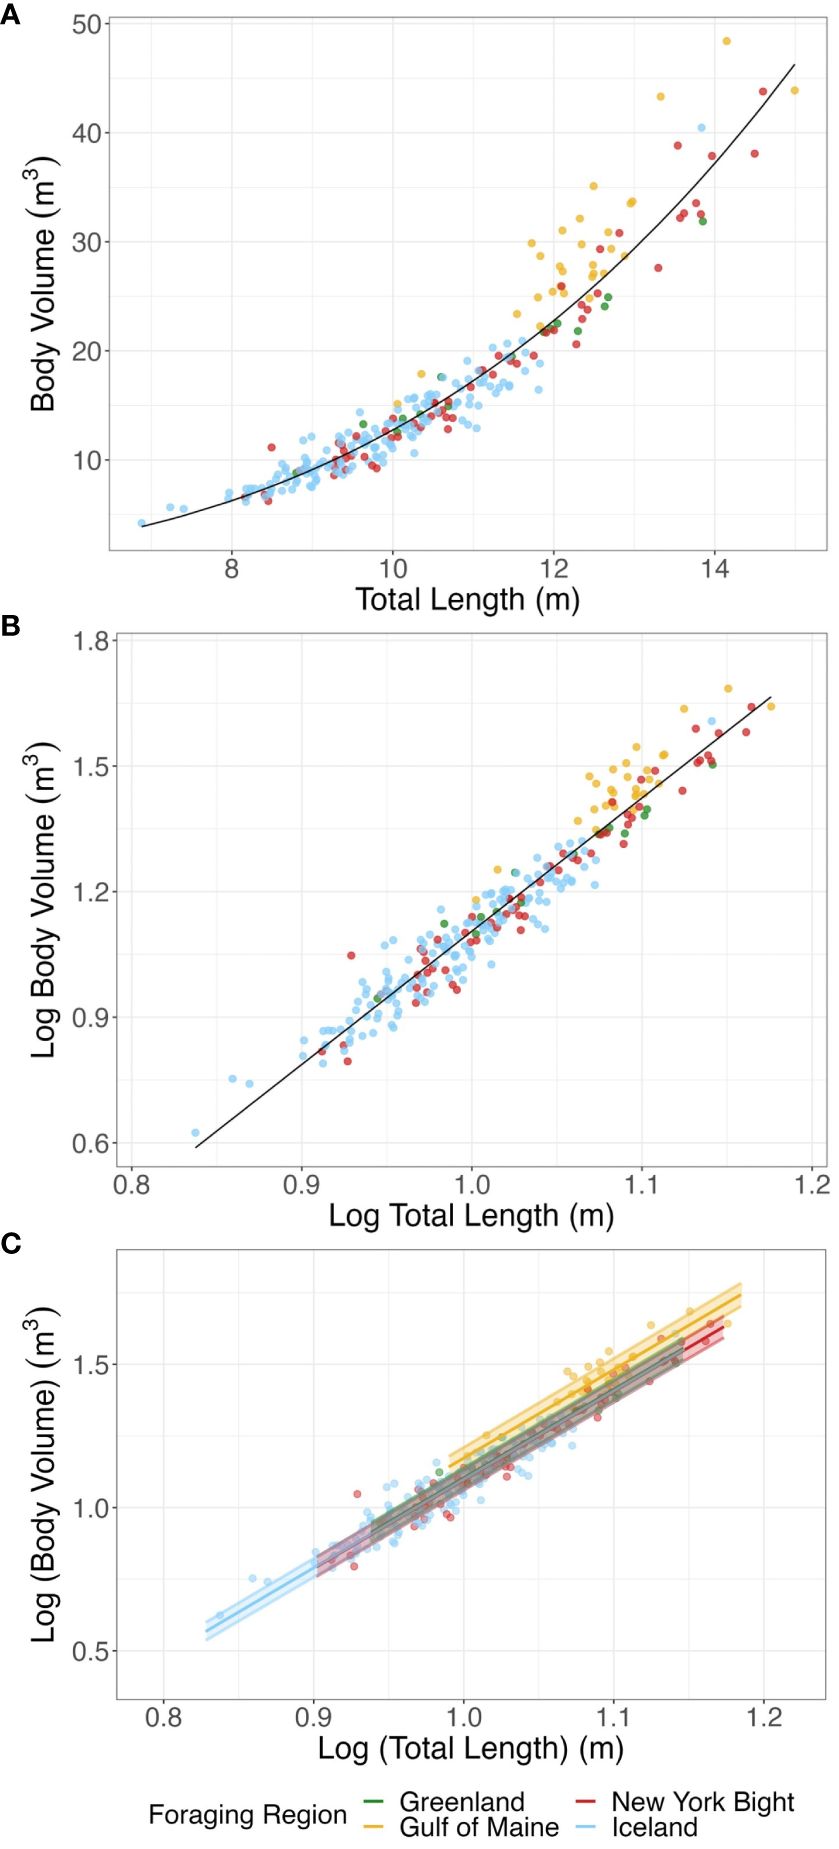
Figure 3 (A) Mean total length (m) and mean body volume (m3) for bootstrapped humpback whale measurements. (B) Mean log total length (m) and mean log body volume (m3) for bootstrapped humpback whale measurements. The solid line represents expected values of the log-log relationship, from which BCI is derived. . (C) SMA regressions of log total length (m) and log body volume (m3) for foraging regions, with 95% confidence interval of elevation. The SMA for Iceland data was so similar to those from the Greenland and New York Bight that the Iceland line is obscured by that of these two study areas. Points represent mean total length and mean total body volume for bootstrapped individuals. Common Mean Elevation: New York Bight, -1.991; Gulf of Maine, -1.914; Iceland, -1.988; Greenland, -1.983.
The SMA regressions of the log-log relationship of body volume to total body length were significant for all foraging regions (New York Bight: R-squared > 0.950, p< 0.001; Gulf of Maine: R-squared > 0.757, p< 0.001; Greenland: R-squared > 0. 962, p< 0.001; Iceland: R-squared > 0.891, p< 0.001). For 56.9% of bootstrapped populations analyzed there was no significant difference in the slope of SMAs between the different foraging regions, indicating similar log-log relationships between body volume and body length across foraging areas. Groups with significantly different slopes cannot be compared further, so we focused analyses of elevation on the bootstrapped populations for which there was no significant difference in slope. We found significant differences in elevation between foraging regions; the Gulf of Maine showed significantly higher elevation than the other regions, indicating that humpback whales foraging in the Gulf of Maine had a higher body volume for a given body size (Figure 3C; GOM and Greenland p< 0.001, GOM and Iceland p< 0.001, GOM and New York Bight p< 0.001; all other pair-wise differences p ≥ 0.553; pair-wise differences in elevation adjusted for multiple comparisons).
Differences in mass between the Gulf of Maine and the New York Bight, Iceland, and Greenland derived from the SMA log-log relationships between mass and body length found a mean common slope of 3.087 (95% CI: 3.069 – 3.104) (Supplementary Figure 4) in the same 56.9% of bootstrapped populations. The Gulf of Maine had a bootstrapped mean elevation of 1.101 (95% CI: 1.079 – 1.123), while the New York Bight, Iceland and Greenland had mean elevations of 1.024, 1.026, 1.031 (95% CI for each region respectively: 1.003 – 1.045; 1.006 – 1.046; 1.011 – 1.052). This reflects a mean vertical shift of 0.074 (95% CI: 0.072 – 0.075) in the log-log allometric relationships, or a multiplicative factor of 1.185 (118.5%) when exponentiated to raw body mass and total length. These results indicated that whales in the Gulf of Maine had approximately 18% higher body mass for a given body size than those in the New York Bight, Iceland and Greenland.
BCI for each individual whale was calculated from Equation (2) (mean , derived from all data from the West Indies DPS/combined North Atlantic foraging grounds. We found no significant difference in BCI between juveniles and adults in the New York Bight (p > 0.402), and no significant difference in 98.8% of Gulf of Maine (p > 0.05) bootstrapped populations. We could not perform a t-test on Iceland data, because for 96.6% of our bootstrapped populations, there was 1 adult within the Iceland data (Supplementary Figure 3). We found a significant difference in BCI between juveniles and adults in Greenland (p< 0.016), though the sample size was small (Supplementary Figure 3). We therefore assessed age class using a mixed-effect Analysis of Variance (ANOVA) with foraging region as a random effect to test for a difference in BCI between age classes. Since 94.7% of bootstrapped analyses showed no difference in BCI between juveniles and adults (p > 0.05) when accounting for foraging region as a random effect (p > 0.162), we did not consider age class in further analyses.
BCI was significantly different between foraging regions (p< 0.001). The effect size (mean η2 = 0.168) reflected a large effect of foraging region on BCI (Cohen, 1988). Specifically, the BCI value was significantly higher in the Gulf of Maine than in other foraging sites, while all comparisons between other foraging sites were not statistically significant (Figure 4; Table 3). For all bootstrapped populations, DOY had a statistically significant effect and small effect size (p< 0.05, mean η2 = 0.019), and for all populations year did not have a statistically significant effect (p > 0.357, mean η2 = 0.009 for year). Because DOY had a statistically significant effect in all bootstrapped population analyses, we analyzed linear models between BCI and DOY for each region. There are no significant linear trend observed between DOY and BCI in all New York Bight (p > 0.56) and Greenland (p > 0.65) bootstrapped populations, and in 99.0% of Gulf of Maine bootstrapped populations (p > 0.05). In all bootstrapped populations, there was a significant linear trend between BCI and DOY in Iceland, with a mean slope of -0.00058 (95% C.I.: -0.00064 - -0.00052), a mean intercept of 0.131 (95% C.I.: 0.116 – 0.146), and mean R2 value of 0.047 (95% C.I.: 0.032 – 0.051) (Supplementary Table 5, Supplementary Figure 5).
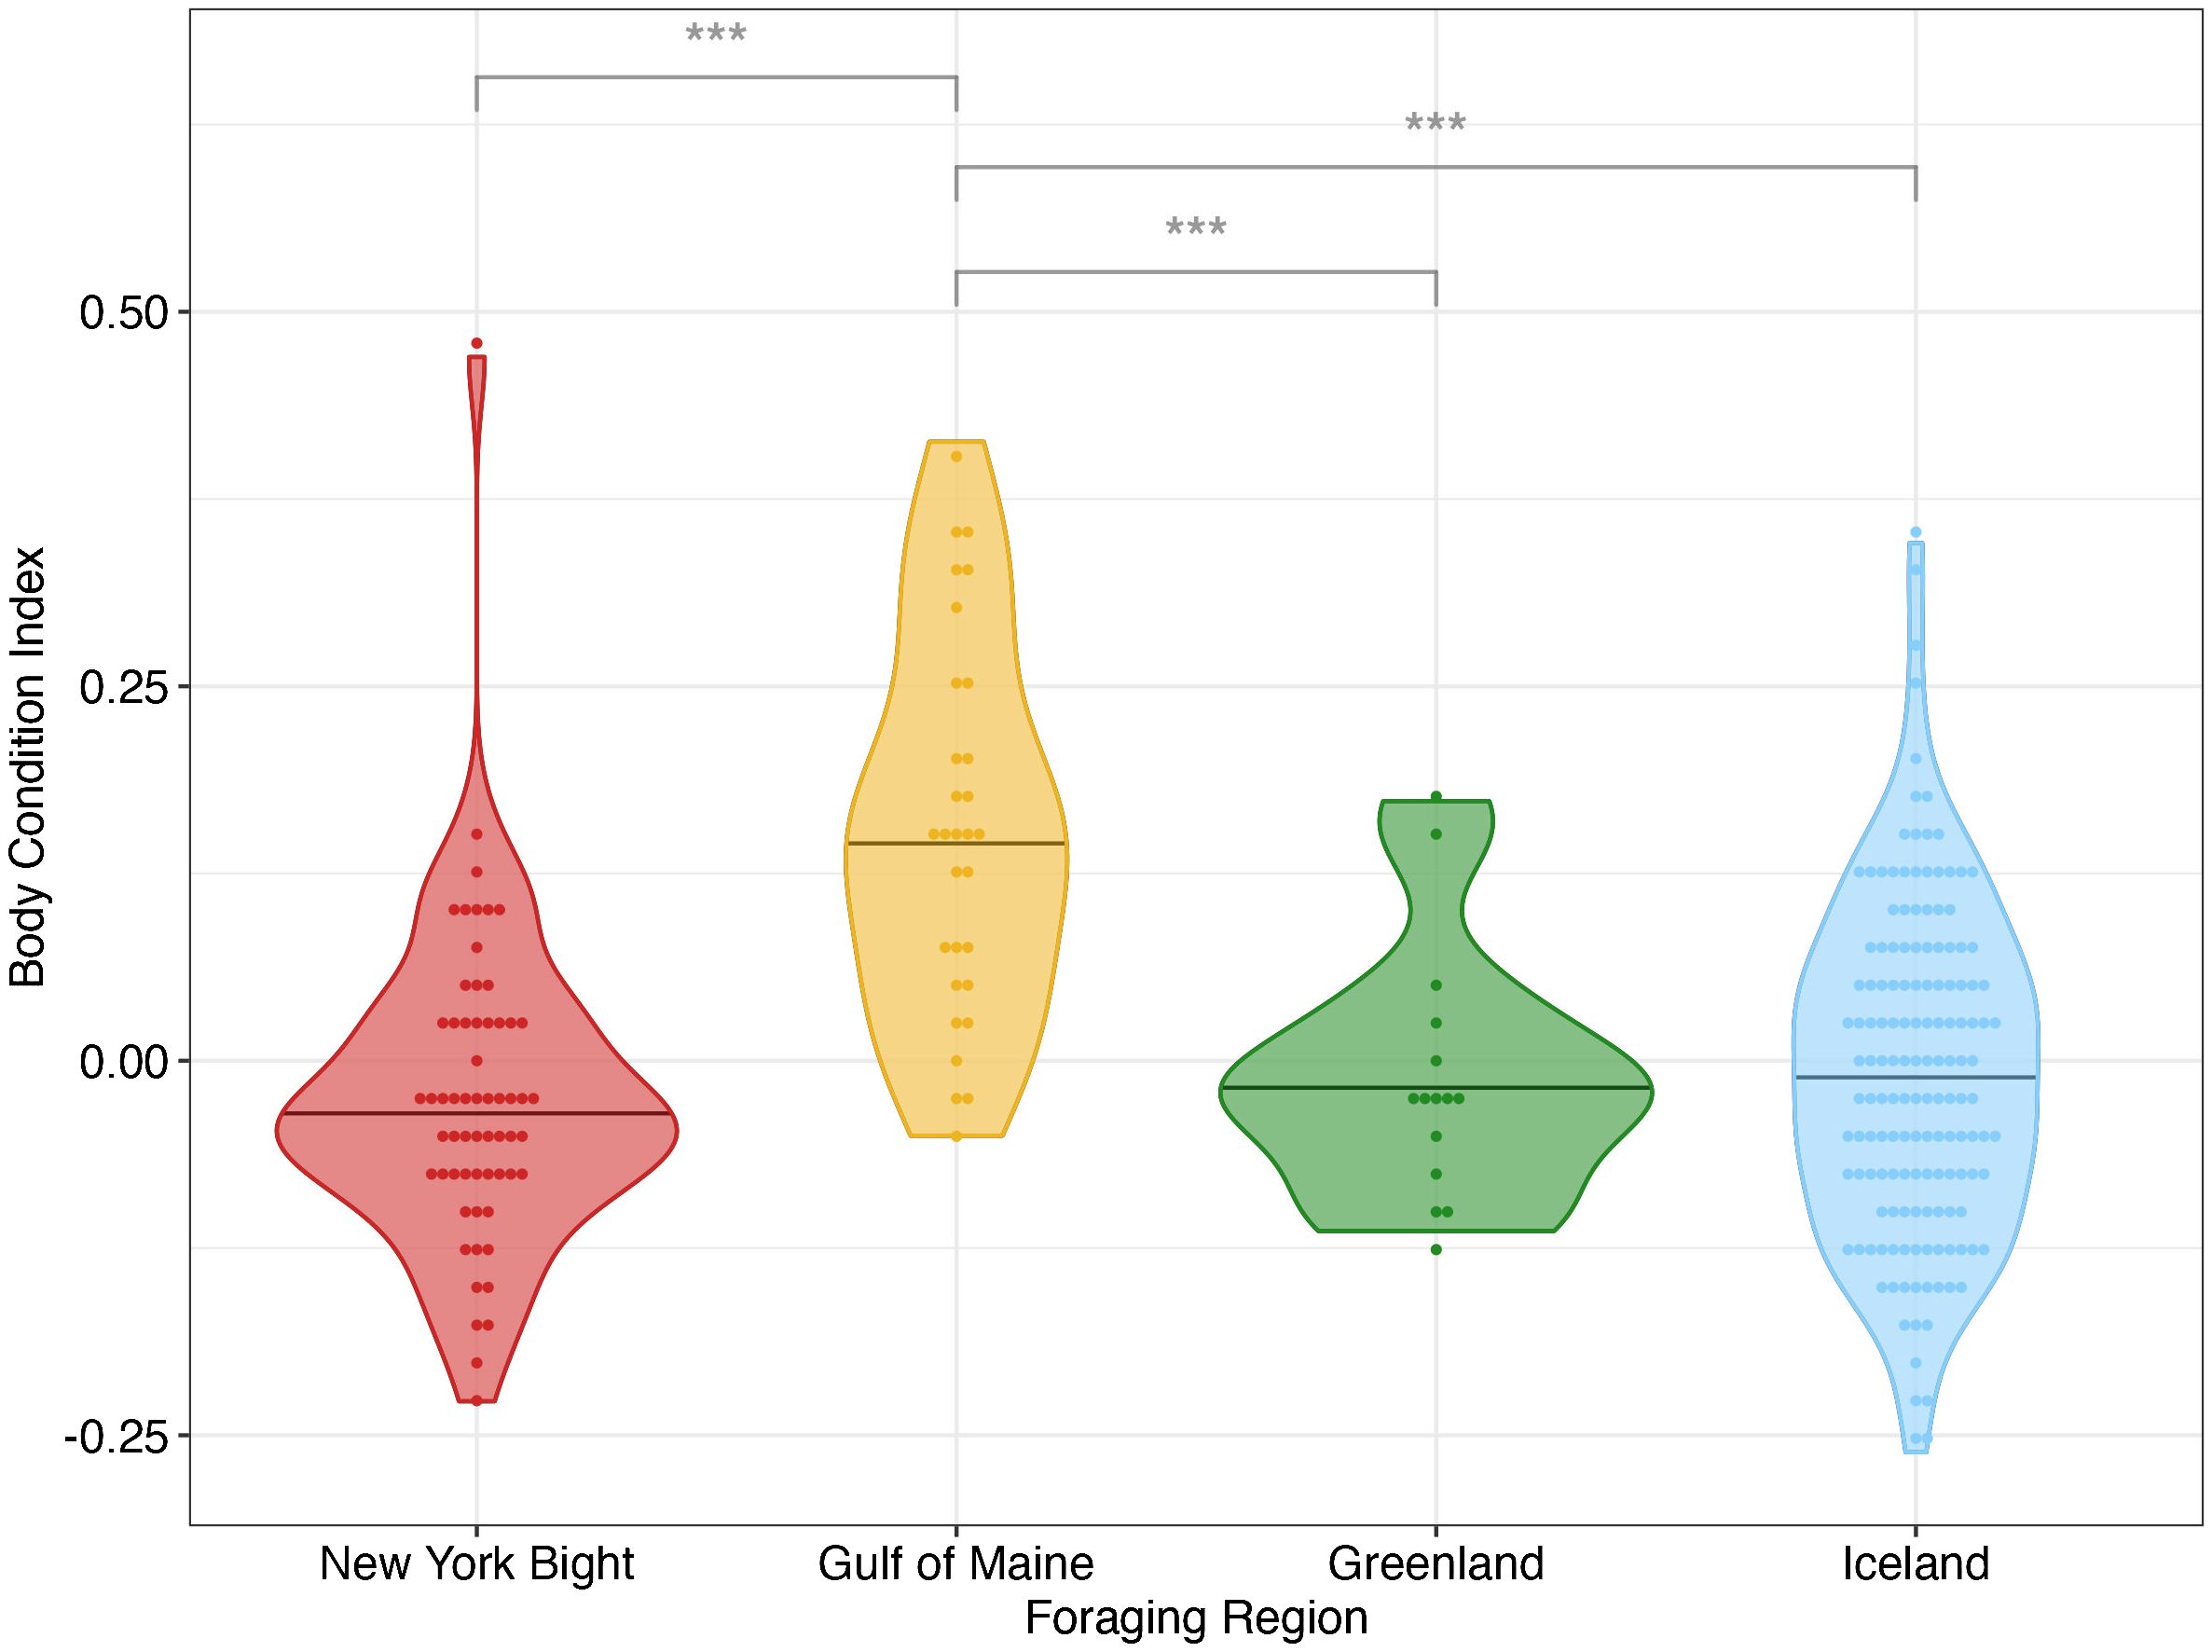
Figure 4 Mean body condition indices (BCI) for individual bootstrapped humpback whales in four foraging areas in the North Atlantic derived from UAS imagery. *** denotes p< 0.001 between pairwise comparisons. Bar denotes foraging region median BCI. Positive BCI indicates an individual whale has a better body condition relative to the average whale of the same length in the overall sampled population; negative BCI indicates worse than average condition for the individual within that population.
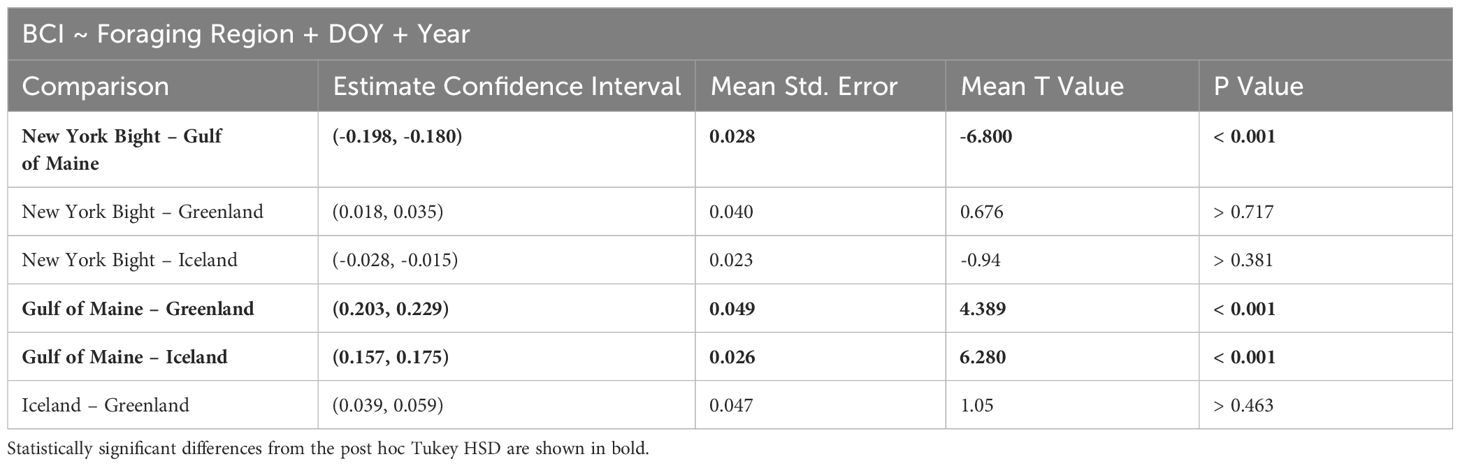
Table 3 ANCOVA results for comparisons of humpback whale Body Condition Index across foraging areas, and including year and day of year as covariates for 1000 bootstrapped populations.
When evaluating BCI from a log-log linear relationship (Equation 2) using data only collected in August and September (Table 2), a time period when data were collected from multiple study sites, BCI was significantly different among foraging regions (p< 0.001). BCI was significantly higher in the Gulf of Maine when compared to Iceland (p< 0.004) and the New York Bight (p< 0.010) for all bootstrapped populations. There was no significant difference between the New York Bight and Iceland (p > 0.366). Greenland was excluded from this analysis, as no data were collected in August or September. DOY did not have a statistically significant effect (p > 0.05) in 97.9% of bootstrapped populations, and year did not have a statistically significant effect all bootstrapped populations (p > 0.177) (Supplementary Table 4). The effect size (mean η2 = 0.010) reflected a moderate effect of foraging region on BCI (Cohen, 1988). These results mirror those of the ANCOVA calculated using all available data.
Body segment volume (m3) proportional to total length cubed (m3) of humpback whales from each foraging region in 5% segments along the body axis (Figure 5A) showed higher proportional segment volume for Gulf of Maine whales between approximately 40%-70%, which corresponds to the metabolically active region for humpback whales (Christiansen et al., 2016a). Figure 5B shows 3D models representing an average humpback whale of the same total length for the Gulf of Maine vs. New York Bight, Iceland, and Greenland, generated from average body segment volume proportional to total length cubed from the respective groups.
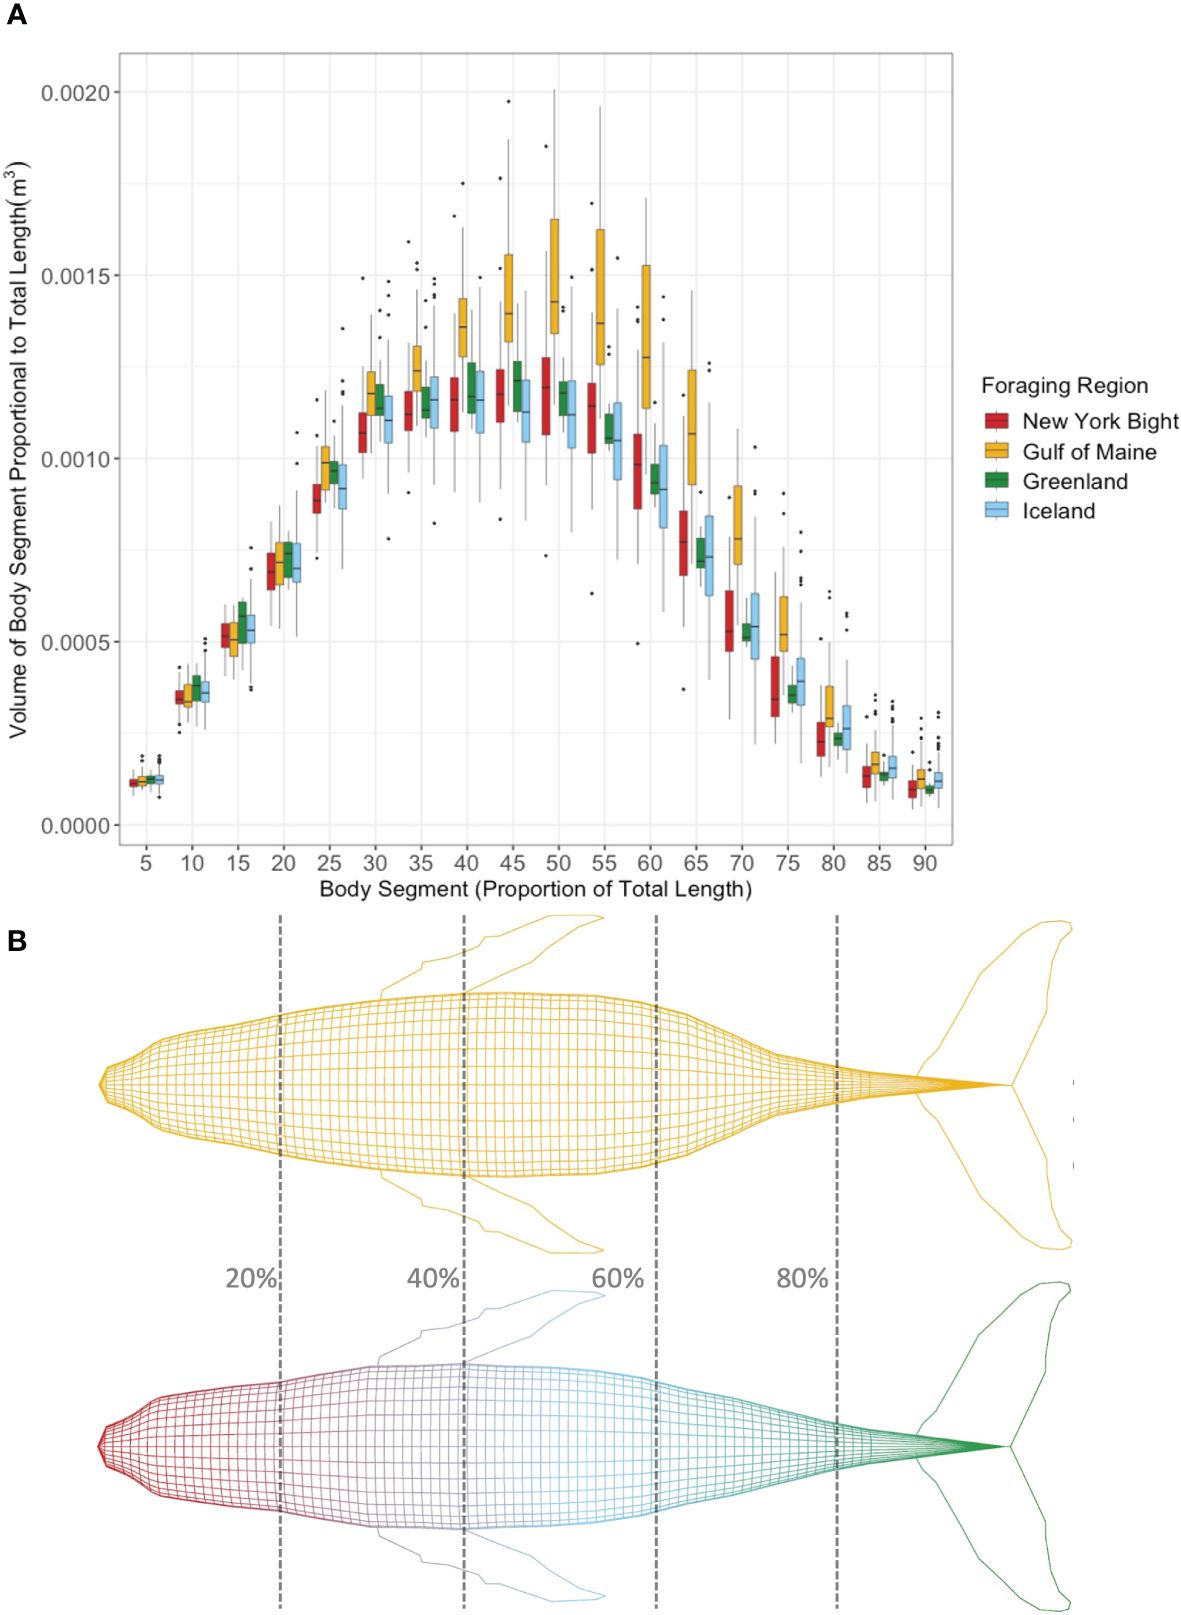
Figure 5 (A) Mean body segment volume (m3) proportional to total length cubed (m3) of individual bootstrapped humpback whales from each foraging region in 5% percentile segments along the body axis. (B) Humpback whale models scaled using average width values of humpback whales from the Gulf of Maine (above) vs. New York Bight, Greenland, and Iceland (shown together as there was no difference between study areas, below) scaled to the same total length. Percentage of total length shown for reference. Larger segment volumes proportional to total length Gulf of Maine humpback whales in (a) between 40% and 75% total length are reflected in the 3D model.
Our comparison of UAS-derived body condition of humpback whales from major foraging regions across the western North Atlantic suggests that West Indies DPS humpback whales foraging in the Gulf of Maine are accumulating more energy reserves than those in the New York Bight, Greenland and Iceland at the time of observation. Our findings represent an average difference of approximately 18% increase in mass for a whale of a given length in the Gulf of Maine compared to a whale of the same length in the New York Bight, Greenland, and Iceland, based on the difference between regional SMA slopes and elevations. For a whale of 10 m, this would equate to a mass difference of approximately 2,400 kg (95% CI: 2100 – 2,700 kg); for a whale of 12 m, this would equate to a mass difference of approximately 4200 kg (95% CI: 3,800 – 4750 kg).
While humpback whales are known to be generalist consumers that can adapt their foraging behavior and consumption based on prey availability (Hazen et al., 2009), energetic accumulation, and therefore body condition, depend on overall prey abundance and distribution. Regional differences in prey availability could contribute to the regional differences in body condition we detected (Christiansen et al., 2020). The Gulf of Maine is a region of high productivity, driven by complex oceanographic processes, strong tidal mixing and strong seasonality in mixing and freshwater runoff (Townsend, 1991). In addition to humpback whales, the Gulf of Maine provides foraging habitat for a diverse range of piscivorous predators, including fin whales (Balaenoptera physalus), minke whales (Balaenoptera acutorostrata), harbor porpoises (Phocoena phocoena), harbor seals (Phoca vitulina), grey seals (Halichoerus grypus), bluefin tuna (Thunnus thynnus), Atlantic puffins (Fratercula arctica), and great shearwater (Puffinus gravis) (Johnston et al., 2005; Overholtz and Link, 2007; Bowser et al., 2013; Read and Brownstein, 2003; Schick et al., 2004; Powers et al., 2017). Within the Northeast US, the Gulf of Maine shows higher biomass of humpback whale prey species than regions further south, such as Southern New England, where New York Bight is located (Gabriel, 1992; Brodziak et al., 2004; Stepanuk, 2022). Greater prey availability in the Gulf of Maine than the New York Bight could explain the observed differences in body condition between these two regions. The abundance of humpback whales in the Gulf of Maine has been increaseng since 2000 (Robbins and Pace, 2018; Hayes et al., 2022; Robbins et al., 2024) and the use of New York waters likely represents an expansion into new or previously underused foraging habitat. The low body condition observed for humpback whales in New York could be related to increased intraspecific competition as the humpback whale population increases, resulting in reduced energetic accumulation in a less profitable foraging ground, or may occur because this foraging ground favors animals that are less competitive on larger feeding grounds (Bierlich et al., 2023). Recent studies in the Gulf of Maine, in the northern region where data was collected, and Scotian Shelf have showed declines in herring (Boyce et al., 2019, 2021), a key lipid-rich foraging fish prey species for humpbacks in the region (Atlantic States Marine Fisheries Commision, 2023). Although body condition of humpback whales in the Gulf of Maine was found to be higher than other foraging regions, continued declines in the abundance and diversity of nutritionally important species such as herring could negatively impact the body condition of humpback whales in the Gulf of Maine in the future.
Humpback whales in Iceland and Greenland rely heavily on krill (Euphausiacea), with sand lance (Ammodytidae) and capelin (Mallotus villosus) as important secondary prey species (Laidre et al., 2010; Akiyama et al., 2019; García-Vernet et al., 2021). Krill prey abundance in Iceland has shown marked declines due to recruitment failure, and increased temperatures, which could contribute to the lower relative body condition observed in Icelandic humpback whales (Silva et al., 2014; Víkingsson et al., 2014, 2015). More broadly, Edwards et al. (2021) found that North Atlantic krill has experienced a “habitat squeeze” in distribution – the southern boundary of krill have shifted northward but the northern boundary has not, as it is constrained by ocean currents and the polar front, resulting in an overall loss of habitat and decline in abundance. Furthermore, humpback whales feeding on invertebrate species capitalize on dense patches of prey (Cade et al., 2021). Fine-scale changes in prey density due to climate change could impact energy availability to predators, even if overall biomass is preserved on a broader scale. Humpback whales foraging in Iceland and Greenland are dependent on less diverse prey types that have known declines, which may explain the lower body condition observed in these regions.
Gulf of Maine humpback whales could be accumulating energy seasonally as expected, whereas other regions are not, especially given there was no significance between BCI and DOY in the New York Bight as expected. There was a significant trend between BCI and DOY in Iceland, though the significance was due to a decreased estimate of BCI in this region over time, as opposed to the expected increase in body condition over the foraging season. Due to the observed small effect size, small mean slope (-0.0005), and low R2 value, we do not think that this significance is biologically relevant to the population. If whales are not accumulating energy seasonally in the New York Bight and Iceland, further studies in these regions are critical.
Regional variability in anthropogenic threats could contribute to the observed patterns in body condition as well. Entanglement in fishing gear and vessel strikes are the two leading sources of human-caused mortality and serious injury in baleen whales, and can negatively impact body condition when injuries are not fatal (Van Der Hoop et al., 2013; Moore et al., 2021, 2016, 2017). Humpback whales are known to endure lengthy entanglements, in which they experience limited mobility, reduced feeding ability, and increased risk of infections. Increased drag from gear affixed to their body results in additional energy use and poorer body condition (Van Der Hoop et al., 2016, 2017; Moore and van der Hoop, 2012; Ramp et al., 2021). Vessel density, and therefore vessel strike risk to whales, vary among regions. Vessel strikes, if not fatal, can cause serious injury and/or result in infection which may divert energy from growth and reproduction to healing (Hill et al., 2017; Carretta and Henry, 2022) and could therefore negatively impact body condition. Increasing vessel traffic and associated increases in underwater noise impacts foraging behavior, potentially leading to less foraging success and poorer body condition (Blair et al., 2016; Guilpin et al., 2020). Foraging grounds in the New York Bight intersect with dense vessel traffic of the Port of New York and New Jersey, the busiest port on the East Coast of the United States (Port Authority of New York and New Jersey, 2023). Impacts of shipping traffic, both through non-lethal vessel strikes and through impacts on foraging behavior, could play a role in the low body condition observer for whales foraging in New York.
Phenological or demographic differences in our sample could have influenced differences we observed in body condition between the Gulf of Maine and the foraging grounds of the New York Bight, Greenland, and Iceland. While we include calendar day of year in our analysis, and conduct a secondary analysis of only August and September data to account for the potential effects of seasonal accumulation of energy reserves, exact arrival times on foraging grounds following migrations from breeding grounds are not known for all foraging regions in our study. Arrival time on foraging grounds could vary between individuals or foraging grounds due to distance traveled from breeding grounds, age, and reproductive class (Craig et al., 2003; Modest et al., 2021). Furthermore, there is evidence that humpback whales can overwinter in the New York Bight and Iceland, staying year-round instead of migrating to low latitude breeding grounds (Magnúsdóttir et al., 2014; Magnúsdóttir and Lim, 2019; Davis et al., 2020; Zoidis et al., 2021). Thus, while of our BCI analysis accounted for day of year, it is possible that phenological differences and the day that an individual was measured by UAS within the foraging season could contribute to our findings. For example, if whales migrated from the breeding grounds and arrived at feeding grounds in Iceland later than whales feeding in the New York Bight, day of year would not provide a good proxy of the potential for seasonal accumulation of energy reserves. Demographic differences in our sample may also contribute to the difference in body condition detected.
Our dataset is limited by unknown variables that are known to impact BCI (Christiansen et al., 2014; Bierlich et al., 2022, 2018, 2020). Specifically, we do not know the sex or reproductive class of every sampled whale and use a threshold value based on total length (11.47 m; Bierlich et al., 2022) to determine age class. Pregnant females may be within the dataset, as re-sighting information on each individual is not available to confirm whether or not they were seen with a calf the following year. More juveniles than adults were sampled in our study, potentially due to near-shore habitat that is predominantly used by juveniles (Stepanuk et al., 2021) along with potential near-shore sampling bias introduced by UAS-flight weather restrictions and opportunistic sampling. The longest and largest whales in the dataset were sampled in the Gulf of Maine, potentially due to sampling bias for old, healthy individuals reflective of the high residency and return rate in the region (Stevick et al., 2006). We note that because data was collected in the northern Gulf of Maine, it is possible that humpbacks foraging in more southerly regions such as near Stellwagen Bank could show different body condition patterns than we observed in this study. This limitation applies to other study regions as well, in which we could not collect data from the entirety of each region. While we have taken measures to account for body size by using BCI, a relative body condition metric based on the residuals of the relationship between total length and expected body volume, and assessing differences in BCI between juveniles and adults, sex and reproductive class may still impact our finding since breeding females could accumulate energy reserves differently than nonbreeding adults (Christiansen et al., 2016b).
We used the average tissue body density from Aoki et al. (2021) to estimate mass. While this study also examined body density separately by sex and reproductive status, we do not have sex and reproductive class information for whales in our dataset. Thus, effects of key factors such as day of year, lipid content and reproductive class that impact tissue body density have not been quantified in our estimation. As further studies estimate body density, effects of these parameters can be quantified and used to develop more accurate estimates of mass.
Our study integrates data collected from several UAS models, which introduce differences leading to potential error. To ensure the robustness of our data comparison across different UAS models, we used a bootstrapping analysis to incorporate and propagate sources of error, and used BCI as a relative metric. We also conducted a secondary pixel-only analysis that did not include sources of error such as altitude. In addition, we observed consistency in body volume segments relative to total length (Figure 5A) in the 5–20% body region, the head region, which is independent of energy reserves and suggests error is not impacting this comparison. Additionally, we are limited in our ability to obtain specific dorso-lateral height data for each individual whale. We use the mean height to width ratios developed in Christiansen et al. (2020), which Hirtle et al. (2022) demonstrated a volume error in the Western Australia population of less than 3.5%. To better address this error in the West Indies DPS, it is important to collect dorso-lateral height data in the North Atlantic whenever possible. We acknowledge that using a metric of body condition based on 3D volumes can introduce more uncertainty (less precision) than 2D models (Bierlich et al., 2021a), though this is a necessary uncertainty to be able to estimate mass. While our study uses separate resampling to address multiple sources of error, the Bayesian framework detailed in Bierlich et al. (2021b) and used in Barlow et al. (2023), is an alternative method to addressing uncertainty. As long term UAS-collected datasets, especially collaborative data, become more attainable, maintaining comparative ability is important to future studies. This is especially true as technology advances and knowledge within the field progresses rapidly.
Our findings highlight the importance of using body condition as a proxy and as an indicator of humpback whale nutritional health. Energetically stressed animals may be less resilient, and therefore more susceptible to mortality, from both natural and anthropogenic causes (Wiley et al., 1995). For these reasons, it is notable that body condition in the New York Bight is lower than in the Gulf of Maine. While whales along the entire Atlantic coast are susceptible to the threats identified in the ongoing UME, strandings in New York waters have increased disproportionately, with 72 of the 209 mortalities recorded in New York (43) and New Jersey (29) since 2016 (National Oceanic and Atmospheric Administration, 2022; Henry, 2023). Cumulatively, the observed differences in body condition and the mortalities occurring as part of the UME in the Gulf of Maine and New York Bight are important to explore, especially given the limited demographic, sighting, and exchange information between the two regions (Brown et al., 2022). Future studies are needed to better understand drivers and differences of body condition in humpback whales and links with overall health and mortality as a result of anthropogenic threats.
The datasets presented in this study can be found in an online repository at: https://github.com/chelsinapoli/NorthAtlanticHumpbackBodyCondition.
The animal study was approved by Stony Brook University Institutional Animal Care and Use Committee (IACUC #: 1208289_TR001). The study was conducted in accordance with the local legislation and institutional requirements.
CN: Data curation, Formal analysis, Writing – original draft, Writing – review & editing, Investigation, Methodology. NH: Formal analysis, Methodology, Writing – review & editing, Investigation. JS: Methodology, Writing – review & editing, Investigation. FC: Methodology, Writing – review & editing, Investigation. EH: Methodology, Writing – review & editing, Investigation. TG: Writing – review & editing, Investigation. AS: Writing – review & editing, Investigation. FD: Writing – review & editing, Investigation. MG: Writing – review & editing, Investigation. MR: Writing – review & editing, Investigation. GL: Writing – review & editing, Investigation. KD: Writing – review & editing, Investigation. SV: Writing – review & editing, Investigation. MS: Writing – review & editing, Investigation. TB: Writing – review & editing, Investigation. AZ: Writing – review & editing, Investigation. ST: Writing – review & editing, Investigation. LT: Conceptualization, Methodology, Supervision, Writing – original draft, Writing – review & editing.
The author(s) declare financial support was received for the research, authorship, and/or publication of this article. We thank the Eimskip University Fund and the University of Iceland’s research fund for funding to support work in Iceland. This work, and the field efforts in the New York Bight was funded by the New York State Environmental Protection Fund Ocean and Great Lakes Program, NYS DEC.
We thank Captains Brian Gagliardi, Andrew Brosnan, Scott Convery, Chris Harter, Michael Mason and David Bowman, as well as Stephanie Adamczack, Hannah Blair, Alex Borowicz, Audrey Calhoun, Taylor Evans, Tziporah Feldman, Madeleine Foley, Matthew Fuirst, Rachael Herman, Dallas Jordan, Siobhan Keeling, Kim Lato, and Jessica Lopez for their assistance in conducting field studies in the New York Bight. We also thank Whale Wise field team members, Petr Slavík, Jessica Ward, Synnøve Røsand, Amelie Laute, and Johanna Behrisch. We would also like to thank Małgorzata Jarzynowska, Alyssa Poldner, Silva Naomi Sophie Ruppert, and captain Aðalgeir Bjarnason for their assistance with data collection in NE-Iceland. We would like to add thanks to the captain and crew of the FV Barker Boys, Canadian Whale Institute, Dalhousie University, and Don LeRoi of Aerial Imaging Systems. We also thank Cetos Research Organization & Allied Whale drone pilots Nils Midtun and Captain Toby Stephenson, as well as Lindsey Jones, Natasha Pastor, and Rachel Rice for their field work and research efforts. Humpback whale field work in the New York Bight was conducted under a National Marine Fisheries Service (NMFS) General Authorization to Lesley H Thorne (GA No. 21889; No. 26260), and field work in the Gulf of Maine was conducted under NMFS Permit No. 20951 Issued to Ann Zoidis. Fieldwork in the Gulf of Maine by University of New Brunswick was conducted under a DFO Section 38 License (#360624).
The authors declare that the research was conducted in the absence of any commercial or financial relationships that could be construed as a potential conflict of interest.
The reviewer LGT declared a past co-authorship with the author LT to the handling editor.
All claims expressed in this article are solely those of the authors and do not necessarily represent those of their affiliated organizations, or those of the publisher, the editors and the reviewers. Any product that may be evaluated in this article, or claim that may be made by its manufacturer, is not guaranteed or endorsed by the publisher.
The Supplementary Material for this article can be found online at: https://www.frontiersin.org/articles/10.3389/fmars.2024.1336455/full#supplementary-material
Akiyama Y., Akamatsu T., Rasmussen M. H., Iversen M. R., Iwata T., Goto Y., et al. (2019). Leave or stay? Video-logger revealed foraging efficiency of humpback whales under temporal change in prey density. PloS One 14, e0211138. doi: 10.1371/journal.pone.0211138
Aoki K., Isojunno S., Bellot C., Iwata T., Kershaw J., Akiyama Y., et al. (2021). Aerial photogrammetry and tag-derived tissue density reveal patterns of lipid-store body condition of humpback whales on their feeding grounds. Proc. R. Soc. B: Biol. Sci. 288, 20202307. doi: 10.1098/rspb.2020.2307
Arranz P., Christiansen F., Glarou M., Gero S., Visser F., Oudejans M. G., et al. (2022). Body condition and allometry of free-ranging short-finned pilot whales in the north atlantic. Sustainability 14, 14787. doi: 10.3390/su142214787
Atlantic States Marine Fisheries Commission. (2023). Atlantic herring. Available online at: https://www.asmfc.org/species/atlantic-herring.
Baker C. S., Palumbi S. R., Lambertsen R. H., Weinrich M. T., Calambokidis J., O’Brien S. J. (1990). Influence of seasonal migration on geographic distribution of mitochondrial DNA haplotypes in humpback whales. Nature 344, 238–240. doi: 10.1038/344238a0
Barlow D. R., Bierlich K. C., Oestreich W. K., Chiang G., Durban J. W., Goldbogen J. A., et al. (2023). Shaped by their environment: variation in blue whale morphology across three productive coastal ecosystems. Integr. Organismal Biol. 5, obad039. doi: 10.1093/iob/obad039
Bengston Nash S. M., Castrillon J., Eisenmann P., Fry B., Shuker J. D., Cropp R. A., et al. (2018). Signals from the south; humpback whales carry messages of Antarctic sea-ice ecosystem variability. Global Change Biol. 24, 1500–1510. doi: 10.1111/gcb.14035
Best P. B. (1993). Increase rates in severely depleted stocks of baleen whales. ICES J. Mar. Sci. 50, 169–186. doi: 10.1006/jmsc.1993.1018
Bierlich K., Hewitt J., Bird C. N., Schick R., Friedlaender A., Torres L., et al. (2021a). Comparing uncertainty associated with 1-, 2-, and 3D aerial photogrammetry-based body condition measurements of baleen whales. Front. Mar. Sci. 8. doi: 10.3389/fmars.2021.749943
Bierlich K. C., Hewitt J., Schick R. S., Pallin L., Dale J., Friedlaender A. S., et al. (2022). Seasonal gain in body condition of foraging humpback whales along the Western Antarctic Peninsula. Front. Mar. Sci. 9. doi: 10.3389/fmars.2022.1036860
Bierlich K. C., Kane A., Hildebrand L., Bird C. N., Fernandez Ajo A., Stewart J. D., et al. (2023). Downsized: gray whales using an alternative foraging ground have smaller morphology. Biol. Lett. 19, 20230043. doi: 10.1098/rsbl.2023.0043
Bierlich K., Schick R., Hewitt J., Dale J., Goldbogen J., Friedlaender A., et al. (2021b). Bayesian approach for predicting photogrammetric uncertainty in morphometric measurements derived from drones. Available online at: https://www.semanticscholar.org/paper/4b275a439d5d0680b53d92ad0b7ef8ab218cc628.
Bird C., Bierlich K. (2020). CollatriX: A GUI to collate MorphoMetriX outputs. J. Open Source Software 5, 2328. doi: 10.21105/joss.02328
Blair H. B., Merchant N. D., Friedlaender A. S., Wiley D. N., Parks S. E. (2016). Evidence for ship noise impacts on humpback whale foraging behaviour. Biol. Lett. 12, 20160005. doi: 10.1098/rsbl.2016.0005
Bossart G. D. (2011). Marine mammals as sentinel species for oceans and human health. Veterinary Pathol. 48, 676–690. doi: 10.1177/0300985810388525
Bowser A. K., Diamond A. W., Addison J. A. (2013). From puffins to plankton: a DNA-based analysis of a seabird food chain in the northern Gulf of Maine. PloS One 8, e83152. doi: 10.1371/journal.pone.0083152
Boyce D. G., Petrie B., Frank K. T. (2019). Multivariate determination of Atlantic herring population health in a large marine ecosystem. ICES J. Mar. Sci. 76, 859–869. doi: 10.1093/icesjms/fsy208
Boyce D. G., Petrie B., Frank K. T. (2021). Fishing, predation, and temperature drive herring decline in a large marine ecosystem. Ecol. Evol. 11, 18136–18150. doi: 10.1002/ece3.8411
Bradford A., Weller D., Punt A., Ivashchenko Y., Burdin A., Vanblaricom G., et al. (2012). Leaner leviathans: Body condition variation in a critically endangered whale population. J. Mammal. 93, 251–266. doi: 10.1644/11-MAMM-A-091.1
Brodziak J. K., Legault C. M., Col L. A., Overholtz W. J. (2004). Estimation of demersal and pelagic species biomasses in the Northeast UAS continential shelf ecosystem (CM 2004/FF:07). Available at: https://www.ices.dk/sites/pub/CM%20Doccuments/2004/FF/FF0704.pdf.
Brown D. M., Robbins J., Sieswerda P. L., Ackerman C., Aschettino J. M., Barco S., et al. (2022). Site fidelity, population identity and demographic characteristics of humpback whales in the New York Bight apex. J. Mar. Biol. Assoc. United Kingdom 102, 157–165. doi: 10.1017/S0025315422000388
Brown D. M., Robbins J., Sieswerda P. L., Schoelkopf R., Parsons E. C. M. (2018). Humpback whale (Megaptera novaeangliae) sightings in the New York-New Jersey Harbor Estuary. Mar. Mammal Sci. 34, 250–257. doi: 10.1111/mms.12450
Burnett J. D., Lemos L., Barlow D., Wing M. G., Chandler T., Torres L. G. (2018). Estimating morphometric attributes of baleen whales with photogrammetry from small UASs: A case study with blue and gray whales. Mar. Mammal Sci. 35, 108–139. doi: 10.1111/mms.12527
Cade D. E., Seakamela S. M., Findlay K. P., Fukunaga J., Kahane-Rapport S. R., Warren J. D., et al. (2021). Predator-scale spatial analysis of intra-patch prey distribution reveals the energetic drivers of rorqual whale super-group formation. Funct. Ecol. 35, 894–908. doi: 10.1111/1365–2435.13763
Carretta J. V., Henry A. G. (2022). Risk assessment of whale entanglement and vessel strike injuries from case narratives and classification trees. Front. Mar. Sci. 9. doi: 10.3389/fmars.2022.863070
Castrillon J., Bengtson Nash S. (2020). Evaluating cetacean body condition; a review of traditional approaches and new developments. Ecol. Evol. 10, 6144–6162. doi: 10.1002/ece3.6301
Christiansen F., Dawson S., Durban J., Fearnbach H., Miller C., Bejder L., et al. (2020). Population comparison of right whale body condition reveals poor state of the North Atlantic right whale. Mar. Ecol. Prog. Ser. 640, 1–16. doi: 10.3354/meps13299
Christiansen F., Dujon A. M., Sprogis K. R., Arnould J. P. Y., Bejder L. (2016a). Noninvasive unmanned aerial vehicle provides estimates of the energetic cost of reproduction in humpback whales. Ecosphere 7, e01468. doi: 10.1002/ecs2.1468
Christiansen F., Rodríguez-González F., Martínez-Aguilar S., Urbán J., Swartz S., Warick H., et al. (2021). Poor body condition associated with an unusual mortality event in gray whales. Mar. Ecol. Prog. Ser. 658, 237–252. doi: 10.3354/meps13585
Christiansen F., Rojano-Doñate L., Madsen P. T., Bejder L. (2016b). Noise levels of multi-rotor unmanned aerial vehicles with implications for potential underwater impacts on marine mammals. Front. Mar. Sci. 3. doi: 10.3389/fmars.2016.00277
Christiansen F., Sironi M., Moore M., Martino M. D., Ricciardi M., Warick H., et al. (2019). Estimating body mass of free-living whales using aerial photogrammetry and 3D volumetrics. Methods Ecol. Evol. 10, 2034–2044. doi: 10.1111/2041–210X.13298
Christiansen F., Sprogis K. R., Nielsen M. L. K., Glarou M., Bejder L. (2023). Energy expenditure of southern right whales varies with body size, reproductive state and activity level. J. Exp. Biol. 226, jeb245137. doi: 10.1242/jeb.245137
Christiansen F., Tervo O. M., Heide-Jørgensen M. P., Teilmann J. (2024). Prey consumption of bowhead whales in West Greenland estimated from drone measurements of body size and condition. Polar Biol. 47, 17–39. doi: 10.1007/s00300–023-03207–8
Christiansen F., Víkingsson G., Rasmussen M., Lusseau D. (2014). Female body condition affects foetal growth in a capital breeding mysticete. Funct. Ecol. 28, 579–588. doi: 10.1111/1365–2435.12200
Christiansen F., Vivier F., Charlton C., Ward R., Amerson A., Burnell S., et al. (2018). Maternal body size and condition determine calf growth rates in southern right whales. Mar. Ecol. Prog. Ser. 592, 267–281. doi: 10.3354/meps12522
Cohen J. (1988). Statistical power analysis for the behavioral sciences (2nd ed.) (Hillsdale, NJ: Erlbaum).
Craig A. S., Herman L. M., Gabriele C. M., Pack A. A. (2003). Migratory timing of humpback whales (Megaptera novaeangliae) in the central north pacific varies with age, sex and reproductive status. Behaviour 140, 981–1001. doi: 10.1163/156853903322589605
Davis G. E., Baumgartner M., Corkeron P., Bell J. T., Berchok C., Bonnell J., et al. (2020). Exploring movement patterns and changing distributions of baleen whales in the western North Atlantic using a decade of passive acoustic data. Global Change Biol. 26, 4812–4840. doi: 10.1111/gcb.15191
Dawson S., Bowman M., Leunissen E., Sirguey P. (2017). Inexpensive aerial photogrammetry for studies of whales and large marine animals. Front. Mar. Sci. 4. doi: 10.3389/fmars.2017.00366
Domínguez-Sánchez C. A., Acevedo-Whitehouse K. A., Gendron D. (2018). Effect of drone-based blow sampling on blue whale (Balaenoptera musculus) behavior. Mar. Mammal Sci. 34, 841–850. doi: 10.1111/mms.12482
Durban J., Fearnbach H., Barrett-Lennard L., Perryman W., LeRoi D. (2015). Photogrammetry of killer whales using a small hexacopter launched at seal. J. Unmanned Veh. Syst. 3, 131-135. doi: 10.1139/JUVS-2015–0020
Edwards M., Hélaouët P., Goberville E., Lindley A., Tarling G. A., Burrows M. T., et al. (2021). North Atlantic warming over six decades drives decreases in krill abundance with no associated range shift. Commun. Biol. 4, 644. doi: 10.1038/s42003–021-02159–1
Fearnbach H., Durban J. W., Barrett-Lennard L. G., Ellifrit D. K., Balcomb K. C. (2020). Evaluating the power of photogrammetry for monitoring killer whale body condition. Mar. Mammal Sci. 36, 359–364. doi: 10.1111/mms.12642
Fernandez Ajó A., Pirotta E., Bierlich K. C., Hildebrand L., Bird C. N., Hunt K. E., et al. (2023). Assessment of a non-invasive approach to pregnancy diagnosis in gray whales through drone-based photogrammetry and faecal hormone analysis. R. Soc. Open Sci. 10, 230452. doi: 10.1098/rsos.230452
Fleming A. H., Clark C. T., Calambokidis J., Barlow J. (2016). Humpback whale diets respond to variance in ocean climate and ecosystem conditions in the California Current. Global Change Biol. 22, 1214–1224. doi: 10.1111/gcb.13171
Fossi M. C., Panti C. (2017). “Sentinel Species of Marine Ecosystems,” in Oxford Research Encyclopedia of Environmental Science. Oxford University Press. doi: 10.1093/acrefore/9780199389414.013.110
Friedlaender A. S., Hazen E. L., Nowacek D. P., Halpin P. N., Ware C., Weinrich M. T., et al. (2009). Diel changes in humpback whale Megaptera novaeangliae feeding behavior in response to sand lance Ammodytes spp. Behavior and distribution. Mar. Ecol. Prog. Ser. 395, 91–100. doi: 10.3354/meps08003
Gabriel W. L. (1992). Persistence of demersal fish assemblages between cape hatteras and nova scotia, northwest atlantic. J. Northwest Atlantic Fishery Sci. 14, 29–46. doi: 10.2960/J.v14.a2
Ganley L., Brault S., Mayo C. (2019). What we see is not what there is: Estimating North Atlantic right whale Eubalaena glacialis local abundance. Endangered Species Res. 38, 101–113. doi: 10.3354/esr00938
García-Vernet R., Borrell A., Víkingsson G., Halldórsson S. D., Aguilar A. (2021). Ecological niche partitioning between baleen whales inhabiting Icelandic waters. Prog. Oceanography 199, 102690. doi: 10.1016/j.pocean.2021.102690
Glarou M., Gero S., Frantzis A., Brotons J. M., Vivier F., Alexiadou P., et al. (2023). Estimating body mass of sperm whales from aerial photographs. Mar. Mammal Sci. 39, 251–273. doi: 10.1111/mms.12982
Gonçalves Neto A., Langan J. A., Palter J. B. (2021). Changes in the Gulf Stream preceded rapid warming of the Northwest Atlantic Shelf. Commun. Earth Environ. 2, 74. doi: 10.1038/s43247–021-00143–5
Guilpin M., Lesage V., McQuinn I., Brosset P., Doniol-Valcroze T., Jeanniard-du-Dot T., et al. (2020). Repeated vessel interactions and climate- or fishery-driven changes in prey density limit energy acquisition by foraging blue whales. Front. Mar. Sci. 7. doi: 10.3389/fmars.2020.00626
Hansen R. G., Boye T. K., Larsen R. S., Nielsen N. H., Tervo O., Nielsen R. D., et al. (2019). Abundance of Whales in West and East Greenland in Summer 2015 (NAMMCO Scientific Publications), 11. doi: 10.7557/3.4689
Haug T., Lindstrøm U., Nilssen K. T. (2002). Variations in minke whale (Balaenoptera acutorostrata) diet and body condition in response to ecosystem changes in the barents sea. Sarsia 87, 409–422. doi: 10.1080/0036482021000155715
Hayes S. H., Josephson E., Maze-Foley K., Rosel P. E., Wallace J. (2022). US Atlantic and Gulf of Mexico marine mammal stock assessments 2021 (NOAA technical memorandum NMFS-NE), 288.
Hazen E. L., Abrahms B., Brodie S., Carroll G., Jacox M. G., Savoca M. S., et al. (2019). Marine top predators as climate and ecosystem sentinels. Front. Ecol. Environ. 17, 565–574. doi: 10.1002/fee.2125
Hazen E., Friedlaender A., Thompson M., Ware C., Weinrich M., Halpin P., et al. (2009). Fine-scale prey aggregations and foraging ecology of humpback whales Megaptera novaeangliae. Mar. Ecol. Prog. Ser. 395, 75–89. doi: 10.3354/meps08108
Heide-Jørgensen M. P., Chambault P., Jansen T., Gjelstrup C. V. B., Rosing-Asvid A., Macrander A., et al. (2023). A regime shift in the Southeast Greenland marine ecosystem. Global Change Biol. 29, 668–685. doi: 10.1111/gcb.16494
Henry A. (2023). Serious injury and mortality determinations for baleen whale stocks along the Gulf of Mexico, United States East Coast, and Atlantic Canadian Provinces,. 2017–2021. doi: 10.25923/5C4N-BH81
Hill A. N., Karniski C., Robbins J., Pitchford T., Todd S., Asmutis-Silvia R. (2017). Vessel collision injuries on live humpback whales, Megaptera novaeangliae, in the southern Gulf of Maine. Mar. Mammal Sci. 33, 558–573. doi: 10.1111/mms.12386
Hirtle N. O., Stepanuk J. E. F., Heywood E. I., Christiansen F., Thorne L. H. (2022). Integrating 3D models with morphometric measurements to improve volumetric estimates in marine mammals. Methods Ecol. Evol. 13, 2478–2490. doi: 10.1111/2041–210X.13962
Horton T. W., Hauser N., Cassel S., Klaus K. F., Fettermann T., Key N. (2019). Doctor drone: non-invasive measurement of humpback whale vital signs using unoccupied aerial system infrared thermography. Front. Mar. Sci. 6. doi: 10.3389/fmars.2019.00466
Johnston D. W. (2019). Unoccupied aircraft systems in marine science and conservation. Annu. Rev. Mar. Sci. 11, 439–463. doi: 10.1146/annurev-marine-010318–095323
Johnston D. W., Thorne L. H., Read A. J. (2005). Fin whales Balaenoptera physalus and minke whales Balaenoptera acutorostrata exploit a tidally driven island wake ecosystem in the Bay of Fundy. Mar. Ecol. Prog. Ser. 305, 287–295. doi: 10.3354/meps305287
Karmalkar A. V., Horton R. M. (2021). Drivers of exceptional coastal warming in the northeastern United States. Nat. Climate Change 11, 854–860. doi: 10.1038/s41558–021-01159–7
Katona S. K., Whitehead H. P. (1981). Identifying Humpback Whales using their natural markings. Polar Rec. 20, 439–444. doi: 10.1017/S003224740000365X
Kettemer L. E., Rikardsen A. H., Biuw M., Broms F., Mul E., Blanchet M.-A. (2022). Round-trip migration and energy budget of a breeding female humpback whale in the Northeast Atlantic. PloS One 17, e0268355. doi: 10.1371/journal.pone.0268355
Laidre K., Heide-Jørgensen M., Heagerty P., Cossio A., Bergström B., Simon M. (2010). Spatial associations between large baleen whales and their prey in West Greenland. Mar. Ecol. Prog. Ser. 402, 269–284. doi: 10.3354/meps08423
Laute A., Glarou M., Dodds F., Gomez Røsand S. C., Grove T. J., Stoller A., et al. (2023). Underwater sound of three unoccupied aerial vehicles at varying altitudes and horizontal distances. J. Acoustical Soc. America 153, 3419. doi: 10.1121/10.0019805
Lemos L. S., Burnett J. D., Chandler T., Sumich J., Torres L. (2020). Intra- and inter-annual variation in gray whale body condition on a foraging ground. Ecosphere 11, e03094. doi: 10.1002/ecs2.3094
Lockyer C. H., McConnell L. C., Waters T. D. (1985). Body condition in terms of anatomical and biochemical assessment of body fat in North Atlantic fin and sei whales. Can. J. Zoology 63, 2328–2338. doi: 10.1139/z85–345
MacKay M. (2015). Occurrence patterns and social behaviors of humpback whales (Megaptera novaeangliae) wintering off Puerto Rico. Available at: https://oaktrust.library.tamu.edu/handle/1969.1/155581?show=full.
Magnúsdóttir E. E., Lim R. (2019). Subarctic singers: Humpback whale (Megaptera novaeangliae) song structure and progression from an Icelandic feeding ground during winter. PloS One 14, e0210057. doi: 10.1371/journal.pone.0210057
Magnúsdóttir E. E., Rasmussen M. H., Lammers M. O., Svavarsson J. (2014). Humpback whale songs during winter in subarctic waters. Polar Biol. 37, 427–433. doi: 10.1007/s00300–014-1448–3
Meyer-Gutbrod E., Greene C. (2014). Climate-associated regime shifts drive decadal-scale variability in recovery of north atlantic right whale population. Oceanography 27, 148–153. doi: 10.5670/oceanog.2014.64
Meyer-Gutbrod E. L., Greene C. H., Davies K. T. A., Johns D. G. (2021). Ocean regime shift is driving collapse of the north atlantic right whale population. Oceanography 34, 22–31. doi: 10.5670/oceanog.2021.308
Meyer-Gutbrod E., Greene C., Sullivan P., Pershing A. (2015). Climate-associated changes in prey availability drive reproductive dynamics of the North Atlantic right whale population. Mar. Ecol. Prog. Ser. 535, 243–258. doi: 10.3354/meps11372
Mills K., Pershing A., Brown C., Chen Y., Chiang F.-S., Holland D., et al. (2013). Fisheries management in a changing climate: lessons from the 2012 ocean heat wave in the northwest atlantic. Oceanography 26, 191-195. doi: 10.5670/oceanog.2013.27
Modest M., Irvine L., Andrews-Goff V., Gough W., Johnston D., Nowacek D., et al. (2021). First description of migratory behavior of humpback whales from an Antarctic feeding ground to a tropical calving ground. Anim. Biotelemetry 9, 42. doi: 10.1186/s40317–021-00266–8
Moore S. E. (2008). Marine mammals as ecosystem sentinels. J. Mammalogy 89, 534–540. doi: 10.1644/07-MAMM-S-312R1.1
Moore M., Rowles T., Fauquier D., Baker J., Biedron I. S., Durban J., et al. (2021). REVIEW: Assessing North Atlantic right whale health: Threats, and development of tools critical for conservation of the species. Dis. Aquat. Organisms 143, 205–226. doi: 10.3354/dao03578
Moore M., van der Hoop J. (2012). The painful side of trap and fixed net fisheries: chronic entanglement of large whales. J. Mar. Biol. 2012, 1–4. doi: 10.1155/2012/230653
National Oceanic and Atmospheric Administration (2016). Endangered and threatened species; identification of 14 distinct population segments of the humpback whale (Megaptera novaeangliae) and revision of species-wide listing. Federal Register 81, 62260–62320.
National Oceanic and Atmospheric Administration. (2020). HUMPBACK WHALE (Megaptera novaeangliae): Gulf of Maine Stock [Marine Mammal Stock Assessment]. Available online at: https://s3.amazonaws.com/media.fisheries.noaa.gov/2020–10/2019%20humpback%20whale%20gulf%20of%20Maine%20508.pdf?null.
National Oceanic and Atmospheric Administration. (2022). 2016–2022 humpback whale unusual mortality event along the atlantic coast. Mar. Life Distress.
Noren S. R., Schwarz L., Chase K., Aldrich K., Oss K. M.-V., Leger J. S. (2019). Validation of the photogrammetric method to assess body condition of an odontocete, the shortfinned pilot whale Globicephala macrorhynchus. Mar. Ecol. Prog. Ser. 620, 185–200. doi: 10.3354/meps12971
Nye J., Link J., Hare J., Overholtz W. (2009). Changing spatial distribution of fish stocks in relation to climate and population size on the Northeast United States continental shelf. Mar. Ecol. Prog. Ser. 393, 111–129. doi: 10.3354/meps08220
Overholtz W. J., Link J. S. (2007). Consumption impacts by marine mammals, fish, and seabirds on the Gulf of Maine–Georges Bank Atlantic herring (Clupea harengus) complex during the years 1977–2002. CES Journal of Marine Science 64, 83–96.
Palsbøll P. J., Clapham P. J., Mattila D. K., Larsen F., Sears R., Siegismund H. R., et al. (1995). Distribution of mtDNA haplotypes in North Atlantic humpback whales: The influence of behaviour on population structure. Mar. Ecol. Prog. Ser. 116, 1–10. doi: 10.3354/meps116001
Pendleton D., Sullivan P., Brown M., Cole T., Good C., Mayo C., et al. (2012). Weekly predictions of North Atlantic right whale Eubalaena glacialis habitat reveal influence of prey abundance and seasonality of habitat preferences. Endangered Species Res. 18, 147–161. doi: 10.3354/esr00433
Pershing A. J., Alexander M. A., Hernandez C. M., Kerr L. A., Le Bris A., Mills K. E., et al. (2015). Slow adaptation in the face of rapid warming leads to collapse of the Gulf of Maine cod fishery. Science 350, 809–812. doi: 10.1126/science.aac9819
Piatt J. F., Methven D. A. (1992). Threshold foraging behavior of baleen whales. Mar. Ecol. Prog. Ser. 84, 205–210. doi: 10.3354/meps084205
Port Authority of New York & New Jersey. (2023). Facts and figures. Available online at: https://www.panynj.gov/port/en/our-port/facts-and-figures.html.
Powers K. D., Wiley D. N., Allyn A. J., Welch L. J., Ronconi R. A. (2017). Movements and foraging habitats of great shearwaters Puffinus gravis in the Gulf of Maine. Mar. Ecol. Prog. Ser. 574, 211–226. doi: 10.3354/meps12168
Ramp C., Delarue J., Palsbøll P. J., Sears R., Hammond P. S. (2015). Adapting to a warmer ocean—Seasonal shift of baleen whale movements over three decades. PloS One 10, e0121374. doi: 10.1371/journal.pone.0121374
Ramp C., Gaspard D., Gavrilchuk K., Unger M., Schleimer A., Delarue J., et al. (2021). Up in the air: Drone images reveal underestimation of entanglement rates in large rorqual whales. Endangered Species Res. 44, 33–44. doi: 10.3354/esr01084
R Core Team. (2021). R: A language and Environment for Statistical Computing (R Foundation for Statistical Computing). Available at: https://www.R-project.org/.
Read A. J., Brownstein C. R. (2003). Considering other consumers: fisheries, predators, and Atlantic herring in the Gulf of Maine. Conserv. Ecol. 7, 2. doi: 10.5751/ES-00474-070102
Robbins J., Bérubé M., Clapham P. J., Mattila D. K., Palsbøll P. J., Asmutis-Silvia R., et al. (2024). Before and after delisting: population dynamics of North Atlantic humpback whales over two decades in the Gulf of Maine. bioRxiv, 2024–2002. doi: 10.1101/2024.02.04.577870
Robbins J., Pace R. M. (2018). Trends in abundance of North Atlantic humpback whales in the Gulf of Maine (Report to the Northeast Fisheries Science Center), 1–40. Available at: https://repository.library.noaa.gov/view/noaa/22947.
Russell G., Christiansen F., Colefax A., Sprogis K. R., Cagnazzi D. (2023). Comparisons of morphometrics and body condition between two breeding populations of Australian humpback whales. Wildlife Res. 51. doi: 10.1071/WR23026
Savoca M. S., Czapanskiy M. F., Kahane-Rapport S. R., Gough W. T., Fahlbusch J. A., Bierlich K. C., et al. (2021). Baleen whale prey consumption based on high-resolution foraging measurements. Nature 599, 7883. doi: 10.1038/s41586–021-03991–5
Schick R. S., Goldstein J., Lutcavage M. E. (2004). Bluefin tuna (Thunnus thynnus) distribution in relation to sea surface temperature fronts in the Gulf of Maine, (1994–96). Fisheries Oceanography 13, 225–238. doi: 10.1111/j.1365-2419.2004.00290.x
Seidov D., Mishonov A., Parsons R. (2021). Recent warming and decadal variability of Gulf of Maine and Slope Water. Limnology Oceanography 66, 3472–3488. doi: 10.1002/lno.11892
Silva T., Gislason A., Licandro P., Marteinsdóttir G., Ferreira A. S. A., Gudmundsson K., et al. (2014). Long-term changes of euphausiids in shelf and oceanic habitats southwest, south and southeast of Iceland. J. Plankton Res. 36, 1262–1278. doi: 10.1093/plankt/fbu050
Stepanuk J. E. (2022). Habitat Use and Foraging Ecology of Rorquals in a Changing Ocean (Stony Brook University). Available at: http://proxy.library.stonybrook.edu/login?url=https://www.proquest.com/dissertations-theses/habitat-use-foraging-ecology-rorquals-changing/docview/2714067672/se-2.
Stepanuk J., Heywood E., Lopez J., DiGiovanni R. Jr., Thorne L. (2021). Age-specific behavior and habitat use in humpback whales: Implications for vessel strike. Mar. Ecol. Prog. Ser. 663, 209–222. doi: 10.3354/meps13638
Stephens P. A., Boyd I. L., McNamara J. M., Houston A. I. (2009). Capital breeding and income breeding: Their meaning, measurement, and worth. Ecology 90, 2057–2067. doi: 10.1890/08–1369.1
Stevick P., Allen J., Clapham P., Friday N., Katona S., Larsen F., et al. (2003). North Atlantic humpback whale abundance and rate of increase four decades after protection from whaling. Mar. Ecol. Prog. Ser. 258, 263–273. doi: 10.3354/meps258263
Stevick P. T., Allen J., Clapham P. J., Katona S. K., Larsen F., Lien J., et al. (2006). Population spatial structuring on the feeding grounds in North Atlantic humpback whales (Megaptera novaeangliae). J. Zoology 270, 244–255. doi: 10.1111/j.1469–7998.2006.00128.x
Stewart J., Durban J., Europe H., Fearnbach H., Hamilton P. K., Knowlton A. R., et al. (2022). Larger females have more calves: Influence of maternal body length on fecundity in North Atlantic right whales. Mar. Ecol. Prog. Ser. 689, 179-189. doi: 10.3354/meps14040
Straneo F., Heimbach P. (2013). North Atlantic warming and the retreat of Greenland’s outlet glaciers. Nature 504, 36–43. doi: 10.1038/nature12854
Swingle W. M., Barco S., Pitchford T., McLellan W., Pabst D. A. (1993). Appearance of juvenile humpback whales feeding in the nearshore waters of Virginia. Mar. Mammal Sci. 9, 309–315. doi: 10.1111/J.1748–7692.1993.TB00458.X
Todd R. E., Ren A. S. (2023). Warming and lateral shift of the Gulf Stream from in situ observations since 2001. Nat. Climate Change 13, 1348–1352. doi: 10.1038/s41558–023-01835-w
Torres W. I., Bierlich K. (2020). MorphoMetriX: a photogrammetric measurement GUI for morphometric analysis of megafauna. J. Open Source Software 5, 1825. doi: 10.21105/joss.01825
Torres L. G., Bird C. N., Rodríguez-González F., Christiansen F., Bejder L., Lemos L., et al. (2022). Range-wide comparison of gray whale body condition reveals contrasting sub-population health characteristics and vulnerability to environmental change. Front. Mar. Sci. 9. doi: 10.3389/fmars.2022.867258
Townsend D. W. (1991). Influences of oceanographic processes on the biological productivity of the Gulf of Maine. Rev. Aquat. Sci. 5, 211–230.
Våge K., Papritz L., Håvik L., Spall M. A., Moore G. W. K. (2018). Ocean convection linked to the recent ice edge retreat along east Greenland. Nat. Commun. 9, 1287. doi: 10.1038/s41467–018-03468–6
Van Der Hoop J. M., Moore M. J., Barco S. G., Cole T. V., Daoust P.-Y., Henry A. G., et al. (2013). Assessment of management to mitigate anthropogenic effects on large whales. Conserv. Biol. 27, 121–133. doi: 10.1111/j.1523–1739.2012.01934.x
Van Der Hoop J. M., van der Corkeron P., Henry A. G., Knowlton A., Moore M. (2017). Predicting lethal entanglements as a consequence of drag from fishing gear. Mar. pollut. Bull. 115 1–2, 91–104. doi: 10.1016/j.marpolbul.2016.11.060
Van Der Hoop J. M., van der Corkeron P., Moore M. (2016). Entanglement is a costly life-history stage in large whales. Ecol. Evol. 7, 92–106. doi: 10.1002/ece3.2615
Víkingsson G. A., Elvarsson B. Þ., Ólafsdóttir D., Sigurjónsson J., Chosson V., Galan A. (2014). Recent changes in the diet composition of common minke whales (Balaenoptera acutorostrata) in Icelandic waters. A consequence of climate change? Mar. Biol. Res. 10, 138–152. doi: 10.1080/17451000.2013.793812
Vikingsson G. A., Pike D. G., Valdimarsson H., Schleimer A., Gunnlaugsson T., Silva T., et al. (2015). Distribution, abundance, and feeding ecology of baleen whales in Icelandic waters: Have recent environmental changes had an effect? Front. Ecol. Evol. 3. doi: 10.3389/fevo.2015.00006
Warton D. I., Duursma R. A., Falster D. S., Taskinen S. (2012). smatr 3—An R package for estimation and inference about allometric lines. Methods Ecol. Evol. 3, 257–259. doi: 10.1111/j.2041-210X.2011.00153.x
Warton D., Duursma R., Falster D., Taskinen S. (2018) smatr: (Standardised) major axis Estimation and Testing Routines. Available online at: https://CRAN.R-project.org/package=smatr.
Warton D. I., Weber N. C. (2002). Common slope tests for bivariate errors-in-variables models. Biometrical J. 44, 161–174. doi: 10.1002/1521–4036(200203)44:2<161::AID-BIMJ161>3.0.CO;2-N
Warton D. I., Wright I. J., Falster D. S., Westoby M. (2006). Bivariate line-fitting methods for allometry. Biol. Rev. 81, 259. doi: 10.1017/S1464793106007007
Weinrich M. (1998). Early experience in habitat choice by humpback whales (Megaptera novaeangliae). J. Mammalogy 79, 163–170. doi: 10.2307/1382851
Wenzel F. W., Broms F., López-Suárez P., Lopes K., Veiga N., Yeoman K., et al. (2020). Humpback whales (Megaptera novaeangliae) in the cape verde islands: migratory patterns, resightings, and abundance. Aquat. Mammals 46, 21–31. doi: 10.1578/AM.46.1.2020.21
Wiley D., Asmutis R., Pitchford T., Gannon D. (1995). Stranding and mortality of humpback whales, Megaptera novaeangliae, in the mid-Altantic and southeast United States 1985–1992. J. Fish. Bull 93, 1, 196–205.
Williams R., Víkingsson G., Gislason A., Lockyer C., New L., Thomas L., et al. (2013). Evidence for density-dependent changes in body condition and pregnancy rate of North Atlantic fin whales over four decades of varying environmental conditions. Ices J. Mar. Sci. 70, 1273–1280. doi: 10.1093/ICESJMS/FST059
Keywords: Megaptera novaeangliae, baleen whale, body volume, body Size, habitat, unoccupied aerial systems, body mass
Citation: Napoli C, Hirtle N, Stepanuk J, Christiansen F, Heywood EI, Grove TJ, Stoller A, Dodds F, Glarou M, Rasmussen MH, Lonati GL, Davies KTA, Videsen S, Simon MJ, Boye TK, Zoidis A, Todd SK and Thorne LH (2024) Drone-based photogrammetry reveals differences in humpback whale body condition and mass across North Atlantic foraging grounds. Front. Mar. Sci. 11:1336455. doi: 10.3389/fmars.2024.1336455
Received: 10 November 2023; Accepted: 27 May 2024;
Published: 26 June 2024.
Edited by:
Mark Meekan, University of Western Australia, AustraliaReviewed by:
Leigh Gabriela Torres, Oregon State University, United StatesCopyright © 2024 Napoli, Hirtle, Stepanuk, Christiansen, Heywood, Grove, Stoller, Dodds, Glarou, Rasmussen, Lonati, Davies, Videsen, Simon, Boye, Zoidis, Todd and Thorne. This is an open-access article distributed under the terms of the Creative Commons Attribution License (CC BY). The use, distribution or reproduction in other forums is permitted, provided the original author(s) and the copyright owner(s) are credited and that the original publication in this journal is cited, in accordance with accepted academic practice. No use, distribution or reproduction is permitted which does not comply with these terms.
*Correspondence: Chelsi Napoli, Y2hlbHNpLm5hcG9saUBzdG9ueWJyb29rLmVkdQ==
Disclaimer: All claims expressed in this article are solely those of the authors and do not necessarily represent those of their affiliated organizations, or those of the publisher, the editors and the reviewers. Any product that may be evaluated in this article or claim that may be made by its manufacturer is not guaranteed or endorsed by the publisher.
Research integrity at Frontiers
Learn more about the work of our research integrity team to safeguard the quality of each article we publish.