
94% of researchers rate our articles as excellent or good
Learn more about the work of our research integrity team to safeguard the quality of each article we publish.
Find out more
ORIGINAL RESEARCH article
Front. Mar. Sci., 12 February 2024
Sec. Marine Fisheries, Aquaculture and Living Resources
Volume 11 - 2024 | https://doi.org/10.3389/fmars.2024.1334761
This article is part of the Research TopicSea Cucumbers: The Sustainability of Emergent and Historical ResourcesView all 12 articles
 Bohong Liu1,2,3
 Lili Xing1,2,3*
 Shilin Liu1,2,3
 Lina Sun1,2,3*
 Fang Su1,2,3
 Wei Cui1,2,3Chunxi Jiang1,2,3
Sea cucumber (Apostichopus japonicus) is one of the cultured species with the highest production value to a single species in China’s marine agricultural industry with high nutritional and medicinal value. Body color influences numerous biological functions in sea cucumbers, and it has become a key trait in selective breeding. It is found that a cultivation environment with strong light intensity leads to a lighter body color of A. japonicus compared to dark conditions. However, little research has been conducted on the molecular mechanisms regulating body color in different breeding environments. In this study, we used Illumina sequencing to examine gene expression patterns in green and purple A. japonicus exposed to different culture conditions. Overall, the genes in the body wall of purple individuals were more affected by the environment. We also identified pathways that were potentially influenced by the breeding environment, such as “Drug metabolism - cytochrome P450”, “Porphyrin and chlorophyll metabolism”, “Phosphatidylinositol signaling system”, “TGF-beta signaling”, and “mTOR signaling”. The aim of this study was to determine the light conditions and breeding environment that are more favorable to the requirements of body color in A. japonicus and apply them to the selection of high-quality breeds. The results obtained will support the breeding of A. japonicus with specific traits and the production of seedlings to promote the development of this maricultural industry.
Factors associated with the breeding environment, such as light, water temperature, water depth, salinity, dissolved oxygen, pH, and culture cycle, significantly affect sea cucumbers (Jiang et al., 2016). Light in particular is essential for various biological activities and is an important environmental factor for the survival and proliferation of sea cucumbers (Yaguchi and Yaguchi, 2021). Moreover, light intensity, as an important environmental factor for the growth of aquatic organisms, can directly or indirectly affect animal feeding, phototaxis, clustering and diurnal activity rhythms (Li et al., 2020). Light intensity (lx) refers to the luminous flux of visible light received per unit area. It has been shown that Tridacna crocea, which is characterized by blue outer coat membranes, exhibits different color changes at different light intensities, with the color variation produced at 15,000 lx. being more significant than that at 5,000 lx and 10,000 lx. (Liu et al., 2021). Graham and Hutchison (1979) investigated diurnal activity rhythms in three freshwater turtle species (Chrysemys picta, Clemmys guttata, and Sternotherus odoratus) under different light cycles and showed that they became diurnal under long photoperiods (16L:8D) and nocturnal under short photoperiods (8L:16D). Luo et al. (2022) showed that shortening the photoperiod reduced the magnitude of circadian activity rhythms in water snakes. Animals in nature exhibit circadian rhythms that are related not only to their organism, but also to the photoperiod in the breeding environment. Overall, light is an important factor influencing circadian rhythms, and many freshwater and marine species are exposed to optimal light conditions.
Light is an important factor in the development, survival, growth, and reproduction of animals. Numerous studies, conducted both in China and internationally, have investigated the responses of fish, shrimp, and sea cucumber larvae in light fields as well as their characteristics and body color (Wurts and Stickney, 1984; Primavera and Caballero, 1992; Wang et al., 2003; Moller and Naylor, 2009). However, only a few studies have been conducted on the influence of different light environments on body color formation in sea cucumbers, and they mostly consisted in exposing individuals to different artificially simulated light conditions to observe variations in their body color. Some investigations have shown that light affects body color in fish; for example, light was revealed as one of the most important causes of induced whitening in Paralichthys olivaceus (Guan et al., 2008; Wang et al., 2008a; Wang et al., 2008b; Wang, 2017). In Siniperca scherzeri, body color change was also shown to be related to light: the stronger the light intensity, the darker the black of the body surface, but when light intensity was weak, the black color faded and yellow emerged, and under dark conditions, both black and yellow disappeared (Wang, 2003; Miao et al., 2013). Black-eyed goldfish reared in dark conditions was shown to exhibit the slowest growth rate along with a non-obvious body color change, while they grew fastest and had significant body color change under natural light conditions (Wang et al., 2002). The body color of A. japonicus was shown to be directly dependent on the growing environment and to be specifically affected by light intensity and duration of light exposure in different regions and seasons (Xue et al., 2007; Jiang, 2011; Wang et al., 2012; Wang et al., 2016). At present, sea cucumbers inhabiting natural environments are mainly distributed in dark or light reef sides or other types of cover. In contrast, indoor reared environments are mainly dominated by less intense light or dark conditions. However, there is no literature to clarify the optimal light intensity for sea cucumber. Throughout evolution, sea cucumbers have developed a series of adaptive characteristics to variations in light. Studying the response mechanism of these organisms to light is of great scientific value for further research on breeding.
The key genes regulating the response of A. japonicus to light have not yet been examined. In the present study, we carried out the transcriptome analysis of RNA obtained from the body wall tissues of green and purple A. japonicus cultured under different breeding environments, and analyzed and verified the differentially expressed genes. The aim was to determine which breeding conditions are more favorable to the growth and development of A. japonicus and changes in body color so that they can be applied in the selection of high-quality breeds. The results of this study to the selection and breeding of good varieties of A. japonicus will contribute to promoting the development of the A. japonicus industry.
The experiment was carried out in the Rushan Branch of Shandong Orient Ocean Co., Ltd., using a total of four A. japonicus specimens with different colors. Two of them, one green (G) and one purple (P), were obtained from dark conditions and cultured on pellet feed mixed with seaweed and sea mud, while the other two, one light green (LG) and one light purple (LP), were obtained from natural environment. and fed on fermented pellet feed for sea cucumbers during the culture period. The experimental body wall was frozen in liquid nitrogen and stored at −80°C.
Total RNA was extracted using the Trizol kit (Invitrogen, Carlsbad, CA, USA) according to the manufacturer’s protocol. RNA quality was assessed on an Agilent 2100 bioanalyzer (Agilent, Palo Alto, CA, USA) and verified via agarose gel electrophoresis without RNase. After extraction, eukaryotic mRNA was enriched by Oligo (dT) magnetic beads, while prokaryotic mRNA was enriched by removing rRNA using the Ribo ZeroTM magnetic kit (Epicentre, Madison, WI, USA). The enriched mRNA was then broken into short fragments using fragmentation buffer and reverse transcribed into cDNA using random primers. cDNA was extracted using DNA polymerase I, RNase H, dNTPs, and buffer. It was then used for second-strand cDNA synthesis. The cDNA fragments were purified and end-repaired, and poly(A) was added. Then, the fragments with lengths ranging from 250 to 300 bp were screened using AMPure XP beads, PCR amplified, and the PCR products were purified again using the above-mentioned beads (NEBNex® Ultra™ RNA Library Prep Kit for Illumina®). Finally, the fragments were sequenced using an Illumina NovaSeq 6000 platform, and the raw reads were deposited into the Sequence Read Archive (SRA) database at the National Center for Biotechnology Information (NCBI) (TaxID: 307972).
The raw data is further filtered in order to obtain high quality clean reads. In addition, to ensure the quality and reliability of the data analysis, the reads with adapters, N (which indicated that the base information could not be determined), and low quality (reads with Qphred ≤ 20 bases accounting for more than 50% of the entire read length) were removed from the raw data. At the same time, Q20, Q30, and GC contents were calculated for the clean data. Then, the reference genome was obtained and the paired-end clean reads were mapped to it using HISAT2 v2.0.5.
Based on the results of principal component analysis (PCA), the 12 samples were divided into four groups (i.e., P, LP, G, and LG). Then, differential expression analysis was performed for P vs LP, G vs LG, and P vs G to identify DEGs between different colored A. japonicus. Genes with adjusted a value of P <0.05 found by DESeq2 were assigned as differentially expressed. Genes with a false discovery rate (FDR) ≤ 0.001 and a fold change ≥ 2.0 or ≤ 0.5 in pairwise comparisons were considered as DEGs and were functionally annotated in the NCBI Non-redundant protein (NR), Kyoto Encyclopedia of Genes and Genomes (KEGG), Swissprot, the protein family database (Pfam), Gene Ontology (GO), EuKaryotic Orthologous Groups (KOG), and Clusters of Orthologous Groups of proteins (COG) databases.
To validate the RNA-sequencing results, nine genes were randomly selected for real-time PCR. Primers were designed for optimal performance using primer 5 (Supplementary Table S3). Using the Prime Script™ RT Reagent Kit with genomic DNA Eraser (Takara), the RNA was reverse transcribed into single-stranded cDNA and adopted as a template for qRT-PCR. Actin was used as the reference gene. Supplementary Table S3 lists the primers (AJ-GEN F and AJ-GEN R) and actin primers (actin F and actin R) for the gene of A. japonicus. The mRNA expression levels of differently colored A. japonicus individuals were assessed using the SYBR® Premix ExTaq™ (Takara) kit. The reaction system was set up according to the instructions, with pre-denaturation at 95°C for 5 seconds, followed by 40 denaturation cycles at 95°C for 10 seconds each, denaturation at 60°C for 20 seconds, and extension at 72°C for 30 seconds. Finally, the melting curve was added. The expression level of mRNA was measured using the 2−ΔΔCt method.
The results of the experiments were expressed as mean ± standard deviation (SD). Data were analyzed using one-way analysis of variance (ANOVA) with multiple comparisons for significant differences in gene expression between groups, and the normal distribution of raw data was assessed via T-test. Statistical analyses were performed using GraphPad Prism version 8.0. P values < 0.05 were considered significant. Genes with P ≤ 0.05 and an absolute fold change of ≥ 2 were considered DEGs.
To understand the transcriptional regulation of different colors in A. japonicus, the three samples examined for each group, i.e., LP, P, G, and LG, were subjected to RNA sequencing (RNA-seq). A total of 12 cDNA libraries were constructed in this study. To ensure data quality, the raw data were filtered before information analysis to reduce the interference of invalid data. First, fastp (Chen et al., 2018) was used to perform quality control on the raw reads and filter low-quality data to obtain clean reads (Supplementary Table S1). RNA-seq generated 40, 141, 262-47, 613, and 400 high-quality clean reads. Then, the clean reads were compared to the ribosomal database for the species examined using the short read comparison tool HISAT2. The reads mapped to ribosomes in the comparison groups without allowing mismatches were removed and the unmapped reads were retained for subsequent transcriptome analysis. A reference genome-based comparison analysis was carried out in HISAT2. In total, 28, 534, 702-35, 058, 298 reads (67.9–76.98% of clean reads) were mapped to the A. japonicus genome (Supplementary Table S2).
To reveal the effect of breeding conditions on the body color of A. japonicus, the samples of LG and LP individuals grown in the natural environment and those of G and P individuals cultured under artificial breeding conditions were subjected to DEG analysis (P < 0.05). Overall, 989, 982, and 646 DEGs were detected in P vs LP, G vs LG, and P vs G, respectively. A total of 588 upregulated genes and 401 downregulated genes were differentially expressed between P and LP, and a total of 642 upregulated genes and 340 downregulated genes were differentially expressed between G and LG. In addition, 326 upregulated genes and 320 downregulated genes were differentially expressed between P and G individuals (Figure 1). To verify the expression of the identified DEGs, nine genes were selected for qRT-PCR. The RNA-seq results reported in Figure 2 are well in line with the qRT-PCR results (Tables 1–3).

Figure 1 Identification of differentially expressed genes (DEGs) in the body wall of A. japonicus after exposure to different breeding conditions. (A–C) represent the volcano plots of DEGs in P vs LP, G vs LG, and P vs G, respectively. The red and green dots indicate upregulated and downregulated genes, respectively. P, purple; LP, light purple; G, green; and LG, light green.
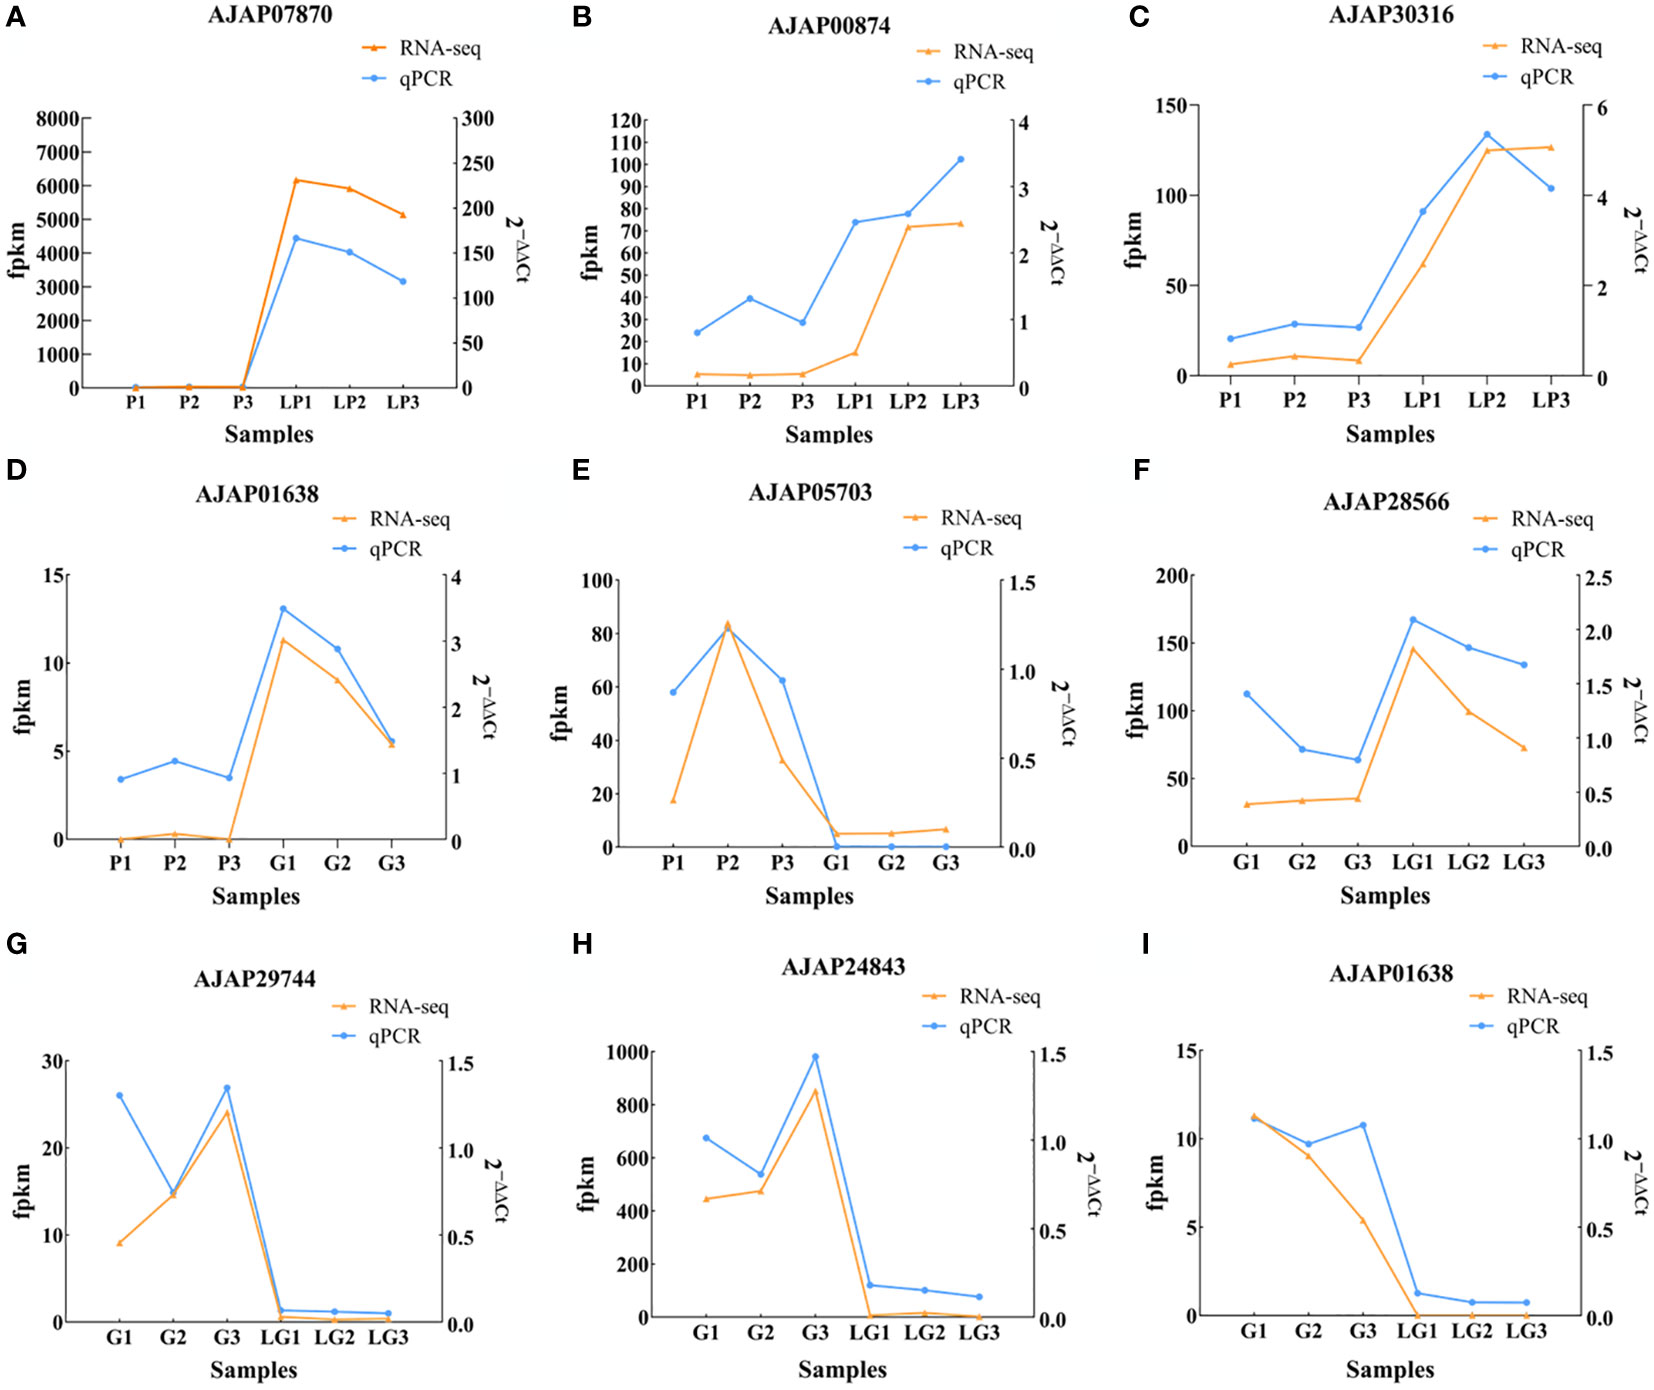
Figure 2 Graphs illustrating the differences in the relative expression of nine selected DEGs. (A–C) Differential expression of AJAP07870, AJAP00874, and AJAP30316 in the P vs LP group; (D, E) Differential expression of AJAP01638 and AJAP05703 in the P vs G group; (F–I) Differential expression of AJAP28566, AJAP29744, AJAP24843, and AJAP01638 in the G vs LG group.

Table 1 Selection of DEGs in purple (P) and light purple (LP) A. japonicus for RNA-seq and RT-PCR analysis.
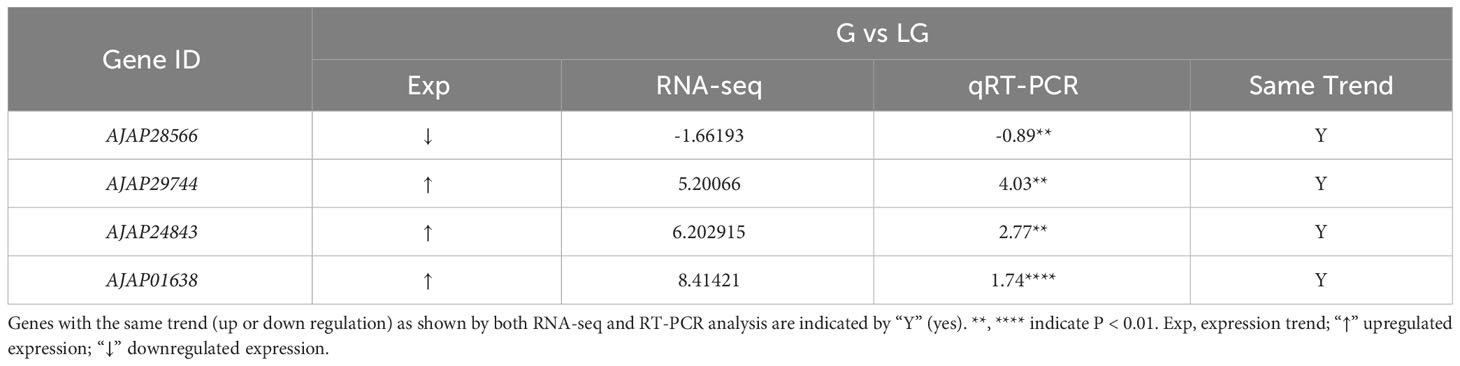
Table 2 Selection of DEGs in green (G) and light green (LG) A. japonicus for RNA-seq and RT-PCR analysis.
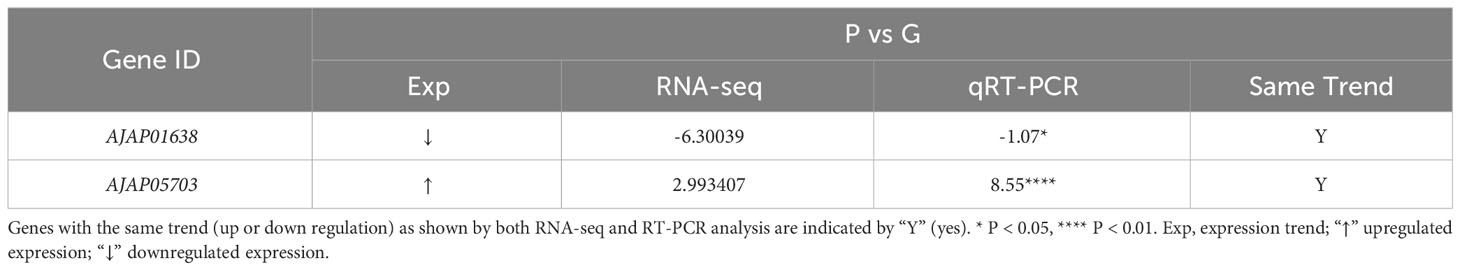
Table 3 Selection of DEGs in purple (P) and green (G) A. japonicus for RNA-seq and RT-PCR analysis.
To further understand the function of DEGs, GO term and Kyoto Encyclopedia of Genes and Genomes (KEGG) enrichment analyses were performed. After GO annotation, the DEGs in P vs LP were shown to be significantly enriched with 18 GO terms, including 10 biological processes and 8 molecular functions (Figure 3). The three most significantly enriched functional categories were “fucosyltransferase activity”, “protein tyrosine phosphatase activity”, and “protein glycosylation”. The DEGs in G vs LG were significantly enriched with 12 GO terms, including 2 biological processes and 10 cellular components (Figure 4). The three most significantly enriched functional categories were “tetrapyrrole binding”, “antioxidant activity”, and “peroxidase activity”. The DEGs in G vs P were significantly enriched in 241 GO terms, including 114 biological processes, 13 cellular components, and 114 molecular functions. However, the GO terms in these two groups were not significantly enriched in DEGs (Figure 5).
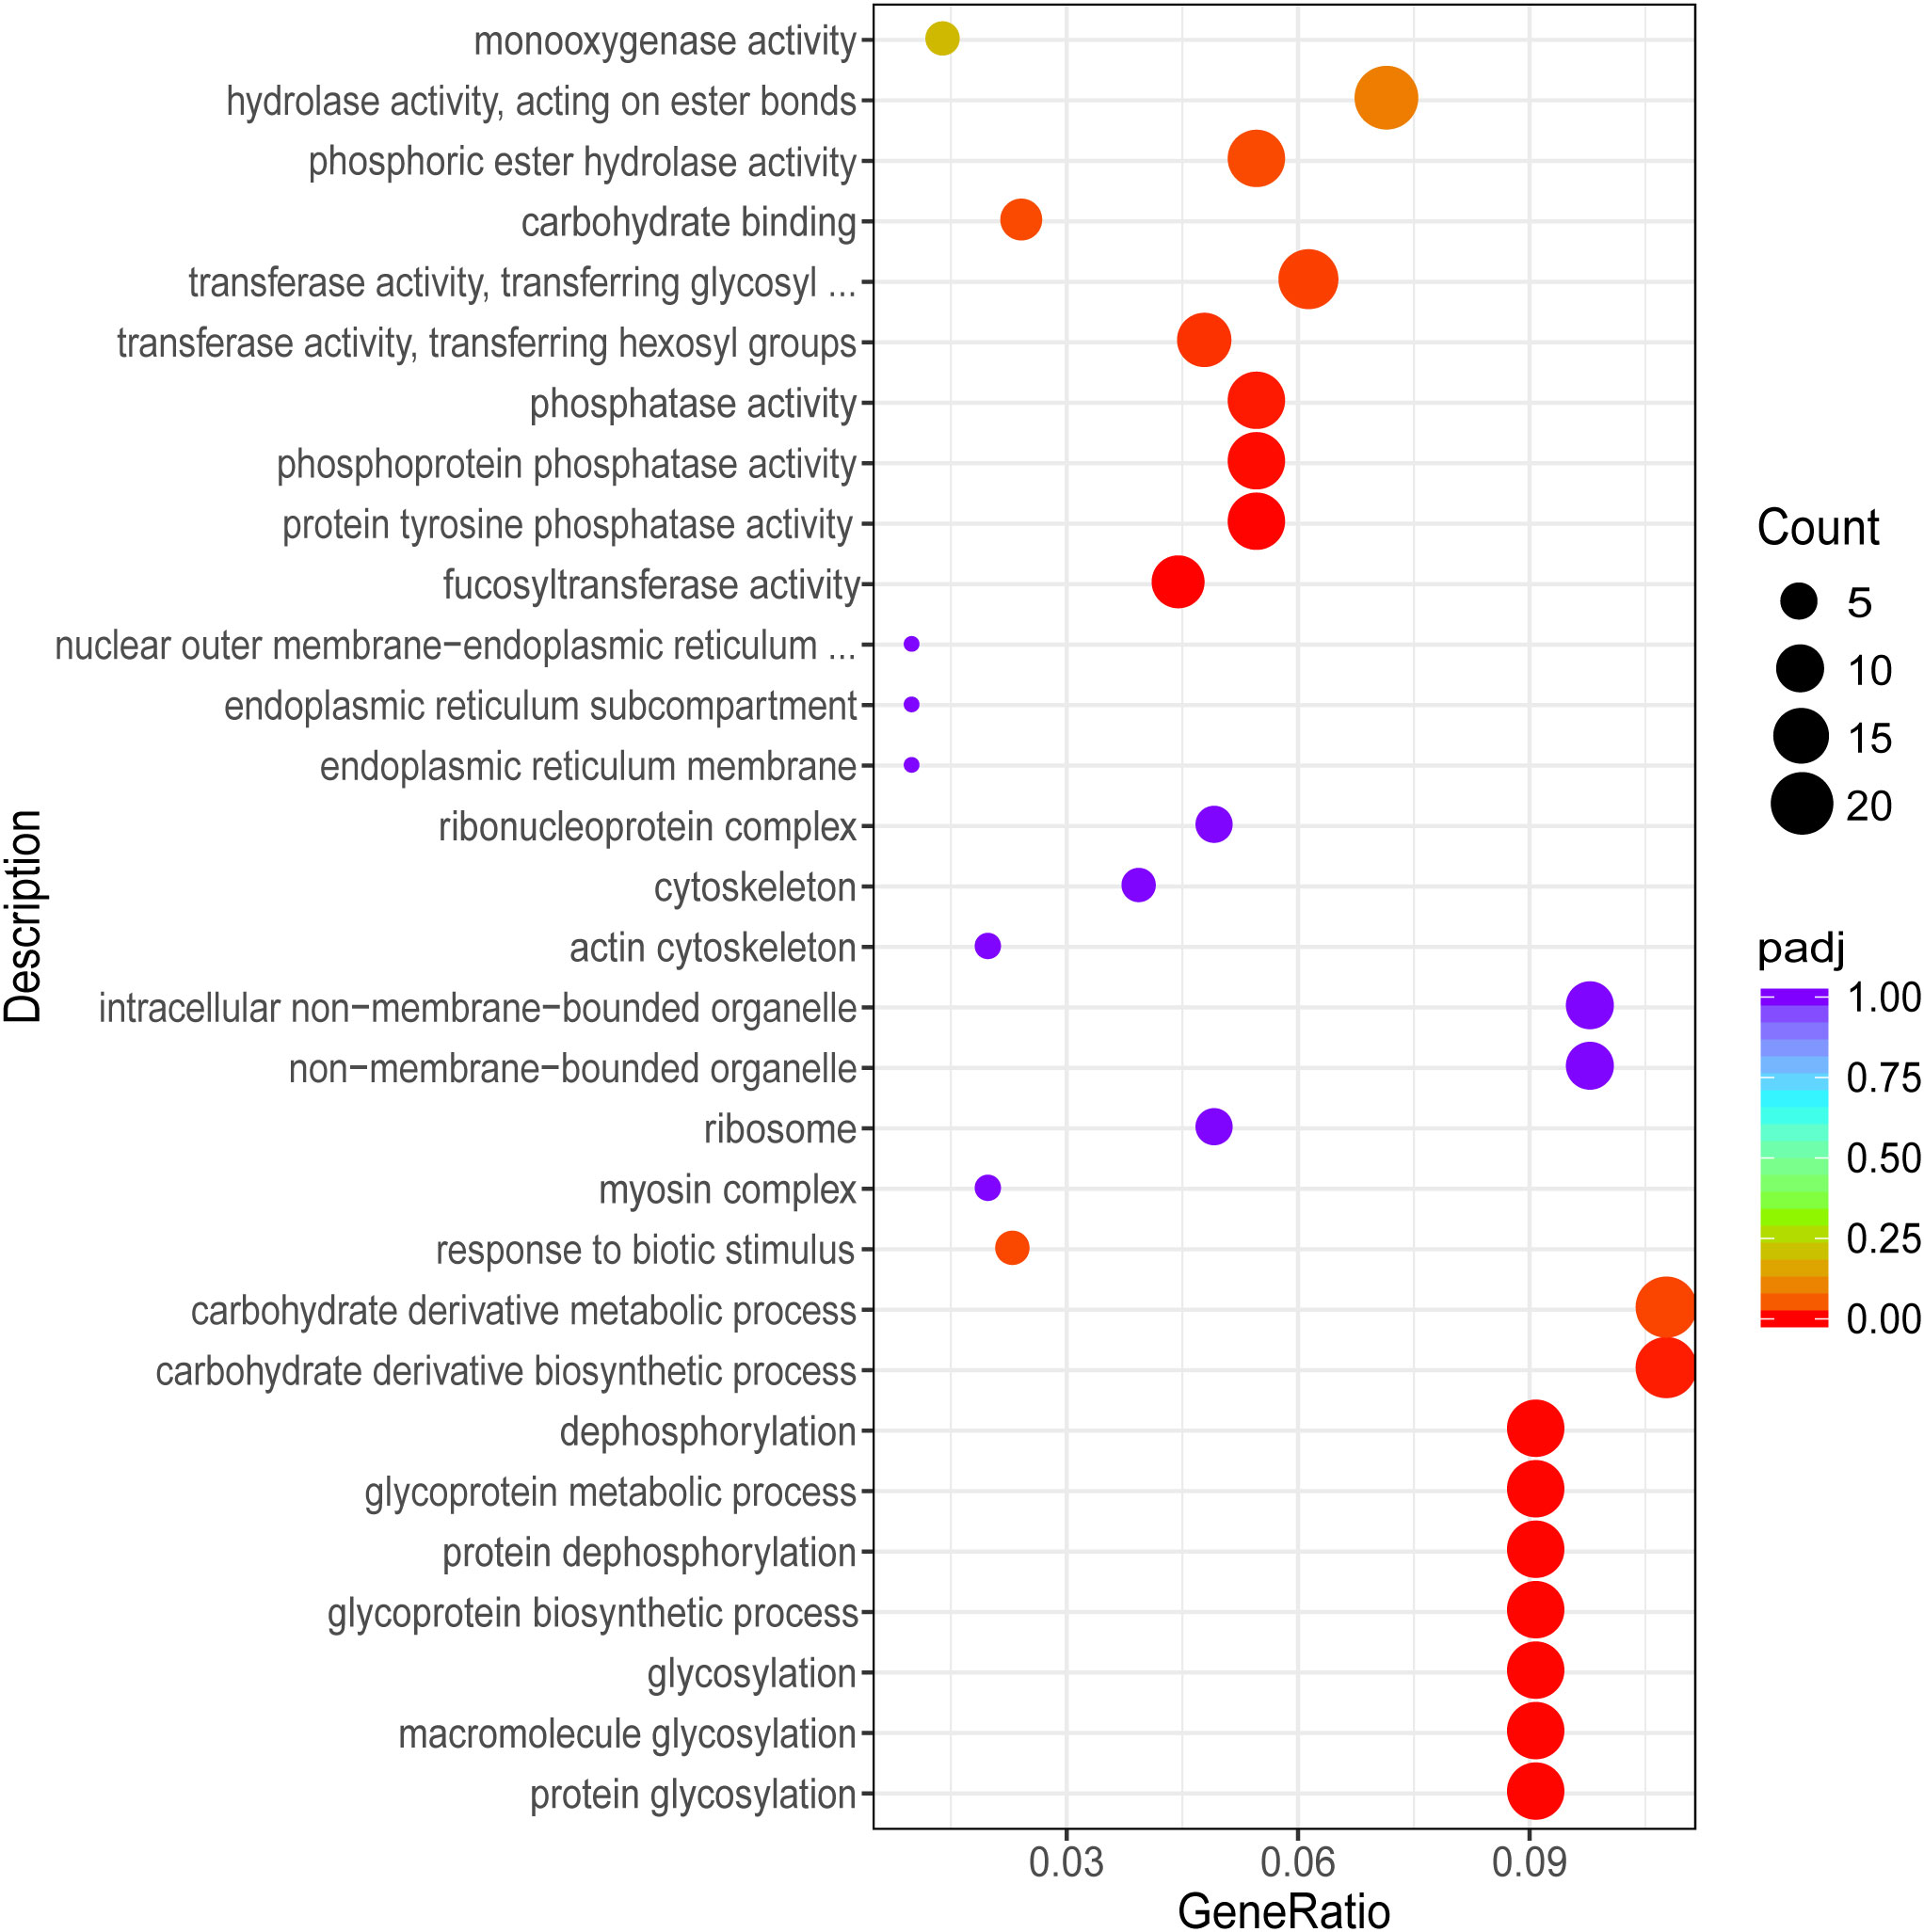
Figure 3 Scatterplot illustrating the GO enrichment of DEGs in P vs LP (P, purple; LP, light purple).
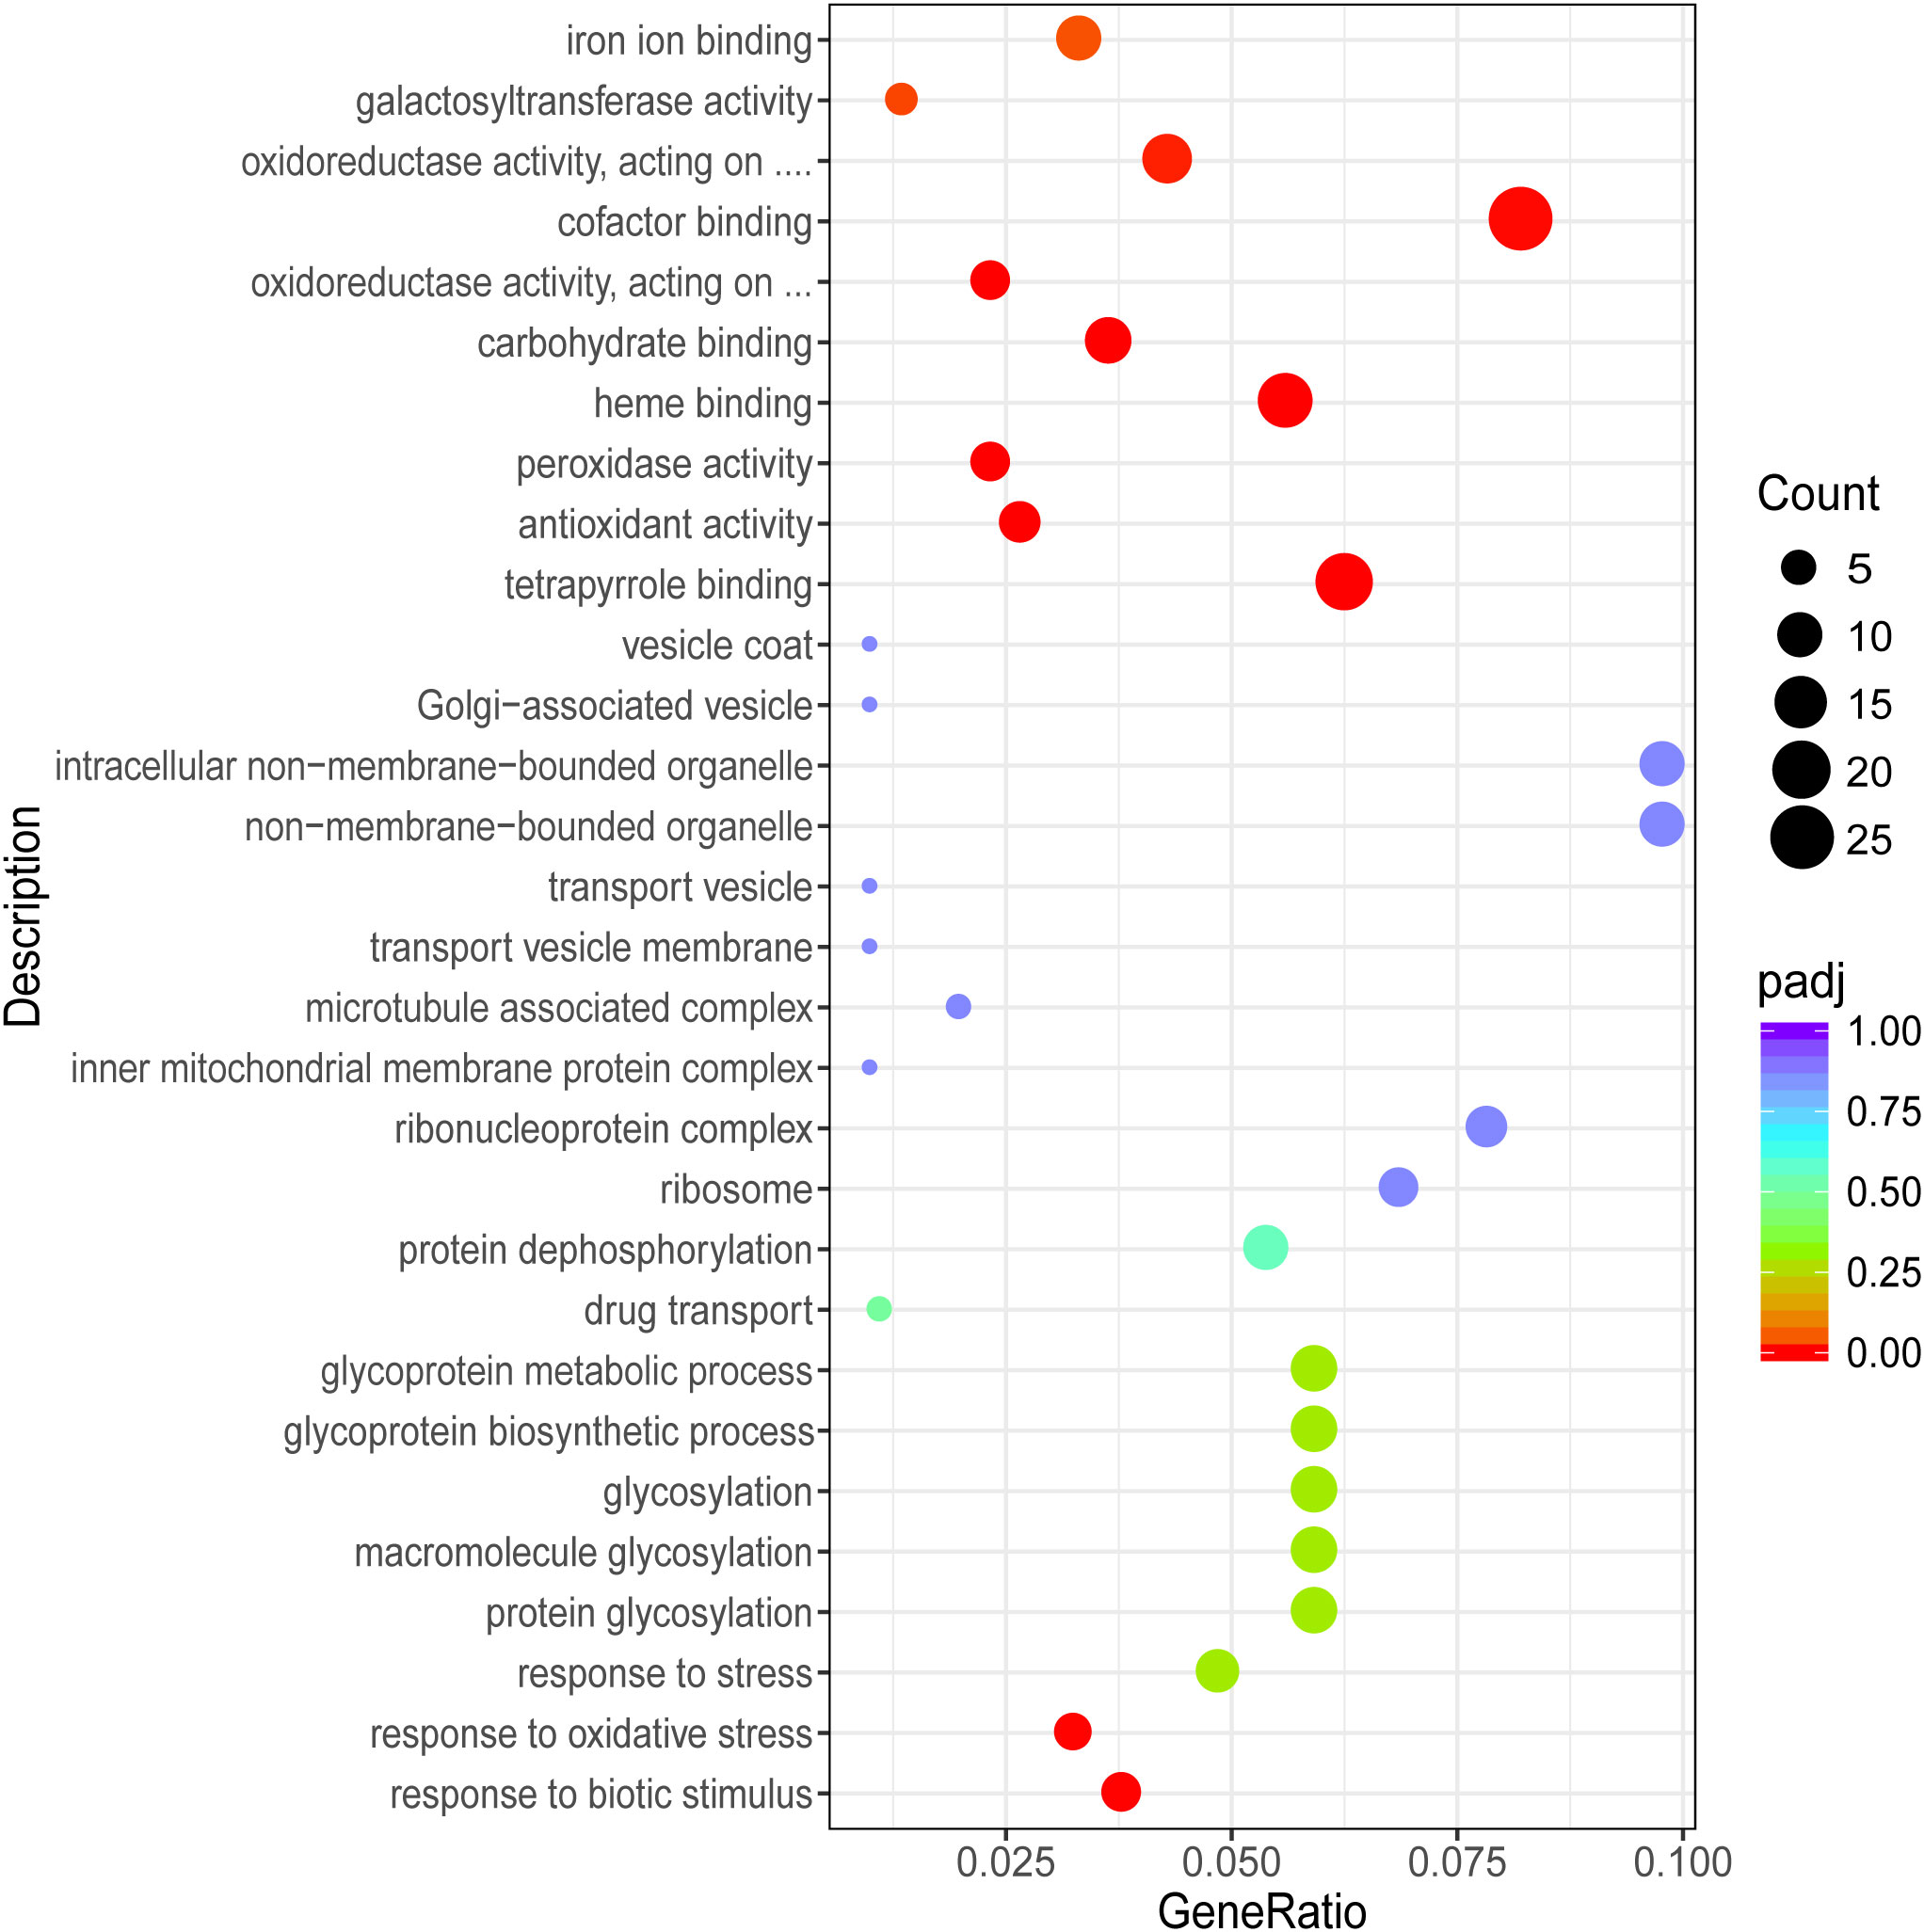
Figure 4 Scatterplot illustrating the GO enrichment of DEGs in G vs LG (G, green; LG, light green).
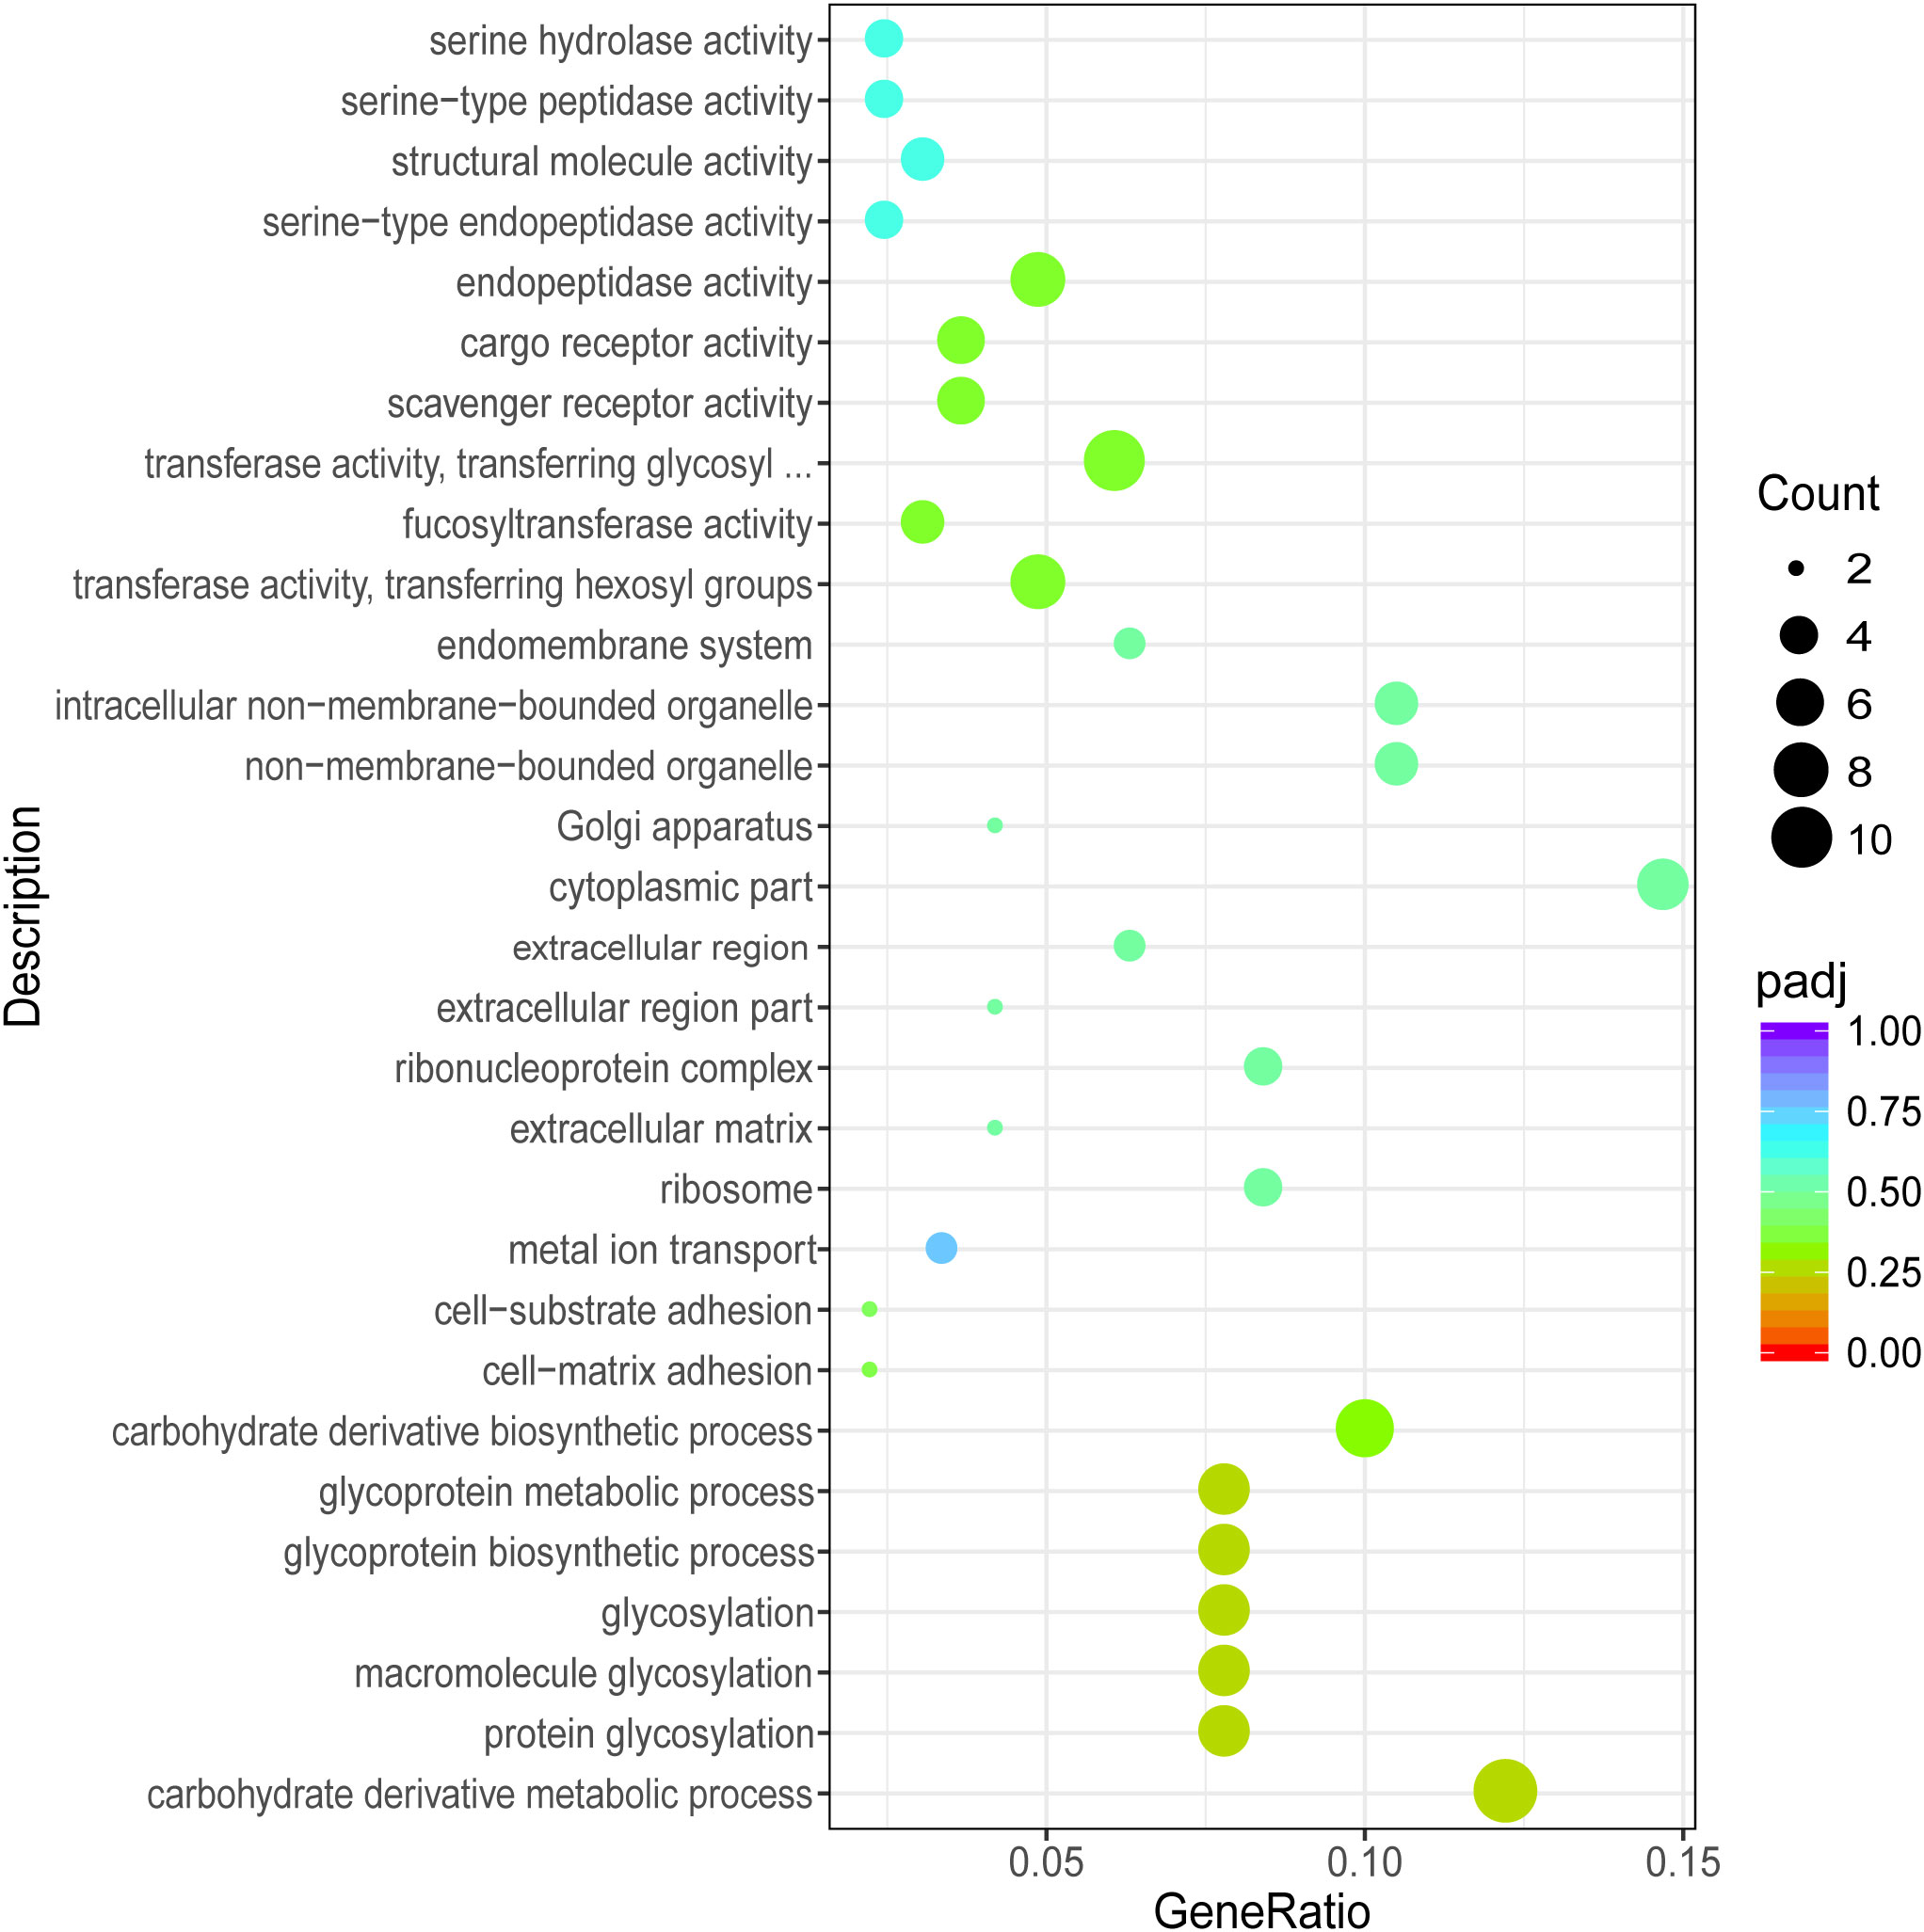
Figure 5 Scatterplot illustrating the GO enrichment of DEGs in P vs G (P, purple; G, green).
To further investigate their functionality, these DEGs were all mapped to the KEGG database. A hypergeometric test with a P value of 0.05 was used as the criterion for pathway detection. After the mapping, the 989 DEGs in the P vs LP group were divided into 54 pathways, of which two were significantly enriched (Table 4). The 982 DEGs in the G vs LG group were divided into 58 pathways, of which two (Table 5) were significantly enriched (P < 0.05). The 646 DEGs in the P vs G group were divided into 32 pathways, but none of them were significantly enriched (Figure 6). Two significantly enriched pathways were detected in P vs LP, i.e., “Drug metabolism - cytochrome P450” and “Arachidonic acid metabolism” and in G vs LG, i.e., “Oxidative phosphorylation” and “Arachidonic acid metabolism”.

Table 4 Enriched DEG pathways in P vs LP (P, purple; LP, light purple).

Table 5 Enriched DEG pathways in G vs LG (G, green; LG, light green).
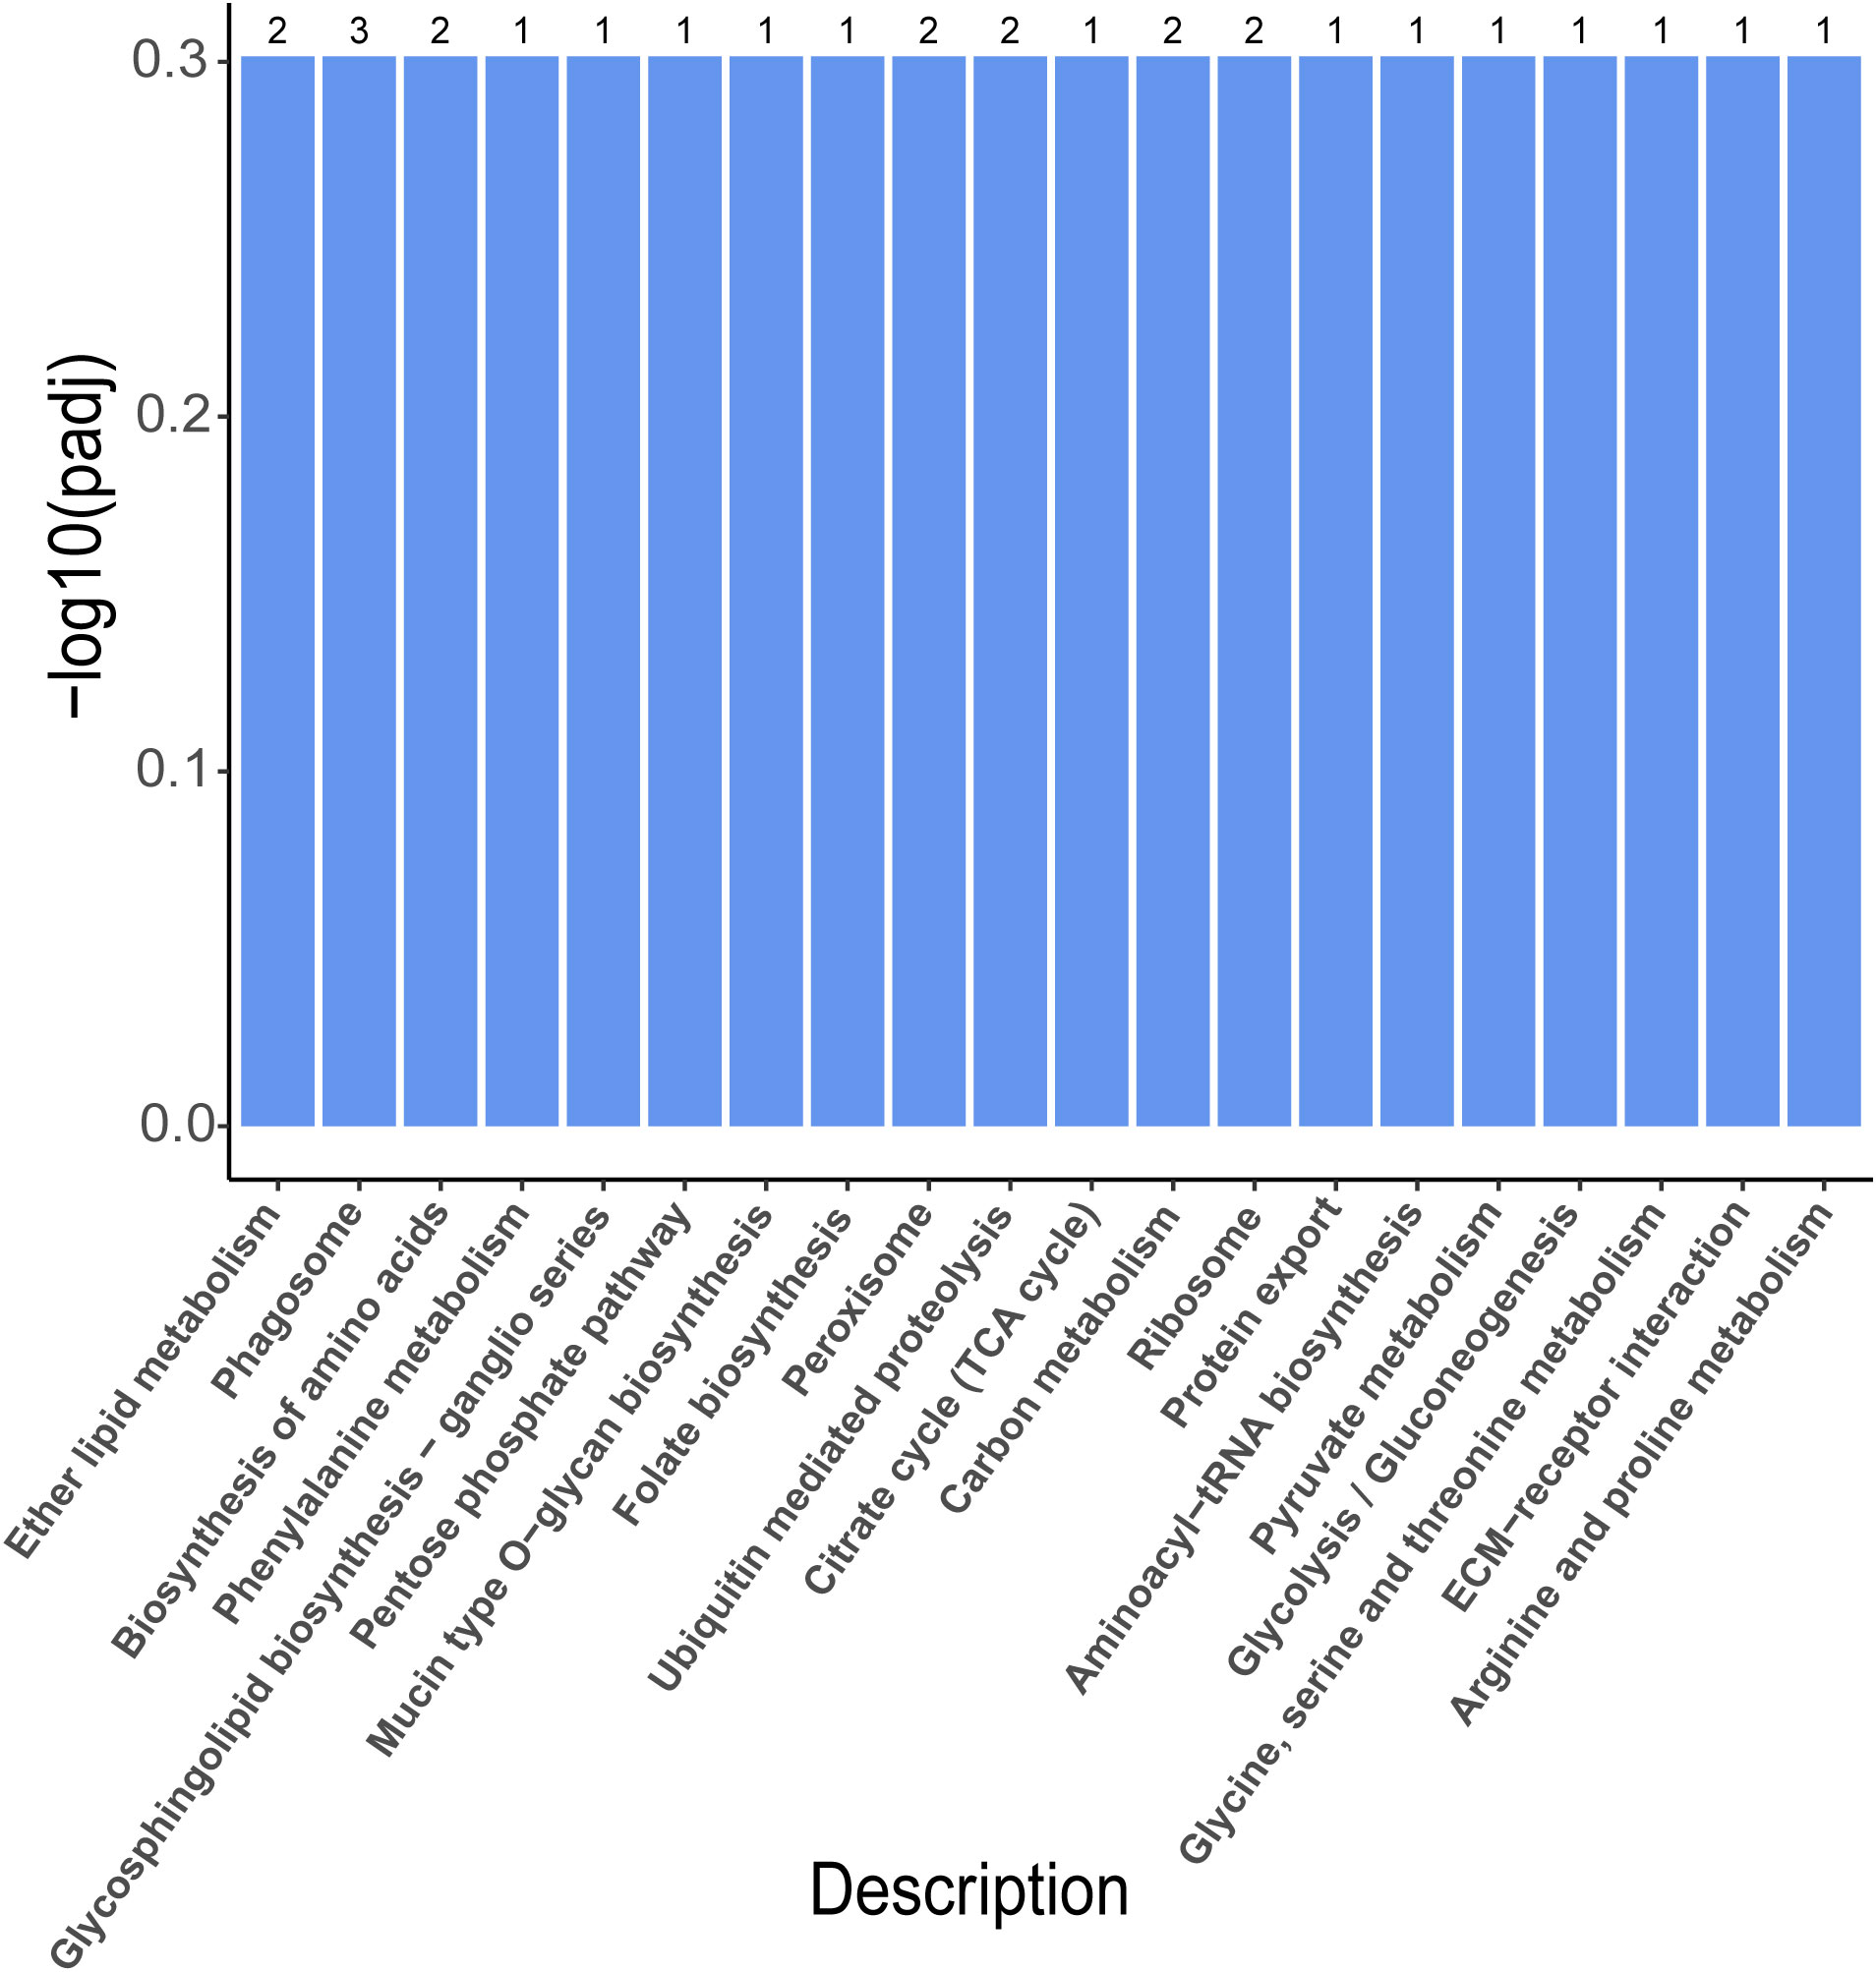
Figure 6 Histogram illustrating the KEGG enrichment of DEGs in P vs G. (P, purple; G, green).
To further understand the molecular mechanism of body color and growth in green and purple A. japonicus cultured in different breeding environments, the following enrichment pathways were selected for subsequent analysis: “Phosphatidylinositol signaling system”, “Wnt signaling”, “Drug metabolism - cytochrome P450”, “Porphyrin and chlorophyll”, “TGF-beta signaling”, and “mTOR signaling” (Tables 6–8).
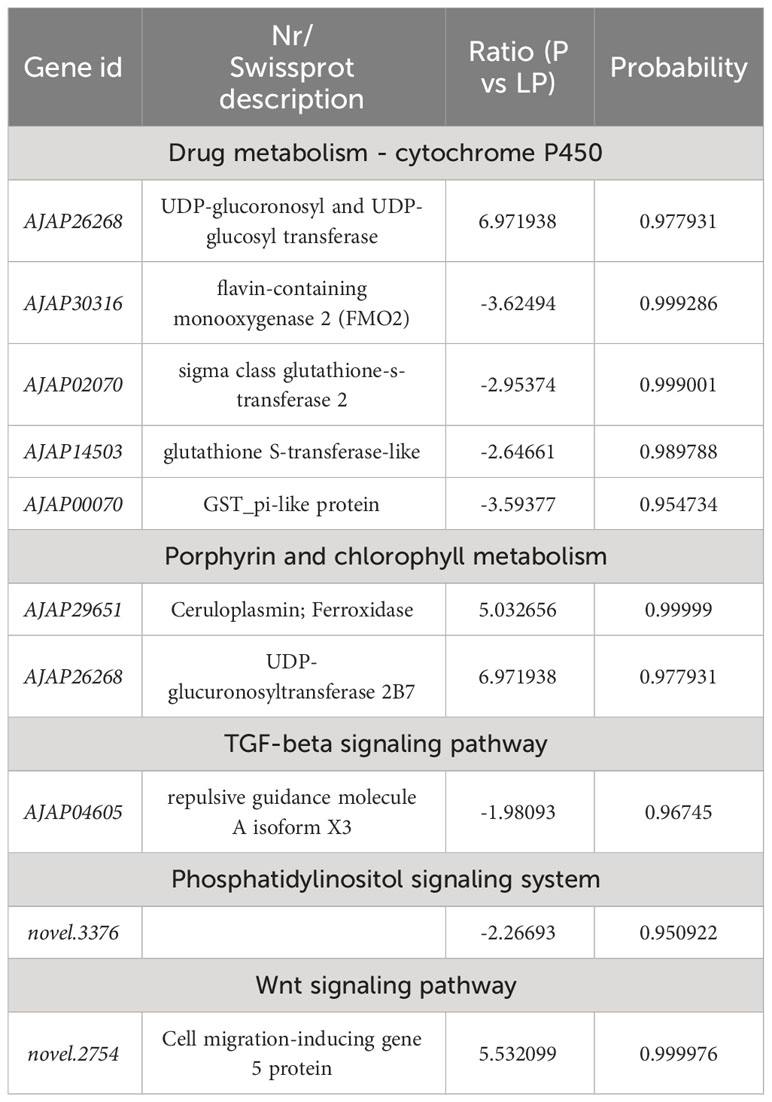
Table 6 Selected DEGs between purple (P) and light purple (LP) A. japonicus and associated enriched pathways.
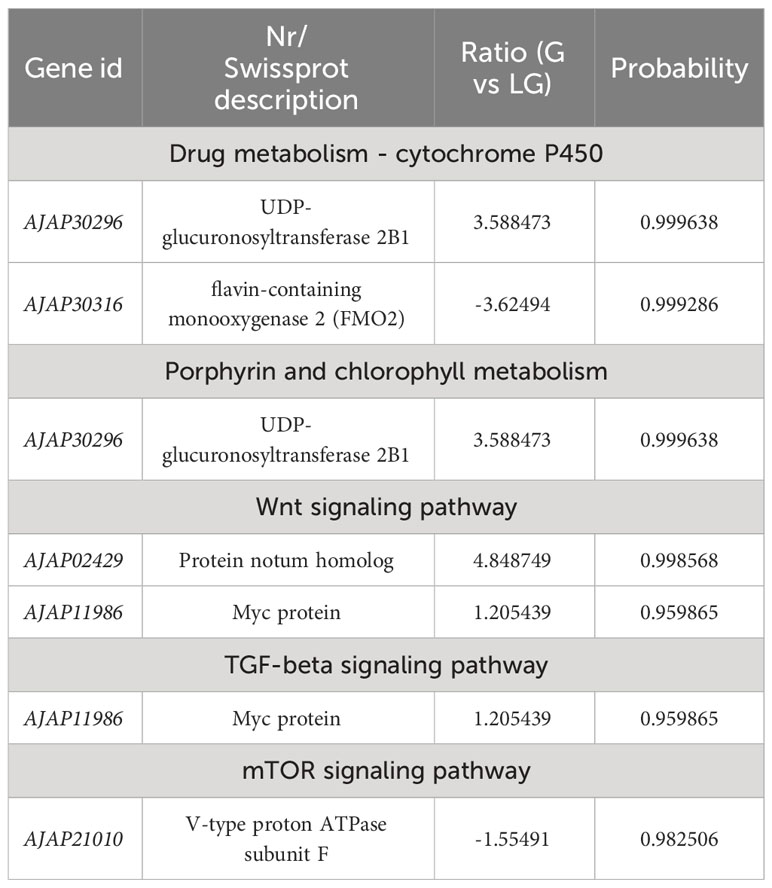
Table 7 Selected DEGs between green (G) and light green (LG) A. japonicus and associated enriched pathways.
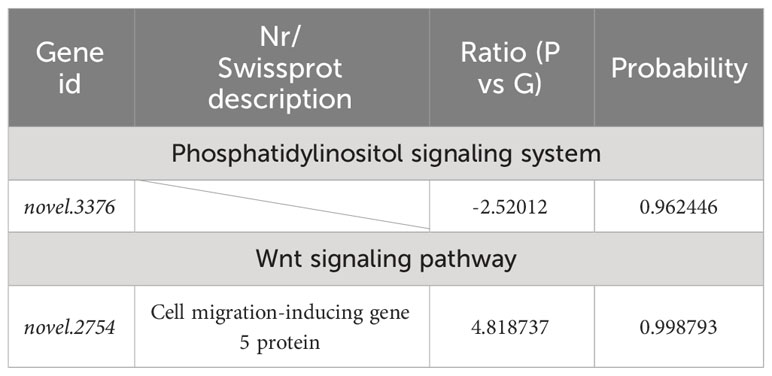
Table 8 Selected DEGs between purple (P) and green (G) A. japonicus and associated enriched pathways.
Pigment cells develop from the neural crest in the embryo and play an important role in the production of body color in animals (Streelman et al., 2007). However, in some species, these cells can rapidly change color by changing the position of pigments and reorienting reflective structures (Yu, 1996). The mechanisms of color change vary among species. For example, Chamaeleonidae where shown to use cell signals to change color (Stuart-Fox et al., 2007). Misumena vatia (Thomisidae) body color variation is related to the formation and location of ocular pigment granules (Insausti and Casas, 2008). Wnt signaling plays an important role in many developmental processes, including neural crest-derived melanocyte development (Cho et al., 2009). This pathway was shown to promote the differentiation of neural crest cells to melanocytes in mice (Dunn et al., 2000), while its inhibition was shown to reduce pigment cells in zebrafish (Dorsky et al., 1998). The family of macrophage migration inhibitory factors (e.g., FMO) are ancient and have been identified in bacteria, plants, and animals (Huang et al., 2016). These genes encode an inflammatory cytokine with reciprocal isomerase activity (Lubetsky et al., 2002; Calestani et al., 2003; Wessel et al., 2020; Spurrell et al., 2023). Dimethylaniline monooxygenase [N-oxide-forming] 2 (FMO2) (Bickel, 1971) is a mitochondria-specific factor involved in pigment cell expression but not in pigment biosynthesis. UDP-glucuronosyltransferase is an intracellular membrane protein that catalyzes the transfer of glucuronide from UDP glucuronic acid to lipophilic receptors. Glucuronidation plays an integral role in the metabolism of various endogenous substances, such as bilirubin and steroid hormones (Mackenzie, 1986; Mackenzie and Rodbourn, 1990; Stuart-Fox et al., 2007; Mroz et al., 2018). In the present study, UDP-glucuronosyltransferase in G vs LG was upregulated in the “Drug metabolism - cytochrome P450” and “Porphyrin and chlorophyll metabolism” pathways, while in P vs LP and G vs LG it was downregulated in the “Drug metabolism - cytochrome P450” pathway. FMO2 in both P vs LP and G vs LG was downregulated in “Drug metabolism - cytochrome P450”. These results indicate that both the upregulation of UDP-glucuronosyltransferase and the downregulation of FMO2 may lead to a decrease in the pigmentation of sea cucumbers in natural farming environments. These findings are more conducive to the light conditions and breeding environments required by the body color of the A. japonicus, and are applied to the selection of high-quality varieties.
The epidermal cells of sea cucumbers secrete mucus, and the epithelium serves to protect the body. Myc proteins (c-Myc, L-Myc, S-Myc, and N-Myc) are a class of transcription factors that regulate growth and cell cycle entry by inducing the expression of genes required for these processes (Zhu and Thompson, 2019). The mTOR protein kinase belongs to a major eukaryotic signaling network that regulates cell growth depending on environmental conditions and plays a fundamental role in cellular and organismal physiology (Dowling et al., 2010; Hoeffer and Klann, 2010; Laplante and Sabatini, 2012). Phosphatidylinositol 3-kinases (PI3Ks) are a protein family involved in the regulation of a variety of cellular functions, including cell survival, growth, metabolism, and glucose homeostasis (Fruman et al., 2017). TGF-beta superfamily ligands play an important role in the development and physiology of different animal species, among which TGF-beta signaling may be closely related to tumor progression (Gigante et al., 2012; Larson et al., 2020). TGF-beta signaling plays an important role in early embryonic development as well as in tissue and organ formation, immune surveillance, and the balance between tissue repair and homeostasis in the adult body (Heldin et al., 1997; Feng and Derynck, 2005; Qin et al., 2022; Li et al., 2023). The results of this study showed that in G vs LG, Myc protein genes were up-regulated in the “TGF-beta signaling” and “Wnt signaling” pathways. Myc gene products, especially c- Myc, play an important role in the induction of apoptosis and regulation of cell growth (Lourenco et al., 2021; Patange et al., 2022).
This is the first study to investigate the effects of different breeding environments on body color-related genes in green and purple A. japonicus using RNA-seq analysis. We identified five pathways involved in the regulation of pigmentation genes. Moreover, based on the number of identified DEGs, it was revealed that purple individuals were more susceptible to the breeding environment. Those grown in natural conditions were lighter in color compared to those grown in the dark, in which flavin-containing monooxygenase 2 (FMO2) (AJAP30316) and polyketide synthase (AJAP13983) showed significant downregulation. In particular, the former gene was also significantly enriched in “Drug metabolism - cytochrome P450”. In addition, GO and KEGG analyses revealed the presence of possible DEGs enriched in the following pathways: “Wnt signaling”, “Drug metabolism - cytochrome P450”, “Porphyrin and chlorophyll metabolism”, “Phosphatidylinositol signaling system”, “TGF-beta signaling”, and “mTOR signaling”. The results of this study provide important clues to better understand the effects of different breeding environments on green and purple A. japonicus and will contribute to the development of optimal culture strategies.
The datasets presented in this study can be found in online repositories. The names of the repository/repositories and accession number(s) can be found below: https://www.ncbi.nlm.nih.gov/, PRJNA989434.
The animal study was approved by Laboratory Animal of National Institute of Health. The study was conducted in accordance with the local legislation and institutional requirements.
BL: Writing – original draft. LX: Conceptualization, Writing – review & editing. SL: Methodology, Supervision, Writing – review & editing. LS: Supervision, Writing – review & editing. FS: Data curation, Writing – review & editing. WC: Data curation, Writing – review & editing. CJ: Data curation, Writing – review & editing.
The author(s) declare financial support was received for the research, authorship, and/or publication of this article. This study was supported by the National Natural Science Foundation of China (No. 42106109), the Natural Science Foundation of Shandong Province Youth Program (ZR2020QD100), the Strategic Priority Research Program of the Chinese Academy of Sciences (XDA24030304), and the Agricultural Seed Project of Shandong Province (2020LZGC015).
The authors declare that the research was conducted in the absence of any commercial or financial relationships that could be construed as a potential conflict of interest.
All claims expressed in this article are solely those of the authors and do not necessarily represent those of their affiliated organizations, or those of the publisher, the editors and the reviewers. Any product that may be evaluated in this article, or claim that may be made by its manufacturer, is not guaranteed or endorsed by the publisher.
The Supplementary Material for this article can be found online at: https://www.frontiersin.org/articles/10.3389/fmars.2024.1334761/full#supplementary-material
Bickel M. H. (1971). N-oxide formation and related reactions in drug metabolism. Xenobiotica 1 (4), 313–319. doi: 10.3109/00498257109041493
Calestani C., Rast J. P., Davidson E. H. (2003). Isolation of pigment cell specific genes in the sea urchin embryo by differential macroarray screening. Development 130, 4587–4596. doi: 10.1242/dev.00647
Chen S., Zhou Y., Chen Y., Gu J. (2018). fastp: an ultra-fast all-in-one FASTQ preprocessor. Bioinformatics 34 (17), i884–i890. doi: 10.1093/bioinformatics/bty560
Cho M., Ryu M., Jeong Y., Chung Y. H., Kim D. E., Cho H. S., et al. (2009). Cardamonin suppresses melanogenesis by inhibition of Wnt/beta-catenin signaling. Biochem. Biophys. Res. Commun. 390 (3), 500–505. doi: 10.1016/j.bbrc.2009.09.124
Dorsky R. I., Moon R. T., Raible D. W. (1998). Control of neural crest cell fate by the Wnt signalling pathway. Nature 396 (6709), 370–373. doi: 10.1038/24620
Dowling R. J., Topisirovic I., Fonseca B. D., Sonenberg N. (2010). Dissecting the role of mTOR: lessons from mTOR inhibitors. Biochim. Biophys. Acta 1804 (3), 433–439. doi: 10.1016/j.bbapap.2009.12.001
Dunn K. J., Williams B. O., Li Y., Pavan W. J. (2000). Neural crest-directed gene transfer demonstrates Wnt1 role in melanocyte expansion and differentiation during mouse development. Proc. Natl. Acad. Sci. U.S.A. 97 (18), 10050–10055. doi: 10.1073/pnas.97.18.10050
Feng X. H., Derynck R. (2005). Specificity and versatility in tgf-beta signaling through Smads. Annu. Rev. Cell Dev. Biol. 21, 659–693. doi: 10.1146/annurev.cellbio.21.022404.142018
Fruman D. A., Chiu H., Hopkins B. D., Bagrodia S., Cantley L. C., Abraham R. T. (2017). The PI3K pathway in human disease. Cell 170 (4), 605–635. doi: 10.1016/j.cell.2017.07.029
Gigante M., Gesualdo L., Ranieri E. (2012). TGF-beta: a master switch in tumor immunity. Curr. Pharm. Des. 18 (27), 4126–4134. doi: 10.2174/138161212802430378
Graham T. E., Hutchison V. H. (1979). Turtle diel activity: Response to different regimes of temperature and photoperiod. Comp. Biochem. Physiol. Part A: Physiol. 63 (2), 299–305. doi: 10.1016/0300-9629(79)90163-4
Guan J., Chang J., Chen W. (2008). Preliminary study on the recovery of body coloration in albino Paralichthys olivaceus. Qilu Fisheries 25 (6), 5–6. (Chinese)
Heldin C. H., Miyazono K., ten Dijke P. (1997). TGF-beta signalling from cell membrane to nucleus through SMAD proteins. Nature 390 (6659), 465–471. doi: 10.1038/37284
Hoeffer C. A., Klann E. (2010). mTOR signaling: at the crossroads of plasticity, memory and disease. Trends Neurosci. 33 (2), 67–75. doi: 10.1016/j.tins.2009.11.003
Huang W. S., Duan L. P., Huang B., Wang K. J., Zhang C. L., Jia Q. Q., et al. (2016). Macrophage migration inhibitory factor (MIF) family in arthropods: Cloning and expression analysis of two MIF and one D-dopachrome tautomerase (DDT) homologues in mud crabs, Scylla paramamosain. Fish Shellfish Immunol. 50, 142–149. doi: 10.1016/j.fsi.2016.01.030
Insausti T. C., Casas J. (2008). The functional morphology of color changing in a spider: development of ommochrome pigment granules. J. Exp. Biol. 211 (Pt 5), 780–789. doi: 10.1242/jeb.014043
Jiang S. (2011). Study On the Growth, Body Color and Biochemical Composition of Body Wall of Red Sea cucumber (Apostichopus japonicus) (Ph.D., Ocean University of China). (Chinese)
Jiang Y., Song H., Liu Y., Wei M., Wang X., Hu Y., et al. (2016). Cloning of the TYR gene of Amphilophus citrinellus, along with its developmental timing and tissue expression analysis. J. Agric. Biotechnol. 24 (5), 697–707. doi: 10.3969/j.issn.1674-7968.2016.05.008
Laplante M., Sabatini D. M. (2012). mTOR signaling in growth control and disease. Cell 149 (2), 274–293. doi: 10.1016/j.cell.2012.03.017
Larson C., Oronsky B., Carter C. A., Oronsky A., Knox S. J., Sher D., et al. (2020). TGF-beta: a master immune regulator. Expert Opin. Ther. Targets 24 (5), 427–438. doi: 10.1080/14728222.2020.1744568
Li J., Liu J., Cao X., Wang F., Li J., Zheng L., et al. (2020). Effects of light on growth, digestion and immunity of white, green and purple Apostichopus japonicus. J. Dalian Ocean Univ. 35 (2), 184–189. doi: 10.16535/j.cnki.dlhyxb.2019-057
Li Y., Deng D., Höfer C. T., Kim J., Heo W. D., Xu Q., et al. (2023). Liebig’s law of the minimum in the TGF-β pathway. bioRxiv 2023.2007.2010.548398. doi: 10.1101/2023.07.10.548398
Liu E., He Y., Gu Z., Shi Y., Wang A., Liu C. (2021). Effects of light intensity on the color change of the outer coat membrane of Tridacna crocea. Mar. Sci. 45 (1), 70–75. doi: 10.11759/hykx20200424002
Lourenco C., Resetca D., Redel C., Lin P., Macdonald A. S., Ciaccio R., et al. (2021). MYC protein interactors in gene transcription and cancer. Nat. Rev. Cancer 21, 579–591. doi: 10.1038/s41568-021-00367-9
Lubetsky J. B., Dios A., Han J., Aljabari B., Ruzsicska B., Mitchell R., et al. (2002). The tautomerase active site of macrophage migration inhibitory factor is a potential target for discovery of novel anti-inflammatory agents. J. Biol. Chem. 277 (28), 24976–24982. doi: 10.1074/jbc.M203220200
Luo H., Huang G., Li J., Yang Q., Zhu J., Zhang B., et al. (2022). De novo genome assembly and annotation of Holothuria scabra (Jaeger 1833) from nanopore sequencing reads. Genes Genomics 44 (12), 1487–1498. doi: 10.1007/s13258-022-01322-0
Mackenzie P. I. (1986). Rat liver UDP-glucuronosyltransferase. Sequence and expression of a cDNA encoding a phenobarbital-inducible form. J. Biol. Chem. 261 (13), 6119–6125. (Chinese)
Mackenzie P. I., Rodbourn L. (1990). Organization of the rat UDP-glucuronosyltransferase, UDPGTr-2, gene and characterization of its promoter. J. Biol. Chem. 265 (19), 11328–11332. doi: 10.1016/S0021-9258(19)38595-3
Miao T., Zhong Y., Qian K., Zhao J., Gan Y. (2013). Observations on the occurrence of body coloration in Siniperca chuatsi. J. Aquat. Sci. Technol. 40 (2), 57–59. doi: 10.3969/j.issn.1001-1994.2013.02.001
Moller T. H., Naylor E. (2009). Environmental influence on locomotor activity inNephrops norvegicus(Crustacea: decapoda). J. Mar. Biol. Assoc. United Kingdom 60 (1), 103–113. doi: 10.1017/s0025315400024152
Mroz A., Ryska I., Sominko H., Bejrowska A., Mazerska Z. (2018). Drug-drug interaction potential of antitumor acridine agent C-1748: The substrate of UDP-glucuronosyltransferases 2B7, 2B17 and the inhibitor of 1A9 and 2B7. Pharmacol. Rep. 70 (5), 972–980. doi: 10.1016/j.pharep.2018.03.007
Patange S., Ball D. A., Wan Y., Karpova T. S., Girvan M., Levens D., et al. (2022). MYC amplifies gene expression through global changes in transcription factor dynamics. Cell Rep. 38, 110292. doi: 10.1016/j.celrep.2021.110292
Primavera J. H., Caballero R. M. V. (1992). Light color and ovarian maturation in unablated and ablated giant tiger prawn Penaeus monodon (Fabricius). Aquaculture 108 (3-4), 247–256. doi: 10.1016/0044-8486(92)90110-7
Qin S. L., Guo Y., Li S. X., Zhou L., Maimaiti A., Akemu Y., et al. (2022). The role of the TGF-beta/LIF signaling pathway mediated by SMADs during the cyst formation of Echinococcus in young children. BMC Mol. Cell Biol. 23 (1), 50. doi: 10.1186/s12860-022-00452-3
Spurrell M., Oulhen N., Foster S., Perillo M., Wessel G. (2023). Gene regulatory divergence amongst echinoderms underlies appearance of pigment cells in sea urchin development. Dev. Biol. 494, 13–25. doi: 10.1016/j.ydbio.2022.11.008
Streelman J. T., Peichel C. L., Parichy D. M. (2007). Developmental genetics of adaptation in fishes: the case for novelty. Annu. Rev. Ecology Evolution Systematics 38 (1), 655–681. doi: 10.1146/annurev.ecolsys.38.091206.095537
Stuart-Fox D., Moussalli A., Whiting M. J. (2007). Natural selection on social signals: signal efficacy and the evolution of chameleon display coloration. Am. Nat. 170 (6), 916–930. doi: 10.1086/522835
Wang X. (2003). Observations on the changes of body coloration in Siniperca scherzeri. Chongqing Fisheries 3), 30–31. (Chinese)
Wang R. (2017). Mmu-143 Regulate the expression of Tyrp1a Gene and Establishment of Japanese Flounder Albinism Skin Cell Lines. (M.S., ShanghaiOceanUniversity). (Chinese).
Wang F., Dong S. L., Huang G. Q., Wu L. X., Tian X. L., Ma S. (2003). The effect of light color on the growth of Chinese shrimp Fenneropenaeus chinensis. Aquaculture 228 (1-4), 351–360. doi: 10.1016/S0044-8486(03)00312-0
Wang J., Hou L., Qi Z., Li D., Zhong Y., Yao F. (2008a). Tissue expression profile and protein structure analysis of the albinism-related motif Nzfp123 in Paralichthys olivaceus. J. Appl. Environ. Biol. 014 (6), 779–782. (Chinese)
Wang J., Hou L., Qi Z., Li D., Zhong Y., Yao F. (2008b). Tissue expression profile and protein structure analysis of the albinism-related gene zfp123 in Paralichthys olivaceus. J. Appl. Environ. Biol. 14 (6), 779–782. doi: 10.3724/sp.J.1145.2008.00779
Wang J., Xu Z., Zhang K., Jiang Y., Cong W., Zhang J., et al. (2012). Effects of different intensities and colors of light on the aggregation behavior of juvenile Apostichopus japonicus. J. Aquat. Sci. 25, 5–9. (Chinese)
Wang J., Zhao R., Gao H., Zhou X., Zhao Y. (2002). Effects of different food and light time on the body color and growth of the black eyed goldfish. Chin. Ornamental Fish 2), 24–26. (Chinese)
Wang X., Luo Y., Li D., Wu J., Jiang D., Guo Q. (2016). Effect of light level on color change and growth of juvenile Apostichopus japonicus. Hebei Fisheries 11-12, 62. (Chinese)
Wessel G. M., Kiyomoto M., Shen T. L., Yajima M. (2020). Genetic manipulation of the pigment pathway in a sea urchin reveals distinct lineage commitment prior to metamorphosis in the bilateral to radial body plan transition. Sci. Rep. 10, 1973. doi: 10.1038/s41598-020-58584-5
Wurts W. A., Stickney R. R. (1984). An hypothesis on the light requirements for spawning penaeid shrimp, with emphasis on Penaeus setiferus. Aquaculture 41 (2), 93–98. doi: 10.1016/0044-8486(84)90086-3
Xue S., Fang J., Mao Y., Zou J., Zhang J., Zhang Y. (2007). Effects of different light intensities on the growth of juvenile Apostichopus japonicus. Mar. Aquat. Res. 28, 13–18. (Chinese)
Yaguchi J., Yaguchi S. (2021). Sea urchin larvae utilize light for regulating the pyloric opening. BMC Biol. 19 (1), 64. doi: 10.1186/s12915-021-00999-1
Keywords: Apostichopus japonicus, transcriptome, body color, breeding environment, differentially expressed genes
Citation: Liu B, Xing L, Liu S, Sun L, Su F, Cui W and Jiang C (2024) Transcriptome analysis of purple and green Apostichopus japonicus reared under different breeding environments. Front. Mar. Sci. 11:1334761. doi: 10.3389/fmars.2024.1334761
Received: 07 November 2023; Accepted: 25 January 2024;
Published: 12 February 2024.
Edited by:
Ana Pombo, Center for Marine and Environmental Sciences (MARE- IPLeiria), PortugalReviewed by:
Ming Guo, Ningbo University, ChinaCopyright © 2024 Liu, Xing, Liu, Sun, Su, Cui and Jiang. This is an open-access article distributed under the terms of the Creative Commons Attribution License (CC BY). The use, distribution or reproduction in other forums is permitted, provided the original author(s) and the copyright owner(s) are credited and that the original publication in this journal is cited, in accordance with accepted academic practice. No use, distribution or reproduction is permitted which does not comply with these terms.
*Correspondence: Lili Xing, bGlsaXhpbmdAcWRpby5hYy5jbg==; Lina Sun, c3VubGluYUBxZGlvLmFjLmNu
Disclaimer: All claims expressed in this article are solely those of the authors and do not necessarily represent those of their affiliated organizations, or those of the publisher, the editors and the reviewers. Any product that may be evaluated in this article or claim that may be made by its manufacturer is not guaranteed or endorsed by the publisher.
Research integrity at Frontiers
Learn more about the work of our research integrity team to safeguard the quality of each article we publish.