 Yifei Liu
 Xiaoming Xia1,2*
 Tinglu Cai
- 1Second Institute of Oceanography, Ministry of Natural Resources, Hangzhou, China
- 2Key Laboratory of Ocean Space Resource Management Technology, Ministry of Natural Resources, Hangzhou, China
- 3Ocean College, Zhejiang University, Zhoushan, China
Tidal bay evolution is the result of the comprehensive influence of multiple factors. It is crucial to analyze the primary factors to disassemble the comprehensive effects. In this study, remote sensing and bathymetric data were used to investigate anthropogenic activities and geomorphological changes in Puba Bay, China. From 1964 to 2020, the intertidal zone area decreased by 64.5% due to mariculture ponds and coastal reclamation, with the former accounting for 60.4% of the total area. Over five decades, the bay experienced significant silting, with a 61.5% decrease in underwater area, an 88.4% decrease in volume, and considerable reductions in maximum water depth, cross-sectional terrain depth, and width. Anthropogenic activities led to a reduction in tidal prism and tidal velocity, resulting in increased flood dominance and decreased ebb dominance in the main channel, leading to more siltation. Negative and positive feedback mechanisms were observed between anthropogenic activities, seaward expansion of intertidal flats, and bay siltation. The influence of mariculture ponds, as the major factor, on geomorphological changes was found to be similar to that of coastal reclamation. To maintain water depth and capacity for material exchange in the bay, preliminary suggestions for mariculture pond management are proposed.
1 Introduction
Tidal flows move sediment into and out of tidal bays, generating tidal flats and channels and controlling their geomorphology. In general, an equilibrium status will be reached when the ebb tidal velocity is sufficient to flush out the sediment load being pushed into the bay during the flood tide (Serrano et al., 2013). However, such a static equilibrium rarely exists in coastal environments (Xie et al., 2017a). The dynamic equilibrium concept was proposed by Friedrichs (2011) where the choice of temporal scale is imperative to analyze the morphological equilibrium type (Zhou et al., 2017). Under the influence of natural drivers, tidal morphology generally reaches a dynamic equilibrium over annual or longer temporal scales (Friedrichs, 2011).
However, human actions have altered this natural evolutionary state (Jewell et al., 2012). Many anthropogenic activities, such as land reclamation, dock and port construction, and mariculture have relied on the resources of the mudflats and tidal channels of bays. These activities change the local terrain and boundaries of a bay, causing changes in hydrodynamics and sediment transport, resulting in topographic adjustments. The comprehensive effects of various anthropogenic activities dominate the evolution of a bay or an estuary (Dai et al., 2016; Wei et al., 2017; Mei et al., 2018; Zhao et al., 2018). Quantitatively disassembling these comprehensive effects is beneficial to the exploitation and management of a bay but also more challenging for a large bay with more anthropogenic activity. However, for a small bay with few types of large-scale anthropogenic activities, the relevance between anthropogenic activity and geomorphological change is evident. Analyzing this coupling relevance is useful for disassembling the comprehensive effects acting on a large bay.
Coastal reclamation is a major human activity in coastal areas (Jiang et al., 2015; Tian et al., 2016; Murray et al., 2022) and also a major factor contributing to changes in coastal evolution in these regions (Chen et al., 2022; Li et al., 2022). Previous research has concentrated on coastal reclamation effects on the hydrodynamics, sediment transport, and morphodynamics of tidal bays or estuaries (Van Maren et al, 2016; Sun et al., 2017; Yang and Chui, 2017; Gao et al., 2018; Liang et al., 2018). Long-term, large-scale coastal reclamation has reduced the area of coastal wetlands, markedly reduced the natural coastline, and harmed coastal ecosystems in China. In this regard, the Chinese government issued a notification strictly forbidding new commercial land reclamation after 2018. In this situation, the impact of other human activities on the evolution of the bay will become increasingly apparent. With large-scale distribution of offshore aquaculture, Puba Bay is well situated to research this impact. According to the most recent mariculture survey funded by the ‘Survey of Using Sea Areas for Aquatic Breeding in Zhejiang Province,’ the area of mariculture ponds in 2020 was 16 km2, accounting for > 45% of the intertidal flat area of Puba Bay. Moreover, mariculture pond influences are similar to those of coastal reclamation on hydrodynamics, sediment transport, and morphodynamics. However, the maricultural expansion effect on Puba Bay evolution has rarely been reported.
Here, we investigated the processes of major anthropogenic activities, and the changes in tidal dynamics, sediment transport, and morphology in Puba Bay over the last five decades. There are two types of major anthropogenic activities in Puba Bay: coastal reclamation, in which an enclosed area is filled with land, and mariculture pond building. Therefore, the effects of these on tidal dynamics and sediment transport in the bay were explored. Feedback mechanisms have been proposed to explain the relationship between morphological evolution and anthropogenic activity. The coupling effect between these is useful for coastal exploitation and management. Finally, preliminary suggestions for mariculture pond management are proposed.
2 Study area
Puba Bay is located on the east coast of Zhejiang Province, Southeastern China (Figure 1). Low hills surround the bay on its north, west, and south sides. Kuotangshan Island is located at the eastern mouth of the bay, dividing it into two channels that connect to the East China Sea: the Niutoumen Channel (NTC) and the Baidaimen Channel (BDC). The width at the mouth and length of the bay are approximately 5 and 19 km, respectively. According to the latest 2019 coastline survey, the sea area in Puba Bay was calculated as 57 km2. Compared to nearby Hangzhou Bay and Sanmen Bay, with areas of 5000 and 480 km2, respectively (ECCHE, 1992), the size of Puba Bay decreases by one to two orders of magnitude and is therefore considered a small bay.
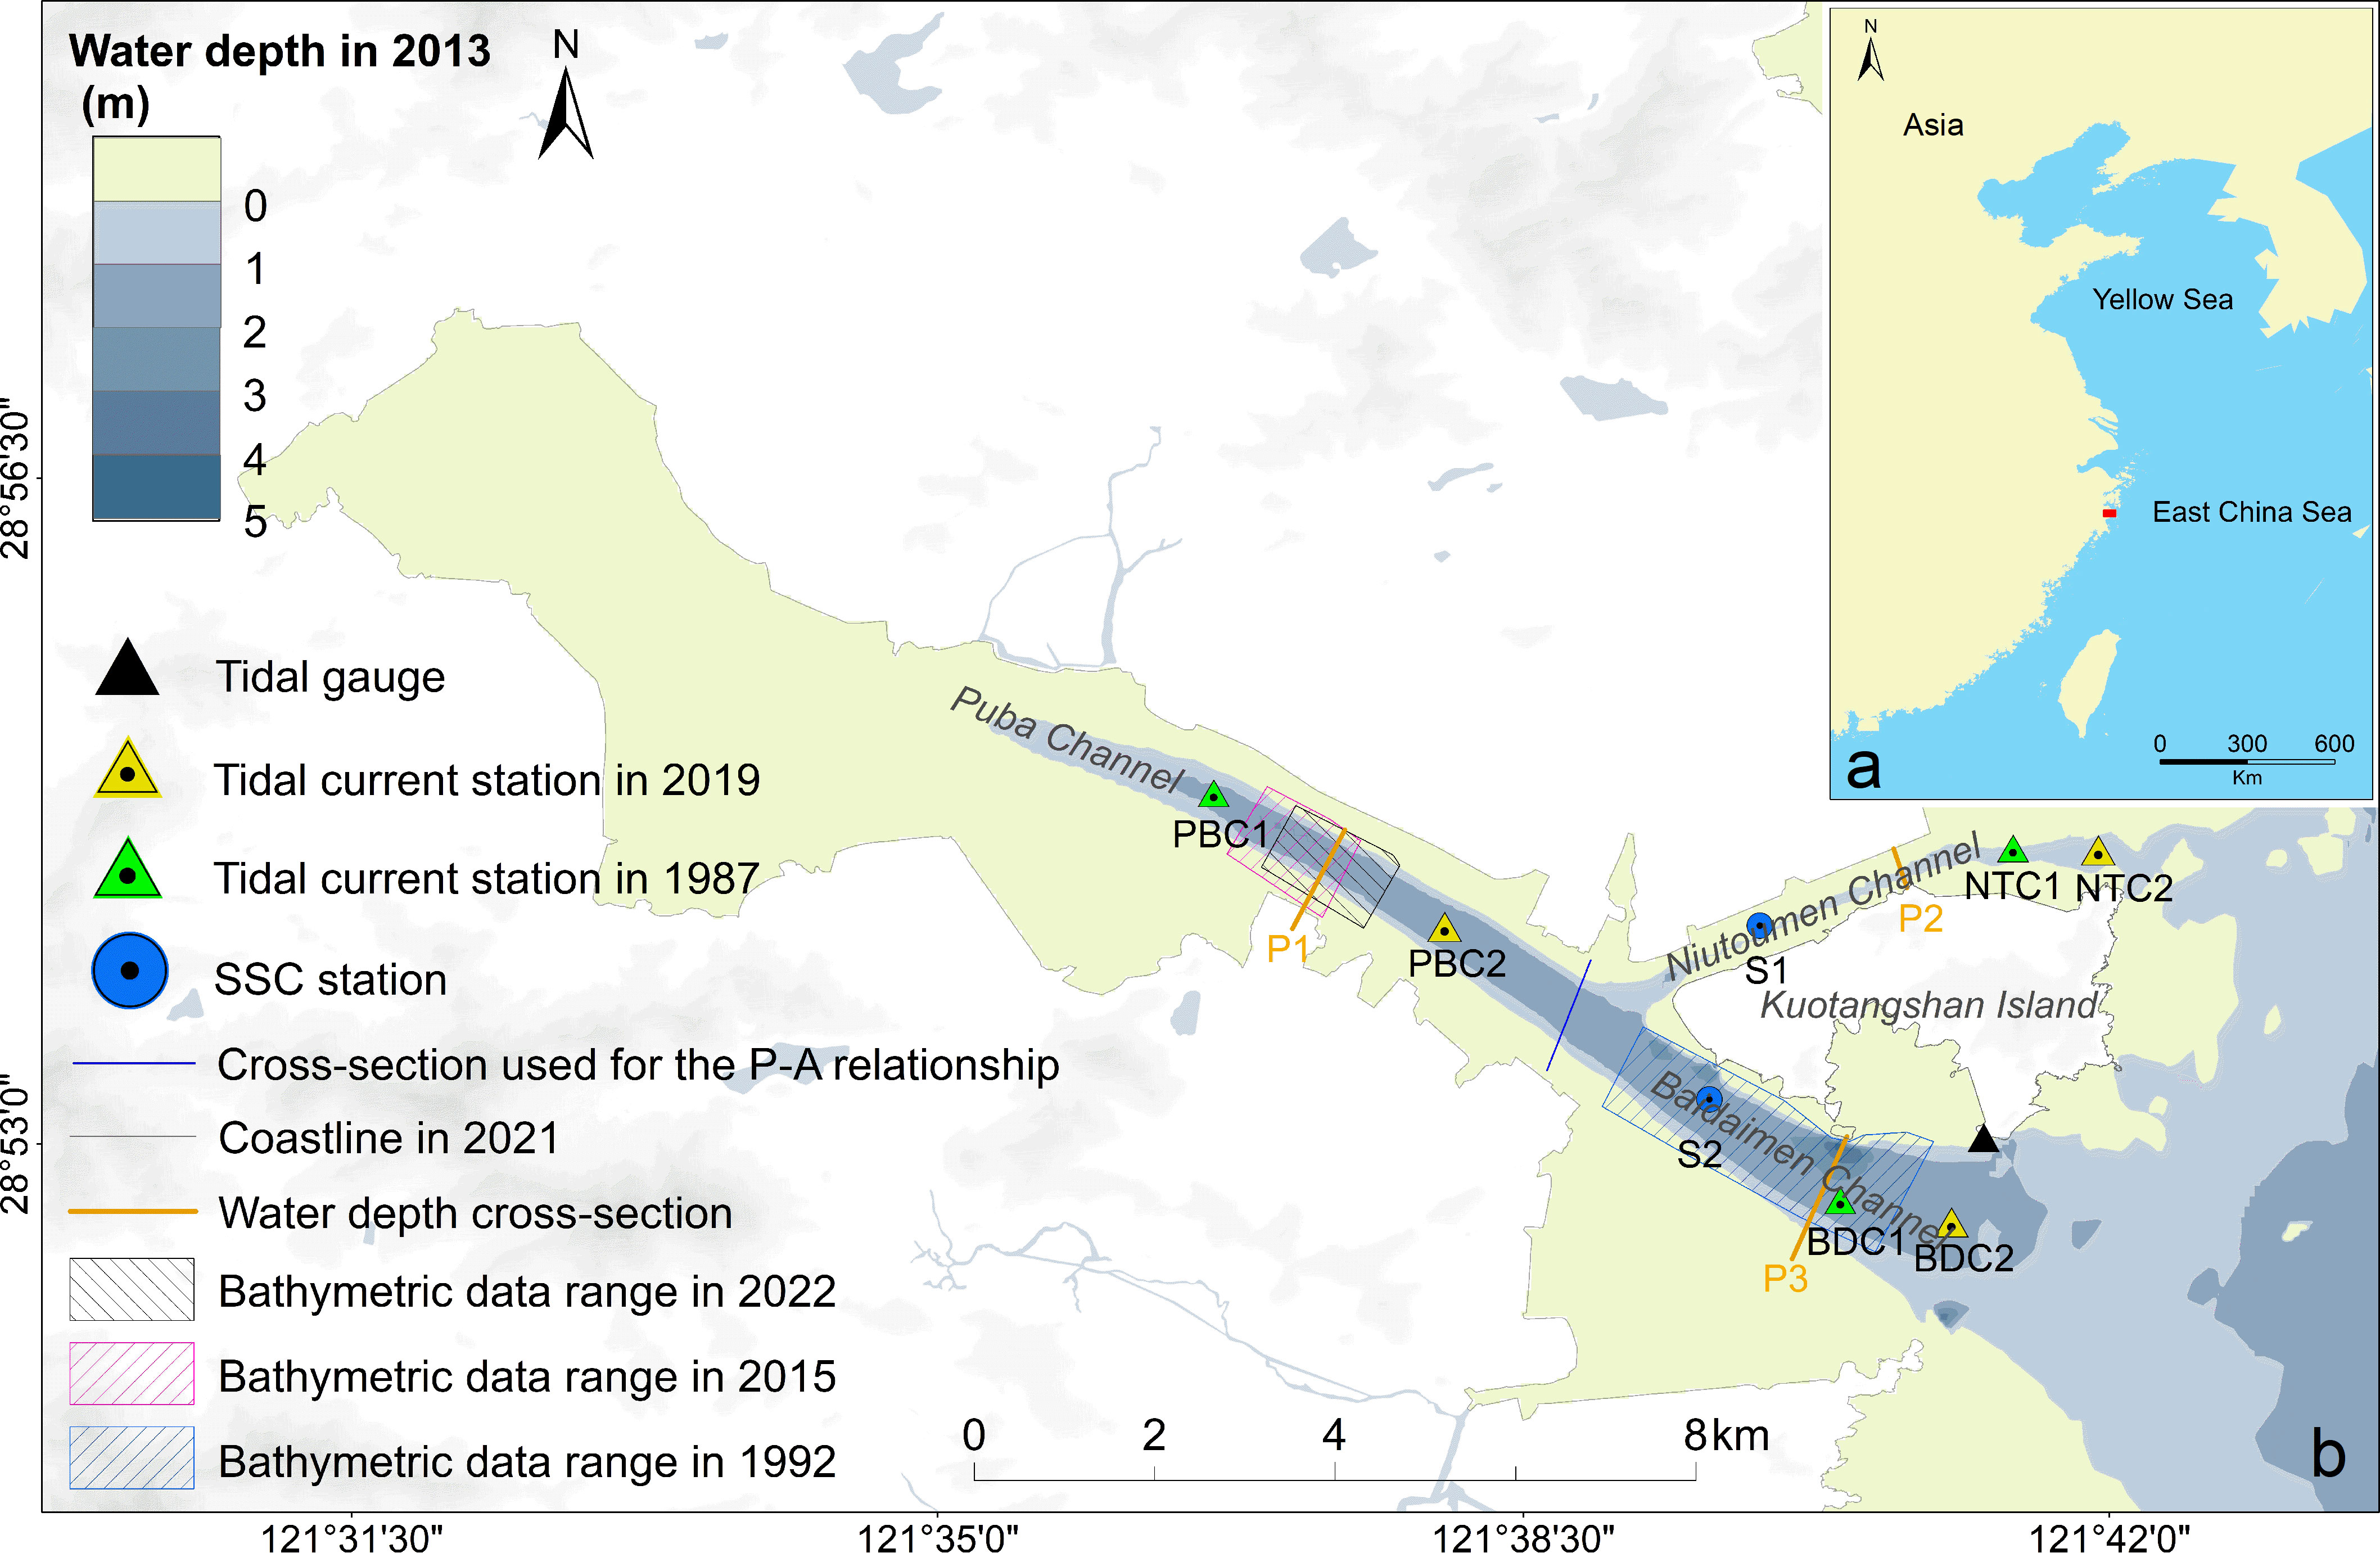
Figure 1 Chart of the study area and locations of observation stations.
Puba Bay is a tide-dominated bay with an average tidal range of 4.09 m in the NTC (Hu and Cao, 1981). Three small streams flow into it, and the semi-enclosed environment surrounded by low hills on three sides restricts wave propagation. Compared with tides, runoff and wave effects on the geomorphological evolution of Puba Bay is considered negligible, except for storm waves or continuous heavy rainfall. The progressive tidal waves of the East China Sea enter and exit the bay, presenting a semi-diurnal tidal cycle. According to 25 h mooring observations of tidal currents, the maximum flood and ebb laminar flow velocities in the BDC during the spring tide period were 94 and 126 cm/s, respectively, whereas they were 80 and 95 cm/s, respectively in the NTC (ECCHE, 1992). Therefore, the BDC was the main channel through which tidal waves entered and exited Puba Bay. Tidal waves undergo distortions as they propagate through the shallow waters in the bay, which originates in tidal asymmetry. Tidal asymmetry, in combination with fine sediment, induces net sediment transport, an important mechanism for the exploitation of intertidal flats and tidal channels.
Fine sediment enters the bay during the flood tide, some of which accumulates along the shore and forms extensive intertidal flats. According to the latest intertidal flat survey in China, this area, defined as the zone between coastlines—the location of mean high water springs—and 0 m isobath below the datum of theoretical lowest tidal level (TLTL), was 35 km2 in Puba Bay in 2021, accounting for more than 60% of the total area. According to bathymetry data measured in 1964, the tidal channel depth ranges from 3 to 10 m and the maximum depth exceeds 18 m, which is in the BDC. These intertidal flats are important resources for local residents who have been digging mariculture ponds where the excavated mud is heaped around the ponds to prevent floodwater from entering. Mariculture pond building and coastal reclamation are two major anthropogenic activities, as shown in recent remote sensing images (Figure 2).
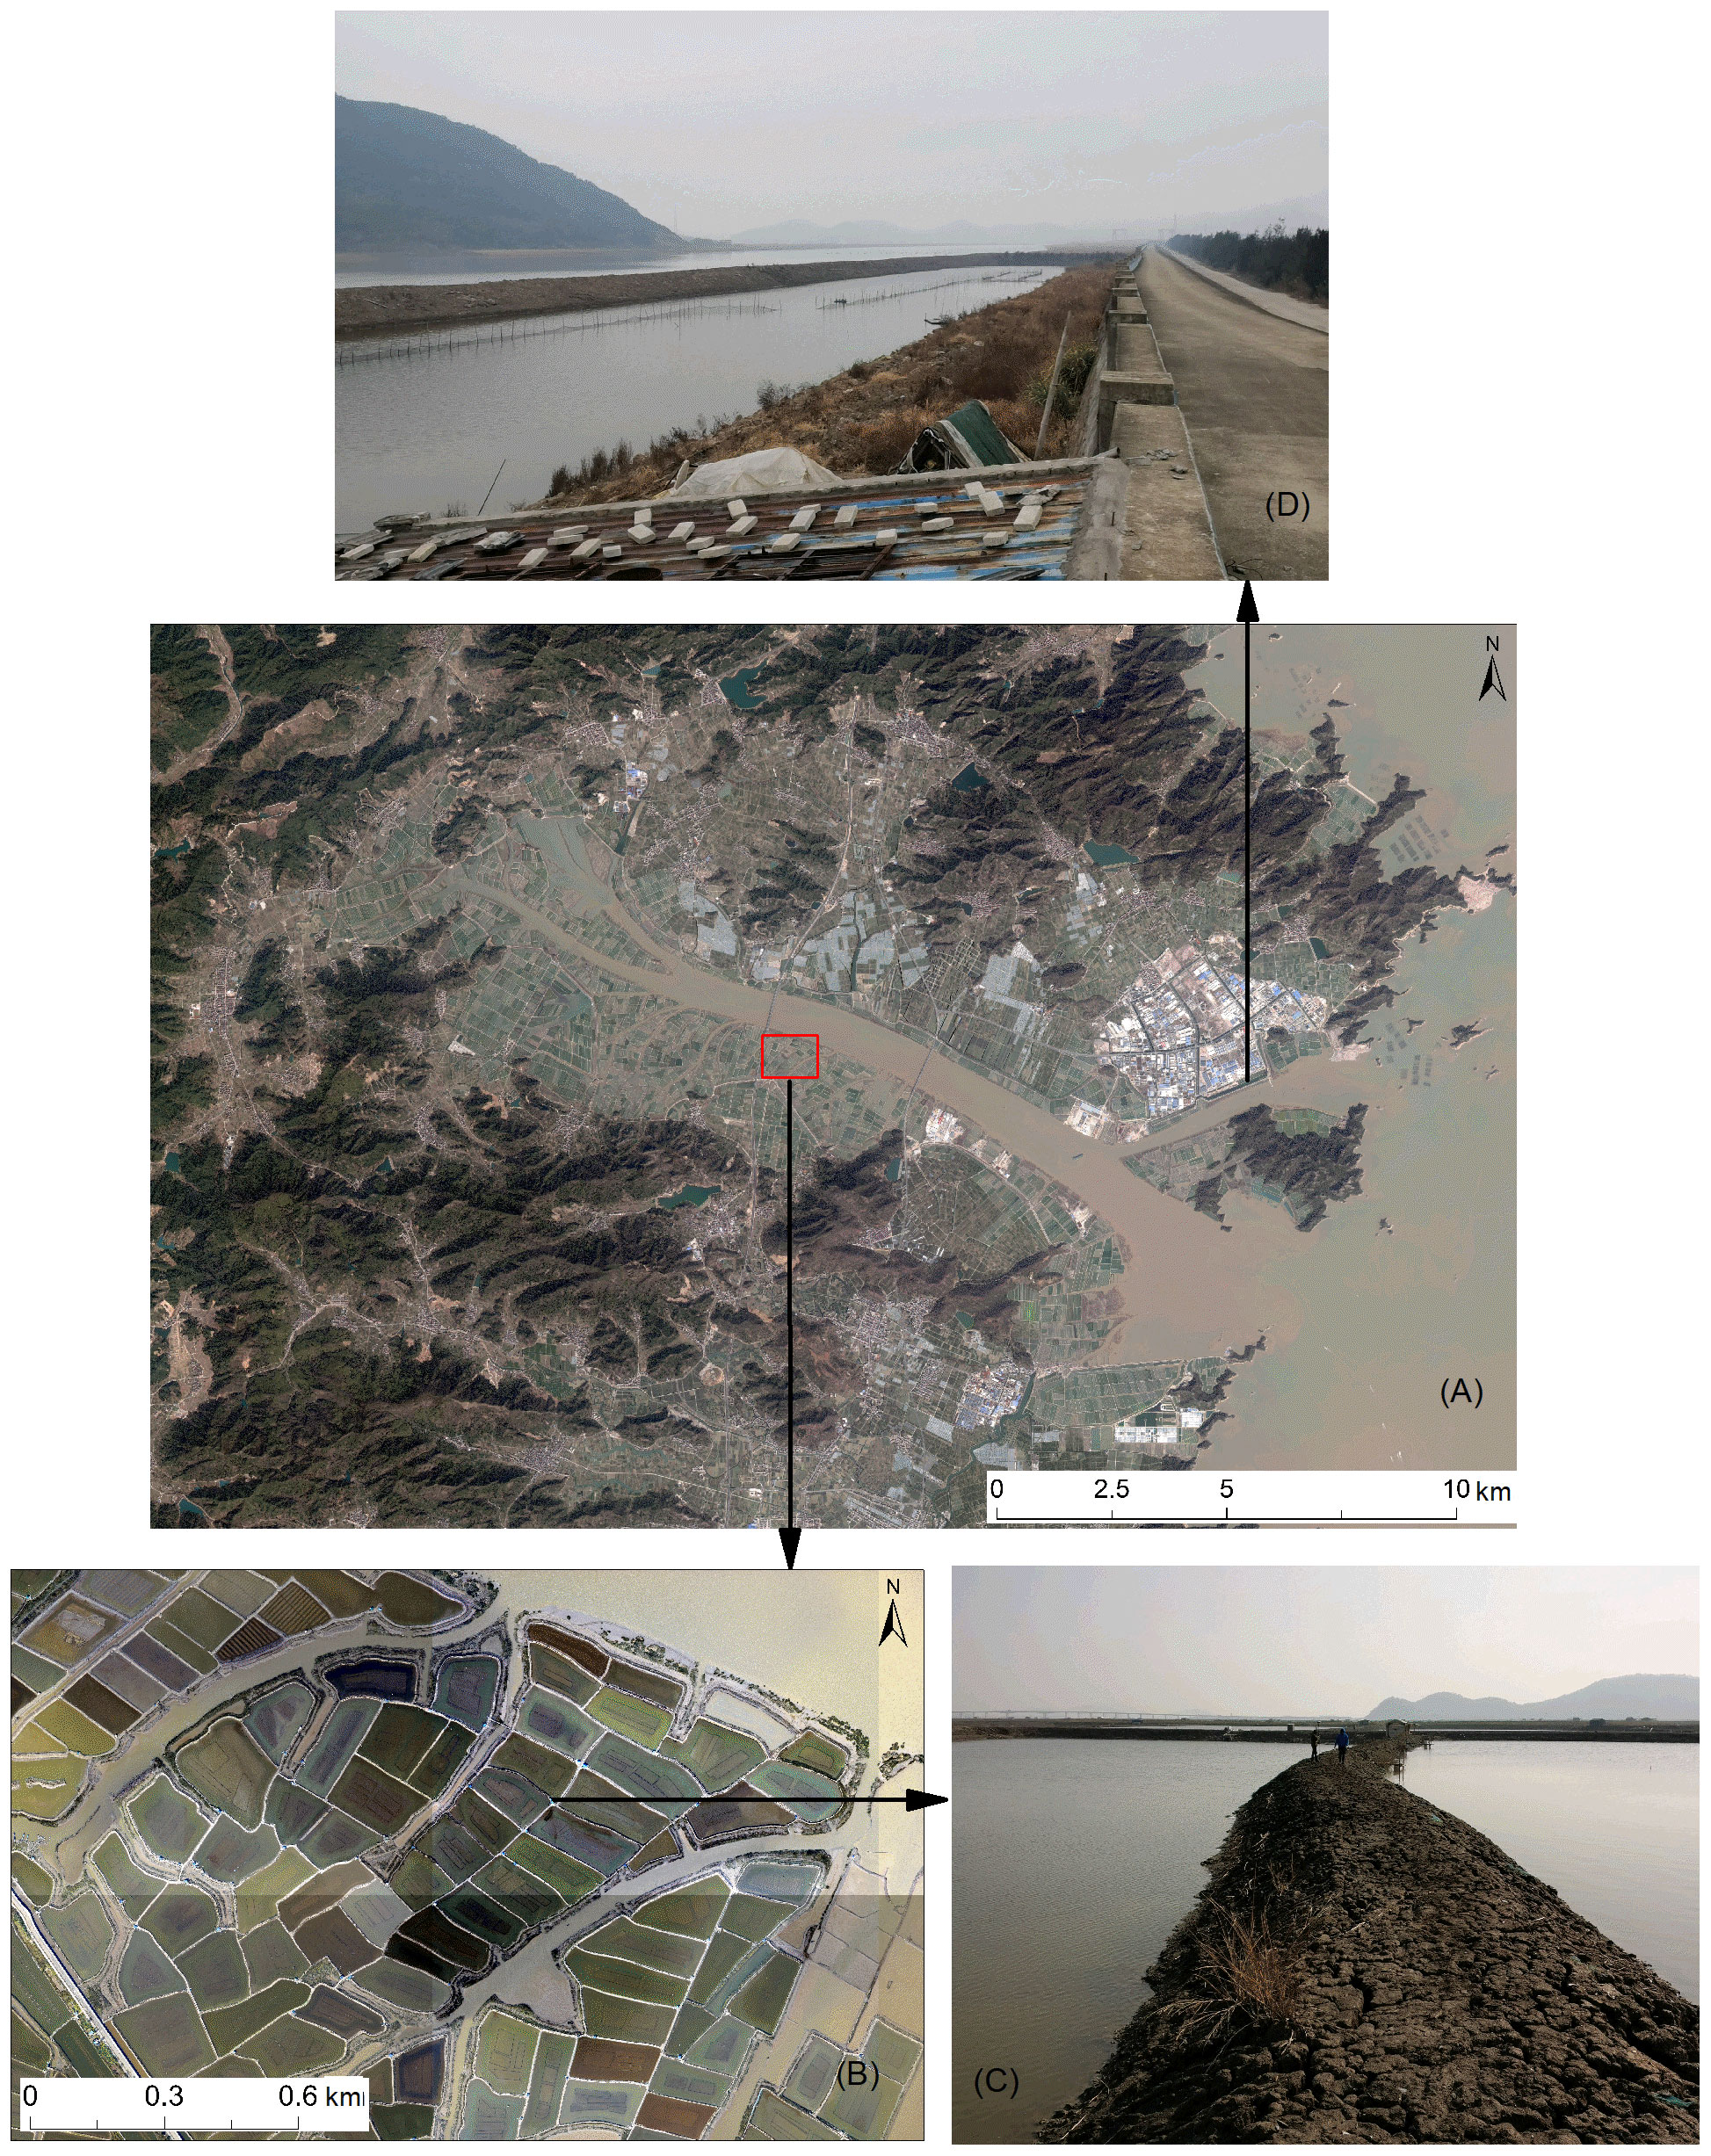
Figure 2 (A) Aerial photographs covering the study area in 2020; (B) Aerial photographs enlarged on a specific area of mariculture ponds; (C) Photo of mariculture ponds taken in 2020; (D) Photo of a concrete seawall which is the boundary of coastal reclamation.
3 Materials and methods
3.1 Data collection
Three datasets were collected and used in this study. The first set of bathymetric data is summarized in Table 1. Paper sea charts or topographic maps surveyed in 1964, 1978, 1992, 2015, and 2022 were digitalized, and digital topographic map data surveyed in 2013 was collected. The data range covers the whole study area, except for 1992, 2015, and 2022, which only cover part of the area in the BDC and PBC (Figure 1).
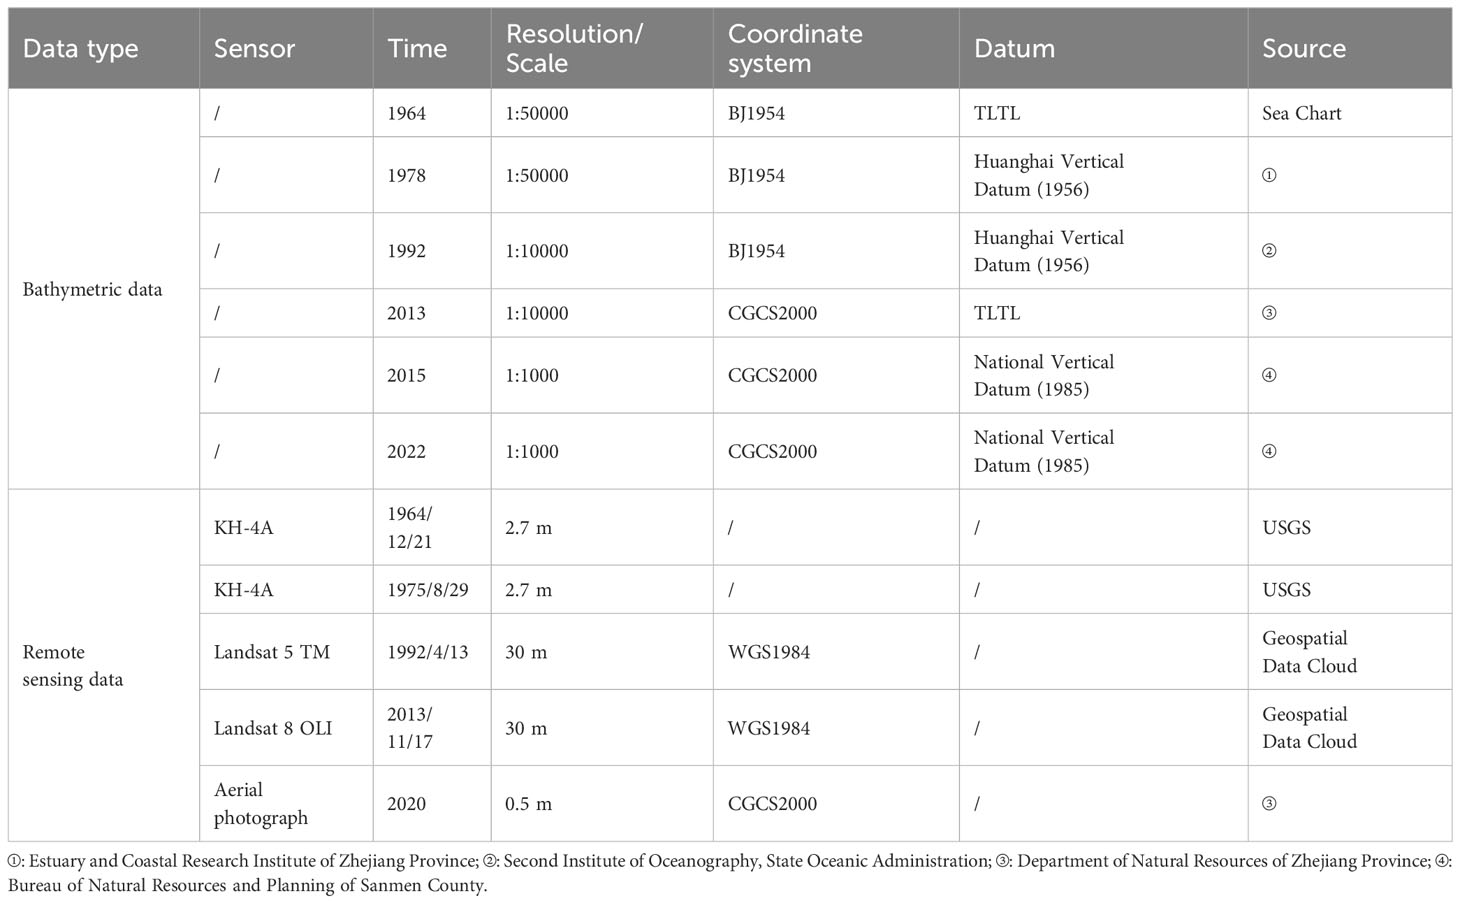
Table 1 Remote sensing and bathymetric data collected.
The second set of remote sensing data is summarized in Table 1. Remote sensing data from 1964, 1975, 1992, 2013, and 2020 were obtained to ensure consistency with the bathymetric data measurement times. The KH-4A satellite images captured in 1964 and 1975 were downloaded from the USGS (http://earthexplorer.usgs.gov/). Landsat satellite images captured in 1992 and 2013 were downloaded from the Geospatial Data Cloud (http://www.gscloud.cn/). Aerial photographs taken in 2020 were obtained from the Department of Natural Resources of Zhejiang Province. The satellite images were geographically registered using aerial photography with the China Geodetic Coordinate System 2000 (CGCS2000) and Gauss-Krüger projection. The spatial resolution of the aerial photography was 0.5 m, sufficiently high to calibrate the coastal boundary retrieved from the satellite images.
The third set comprised flow velocity, tidal level, and suspended sediment concentration (SSC) data. Three 25 h mooring tidal current observations (Figure 1) were used to record real time spring velocity and direction from September 7th to 9th, 1987 (from the Second Institute of Oceanography, MNR), and from August 16th to 17th, 2019 (from the Sanmen County Bureau of Natural Resources and Planning). The velocity observation accuracy was 0.01 m/s. Tidal level data were collected from the Sanmen County Bureau of Natural Resources and Planning with observations from August 1, 0:00 to August 31, 23:00 (2019), with 1 h interval recordings. The observation station was located in the BDC (Figure 1). SSC data were collected from the Second Institute of Oceanography, MNR. Two 25 h SSC mooring observations (Figure 1) from February 13, 11:00 to February 14, 13:00 (2006; spring tide), and from February 20, 12:00 to February 21, 14:00 (2006; neap tide) were used.
3.2 Methods
Bathymetric data were processed using ArcGIS 10.2 software (Environmental Systems Research Institute, Inc., Redlands, CA, USA). The paper nautical charts or topographic maps were first digitized using ‘georeferencing’ tools. The coordinate system, projection, and depth datum of all bathymetric data were then unified to the CGCS2000, Gauss-Krüger projection, and TLTL, respectively. Finally, bathymetric data were interpolated into 50 × 50 m grid resolution digital elevation models (DEMs) using the triangular irregular network interpolation (TIN) method, widely used in bathymetric analysis (Dallas and Barnard, 2009; Andes and Cox, 2017; Zhou et al., 2020; Gao et al., 2021). DEMs can be used to generate contours, extract topographic profiles, and calculate volumes.
Envi v5.3 software (Exelis Visual Information Solutions, Boulder, CO, USA) was used to preprocess the satellite images, which included radiometric enhancement, FLAASH atmospheric correction, a seamless mosaic, and a spatial subset. The resulting images were opened in ArcGIS 10.2 software and georeferenced using ‘georeferencing’ tools. Geographical registration was conducted using four control points surrounding the study area. The four control point positions were consistent for each satellite image, and their geographic coordinates were extracted from the aerial photographs using CGCS2000 and Gauss-Krüger projections.
Coastal boundaries were extracted from each satellite image using visual interpretation methods. There were two boundary types in the study area: that between rocky shores and intertidal flats, and between the outer limit of mariculture ponds and coastal reclamations. To improve the interpretation accuracy, the boundaries were initially extracted from high-resolution aerial photographs taken in 2020. The extracted boundaries were then overlaid with satellite images and adjusted based on the range of anthropogenic activity variation.
4 Results
4.1 Tidal current and suspended sediment characteristics
Puba Bay is tide-dominated. According to field data observed in 2019, the average and maximum tidal range is 3.86 and 6.2 m in the BDC, respectively, and the average duration of flood and ebb tide is 6 h 7 min and 6 h 18 min, respectively (Figure 3).
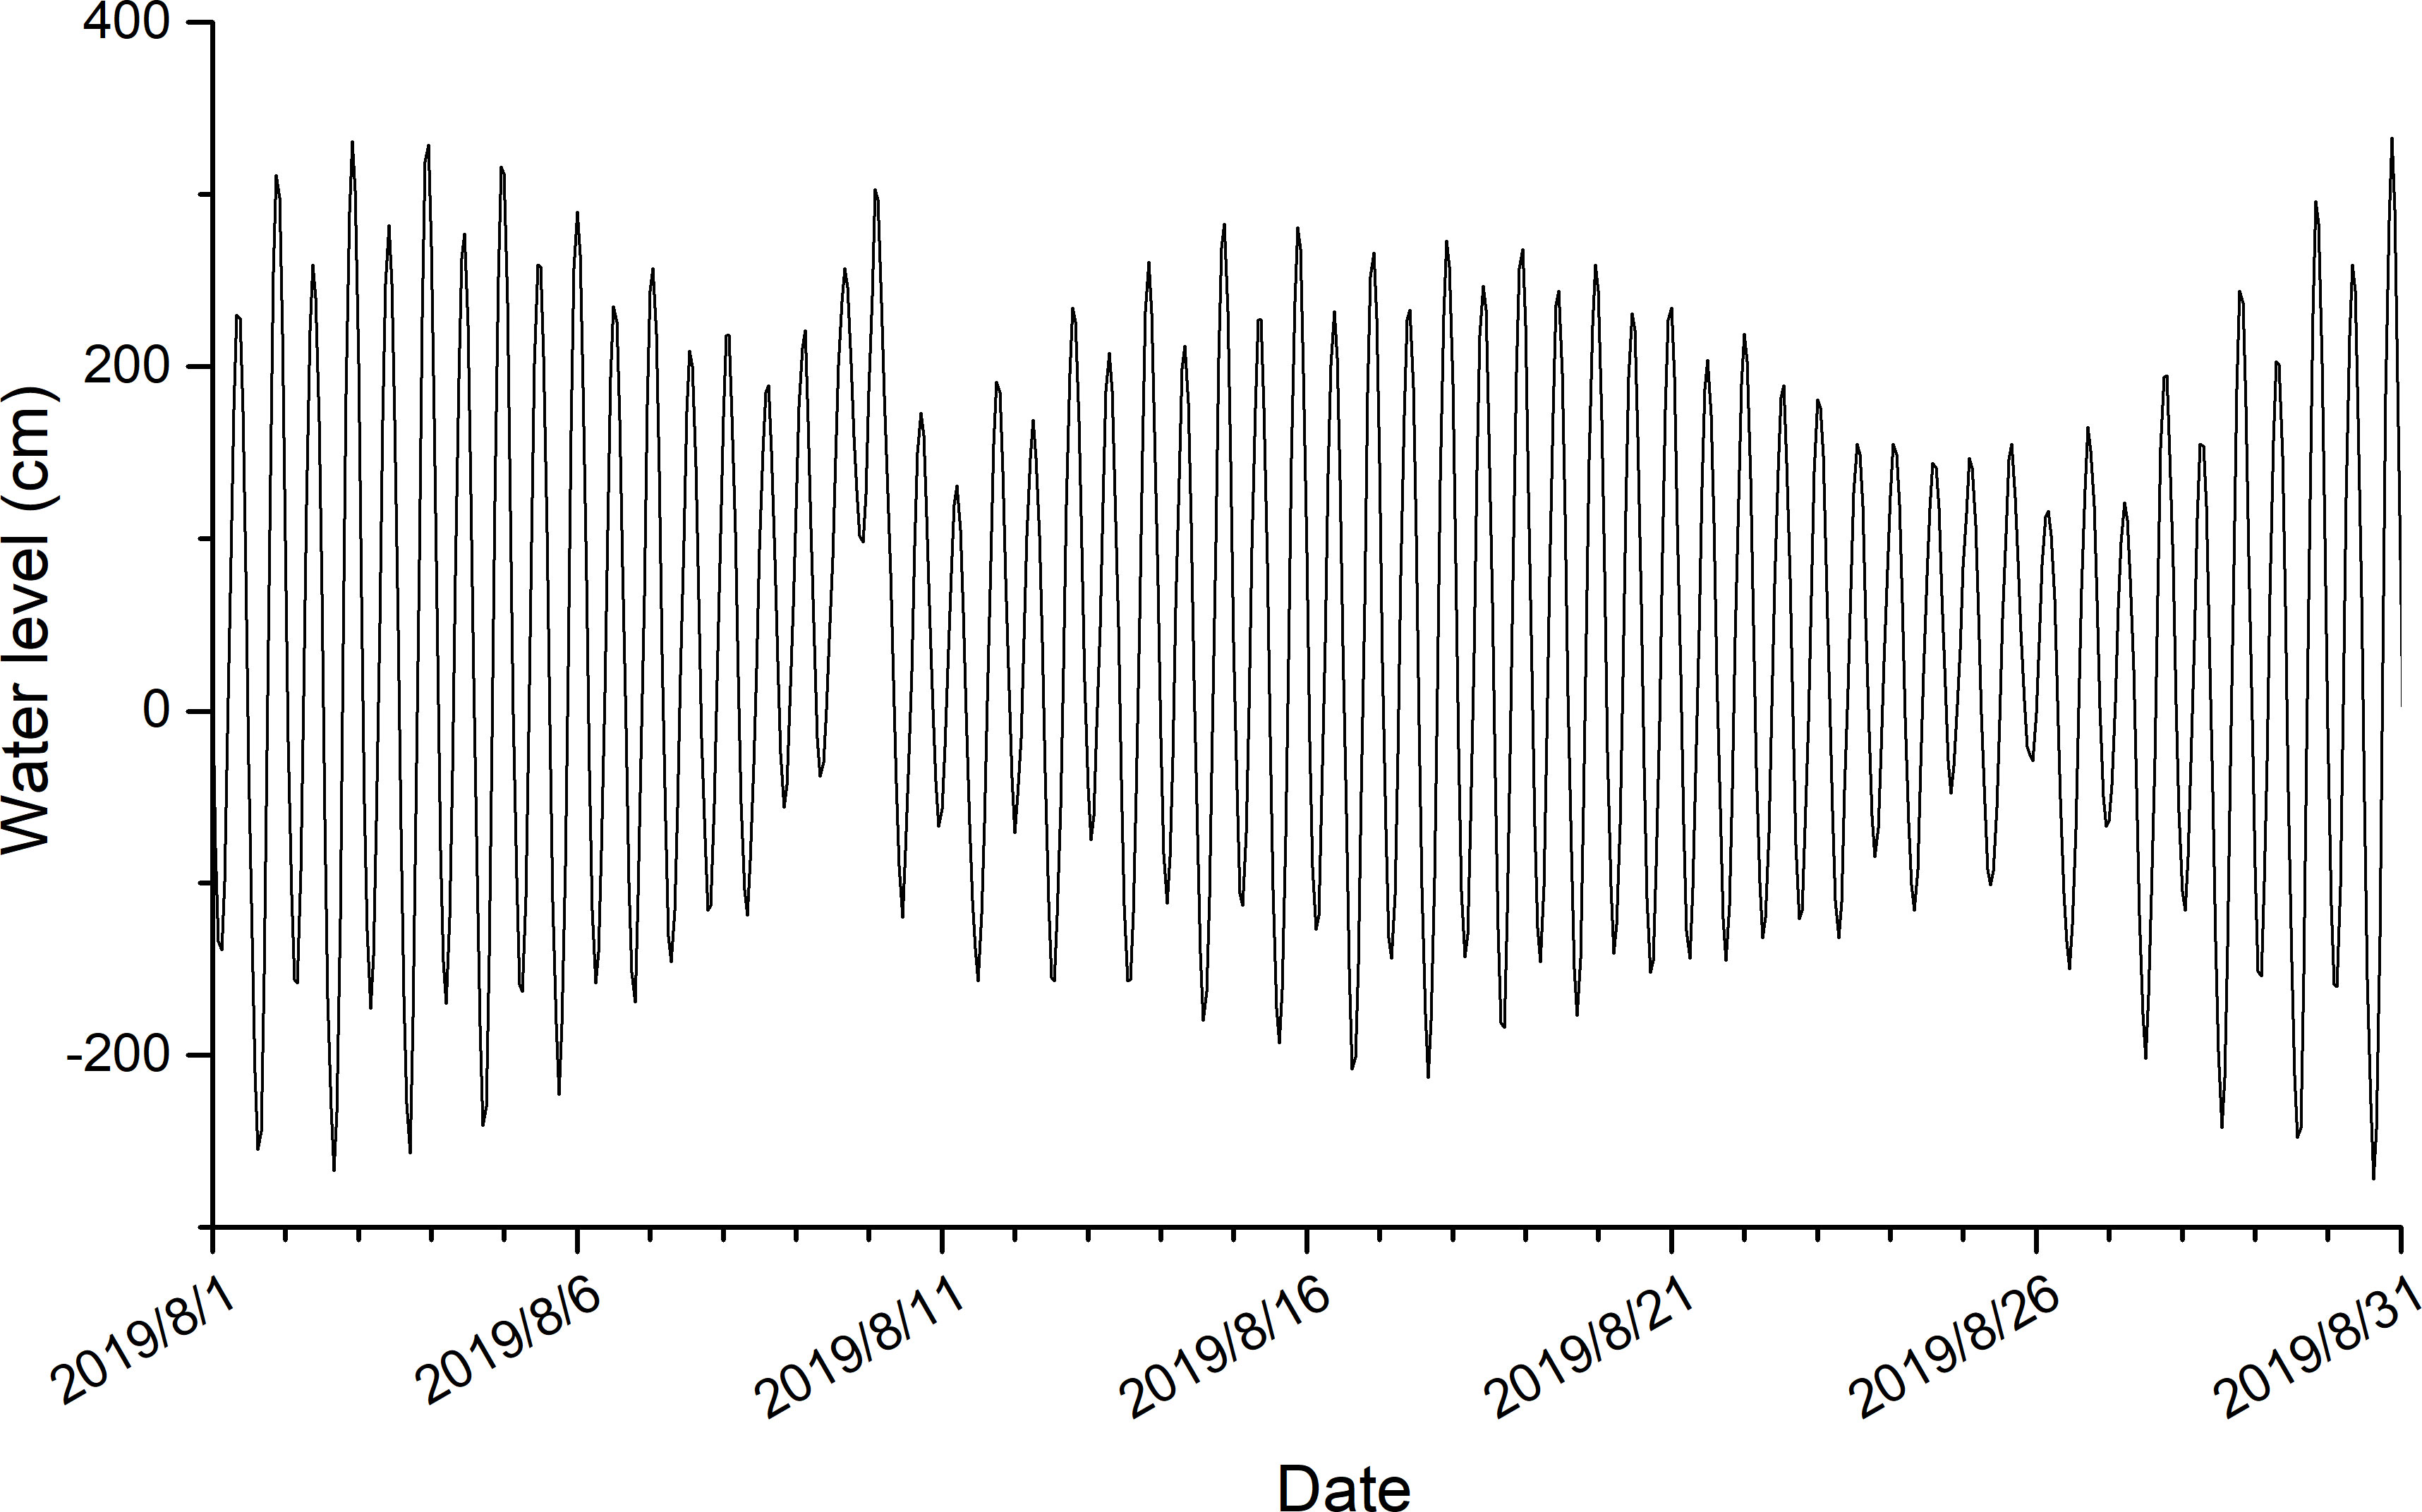
Figure 3 The measured water level change curve in August 2019. The water level is based on the National Vertical Datum (1985).
Tidal velocity is a key factor controlling the transportation and accumulation of sediment in macrotidal bays. The observed data showed that the maximum ebb and flood velocities decreased between 1978 and 2019 in the PBC and between 1987 and 2019 in the BDC and NTC (Figure 4). There is a difference in the strength of the maximum ebb and flood velocities as well as an unequal duration of the falling and rising tides. As a result, tidal asymmetry develops in this bay (Friedrichs and Aubrey, 1988). The tide is flood-dominant when the rising tide time is shorter than the falling tide time, and ebb-dominant when the opposite occurs (Wang et al., 2002). The tide was flood-dominant in the PBC, ebb-dominant in the BDC, and flood-dominant in the NTC in 1978 and 1987 (Table 2). By 2019, flood dominance in the PBC had increased, ebb dominance in the BDC had declined, and flood dominance in the NTC had been converted to ebb dominance.
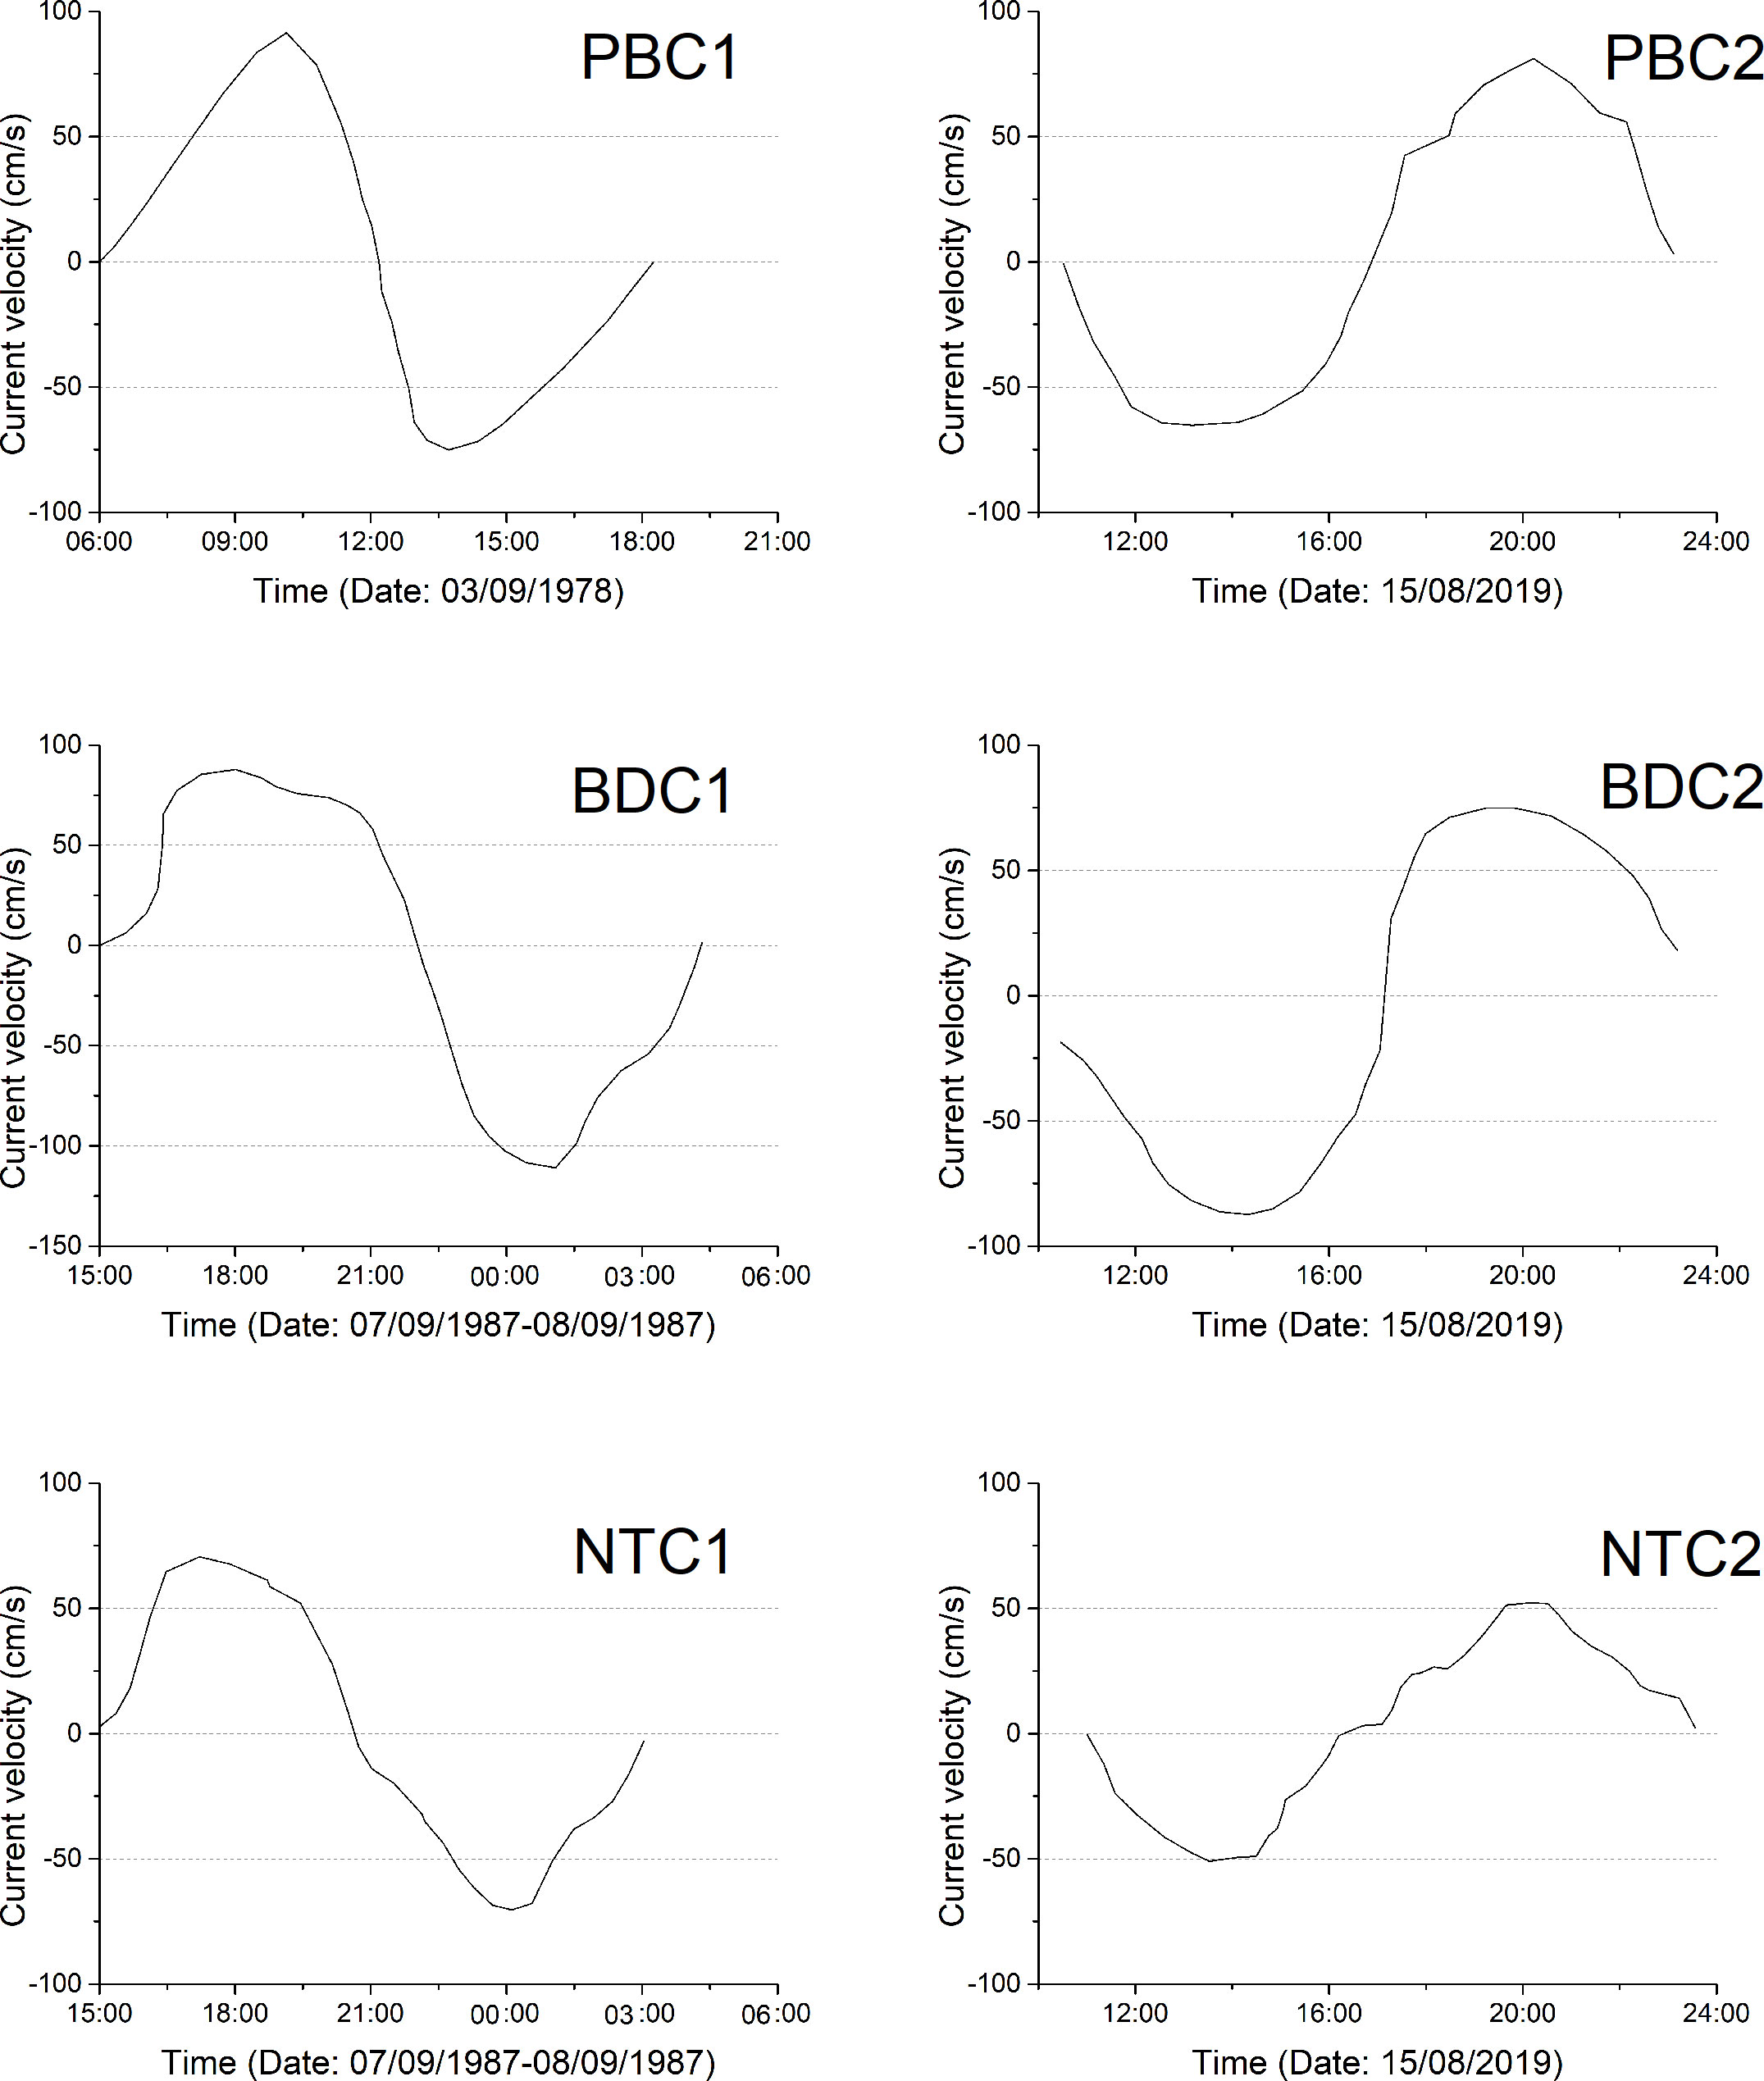
Figure 4 Observation data of spring tidal velocity in the tidal current stations. The locations are shown in Figure 1. Solid line indicates the change of current velocity, with positive and negative value representing the flood and ebb velocity, respectively.
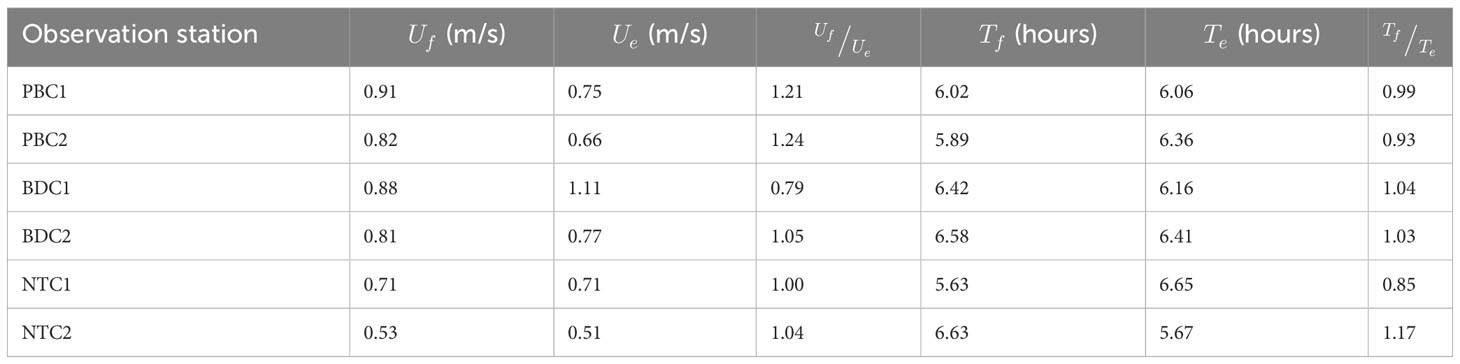
Table 2 Maximum ebb and flood velocities ( and ) and the duration of ebb and flood tides ( and ) observed in 1978, 1987 and 2019.
According to the observed data, SSC exhibited temporal changes during a spring-neap tidal cycle (Figure 5). The vertical average SSC decreased from the spring to neap tides, and its maximum value was 0.928 and 0.636 kg/m3 during the spring and neap tides, respectively. The SSC curve had two troughs (appearing at tidal slack) and two crests (appearing after the maximum flow velocity) during a flood-ebb tidal cycle because of the erosion lag effect. The trends in SSC changes at S1 and S2 were consistent during the same tidal phase; however, the SSC at S2 was higher than that at S1, possibly confirming that the BDC is the main channel for material transport.
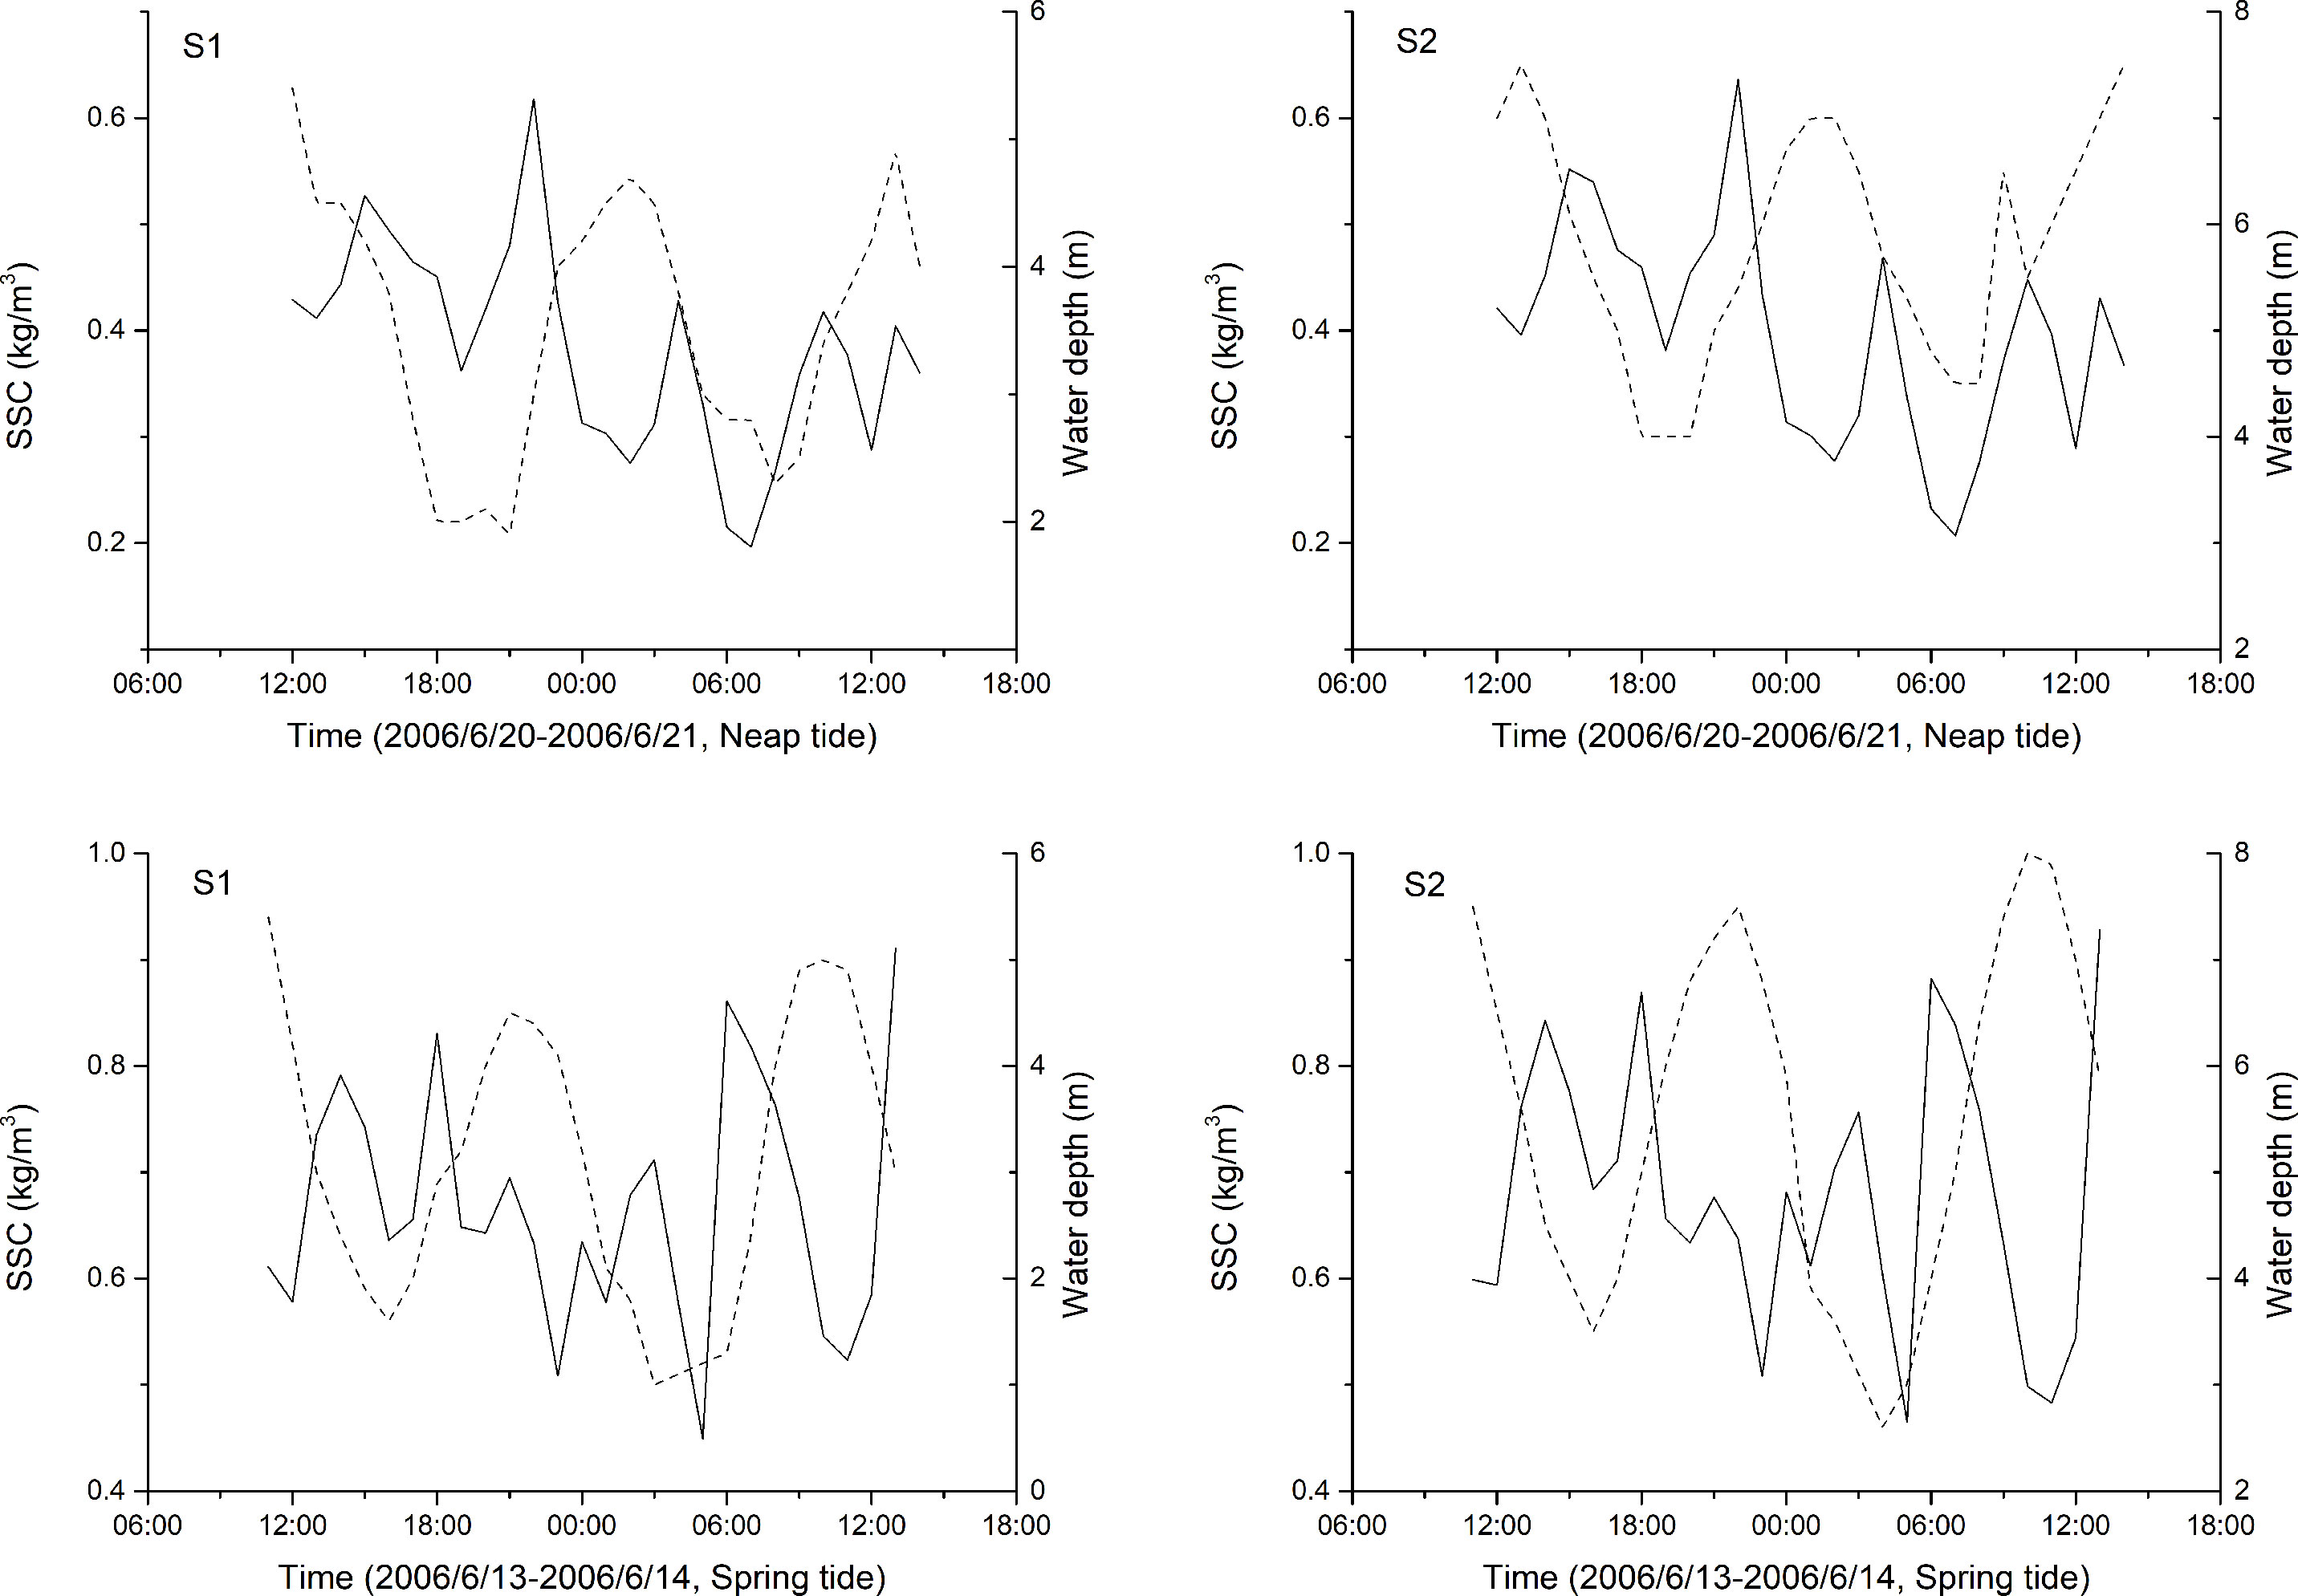
Figure 5 The measured SSC change curve in June 2006.
4.2 Major anthropogenic activity processes
The boundaries of the major anthropogenic activities were extracted from remote sensing images (Figure 6). In 1964, the coastal morphology of the bay primarily consisted of alternating headlands and secondary bays. At that time, the shape of the coastal boundaries was winding, corresponding to the distribution of rocky headlands and secondary bays, and the sea area and intertidal zone area were 98.11 and 75.189 km2, respectively. The extent of the intertidal zone decreased by 63.283 km2 between 1964 and 2020, accounting for 64.5% of the total area in 1964 as anthropogenic activities expanded (Table 3). In addition to decreasing in size, the shape of the coastal boundaries also changed. Secondary bays eventually disappeared as anthropogenic activities increased, and the coastal boundaries became straight in shape. However, because of the need for tidal water intake and discharge in the densely distributed mariculture ponds in the southern bay, there were many narrow tidal creeks left for the tide to enter and exit, forming a distribution pattern alternating between the straight boundaries and tidal creek boundaries.
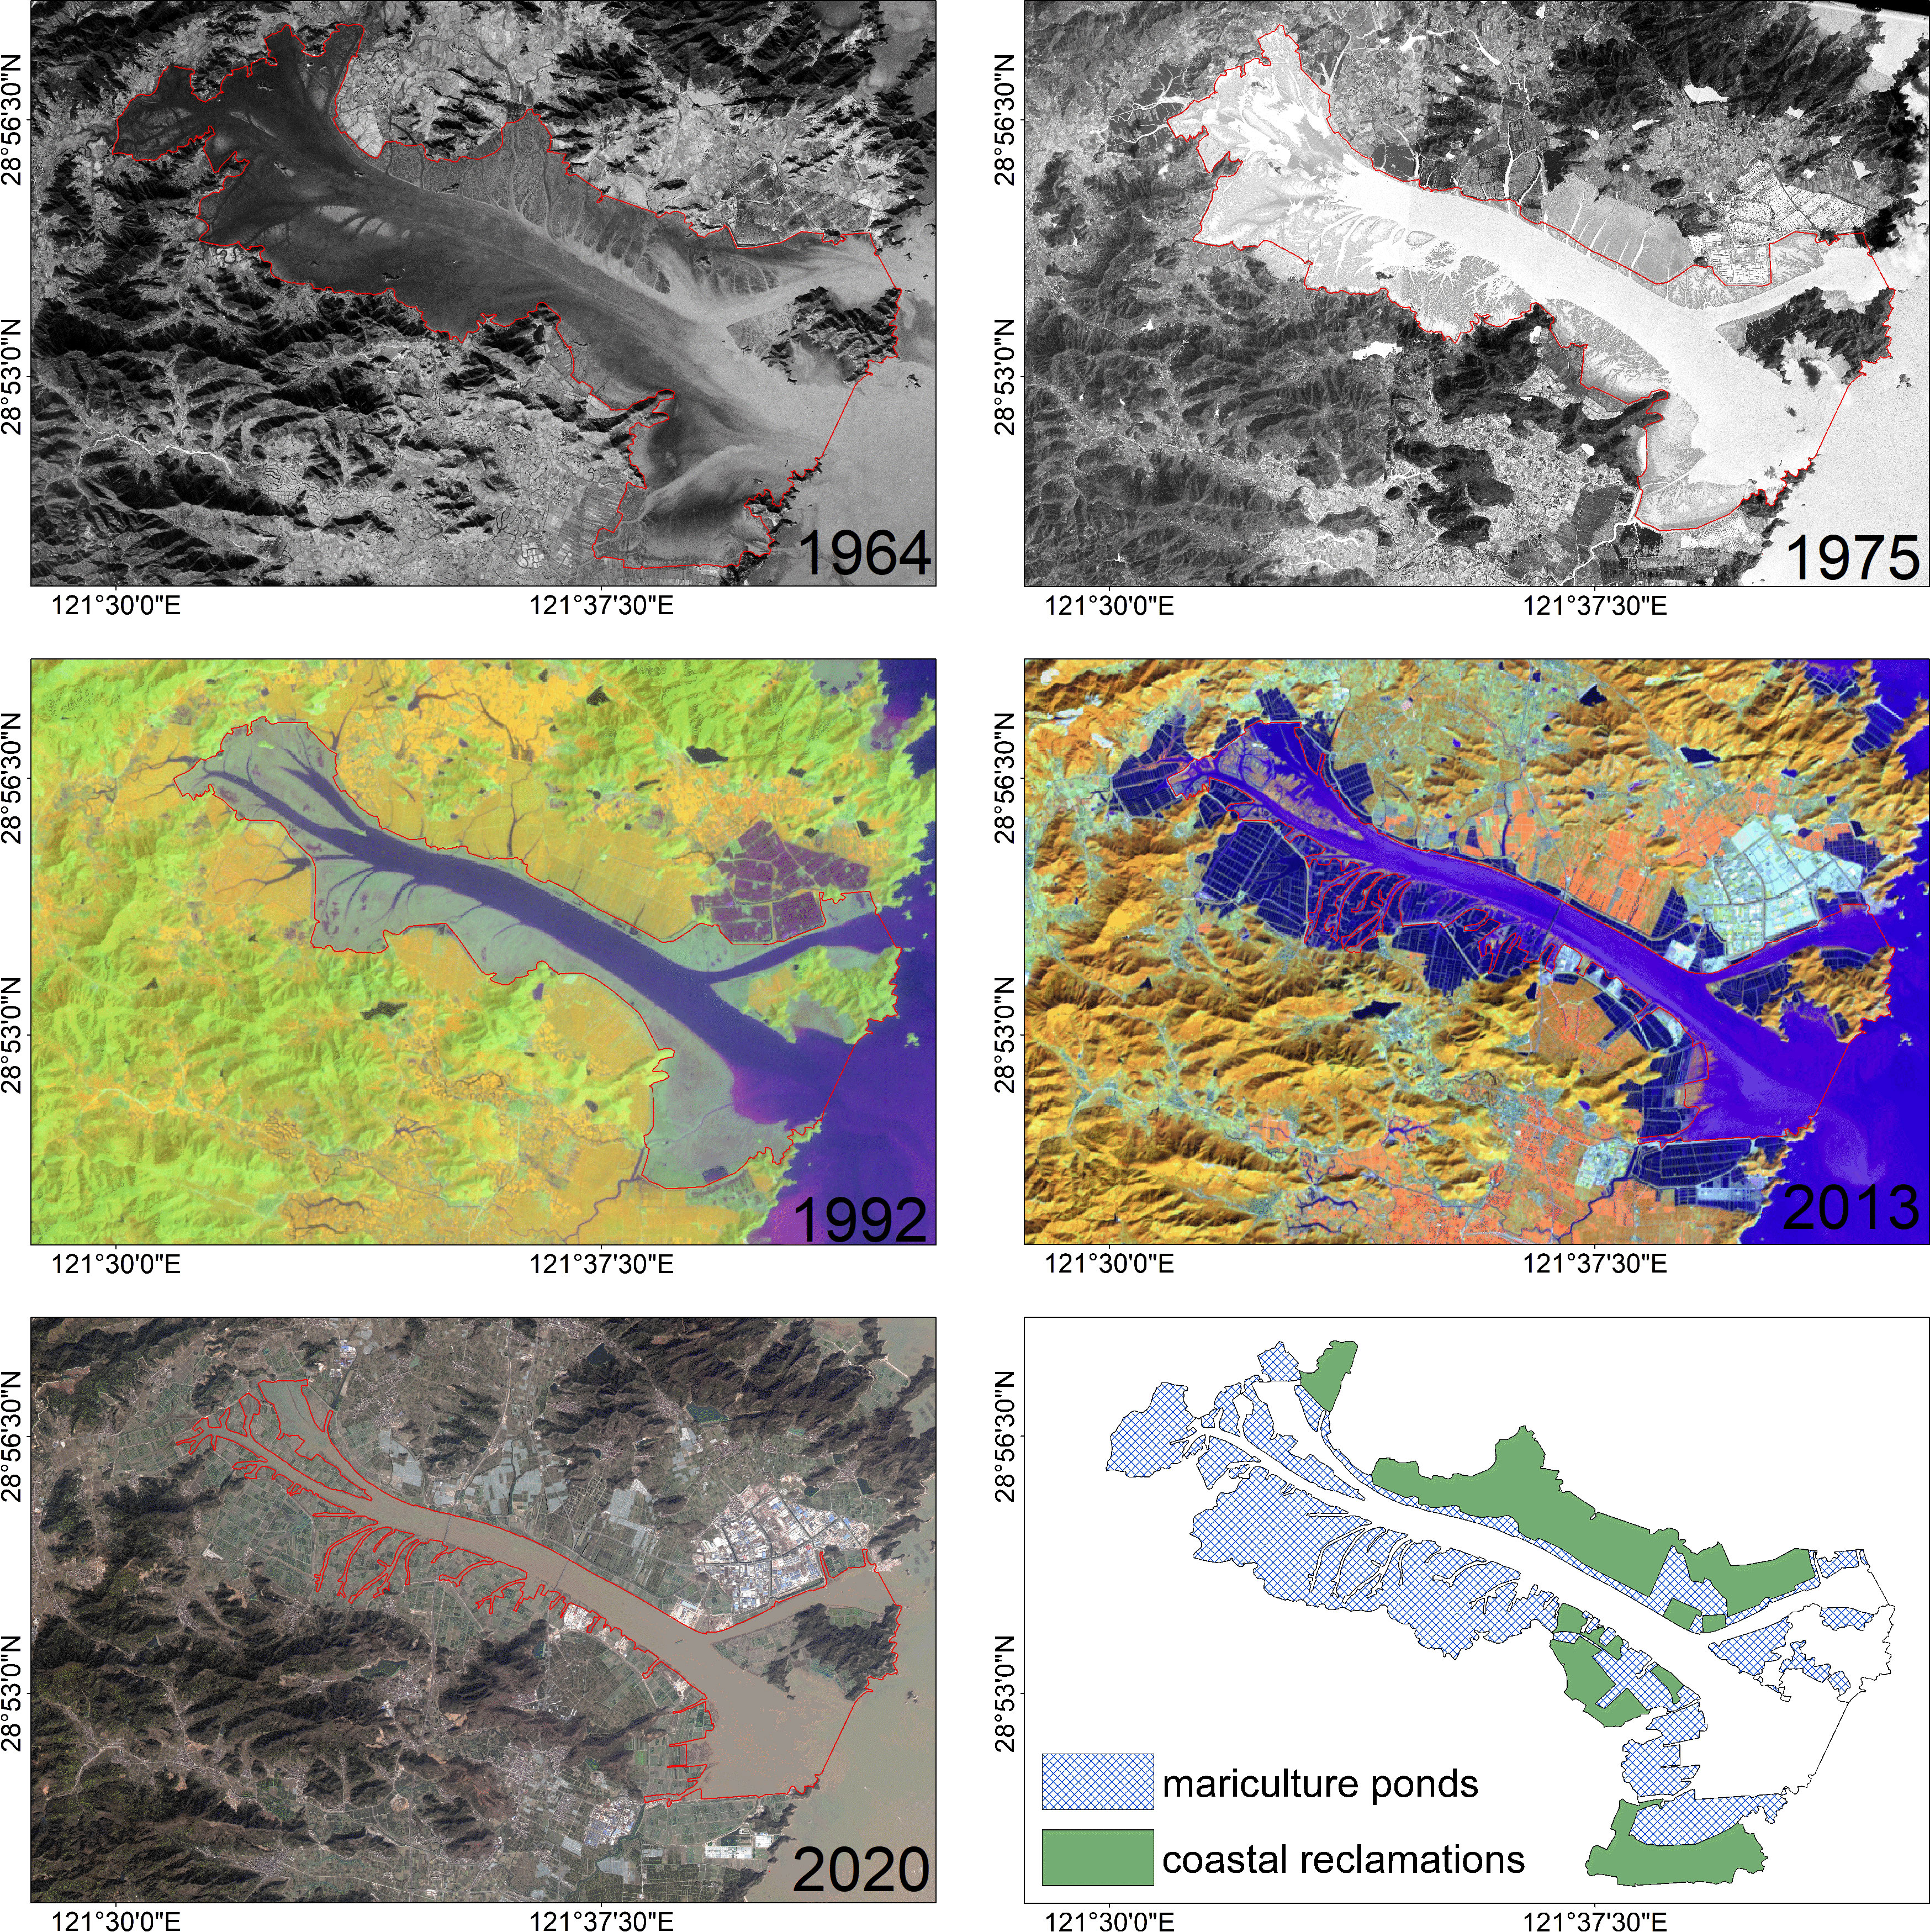
Figure 6 Extension and distribution of mariculture ponds and coastal reclamations. The boundaries are extracted from remote sensing images in the years 1964, 1975, 1992, 2013, and 2020, as shown by the red line.
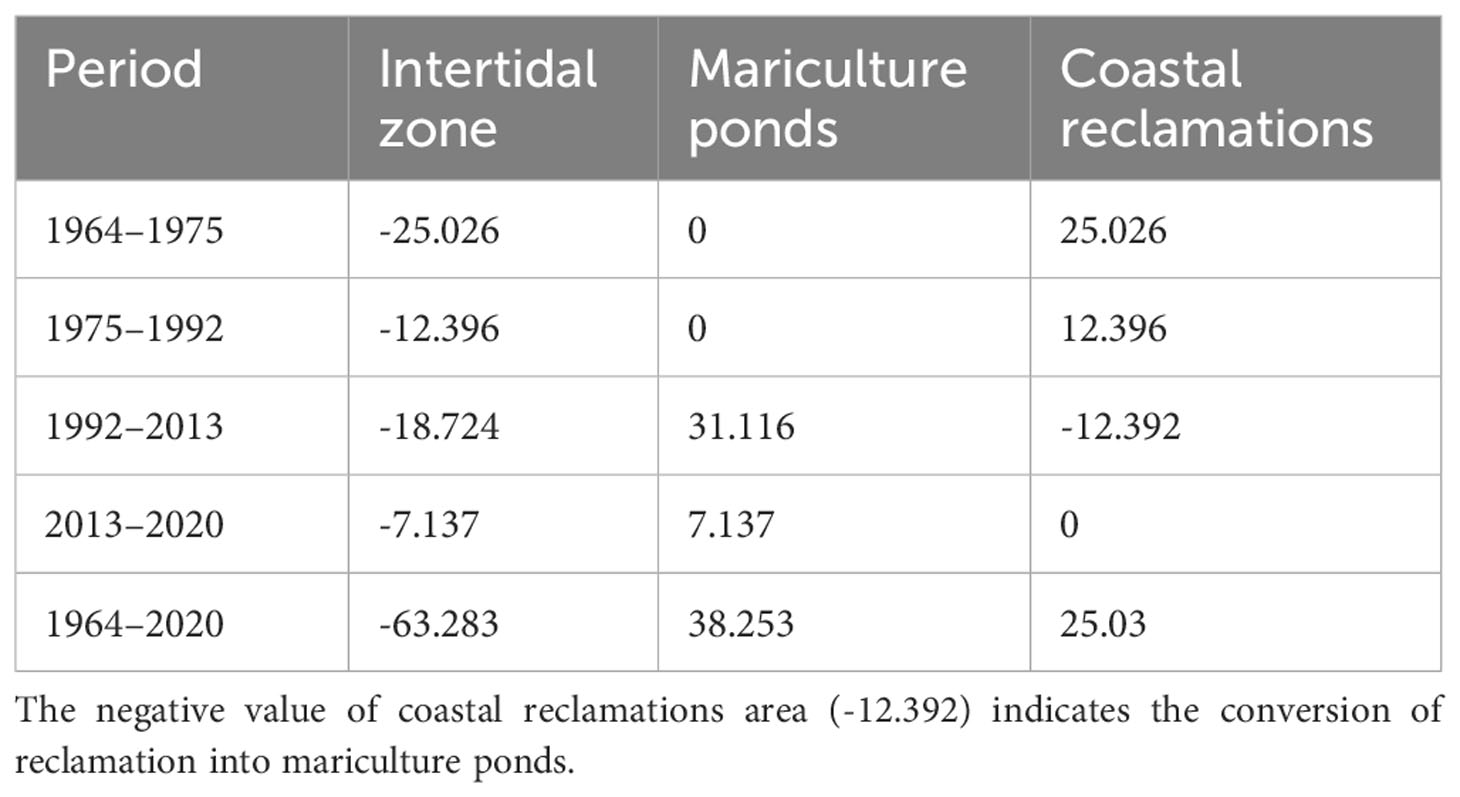
Table 3 Variations in the intertidal zone, mariculture ponds, and coastal reclamation areas (area unit: km2).
Anthropogenic activities are the main cause of the reduction in intertidal zones. Coastal reclamation mainly occurred in the intertidal flats on the north and south sides of the bay mouth (Figure 6). The building of mariculture ponds was extensive on the south side and top of the bay, but only sporadic on the north side. Coastal reclamation occurred between 1964 and 2013: large-scale reclamation occurred before 1992, was minimal between 1992 and 2013, and some past reclamations were converted into mariculture ponds (Table 3). Mariculture ponds were increasingly built after 1992 and exceeded previous coastal reclamation, becoming the main anthropogenic activity in Puba Bay. The area of constructed mariculture ponds between 1964 and 2020 was 38.253 km2, accounting for 60.4% of the reduced area of the intertidal zone.
4.3 Underwater bathymetry changes in Puba Bay
The evolution of the underwater region deeper than 0 m exhibited marked siltation characteristics from 1964 to 2013 (Figure 7). Notably, the underwater region coverage range was reduced due to this siltation. The upstream endpoint of the 0 m isobath in the PBC retreated 6.8 km towards the mouth of the bay, accounting for half of the total length of the PBC. Some branch channels that had previously been connected to the PBC deteriorated or completely vanished owing to siltation. Meanwhile, the channel width also became noticeably narrower. In 1964, the PBC, BDC, and NTC widths were 800–1200, 1200–2200, and 200–800, respectively, but were reduced to 300–600, 700–2000, and 100–400 m, respectively in 2013. The retreat of the bay in both the longitudinal and transverse directions noticeably reduced the underwater area. According to the DEMs, the projected underwater area in 1964 was 20.152 km2; however, it was 17.545 and 7.765 km2 in 1978 and 2013, respectively (Table 4). Over a 50-year period, the coverage area of the underwater regions decreased by 61.5%.
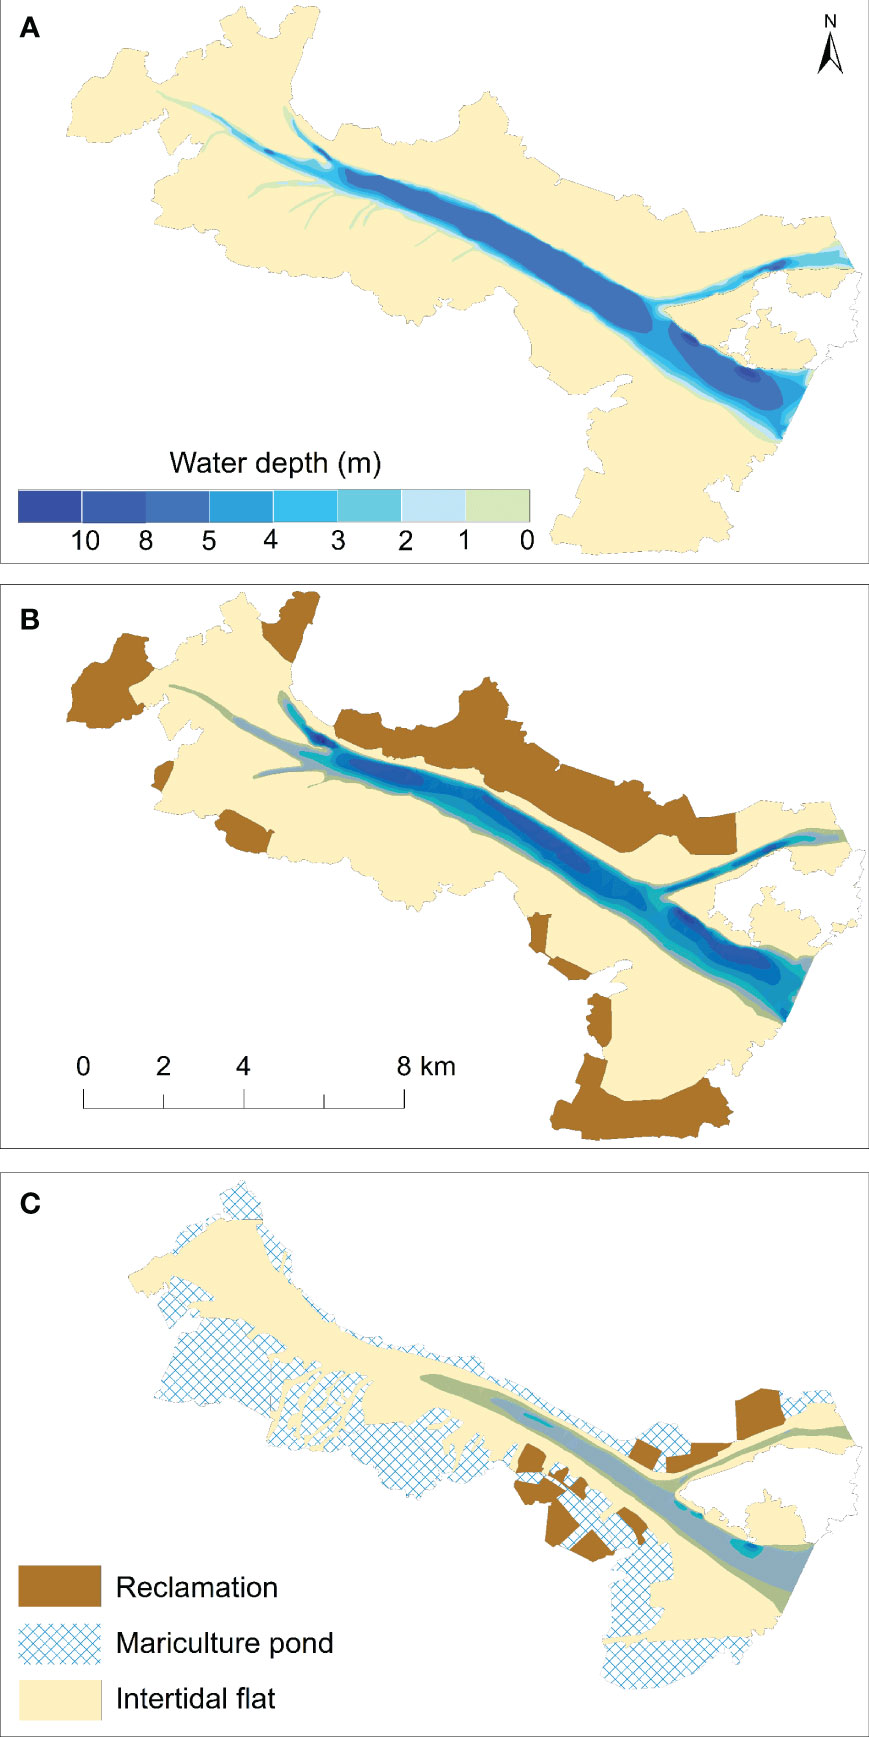
Figure 7 Evolution of underwater regions deeper than 0 m isobath in three periods: 1964 (A), 1978 (B), and 2013 (C). The depth datum of all bathymetric data is TLTL. The anthropogenic activities shown in (B) and (C) occurred during 1964–1978 and 1978–2013, respectively.
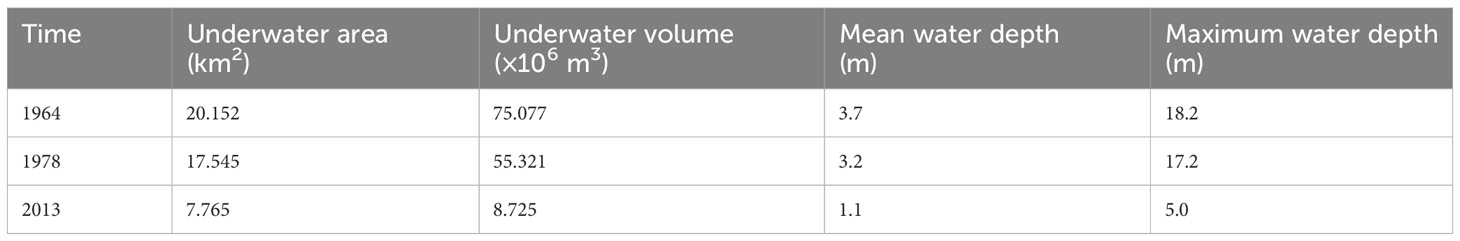
Table 4 Characteristics of typical underwater shape parameters.
Regarding vertical change, the water depth exhibited a decreasing trend with the isobath ranges with the same values decreasing during different periods (Figure 7). The maximum water depth was measured in the BD and it had decreased from 18.2, to 17.2, and to 5.0 m in 1964, 1978, and 2013, respectively. Between 1964 and 2013, this value also decreased from 8 to 2.1 m in the PBC and from 9.8 to 1.9 m in the NTC, respectively. Because it is not a main channel, the NTC degradation is more visible under the influence of extensive siltation. According to the DEMs, the underwater region volumes in 1964, 1978, and 2013 were 75.077 × 10⁶, 55.321 × 10⁶, and 8.725 × 10⁶ m3, respectively (Table 4). The underwater volume of Puba Bay decreased by 88.4% between 1964 and 2013.
In each of the three channels, a cross-section was established. The cross-sections were selectively placed at major terrain fluctuations or changes in each channel (Figure 1). The typical cross-sectional topography, as shown in Figure 8, was characterized by siltation features, manifesting as a continuous narrowing of the cross-sectional width and shallowing of the water depth. Between 1964 and 2022, the maximum width and water depth of the P1 section decreased by 660 and 7.3 m, respectively. In 2022, the width and depth of this section were only 350 and 0.2 m, respectively. If the siltation continued, the topography of this section would separate from the underwater environment, and the 0 m isobath would continue to retreat towards the bay mouth. Between 1964 and 2013, sections P2 and P3 narrowed in width by 130 and 380 m, respectively, and t heir maximum water depths decreased by 6.8 and 6.5 m, respectively. In 2013, the width and depth of the two sections were 160 and 1.5 m, and 910 and 4.0 m, respectively. The NTC nearly vanished because of siltation, with BDC becoming the primary waterway for material movement.
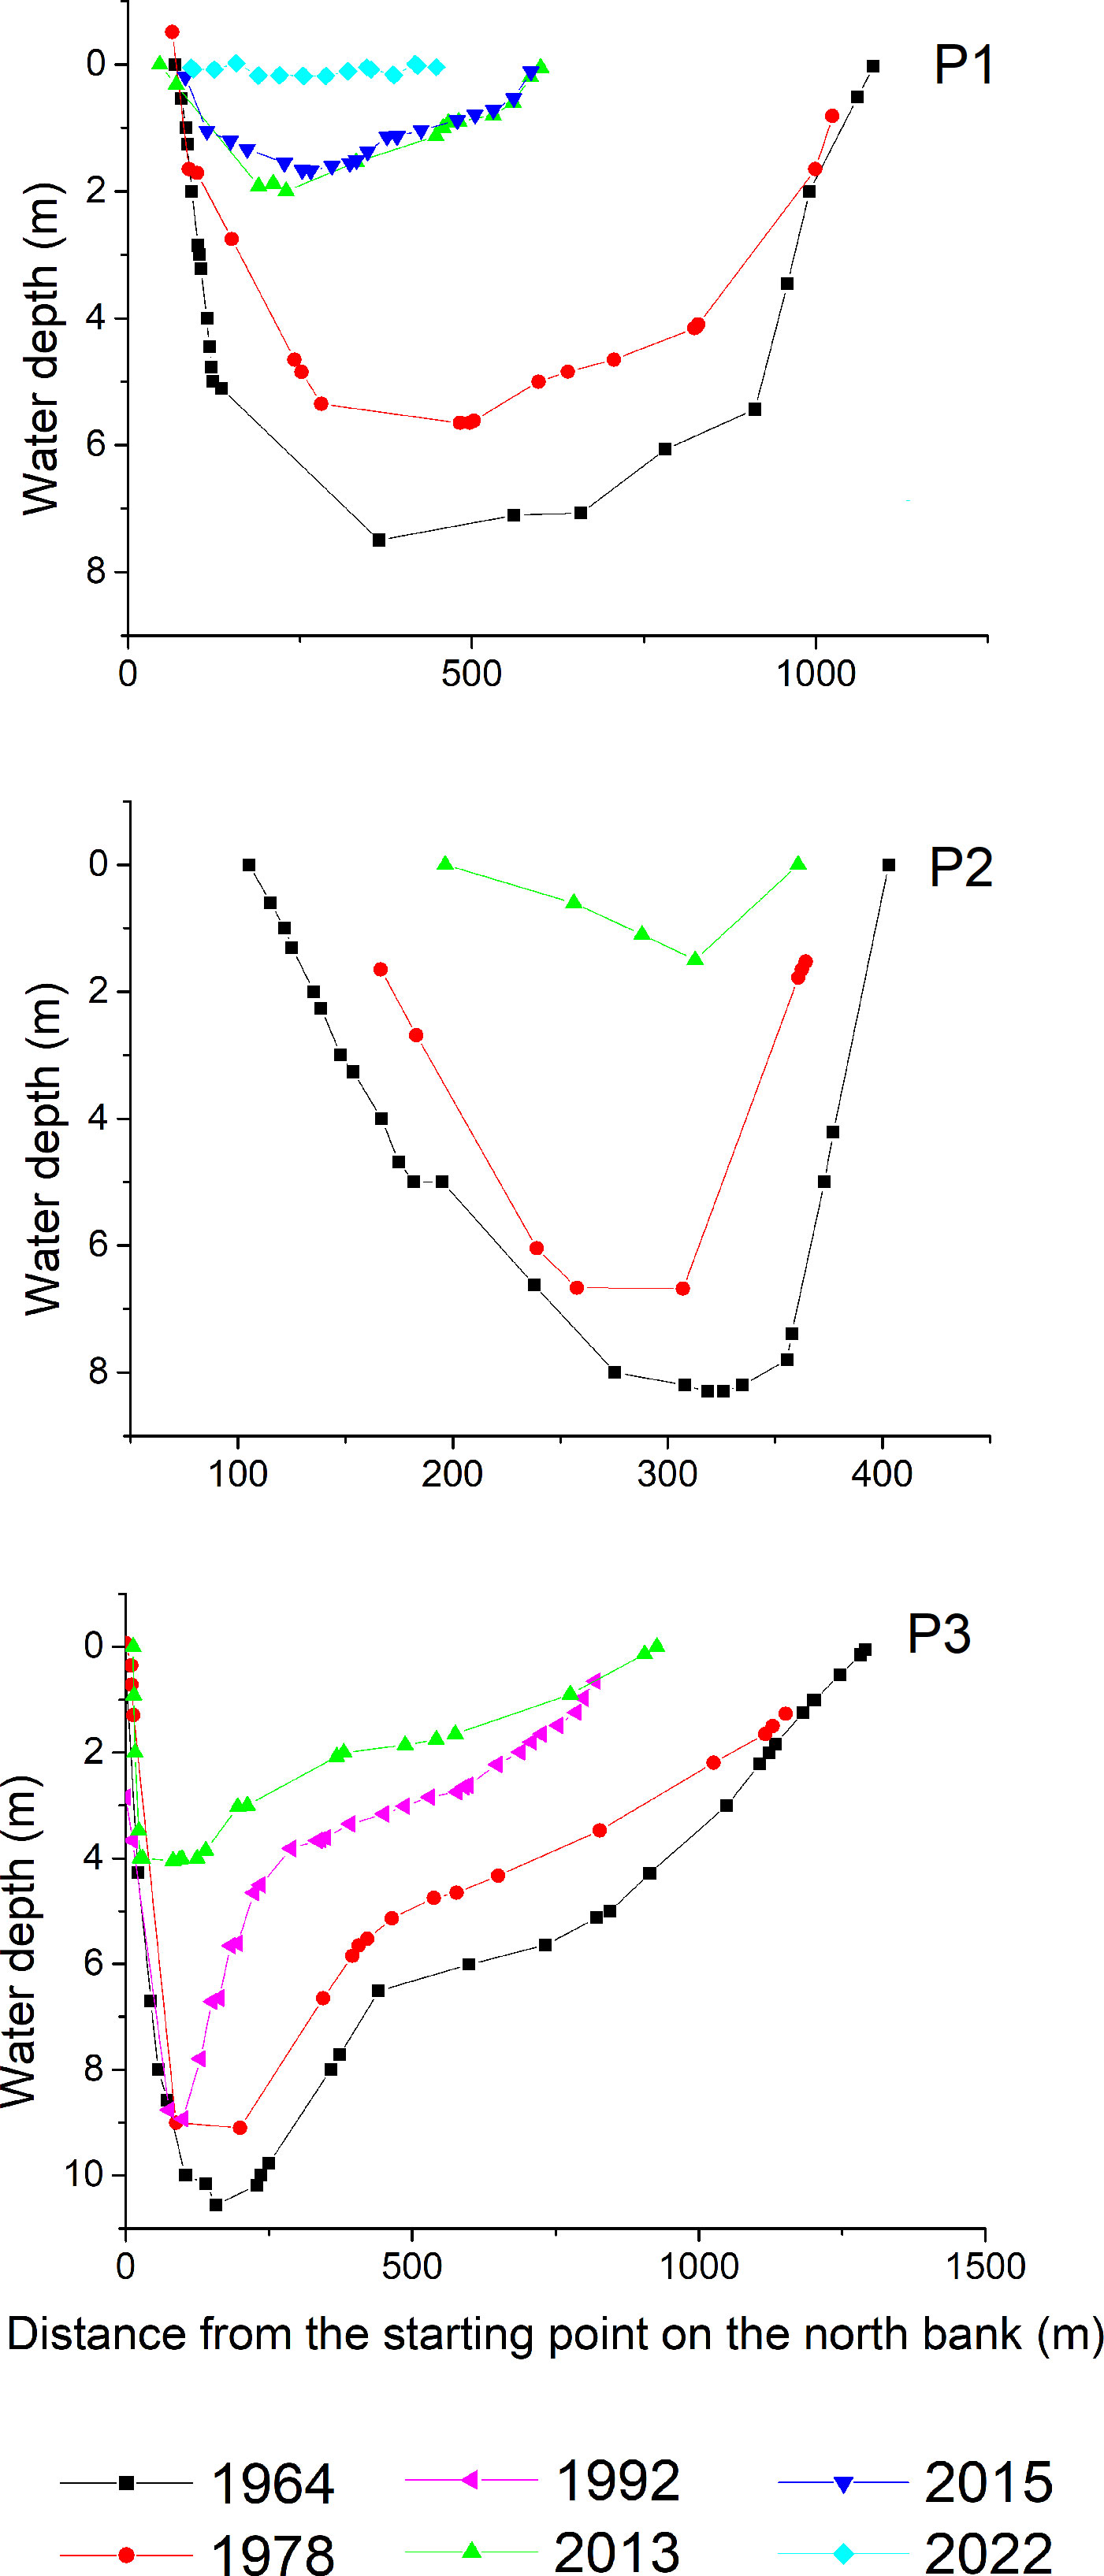
Figure 8 Typical cross-sectional topography changes in the three channels.
5 Discussion
5.1 Anthropogenic activity effects on tidal dynamics and sediment transport
Puba Bay is macrotidal with the tides being the primary force driving its long-term geomorphological evolution. It has been heavily silted in recent decades. The siltation of a tidal bay results from the diminishing ability of tidal fluxes to wash out the sediment delivered into the bay during flood tides (Serrano et al., 2013; Mandal and Chaudhuri, 2021). The sediment transport capacity of tidal water is influenced by variations in the tidal prism, defined as the volume of water contained in an estuary or embayment between mean low and mean high tides (Luketina, 1998). This can be calculated by multiplying the mean water area of the embayment at high and low tide levels by the mean tidal range (Shigeruma, 1980; Zhang, 1987). Because of the importance of spring tides on hydrodynamics and mass transport, the water areas of the mean high- and low-water during the spring tidal phase were selected to calculate the tidal prism here (Gao, 1988). The mean spring tidal range (5.2 m) was obtained from long-term tidal gauge records for Puba Bay (ECCHE, 1992). The results show that the tidal prism was 316.032 × 10⁶, 245.593 × 10⁶, and 137.437 × 10⁶ m3 in 1964, 1975, and 2013, respectively. The tidal prism decreased by 178.595 × 10⁶ m3 between 1964 and 2013, accounting for 56.5% of its 1964 value. The tidal prism reduction was caused by a decrease in the intertidal zone and underwater area. Mariculture ponds and coastal reclamations occupy a portion of the bay area and may be the primary factor influencing the topography evolution in Puba Bay. Under natural evolution conditions without human activity, the bay should be in a state of slow evolution or dynamic equilibrium. However, this activity has interrupted the natural geomorphic evolution of the bay, causing a tidal prism decrease, and sediment transport weakening out of the bay, resulting in sediment accumulation.
Sufficient sediment supply is a necessary condition for the siltation of a bay. The sediment accumulating in the East Zhejiang coastal area mainly comes from the Changjiang River, and the wide muddy tidal flat grows seawards with this accumulation (Milliman et al., 1985; Gu et al., 1997). For small bays like Puba Bay, the muddy sediment is enough for their natural evolutionary needs, evidenced by the high SSC. As mentioned above, the vertical average SSC is 0.928 kg/m3 during the Puba Bay spring tide. In this way, the net sediment transport direction is mainly related to tidal asymmetry in tidal environments (Dronkers, 1986; Van Maren and Gerritsen, 2012; Gatto et al., 2017; Lafta, 2022). The increase of flood dominance in the PBC suggests that sediment is being transported into the bay. This trend corresponds to the siltation of the bay between 1978 and 2019. Due to coastal reclamation, the increase of flood dominance inducing sediment accumulation has also been documented in the Hangzhou Bay– Qiantang Estuary system (Xie et al., 2017b; Xie et al., 2022) and the north branch of the Changjiang Estuary (Guo et al., 2021). The NTC has nearly silted up, with the BDC becoming the main channel for material transport. The ebb dominance decrease in the BDC indicates that sediment transport out of the bay is diminishing.
However, the observed tidal velocity data here allowed for the qualitative interpretation of tidal asymmetry and the net sediment movement into the bay that resulted in siltation. Traditional methods of quantifying tidal asymmetry can be used to explain the relationship between tidal asymmetry and morphological evolution in the future. Meanwhile, due to a lack of sediment transport data, numerical modeling or remote sensing can be used to analyze the change in net sediment transport in future.
5.2 Feedback mechanisms between morphology evolution and anthropogenic activities
Coastal evolution has multivariate characteristics that become more complicated owing to the interactions between many variables. This reciprocal interaction is referred to as feedback. Anthropogenic activity is an important factor in the evolution of Puba Bay. As previously stated, coastal reclamation and mariculture ponds occupy part of the intertidal flat, resulting in a reduction in this area. There is negative feedback between the extension of anthropogenic activities and intertidal flat areas (Jia et al., 2003; Wang et al., 2012; Liu et al., 2017). Prior to these activities, Puba Bay had a large ratio of intertidal area to total basin area. In this case, ebb dominance may occur until a dynamic equilibrium is reached between sediment input and output in the bay. When coastal reclamation and mariculture ponds occurred in the intertidal flat, this equilibrium was broken and flood dominance resulted. This negative feedback occurs to maintain the shoal shape, resulting in seaward migration of the intertidal flat outer boundaries, causing siltation of the bay.
Puba Bay is macrotidal, and its semi-enclosed environment, surrounded by low hills on three sides, limits wave propagation. It can be arbitrarily defined as sheltered coasts where the offshore wave height is reduced by more than 75% (Chaumillon et al., 2019). Sediment accumulation is common in tidal bays on sheltered shores. Considering the sediment fill and regression of this type of tidal bay as variables, the reclamation and mariculture pond building would increase the natural regression tendency through a positive feedback mechanism (Schmitt and Chaumillon, 2023). Although the selected variables and feedback mechanisms generated are different, the results of both show that coastal reclamation and mariculture pond building promote siltation of the bay.
5.3 Proposals for the management of mariculture pond expansion
Mariculture ponds were built after 1992 and have since become a major anthropogenic activity in Puba Bay. The area of the constructed mariculture ponds was 38.253 km2 and constituted 60.4% of the reduced area of the intertidal zone between 1964 and 2020. Extensive anthropogenic activity has resulted in marked siltation of the bay, threatening its ecological health and sustainable utilization. To restore the water depth and capacity for material exchange in the bay, pond expansion must be terminated, and the cofferdams of some ponds need be lowered to below the floodwater level. Lowering cofferdams limits the aquaculture capacity of some breeding species (such as green crabs) and reduces the aquaculture income of local fishmen. As a result, these ponds must be carefully selected for management purposes. First, the mariculture ponds should be properly classified. Influenced by traditional customs, some local villagers, or villages independently engaged in intertidal flat aquaculture activities without obtaining government permits. Mariculture ponds, without administrative breeding permits or that do not comply with relevant planning—coastal protection, utilization planning, and intertidal aquaculture planning— must be prioritized for disposal.
Furthermore, the total area of the mariculture ponds needs to be calculated. From the perspective of geomorphological evolution, the P-A relationship can be employed to explore this. Gao (1988) calculated the P-A relationships of tidal inlets along the East China Sea coast, and the linear related coefficient between and equaled 0.97. Xia (2011) divided the Sanmen Bay into eight sub-inlet units and calculated the P-A relationship with the linear related coefficient being 0.999. Not only because of the better correlation between and , there are also similarities between Puba Bay and the sub-inlets in the Sanmen Bay in terms of morphology, formation, and evolution. Therefore, the P-A expression of Xia (2011) was employed here:
where, is the inlet cross-sectional area, is the basin tidal prism. By lowering cofferdams of some mariculture ponds, the new intertidal zone area and basin tidal prism can be calculated. Then, the inlet cross-sectional area can be obtained. Here we took the water depth and area of mariculture ponds from 2013 as an example. The location of the inlet cross-section is shown in Figure 1. According to the DEM in 2013, the cross-section was extracted and its area calculated to be 4295 m2. If the area of mariculture ponds decreases by 10 km2, the new intertidal zone area and basin tidal prism are calculated to be 27.82 km2 (56% increase) and 88.733 × 10⁶ m3, respectively. Then is calculated to be 7501 m2 ccording to the Equation 1. Under constant width, the water depth of the cross-section increases. Therefore, by setting the target value of cross-section area or water depth, the reserved area of mariculture ponds can be calculated using the P-A relationship formula.
6 Conclusions
Mariculture pond expansion and coastal reclamation resulted in a decrease in the intertidal zone, reducing the tidal prism and influencing tidal asymmetry during the last five decades in Puba Bay. Both the tidal prism and maximum ebb and flood velocities during the spring tide decreased. Flood dominance increased, whereas ebb dominance decreased in the main waterway. With enough supply of muddy sediment, the dynamic tidal variations caused more sediment to be transported into the bay. Puba Bay has experienced rapid siltation with the obvious decreases of underwater area and volume, water depth, and width of cross-section. There is a negative feedback and positive feedback mechanism between the extension of anthropogenic activity and intertidal flat area, and the sediment fill, respectively. Both feedback mechanisms cause siltation of the bay.
Large-scale mariculture pond expansion is the major factor inducing rapid siltation of Puba Bay. To maintain the water depth and capacity for material exchange in the bay, the cofferdams of some mariculture ponds need be lowered below floodwater levels. Scientific planning should be developed in future to determine the total area of reserved mariculture ponds.
Data availability statement
The original contributions presented in the study are included in the article/supplementary material. Further inquiries can be directed to the corresponding authors.
Author contributions
YL: Writing – original draft, Writing – review & editing. XX: Writing – review & editing. XW: Methodology, Writing – original draft. TC: Data curation, Writing – original draft. JZ: Data curation, Writing – original draft.
Funding
The author(s) declare financial support was received for the research, authorship, and/or publication of this article. This work was funded by Zhejiang Provincial Natural Science Foundation of China under Grant No. LDT23D06025D06, the Survey of Using Sea Areas for Aquatic Breeding in Zhejiang Province under Grant No. SJ20089, and Survey of Types of Coastal Wetlands in Zhejiang Province under Grant No. DJ21077G.
Acknowledgments
We would like to thank Minmin Ding and Minghui Zhu for their help in the field investigation. We also would like to thank Prof. Yan Li from State Key Laboratory of Satellite Ocean Environment Dynamics (SOED) for his valuable advices. Reviewers and the academic editor are thanked for their valuable and constructive comments in improving the overall quality of this work.
Conflict of interest
The authors declare that the research was conducted in the absence of any commercial or financial relationships that could be construed as a potential conflict of interest.
Publisher’s note
All claims expressed in this article are solely those of the authors and do not necessarily represent those of their affiliated organizations, or those of the publisher, the editors and the reviewers. Any product that may be evaluated in this article, or claim that may be made by its manufacturer, is not guaranteed or endorsed by the publisher.
References
Andes L. C., Cox A. L. (2017). Rectilinear inverse distance weighting methodology for bathymetric cross-section interpolation along the Mississippi River. J. Hydrol. Eng. 22 ((7)), 04017014. doi: 10.1061/(ASCE)HE.1943-5584.0001514
Chaumillon E., Cange V., Gaudefroy J., Merle T., Bertin X., Pignon C. (2019). Controls on shoreline changes at Pluri-annual to secular timescale in mixed-energy rocky and sedimentary estuarine systems. J. Coast. Res. 88, 135–156. doi: 10.2112/SI88-011.1
Chen Y. H., Li G. S., Cui L. L., Li L. J., He L., Ma P. P. (2022). The effects of tidal flat reclamation on the stability of the coastal area in the Jiangsu Province, China, from the perspective of landscape structure. Land 11, 421. doi: 10.3390/land11030421
Dai Z. J., Fagherazzi S., Mei X. F., Chen J. Y., Meng Y. (2016). Linking the infilling of the North Branch in the Changjiang (Yangtze) estuary to anthropogenic activities from 1958 to 2013. Mar. Geol. 379, 1–12. doi: 10.1016/j.margeo.2016.05.006
Dallas K., Barnard P. L. (2009). Linking human impacts within an estuary to ebb-tidal delta evolution. J. Coast. Res. Spec. Issue. 56, 713–716. Available at: https://www.jstor.org/stable/25737671
Dronkers J. (1986). Tidal asymmetry and estuarine morphology. Neth. J. Sea. Res. 20, 117–131. doi: 10.1016/0077-7579(86)90036-0
ECCHE (Editorial Committee for Chinese Harbours and Embayments) (1992). Chinese Harbours and Embayments (Beijing: China Ocean Press), 336–349.
Friedrichs C. T. (2011). “Tidal flat morphodynamics: A synthesis,” in Treatise on Estuarine and Coastal Science. Eds. Wolanski E., Mclusky D. (Waltham: MA: Academic Press), 137–170.
Friedrichs C. T., Aubrey D. G. (1988). Non-linear tidal distortion in shallow well-mixed estuaries: A synthesis. Estuar,. Coast. Shelf S 27, 521–545. doi: 10.1016/0272-7714(88)90082-0
Gao G. D., Wang X. H., Bao X. W., Song D. H., Lin X. P., Qiao L. L. (2018). The impacts of land reclamation on suspended-sediment dynamics in Jiaozhou Bay, Qingdao, China. Estuar. Coast. Shelf S 206, 61–75. doi: 10.1016/j.ecss.2017.01.012
Gao W. L., Shen F., Tan K., Zhang W. G., Liu Q. X., Lam N. S. N., et al. (2021). Monitoring terrain elevation of intertidal wetlands by utilising the spatial-temporal fusion of multi-source satellite data: A case study in the Yangtze (Changjiang) Estuary. Geomorphology 383, 107683. doi: 10.1016/j.geomorph.2021.107683
Gatto V. M., Van Prooijen B. C., Wang Z. B. (2017). Net sediment transport in tidal basins: Quantifying the tidal barotropic mechanisms in a unified framework. Ocean Dynam. 67, 1385–1406. doi: 10.1007/s10236-017-1099-3
Gu G. C., Hu F. X., Zhang Z. T. (1997). The sediment source and development mechanics of the muddy coast in the Ease Zhejiang. Donghai Mar. Sci. 15, 1–12.
Guo L. C., Xie W. M., Xu F., Wang X. Y., Zhu C. Y., Meng Y., et al. (2021). A historical review of sediment export- import shift in the North Branch of Changjiang Estuary. Earth Surf. Process Landf 47, 5–16. doi: 10.1002/esp.5084
Hu F. X., Cao P. K. (1981). Characteristics of the tidal wave movement in the Sanmen Bay and its relationship with the topographic development. Oceanologia ET Limnologia Sin 12, 225–234.
Jewell S. A., Walker D. J., Fortunato A. B. (2012). Tidal asymmetry in a coastal lagoon subject to a mixed tidal regime. Geomorphology 138, 171–180. doi: 10.1016/j.geomorph.2011.08.032
Jia J. J., Gao S., Xue Y. C. (2003). Sediment dynamic processes of the Yuehu inlet system, Shandong Peninsula, China. Estuar. Coast. Shelf S . 57, 783–801. doi: 10.1016/S0272-7714(02)00406-7
Jiang T. T., Pan J. F., Pu X. M., Wang B., Pan J. J. (2015). Current status of coastal wetlands in China: Degradation, restoration, and future management. Estuar. Coast. Shelf Sci. 164, 265–275. doi: 10.1016/j.ecss.2015.07.046
Lafta A. A. (2022). Investigation of tidal asymmetry in the Shatt Al-Arab river estuary, Northwest of Arabian Gulf. Oceanologia 64, 376–386. doi: 10.1016/j.oceano.2022.01.005
Li L. J., Li G. S., Du J. Q., Wu J., Cui L. L., Chen Y. H. (2022). Effects of tidal flat reclamation on the stability of coastal wetland ecosystem services: A case study in Jiangsu Coast, China. Ecol. Indic. 145, 109697. doi: 10.1016/j.ecolind.2022.109697
Liang H. D., Kuang C. P., Olabarrieta M., Song H. L., Ma Y., Dong Z. C., et al. (2018). Morphodynamic responses of Caofeidian channel-shoal system to sequential large-scale land reclamation. Contin. Shelf Res. 165, 12–25. doi: 10.1016/j.csr.2018.06.004
Liu Y. F., Xia X. M., Chen S. L., Jia J. J., Cai T. L. (2017). Morphological evolution of Jinshan trough in Hangzhou bay (China) from 1960 to 2011. Estuar. Coast. Shelf S 198, 367–377. doi: 10.1016/j.ecss.2016.11.004
Luketina D. (1998). Simple tidal prism models revisited. Estuar. Coast. Shelf S. 46, 77–84. doi: 10.1006/ecss.1997.0235
Mandal S., Chaudhuri S. (2021). Hydrodynamic stability of tidal inlet system: A case study of Pichaboni inlet, Purba Medinipur, West Bengal, India. Reg. Stud. Mar. Sci. 46, 101869. doi: 10.1016/j.rsma.2021.101869
Mei X. F., Dai Z. J., Wei W., Li W. H., Wang J., Sheng H. (2018). Secular bathymetric variations of the North Channel in the Changjiang (Yangtze) Estuary, China 1880–2013: Causes and effects. Geomorphology 303, 30–40. doi: 10.1016/j.geomorph.2017.11.014
Milliman J. D., Huang-ting S., Zuo-sheng Y., Meade R. H. (1985). Transport and deposition of river sediment in the Changjiang estuary and adjacent continental shelf. Contin. Shelf Res. 4, 37–45. doi: 10.1016/0278-4343(85)90020-2
Murray N. J., Worthington T. A., Bunting P., Duce S., Hagger V., Lovelock C. E., et al. (2022). High-resolution mapping of losses and gains of Earth’s tidal wetlands. Science 376, 744–749. doi: 10.1126/science.abm9583
Schmitt A., Chaumillon E. (2023). Understanding morphological evolution and sediment dynamics at multi-time scales helps balance human activities and protect coastal ecosystems: An example with the Gironde and Pertuis Marine Park. Sci. Total Environ. 887, 163819. doi: 10.1016/j.scitotenv.2023.163819
Serrano D., Ramírez-Félix E., Valle-Levinson A. (2013). Tidal hydrodynamics in a two-inlet coastal lagoon in the Gulf of California. Contin. Shelf Res. 63, 1–12. doi: 10.1016/j.csr.2013.04.038
Shigeruma T. (1980). Tidal prism-throat area relationship of the bays of Japan. Shore & Beach 48, 30–35.
Sun Z. L., Huang S. J., Jiao J. G., Nie H., Lu M. (2017). Effects of cluster land reclamation projects on storm surge in Jiaojiang Estuary, China. Water Sci. Eng. 10, 59–69. doi: 10.1016/j.wse.2017.03.003
Tian B., Wu W. T., Yang Z. Q., Zhou Y. X. (2016). Drivers, trends, and potential impacts of long-term coastal reclamation in China from 1985 to 2010. Estuar. Coast. Shelf S. 170, 83–90. doi: 10.1016/j.ecss.2016.01.006
Van Maren D. S., Gerritsen H. (2012). Residual flow and tidal asymmetry in the Singapore Strait, with implications for resuspension and residual transport of sediment. J. Geophys. Res. Oceans 117 ((C4)), C04021. doi: 10.1029/2011JC007615
Van Maren D. S., Oost A. P., Wang Z. B., Vos P. C. (2016). The effect of land reclamations and sediment extraction on the suspended sediment concentration in the Ems Estuary. Mar. Geol. 376, 147–157. doi: 10.1016/j.margeo.2016.03.007
Wang Y. P., Gao S., Jia J. J., Thompson C. E. L., Gao J. H., Yang Y. (2012). Sediment transport over an accretional intertidal flat with influences of reclamation, Jiangsu coast, China. Mar. Geol. 291–294, 147–161. doi: 10.1016/j.margeo.2011.01.004
Wang Z. B., Jeuken M. C. J. L., Gerritsen H., De Vriend H. J., Kornman B. A. (2002). Morphology and asymmetry of the vertical tide in the Westerschelde estuary. Contin. Shelf Res. 22, 2599–2609. doi: 10.1016/S0278-4343(02)00134-6
Wei W., Dai Z. J., Mei X. F., Liu J. P., Gao S., Li S. S. (2017). Shoal morphodynamics of the Changjiang (Yangtze) estuary: Influences from river damming, estuarine hydraulic engineering and reclamation projects. Mar. Geol. 386, 32–43. doi: 10.1016/j.margeo.2017.02.013
Xie D. F., Bing Wang Z., Huang J. B., Zeng J. (2022). River, tide and morphology interaction in a macro-tidal estuary with active morphological evolutions. Catena 212, 106131. doi: 10.1016/j.catena.2022.106131
Xie D. F., Gao S., Wang Z. B., Pan C. H., Wu X. G., Wang Q. S. (2017a). Morphodynamic modeling of a large inside sand bar and its dextral morphology in a convergent estuary: Qiantang Estuary, China. J. Geophys. Res. Earth Surf. 122, 1553–1572. doi: 10.1002/2017JF004293
Xie D. F., Pan C. H., Wu X. G., Gao S., Wang Z. B. (2017b). Local human activities overwhelm decreased sediment supply from the Changjiang River: Continued rapid accumulation in the Hangzhou Bay- Qiantang Estuary system. Mar. Geol. 392, 66–77. doi: 10.1016/j.margeo.2017.08.013
Yang Y., Chui T. F. M. (2017). Hydrodynamic and transport responses to land reclamation in different areas of semi-enclosed subtropical bay. Contin. Shelf Res. 143, 54–66. doi: 10.1016/j.csr.2017.06.008
Zhang Q. M. (1987). On P-A relationships of tidal inlets along South China coast. Trop. Oceanol 6, 10–18.
Zhao J., Guo L. C., He Q., Wang Z. B., van Maren D. S., Wang X. Y. (2018). An analysis on half century morphological changes in the Changjiang Estuary: Spatial variability under natural processes and human intervention. J. Mar. Syst. 181, 25–36. doi: 10.1016/j.jmarsys.2018.01.007
Zhou Z., Coco G., Townend I., Olabarrieta M., van der Wegen M., Gong Z., et al. (2017). Is ‘morphodynamic equilibrium’ an oxymoron? Earth Sci. Rev. 165, 257–267. doi: 10.1016/j.earscirev.2016.12.002
Keywords: macro-tidal bay, mariculture pond expansion, coastal reclamation, rapid siltation, Puba Bay
Citation: Liu Y, Xia X, Wang X, Cai T and Zheng J (2024) Human-induced rapid siltation within a macro-tidal bay during past decades. Front. Mar. Sci. 11:1325003. doi: 10.3389/fmars.2024.1325003
Received: 20 October 2023; Accepted: 23 January 2024;
Published: 07 February 2024.
Edited by:
Yang Yang, Nanjing Normal University, ChinaReviewed by:
Qinghua Ye, Deltares, NetherlandsDongfeng Xie, Zhejiang Institute of Hydraulics & Estuary, China
Copyright © 2024 Liu, Xia, Wang, Cai and Zheng. This is an open-access article distributed under the terms of the Creative Commons Attribution License (CC BY). The use, distribution or reproduction in other forums is permitted, provided the original author(s) and the copyright owner(s) are credited and that the original publication in this journal is cited, in accordance with accepted academic practice. No use, distribution or reproduction is permitted which does not comply with these terms.
*Correspondence: Yifei Liu, sd_106108@sio.org.cn; Xiaoming Xia, xiaxm@sio.org.cn