 Sining Jiang
 Zhongwen Guo
 Hailei Zhao*
94% of researchers rate our articles as excellent or good
Learn more about the work of our research integrity team to safeguard the quality of each article we publish.
Find out more
TECHNOLOGY AND CODE article
Front. Mar. Sci., 21 February 2024
Sec. Ocean Observation
Volume 11 - 2024 | https://doi.org/10.3389/fmars.2024.1324523
This article is part of the Research TopicTowards Standards for Marine Environment Impact AssessmentView all 7 articles
This paper presents the design and implementation of an ISO-compliant ocean profiling observation system for wave-powered vertical profiler. This system aims to provide a comprehensive, scalable, and interoperable solution for high-resolution, real-time oceanic observation. As a part of this system, we introduce a wave-powered vertical profiler, known as “Wave Master,” designed to offer enhanced stability and reliability for long-term oceanic data collection. The core of the paper focuses on the Ocean Profiling Observation Complex Virtual Instrument (OPO-CVI), a comprehensive system developed in alignment with ISO 21851 standard. OPO-CVI seamlessly integrates data collection, transmission, storage, and visualization. Specifically, OPO-CVI addresses the challenges of information isolation, system rigidity, and lack of modularity in traditional ocean profiling methods by standardizing data formats and transmission protocols, allowing for seamless integration of new observation elements, and employing a modular architecture for enhanced scalability and reusability. By offering detailed technical insights into the OPO-CVI architecture and its compliance with ISO 21851 standard, this paper aims to contribute significantly to the advancement of standardized, efficient, and reliable oceanic observation systems.
Long-term, high-resolution ocean profiling observations (OPOs) play a crucial role in various fields, including physical oceanographic research, marine technology development, environmental protection, and natural disaster prediction. They contribute to marine conservation efforts and sustainable resource management (Gould et al., 2013; Wang et al., 2022). However, achieving comprehensive and high-resolution OPOs is a challenging task that requires both reliable sensing equipment and robust data management systems.
In the realm of profiling instruments, existing marine profiling instruments have made significant strides in the collection of oceanographic data. However, these instruments, including seabed bases (Send et al., 2013), shipboard winches (Nash et al., 2017), and McLane profilers (Morrison et al., 2000), are not without their limitations. They rely heavily on electric power, which ties their operational range and duration to the availability of underwater energy sources. This reliance poses constraints on their application in vast and dynamic marine environments where power supply can be unpredictable. In the 1990s, the University of California, Scripps Institution of Oceanography developed the Wirewalker (Rainville and Pinkel, 2001), a wave-powered profiling float. This instrument harnesses wave energy at the sea surface for autonomous vertical profiling, employing an all-mechanical design that requires no electrical power and can operate continuously for extended periods (Pinkel et al., 2011; Omand et al., 2017). The Wirewalker has proven successful in various oceanographic research applications, including the study of internal waves (Wang and Pawlowicz, 2011), ocean-atmosphere interactions (Wijesekera et al., 2016), plankton ecology (Omand et al., 2017), coastal circulation (Feddersen et al., 2016), ocean turbulence (Fan et al., 2018), and coastal water quality assessment. However, despite its achievements, challenges persist, including switch device malfunctions, detachment of switch cams, sensor looseness, and mooring cable abrasion (Cumbee, 2019).
In the realm of marine observation systems, the aspiration for an efficient, sustainable, and comprehensive global ocean observing system has been a focal point of international coordination efforts for decades. Maritime nations have established their own ocean observation systems to monitor marine environments and analyze data in real time. Notable examples include the UK’s Proudman Oceanographic Laboratory Coastal Ocean Modeling System (POLCOMS), the Carolinas Coastal Ocean Observing and Prediction System (Caro-COOPS) in the United States, and Canada’s Victoria Experimental Network Under the Sea (VENUS). These marine observation systems have been successful in real-time monitoring and targeted analysis of ocean data. However, they were developed with a local focus to address specific issues, often overlooking the need for a global perspective. This oversight has led to several challenges:
Firstly, these systems are often designed based on specific requirements during their development, lacking consistent standards and specifications. This has led to issues such as inconsistent data formats and nonuniform data transmission methods between systems, resulting in the problem of information isolation and limiting data sharing and interconnectivity (Qiu et al., 2018). Secondly, as ocean science evolves, the demand for observation data elements and equipment continues to grow and evolve. However, most existing oceanographic observation software solutions were not initially designed to accommodate the addition of new observation elements and devices in the future, resulting in insufficient system scalability and requiring substantial resources and time for system upgrades. Lastly, these systems often lack modular design, making the construction of new systems complex and time-consuming while also restricting software reusability. Therefore, to meet the demands of future marine scientific research and monitoring, greater emphasis on standardization, modularity, and scalability is needed to build more flexible and efficient ocean profiling observation systems.
To address these challenges, we design the Ocean Profiling Observation Complex Virtual Instrument (OPO-CVI) by referencing ISO 21851 requirements and aligning them with the practical needs of oceanic observation. Firstly, OPO-CVI, designed in line with ISO 21851 standard, addresses data inconsistency by standardizing data formats, ensuring uniform data transmission methods. This standardization fosters information sharing and interconnectivity between systems. Furthermore, in response to the evolving needs of ocean science and the challenge of system scalability, we have developed the OPO-CVI layered model. The layered approach accommodates the incorporation of new observation elements and devices, making the system highly adaptable to various oceanic conditions. For instance, integrating a new observational device into the OPO-CVI involves simply adding the device’s configuration information to the sensing layer, and then integrating the corresponding collection protocols into the acquisition layer. This modular approach significantly enhances the system’s scalability, addressing the issue of insufficient flexibility in existing systems. Lastly, the OPO-CVI’s architecture, being scalable and modular, allows for the easy addition or removal of components, thus adapting to evolving ocean science needs. Its modular design simplifies system construction and enhances software reusability. These features collectively enhance the flexibility and efficiency of ocean profiling observation systems, setting a new standard in the field.
Additionally, to validate the effectiveness of our OPO-CVI system when equipped with a real frontend ocean profiling instrument, we have developed an innovative wave-powered vertical profiler, named “Wave Master”, inspired by the principles of the Wirewalker. The Wave Master serves as the data acquisition device in the sensing layer of our ocean profiling observation system. Building upon the foundational structure of the existing Wirewalker, the Wave Master incorporates detailed improvements, addressing issues such as switch device malfunctions and switch cam detachment. These enhancements notably increase its stability and reliability during long-term operations. A detailed technical overview of the Wave Master is provided in Section “Wave Master” of “Methods”. The overall architecture of our ocean profiling observation system is shown in Figure 1. The Wave Master, driven by wave energy, moves the sensor-equipped vehicle vertically along a cable in the ocean, collecting ocean parameters from different depths and locations. These data are then transmitted to the OPO-CVI via a buoy situated on the ocean surface, which is equipped with satellite communication capabilities. The OPO-CVI integrates modules for data management, visualization, and computational analysis, offering functionalities such as data storage, querying, and display. Importantly, the standardized data structure and data interfaces designed in accordance with ISO 21851 standard make data integration between OPO-CVIs more convenient, enhancing the interoperability, scalability, and reusability of OPO-CVIs. Section “Design of OPO-CVI Model” of “Methods” provides an in-depth discussion of the design and implementation of OPO-CVI.
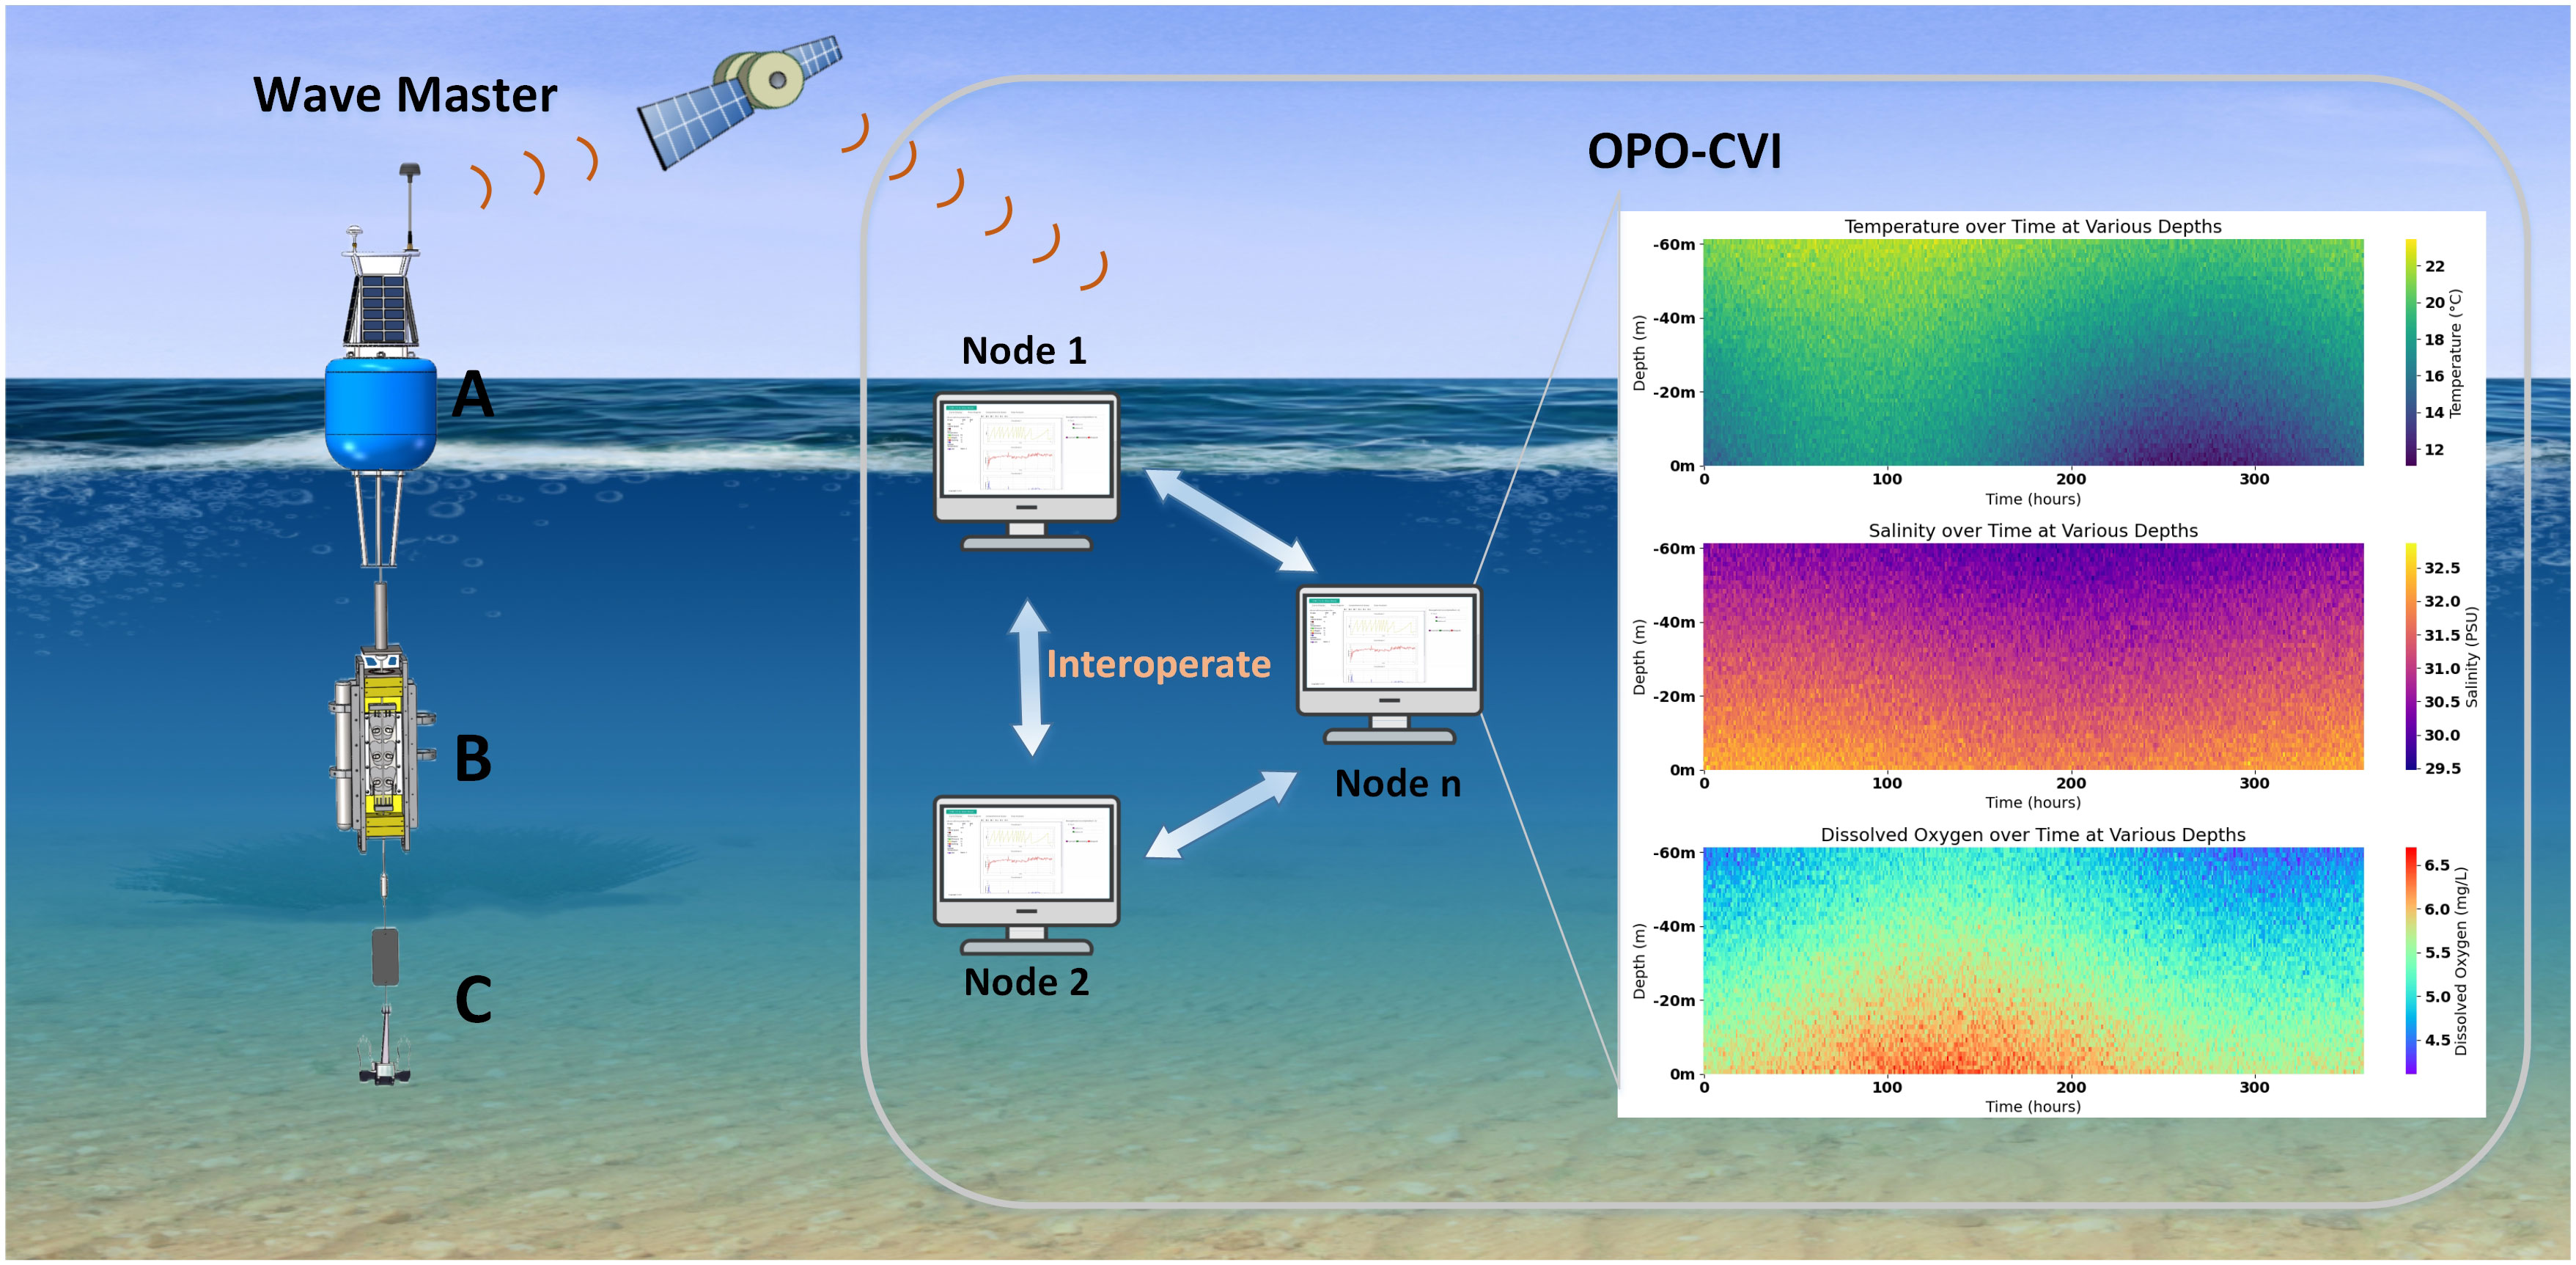
Figure 1 The framework of OPO-CVI for Wave Master. (A) communication buoy, (B) vehicle, (C) mooring system.
In the architecture of our ocean profiling observation system, the Wave Master serves as the cornerstone of the front-end sensing layer. Its role is pivotal in acquiring high-resolution time-series oceanic parameters across various vertical positions in the ocean. Wave Master is composed of three core components: a communication buoy that collects and sends data, a vehicle equipped with sensors to measure ocean conditions, and a mooring system to keep the device stable in water, as illustrated in the Figure 2. The function of the Wave Master is akin to an ocean sensing platform, dynamically traversing vertical depths to collect vital oceanographic data.
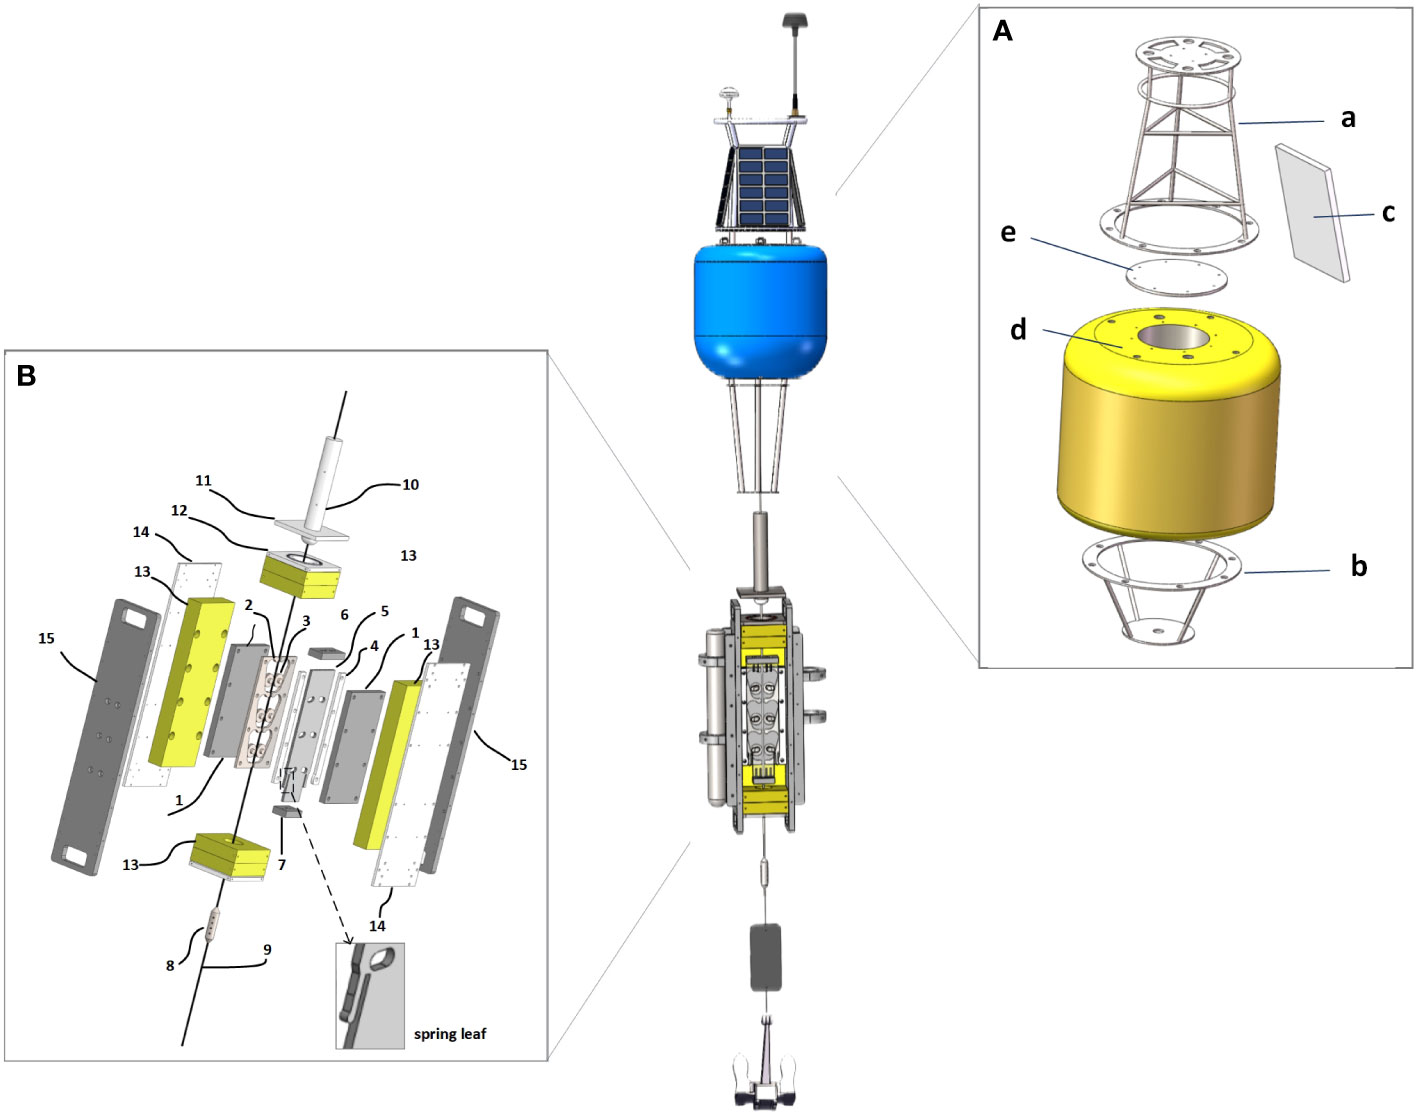
Figure 2 The design structure of Wave Master. In (A) panel, numerical labels 1–15 represent the backplate, limit plate, ratchet, fixed card plate, movable plate, upper trigger plate, lower trigger plate, limit block, steel cable, limit slider, communication receiver, communication transmitter, floatation material, outer shell cover, and outer shell side panels, respectively. In (B) panel, alphabetical labels a–e denote the upper tower, lower tower, solar panels, electronics compartment, and hatch cover, respectively.
The primary role of the communication buoy in the Wave Master system is to capture wave energy. As it oscillates in response to wave forces, moving up and down with the waves, this motion actively pulls the cable connected to buoy, thereby enabling the operational mechanism of the vehicle platform. Simultaneously, The electronic compartment of the Communication Buoy houses a satellite communication terminal, a versatile meteorological instrument suite, a platform data acquisition system, solar panels, and batteries. It is responsible for collecting meteorological data from sensors mounted on the buoy, capturing meteorological elements, as well as hydrological data from the multi-parameter profiling instrument installed on the wave energy platform. Subsequently, it stores, integrates, and transmits all data to the communication module. Utilizing satellite communication systems, this module relays the collected data back to the mainland. The lower end of the buoy connects to the mooring system, which comprises steel cables, weights, and a gravity anchor block. This system serves as the wave energy transmission mechanism for the entire platform.
Figure 2A presents the specific design of the communication buoy. The structural components include the buoy body, electronics compartment, lower tower, upper tower, electronics compartment cover, and tower connecting rods. The outer ring of the electronics compartment is equipped with O-rings to ensure waterproofing. The compartment cover features watertight threaded holes for the passage of tower-mounted devices and connections to data acquisition and satellite communication modules within the electronics compartment. The electronics compartment cover is made from aluminum alloy, subjected to anodization, and features threaded holes designed for various cable types. Regarding the center of gravity placement, research indicates that lowering the center of gravity of the buoy increases its natural frequency and widens the range of captured wave frequencies, resulting in more efficient wave energy capture. Therefore, in this design, the buoy’s center of gravity is positioned at a height of 0.2 meters above the buoy’s base (Zhao et al., 2023).
The Vehicle stands as the core component of the Wave Master, which is constructed from several components including the backplate, limit plate, ratchet, fixed card plate, movable plate, upper trigger plate, lower trigger plate, limit block, steel cable, limit slider, communication receiver, communication transmitter, flotation material, outer shell cover, and outer shell side panels, as shown in Figure 2B. Existing solutions, including the Wirewalker, predominantly employ a lever-based directional switching mechanism, as illustrated in Supplementary Figure S1A in Supplementary Material. However, this design, while functional, is complex and has a high failure rate (Cumbee, 2019), and is prone to marine biofouling during prolonged subsea operation. To address these issues, we have simplified the design by integrating the switching mechanism with a ratchet mechanism that locks the direction of movement, as shown in Supplementary Figure S1B in Supplementary Material. The directional change and locking of the underwater movement of the drive platform are achieved through the deformation of a spring leaf at the end of the movable plate.
The Vehicle is positioned along the steel cable, threaded through its central axis. It harnesses the wave energy transmitted through the mooring system and converts it into mechanical energy for profiling movements through an internal mechanical structure. The vehicle contains a unidirectional motion mechanism and a motion direction switching mechanism, allowing it to autonomously descend, ascend, switch, and lock its movement state underwater. Influenced by wave forces, the buoy undergoes vertical oscillations, which in turn drive the connected steel cable to ascend and descend. When the steel cable ascends, the unidirectional motion mechanism on the driving platform disengages, resulting in a relative displacement between the cable and the platform due to underwater resistance. Conversely, when the steel cable descends, the unidirectional motion mechanism engages, locking the platform with the cable for downward movement. This cyclic process continues, propelling the platform to oscillate and submerge under the influence of wave action until it reaches the bottom of the cable, triggering the unidirectional motion mechanism to unlock. At this point, the platform and cable operate independently, with the platform ascending, driven by its own buoyancy, until it reaches the top of the cable, where the state switches once more and locks. This continuous cycle ensures the automatic profiling motion of the Wave Master, driven by the energy harnessed from the waves. The autonomous vertical motion of the vehicle takes the attached sensors, enabling the collection of oceanic data across varied depths, thereby fulfilling the objective of wave-driven ocean profile observations. Furthermore, in (Zhao et al., 2023), detailed numerical simulations were conducted to analyze the hydrodynamic behavior and stability of the Wave Master under various ocean conditions. These simulations involved modeling the Wave Master’s response to wave dynamics and assessing its performance in maintaining position and stability.
The communication receiver is affixed to the limiting slider, while the transmitter is securely mounted on the external shell’s side and cover plates. The communication ends, comprising the receiver’s coupling coil and the transmitter’s coupling coil, are assembled opposite each other. Upon contact, they initiate communication, moving together on the limiting slider until the device’s motion state switches, ending the communication. During the movement process, the transmitter can move freely on the limiting slider, while the receiver can move freely on the cylindrical part of the limiting slider.
A wave-powered ocean profiling system is fundamentally a moored profiling platform due to its reliance on stable positioning for accurate data collection. This stability is achieved through mooring, which involves anchoring the system to a fixed location using cables, anchor chains, and ballasts. This concept is detailed in (Bailey et al., 2019), who explore various aspects of moored oceanographic instrumentation, including design considerations and operational benefits of such systems. This mooring setup is essential for ensuring the system’s stability and positioning, allowing for accurate and reliable data collection (Davidson and Ringwood, 2017). The mooring system of Wave Master is primarily composed of the mooring cable, ballast, gravity anchor, anchor chain, upper and lower limiting blocks, and swivel.
The Wave Master’s mooring system offers two operational modes: floating and anchored. These are designed to cater to scenarios requiring mobility, such as observing ocean currents and eddies, and to fixed area observations, respectively. The dual operational modes significantly enhance its versatility, allowing it to be effectively utilized across a diverse range of oceanographic research scenarios. Whether it’s drifting along with ocean currents to study mesoscale phenomena or staying anchored for localized observations, the adaptive design of our mooring system ensures that diverse research objectives can be met efficiently and effectively.
The concept of Complex Virtual Instruments (CVI), as discussed in (Guo et al., 2013; Hu et al., 2014), has emerged as a revolutionary approach in ocean sensor networks, offering a software-based representation of physical sensors that our OPO-CVI model leverages. A virtual instrument is essentially a software-based representation of a physical instrument or device. It allows users to interact with and control the instrument through a computer interface. In the context of ocean sensor networks, a CVI refers to a software model that simulates the behavior and characteristics of multiple ocean sensors. This model allows researchers and engineers to conduct experiments and simulations without the need for physical sensors or deployment in the actual ocean, saving time and resources. The CVI can be customized to simulate various types of ocean sensors, such as temperature sensors, pressure sensors, salinity sensors, and more. It can also incorporate realistic oceanographic models to simulate the behavior of the ocean and its impact on sensor measurements. In this paper, we delve into the architecture of a CVI model tailored for ocean sensor networks.
The ISO 21851 standard (ISO, 2020-08), titled “Marine Technology - Ocean Observation System – Design Criteria of Ocean Hydrology-Meteorological Observation System Reuse and Interaction,” was released by our team in 2020. It serves as the foundational framework for the Ocean Hydrology-Meteorological Observation CVI (OHM-CVI) model. This standard establishes a comprehensive framework for oceanic hydro-meteorological observation systems, specifying system functionality, data structure types, data transmission formats and protocols, as well as input and output interfaces. The system accommodates common oceanic instruments such as buoys, profilers, and shore-based instruments, while offering data reception, storage, display, processing, and analysis capabilities for a range of observations including water temperature, salinity, depth, ocean currents, waves, air temperature, air pressure, humidity, wind, and precipitation data.
The ISO 21851 standardized data input-output interfaces and data exchange formats. The input interface is responsible for receiving data collected by marine observation equipment. The output interface provides two data sharing methods, MQ and REST, tailored for different data sharing scenarios, facilitating interoperability for marine observation data. The standard also defines a Function Module, encompassing data visualization, statistical analysis, and comprehensive query functions, meeting the requirements for storage, display, processing, and analysis of hydro-meteorological observation data. The framework of OHM-CVI model standardized in ISO 21851 is depicted as Supplementary Figure S2 in Supplementary Material.
In the realm of ocean observation system software design, a well-defined layered architecture serves multiple critical functions. This layered architecture not only streamlines the organization and management of diverse observational data and functional modules but also ensures their independence. This independence facilitates the decoupling of modules, allowing for more efficient system design and operation. Besides, the modularity allowed by a layered architecture enables each layer to be developed, tested, and maintained independently, facilitating code reuse and system flexibility. The separation of concerns ensures that each layer can focus on its specific functionalities, such as data access or business logic, without being entangled with other layers. This separation enhances the system’s maintainability, as changes in one layer do not affect the others. Existing research has also delved into the layered architectures for ocean observation systems, but they all have certain limitations. For example, the Internet of Things (IoT) common layer architectures outlined in (Al-Absi et al., 2021) segregate the system into a business layer, application layer, data processing layer, data transmission layer, and perception and execution layer. However, this model was specifically designed for marine environment protection and monitoring, limiting its general applicability and thus its utility as a reference for the broader scope of ocean observation system software design. On the other hand, the layers architecture of the Ocean Sensor Web discussed in (Jiang et al., 2013) focuses mainly on the transmission and processing of data across various layers, incorporating multiple data sources and interfaces. Yet, it falls short in addressing advanced data analytics and interpretation and lacks explicit solutions for cross-platform data integration and standardization.
In this paper, we introduce the OPO-CVI layer model, which is divided into sensing layer, acquisition layer, management layer and application layer, as shown in Figure 3. Our model provides a clear hierarchical structure for more effective organization and management of ocean observational data. Unlike existing systems, our model complies with ISO 21851 standard, ensuring data consistency and comparability. The layered approach allows for easy addition or removal of components, making the system highly adaptable to various oceanic conditions. Designed to scale both horizontally and vertically, the OPO-CVI Layer Model meets a wide range of observational needs. Furthermore, our model facilitates seamless integration with other systems through standardized data formats and transmission protocols. By introducing the OPO-CVI Layer Model, we aim to set a new standard in the field of ocean observation systems, addressing identified limitations and gaps in existing research.
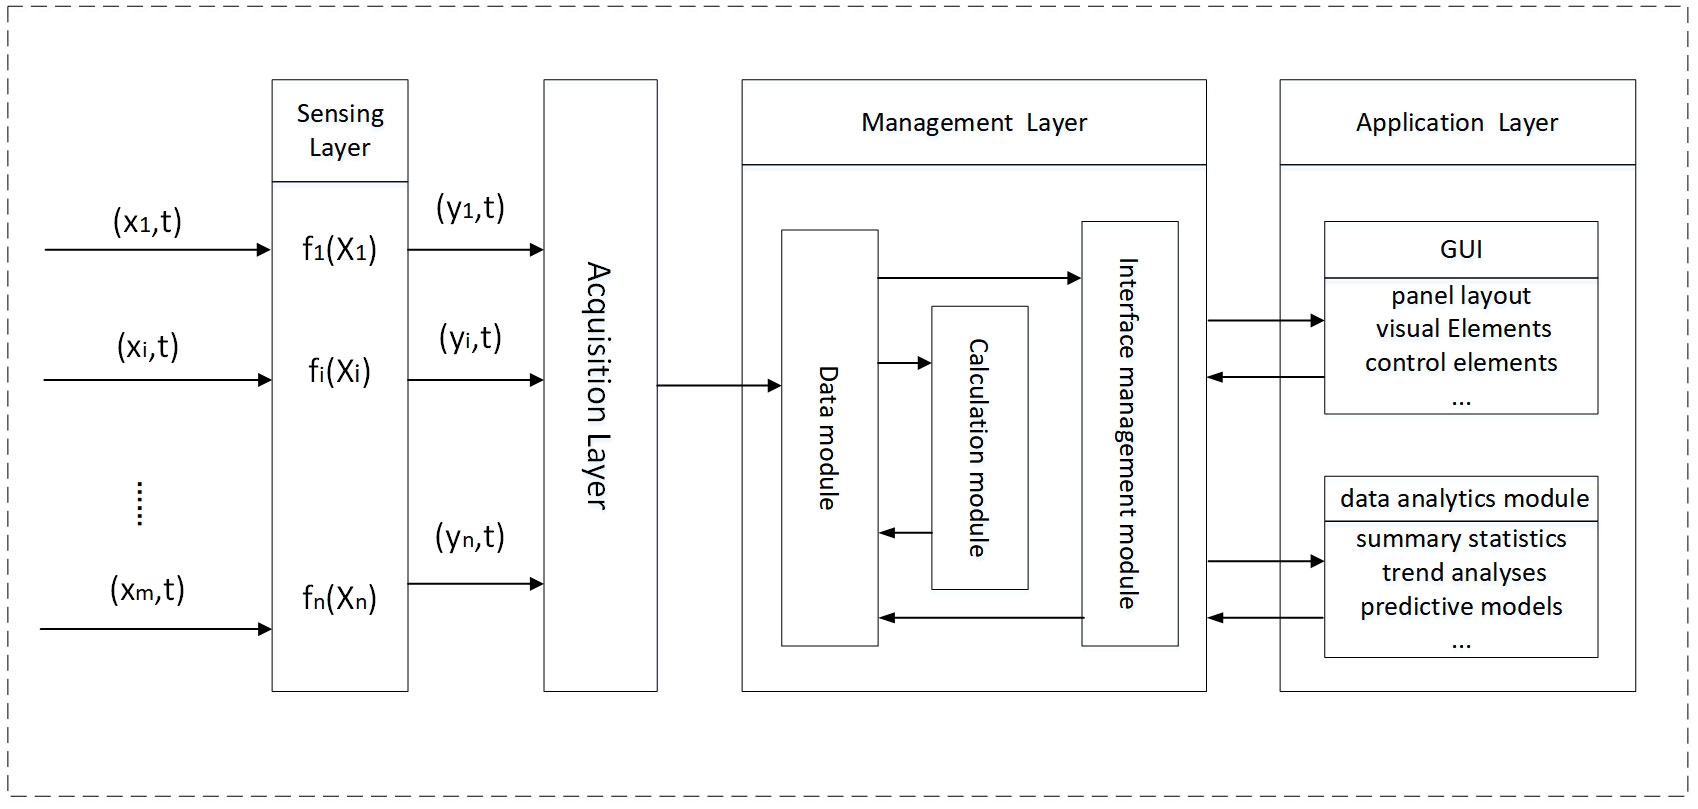
Figure 3 The layer model of OPO-CVI, which is divided into sensing layer, acquisition layer, management layer and application layer.
The sensing layer serves as the foundational layer of the CVI model. It is responsible for the initial acquisition of environmental data through Ocean Observation Instruments (OOIs) on wave master. These OOIs are designed to capture a wide range of oceanic parameters, such as sound waves, temperature gradients, and pressure differentials. The layer employs a variety of sensors, each with its unique capabilities and limitations, to ensure comprehensive data collection. Furthermore, the sensing layer is equipped with real-time monitoring capabilities to ensure data integrity and to facilitate immediate corrective actions in case of sensor malfunctions or data anomalies. The core task of OOIs is to transform analog signals, typically simulating environmental conditions, into digital data that computers can interpret. The output of this process is real numerical data accessible to users. To facilitate this, OPO-CVI employs a specific OOI description model, the model comprises key elements:
Input (X): Represents data acquired by sensors from the physical world, such as oceanic measurements.
Data Processing Procedure (F): Describes the transformation process applied to the electrical signals received from sensors. For instance, it may convert voltage data related to pressure measurements into actual pressure values using function f.
Output (Y): Signifies the results of the data processing that can be comprehended by users. These outputs are time-serialized data related to t.
The sensing layer employs a mathematical model to formalize the data acquisition and transformation process. The data processing function F consists of a set of individual functions f1,f2,…fn. These functions map the input data points X = {(x1,t), (x2,t),…(xm,t)} to output data points Y = {(y1,t), (y2,t),…(yn,t)}. Each function fi is responsible for transforming a subset Xiof X into an output yi. The relationship can be expressed as Equation (1):
The sensing layer consists of many OOIs responsible for data acquisition in oceanography. There are situations where one instrument relies on the output of another instrument. The access procedure involves OOI model operations, which include combination and connection operations. The combination operation combines multiple OOIs. Consider N different OOIs, each denoted as Ci containing an input Xi, a function Fi, and an output Yi, as expressed in Equation (2):
The Combination Operation generates a new OOI Cnew with its input Xnew, function Fnew, and output Ynew, as expressed in Equation (3):
The input Xnew is defined as Equation (4):
The function is the maximum function combination of the original OOIs, which can be expressed as Equation (5):
The output is the sum of all , as expressed in Equation (6):
There are situations where one instrument relies on the output of another instrument. This relationship is termed the OOI connection operation and represents an integration of OOIs. A portion of one instrument’s output becomes part of another instrument’s input. The connection between instruments A and B can be expressed as A → B, with the operation expressed as Equation (7):
Additionally, the Sensing Layer incorporates error models to account for sensor inaccuracies, denoted as E, which can be integrated into the data processing function F as F(X,E).
The acquisition layer plays a pivotal role in the OPO-CVI model, acting as the crucial link between the sensing layer and the subsequent layers. Its primary function is to efficiently collect data from a diverse array of OOIs using various communication interfaces, all while adhering to standardized oceanic observation protocols.
Given the inherent diversity in OOIs that can be hosted on the Wave Master, each potentially employing unique data access methods and communication protocols, the design of this layer embodies adaptability. In traditional oceanic observation system development, developers often face the challenge of accommodating distinct OOI requirements through manual code adjustments when deployed on profilers (Bermudez et al., 2009; Menaka and Gauni, 2021). The OPO-CVI model introduces a systematic approach to streamline data collection. To achieve this, the Acquisition Layer incorporates specialized acquisition software and modules. Each acquisition module is meticulously mapped to a specific OOI, establishing an automatic and standardized connection between the module and the instrument. This mapping is facilitated through abstract description files providing a standardized framework for defining OOI characteristics, communication protocols, and configuration details. These description files serve as the linchpin for efficient and adaptive data collection, bridging the gap between acquisition modules and OOIs. Figure 4 shows the definition of the description file.
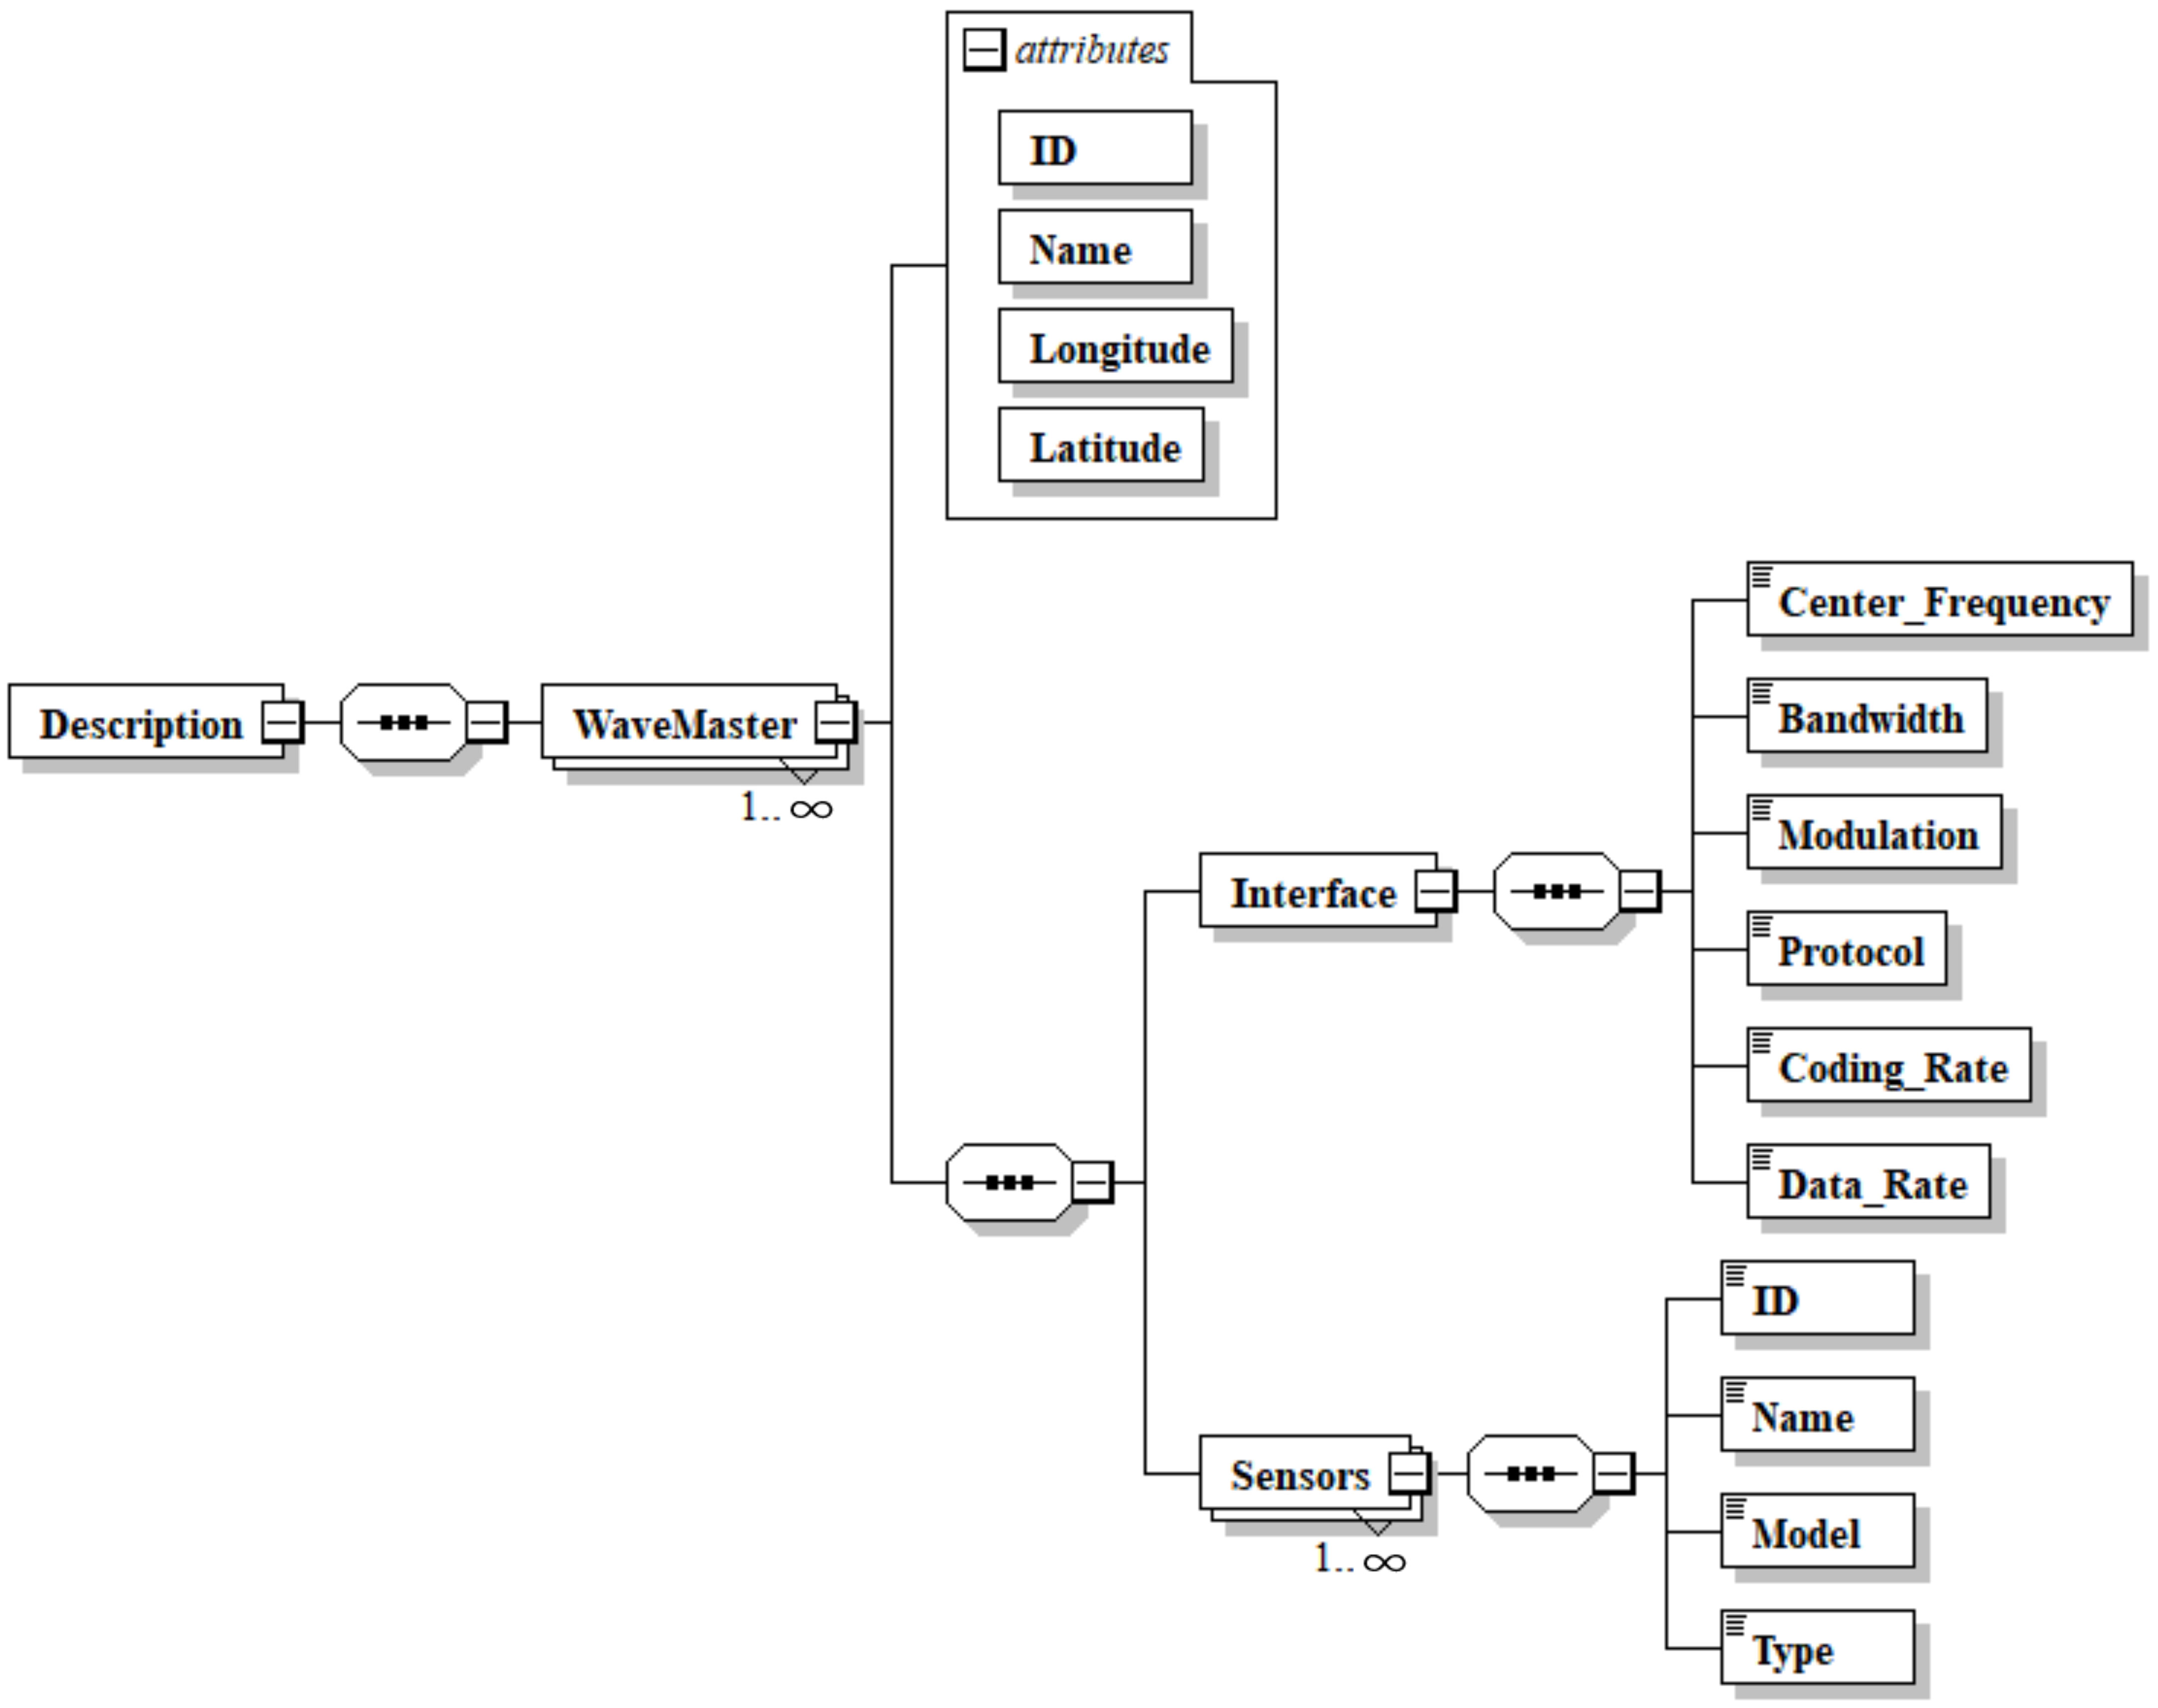
Figure 4 The format of description file for acquisition model.
In instances requiring updates or modifications to a specific OOI, the system’s design facilitates a straightforward solution through the following steps: 1) update the corresponding description file, 2) reload the acquisition module, 3) verify the changes. A revision to the corresponding description file within the acquisition layer seamlessly incorporates these adjustments and updates, obviating the need for extensive manual coding. This approach minimizes system downtime and simplifies maintenance efforts.
Furthermore, the existence of the acquisition layer enables a clear separation of logic between the application layer and the sensing layer. This segregation enhances modularity and system scalability, empowering the OPO-CVI model to effortlessly adapt to evolving oceanic monitoring requirements and seamlessly integrate new OOIs.
In essence, the Acquisition Layer within the OPO-CVI model redefines data collection from a spectrum of OOIs. Its intelligence, adaptability, and efficiency simplify development and ensure seamless data flow, rendering the OPO-CVI model a robust and adaptive solution for oceanic observation in a dynamically changing marine environment.
The management layer is designed to handle the data that is collected and buffered by the acquisition layer. It serves multiple functions, including data processing, analysis, and storage.
In mathematical terms, the data flow within the management layer can be represented as a function M, which takes as input the buffered data B from the acquisition layer and outputs a structured dataset S. The function M can be decomposed into sub-functions {m1,m2,…,mn}, each responsible for a specific operation such as data cleaning, transformation, or analytics.
The data module is a primary component of this layer. It establishes a direct connection with the acquisition layer to retrieve data. The module then applies a set of predefined algorithms and rules for data transformation and storage. The transformed data is stored in a database, making it accessible for further operations. Mathematically, the data module can be represented as D = (DB, Algo, Rules), where DB is the database, Algo denotes the algorithms used for data transformation, and Rules are the conditions applied during this process.
The calculation module is another essential component, aimed at data analysis. It employs various mathematical models and machine learning algorithms to derive logical parameters from the processed data. In mathematical terms, the calculation module can be represented as C = (LP,MM,ML), where LP stands for logical parameters, MM for mathematical models, and ML for machine learning algorithms.
The interface management module acts as the intermediary between the management layer and the application layer. It provides standardized data interfaces, such as Web Service, MQ, and FTP, to facilitate data sharing and system integration. By performing these functions, the Management Layer ensures that the data flows in a structured manner from the acquisition layer to the application layer, while also making it accessible for further analysis and interpretation.
The application layer serves as the user interface of the OPO-CVI model, offering a range of tools for data visualization, analysis, and interpretation. This layer is essential for transforming raw and processed data into actionable insights useful for scientific research and decision-making in oceanography. In mathematical terms, the application layer can be represented as a function A, which takes the structured dataset S from the management layer as input and produces a set of visualizations V and analytical results R. The function A can be decomposed into sub-functions {a1,a2,…,an}, each responsible for specific tasks such as data rendering, statistical analysis, or report generation.
The graphical user interface (GUI) is a significant component of the application layer. It is designed to display various types of oceanic data on a unified panel. The GUI dynamically initializes observing platforms, parameters, and curve window information by reading OPO-CVI description files. This adaptability allows the system to cater to a wide range of oceanic monitoring needs. In mathematical terms, the GUI can be represented as GUI = (P,V,C), where P denotes the panel layout, V represents the visual elements, and C stands for the control elements like buttons and sliders.
Another key feature of the application layer is its data analytics module. This module employs a variety of statistical methods and machine learning algorithms to analyze the data. It can generate summary statistics, trend analyses, and predictive models, offering valuable insights into oceanic conditions. In mathematical terms, the analytics module can be represented as AM = (SM,TA,PM), where SM stands for summary statistics, TA for trend analyses, and PM for predictive models.
By offering these functionalities, the application layer ensures that the OPO-CVI model is not just a data collection tool but a comprehensive system for advanced oceanographic research and monitoring.
A well-thought-out data structure not only ensures efficient storage and retrieval of oceanographic data but also facilitates data interoperability and integration across different components of the system (Snowden et al., 2019). ISO 21851 categorizes data structure standardization into two main classes: attribute description and observation elements.
The attribute descriptions part of ISO 21851 focuses on describing attributes related to OPO-CVI, equipment, and parameters. For each attribute, the description includes its name, type, properties, and remarks. This comprehensive approach ensures that critical details about attributes are consistently documented, promoting clarity and consistency in data representation. In this paper, we introduce an Object Description Model (ODM) that abstracts the descriptive data of various objects within ocean observation systems, aligning with the ISO 21851 specification. The ODM conceptualizes object description data as a collection of descriptive elements, with a defined structure for describing object information (Item ID, Item Name, Item Description) and summarize relationship between elements in different type. Let E be the set of all elements in the ODM. Each element e ∈ E can be represented as a tuple by Equation (8):
Each element can be further detailed through sub-elements. The schema for descriptive elements is illustrated in Figure 5, with each element identified by its unique ItemID attribute. As shown in Figure 5, “OPO-CVI” element represents the ocean profile observation system designed within our study, which is characterized by attributes such as ID, name, developer, date, and version, which collectively define their unique profiles. The element “Platform” refers to the Wave Master observation platforms. In practice, there is no limit to the number of these platforms, and each is uniquely identified using attributes such as ID, name, datetime, longitude, and latitude. Additionally, each platform may house multiple sensing devices, such as CTD, pH meters, dissolved oxygen sensors, and more. These sensors are described within the “Instrument” element, where attributes like ID, name, model, and type are employed to delineate their characteristics. Furthermore, each sensor may collect various parameters. For instance, a CTD sensor may simultaneously measure conductivity, temperature, and depth. These individual parameters are elaborated upon within the “Parameter” element, where attributes like ID, name, unit, and precision provide detailed descriptions. Correspondingly, we utilize tables in the relational database to record these attribute descriptions and maintain their hierarchical relationships through foreign keys, as shown in the lower half of Figure 5.
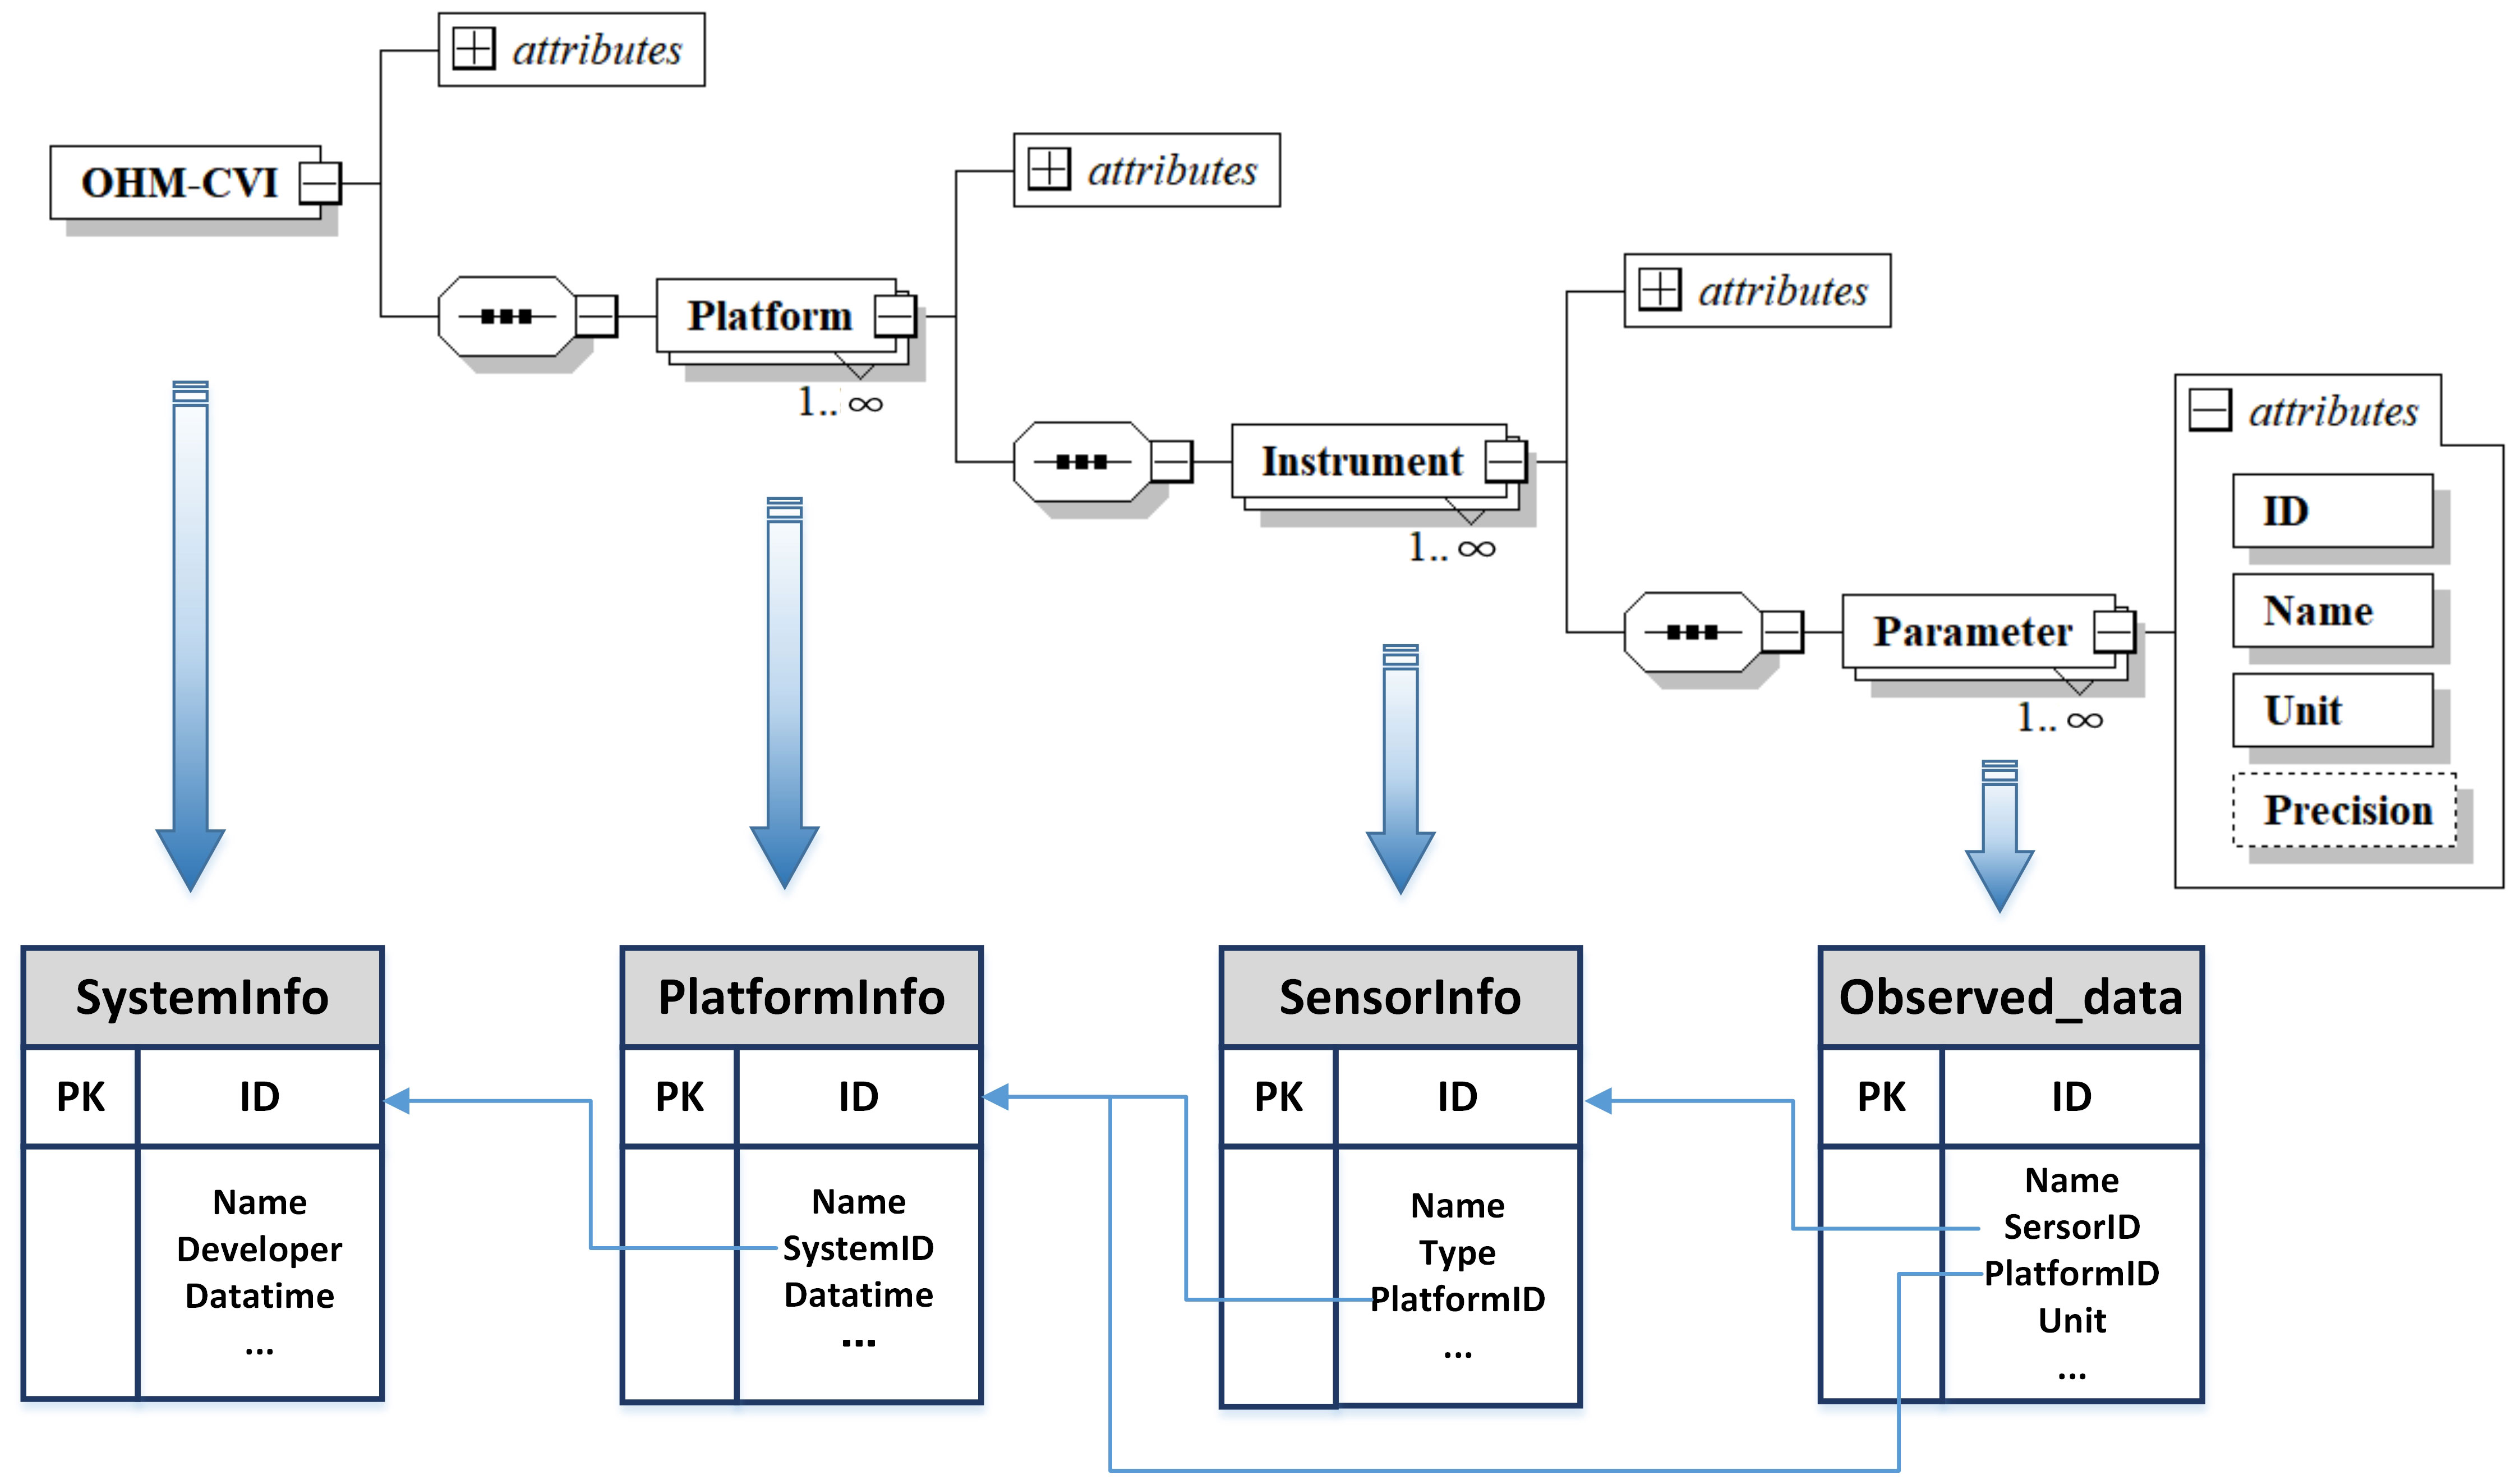
Figure 5 Attribute description in designed OPO-CVI Model. OPO-CVI nodes represent the oceanographic observation systems designed within our study. Platform nodes represent the Wave Masters in observation network. Instrument nodes represent the sensor package equipped on Wave Masters, such as CTD, pH Sensor, and fluorometers. Parameter nodes represent the parameters measured by the sensor, such as conductivity, temperature, and depth parameters collected by the CTD sensor.
The observation elements section aims to elaborate on the specific elements that are crucial for capturing the observational data within the OPO-CVI framework. These elements are designed to encapsulate the raw data collected by various sensors and instruments, as well as the processed and analyzed information that is derived from them. This section is aligned with the ISO 21851 standard, which categorizes observation elements into two main types: oceanic hydrological data and oceanic meteorological data. The oceanic hydrological data is collected through sensors mounted on vehicles submerged under the Wave Master platforms, while the oceanic meteorological data is gathered via sensors mounted on buoys located on the surface of the Wave Master platforms.
According to the ISO 21851 standard, in our designed OPO-CVI, oceanic hydrological data includes elements like water temperature, salinity, and current speed. Besides, our designed OPO-CVI also covers oceanic meteorological data, focusing on elements like wind speed, wind direction, air temperature, relative humidity, and precipitation. Table 1 provides a detailed description of these elements.
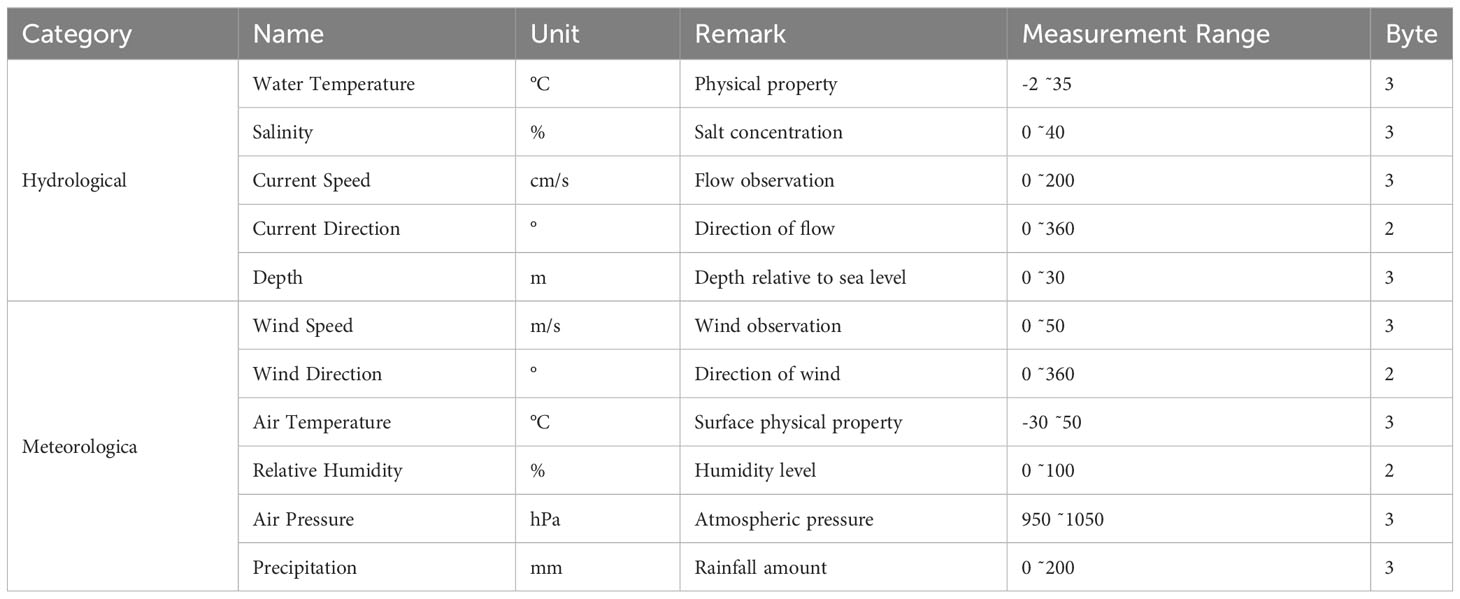
Table 1 Oceanic hydrological and meteorological observation elements.
In the Object Description Model (ODM), let O be the set of all observation elements. Each observation element o ∈ O can be represented as a tuple by Equation (9):
where D is the data type, S is the source (which sensor or instrument), V is the value of the observation, Q is the quality indicator, and T is the timestamp. Data Type (D) specifies the kind of data being observed, such as temperature, salinity, or pH level. This aligns with the “Parameter” element in the attribute description, providing a link between the two. Source (S) identifies the specific sensor or instrument responsible for the observation. This is crucial for data traceability and aligns with the “Instrument” element in the attribute description. Value (V) captures the actual observed value. Depending on the data type, this could be a single numerical value, a text string, or even a more complex data structure. Quality Indicator (Q) provides a measure of the data quality, which could be a simple flag indicating if the data is ‘good’ or ‘bad’, or a more complex metric that provides a quality score. Timestamp (T) records the exact time the observation was made, essential for time-series analysis and for synchronizing data from multiple sources.
In our oceanographic profile observation application, our primary focus is typically on the vertical profiles of specific geographical locations. We employ Wave Master profiling instruments to collect time-series oceanographic metrics at these locations, serving as descriptions of our observed positions. Consequently, in the design of our database, we store all observation data in units of Wave Masters, with each row in the ‘Observation Data’ table representing all oceanographic observation parameters collected by a specific Wave Master device within a given time frame, as shown in Figure 6. In this context, the ‘ID’ field represents the unique identifier of the Wave Master device, which is mapped to the corresponding ID in the ‘PlatformInfo’ table. The ‘Datatime’ field denotes the timestamp of data collection, encompassing all oceanographic observation parameter values collected by the Wave Master device at a particular timestamp. These parameter values are separated by the ‘@’ symbol to facilitate subsequent data parsing and processing. ‘RelevantID’ reflects the order of different parameters within the ‘data” field.
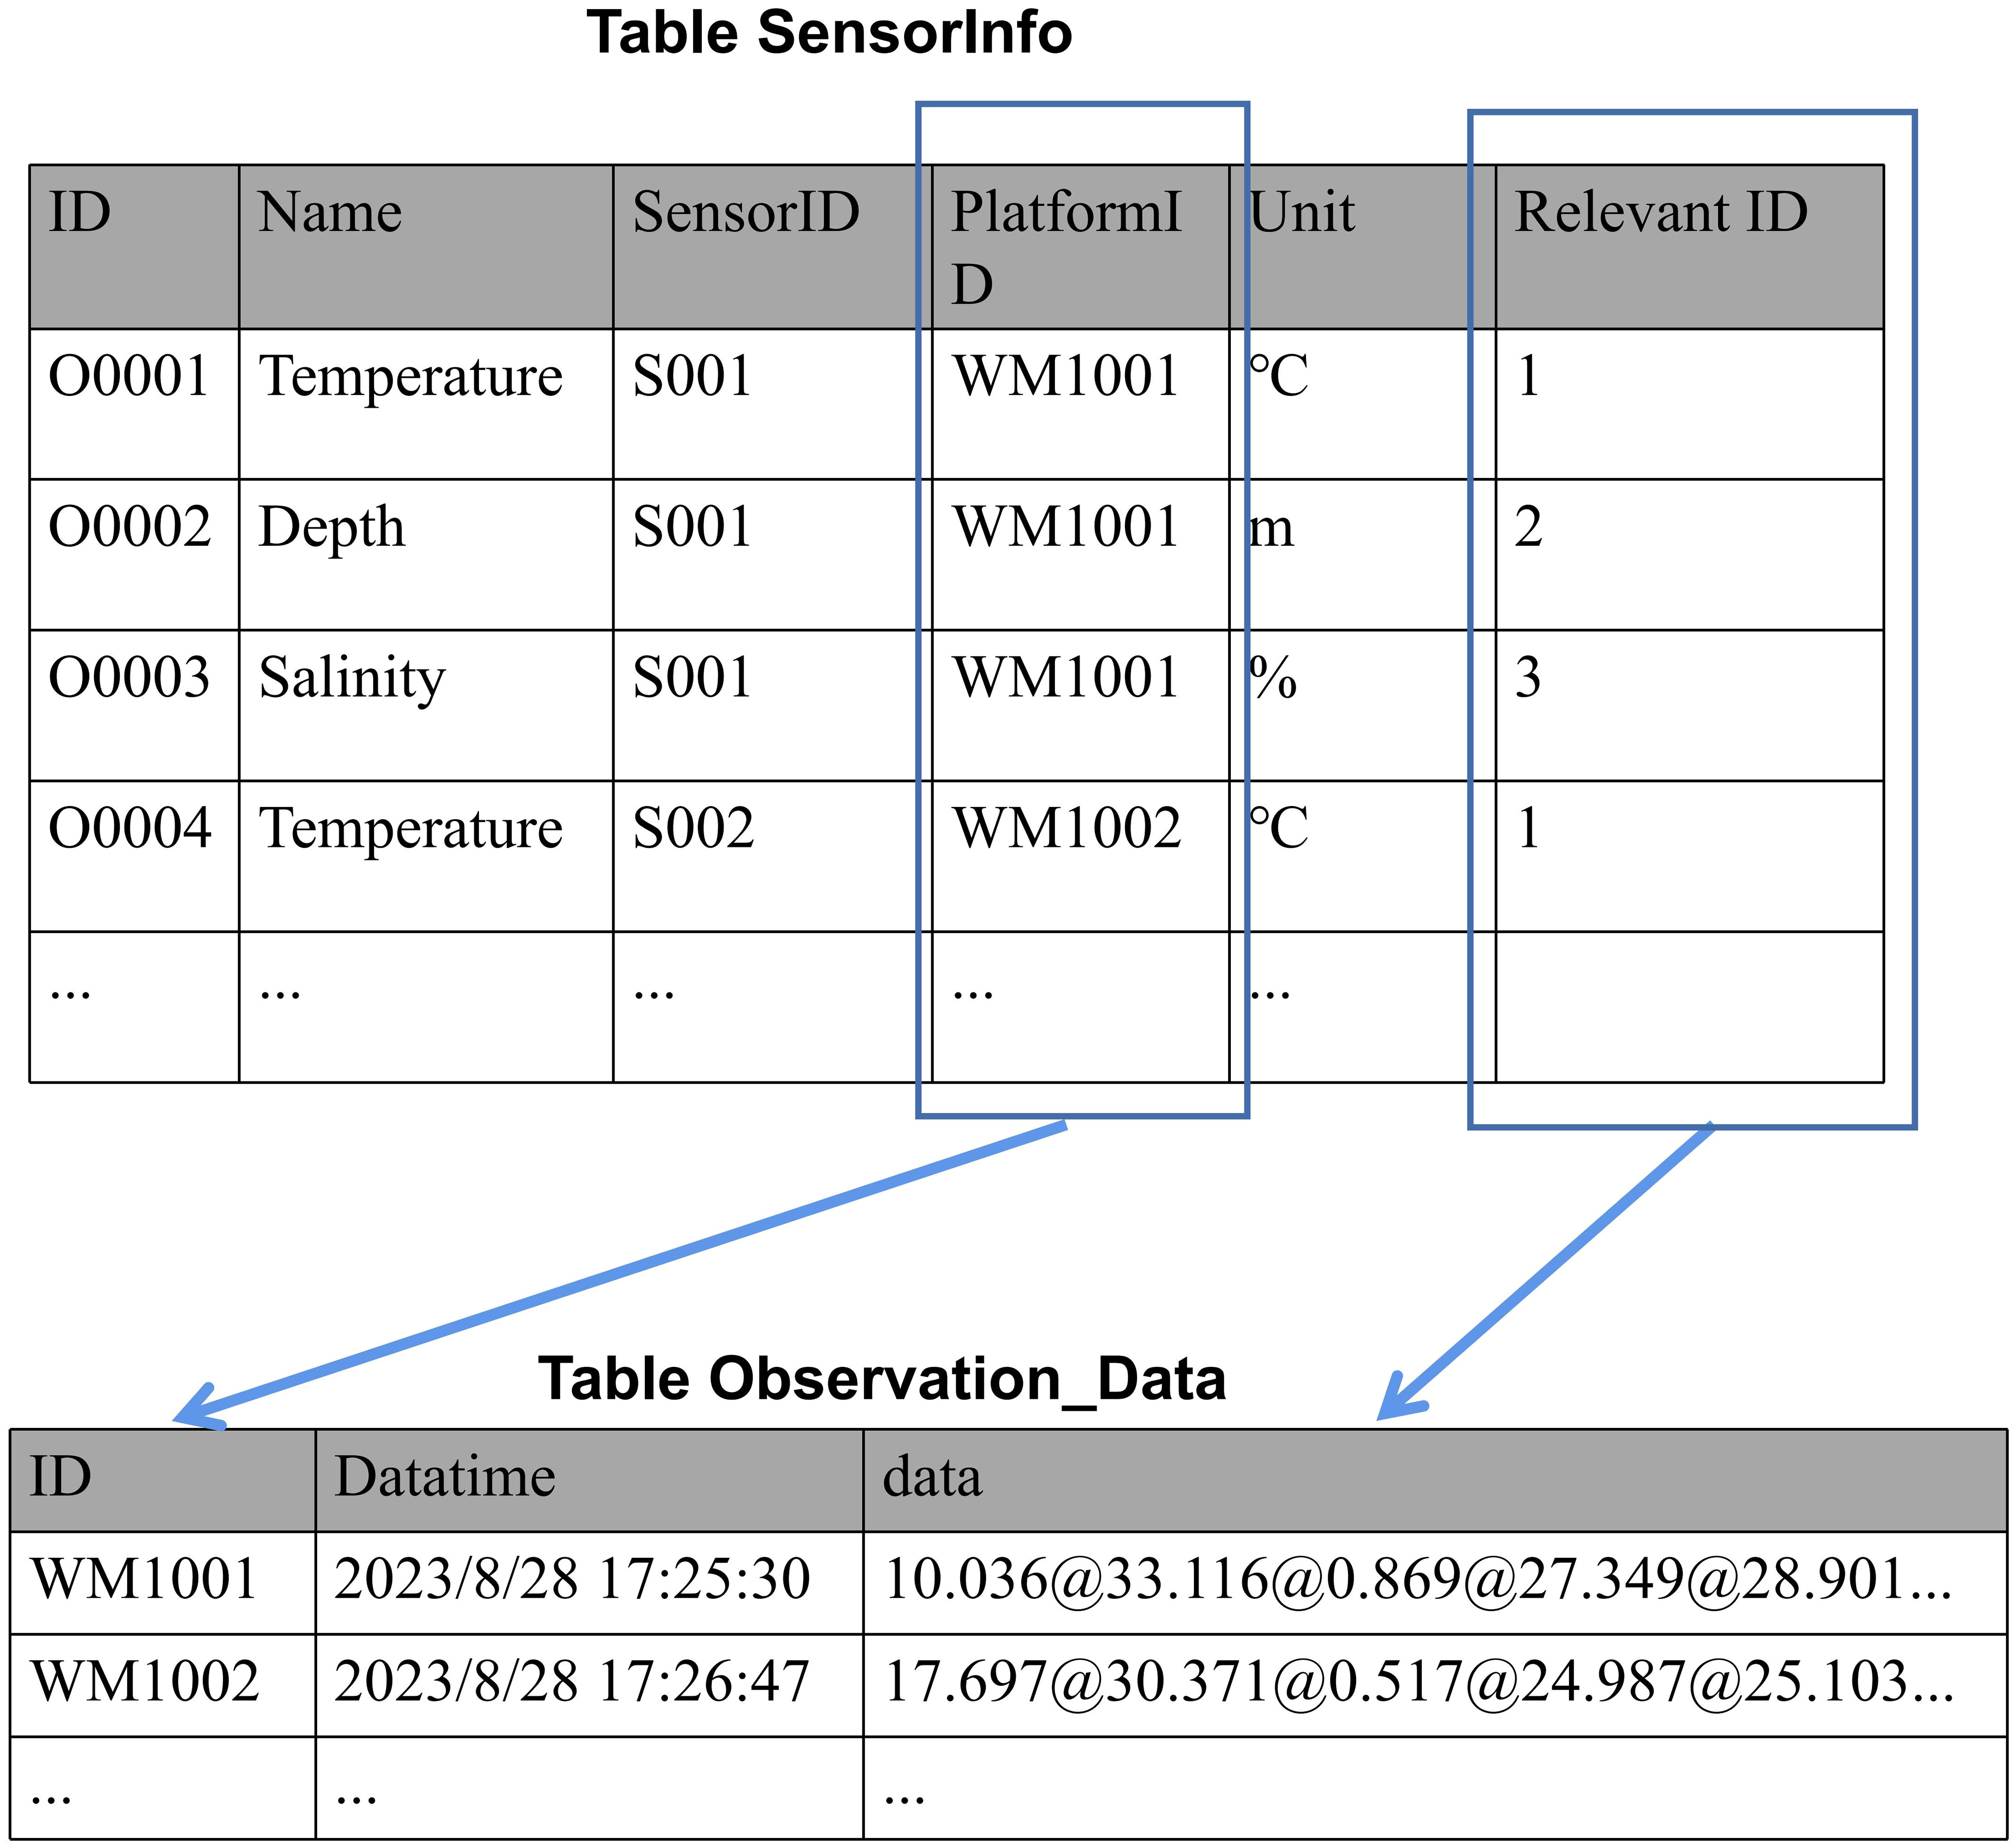
Figure 6 The mapping between table SensorInfo and table Observation Data.
Considering that oceanographic observations are typically long-term and high-frequency processes, the data volume in the ‘Observation Data’ table increases over time, which may lead to slower data retrieval processes. To address this issue, we have implemented sharding technology. We partition the data tables based on the time dimension, creating sub-tables that represent specific time ranges, such as monthly or quarterly intervals. This approach ensures that each sub-table contains a relatively smaller data volume, enhancing data retrieval speed for most queries.
To accommodate varying data growth rates, we employ a dynamic sharding strategy. This means that we can automatically adjust the time range of sub-tables based on actual data volumes and requirements. For instance, if data within a certain time period experiences rapid growth, the system can automatically create more frequent sub-tables to maintain manageable sizes for each sub-table.
To expedite queries, we have established appropriate indices on each sub-table. These indices assist the database system in quickly locating and retrieving the required data (Nathan et al., 2020). We utilize academically robust indexing algorithms to optimize query performance (Elmasri et al., 2015). Initially, we employ single-column indices to index numerical values in a specific column, facilitating the rapid location of specific values. For example, for sub-tables containing timestamps, we create timestamp indices to enhance the efficiency of data queries based on time ranges. Additionally, we employ multi-column indices to combine values from multiple columns for indexing, supporting complex multi-condition queries. This indexing strategy significantly reduces the need for database system scans, thereby improving query response times. Furthermore, we employ full-text indices to address text-based data search requirements, enabling keyword searches and text matching within the oceanographic observation data.
To manage historical data effectively, we have implemented data migration and cleaning strategies, both of which are pivotal for the long-term sustainability and efficiency of ocean observation systems (Li et al., 2017). Firstly, our data archiving strategy is predicated on a tiered storage architecture (You et al., 2005). Utilizing automated scripts, data that surpasses a predetermined age threshold—typically 90 days—is seamlessly migrated from high-performance storage arrays to cold storage solutions (Memishi et al., 2019). This archival process is not merely a data offloading exercise but a calculated maneuver to optimize database performance. It significantly reduces the I/O operations on the primary storage, thereby expediting query execution. The strategy adheres to regulatory requirements for long-term data retention, with features such as end-to-end encryption and ISO 27001-compliant storage solutions.
For data cleaning, we employ a structured workflow that leverages the extended isolation forest (Laskar et al., 2021). This approach enhances the traditional Isolation Forest algorithm by initially partitioning the data into k clusters using K-means. For each cluster, an Isolation Forest is trained, and anomaly scores are calculated based on the average path length in the isolation trees. Mathematically, the anomaly score s(x,n) for a data point x in a forest of n trees is given by Equation (10):
where E(h(x)) is the average path length of x in the forest, and c(n) is the average path length for unsuccessful search in a binary search tree. This hybrid approach is particularly effective for high dimensional and large-scale data, as it allows for more localized anomaly detection. Data points flagged as anomalies are then subjected to manual review for validation before removal. Additionally, deduplication algorithms are run to identify and remove duplicate entries. These cleaning operations are strategically scheduled to run during off-peak hours to minimize any impact on system performance.
Standardized service interfaces are pivotal for interconnecting various ocean observation systems. They ensure that systems from different vendors or organizations can interoperate without compatibility issues, thereby reducing the need for custom integration efforts (Lindstrom et al., 2012; Buck et al., 2019). In accordance with ISO 21851 specifications, we categorize these interfaces based on their functionality into three types: data input interfaces, data output interfaces, and data interaction interfaces. Following the principles of RESTful WebService design with a foundation in the HTTP protocol, our interface design is developed and deployed on a Tomcat server for external access. In the process of WebService development, we employ Javax.ws.rs.jar to realize RESTful-style interfaces, utilizing JSON strings as the data transmission format. In the subsequent sections, we will provide a detailed exposition of our interface design.
Data input interfaces serve as the data entry points for the software system and are responsible for receiving data from various instrument devices and observation platforms. This data mainly includes the status of instrument devices, observational data, and platform equipment parameters. Data input interfaces are a critical component of the software architecture, serving as the primary data entry points for the entire system. These interfaces are designed to be highly modular and extensible, facilitating seamless integration with a variety of instrument devices and observation platforms. The primary objective is to ensure the accurate and timely reception of data, which is then pre-processed and stored for subsequent analysis and utilization. The input interfaces can be categorized into three types based on the data received through these interfaces: putSourceStatus, putSourceData, and putSourceParameter. The specific related parameters are detailed in Table 2.

Table 2 Description of data input interfaces.
The putSourceStatus interface is responsible for ingesting comprehensive status information from instrument devices. Given the inherent complexities of underwater environments, the Wave Master and its onboard sensors may face operational challenges such as mechanical failures or loss of connectivity. Therefore, the putSourceStatus interface is designed to ingest a range of status metrics from the devices. It accepts a status value of 1 when the Wave Master or other instrument devices are operational, and 0 when they are not. Additionally, it captures other critical metrics such as error states that may influence data collection. This comprehensive status information is vital for maintaining the system’s operational integrity and directly impacts the accuracy and availability of the data collected.
The putSourceData interface is responsible for receiving observational data generated by instrument devices, including the Wave Master. Given that the Wave Master is designed to operate in complex marine environments, the data it generates is particularly sensitive to various factors such as water currents, temperature, and salinity. The putSourceData interface standardizes this raw data upon receipt, ensuring that it conforms to the data models defined within the OPO-CVI. Once standardized, the data is stored in the system’s database, making it ready for further analysis and interpretation.
The putSourceParameter interface is designed to collect essential metadata about newly connected observation platforms and instrument devices, including the Wave Master. This metadata includes but is not limited to, model numbers, production dates, and calibration coefficients. The putSourceParameter interface validates this metadata against predefined schemas to ensure its reliability. This is particularly important for the Wave Master, as the metadata can include specific calibration parameters that are crucial for the accurate interpretation and analysis of the observational data it generates.
Output interfaces serve as the data exit points for the software system and are responsible for delivering standardized observational data and equipment status information to external systems or databases. These interfaces are a critical component of the software architecture, serving as the primary data exit points for the entire system. They are designed to be highly modular and extensible, facilitating seamless integration with a variety of external systems and databases. The primary objective is to ensure the accurate and timely delivery of data, which can then be used for subsequent analysis and utilization. The output interfaces can be categorized into two types based on the data delivered through these interfaces: getData and getEquipmentStatus. The specific related parameters are detailed in Table 3.
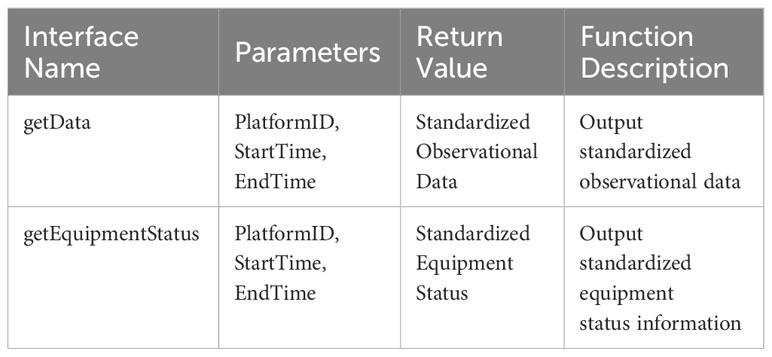
Table 3 Description of data output interfaces.
The getData interface is responsible for outputting standardized observational data, which includes data generated by the Wave Master. The interface accepts parameters such as the observation platform ID, start time, and end time for the data collection period. Upon invocation, the interface fetches the relevant data from the database, standardizes it according to predefined schemas, and then outputs it for further analysis or for serving as input to another OPO-CVI instance.
The getEquipmentStatus interface outputs standardized equipment status information, including the status of the Wave Master. It accepts similar parameters to the getData interface and returns the operational status of the equipment. This status information is crucial for monitoring the health of the Wave Master and other observation platforms, ensuring that the data collected is both accurate and reliable.
Data interaction interfaces are provided by the Database Management Module to facilitate data exchange with the database. These interfaces mainly deal with the addition and querying of data related to instrument devices, observation platforms, elements, and user information. The interfaces are designed to be highly modular and extensible, ensuring seamless integration with various data sources and types. The primary objective is to ensure accurate and timely data exchange, which is crucial for the system’s overall functionality and reliability (Lindstrom et al., 2012). The interaction interfaces can be categorized based on their functionalities as detailed in Table 4.
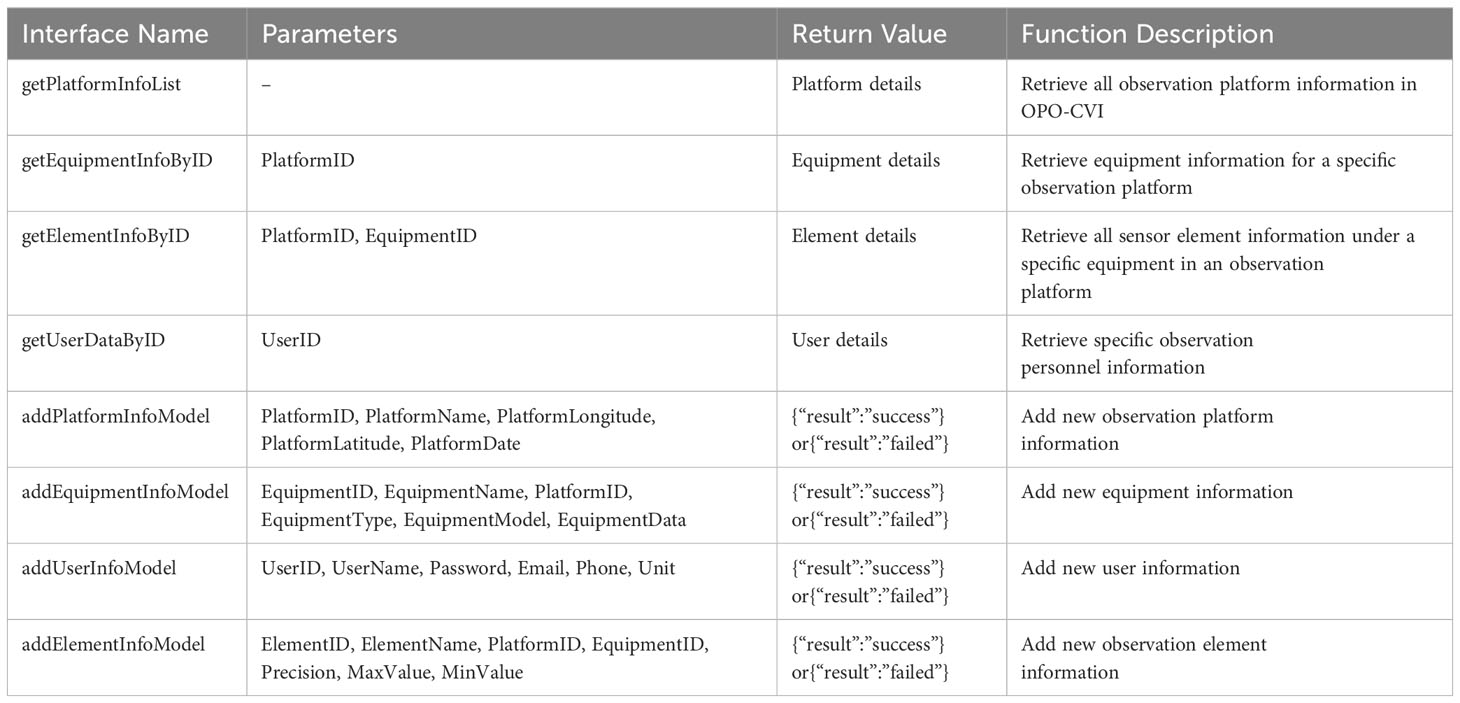
Table 4 Description of data interaction interfaces.
The getPlatformInfoList interface retrieves comprehensive information about all observation platforms within the OPO-CVI, including their names, IDs, and geographical coordinates. The getEquipmentInfoByID interface is designed to fetch detailed information about all instrument devices associated with a specific observation platform, identified by its PlatformID. The getElementInfoByID interface aims to collect detailed information about all sensor elements under a specific instrument device in an observation platform. This includes the element’s name, ID, accuracy, maximum and minimum values, among other metrics. The getUserDataByID interface retrieves detailed information about a specific observation personnel, including their name, email, contact number, user permissions, approval status, registration time, and approver. The addPlatformInfoModel, addEquipmentInfoModel, addUserInfoModel, and addElementInfoModel interfaces are responsible for adding new information to the database. They validate the input against predefined schemas to ensure its reliability before committing it to the database.
The OPO-CVI system is developed within a Browser/Server (B/S) architecture that employs a separation of concerns between the front-end and back-end functionalities. The front-end is developed using HTML, CSS, and JavaScript, which facilitate the structuring, styling, and interactivity of the system’s user interface. For the back-end, the system utilizes the Spring Boot framework, chosen for its ability to create stand-alone, production-grade applications based on the Java platform. Java is the primary language used for back-end service development, providing the necessary functionality to manage the system’s operations. Data storage and management are handled by a MySQL database. The connection between the application and the database is established through MyBatis, a persistence framework that aids in the mapping of objects to database operations, using SQL. We verified the functionality and scalability of the developed OPO-CVI system in the following sections.
The most important functional modules for an ocean observation system should include functions such as data display, comprehensive query, and computational analysis (Jiang et al., 2013; Hu et al., 2014). ISO 21851 also provides specifications for the functional modules of the OPO-CVI system, categorizing them into data display, comprehensive query, and computational analysis. The standard also elaborates on the essential functionalities that each component should encompass. These modules are pivotal for the effective collection, analysis, and visualization of oceanographic data. The data display module allows for interactive visualization, offering features like maps and time-series plots to represent spatial and temporal variations (Hu et al., 2014). The comprehensive query module supports advanced search functionalities, enabling users to filter data based on various parameters such as time, location, and depth. The computational analysis module includes a range of algorithms for advanced data processing, including statistical analysis and modeling. These modules collectively offer a comprehensive platform for oceanographic research, enabling better understanding of ocean processes and climate change impacts. In the following sections, we will conduct functional verification for each of these components.
The curve display module is designed to visualize the temporal trends of multiple oceanographic variables. Curves are generated by connecting observational data points at adjacent time units, providing insights into the variations of these variables over a specific time frame. This visual representation allows users to gain an intuitive understanding of the collected oceanographic data. As illustrated in Figure 7A, the user interface of the curve display module in the OPO-CVI system comprises three main components: a navigation bar, observation parameters, and a curve window. The navigation bar on the right displays all the Wave Masters in the OPO-CVI system along with their operational statuses. On the left, the observation parameters section shows the variables currently being monitored by the selected Wave Master. By selecting the variables to be visualized, the central curve window dynamically generates an equal number of coordinate systems to display the chosen parameters.
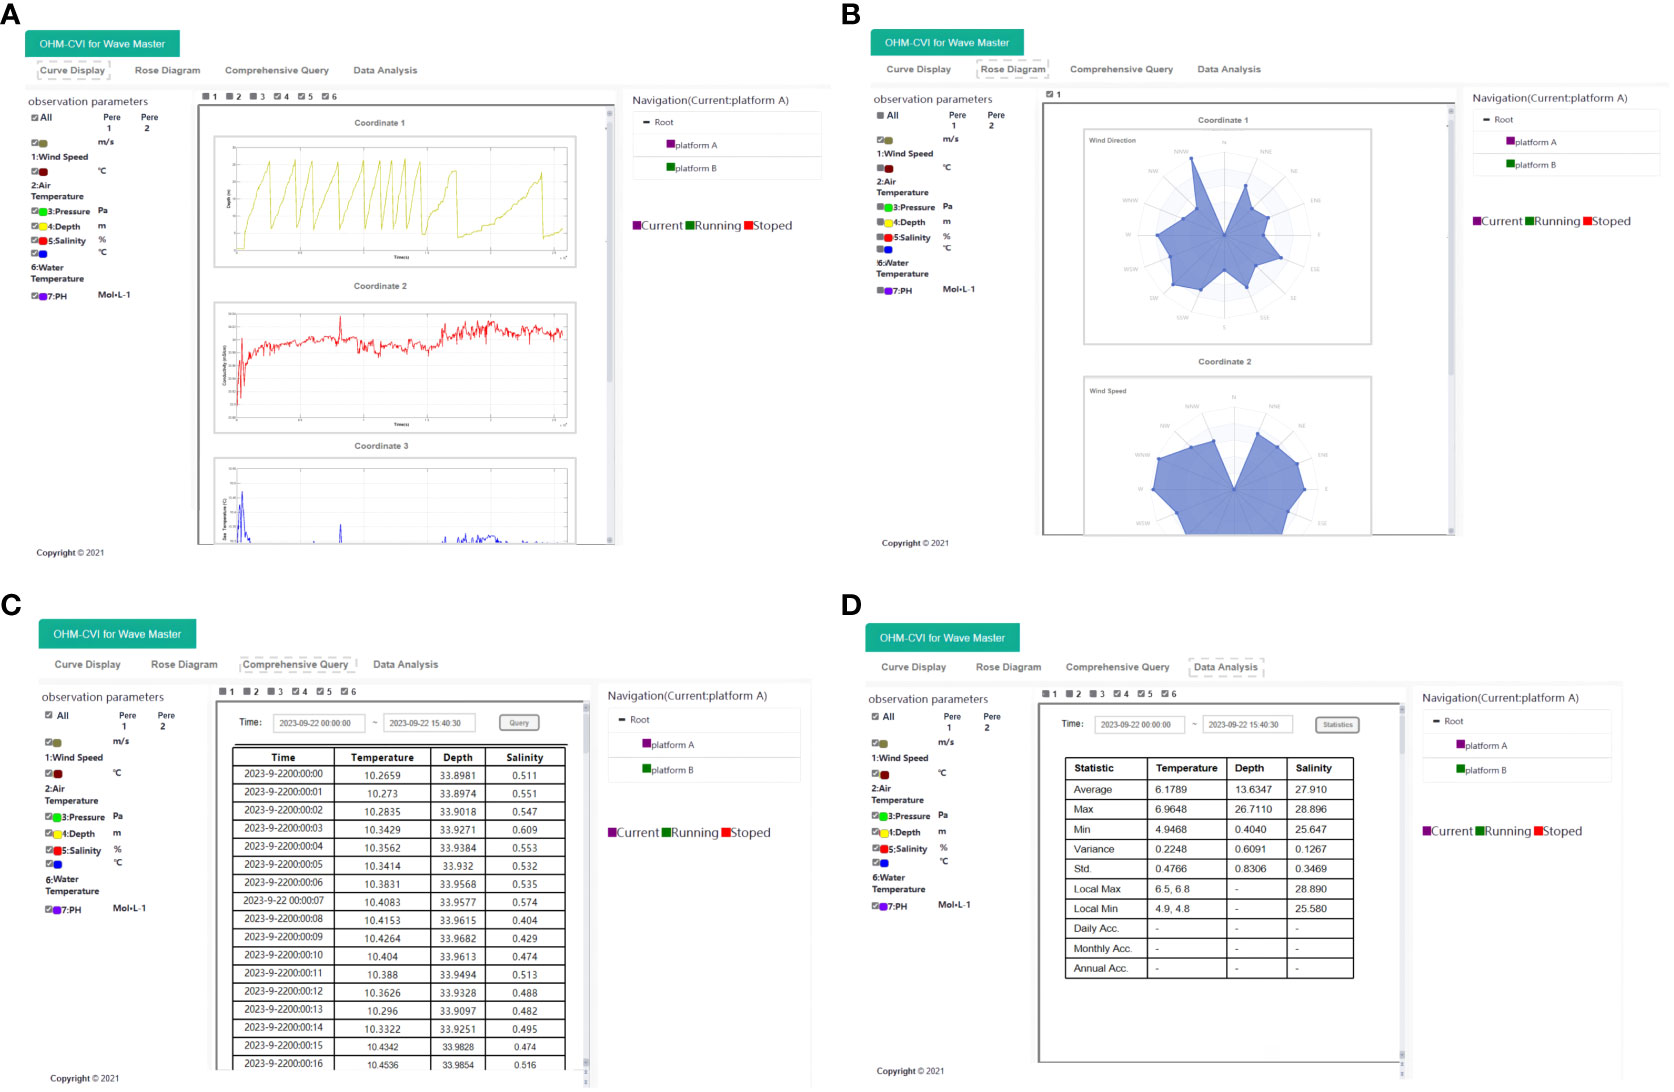
Figure 7 User interface of functional components in OPO-CVI. (A) Curve display component. (B) Rose Diagram component. (C) comprehensive query component. (D) data analysis component.
In addition, the OPO-CVI system also incorporates a rose Diagram component, which facilitates the analysis of interrelated information among wind speed, wind direction, frequency, as well as current speed, current direction, and frequency. As depicted in Figure 7B, users can specify the time range and elements for which the rose diagram can be generated. Upon querying, the interface produces a 16-compass Rose Diagram that displays the respective speeds and frequencies for each of the 16 cardinal directions. Two types of elements can be selected: wind speed and current speed. Choosing ‘wind speed’ generates a wind rose diagram, illustrating the relationships among wind speed, wind direction, and frequency. Conversely, selecting ‘current speed’ produces a Current Rose Diagram, which portrays the interrelationships among current speed, current direction, and frequency.
In the OPO-CVI model, the comprehensive query component is categorized into two types: real-time data query and historical data query. The real-time data query displays current readings of all observational parameters from the selected observation platform and automatically refreshes the data at predetermined intervals. On the other hand, the historical data query presents data in a tabular format, generated based on the selected observation platform, time range, and data type. As depicted in Figure 7C, the interface allows users to specify the start and end times for observation, as well as the type of elements to be queried. Upon querying, a data list is generated, where each entry is annotated with the time of observation, the observational parameters, and their respective units. Users can easily navigate through the data by scrolling up and down.
The primary function of the data analysis module is to compute statistical metrics, including mean, variance, standard deviation, maximum value, minimum value, local maxima, local minima, as well as daily, monthly, and yearly accumulations for the selected observation platform, time range, and data type. Additionally, the module allows for the setting of threshold values and provides alert notifications when the data exceeds or falls below these thresholds. This aids users in gaining a comprehensive understanding of oceanographic and meteorological data. As illustrated in Figure 7D, the data analysis interface allows users to specify the start and end times for observation and the elements to be analyzed. Upon querying, a data analysis list is generated, where each row represents a specific statistical metric, while each column represents a different observational parameter.
In order to validate the interoperability between OPO-CVI models, two distinct models were developed, referred to as O1 and O2. O1 consists of five Wave Master platforms, each equipped with various sensors such as CTD and anemometers. On the other hand, the O2 system comprises four Wave Master platforms, each outfitted with an Acoustic Doppler Current Profiler (ADCP), which measures water current velocities over a depth range, using the Doppler effect of sound waves. This enables the O2 system to collect seven parameters, such as temperature, roll, pitch, and velocity. The specific conditions for O1 and O2 are detailed in Table 5. When O1 attempts to access or manipulate data from O2, it first retrieves configuration description file of O2 to obtain metadata about the number of Wave Master platforms, their descriptions, and sensor configurations in O2. This metadata is then locally loaded into O1, establishing an interlink between the two models. Subsequently, O1 accesses the time-series observational data from O2 by invoking standardized data interfaces. An integrated interoperability interface of O1 and O2 is illustrated in Figure 8.
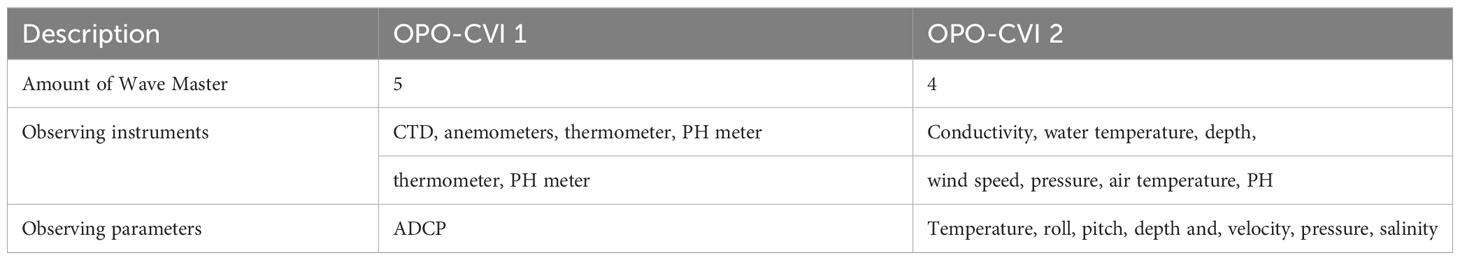
Table 5 Conditions of two integrated OPO-CVI model.
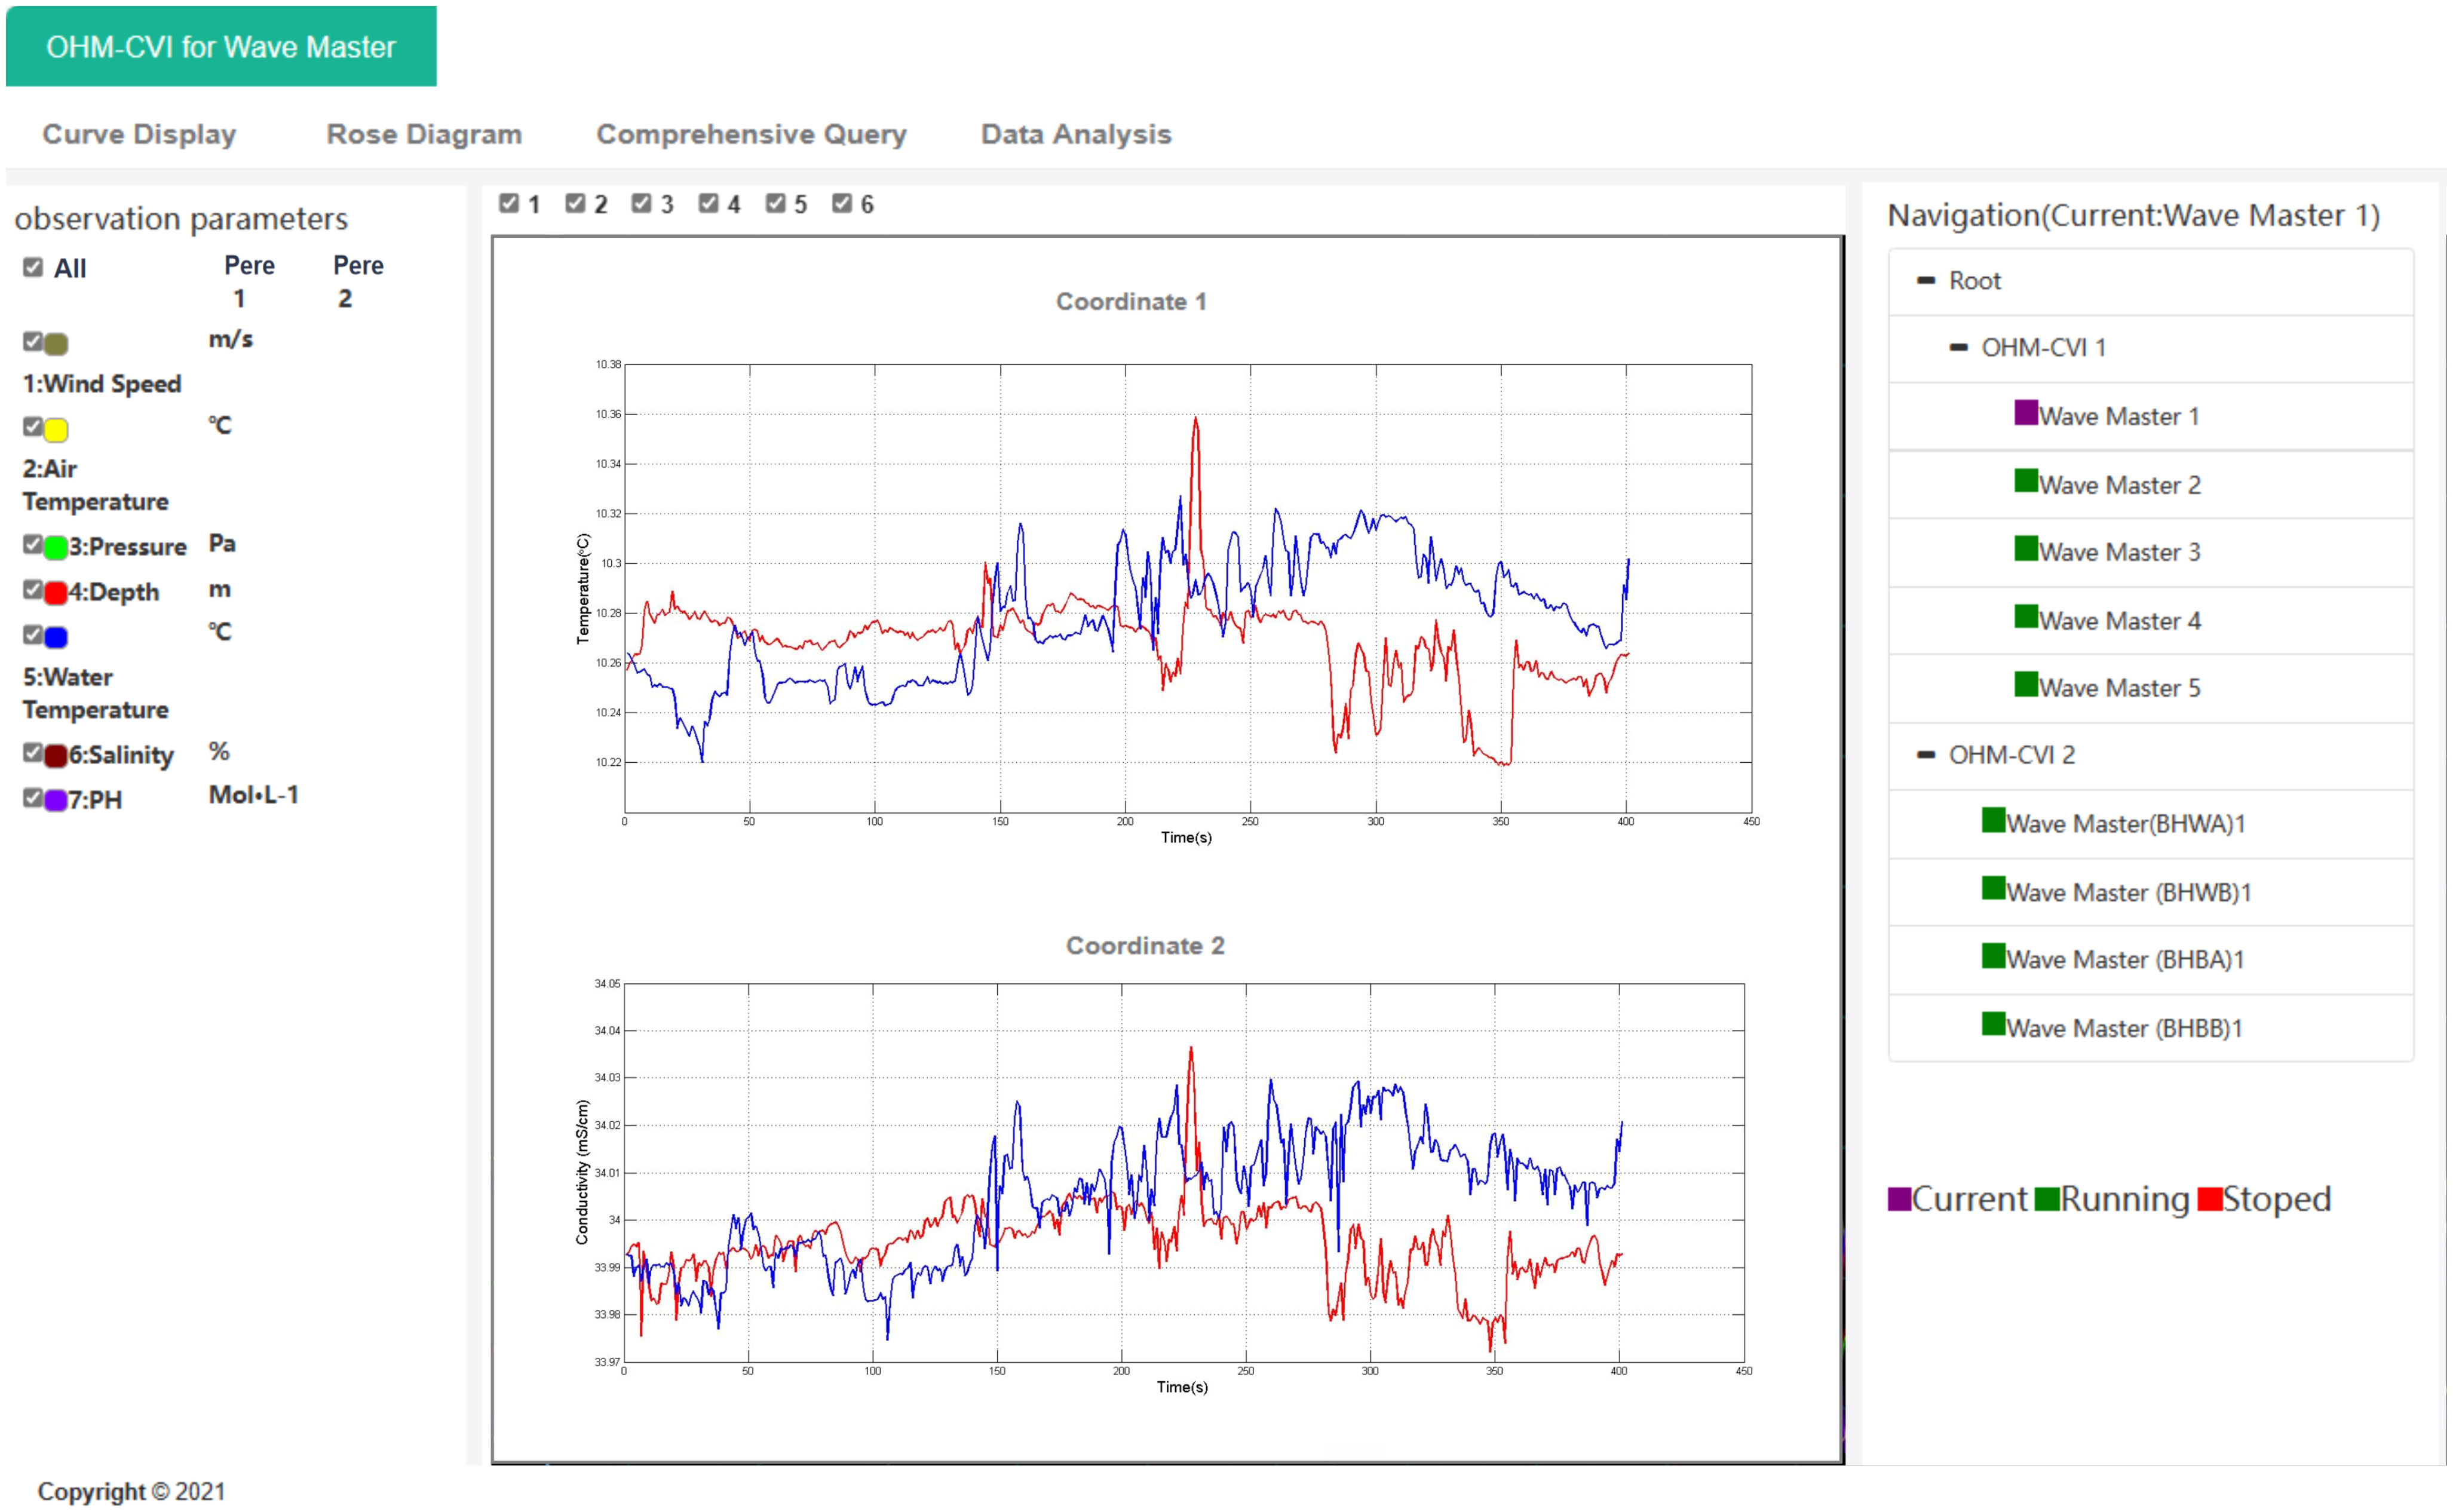
Figure 8 Integrated OPO-CVI interoperability interface. The right-hand navigation panel displays all Wave Masters deployed in both OPO-CVI 1 and OPO-CVI 2, allowing for simultaneous access. The central graph window overlays data of the same type and time period from both OPO-CVIs for comparative analysis.
Additionally, we explored the scalability of the OPO-CVI model. Scalability is crucial as the OPO-CVI is designed to integrate various CVI models. However, as the number of integrated OPO-CVI nodes increases, the efficiency tends to decline. This is primarily due to the increased latency from data request to reception and display, which directly impacts user experience. To evaluate this, we conducted tests to measure the average response delay and throughput for each data request under different numbers of OPO-CVI integrations. A response delay occurs from the time the request is sent to the end of receiving all data. All OPO-CVI models were deployed on computers running Windows, equipped with 3.8 GHz 4-vCPU virtual machines, 32GB RAM, and SSDs as local disks.
Several factors influence data response latency and throughput, including network topology and data size. As such, we investigated the response latency and throughput during data exchange between local area networks (LANs) and wide area networks (WANs) as the number of integrated OPO-CVI models increased from 2 to 10. OPO-CVI models were configured to simultaneously send requests to the standardized input interfaces of other OPO-CVI models. Each request aimed to retrieve 500K of interconnected data. The average time taken from sending the request to receiving all the data was calculated. The experimental results are shown in Figure 9A. The results indicate that as the number of integrated OPO-CVI models increased, the average response time also increased. However, all response times remained under 1 second, which we consider to be acceptable. This demonstrates that OPO-CVI possesses excellent scalability. Furthermore, LANs outperformed WANs in terms of response time, suggesting that a higher-quality network can provide a better user experience for OPO-CVI interoperability.
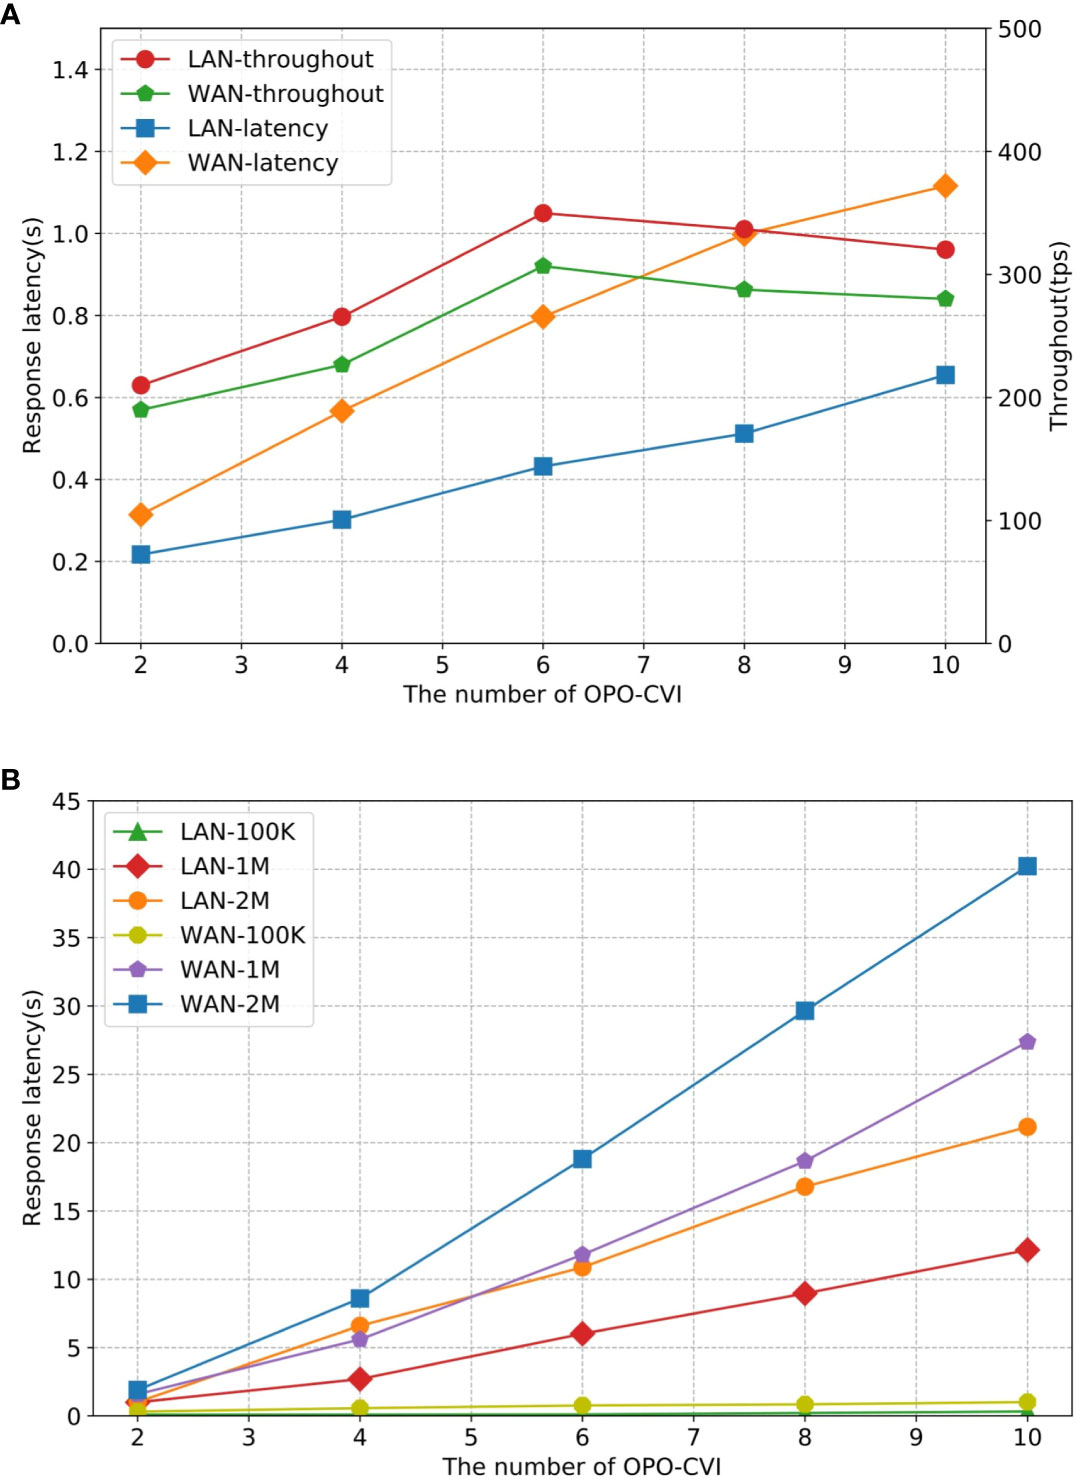
Figure 9 (A) The response latency and throughput in varying number of integrated OPO-CVI nodes through LANs and WANs. (B) Variation of response latency with different numbers of concurrent OPO-CVI and data sizes.
In the interconnection of OPO-CVI models, the size of the requested data is a critical parameter that significantly impacts response latency. To assess the influence of varying data request sizes on response latency, we measured the time taken from the moment a request is sent until all the returned data is received. During this evaluation, we varied the number of integrated OPO-CVI models from 2 to 10. The sizes of the requested data were set at three sizes: 500 kilobytes (500K), 1 megabyte (1M), and 2 megabytes (2M). The experimental results are illustrated in Figure 9B.
This study has introduced the “Wave Master,” a novel wave-powered vertical profiler, and we designed the Ocean Profiling Observation Complex Virtual Instrument (OPO-CVI) for it, developed in accordance with the ISO 21851 standard. The integration of these systems represents a significant advancement in the field of oceanic observation, addressing the critical need for standardized, scalable, and modular approaches to ocean profiling.
In the realm of profiling instruments, existing marine profiling instruments have made significant strides in the collection of oceanographic data. However, these instruments, including seabed bases (Send et al., 2013), shipboard winches (Nash et al., 2017), and McLane profilers (Morrison et al., 2000), are not without their limitations. While approaches relying on mooring chain networks, such as the NorthEast Pacific Time series Undersea Networked Experiments (NEPTUNE-Canada) (El-Sharkawi et al., 2005), offer the advantages of stable energy supply and real-time data transmission, autonomous vertical platforms provide greater flexibility. These platforms are particularly advantageous for studying mesoscale phenomena, researching ocean climate change, and observing internal ocean waves due to their low cost, easy maintenance, and flexible operation (Chai et al., 2020). Originating in the late 20th century, this approach involves attaching sensors to mooring cables, enabling repeated observations of vertical profile parameters through controlled ascent and descent (Eriksen et al., 1982). Among the various types of autonomous vertical platforms, including seabed base (Send et al., 2013) and shipboard winch (Nash et al., 2017; Kock et al., 2023), moored profilers stand out for their lower operational costs, ease of deployment, and retrieval.
In 1998, a collaboration between the Woods Hole Oceanographic Institution and a marine technology company led to the development of the McLane moored profiler (Morrison et al., 2000). This instrument, driven by electric motors, is equipped with temperature, salinity, and depth sensors, as well as acoustic current meters. Observational data is stored within the profiler and retrieved upon system recovery. However, this type of instrument lacks real-time data transmission capabilities. With advancements in technology, the McLane moored profiler has integrated inductive coupling technology with surface buoys, enabling real-time data transmission to surface buoys and subsequent satellite relay to shore stations. Nonetheless, these instruments are still subject to constraints related to underwater energy supply.
In the 1990s, the University of California, Scripps Institution of Oceanography developed the Wirewalker (Rainville and Pinkel, 2001), a wave-powered profiling float. This instrument harnesses wave energy at the sea surface for autonomous vertical profiling, employing an all-mechanical design that requires no electrical power and can operate continuously for extended periods (Pinkel et al., 2011; Omand et al., 2017). The Wirewalker has proven successful in various oceanographic research applications, including the study of internal waves (Wang and Pawlowicz, 2011), ocean-atmosphere interactions (Wijesekera et al., 2016), plankton ecology (Omand et al., 2017), coastal circulation (Feddersen et al., 2016), ocean turbulence (Fan et al., 2018), and coastal water quality assessment. However, despite its achievements, challenges persist, including switch device malfunctions, detachment of switch cams, sensor looseness, and mooring cable abrasion (Cumbee, 2019).
We developed an innovative wave-powered vertical profiler, named “Wave Master”, as the profile data acquisition device in the sensing layer of our ocean profiling observation system. The Wave Master builds upon the existing Wirewalker structure with detailed improvements, addressing issues such as switch device malfunctions and switch cam detachment, addressing issues such as switchgear malfunctions and cam detachment. It offers a more reliable and enduring method for data collection. We present a comparative analysis with existing oceanic profiling methods, as summarized in Table 6.
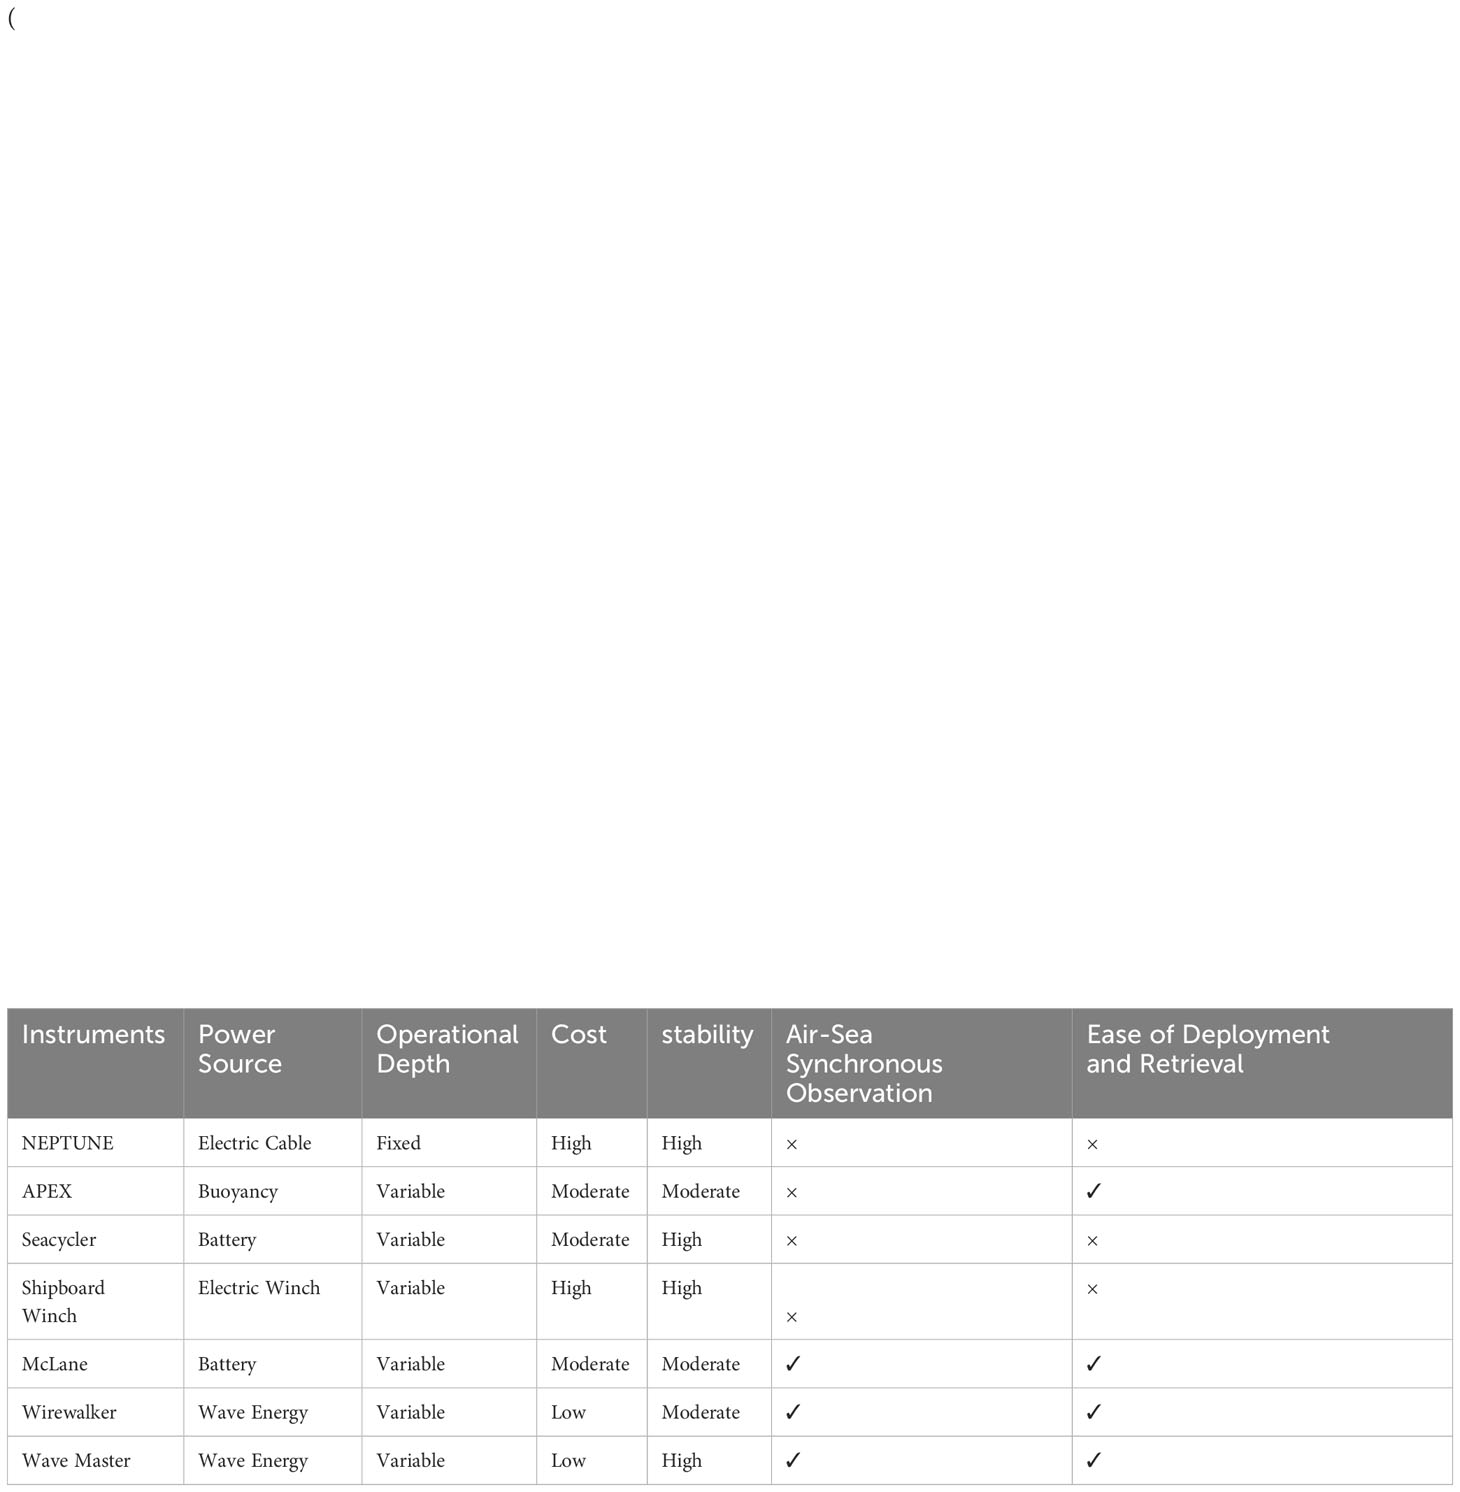
Table 6 Comparison with other oceanic profiling methods.
While the development of advanced frontend observational instruments is crucial, they are most effective when integrated into a well-structured backend oceanic IoT system. With the rapid advancement of IoT technology, several countries have established their own oceanographic IoT systems. The Array for Realtime Geostrophic Oceanography (ARGO) is a pioneering system that deploys a global array of autonomous floats to measure temperature and salinity in the upper 2000 meters of the ocean, forming an extensive ocean observation network. This network rapidly and accurately collects and analyzes oceanic data on a global scale, thereby improving the accuracy of climate forecasts and providing timely prevention of the impact of global natural disasters on humanity (Jayne et al., 2017; Wong et al., 2020). The Integrated Ocean Observing System (IOOS) in the United States is a comprehensive effort that goes beyond just data collection; it integrates a variety of oceanic and coastal data sources, including satellite observations and buoy networks. This system supports a wide range of applications, from navigation and disaster response to scientific research and environmental management, making it a cornerstone of U.S. marine policy (Muller-Karger et al., 2013). The Victoria Experimental Network Under the Sea (VENUS), situated off the coast of British Columbia, Canada, delivers real-time data and power to a broad array of instrumentation in coastal environments. This makes it a versatile platform for multidisciplinary oceanographic research, including studies on marine ecosystems, sediment transport, and underwater acoustics (Painter and Flynn, 2006). The UK’s Proudman Oceanographic Laboratory Coastal Ocean Modeling System (POLCOMS) specializes in high-resolution modeling and forecasting for the coastal ocean. It focuses on applications that are particularly useful for tidal and storm surge predictions, as well as coastal erosion studies, thereby playing a critical role in coastal management and hazard mitigation. Collectively, these systems aim to achieve high resolution real-time monitoring and data collection of the marine environment, supporting various fields such as meteorological forecasting, marine scientific research, and environmental protection (Le Traon et al., 2019).
However, they were developed with a local focus to address specific issues, often overlooking the need for a global perspective. This localized approach has resulted in low utilization rates of ocean data and poor system reusability on a broader scale (Pearlman et al., 2016). Although some systems have a global perspective, they often neglect the heterogeneity of ocean observation systems and lack a unified model for processing ocean observation data. For instance, profiling floats [e.g., Argo (Riser et al., 2016)] or sampling geometry such as time series measurement at one location [e.g., OceanSITES (Send et al., 2010)] can be employed. These programs are independently governed and funded, serving different stakeholders, yet they often share commonalities. Addressing the needs of individual stakeholders impacts the design of information systems for managing and distributing observations. This uniqueness of stakeholders results in distinct information systems, contributing to a lack of interoperability across systems (Snowden et al., 2019). This oversight has led to difficulties in data exchange and sharing among heterogeneous systems, impeding comprehensive research and analysis of large-scale marine observation data. The lack of standardized technical protocols results in low reusability of software modules in general cases. The development of these systems did not prioritize the standardization of large-scale interconnection interfaces, limiting data utilization rates (Qiu et al., 2018).
To address these challenges, we proposed the OPO-CVI model by referencing ISO 21851 requirements and aligning them with the practical needs of ocean profiling observation. This study contribute to the evolving understanding of ocean profiling by demonstrating the feasibility and benefits of a standardized approach to oceanic data collection. The OPO-CVI’s modular architecture enables seamless integration with existing and future oceanographic IoT systems, potentially revolutionizing how ocean data is collected, shared, and analyzed (Le Traon et al., 2019).
While the OPO-CVI offers several advantages in terms of cost-effectiveness, flexibility, and alignment with ISO 21851 standard, some limitations still exist in our proposed OPO-CVI.
Data Transmission: One of the primary limitations lies in the data transmission mechanism. Unlike the Wirewalker system, which uses sheathed steel cables for communication, our system opts for a two-step process. Data is initially stored in an onboard storage module and later transmitted to the communication buoy via short-range radio frequency communication when the vehicle ascends to a proximal distance. This design choice, although cost-effective and stable, prevents real-time acquisition of hydrographic data.
Standardization Challenges: Another challenge is the limited adoption of ISO 21851 standard, which poses difficulties in integrating OPO-CVI with legacy systems. This lack of widespread standardization hampers the system’s interoperability and could slow down its adoption in broader marine research communities (Pearlman et al., 2019).
Performance Scalability: Lastly, the system faces performance degradation in scenarios involving large volumes of data. The service interface’s performance significantly declines under heavy data loads, which could be a bottleneck in future deployments involving comprehensive data collection.
Future Directions: Addressing these limitations will be crucial for the next stages of this research. Future work could explore alternative data transmission methods that allow real-time data acquisition while maintaining system stability. Additionally, efforts should be made to advocate for the broader adoption of ISO 21851 standard to enhance system interoperability. Performance optimization techniques could also be investigated to improve the system’s scalability.
In this paper, we have presented two significant contributions to the field of oceanographic profiling and data interoperability. First, we introduced the Wave Master, an innovative wave-powered vertical profiler that builds upon the existing Wirewalker structure. Through a series of enhancements, we have significantly improved its stability and reliability for long-term oceanic observations. Second, we designed the OPO-CVI for our Wave Master, a standardized model that adheres to the ISO 21851 standard. OPO-CVI serves as the interoperability framework for Wave Master, facilitating seamless data exchange and integration with other oceanographic profiling systems. Our performance evaluations confirm the scalability and interoperability of OPO-CVI, demonstrating its capability to handle varying data sizes and network conditions effectively. The response latency remains within acceptable limits even as the number of integrated OPO-CVI models increases, confirming the system’s robust scalability. By integrating Wave Master with OPO-CVI, we have not only advanced the state-of-the-art in oceanographic profiling but also laid the groundwork for more integrated, efficient, and scalable ocean observation systems. Future work will focus on further optimizing these systems and exploring the integration of OPO-CVI with existing oceanic IoT systems like ARGO and IOOS to create a more comprehensive oceanographic data network. We aim to make OPO-CVI an even more robust and versatile tool for oceanographic research.
The original contributions presented in the study are included in the article/Supplementary Material. Further inquiries can be directed to the corresponding author.
SJ: Conceptualization, Methodology, Writing – original draft, Writing – review & editing. ZG: Conceptualization, Project administration, Supervision, Writing – review & editing. HZ: Investigation, Methodology, Writing – review & editing. ZC: Software, Visualization, Writing – review & editing. WW: Software, Visualization, Writing – review & editing.
The author(s) declare financial support was received for the research, authorship, and/or publication of this article. This work was supported by National Naturaln Science Foundation of China (Grant No. 61827810).
The authors declare that the research was conducted in the absence of any commercial or financial relationships that could be construed as a potential conflict of interest.
All claims expressed in this article are solely those of the authors and do not necessarily represent those of their affiliated organizations, or those of the publisher, the editors and the reviewers. Any product that may be evaluated in this article, or claim that may be made by its manufacturer, is not guaranteed or endorsed by the publisher.
The Supplementary Material for this article can be found online at: https://www.frontiersin.org/articles/10.3389/fmars.2024.1324523/full#supplementary-material
Al-Absi M. A., Kamolov A., Al-Absi A. A., Sain M., Lee H. J. (2021). “Iot technology with marine environment protection and monitoring,” in Pattnaik P. K., Sain M., Al-Absi A. A., Kumar P. (eds) Proceedings of International Conference on Smart Computing and Cyber Security: Strategic Foresight, Security Challenges and Innovation (SMARTCYBER 2020). Lecture Notes in Networks and Systems, vol 149 (Singapore: Springer), 81–89. doi: 10.1007/978-981-15-7990-5_7
Bailey K., Steinberg C., Davies C., Galibert G., Hidas M., McManus M. A., et al. (2019). Coastal mooring observing networks and their data products: recommendations for the next decade. Front. Mar. Sci. 6, 180. doi: 10.3389/fmars.2019.00180
Bermudez L., Delory E., O’Reilly T., del Rio Fernandez J. (2009). “Ocean observing systems demystified,” in Proceedings of the OCEANS 2009, MTS/IEEE Biloxi-Marine Technology for Our Future: Global and Local Challenges, (Piscataway, NJ: IEEE).
Buck J. J., Bainbridge S. J., Burger E. F., Kraberg A. C., Casari M., Casey K. S., et al. (2019). Ocean data product integration through innovation-the next level of data interoperability. Front. Mar. Sci. 6, 32. doi: 10.3389/fmars.2019.00032
Chai F., Johnson K. S., Claustre H., Xing X., Wang Y., Boss E., et al. (2020). Monitoring ocean biogeochemistry with autonomous platforms. Nat. Rev. Earth Environ. 1, 315–326. doi: 10.1038/s43017-020-0053-y
Cumbee S. C. (2019). “WireWalker Experiences with Two Navy-Funded Systems Utilizing Iridium Communications,” in OCEANS 2019 MTS/IEEE SEATTLE, (Seattle, WA, USA) pp 1–5. doi: 10.23919/OCEANS40490.2019.8962651
Davidson J., Ringwood J. V. (2017). Mathematical modelling of mooring systems for wave energy converters—a review. Energies 10, 666. doi: 10.3390/en10050666
Elmasri R., Navathe S., Elmasri R., Navathe S. (2015). “Fundamentals of database systems,” in Advances in Databases and Information Systems (Lyon, France: Springer), 139.
El-Sharkawi M. A., Upadhye A., Lu S., Kirkham H., Howe B. M., McGinnis T., et al. (2005). North east pacific time-integrated undersea networked experiments (neptune): Cable switching and protection. IEEE J. Oceanic Eng. 30, 232–240. doi: 10.1109/JOE.2004.839938
Eriksen C. C., Dahlen J. M., Shillingford J. T. Jr (1982). An upper ocean moored current and density profiler applied to winter conditions near Bermuda. J. Geophysical Res.: Oceans 87, 7879–7902. doi: 10.1029/JC087iC10p07879
Fan Y., Jarosz E., Yu Z., Rogers W. E., Jensen T. G., Liang J.-H. (2018). Langmuir turbulence in horizontal salinity gradient. Ocean Model. 129, 93–103. doi: 10.1016/j.ocemod.2018.07.010
Feddersen F., Olabarrieta M., Guza R., Winters D., Raubenheimer B., Elgar S. (2016). Observations and modeling of a tidal inlet dye tracer plume. J. Geophysical Res.: Oceans 121, 7819–7844. doi: 10.1002/2016JC011922
Gould J., Sloyan B., Visbeck M. (2013). In situ ocean observations: A brief history, present status, and future directions. Int. Geophysics 103, 59–81. doi: 10.1016/B978-0-12-391851-2.00003-9
Guo Z., Liu C., Wang X., Ma H., Jiang Y., Zheng B., et al. (2013). “Cvis: Complex virtual instruments system architecture,” in 2013 IEEE International Instrumentation and Measurement Technology Conference (I2MTC). 566–571 (Minneapolis, MN, USA: IEEE). doi: v
Hu K., Guo Z., Che Z., Shen F. (2014). Composition model of complex virtual instrument for ocean observing. J. Software 9, 1177–1188. doi: 10.4304/jsw.9.5.1177-1188
ISO (2020-08) Design criteria of ocean hydro-meteorological observation systems reuse and interactions. ISO 21851:2020 Marine technology-Ocean observation systems. Available at: https://www.iso.org/standard/71967.html.
Jayne S. R., Roemmich D., Zilberman N., Riser S. C., Johnson K. S., Johnson G. C., et al. (2017). The argo program: present and future. Oceanography 30, 18–28. doi: 10.5670/oceanog.2017.213
Jiang Y., Guo Z., Hu K., Shen F., Hong F. (2013). “Using sensor web to sharing data of ocean observing systems,” in Advances in Wireless Sensor Networks: 6th China Conference, CWSN 2012, Huangshan, China, October 25-27, 2012, Revised Selected Papers 6. 137–156 (Berlin Heideberg: Springer-Verlag).
Kock T., Baschek B., Wobbe F., Heineke M., Riethmueller R., Deschner S. C., et al. (2023). An advanced towed ctd chain for physical-biological high resolution in situ upper ocean measurements. Front. Mar. Sci. 10, 1183061. doi: 10.3389/fmars.2023.1183061
Laskar M. T. R., Huang J. X., Smetana V., Stewart C., Pouw K., An A., et al. (2021). Extending isolation forest for anomaly detection in big data via k-means. ACM Trans. Cyber-Physical Syst. (TCPS) 5, 1–26. doi: 10.1145/3460976824
Le Traon P. Y., Reppucci A., Alvarez Fanjul E., Aouf L., Behrens A., Belmonte M., et al. (2019). From observation to information and users: The copernicus marine service perspective. Front. Mar. Sci. 6, 234. doi: 10.3389/fmars.2019.00234
Li Z., Sun L., Higgs R. (2017). “Research on, and development of, data extraction and data cleaning technology based on the internet of things,” in 2017 IEEE International Conference on Computational Science and Engineering (CSE) and IEEE International Conference on Embedded and Ubiquitous Computing (EUC), Vol. 2. 332–341 (Guangzhou, China: IEEE).
Lindstrom E., Gunn J., Fischer A., McCurdy A., Glover L. K. (2012). A framework for ocean observing (the task team for an integrated framework for sustained ocean observing). Paris: UNESCO.
Memishi B., Appuswamy R., Paradies M. (2019). “Cold storage data archives: More than just a bunch of tapes,” in Proceedings of the 15th International Workshop on Data Management on New Hardware. Amsterdam, The Netherlands: ACM. 1–7.
Menaka D., Gauni S. (2021). Ocean of things: Marine environment monitoring using discriminatory model. J. Physics: Conf. Ser. 1964, 072015. doi: 10.1088/1742-6596/1964/7/072015
Morrison A. T., Billings J. D., Doherty K. W., Toole J. M. (2000). “The mclane moored profiler: A platform for physical, biological, and chemical oceanographic measurements,” in Proceedings of the Oceanology International 2000 Conference. (Brihton, UK). 1–18.
Muller-Karger F., Roffer M., Walker N., Oliver M., Schofield O., Abbott M., et al. (2013). Satellite remote sensing in support of an integrated ocean observing system. IEEE Geosci. Remote Sens. Magazine 1, 8–18. doi: 10.1109/MGRS.2013.2289656
Nash J. D., Marion J., McComb N., Nahorniak J. S., Jackson R. H., Perren C., et al. (2017). Autonomous ctd profiling from the robotic oceanographic surface sampler. Oceanography 30, 110–112. doi: 10.5670/oceanog.2017.229
Nathan V., Ding J., Alizadeh M., Kraska T. (2020). “Learning multi-dimensional indexes,” in Proceedings of the 2020 ACM SIGMOD international conference on management of data. (New York, NY, USA: Association for Computing Machinery), 985–1000. doi: 10.1145/3318464.3380579
Omand M. M., Cetinić I., Lucas A. J. (2017). Using bio-optics to reveal phytoplankton physiology from a wirewalker autonomous platform. Oceanography 30, 128–131. doi: 10.5670/oceanog.2017.233
Painter H., Flynn J. (2006). Current and future wet-mate connector technology developments for scientific seabed observatory applications. In OCEANS 2006 (IEEE), 1–6. doi: 10.1109/OCEANS.2006.306829
Pearlman J., Bushnell M., Coppola L., Karstensen J., Buttigieg P. L., Pearlman F., et al. (2019). Evolving and sustaining ocean best practices and standards for the next decade. Front. Mar. Sci. 6, 277. doi: 10.3389/fmars.2019.00277
Pearlman J., Schaap D., Glaves H. (2016). “Ocean Data Interoperability Platform (ODIP): addressing key challenges for marine data management on a global scale,” in OCEANS 2016 MTS/IEEE Monterey. Monterey, CA, USA, pp. 1–7. doi: 10.1109/OCEANS.2016.7761406
Pinkel R., Goldin M., Smith J., Sun O., Aja A., Bui M., et al. (2011). The wirewalker: A vertically profiling instrument carrier powered by ocean waves. J. Atmospheric Oceanic Technol. 28, 426–435. doi: 10.1175/2010JTECHO805.1
Qiu Z., Guo Z., Wang Y., Hu T., Liu C., Li T. (2018). Reconstruction model of ocean observing complex virtual instrument. J. Ocean Univ. China 17, 1159–1170. doi: 10.1007/s11802-018-3445-6
Rainville L., Pinkel R. (2001). Wirewalker: An autonomous wave-powered vertical profiler. J. Atmospheric Oceanic Technol. 18, 1048–1051. doi: 10.1175/1520-0426(2001)018<1048:WAAWPV>2.0.CO;2
Riser S. C., Freeland H. J., Roemmich D., Wijffels S., Troisi A., Belbéoch M., et al. (2016). Fifteen years of ocean observations with the global argo array. Nat. Climate Change 6, 145–153. doi: 10.1038/nclimate2872
Send U., Fowler G., Siddall G., Beanlands B., Pittman M., Waldmann C., et al. (2013). Seacycler: A moored open-ocean profiling system for the upper ocean in extended self-contained deployments. J. Atmospheric Oceanic Technol. 30, 1555–1565. doi: 10.1175/JTECH-D-11-00168.1
Send U., Weller R. A., Wallace D., Chavez F., Lampitt R., Dickey T., et al. (2010). “Oceansites,” In Proceedings of OceanObs’09: Sustained Ocean Observations and Information for Society, Vol. 2876 (European Space Agency), WPP-306, 913–922.
Snowden D., Tsontos V. M., Handegard N. O., Zarate M., O’Brien K., Casey K. S., et al. (2019). Data interoperability between elements of the global ocean observing system. Front. Mar. Sci. 6, 442. doi: 10.3389/fmars.2019.00442
Wang L., Li H., Jiang J. (2022). A high-efficiency wave-powered marine observation buoy: Design, analysis, and experimental tests. Energy Conversion Manage. 270, 116154. doi: 10.1016/j.enconman.2022.116154
Wang C., Pawlowicz R. (2011). Propagation speeds of strongly nonlinear near-surface internal waves in the Strait of Georgia. (Wiley Online Library), vol. 116. doi: 10.1029/2010JC006776
Wijesekera H. W., Shroyer E., Tandon A., Ravichandran M., Sengupta D., Jinadasa S., et al. (2016). Asiri: An ocean–atmosphere initiative for Bay of Bengal. Bull. Am. Meteorological Soc. 97, 1859–1884. doi: 10.1175/BAMS-D-14-00197.1
Wong A. P., Wijffels S. E., Riser S. C., Pouliquen S., Hosoda S., Roemmich D., et al. (2020). Argo data 1999–2019: Two million temperature-salinity profiles and subsurface velocity observations from a global array of profiling floats. Front. Mar. Sci. 7, 700. doi: 10.3389/fmars.2020.00700
You L. L., Pollack K. T., Long D. D. (2005). “Deep store: An archival storage system architecture,” in 21st International Conference on Data Engineering (ICDE’05). 804–815 (Tokyo, Japan: IEEE).
Keywords: ocean profiling observation, wave-powered vertical profiler, complex virtual instrument, ISO 21851, system interoperability
Citation: Jiang S, Guo Z, Zhao H, Cui Z and Wang W (2024) OPO-CVI: design and implementation of an ocean profiling observation system for wave-powered vertical profiler following an ISO standard. Front. Mar. Sci. 11:1324523. doi: 10.3389/fmars.2024.1324523
Received: 15 November 2023; Accepted: 19 January 2024;
Published: 21 February 2024.
Edited by:
Xuwen Feng, Ministry of Natural Resources, ChinaReviewed by:
Xu Cheng, Innovation Norway, NorwayCopyright © 2024 Jiang, Guo, Zhao, Cui and Wang. This is an open-access article distributed under the terms of the Creative Commons Attribution License (CC BY). The use, distribution or reproduction in other forums is permitted, provided the original author(s) and the copyright owner(s) are credited and that the original publication in this journal is cited, in accordance with accepted academic practice. No use, distribution or reproduction is permitted which does not comply with these terms.
*Correspondence: Zhongwen Guo, Z3Vvemh3QG91Yy5lZHUuY24=; Hailei Zhao, emhhb2hhaWxlaUBzdHUub3VjLmVkdS5jbg==
Disclaimer: All claims expressed in this article are solely those of the authors and do not necessarily represent those of their affiliated organizations, or those of the publisher, the editors and the reviewers. Any product that may be evaluated in this article or claim that may be made by its manufacturer is not guaranteed or endorsed by the publisher.
Research integrity at Frontiers
Learn more about the work of our research integrity team to safeguard the quality of each article we publish.