
94% of researchers rate our articles as excellent or good
Learn more about the work of our research integrity team to safeguard the quality of each article we publish.
Find out more
ORIGINAL RESEARCH article
Front. Mar. Sci. , 12 June 2024
Sec. Coastal Ocean Processes
Volume 11 - 2024 | https://doi.org/10.3389/fmars.2024.1317570
 Anping Shu1*
 Ziru Zhang1*
 Baoshan Cui1
 Yiyuan Zhuo2
 Xin Zhang3,4
 Chengling Pi1
 Fuyang Zhu5
 Huarez Christian1
As part of mangrove restoration initiatives eco-friendly fence has been implemented in eroded coastal areas in recent years. These fences provide the capacity to mitigate incoming wave energy and facilitate sediment deposition, thereby promoting the establishment and maintenance of mangrove habitats. Nevertheless, it is crucial to investigate the influence of the infill porosity on the wave dissipation performance of these fences, as the infill porosity can vary considerably across different restoration projects. The aim of this research is to explore the relationship between the infill porosity and wave dissipation effectiveness to identify more efficient designs for these eco-friendly restoration measures. The experiments involving wave interactions with fence models were conducted in a wave flume measuring 0.8 m in width and 25 m in length. Four wooden fences with distinct infill porosities ranging from 0.60 to 0.90 were strategically positioned to assess wave transmission, reflection, and dissipation phenomena under 18 distinct wave conditions. Additionally, the simulating waves till shore (SWASH)model was employed to calibrate critical bulk drag coefficient parameters and simulate the flow velocity distribution surrounding the fences under the experimental wave conditions. The findings indicated that a fence with a reduced infill porosity exhibits a higher wave transmission coefficient. However, this is accompanied by a higher reflection coefficient and lower wave energy dissipation within the fence. Both the infill porosity and incident wave conditions influence the flow velocity distribution characteristics in the vicinity of the fences. The area where the interaction between waves and fences is the most prominent is concentrated in the upper water layer immediately adjacent to the frontal section of the fences. Understanding the velocity distribution and hydrodynamic characteristics of the fence area aids in better determining the suitable porosity of fill materials for engineering applications.
Mangrove ecosystems are essential for maintaining coastline stability, protecting biodiversity and providing habitat (Murray et al., 2019). However, about 1/3 of mangrove forests on Earth have been permanently lost due to changes in natural environment and interference from human activities in the past 60 years (Atwood et al., 2017). Although artificial afforestation has become a common measure to rapidly restore mangrove ecosystems, the survival rate is not optimistic, and wave conditions are undoubtedly one of the important limiting factors (Balke et al., 2011). In recent years, there has been a notable focus on research pertaining to eco-friendly protective structures, utilizing locally available materials (such as bamboo poles) as viable means to safeguard mangrove afforestation against shoreline erosion. This approach offers greater convenience and cost-effectiveness than permanent breakwater structures, particularly in coastal areas characterized by unstable foundations comprising clay and silt (Mai Van et al., 2021), which has been extensively applied in Southeast Asia and South America to protect mangrove shorelines (Winterwerp et al., 2013; Van Cuong et al., 2015). These structures commonly feature one or more rows of vertically driven bamboo poles connected by horizontal bamboo poles, with branches or bamboo sticks filling the spaces between the rows (Gijón Mancheño et al., 2021). In Vietnam, within the context of a GIZ-funded project focused on management of coastal regions, Albers and Schmitt (2015) demonstrated the effectiveness of bamboo pole fences with dual rows with porous infill in mitigating coastal erosion and enhancing deposition in eroded sea areas in research zone. The outer frame of these fences primarily serves as a means of fixation, ensuring the resilience of the infill against current and wave forces. Furthermore, in another GIZ-funded project, Van Cuong et al. (2015) utilized two sorts of fences constructed from melaleuca poles and branches, combined with fishnets and bamboo mats, for a mangrove plantation initiative along the coast of target location. The purpose was to diminish wave energy and control sediment erosion. These fences achieved wave energy reduction of up to 63% and facilitated sediment deposition at a depth of up to 20 cm per year, equating to approximately 700 tons per hectare as reported. Moreover, they ensured adequate protection of all planted or naturally growing mangrove seedlings, even those areas that were heavily impacted by erosion.
Nevertheless, the real wave dissipation performance of fences is influenced by various factors, encompassing both the structural design of the fences and the characteristics of the waves themselves (Kazemi et al., 2019; Harris et al., 2021). Through experiment and numerical simulation, wave dissipation resulting from the implementation of simple yet widely employed bamboo pole configurations in water bodies, without the use of porous infill, has been quantitatively investigated (Mendez and Losada, 2004; Augustin et al., 2009). The effectiveness of such fences in wave energy dissipation is influenced by factors such as the density, arrangement, and diameter of the cylinders, as well as the frontal contact area (Armono et al., 2021; Gabreil et al., 2022). Numerous studies have concentrated on how to determine the bulk drag coefficient of cylinder arrays to elucidate the mechanisms underlying wave transmission (van Wesenbeeck et al., 2022). In the case of fences containing porous infill, Albers et al. (2013) conducted continuous monitoring and revealed that the relative fence freeboard is a primary factor dictating the wave dissipation effect of bamboo fences. However, the influence of the infill material porosity on wave dissipation hasn’t been extensively investigated. Albers and Von Lieberman (2011) emphasized the significance of porosity, while the specific effects of porosity and infill stiffness on wave energy dissipation have yet to be definitively established.
Advances in computational fluid dynamics software and various wave models have allowed researchers to quantify the wave-breaking processes of various wave protection facilities, in addition to empirical wave propagation models, The commonly used numerical simulation models include various models based on VOF (volume fraction method), such as FLOW-3D model based on Navier-Stokes equation and mass conservation equation using finite difference method, SPH model based on smooth particles, and SWASH model based on finite element method and shallow water wave theory, etc. Armono et al. (2021) used SPH model to simulate the effect of three kinds of single-layer fences without filling, and the simulation results showed that the vertical and horizontal connection arrangement had better wave absorbing performance than the other two arrangements. Thieu Quanga and Mai Trong (2020) further executed a comprehensive field campaign in Vietnam, to investigate the influence of three distinct fence widths on wave dissipation. They utilized infill material with a porosity of 70%, and the researchers employed the IH2-VOF model to capture the flow dynamics through the porous infill. Their outcomes demonstrated that it exhibited higher effectiveness in dissipating high-frequency waves than low-frequency waves. Moreover, the height of the fence exerted a stronger effect on wave dissipation than the width. Notably, the porosity of the fence material significantly influenced both high- and low-frequency wave attenuation, underscoring the importance of considering the role of the material porosity in future research endeavors. Building upon the work of Albers et al. (2013) regarding bamboo fences with porous infill, Dao et al. (2020) conducted measurements to assess the flow resistance of bamboo sticks used in fences with varied arrangements and specific surface areas. Their findings revealed that both the specific surface area and a disordered configuration significantly influenced the resistance of the infill material. The researchers also employed the SWASH model, where the bamboo fence was condensed into a compact arrangement of cylinders, for simulating wave transmission through the bamboo fence (Dao et al., 2018). Notably, the wave transmission coefficient shows a positive correlation to the width of the bamboo fence. Additionally, the transmission of long-duration waves was greater, and since long-duration waves play a crucial role in governing the net sediment input in shoreline systems, including mangroves, they should be considered important factors (Thieu Quanga). Nevertheless, there were discrepancies between the SWASH model simulation results and physical modeling study data or field measurements. Therefore, the SWASH model is used in this study to model the hydrodynamic process of the filled fence, and the wave reduction process in the fence area is simulated by generalizing the fence into a horizontal dense cylinder array. The volume drag force coefficient of each fence is determined by the wave flume experiment results, and the calculated results are compared with the empirical formula.
While previous researchers have recognized the influence of the infill porosity on the wave attenuation performance of fences, variations in the infill porosity exist among different fence types employed in real-world applications. These fences are also exposed to a wide range of wave conditions, posing challenges in quantifying the differences in the wave attenuation capabilities and determining the optimal structural design for a specific fence. The relationship between variations in porosity and the corresponding response of hydraulic characteristics across different porosity ranges warrants further study. The aim of this study is to examine the role of the infill porosity by focusing on fences containing porous infills. To achieve this objective, a comprehensive series of laboratory experiments was devised to evaluate the wave transmission and reflection characteristics of the selected fences. A total of 72 experimental runs were conducted, encompassing fence models with four distinct infill porosities subjected to 18 regular wave conditions. These experiments were instrumental in physically simulating wave interactions. Moreover, on the basis of the experimental outcomes, the SWASH model was utilized to calibrate crucial bulk drag coefficients, facilitating the simulation of the velocity distribution before and after each fence. In this paper, a detailed description of the methodology is provided in Section 2, followed by the presentation of the results and a discussion in Section 3. Finally, the study conclusions are outlined in Section 4.
Physical model experiments often require appropriate scaling ratios and model fabrication dimensions based on the research objectives. In accordance with the wave flume conditions, in this study, a size ratio of NL= 1:4 is adopted for the fence model, corresponding to a time ratio of and a velocity ratio of Nv = 1:2. Four fence models with porosities of 60%, 70%, 80%, and 90% were constructed for the experiments. The fill material consisted of bamboo sticks with a certain stiffness, horizontally arranged in a staggered pattern in a perpendicular orientation to the wave within the flume (Figures 1, 2). The porosity (P) of the fill material was defined as the ratio of the void volume between the front and rear frames to the total volume and could be adjusted by varying the number and spacing (S) of bamboo sticks. The prototype dimensions of the fence materials were determined based on considerations of the dimensions of the prototype fence design employed by Albers et al. (2013) and Thieu Quanga and Mai Trong (2020) in mangrove restoration projects. The height of the fence was set to 1.3 m, with a bamboo pole diameter of approximately 8 cm for the frame construction and infill bamboo stick diameters ranging from 1 to 2 cm. Additionally, due to the scaling ratio of 1:4, the height of the fence models used in the experiments was 32.5 cm, with a spacing of 12.5 cm between adjacent rows of frames. The diameter of the outer frame bamboo poles was approximately 2 cm, and the diameter of the infill bamboo sticks was 5 mm (Figure 1). The actual arrangement of the fence model is shown in Figure 2. For detailed parameters of each fence model, refer to Table 1.
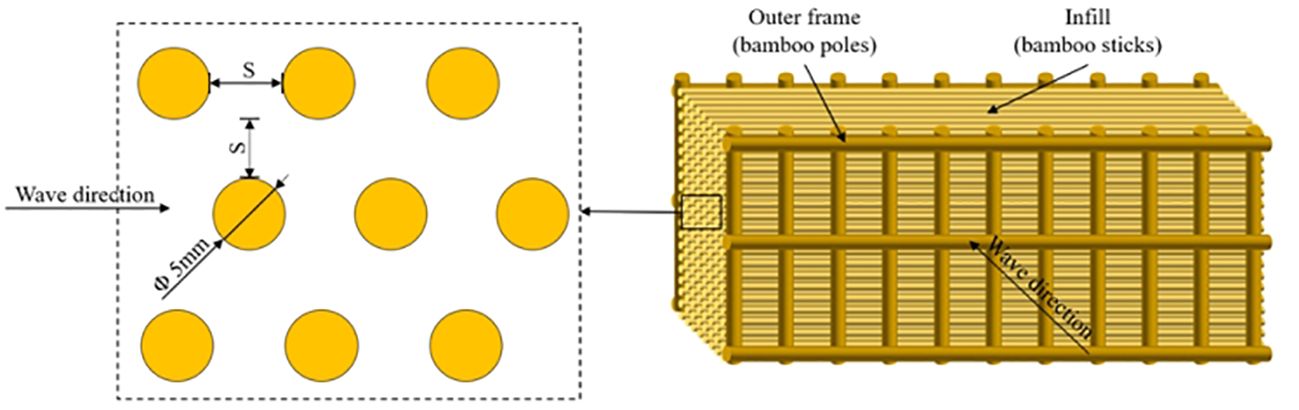
Figure 1 Schematic of the bamboo fence and staggered arrangement of the infill.
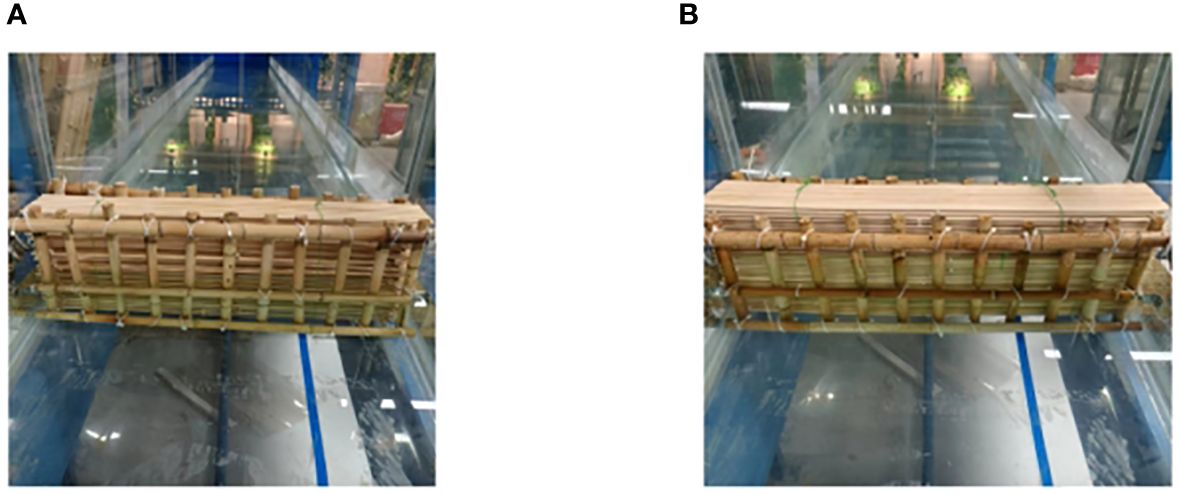
Figure 2 Fence model used: (A) Infill porosity of 90%; (B) infill porosity of 60%.
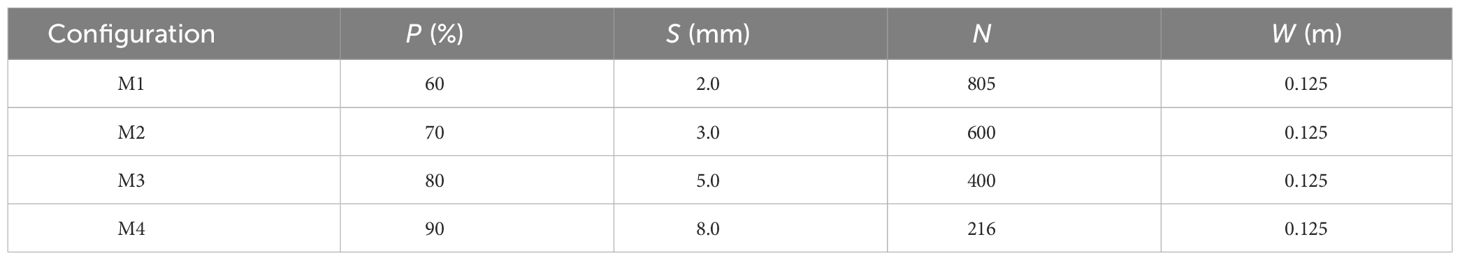
Table 1 Configuration of the fence models designed in the experiment.
The flume exhibits a rectangular cross-section with a total length of 25 m and both a width and height of 0.8 m. The working water depth ranges from 0.2 to 0.6 m. The bottom and sides of the flume are constructed of tempered glass. A wave generation system is installed at one end of the flume, and the control system can be used to simulate regular, cnoidal, and irregular waves. The simulated maximum wave height is 0.2 m, and the maximum period is 3 s. Wave absorbers are placed at both ends of the flume to absorb wave energy and reduce wave reflection.
A total of five wave gauges, labeled WG1–5 (Figure 3), were deployed in the experiments. WG1, located near the wave board at the front of the flume, was used to control the wave generation system for nonreflective wave generation experiments (ARC). WG2–5 were directly connected to the wave height acquisition system, providing digital signals of the water depth with a sampling frequency of 500 Hz and an accuracy of 5‰. Among them, WG2 and WG3 in the front of the fence model were used to measure the reflected wave height (Hr), while WG4 and WG5 at the rear of the fence model were used to measure the transmitted wave height (Ht). Both pairs of wave gauges were positioned 2.5 m away from the fence model, and the distance between the two gauges of each pair was 0.25 times the incident wavelength (L). Incident and reflected waves were separated via the method proposed by Goda and Suzuki (1976).
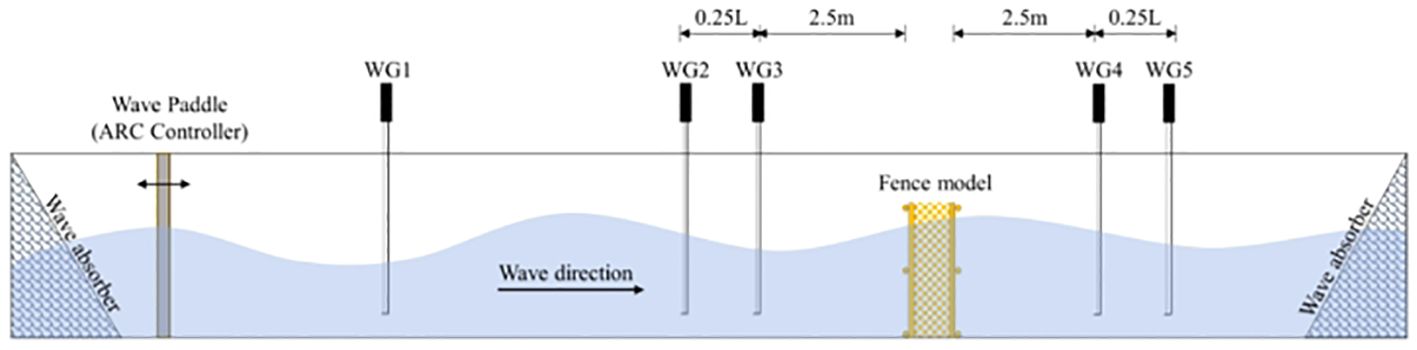
Figure 3 Schematic of the wave flume and experimental setup.
Considering the wave flume conditions, a total of 18 sets of conditions were generated for regular wave scenarios, as summarized in Table 2. The water depth (d) ranged from 20 to 30 cm, the wave height (Hi) ranged from 4 cm to 8 cm, and the wave period (T) ranged from 1 s to 2 s. The Ursell number (Ur), which characterizes the nonlinearity of waves, ranged from 2.84 to 38.58. Under all incoming wave scenarios, the water depth was smaller than the height of the physical model, and most wave conditions did not yield wave overtopping. However, under certain wave conditions (d = 0.3 m, Hi= 0.06, and 0.08 m), the wave crest height exceeded the model height.
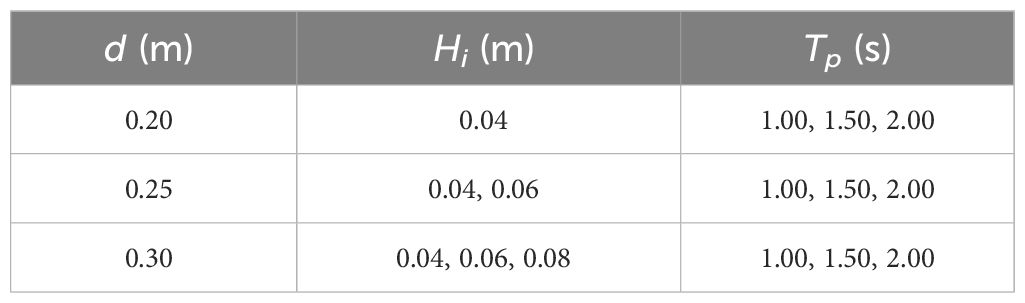
Table 2 Characteristics of the regular waves generated in the flume.
The interaction between waves and fences during wave propagation can be conceptually divided into three distinct processes (Shao, 2005): frontal reflection, rear transmission, and internal dissipation. These processes lead to the partitioning of wave energy into three components in the interior of the fence: transmitted energy (Et), reflected energy (Er), and dissipated energy (Ed). The relationship between them can be shown by Equations 1 and 2.
The energy of a regular wave is proportional to the square of the wave height, so Equation 2 can be written as Equation 3
From Equation 4 we can get the relationship between the three coefficients (Kt Kr Kdis) and how they are calculated, the wave transmission coefficient (Kt) is the ratio of the transmitted wave height Ht to the incident wave height Hi and the wave reflection coefficient (Kr) is the ratio of the reflected wave height Hr to the incident wave height Hi. To determine the precise ratio of these three components of the incident wave energy in the experiment, the reflected wave height Hr and the transmitted wave height Ht were measured to calculate Kr and Kr, and the wave dissipation coefficient (Kd) was then calculated correspondingly.
The SWASH model, developed at Delft University of Technology (Zijlema et al., 2011), is an open-source model capable of simulating hydrodynamic/wave motion under non-hydrostatic conditions. It can be employed to capture unsteady, hydrostatic/non-hydrostatic, free-surface, or rotational flow phenomena in coastal areas driven by waves, tides, buoyancy, or wind, including salinity, temperature, and suspended sediment transport. In this study, SWASH version 7.01AB, compiled locally, was used with parallel computing using MPICH2 to enhance the computational efficiency.
In the three-dimensional case, the governing equation is as Equations 5–8 (Zijlema et al., 2011):
where, u, v, and w are velocity components in the x, y, and z directions, t is time, is density and τ is shear stress.
Assuming the density of water is 1, the total pressure p can be divided into two parts: hydrostatic and non-hydrostatic as Equation 9:
where, ph is the hydrostatic pressure, q is the non-hydrostatic pressure, g is the acceleration of gravity, and ξ represents the free surface.
The free surface boundary conditions are as Equation 10,
The boundary conditions at the bottom and the solid wall are as Equation 11,
Calculations of bottom shear stress in all directions are as Equation 12
where, n is the Manning coefficient, the total water depth is written as H, the average velocity along water depth in the x direction is written as U, V is the average velocity along water depth in the y direction, and cf is the dimensionless Manning coefficient.
On free surfaces, ignore the surface tension, and the free surface pressure boundary condition is as Equation 13 by taking into account thebottom boundary layer of the wave in the flume.
The vertical flow rate of the water quality point at the bottom boundary should meet equation , and the horizontal flow rate should meet as Equation 14.
The open boundary includes the outflow boundary and the inflow boundary, the inflow boundary is the velocity inlet boundary condition, and the influence caused by secondary reflection is eliminated by combining the weak reflection boundary condition as Equation 15,
where, ub is the inflow boundary velocity and ξb is the incident wave amplitude. The outflow boundary is the Sommerfeld boundary condition as Equation 16:
where, f is generally the tangential component of the wavefront or velocity, and c is the wave velocity. The solid wall boundary is a total reflection boundary, and the solid boundary perpendicular to the x-axis is as Equation 17
The fenced model area was generalized with the vegetation module of the SWASH model to simulate its impact on wave propagation. The drag and inertia forces acting on a single bamboo stick in the control equations of the SWASH model are shown as Equation 18:
where, CD is the cylinder drag force coefficient; hv is the height of the simulated cylinder; bv is the diameter of the cylinder; Nv is the number of cylinders per square meter; Cm is the additional mass coefficient; Av is the area of a single simulated cylinder.
In addition to drag and inertia forces, the SWASH model also takes into account pore effects. Therefore, considering the pore effect, the momentum equation in the porous medium region of the cylindrical array is as Equation 19.
where, is the pore flow rate.
The numerical simulation domain (Figure 4) in this study exhibited a total length of 30 m, and a two-dimensional vertically structured grid was utilized. It included the x-direction (wave propagation direction) and the vertical z-direction. The x-direction grid size was Δx = 0.0125 m, equal to Lmin/100, where, Lmin is the minimum incident wave wavelength on the basis of experimental measurements, ensuring the accuracy of the numerical simulation results. As the focus of this study is the velocity distribution during wave propagation and the movement of water particles near the bottom, a 12-layer self-adaptive grid was used along the z-direction. The left boundary at x = 0 m was defined as a weak reflective boundary for nonreflective wave generation, producing a water level and time series. The front end of the fence model was located at x = 10 m, with a width of 0.125 m and a height of 0.325 m. An additional 12 m-long sponge layer was placed at the boundary at x = 18 m at the rear end of the model to absorb transmitted waves and eliminate boundary reflection. To ensure the simulation accuracy, a time step of 0.001 s was set, with Courant numbers ranging from 0.01 to 0.5. Model computation was performed over a duration of 200 incident wave periods. The SWASH model was conducted on a PC which has a 64-bit AMD Ryzen 7 5800H processor (3.2 GHz). The CPU time of SWASH for the research case which uses 12 cores is 405.88 s.
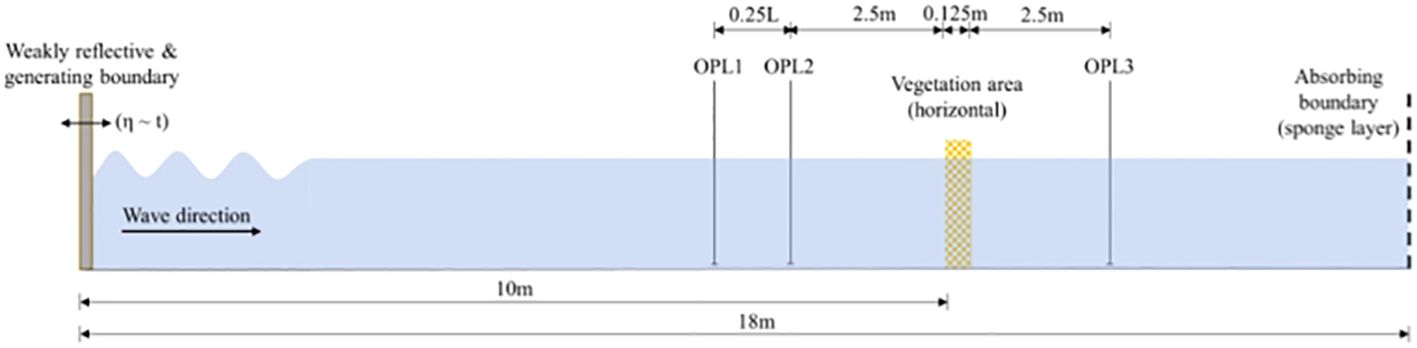
Figure 4 Schematic of the model domain.
In addition to the two-dimensional computed results, specific locations were designated for wave height data collection based on the relative positions of the wave gauges and the fence model in the physical model experiments. Three data output locations, i.e., OPL1, OPL2, and OPL3, were defined in the numerical model for measuring transmitted wave heights and calculating reflected wave heights. As the SWASH program does not include postprocessing capabilities, MATLAB was used for postprocessing and visualization of the velocity distribution results.
Figure 5 shows the experimental relationship between the wave transmission coefficient and wave steepness for the fences with different porosities. The wave transmission coefficients of each model exhibited a significant correlation with wave steepness. With both the wave period and wavelength increasing with increasing wave steepness, the wave transmission coefficient also increased. However, the magnitude of the transmission coefficient variation gradually decreased. Regardless of the occurrence of wave overtopping, distinct differences occurred in wave attenuation effects among the fences with different porosities. Overall, the wave transmission coefficient of the fences exhibited a negative correlation with the fence porosity. For fence M4 with a porosity of 90%, the wave transmission coefficient ranged from 0.49 to 0.90. Fence M4 showed the most effective wave attenuation performance, with a wave transmission coefficient ranging from 0.26 to 0.64. There was no significant correlation between the wave reflection coefficient and wave steepness for each model. With decreasing infill porosity, the reflection coefficient gradually increased (Figure 5). Fence M1 exhibited the strongest wave reflection at the front, which the average wave reflection coefficient is 0.39. Via the calculation of the relationship with the wave dissipation coefficient, it was observed that the fraction of the energy dissipated inside the fences of the wave increased with decreasing infill porosity. For fence M4 with a porosity of 90%, the wave dissipation coefficient ranged from 0.18 to 0.74. Fence M1 exhibited the highest wave dissipation ability, with a wave dissipation coefficient ranging from 0.46 to 0.82. However, with decreasing porosity, the differences in the dissipation coefficient among the different fences declined (Figure 5), especially for fences M1 and M2.
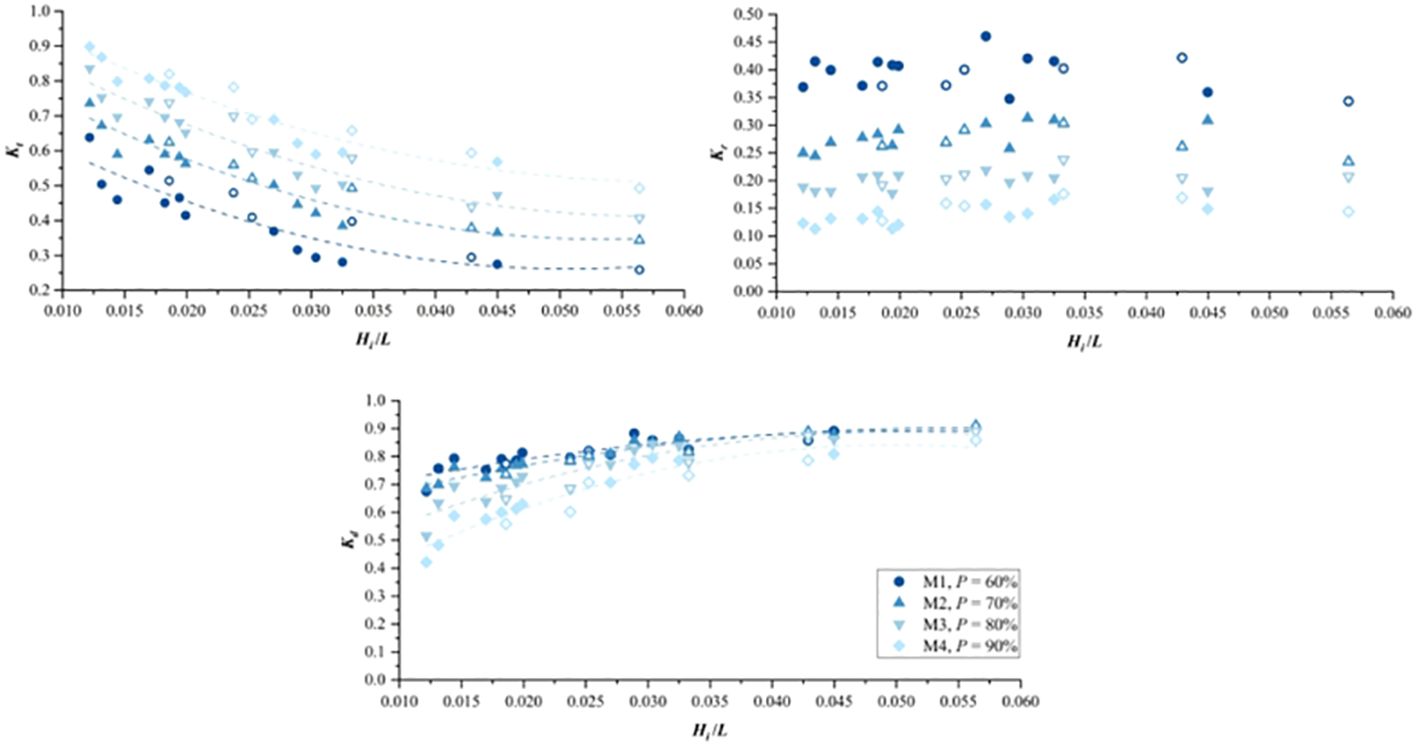
Figure 5 Variation in the wave transmission process (quantified using Kt, Kr and Kd) with wave steepness under the influence of the infill porosity.
Overall, porous infill induced energy dissipation inside the fences when waves were transmitted through them. The principle is similar to wave transmission in vegetation areas. Waves in the presence of rigid cylinder arrays are subjected to surface friction, horizontal drag forces, and inertial forces, along with additional vertical drag forces generated by the horizontally arranged cylinders. Simply increasing the density of bamboo sticks used as infill materials results in a direct increase in the frontal area of the infill. Wave attenuation primarily occurs in the front few rows of bamboo sticks, where the reduced spacing provides greater sheltering effects, increases the pore flow velocity, and amplifies wave reflection and drag forces (Etminan et al., 2019). As a result, less energy enters the fence, indirectly enhancing the wave reduction performance (Suzuki et al., 2019). Additionally, in the experiment, a small spacing between the bamboo sticks was employed, with the rear row of sticks situated in the wake of the front row, experiencing notable sheltering effects and reducing the flow velocity in the front. This led to decreased drag forces and diminished wave energy dissipation, resulting in reduced dissipation efficiency for individual cylinders (Gijón Mancheño et al., 2021).
Through further comparison of the experimental wave transmission process among the different fence models under the different incident wave conditions, it can be observed that in the same depth and period conditions (Hi = 0.04 m, Tp = 1.50 s), the wave damping effect and the relative height of the top of the fences are negatively correlated. In the case of an increase in the water depth of 0.1 m, the wave transmission coefficient of fence M4 shows the most substantial growth, reaching 0.15. Moreover, the wave reflection at the front of the fence slightly changes with increasing water depth, with the reflection coefficient fluctuating within a small range (Figure 6). This may occur because the intensity of wave reflection is mainly related to the frontal area of the fence. With a relatively stable wave reflection coefficient, a rise in the wave transmission coefficient suggests a decrease in the wave dissipation coefficient (Figure 6). Compared to the changes in the water depth, the wave height exerts a more significant impact on the wave transmission process through the fences. Under the same water depth and period conditions (d = 0.20 m, Tp = 1.50 s), the wave transmission coefficient of the different fences decreases with increasing wave height (Figure 7), and the degree of wave reflection at the front of all fences slightly increases with increasing wave height, with an increase less than 0.05. Corresponding to the significant increase in the wave transmission coefficient of the fences, the wave energy dissipation coefficient of the fences also notably increases with increasing wave height, reaching a maximum increase of 0.19 (fence M2). As one of the two influencing factors on wave energy, the incident wave period also affects the wave dissipation process of the fences. As shown in Figure 8, under the same wave height and water depth conditions (d = 0.20 m, Hi = 0.04 m), with increasing incident wave period, the attenuation effect of the fences on the incident waves significantly decreases, with the wave transmission coefficients of all fences increasing by more than 0.1. At the same time, the intensity of wave reflection at the front of the fences shows only slight variations (Figure 8), with a slight decrease in the wave reflection coefficient with increasing period. Corresponding to the increase in the wave transmission coefficient and the decrease in the wave reflection coefficient, the wave dissipation coefficient shows a decreasing trend (Figure 8), and the higher the infill porosity is, the greater the decrease in the wave dissipation coefficient with increasing incident wave period.
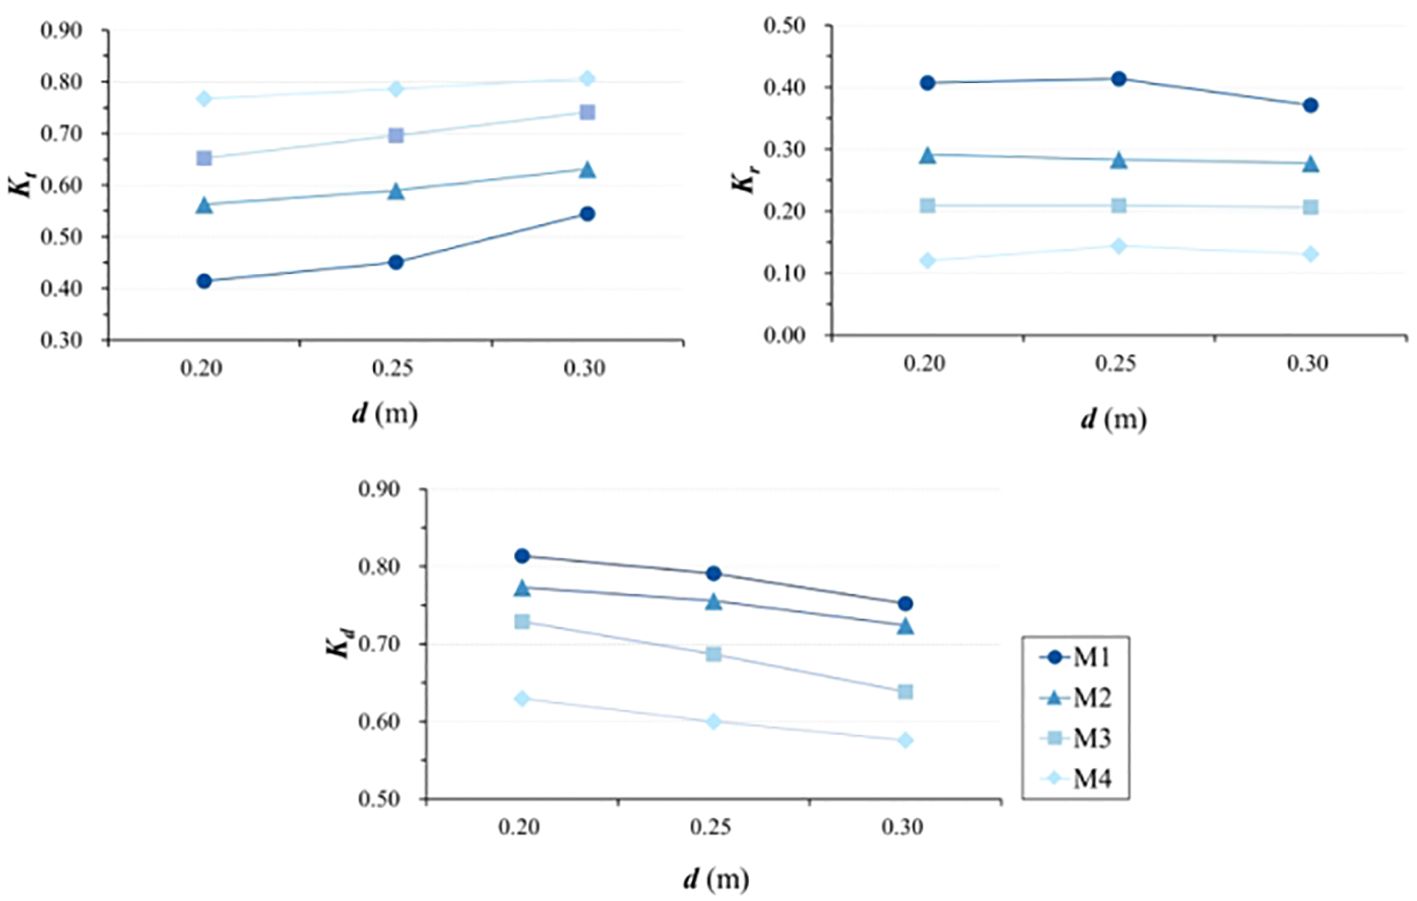
Figure 6 Influence of the still water depth on the wave transmission process (i.e., Kt, Kr and Kd).
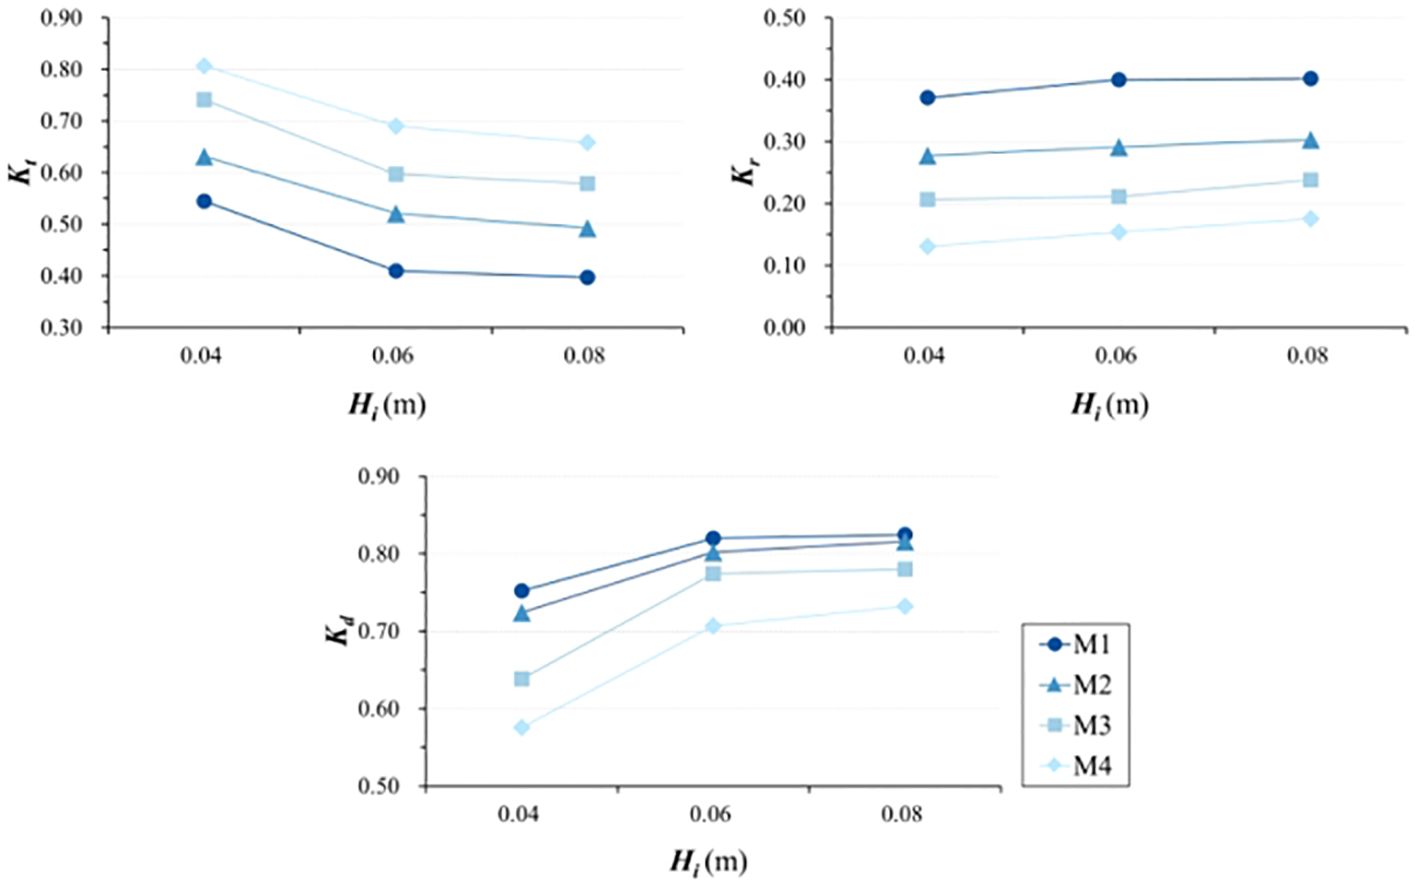
Figure 7 Influence of the wave height on the wave transmission process (i.e.,Kt, Kr and Kd).
Figure 8 Influence of the wave period on the wave transmission process (i.e., Kt, Kr and Kd).
The primary mechanism through which incident wave characteristics influence wave transmission through the fences is attributed to the variations in water particle motion patterns. Wave steepness exhibits a negative correlation with wave period and still water depth. With increasing wave steepness, the flow velocity and acceleration also increase. Consequently, the interaction between the cylinders and steeper waves can generate heightened turbulence, along with an increase in the wave height. Conversely, long waves with longer periods not only possess greater power than shorter waves but also promote a more streamlined flow pattern between the cylinders (Jansen, 2019). This streamlined flow causes the formation of larger wake zones surrounding the elements, resulting in a more pronounced sheltering effect. These findings align with the observations of Thieu Quanga and Mai Trong (2020) during field monitoring, where it was noted that low-frequency waves can penetrate fences more easily. Additionally, in this experiment, an increase was demonstrated in the wave dissipation performance of the fences with increasing wave steepness, reinforcing the aforementioned observations.
In the investigation of the influence of fences on wave propagation, the bulk drag coefficient is the most crucial calibration parameter. The bulk drag coefficient of the cylinder body is primarily influenced by the flow regime of water. In contrast to the drag coefficient of an individual cylinder, which is a single value, the fence consists of numerous bamboo sticks and wave attenuation continuously occurs as waves propagate through each row of bamboo sticks. Each bamboo stick experiences different wave heights and flow velocities at different locations within the fence. Additionally, the front rows of bamboo sticks create a blockage effect on the following bamboo sticks. As a result, it is challenging to estimate the drag coefficient of an individual bamboo strip. Instead, it is necessary to determine the overall average or bulk drag coefficient of the entire infill (CD).
Given the horizontal arrangement of the bamboo sticks used as infill materials in the fence, the theoretical wave transmission model proposed by Suzuki et al. (2019) was adopted to account for the combined effect of the wave forces in the vertical and horizontal directions acting on the cylinders. Consequently, transmission of monochromatic wave through an array of cylinders with a flat foundation can be expressed as Equation 20:
Where β is obtained by Equation 21.
Where, the wave height at the boundary of the vegetation area is Hi, bv is the cylinder stem diameter, the number of plants per square meter is Nv, the wave number is k, a is the inundation degree of the vegetation present and d is the water depth. The CD value used here is an empirical bulk drag coefficient, and wave reflection is neglected.
Based on the calculated theoretical CD values of the fences with different infill porosities (Figure 9), it is observed that the theoretical CD value of all four fences decreases with increasing wave nonlinearity. The fence with the highest infill density, M1, exhibits a bulk drag coefficient that ranges from 3.0–8.1, while that of M2 ranges from 2.9–6.4, that of M3 ranges from 2.2–7.0, and that of M4 ranges from 2.2–8.7.

Figure 9 Theoretical CD values of the fences with different infill porosities.
However, the theoretical model only accounts for wave energy dissipation within an array of cylinders, including the impact of interference of the velocity field. It does not consider the intense wave reflection occurring at the frontal rows of the cylinders. The calculated bulk drag coefficients for the different infill porosities represent the effect of each cylinder on wave attenuation rather than the wave energy dissipation occurring in the fence. In this approach, the energy losses resulting from wave reflection are neglected, which cannot be ignored at a low infill porosity, resulting in higher wave reflection coefficients. Consequently, the average bulk drag coefficient is overestimated under low-porosity scenarios. The validated bulk drag coefficients of all fences are negatively correlated with the wave Ursell number (Figure 10). Moreover, the fences with a higher porosity exhibit validated bulk drag coefficients CD that are closer to the theoretical CD values. The difference between the validated and theoretical CD values of fence M4 is typically approximately 1.0, and under some wave conditions, the validated CD value exactly matches the theoretical CD value. This indicates that the theoretical equation is more applicable to situations with high porosity, where the contribution of the reflected wave energy in front of the fence to the total incident wave energy can be neglected. However, in low-porosity cases, with an increasing proportion of the reflected wave energy to the total incident wave energy, the difference between the validated and theoretical CD values gradually increases, as observed for fence M1. Furthermore, with increasing infill density, the range of the variation in the bulk drag coefficient of the fences decreases. The bulk drag coefficient of fence M1 ranges from 1.1 to 2.5, while the bulk drag coefficient of fence M4 ranges from 1.8 to 7.0.
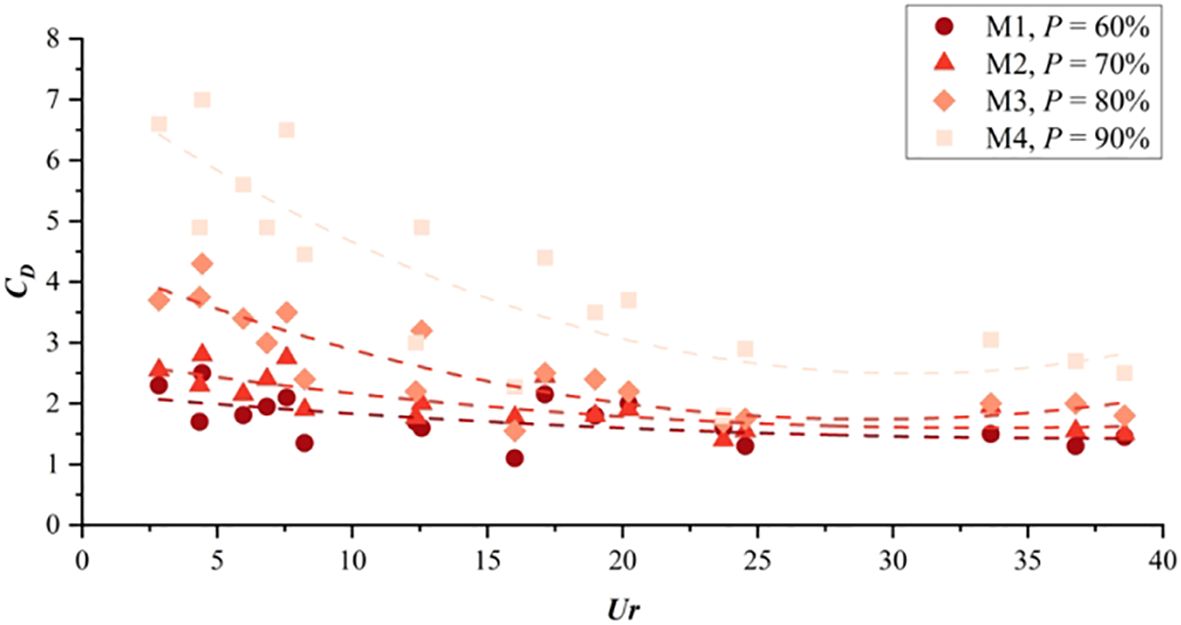
Figure 10 Validated CD values of the fences with different infill porosities.
The bulk drag coefficient results obtained with the theoretical equation and calibration were incorporated into the SWASH model for simulation purposes. Figure 11 shows that the theoretical equation, due to its neglect of wave reflection, yields overestimated bulk drag coefficient values, resulting in lower wave transmission coefficients and higher wave reflection coefficients than the experimental results. However, the validated CD values suitably agree with the experimental results, particularly in terms of the wave transmission coefficient, which reflects the wave attenuation effectiveness of the fences. This indicates the satisfactory accuracy of the model results.
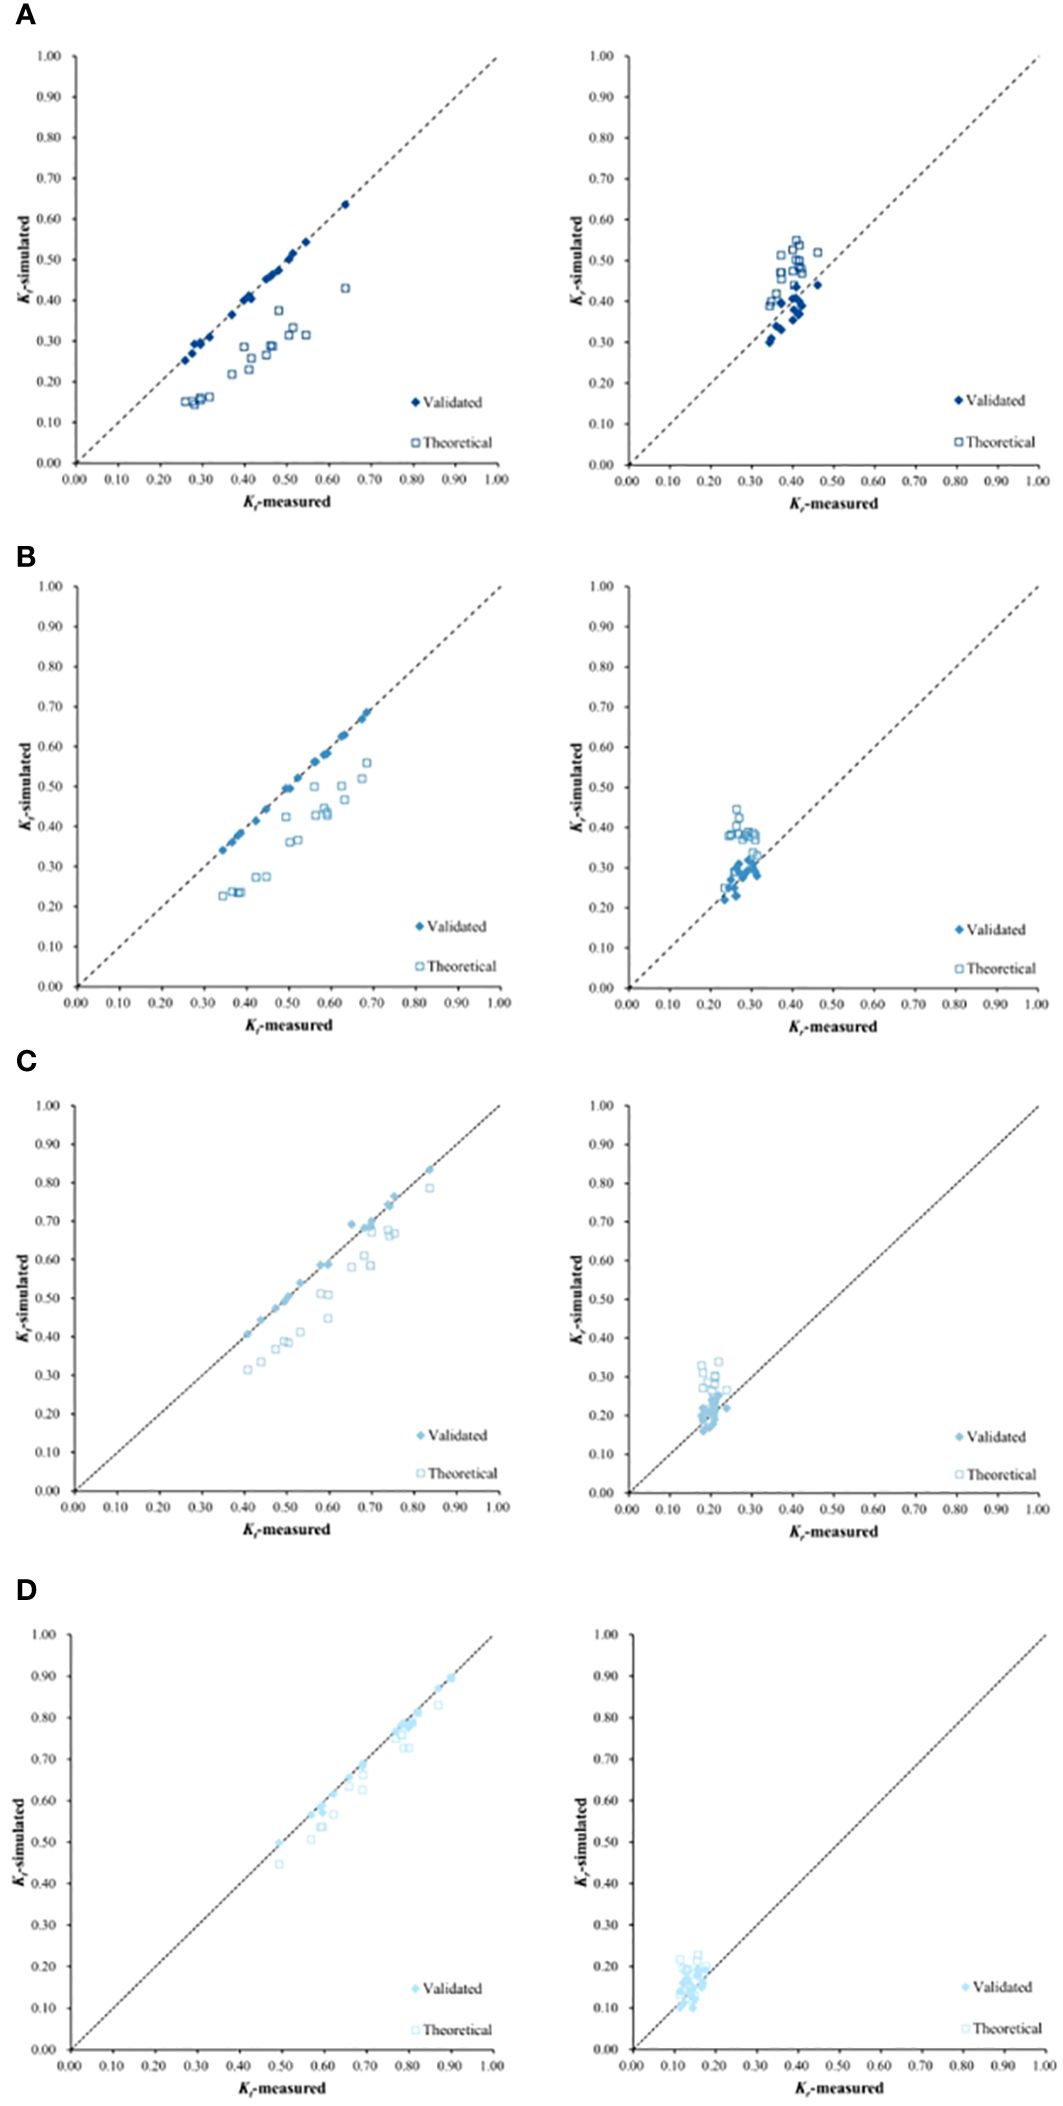
Figure 11 Simulated and measured values of the wave transmission and reflection coefficients of fences M1-M4: (A) M1, (B) M2, (C) M3, and (D) M4.
To further verify the accuracy of the numerical model in simulating water levels using the validated bulk drag coefficient values of the fences, water level time series measurements at the fence front locations WG2 and WG3 were selected and compared to the water level time series at model locations OPL1 and OPL2. Figures 12, 13 show the comparison results between the measured values and simulated values of Models M2 and M4, respectively, under wave conditions of d = 0.25 m, Hi = 0.04 m, and Tp = 1.50 s. The results demonstrate favorable agreement between the model-simulated water levels and the experimentally measured values.
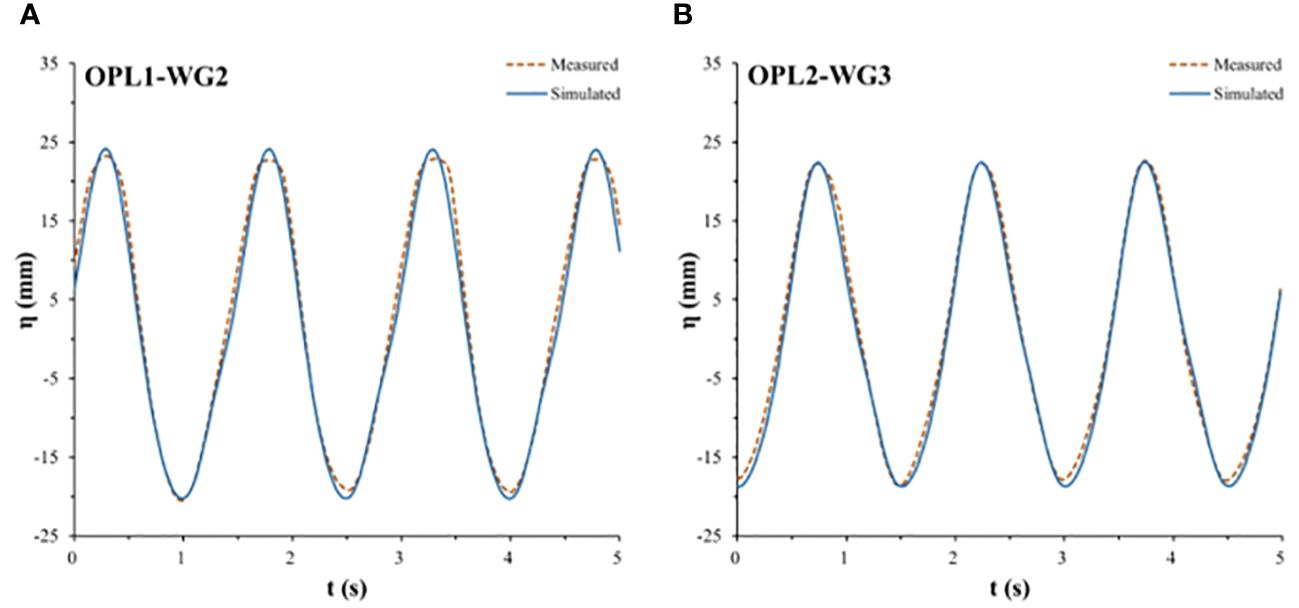
Figure 12 Measured and simulated water levels ahead of fence M2 (d = 0.25 m, Hi = 0.04 m, Tp = 1.50 s): (A) WG2 and (B) WG3.
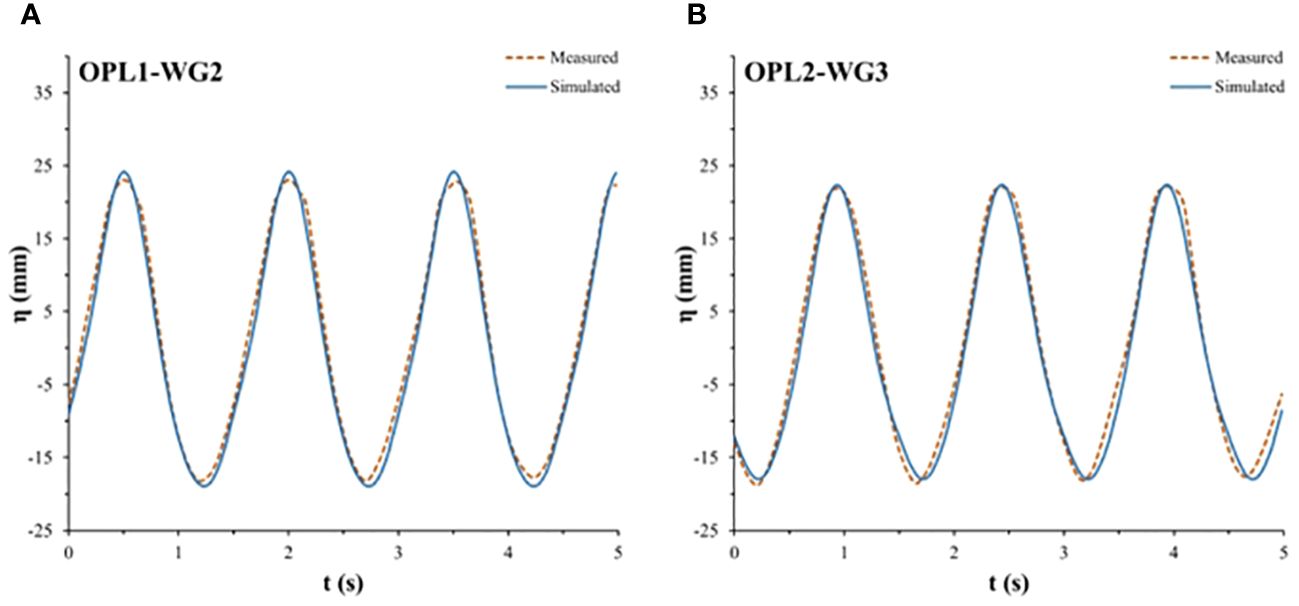
Figure 13 Measured and simulated water levels ahead of fence M4 (d = 0.25 m, Hi = 0.04 m, Tp = 1.50 s): (A) WG2 and (B) WG3.
Due to the lack of direct measurements of velocity profiles in the different water layers during wave motion in the physical model experiments, theoretical models were employed to validate the accuracy of the model in calculating the velocity distributions in the different flow layers. Based on the 5th-order Stokes theory, two sets of blank group model simulation results were selected for validation. The experimental wave conditions are as follows: d = 0.25 m, Hi = 0.04 m, Tp = 1.50 s and d = 0.30 m, Hi = 0.04 m, Tp = 1.50 s. The validation results (Figures 14, 15) indicate suitable agreement between the simulated distributions of the longitudinal and vertical velocities in the different flow layers and the theoretical values. This demonstrates that the model can be used to accurately calculate velocity distributions in flow layers under the action of waves.
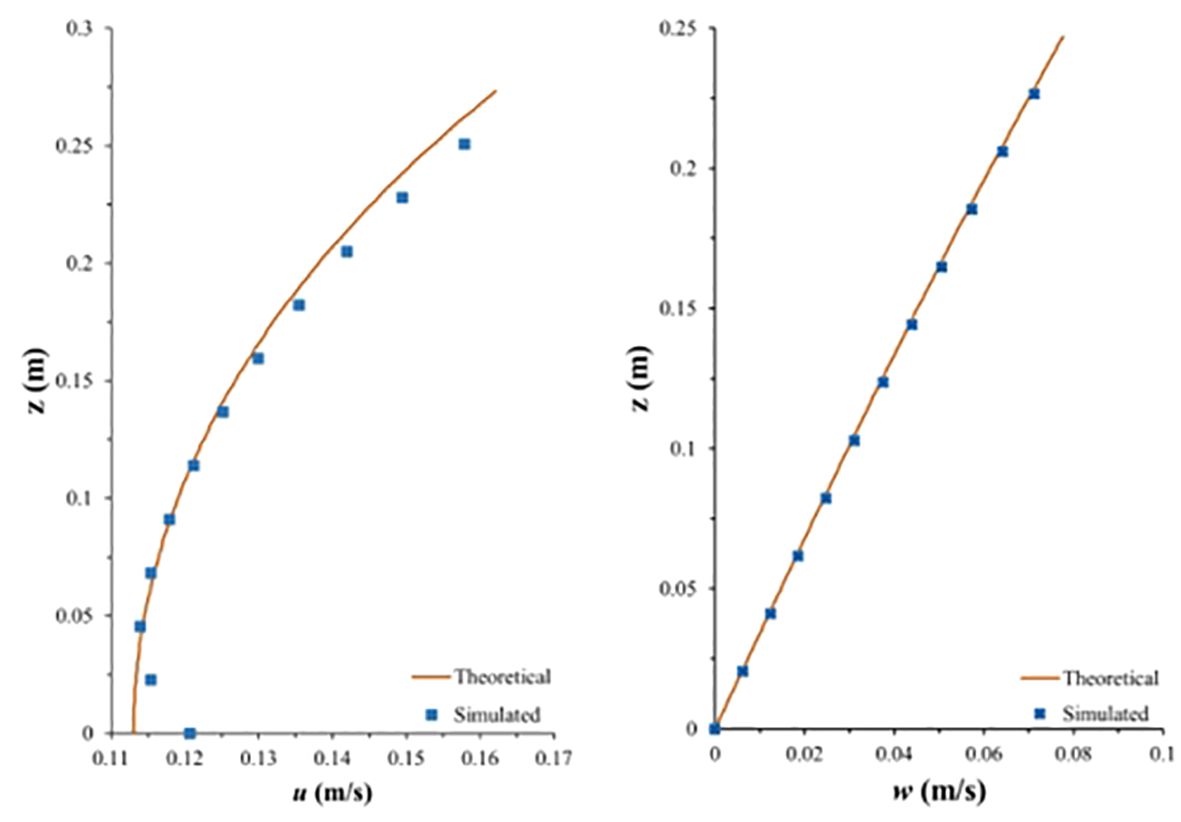
Figure 14 Theoretical and simulated values of the longitudinal and vertical flow velocities (d = 0.25 m, Hi = 0.04 m, Tp = 1.50 s).
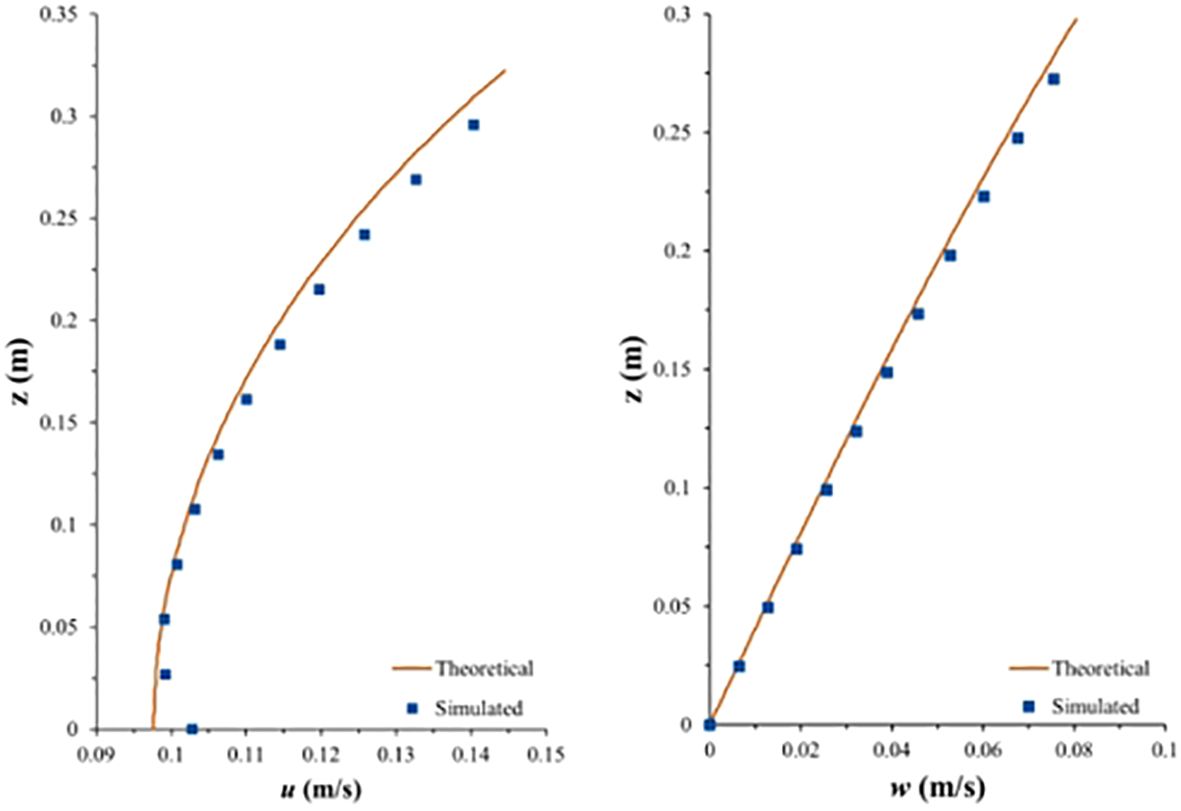
Figure 15 Theoretical and simulated values of the longitudinal and vertical flow velocities (d = 0.30 m, Hi = 0.04 m, Tp = 1.50 s).
Considering the wave conditions of d = 0.25 m, Hi = 0.04 m, and Tp = 1.50 s as an example, Figure 16 shows the distribution of the flow velocity magnitude at a stable moment in the front and rear sections (x = 6–13 m) of the empty group and the fences with different infill porosities. The presence of a fence affects the flow velocity distribution to a certain extent, especially for fences with low infill porosity. Compared to the empty group, with decreasing infill porosity, the flow velocity of water particles in front of the fence increases. In the vicinity of the fence, the flow of water particles is significantly impeded, particularly closer to the upper layer. With increasing infill porosity, this influence gradually diminishes. Compared to the changes in the flow velocity distribution in front of the fence, the variation in the flow velocity behind the fence is higher. Compared to that in the empty group, the velocity magnitude behind the fence decreases due to its wave dissipation effect and the absence of a reflecting boundary. With decreasing wave height and increasing porosity, the flow velocity distribution behind the fence increasingly matches that of the empty group. However, even with the highest-porosity fence (M4), the velocity magnitude behind the fence is significantly smaller than that of the empty group. This imposes a crucial positive effect on promoting sedimentation on the bed behind the fence.
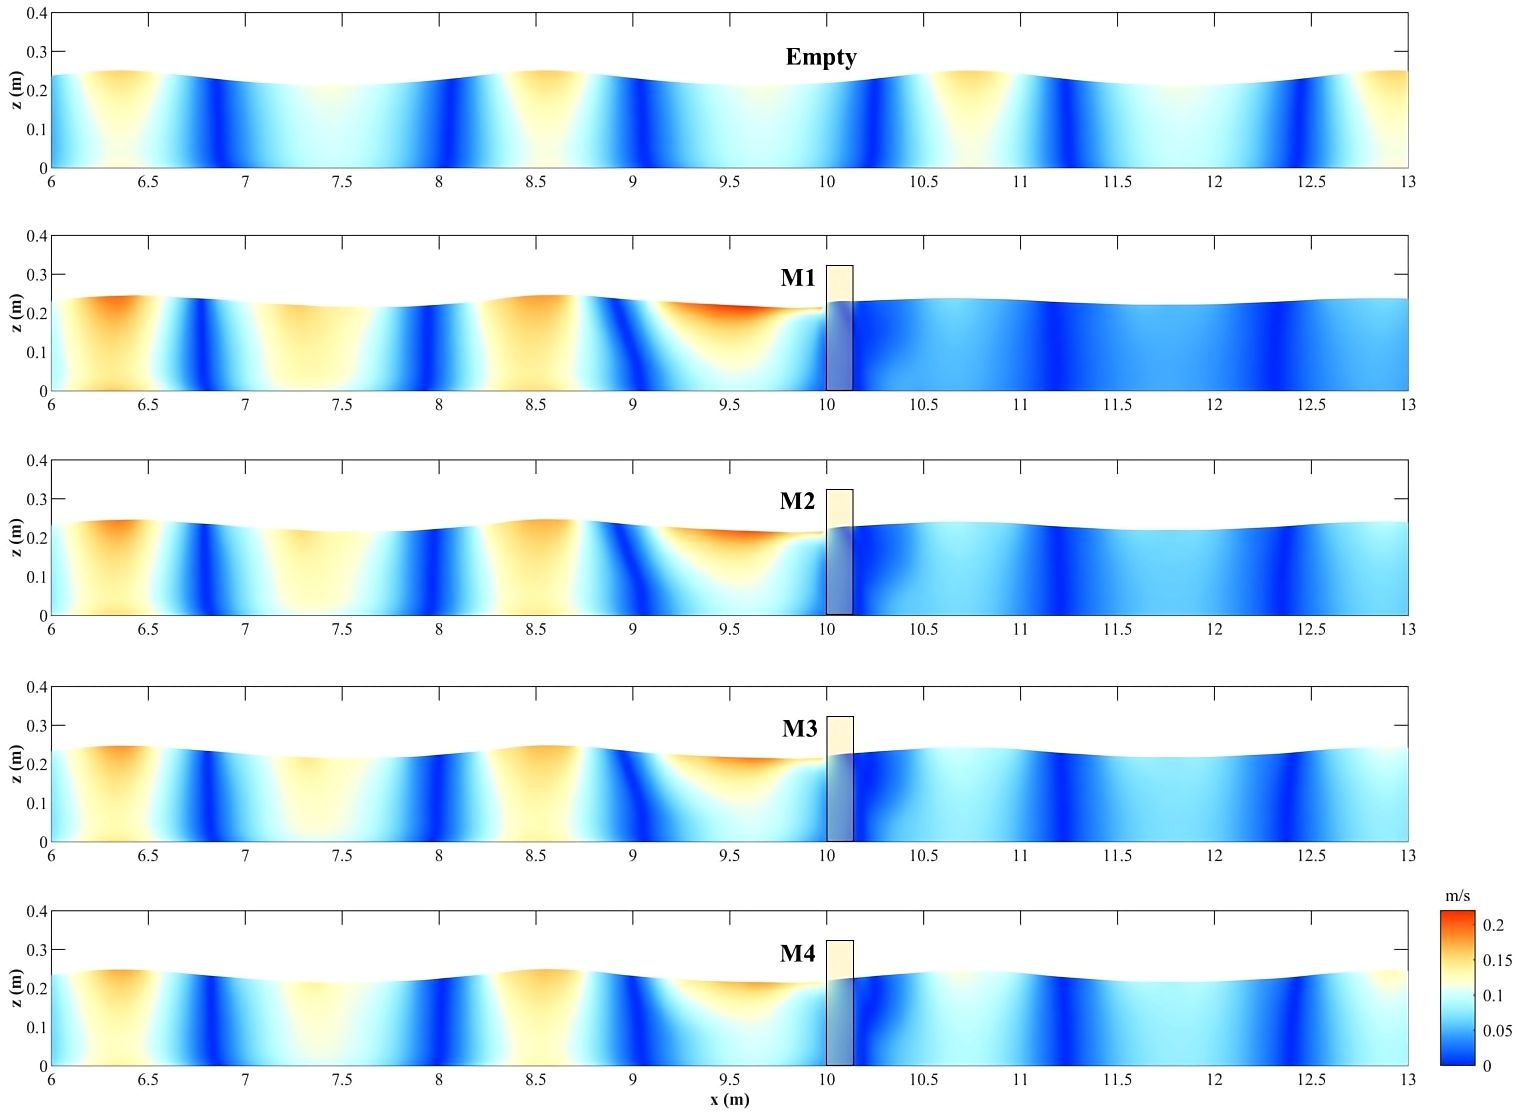
Figure 16 Velocity magnitude distribution around the fences with the different porosities (d = 0.25 m, Hi= 0.04 m, Tp= 1.50 s). (A) Blank; (B) M1; (C) M2; (D) M3; (E) M4.
In the absence of a fence, due to the periodic characteristics of wave motion, the maximum bottom velocities at different points on the bed are the same, and the fluctuations in the curve depend on the sampling frequency set in the model. With the introduction of a fence, the distribution of the maximum bottom velocities shows different patterns when segmented by the fence (Figure 17). Behind the fence, the maximum bottom velocities for all fence configurations are lower than those of the empty group, and in the area near the back of the fence, there is a localized increase in the maximum bottom velocity. With decreasing porosity, the difference in the maximum bottom velocity behind the fence between the fence and empty groups gradually increases. For fence M1, the reduction in the maximum bottom velocity behind the fence is greater than 50% relative to the empty group, while for fence M4 with the highest porosity, the reduction is approximately 25%. However, in front of the fence, influenced by the reflected waves, the distribution of the maximum bottom velocities exhibits a pattern similar to that of standing waves. The maximum bottom velocities at the nodes are significantly lower than those of the empty group, while at the antinodes, the maximum bottom velocities are significantly higher. The locations of the maximum values in all regions cover approximately one-third of the incident wavelength from the front of the fence, indicating that this position experiences the most severe bed erosion. Additionally, with decreasing porosity of the fence, the difference in the distribution of the maximum bottom velocity in the front region becomes more significant relative to the empty group, with an expansion of the extreme values of the maximum bottom velocity. For fence M1, the higher value of the maximum bottom velocity in the front region increases by approximately 50% relative to the empty group.
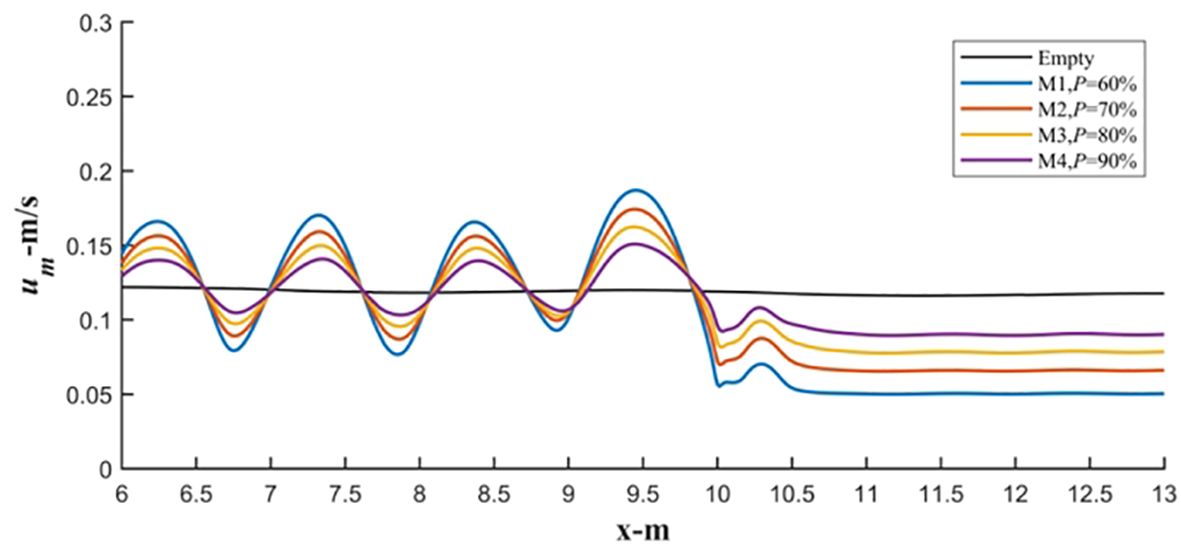
Figure 17 Maximum bottom flow velocity distribution around the fences with the different porosities (d = 0.25 m, Hi= 0.04 m, Tp= 1.50 s).
Considering fence M2 with a porosity of 70% as an example, under consistent-wave height and constant-wave period conditions (Hi= 0.04 m, Tp = 1.50 s), the distribution of the flow velocity magnitude at a specific moment in the front and rear sections (x = 6–13 m) of the fence under different water depths can be observed. Notably, the increase in the water depth exerts a negligible impact on the flow velocity distributions in front of and behind the fence. The flow velocity magnitudes in front of and behind the fence slightly decrease (Figure 18). Combined with the statistical results for wave transmission and reflection coefficients mentioned earlier, it is found that the influence of the water depth on wave transmission through the fence is far less significant relative to the effects of the incident wave period and wave height.
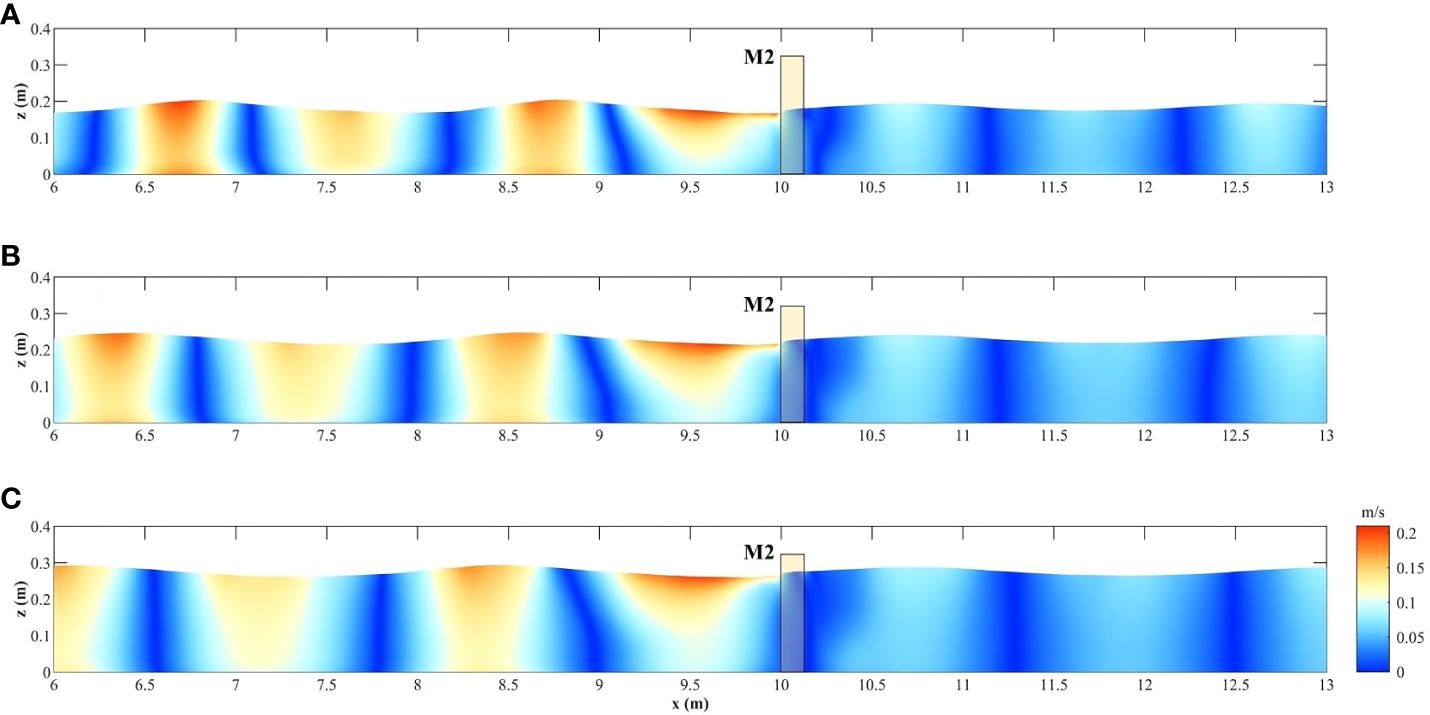
Figure 18 Velocity magnitude distribution around fence M2 under the different water depths (A) d = 0.20 m (B) d = 0.25 m (C) d = 0.30 m.
With the period remaining constant, increasing the water depth leads to an increase in the wavelengths of the incident and reflected waves. This, in turn, causes a change in the position of the higher value of the maximum bottom velocity in the front section of the fence, which still remains within approximately a third of the incident wavelength from the fence (Figure 19). Furthermore, increasing the water depth causes a reduction in the maximum bottom velocity in the front section of the fence. For example, under conditions of d = 0.30 m, the peak value of the maximum bottom velocity is approximately 30% lower than that at d = 0.20 m. This indicates that under shallow water conditions, wave-induced bed erosion in front of the fence increases. However, at the rear of the fence, the increase in the water depth does not significantly affect the fence’s wave transmission coefficient. Therefore, the differences in the distribution of the maximum bottom velocity behind the fence under the three water depth conditions are not significant.
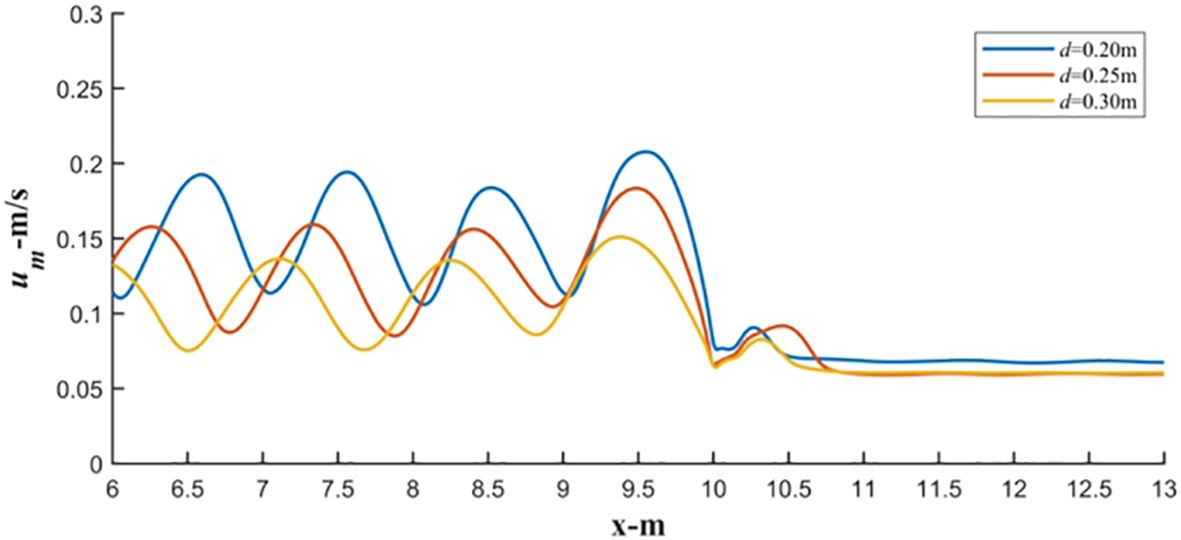
Figure 19 Maximum bottom flow velocity distribution around fence M2 under the different water depths (Hi= 0.04 m, Tp= 1.50 s).
Compared to the water depth, the wave height exerts a more pronounced impact on the flow velocity distributions in front of and behind the fence. In identical water depth and period settings (d = 0.30 m, Tp = 1.50 s), although growth in the wave height leads to a decline in the wave transmission coefficient of the fence, the transmitted wave height still increases, resulting in an increase in the flow velocity magnitude in layers behind the fence (Figure 20). Additionally, a rise in the height of the incident wave leads to a significant increase in the reflected wave height, causing a more significant superposition of incident and reflected waves in front of the fence, manifested as a significant increase in the flow velocity in the flow layers.
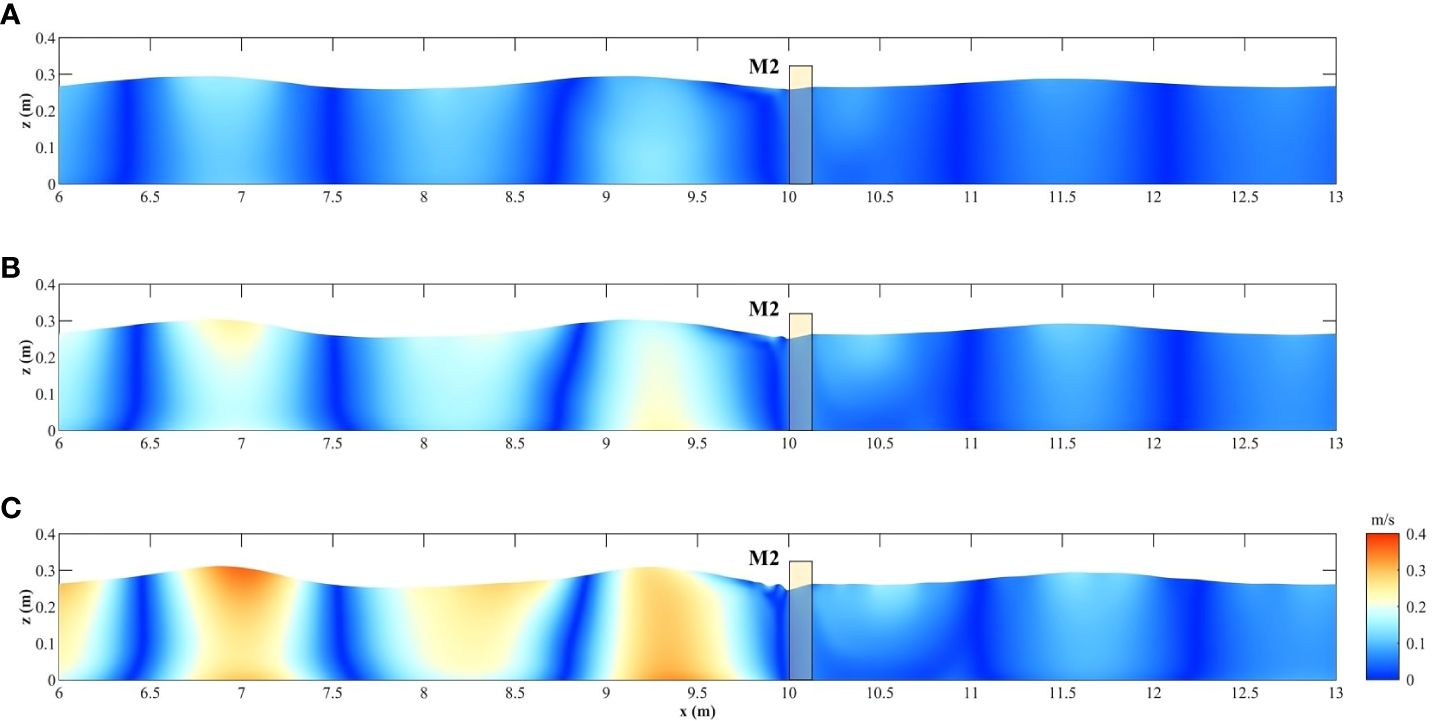
Figure 20 Velocity magnitude distribution around fence M2 under the different wave heights (A) Hi= 0.04 m (B) Hi= 0.06 m (C) Hi= 0.08 m.
With increasing the incident wave height, there is no change in the relative position of the extreme values in the distribution of the maximum bottom velocity in front of the fence. However, an increase in the incident wave height results in a significant increase in the maximum bottom velocity in the front section. For Hi = 0.08 m, the highest maximum bottom velocity in front of the fence is approximately 130% higher than that for Hi = 0.04 m. Additionally, due to the increase in the transmitted wave height with increasing incident wave height, there is a certain increase in the maximum bottom velocity behind the fence. For Hi = 0.08 m, the highest maximum bottom velocity behind the fence is approximately 70% higher than that for Hi = 0.04 m. The changes in the distributions of the maximum bottom velocities in front of and behind the fence with increasing incident wave height indicate that an increase in the incident wave height causes a simultaneous enhancement in the scour intensity of the bed surface in front of and, particularly, in front of the fence (Figure 21).
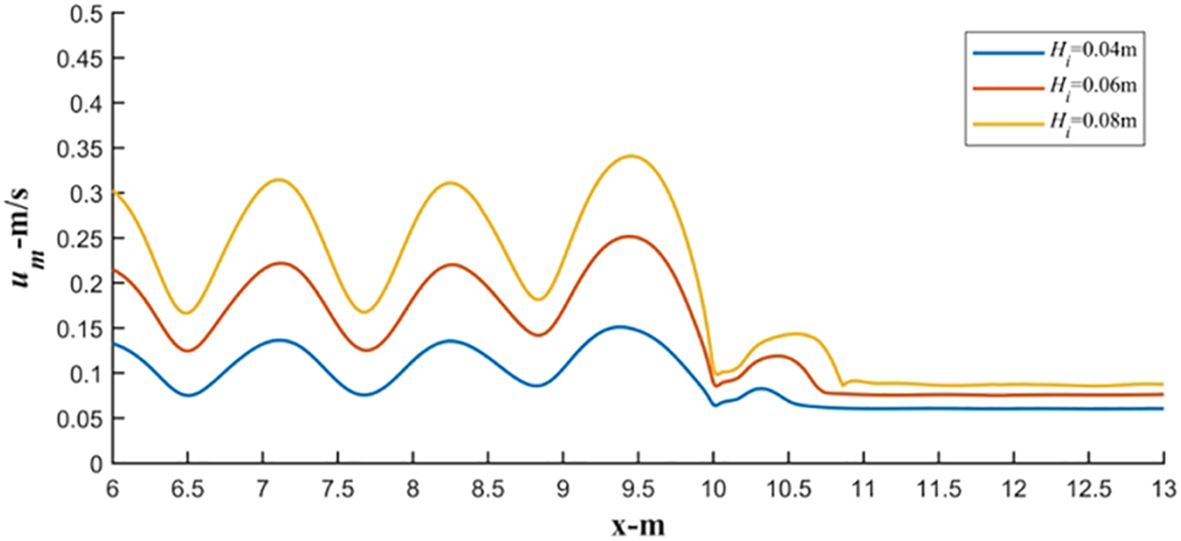
Figure 21 Maximum bottom flow velocity distribution around fence M2 under the different wave heights (d = 0.30 m, Tp= 1.50 s).
Compared to the wave height, the influence of the incident wave period on the flow velocity distributions in front of and behind the fence is less significant. Under the condition of a consistent incident wave height and water depth (d = 0.20 m, Hi = 0.04 m), with increasing wave period, the flow velocity magnitude in the front section of the fence decreases (Figure 22), while behind the fence, the flow velocity magnitude starts to increase due to the increased transmitted wave height.
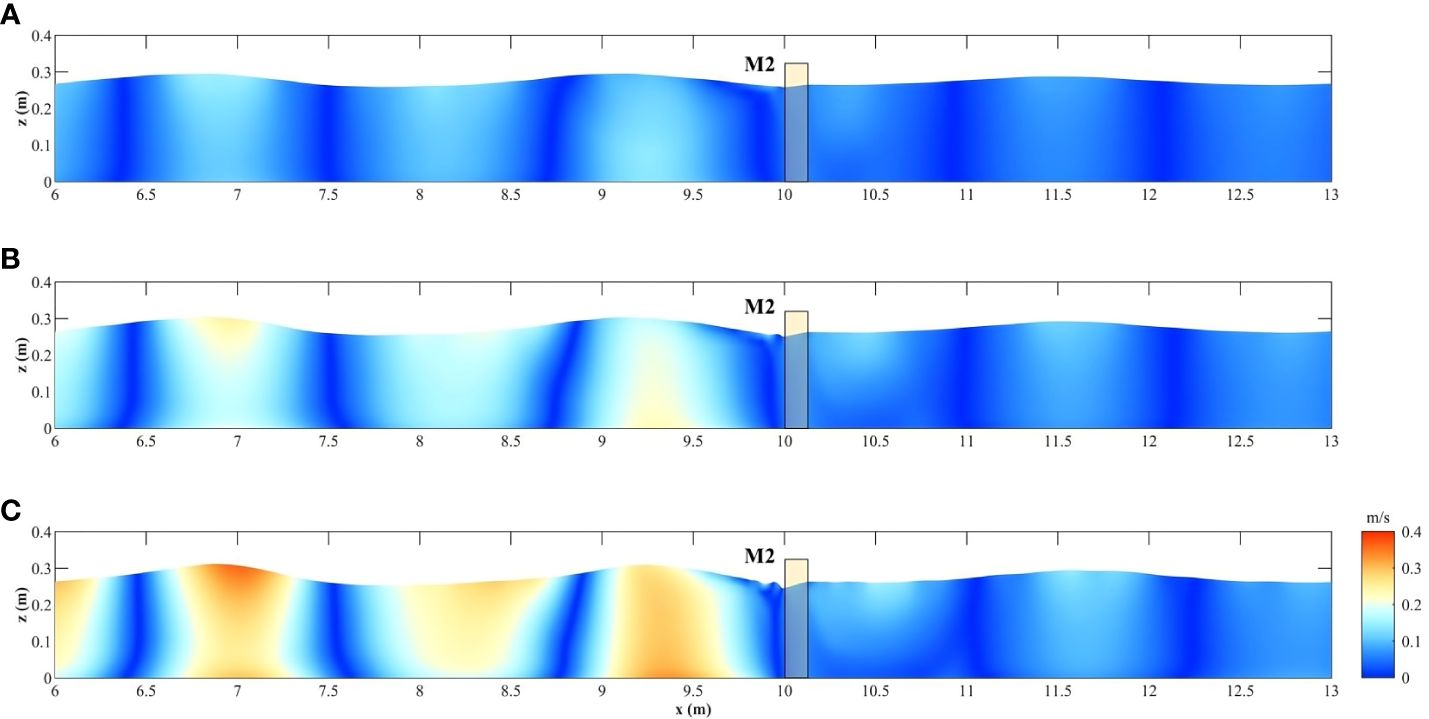
Figure 22 Velocity magnitude distribution around fence M2 under the different wave periods (A) Tp= 1.00 s (B) Tp= 1.50 s (C) Tp= 2.00 s.
In the front section of the fence, an increase in the wave period causes a change in the position of the highest maximum bottom velocity. However, the maximum value still remains relatively close in value. Due to the decrease in the reflected wave height with increasing wave period, the highest maximum bottom velocity in front of the fence does not exhibit a direct positive correlation with the incident wave period but rather follows the pattern of Tp = 1.50 s > Tp = 2.00 s > Tp = 1.00 s. Simultaneously, in the rear section of the fence, a growth in the wave period leads to an increase in the transmitted wave height, resulting in an increase in the maximum bottom velocity behind the fence. Under the condition of Tp = 2.0 s, the maximum bottom velocity behind the fence is approximately twice that under the condition of Tp = 1.0 s (Figure 23).
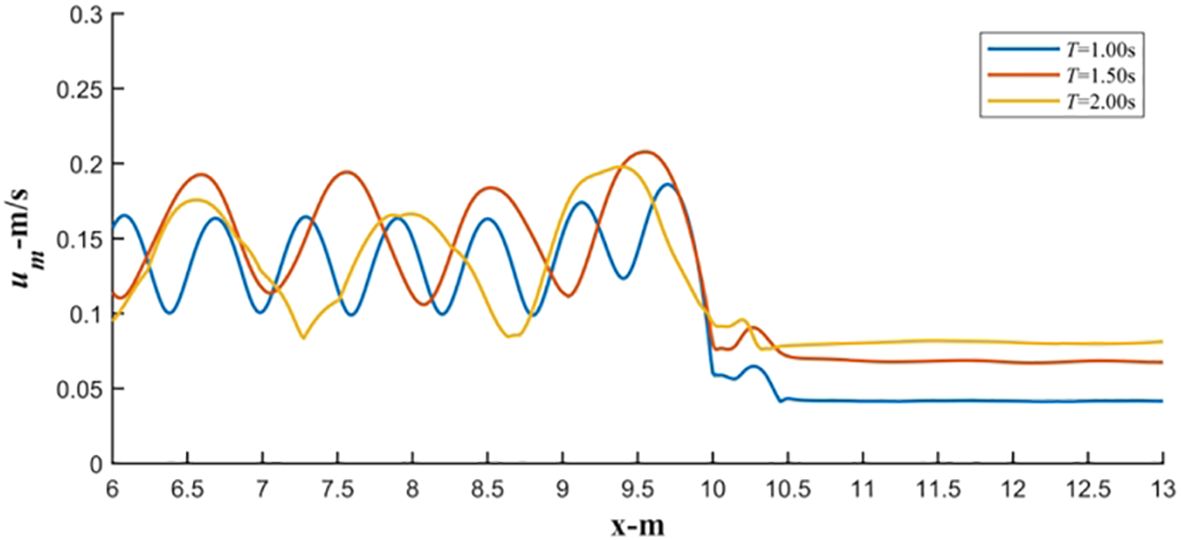
Figure 23 Maximum bottom flow velocity distribution around fence M2 under the different wave periods (d = 0.20 m, Hi= 0.04 m).
The focus of this study is wave transmission through fences with porous infill deployed for mangrove restoration. Fence models with four infill porosities were assessed under 18 sets of experimental wave conditions to investigate the factors influencing wave transmission through fences. The SWASH model was employed to calibrate the vital bulk drag coefficient parameters and simulate the flow velocity distribution around the fence under the experimental wave conditions. The main conclusions of this study are as follows:
Wave transmission through all fence models is significantly influenced by the incident wave conditions. Increasing the wave height causes a reduction in the wave transmission coefficient and causes a rise in the wave dissipation coefficient, while the effects of the water depth and wave period are the opposite. Overall, an increase in wave steepness results in a significant enhancement in the wave attenuation effects of all fences used in this experiment but imposes little impact on wave reflection. Consequently, the wave dissipation coefficient of the fences increases with increasing wave steepness. A lower infill porosity causes a decline in the wave transmission coefficient of the fences but causes a significant increase in the wave reflection intensity, which results in a limited elevation in the wave dissipation coefficient of the fences.
Based on the experimental data, the bulk drag coefficients of the fence models with the four distinct infill porosities were calibrated using the SWASH model. The calibration results indicate that the bulk drag coefficients calculated based on theoretical equations result in an overestimation of the actual bulk drag coefficients and wave dissipation effects of the fences due to the neglect of reflected energy. This phenomenon is the most pronounced when the infill porosity is lower. The validated bulk drag coefficients of the fences are positively correlated with the infill porosity and negatively correlated with the nonlinearity of the waves.
The region where the interaction between waves and fences is the most pronounced is mainly concentrated in the upper layer of water immediately adjacent to the front section of the fences, with a distinct transitional zone occurring at the fence location. A reduced infill porosity yields a significant increase in the velocity magnitude of water particles in front of the fence and, to some extent, yields a reduction in the velocity magnitude behind the fence. Simultaneously, with decreasing porosity, the maximum bottom velocity in front of the fence increases, and a distribution similar to that of standing waves emerges, with the peak position remaining at approximately one-third of the incident wave length from the fence.
The incident wave conditions also impact the flow velocity distribution characteristics around the fence. Increasing the water depth imposes an insignificant influence on the flow velocity distributions in front of and behind the fence, but it causes a significant reduction in the maximum bottom velocity in the front section. Increasing the wave height causes an increase in the flow velocity magnitude in the layers behind the fence and leads to a significant increase in the maximum bottom velocity in front of the fence. The maximum bottom velocity behind the fence also increases to some extent. Finally, an increase in the incident wave period results in a decrease in the flow velocity magnitude in the flow layers in front of the fence and causes a change in the position of the maximum bottom velocity, although the maximum values remain relatively close. It also yields an increase in the flow velocity magnitude in the rear layers and the maximum bottom velocity.
In general, the SWASH model was used to simulate the velocity distribution characteristics of four different porosity fence areas. The simulation results showed that the velocity distribution characteristics and the maximum near-bottom velocity distribution in the profile of the fence area were affected by the incident wave conditions and the porosity of the fill, and it was found that the area with the strongest wave interaction with the fence was mainly concentrated in the upper water body close to the front of the fence. Although the wave mitigation facilities with filled fences are widely used and have a significant impact on the ecological restoration process of the rear mangroves, there is still a lack of relevant research systems to compare the factors affecting the wave mitigation performance of the fences. Therefore, this study simulated the regional velocity distribution before and after the fence under the action of waves through the wave flume experiment and the numerical model. The simulation results of this study contribute to our analysis of the hydrodynamic changes caused by varying porosity in barrier-filled zones. This aids in better determining the suitable porosity of fill materials for engineering applications. It is beneficial to further analyze the environmental effects of the wave prevention fence in the future, including the sediment initiation characteristics in the rear area of the fence and the influence on the growth of mangrove seedlings in the rear, so as to provide a theoretical supplement to the results of the flume experiment and the restoration effect of mangrove seedlings under realistic conditions.
The original contributions presented in the study are included in the article, further inquiries can be directed to the corresponding authors.
AS: Conceptualization, Supervision, Writing – review & editing. ZZ: Data curation, Investigation, Methodology, Writing – review & editing, Writing – original draft. BC: Funding acquisition, Resources, Supervision, Writing – review & editing. YZ: Writing – original draft. XZ: Data curation, Formal Analysis, Writing – review & editing. CP: Data curation, Formal Analysis, Writing – review & editing. FZ: Writing – review & editing. HC: Writing – review & editing.
The author(s) declare financial support was received for the research, authorship, and/or publication of this article. This work was supported by the Key Project of National Natural Science Foundation of China (U2243208, 42330705, U1901212) and the National Natural Science Foundation of China (Grant No. 52039001).
Author YZ is employed by the company T. Y. Lin International Engineering Consulting China Co. Ltd. Author FZ was employed by the company PowerChina ZhongNan Engineering Corporation Limited.
The remaining authors declare that the research was conducted in the absence of any commercial or financial relationships that could be construed as a potential conflict of interest.
All claims expressed in this article are solely those of the authors and do not necessarily represent those of their affiliated organizations, or those of the publisher, the editors and the reviewers. Any product that may be evaluated in this article, or claim that may be made by its manufacturer, is not guaranteed or endorsed by the publisher.
Albers T., Dinh C. S., Klaus S. (2013). Shoreline management guidelines -coastal protection in the lower mekong delta (Vietnam: Deutsche Gesellschaft für Internationale Zusammenarbeit (GIZ) GmbH).
Albers T., Schmitt K. (2015). Dyke design, floodplain restoration and mangrove co-management as parts of an area coastal protection strategy for the mud coasts of the Mekong Delta, Vietnam. Wetlands Ecol. Manage. 23, 991–1004. doi: 10.1007/s11273-015-9441-3
Albers T., Von Lieberman N. (2011). Management of natural resources in the coastal zone of soc trang province-current and erosion modelling survey (Vietnam: Deutsche Gesellschaft für Internationale Zusammenarbeit (GIZ) GmbH).
Armono H. D., Bromo B. H., Sholihin, Sujantoko (2021). Numerical study of bamboo breakwater for wave reduction. Fluids 7, 14. doi: 10.3390/fluids7010014
Atwood T. B., Connolly R. M., Almahasheer H., et al. (2017). Global patterns in mangrove soil carbon stocks and losses. Nat. Climate Change 7 (7), 523–528. doi: 10.1038/nclimate3326
Augustin L. N., Irish J. L., Lynett P. (2009). Laboratory and numerical studies of wave damping by emergent and near-emergent wetland vegetation. Coast. Eng. 56, 332–340. doi: 10.1016/j.coastaleng.2008.09.004
Balke T., Bouma T. J., Horstman E. M., Webb E. L., Erftemeijer P. L., Herman P. M. (2011). Windows of opportunity: thresholds to mangrove seedling establishment on tidal flats. Mar. Ecol. Prog. Ser. 440, 1–9. doi: 10.3354/meps09364
Dao H. T., Hofland B., Stive M. J. F., Mai T. (2020). Experimental assessment of the flow resistance of coastal wooden fences. Water 12, 1910. doi: 10.3390/w12071910
Dao T., Stive M. J. F., Hofland B., Mai T. (2018). Wave Damping due to Wooden Fences along Mangrove Coasts. J. Coast. Res. 34, 1317–1327. doi: 10.2112/JCOASTRES-D-18-00015.1
Etminan A., Lowe R. J., Ghisalberti M. (2019). Canopy resistance on oscillatory flows. Coast. Eng. 152, 103502. doi: 10.1016/j.coastaleng.2019.04.014
Gabreil E., Wu H., Chen C., Li J., Rubinato M., Zheng X., et al. (2022). Three-dimensional smoothed particle hydrodynamics modeling of near-shore current flows over rough topographic surface. Front. Mar. Sci. 9. doi: 10.3389/fmars.2022.935098
Gijón Mancheño A., Jansen W., Uijttewaal W. S. J., Reniers A. J. H. M., van Rooijen A. A., Suzuki T., et al. (2021). Wave transmission and drag coefficients through dense cylinder arrays: Implications for designing structures for mangrove restoration. Ecol. Eng. 165, 106231. doi: 10.1016/j.ecoleng.2021.106231
Goda Y., Suzuki T. (1976). Estimation of incident and reflected waves in random wave experiments. Coast. Eng. Proc. 1, 828–845. doi: 10.9753/icce.v15.47
Harris L., Liang D., Shao S., Zhang T., Roberts G. (2021). MPM simulation of solitary wave run-up on permeable boundaries. Appl. Ocean Res. 111, 102602. doi: 10.1016/j.apor.2021.102602
Jansen W. (2019). Wave dissipation in a permeable structure: Experimental research on the physical processes causing energy dissipation inside an array of cylinders (Delft University of Technology).
Kazemi E., Tait S., Shao S. (2019). SPH-based numerical treatment of the interfacial interaction of flow with porous media. Int. J. Numerical Methods Fluids 92, 219–245. doi: 10.1002/fld.4781
Mai Van C., Ngo A., Mai T., Dao H. T. (2021). Bamboo Fences as a Nature-Based Measure for Coastal Wetland Protection in Vietnam. Front. Mar. Sci. 8, 756597. doi: 10.3389/fmars.2021.756597
Mendez F. J., Losada I. J. (2004). An empirical model to estimate the propagation of random breaking and nonbreaking waves over vegetation fields. Coast. Eng. 51, 103–118. doi: 10.1016/j.coastaleng.2003.11.003
Murray N. J., Phinn S. R., Dewitt M., et al. (2019). The global distribution and trajectory of tidal flats. Nature 565 (7738), 222–225. doi: 10.1038/s41586-018-0805-8
Shao S. (2005). SPH simulation of solitary wave interaction with a curtain-type breakwater. J. Hydraulic Res. 43, 366–375. doi: 10.1080/00221680509500132
Suzuki T., Hu Z., Kumada K., Phan L. K., Zijlema M. (2019). Non-hydrostatic modeling of drag, inertia and porous effects in wave propagation over dense vegetation fields. Coast. Eng. 149, 49–64. doi: 10.1016/j.coastaleng.2019.03.011
Thieu Quanga T., Mai Trong L. (2020). Monsoon wave transmission at bamboo fences protecting mangroves in the lower mekong delta. Appl. Ocean Res. 101, 102259. doi: 10.1016/j.apor.2020.102259
Van Cuong C., Brown S., To H. H., Hockings M. (2015). Using Melaleuca fences as soft coastal engineering for mangrove restoration in Kien Giang, Vietnam. Ecol. Eng. 81, 256–265. doi: 10.1016/j.ecoleng.2015.04.031
van Wesenbeeck B. K., Wolters G., Antolinez J. A. A., Kalloe S. A., Hofland B., de Boer W. P., et al. (2022). Wave attenuation through forests under extreme conditions. Sci. Rep. 12, 1884. doi: 10.1038/s41598–022-05753–3
Winterwerp J. C., Erftemeijer P. L. A., Suryadiputra N., van Eijk P., Zhang L. Q. (2013). Defining eco-morphodynamic requirements for rehabilitating eroding mangrove-mud coasts. Wetlands 33, 515–526. doi: 10.1007/s13157-013-0409-x
Keywords: mangroves, mangrove restoration, wooden fence, wave transmission, numerical modeling, physical modeling
Citation: Shu A, Zhang Z, Cui B, Zhuo Y, Zhang X, Pi C, Zhu F and Christian H (2024) Numerical modeling of bamboo fences with various infill porosities deployed for mangrove restoration. Front. Mar. Sci. 11:1317570. doi: 10.3389/fmars.2024.1317570
Received: 10 October 2023; Accepted: 09 May 2024;
Published: 12 June 2024.
Edited by:
Shunqi Pan, Cardiff University, United KingdomReviewed by:
Songdong Shao, Dongguan University of Technology, ChinaCopyright © 2024 Shu, Zhang, Cui, Zhuo, Zhang, Pi, Zhu and Christian. This is an open-access article distributed under the terms of the Creative Commons Attribution License (CC BY). The use, distribution or reproduction in other forums is permitted, provided the original author(s) and the copyright owner(s) are credited and that the original publication in this journal is cited, in accordance with accepted academic practice. No use, distribution or reproduction is permitted which does not comply with these terms.
*Correspondence: Anping Shu, c2h1YXBAYm51LmVkdS5jbg==; Ziru Zhang, MjAyMTIxMTgwMTAyQG1haWwuYm51LmVkdS5jbg==
Disclaimer: All claims expressed in this article are solely those of the authors and do not necessarily represent those of their affiliated organizations, or those of the publisher, the editors and the reviewers. Any product that may be evaluated in this article or claim that may be made by its manufacturer is not guaranteed or endorsed by the publisher.
Research integrity at Frontiers
Learn more about the work of our research integrity team to safeguard the quality of each article we publish.