
94% of researchers rate our articles as excellent or good
Learn more about the work of our research integrity team to safeguard the quality of each article we publish.
Find out more
ORIGINAL RESEARCH article
Front. Mar. Sci., 02 February 2024
Sec. Global Change and the Future Ocean
Volume 11 - 2024 | https://doi.org/10.3389/fmars.2024.1293955
 Stephen R. Pacella1*
 Cheryl A. Brown1
 James E. Kaldy1
 Rochelle G. Labiosa2
 Burke Hales3T Chris Mochon Collura1George G. Waldbusser3
The impacts of ocean acidification (OA) on coastal water quality have been subject to intensive research in the past decade, but how emissions-driven OA combines with human modifications of coastal river inputs to affect estuarine acidification dynamics is less well understood. This study presents a methodology for quantifying the synergistic water quality impacts of OA and riverine acidification on biologically-relevant timescales through a case study from a small, temperate estuary influenced by coastal upwelling and watershed development. We characterized the dynamics and drivers of carbonate chemistry in Tillamook Bay, OR (USA), along with its coastal ocean and riverine end-members, through a series of synoptic samplings and continuous water quality monitoring from July 2017 to July 2018. Synoptic river sampling showed acidification and increased CO2 content in areas with higher proportions of watershed anthropogenic land use. We propagated the impacts of 1). the observed riverine acidification, and 2). modeled OA changes to incoming coastal ocean waters across the full estuarine salinity spectrum and quantified changes in estuarine carbonate chemistry at a 15-minute temporal resolution. The largest magnitude of acidification (-1.4 pHT units) was found in oligo- and mesohaline portions of the estuary due to the poor buffering characteristics of these waters, and was primarily driven by acidified riverine inputs. Despite this, emissions-driven OA is responsible for over 94% of anthropogenic carbon loading to Tillamook Bay and the dominant driver of acidification across most of the estuary due to its large tidal prism and relatively small river discharges. This dominance of ocean-sourced anthropogenic carbon challenges the efficacy of local management actions to ameliorate estuarine acidification impacts. Despite the relatively large acidification effects experienced in Tillamook Bay (-0.16 to -0.23 pHT units) as compared with typical open ocean change (approximately -0.1 pHT units), observations of estuarine pHT would meet existing state standards for pHT. Our analytical framework addresses pressing needs for water quality assessment and coastal resilience strategies to differentiate the impacts of anthropogenic acidification from natural variability in dynamic estuarine systems.
Coastal acidification is broadly defined as the lowering of pH and carbonate mineral saturation states in coastal waters resulting from human activities, including fossil fuel combustion, land use change, and eutrophication (Kelly et al., 2011; Cai et al., 2021). The combined effects of these activities in the coastal zone can amplify acidification (Cai et al., 2011; Waldbusser et al., 2011; Cai et al., 2021), while reduced buffering capacities of estuarine waters (Egleston et al., 2010) result in acidification rates which can outpace those of the open ocean (Provoost et al., 2010; Carstensen et al., 2018; Cai et al., 2021). Coastal acidification can harm coastal organisms through physiological and behavioral mechanisms (e.g. Gazeau et al., 2013; Busch and McElhany, 2016; Bednarsek et al., 2019) and result in negative impacts to aquaculture (Barton et al., 2015) and alter the structure and function of coastal food webs (Ainsworth et al., 2011; Busch et al., 2013; Marshall et al., 2017). The many acidification mechanisms in estuarine systems provide both challenges and opportunities for local management options (Kelly et al., 2011). Developing effective management strategies and evaluating decision tradeoffs to address coastal acidification will require the ability to attribute and quantify the mechanisms controlling acidification rates (Strong et al., 2014). Differentiating the anthropogenic impacts of acidification from naturally acidic or corrosive conditions can be challenging in biophysically dynamic coastal systems, but methodologies capable of this are necessary for water quality managers to conduct assessments and establish background conditions (e.g., State of Oregon Department of Environmental Quality, 2023).
There remains a need to better characterize how anthropogenic alterations to the chemistry of freshwaters delivered to the coastal zone interact with acidified ocean waters (Li et al., 2023), which has been recently highlighted in studies of freshwater salinization syndrome in the United States (Kaushal et al., 2017). Watershed delivery of alkalinity and inorganic carbon is known to modulate coastal pHT and CaCO3 saturation states (Kaushal et al., 2017; Van Dam and Wang, 2019; Cai et al., 2021), but there have been limited studies which quantify the magnitude and timing of these watershed effects on coastal acidification and water quality degradation (Raymond and Hamilton, 2018). Anthropogenic changes to watersheds and the resultant changes to riverine chemistry can lead to eutrophication-enhanced coastal acidification (Cai et al., 2011; Hu et al., 2015; Laurent et al., 2018), but can also drive long-term coastal basification due to enhanced riverine alkalinity delivery (Kaushal et al., 2017) and primary production (Borges and Gypens, 2010; Duarte et al., 2013). To date, there is no agreed-upon methodology for predicting how urbanization, agricultural development, climate change, and other human activities alter riverine chemistry and interact with acidified ocean waters in coastal and estuarine habitats.
This study used synoptic sampling and continuous water quality monitoring data to characterize the estuarine water quality impacts of both anthropogenic CO2 emissions-driven ocean acidification (OA) and anthropogenic impacts to riverine waters delivered to Tillamook Bay, Oregon (USA), a small open-coast estuary in the northern California Current Large Marine Ecosystem. Acidification research in California Current estuaries has focused on the dominance of high CO2 upwelled water in these systems, and limited information is available on how human land use change in coastal watersheds have altered the typically poorly-buffered carbonate systems of small mountainous rivers discharging to these estuaries. Tillamook Bay is subject to coastal upwelling, receives riverine discharges from watersheds which have been modified by agriculture and silviculture (Shanks et al., 2006), provides critical habitat for commercial shellfish aquaculture operations (Tillamook Estuaries Partnership, 2015) and is considered an estuary of national significance as part of the US Environmental Protection Agency’s National Estuary Program. The estuary’s history of bacterial contamination and hypoxia issues resulting from watershed activities (Sullivan et al., 2005) and exposure to naturally high CO2, low pH ocean waters due to coastal upwelling, made the estuary an ideal system to investigate both ocean- and land-based drivers of acidification.
Tillamook Bay is a shallow (~2 m average depth), relatively small (38 km2) drowned river mouth estuary on the coast of Oregon, USA with a watershed:estuary ratio of 36.6 (Bricker et al., 2007). Strong tidal forcing [mean tidal volume is 1.23 x 10⁸ m3 d-1; [(Shirzad et al., 1988)], shallow depth, and 1.7 m tidal range result in flushing times on the order of one day to a few weeks, depending on tides and season (Colbert and McManus, 2003; Bricker et al., 2007). The coastal ocean end-member is subject to seasonal upwelling typical of the California Current system, with summers characterized by delivery of cold, salty, high CO2, high nutrient, low pH, low dissolved oxygen oceanic waters (Feely et al., 2016), and winters characterized by downwelling and flashy river inputs (Wheatcroft et al., 2013). There are five rivers draining into the estuary: the Miami, Kilchis, Wilson, Trask, and Tillamook rivers in order from north to south (Figure 1). Their combined annual average discharge is ~7.6 x 10⁶ m3 d-1, with a greater than 2 orders of magnitude difference between wet winter and dry summer months. The watersheds of all five rivers lie in the Oregon Coast Range and drain similar geologic features consisting of Tertiary marine sediments and volcanic rocks (Komar et al., 2004). Land use in the watersheds is subject to human activities via managed forest lands and commercial timber harvest in the upper watersheds, and agricultural activity primarily in support of dairy farming in the lower watersheds. Land cover within the Tillamook Bay watershed is classified as 2% open water, 6% developed, 70% forest, 15% shrub/scrub and grassland/herbaceous, 3% pasture/hay,<1% cultivated crops, and 3% wetlands (https://www.mrlc.gov/data/nlcd-2016-land-cover-conus; Table 1). Most of the agricultural and developed areas are within the lower watersheds of the Wilson, Kilchis, Trask, and Tillamook Rivers, while the Miami River watershed contains relatively little agricultural land cover and is primarily forested.
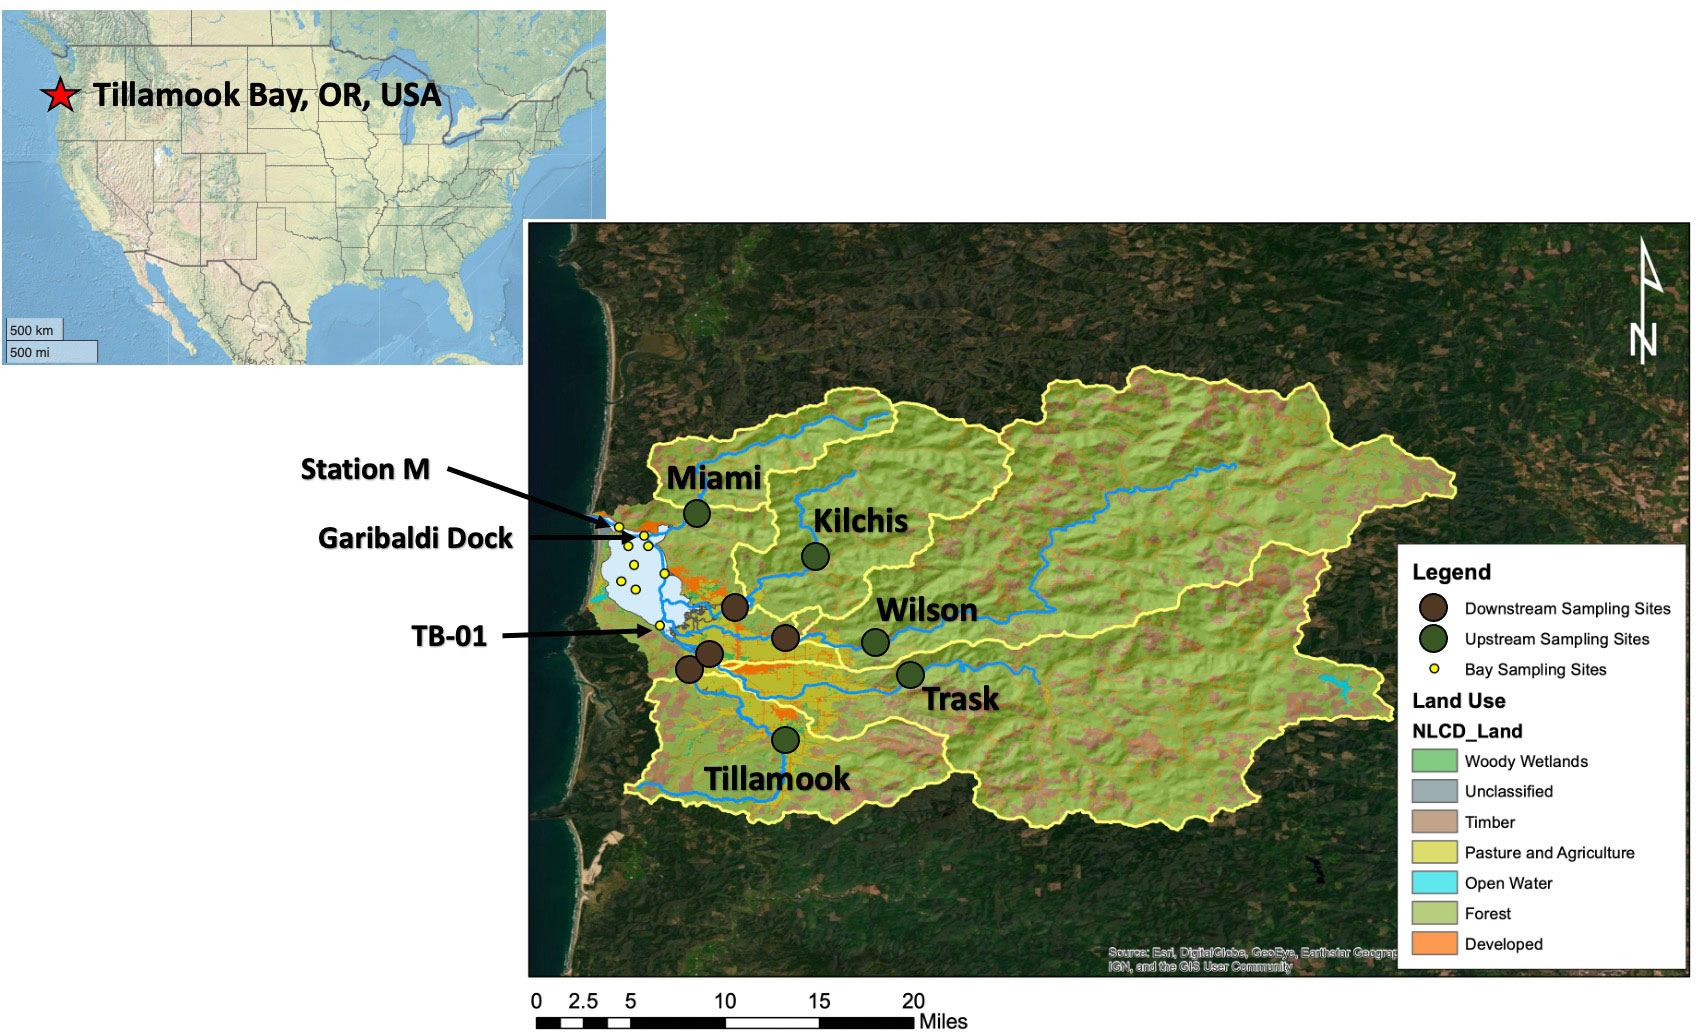
Figure 1 Map of the Tillamook Bay, OR study area. The Tillamook Bay watershed is highlighted, with each river’s sub-watersheds denoted by the yellow boundaries. Watershed land use types are from the National Land Cover Database and color-coded as indicated in the legend. Synoptic sampling stations are indicated by yellow (bay sites), green (upriver sites), and brown (downriver sites) circles. The five major rivers entering the estuary are indicated by blue lines. Garibaldi Dock and TB-01 water quality monitoring stations, as well as the inlet station “M”, are indicated by arrows.
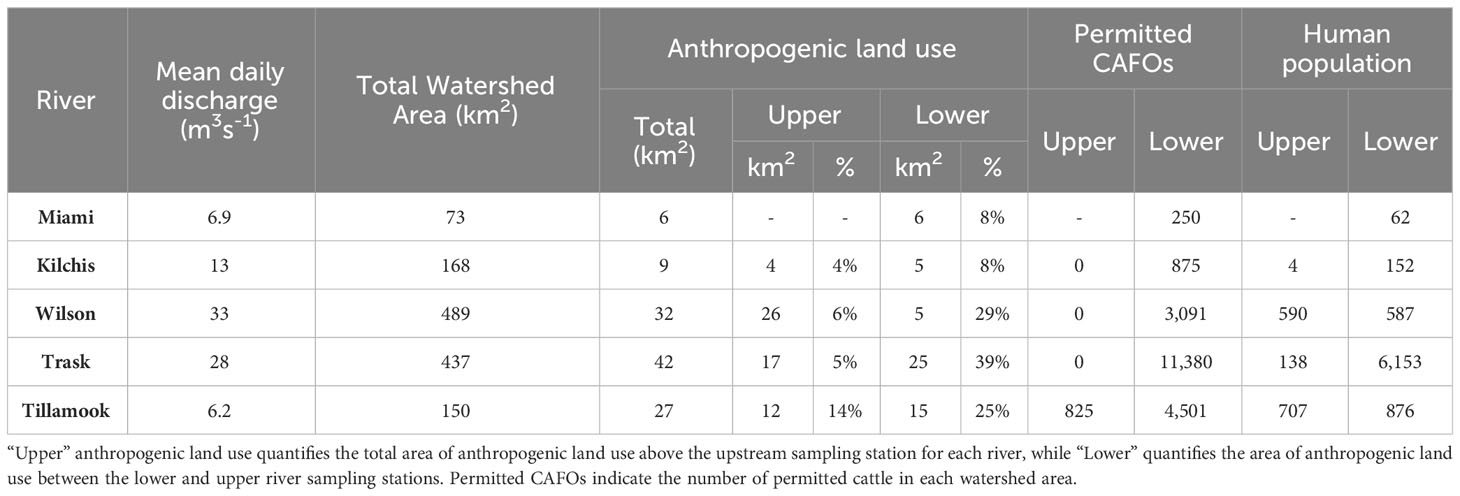
Table 1 Watershed characteristics of river systems discharging to the Tillamook Bay, OR.
Tillamook Bay is Oregon’s largest commercial Pacific Oyster (Crassostrea gigas) producer by area and value, and provides juvenile habitat for salmon and steelhead (Tillamook Estuaries Partnership, 2015). The upper estuary has a history of bacterial contamination and hypoxia issues resulting from a combination of wastewater treatment plant discharge, agricultural runoff, septic system discharge, and direct animal inputs (Sullivan et al., 2005).
Ten synoptic water quality surveys were conducted in Tillamook Bay and its watershed approximately monthly from July 2017 through July 2018 across eight estuary stations, one coastal ocean/inlet site, and 9 riverine sites both above and below areas with significant agricultural land uses (Figure 1). The inlet station (“M”) was sampled to collect incoming coastal ocean waters on flood tides and was used as the coastal ocean end-member. The upriver sampling stations were located in forested sections of the watersheds and selected to minimize urban and agricultural influence upriver of these sites. Downriver sampling stations were in areas of urban and agricultural land use and as far downstream as possible to sample all stations in a single day without tidal salt intrusion. The Miami River was sampled at only one downriver station as the watershed is primarily forested and previous pilot work had shown minimal downriver gradients in water chemistry. For all seasonal analyses, the dry season included surveys conducted from May – September, and the wet season included surveys from October – April.
Water samples at all stations were collected with Niskin (estuary stations) or Van-Dorn (river stations) gas-tight water sampling devices. Water was sampled from ~1 m depth at all estuary stations except for the inlet station, which was sampled at ~5-m depth and always below any observed surface stratification. A YSI 6000 series sonde was used to measure in-situ salinity, temperature, pHNBS (at in-situ temperature), dissolved oxygen, and depth of the sample waters at each station. Sample water for CO2 analysis was transferred to triplicate 330-mL amber glass bottles using best-practices for dissolved gas sampling (e.g. Riebesell et al., 2010), immediately poisoned with 30-µL of a saturated mercuric chloride solution, and sealed with urethane-lined crimp sealed metal caps (Hales et al., 2017). Water for nitrate (NO3-) analysis was filtered through a pre-rinsed 0.4µm capsule filter, collected in triplicate polyethylene centrifuge tubes, stored on ice in the field, and frozen within 12 hours of collection. NO3- concentrations were colorimetrically determined by flow injection analysis at the Marine Chemistry Laboratory at the University of Washington, WA, USA. Analysis of paired partial pressure of CO2 (pCO2) and dissolved inorganic carbon (DIC) for water samples was conducted at Oregon State University in the laboratory of Burke Hales using non-dispersive infrared absorption, as described by Hales et al. (2004) and Bandstra et al. (2006). The full carbonate system [including alkalinity (Alk), pHT and aragonite saturation state (Ωarag)] was calculated utilizing these paired pCO2 and DIC measurements, along with in-situ salinity and temperature following procedures outlined in Hales et al. (2017). We used CO2SYS [Matlab version 3.1; Lewis and Wallace (1998)], K1 and K2 constants of Millero (2010), KSO4 constants of Dickson et al. (1990), and the borate:salinity relationship of Lee et al. (2010) for all carbonate system calculations.
The ocean end-member specific to each survey was characterized by sampling incoming flood tide waters at station M. River DIC and Alk end-members (DICfwa,down & Alkfwa,down) were calculated for each survey using observations from the downriver stations, following the flow-weighted average technique used by Colbert and McManus (2003). Mean daily river discharge for each month of the study was downloaded from the Oregon Water Resources Department Near Real Time Hydrographics Data portal (https://apps.wrd.state.or.us/apps/sw/hydro_near_real_time/). River discharge magnitude and seasonal variation during our 2017-2018 study period was similar (within 5%) to longer term 1996-2014 dynamics, making our observations generally representative of freshwater delivery to Tillamook Bay (Supplementary Figure S1). During some surveys, salt was present at the downriver stations (salinity typically<2), which made those samples unrepresentative of the true river end-member chemistry. To estimate these stations’ DIC and Alk values at zero salinity, linear regressions of salinity versus observed DIC and Alk were created with data from the ocean end-member and the downriver station for that survey. Estimated downriver DIC and Alk values for that station were extrapolated as the y-intercept of these regressions at zero salinity and used for all analyses (Supplementary Figure S2). This regression procedure was required for 8 of the 50 total downriver station sampling events.
The processes responsible for Tillamook Bay carbonate system variability were calculated using observations from the synoptic water quality surveys (Figure 2). Prior studies of estuarine carbonate system drivers have traditionally quantified departures of pH, pCO2, and Ωarag from a defined reference station, such as a coastal ocean end-member (e.g. Rheuban et al., 2019). Due to strong tidal forcing and short water residence times in Tillamook Bay we created a reference estuarine mixing line (REML) using average observed ocean and flow-weighted average river end-member DIC (DICocean, ref), Alk (Alkocean,ref), temperature (Tocean,ref), and salinity (Socean,ref) from all synoptic surveys. The REML for DIC and Alk were calculated as:
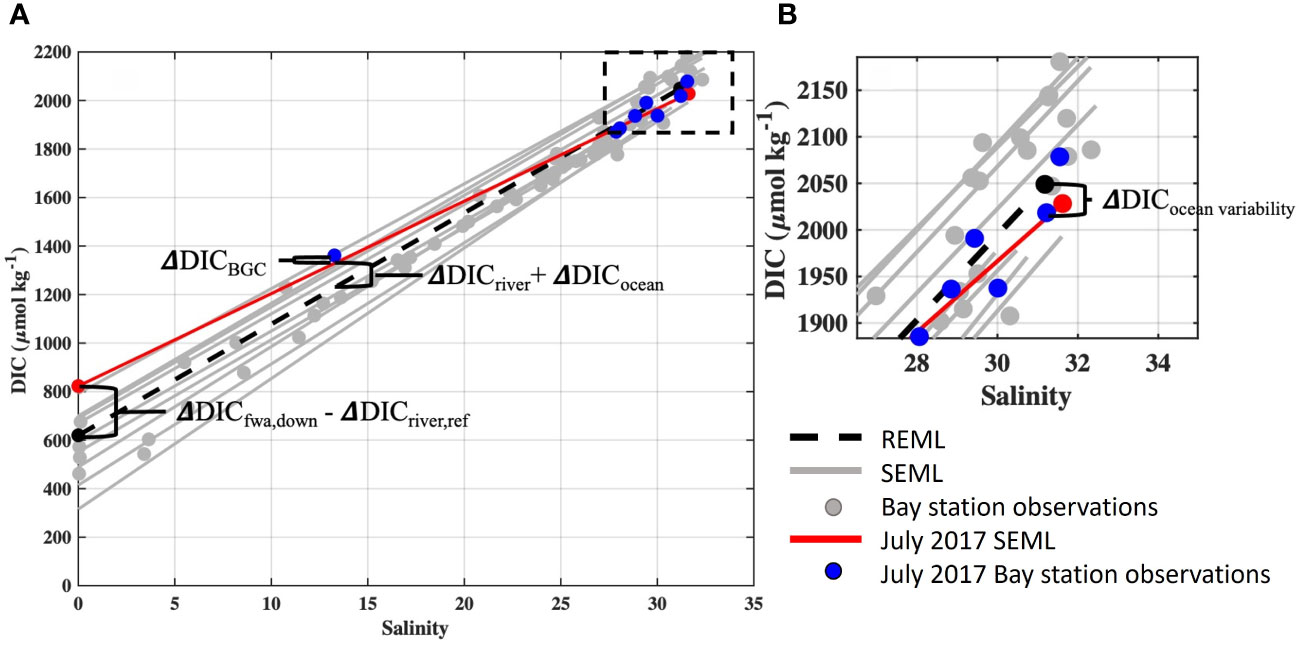
Figure 2 Tillamook Bay estuarine mixing lines for DIC observations. (A). The reference estuarine mixing line (REML) is indicated by black dotted line, synoptic survey-specific estuarine mixing lines (SEML) for all surveys are shown in grey, bay synoptic observations are shown by grey circles, and data for the July 7, 2017 cruise’s SEML (red line) and bay observations (blue circles) are highlighted. Annotations illustrate calculations relevant for mechanistic modeling from Methods Section 2.3. (B). Inset displays ocean end-members of SEMLs and the REML, with the DIC variability attributable to coastal ocean end-member variability (ΔDICocean variability) indicated.
The use of a reference mixing line instead of a single reference station quantifies the role of these mechanisms in altering estuarine chemistry at the observed salinities during the synoptic surveys. This methodology also makes the calculated departures from the reference line directly comparable to estimated changes in estuarine chemistry from OA and riverine carbon enrichments at the same observed salinities.
Departures of pH, pCO2, and Ωarag from the REML were calculated for each estuary sampling station on each cruise and attributed to four primary processes: coastal ocean end-member variability, river end-member variability, thermal effects, and estuarine biogeochemical cycling. Departures were calculated using the anomalies (e.g. ΔDICocean and ΔAlkocean) between observed and reference values for both DIC and Alk, as described below. These anomalies were added to the observed DIC and Alk at the estuary station, and the full carbonate system was recalculated at observed temperature and salinity. Changes in pHT, pCO2, and Ωarag due to each process were found as these recalculated values minus the observed values.
The Oregon coastal ocean is affected by seasonal upwelling dynamics and known for large seasonal differences in carbonate chemistry. Changes to Tillamook Bay carbonate chemistry resulting from coastal ocean end-member variability were estimated for each survey by comparing survey-specific estuarine mixing lines (SEML) to the averaged REML for both DIC and Alk (Figure 2). The variability of coastal ocean end-member DIC and Alk were calculated as the differences between the SEML and REML at the observed salinity of Station M (SM) (Figure 2). To account for the small differences between SM and Socean,ref, we used the REML to calculate DIC and ALK of the REML at SM and used these values to represent the average ocean end-member. The differences in the survey-specific DIC (DICM) and Alk (AlkM) at station M from average ocean conditions were calculated as
where and were found by solving the reference mixing line equations at SM, and and are the variability of DIC and Alk of the coastal ocean end-member relative to average conditions. The effect of this variability was propagated to the estuary synoptic survey observations while accounting for freshwater dilution:
where is the observed salinity at each estuary survey station.
Changes to observed estuarine carbonate chemistry due to river end-member variability were estimated by calculating differences in observed DICfwa,down and Alkfwa,down for each survey from the averaged river reference value (DICriver,ref and Alkriver,ref):
The effects of warming and cooling within the estuary were found by recalculating the estuarine carbonate system at each station and for each survey using observed DIC, Alk, S, and the reference mixing line temperature at the observed salinity (i.e. Tref,Sobs). Changes in pH, pCO2, and Ωarag due to thermal effects were found as these recalculated values minus the observed values.
The impacts of local biogeochemical cycling on estuarine carbonate chemistry were estimated as the departures of DIC and Alk (ΔDICBGC and ΔAlkBGC, respectively) observed at each station from the cruise-specific conservative mixing values of DIC and Alk at the same salinity as the observations (i.e. DICcons,S and Alkcons,S):
Two water quality monitoring stations were established in July 2017; the Garibaldi Dock station in the polyhaline portion of the estuary, and the TB-01 station in the mesohaline portion of the estuary (Figure 1). Both stations consisted of a YSI 6000 series sonde sampling at a 15-minute interval for salinity, temperature, pressure, pHNBS (at in-situ temperature), and dissolved oxygen. The Garibaldi Dock station sonde was located ~1.5 m above the benthos and ranged in depth from 1.5 m to 5.9 m depending upon tidal stage, while the TB-01 station sonde was anchored ~0.2 m above the benthos and ranged in depth from 0.2 m to 3.6 m. Deployed sondes were replaced every 2 - 4 weeks with a freshly calibrated sonde, and laboratory tests were performed immediately following deployments to quantify instrument drift and identify possible fouling issues. The pH probes were calibrated using NIST standards of pHNBS 7 and 10 following manufacturer recommendations. The pHNBS readings from the sondes were converted to the Total scale (pHT) using CO2SYS v3.1, and all reported monitoring observations in this manuscript refer to these converted pHT values. The synoptic estuary water quality surveys sampled directly adjacent to both sondes during the surveys, and calculated pHT from discrete samples was used as an in-situ validation of the sondes’ pHT readings. Root mean squared error between calculated pHT from discrete bottle samples (using pCO2 and DIC) and converted YSI pHT was 0.07 (n = 7) at the Garibaldi Dock, and 0.13 (n=7) at TB-01. We note these discrepancies between the sensor data and bottle data include sampling and analytical uncertainties in addition to the uncertainty specific to the accuracy of the sensor itself.
An alkalinity-salinity regression (Supplementary Figure S3) was created using all discrete bottle samples (n = 89) from the estuary surveys with calculated alkalinity from the paired pCO2 and DIC data:
R2 = 0.989, Root mean square error = 51 μmol kg-1.
This regression was used to calculate alkalinity time series for Garibaldi Dock and TB-01 stations, and the full carbonate system was then calculated using this Alksal and observed pHT (CO2SYS Matlab version 3.1). Propagation of the uncertainties in YSI pHT (0.07 units), Alksal (51 μeq kg-1), salinity, temperature, pressure, and dissociation constants resulted in calculated pCO2 uncertainties of ~17% and calculated Ωarag uncertainties of ~14%.
We estimated the impacts of increasing atmospheric CO2 levels on anthropogenic carbon concentrations of the coastal ocean end-member (Cant) using a modified version of the ΔTCO2 method (Gruber et al., 1996; Pacella et al., 2018; Evans et al., 2019) found in Hare et al. (2020). This method estimated the ventilation age of ocean source waters to the estuary utilizing the observed apparent oxygen utilization (AOU) and assuming an oxygen utilization rate of 5 μmol O2 kg-1 yr-1 specific to North Pacific waters. The coastal ocean waters entering Tillamook Bay are subject to seasonal upwelling and are characterized by a range of water mass ventilation ages and Cant concentrations (Feely et al., 2016). The benefit of this approach is that it captures the Cant dynamics resulting from these variable water mass ventilation histories. Estuarine metabolism will also impact AOU calculations and potentially bias ventilation age estimates. Our method described below attempts to minimize this potential issue by filtering observations to only retain the densest water, with the assumption that these waters are most representative of coastal ocean waters recently advected into the estuary. We note that this technique is an inherently conservative technique for estimating ocean acidification impacts as ventilation age estimates are utilized to reduce modern atmosphere-equilibrated Cant estimates via equilibration with older, lower atmospheric CO2 levels. Biases in AOU and ventilation ages would therefore never result in overestimates of Cant as compared to modern atmosphere-equilibrated values. The anthropogenic carbon concentrations of the coastal ocean end-member were estimated using observations from the Garibaldi Dock monitoring station, given its close proximity to the estuary inlet and exposure to incoming coastal waters on flood tides, as follows:
1. Water densities were calculated for the full time series at the Garibaldi Dock using temperature and salinity. A moving 3-day window was used to identify the observed maximum water density, which was assumed to be representative of coastal ocean waters entering Tillamook Bay, and time series of the corresponding salinity, temperature, density, pH, Alksal, and O2 were created.
2. AOU was calculated at each time point for this ocean end-member time series (AOUocean) as:
where is the oxygen concentration of the waters in equilibrium with the atmosphere at observed salinities and temperatures in μmol O2 kg-1, and O2,maxdens is the observed O2 concentration at the Garibaldi Dock in μmol O2 kg-1 corresponding to the observed 3-day moving density maximum.
3. The ventilation ages of these waters (Agevent) in years were then calculated using the ratio of AOU and oxygen utilization rate as:
was set to zero when AOU was negative (i.e. O2 was supersaturated with respect to the atmosphere).
4. The year of atmospheric equilibration for the ocean end-member was calculated as:
Yearocean,equil was used to determine the global atmospheric CO2 level for that year which surface ocean waters would have equilibrated with (CO2,equil,year; Meinshausen et al., 2011). CO2,equil,year was paired with the ocean end-member Alksal to calculate the equilibrated DIC value at the time of last ventilation (DICequil,vent) as:
5. Cant was calculated using the ΔTCO2 method following Pacella et al., 2018, which maintains the disequilibrium between atmospheric-equilibrated DIC (DICequil,vent) and in-situ seawater DIC values. The DIC disequilibrium value was calculated as:
where is the 2017/2018 DIC value of the ocean end-member calculated with the pH and Alksal time series. The pre-industrial DIC value of coastal ocean waters was calculated as:
where DICequil,1765 is the DIC value of the ocean end-member equilibrated with a year 1765 atmospheric CO2 value (278 ppm). The coastal ocean end-member anthropogenic carbon concentration (Cant; µmol kg-1) was calculated as:
This method assumes no changes in temperature, salinity, and alkalinity.
The Garibaldi Dock monitoring did not start until August 2017, and therefore estimated ocean Cant values using this procedure were not available for the two July 2017 synoptic surveys. To estimate ocean Cant for these July 2017 surveys, the same methodology was applied using observations of water density, AOU, salinity, temperature, DIC, and Alk from Station “M” for each survey.
Changes to river delivery of DIC and Alk (DICenrich and Alkenrich respectively) due to anthropogenic development in the lower watershed were assumed to be constrained by the difference between the flow-weighted average concentrations of upriver and downriver station DIC and Alk concentrations for each synoptic survey, such that:
where DICfwa,up and, DICfwa,down are the flow-weighted average DIC concentrations of the upriver and downriver stations, respectively (in μmol kg-1), Alkfwa,up and Alkfwa,down are the flow-weighted average Alk concentrations of the upriver and downriver stations, respectively (in μmol kg-1), and DICenrich and Alkenrich are the magnitudes of river end-member DIC and Alk changes due to human activities in the lower watershed, respectively (in μmol kg-1). While we were able to apply survey-specific observations of watershed DICenrich and Alkenrich to each set of estuary survey observations, the variability of these values amongst surveys prevented us from choosing a single representative value for each to apply to the water quality monitoring time series at the Garibaldi Dock and TB-01 monitoring stations. We therefore developed a regression between flow-weighted averages of DICenrich and Alkenrich with daily Trask River discharge (the only river with daily gauging for the entire study period) to calculate a time series of daily DICenrich and Alkenrich for the full monitoring period (Supplementary Figure S4). The relationship of Trask River discharge with DICenrich and Alkenrich was calculated as:
R2 = 0.86, root mean square error = 25 µmol kg-1,
R2 = 0.86, root mean square error = 15 µmol kg-1.
where DICenrich and Alkenrich are daily flow-weighted average downriver additions of DIC and Alk as previously defined with units of μmol kg-1, and Q is the average daily discharge of the Trask River in cubic feet per second.
To test the sensitivity of our results to this method, we also created individual river regressions of DICenrich and Alkenrich versus discharge for the Wilson, Kilchis, Trask, and Tillamook Rivers utilizing only data with salinity<0.2. This therefore avoided using the zero salinity extrapolations for some of the downriver stations as discussed in Section 2.2. We report these regressions in the Supplementary Material (Supplementary Figure S5) and the estimated impacts to Tillamook Bay acidification dynamics using these regressions in Supplementary Figures S6, S7. Estimated acidification impacts in Tillamook Bay were not significantly altered utilizing this alternate method as compared with using the zero-salinity extrapolations, and we do not discuss the method further in this manuscript.
Present-day impacts of OA and riverine carbon enrichments to estuarine pHT, pCO2, and Ωarag were estimated for observations from the synoptic surveys and both water quality monitoring stations using the estimates of ocean Cant, river DICenrich, and river Alkenrich. OA impacts were estimated by subtracting Cant concentrations (corrected for salinity) from the present-day survey and monitoring stations’ DIC observations and recalculating the full carbonate system using this estimate of pre-industrial DIC and observed Alk (note that this method assumes no change in alkalinity associated with OA). These recalculated pHT, Ωarag, and pCO2 values (e.g. pHNo OA) were subtracted from present-day observations (e.g. pHobs) to calculate OA-specific impacts to estuarine water quality (e.g. ΔpHOA):
Impacts to present-day estuarine chemistry from riverine carbon enrichments were estimated similarly by subtracting DICenrich and Alkenrich from the present-day survey and monitoring stations’ DIC and Alk and recalculating the full carbonate system using these estimates of DIC and Alk absent anthropogenic development of the lower watershed:
The sum of the impacts to estuarine chemistry from both OA and riverine carbon enrichments were calculated as:
where DICPI and AlkPI are the estimated DIC and Alk concentrations in the absence of both OA and riverine carbon enrichment. DICPI and AlkPI were combined with observed temperature and salinity to recalculate the full carbonate system and estimate present-day anthropogenic impacts to estuarine chemistry as:
Anthropogenic loading of DIC and Alk to Tillamook Bay from DICenrich (, ALKenrich (, and Cant (were calculated as:
where is the discharge of the Trask River, is the ratio of total river discharge to Tillamook Bay to Trask River discharge, and is the average tidal volume for Tillamook Bay.
ArcMap 10x Spatial Analyst Hydrology Tools was used to define the sub-watersheds for each of the nine river sampling sites utilizing a flow direction raster and a “pourpoint” to generate a raster of the area that is hydrologically upstream (Figure 1). Land cover within each of these nine sub-watersheds was obtained from the 2016 Multi-Resolution Land Characteristics (MRLC) land cover layer for the conterminous United States. MRLC categories included in the anthropogenic land use grouping for this study were cropland, developed space, pasture/hay, and wetlands. Satellite imagery was used to confirm that lower watershed areas categorized as wetlands were used as dairy pastures. The number of permitted cows within each sub-watershed was estimated from the combined animal feeding operation (CAFO) data provided by the Oregon Department of Agriculture. Sources of nitrogen loading specific to each of the nine river sampling sites was estimated using the SPAtially Referenced Regressions On Watershed attributes (SPARROW) model developed by the United States Geological Survey (Wise and Johnson, 2011). The SPARROW model is a hybrid statistical and mechanistic model which uses spatial data describing watershed attributes to predict water quality of a surface water network and estimate the discharges of nutrients to streams. For this study, nitrogen loads from forest lands, livestock manure (included confined cattle and grazing livestock), point sources associated with wastewater facilities, non-sewered areas, runoff from developed lands, farm fertilizer, atmospheric deposition, and red alder were estimated to each river sampling site.
In all four rivers with upstream and downstream sampling stations, we observed downstream increases in DIC, Alk, the ratio of DIC : Alk, pCO2, and NO3-, and decreases in pHT (Figures 3A–C; Supplementary Figure S8). These downstream changes in river chemistry were most pronounced during the dry season and occurred in areas with increased human land use modifications (Figure 3D, Supplementary Figure S8) as well as higher proportions of anthropogenic nitrogen sources as determined by SPARROW (Figure S8). The rivers displayed different carbonate chemistry conditions at the upstream stations before entering the lower watershed (Figures 3A–C), but patterns of upstream to downstream carbonate system changes were consistent across rivers (Figure 3D, Supplementary Figure S8). River pHT, pCO2, and DIC : Alk ratios were significantly correlated with river NO3- levels (Figures 3E, F, Supplementary Figure S8; Supplementary Table S1). DIC and Alk concentrations at all river stations were highest during the dry season and lowest during the wet season (Figure 3A, Supplementary Table S1). Upriver DIC ranged from 309 to 700 µmol kg-1, and Alk from 231 to 653 µmol kg-1, with the Trask River having the highest average concentrations. Downriver DIC ranged from 315 to 883 µmol kg-1, and Alk from 212 to 756 µmol kg-1, with the Trask River again having the highest average concentrations.
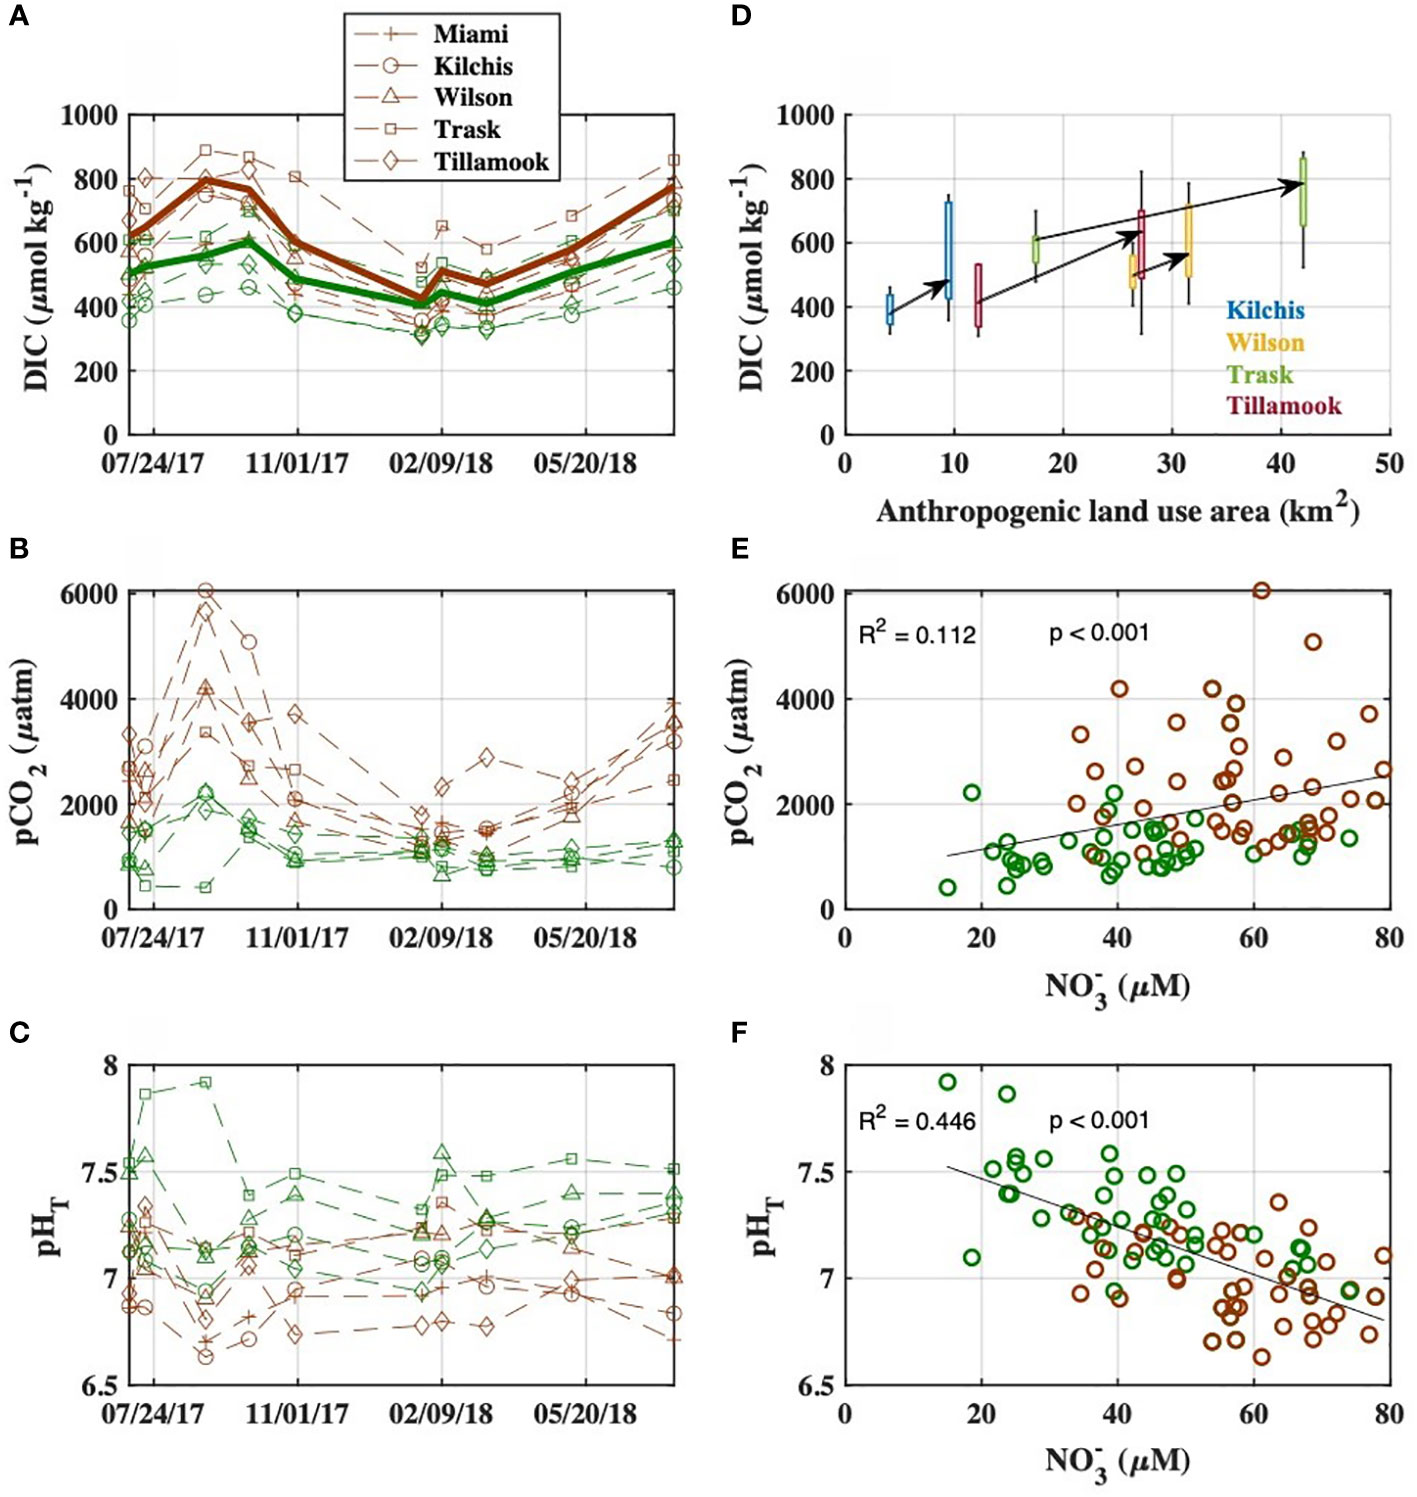
Figure 3 (A–C) Observed carbonate system variables at upstream (green) and downstream (brown) river stations during the synoptic surveys from July 2017 to July 2018. Bold lines indicate flow-weighted averages in (A). (D) The relationships between anthropogenic land use area (from MRLC data) in the sub-watershed of each sampling site and river DIC concentrations. Data are color coded by river, and arrows connect upriver to downriver median DIC concentrations for each river Bivariate plots and linear regressions of riverine (E) pCO2 (linear regression performed between NO3- and log-transformed pCO2 to correct for heteroscedasticity) and (F) pHT with NO3- concentrations, with upstream stations in blue and downstream stations in red. Regression between NO3- and log-transformed pCO2 is displayed in pCO2 space for clarity.
Increases in downstream flow-weighted averages of river DIC and Alk, i.e. DICenrich and Alkenrich, were significantly correlated with Trask River discharge on the day of sampling (Supplementary Figure S4) and were highest during periods of low river discharge (Figure 4). DICenrich concentrations were often much larger than ocean Cant values during the study period, but were largely composed of HCO3- and therefore contributed to increased Alkenrich values as well.
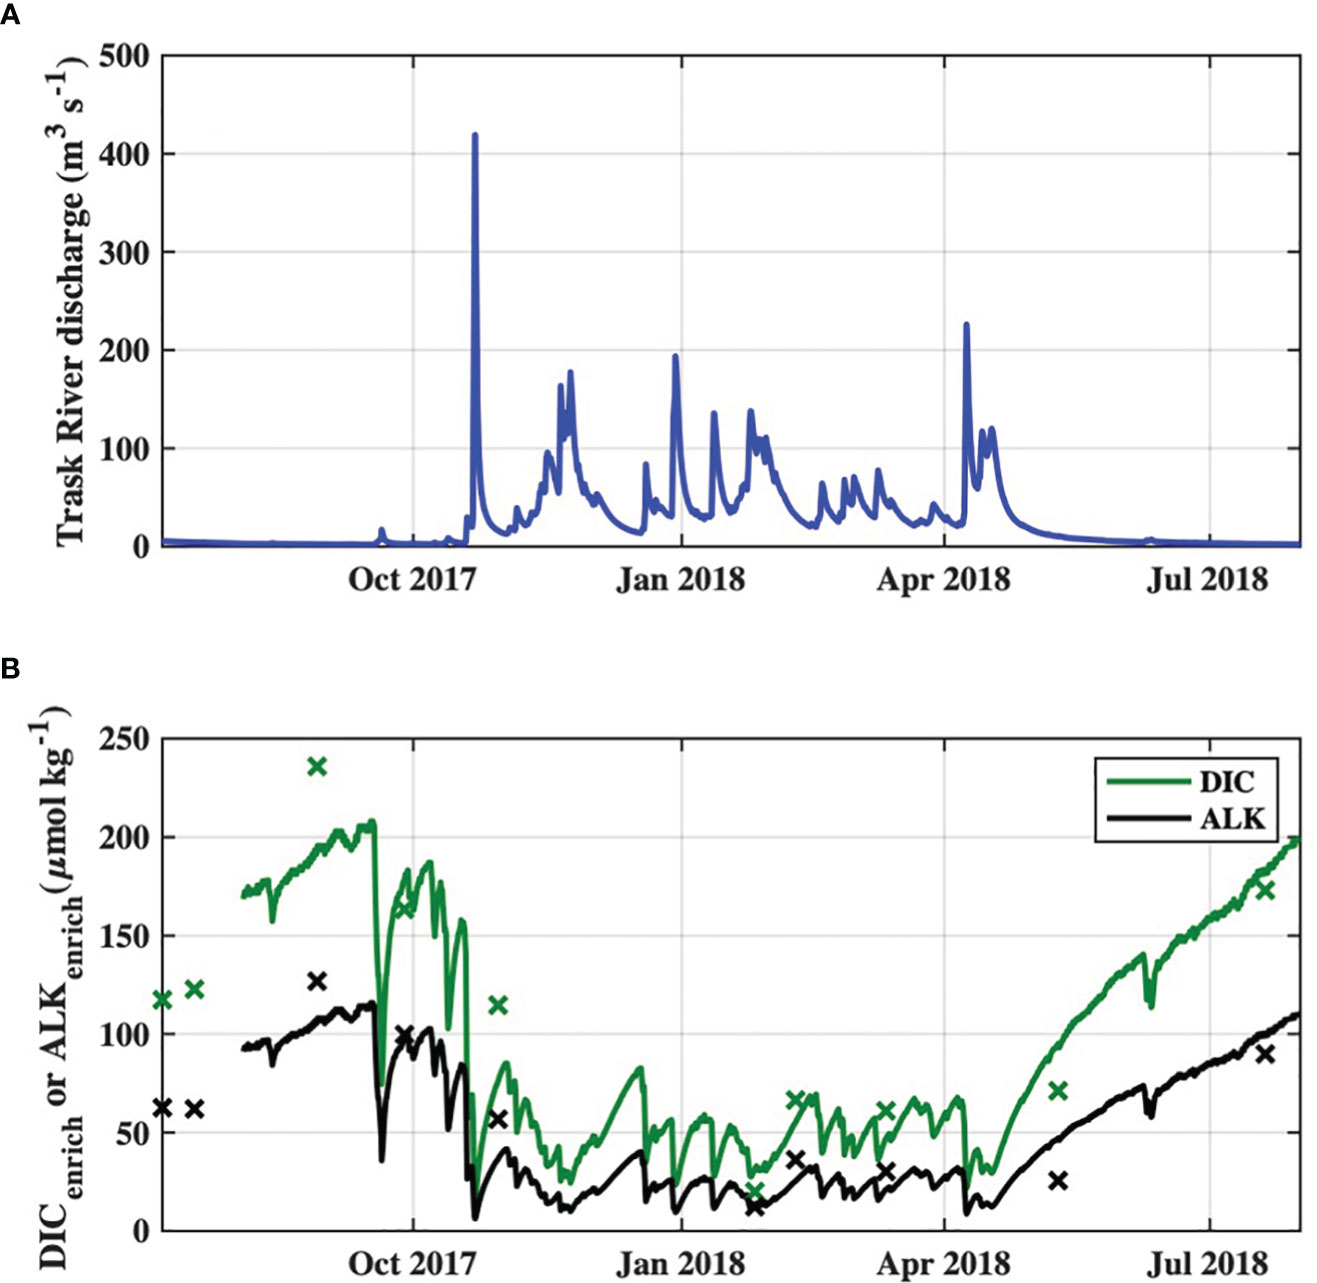
Figure 4 Time series of (A) observed Trask River discharge from USGS station 14302480, and (B) DICenrich and Alkenrich of river end-member discharges to the Tillamook Estuary during the study period. Survey-specific observations of DICenrich and Alkenrich are indicated by “x” markers.
Coastal ocean waters entering Tillamook Bay sampled at station “M” during July and August surveys displayed high pCO2, low pHT, low Ωarag, low O2, and cold temperatures consistent with seasonally upwelled waters of the northern California Current (Figure 5, Supplementary Table S2; Hales et al., 2005; Chan et al., 2017). Ocean salinity, DIC, and Alk were highest during the dry season, lower in the wet season, and lowest in the spring transition period (Figure 5, Supplementary Table S2). Ocean waters entering the estuary during the wet season surveys were higher in O2 and pHT when compared with the dry season - likely due to the absence of upwelling in the wet season. Ωarag during July and August ranged from 0.9 – 1.3, with wet season values near 2 (Figure 5E). pCO2 values indicated nearshore ocean waters were a source of CO2 to the atmosphere in July, August, and September, near atmospheric levels in October and January, and a sink in February, March, and May (Figure 5C, Supplementary Table S2).

Figure 5 Observations of (A) alkalinity, (B) DIC, (C) pCO2, (D) pHT, (E) Ωarag, and (F) dissolved oxygen saturation from estuarine stations (“x” markers), river stations (circle markers), and station M (star markers) in Tillamook Bay during the 2017 and 2018 synoptic surveys. Observations are color-coded by wet (blue) and dry (red) seasons. Dashed lines indicate the reference mixing lines (REML) between average coastal ocean and river end-members, as defined in Methods section.
Observed AOU in coastal ocean waters entering Tillamook Bay was highest during the summers of 2017 and 2018, and co-occurred with relatively dense waters entering the estuary typical of coastal upwelling. Estimated ventilation ages of coastal ocean waters during these summer periods were relatively high, ranging from ~20-35 years, which agreed reasonably well with a previously published ventilation age of 25 years for upwelling source waters from the California Undercurrent (Murray et al., 2015). The temporal dynamics of estimated ventilation ages tracked observed northward wind stress during the study period (Figure 6A), with higher ventilation ages during periods of upwelling-favorable winds (summer) and lower ventilation ages during times of relaxation or downwelling favorable winds (wet season; Figures 6A–C). Wind stress was not used to calculate ventilation age nor Cant, and therefore served as an independent check on the ability of our calculations to reproduce reasonable temporal dynamics of upwelling influences on Cant and ventilation ages of coastal ocean waters. Estimated Cant ranged from 35 to 67 μmol kg-1, with an average value of 56 μmol kg-1 (Figure 6C) and was in agreement with previously published values of 37 to 57 μmol kg-1 for upwelling source waters (Feely et al., 2016; Chan et al., 2017) and 37 to 60 μmol kg-1 for nearshore surface waters in the region (Feely et al., 2016; Hare et al., 2020). Cant was estimated to be lowest during periods of summer upwelling due to the older ventilation ages of upwelled coastal ocean waters, thus last being in contact with lower atmospheric CO2 levels (Figures 6B, C). Cant was highest during the wet season when AOU was low (or positive) and ventilation ages were therefore estimated to also be low or zero (i.e. equilibrated with modern atmospheric CO2 levels) (Figures 6B, C). This behavior of Cant with respect to upwelling dynamics is in agreement with observations of both Feely et al. (2016) and Chan et al. (2017).
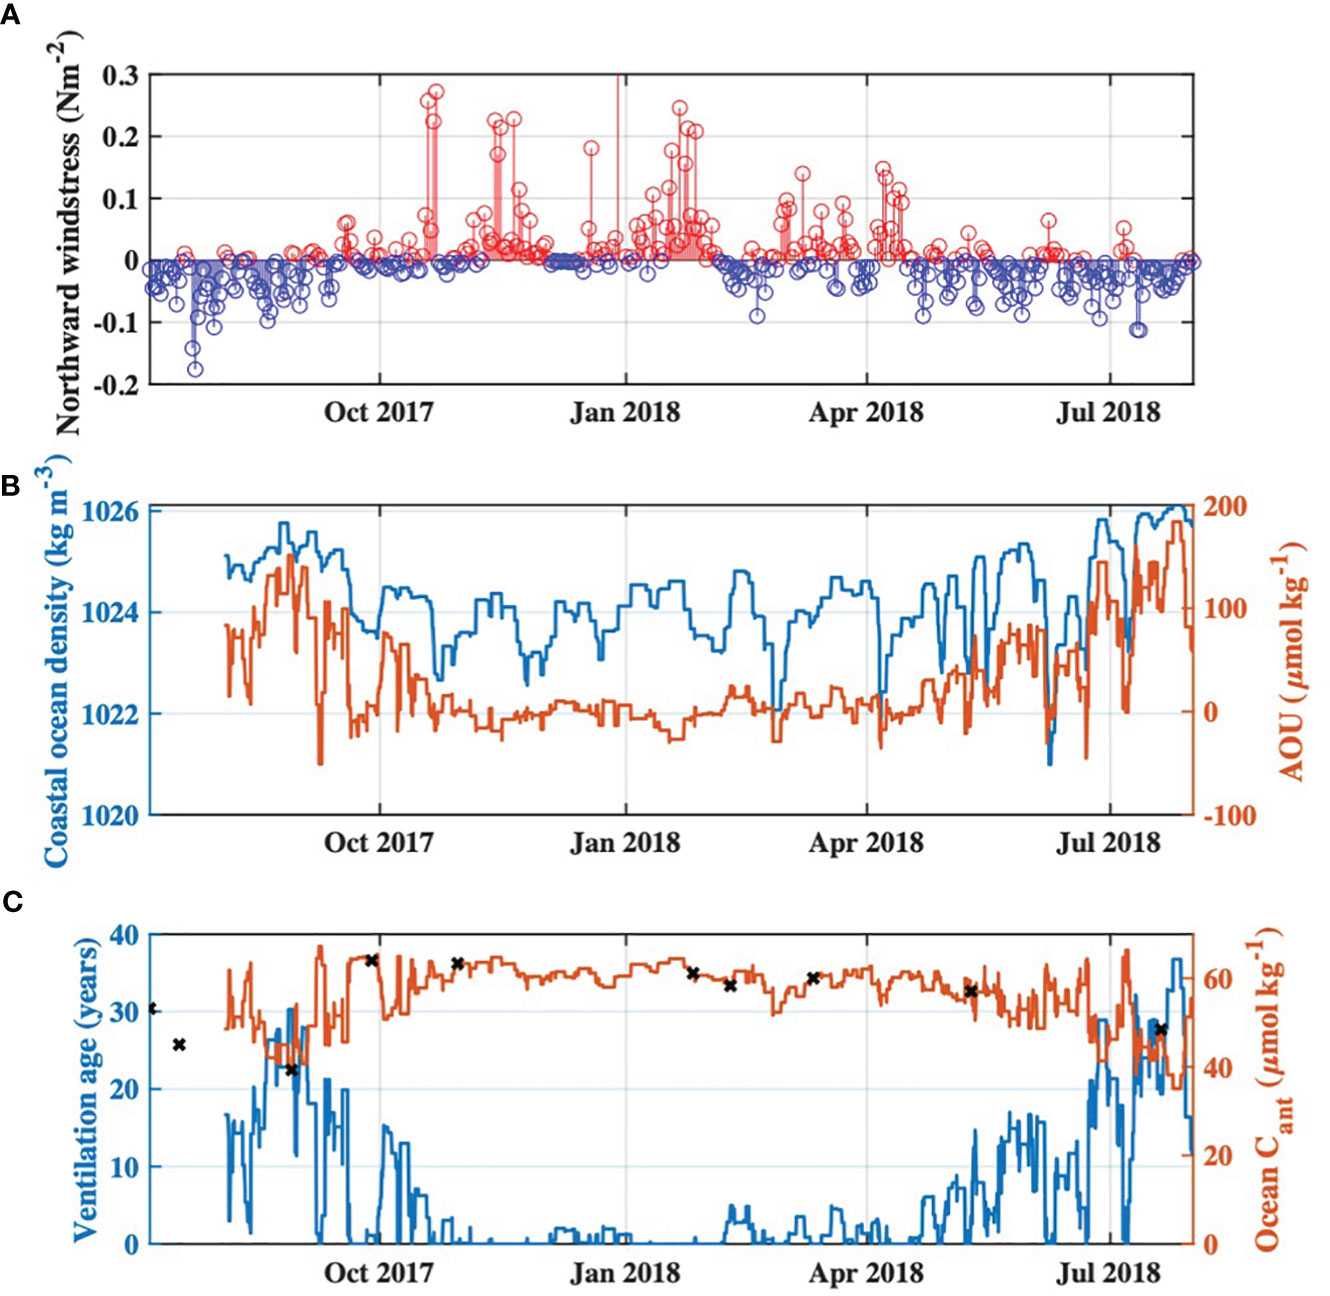
Figure 6 Time series of (A) Northward wind stress during the study period from http://damp.coas.oregonstate.edu/windstress/index.html, with positive values indicated by red and negative values indicated by blue, (B) Time series of 3-day moving maximum water density, and associated apparent oxygen utilization (AOU), at the Garibaldi Dock monitoring site for the study period, and (C) Calculated ventilation age of coastal ocean end-member waters entering Tillamook Estuary, and associated Cant concentrations. Cant values specific to each of the synoptic surveys are indicated by the black “x” markers.
pHT, Ωarag, and pCO2 observations at the estuarine synoptic survey stations largely followed patterns expected from seasonal variabilities of end-member carbonate chemistry and river discharge (Figure 5). The lowest pHT, lowest Ωarag, and highest pCO2 observations during this study in polyhaline portions of the estuary occurred during the July and August surveys, coinciding with similar patterns in coastal ocean chemistry. Estuary stations during these dry season surveys had a mean pHT of 7.77, mean Ωarag of 1.10, and mean pCO2 of 785 µatm. September and October surveys were influenced by increasing river discharge (Figures 4, 5, Supplementary Table S2) and lower CO2 (higher pHT and Ωarag) coastal ocean conditions, with observed estuarine station mean pHT, Ωarag, and pCO2 of 7.86, 1.31, and 602 µatm, respectively. January, February, and March surveys occurred during periods of relatively high river discharge and lower CO2 (higher pHT and Ωarag) coastal ocean conditions similar to the fall, with observed estuarine station mean pHT, Ωarag, and pCO2 of 7.81, 0.90, and 586 µatm, respectively. The May survey appeared to be moderately influenced by river discharge, similar to the fall surveys, with observed estuarine station mean pHT, Ωarag, and pCO2 of 7.90, 1.34, and 581 µatm, respectively.
Monitoring at the Garibaldi Dock and TB-01 stations provided continuous observations of biogeochemical variability within Tillamook Bay which complement the high-quality discrete observations from the synoptic estuary surveys (Figure 7). Observed pHT, along with calculated Ωarag and pCO2, were highly variable on diel, event, and seasonal time scales. Seasonal carbonate chemistry dynamics at the sites showed opposing patterns; the Garibaldi Dock station experienced lower pHT and higher pCO2 during periods of low river discharge and upwelling-favorable conditions in the dry season, with highly variable Ωarag throughout the year, while the TB-01 station experienced lower pHT and Ωarag, with higher pCO2, during periods of high river discharge in the wet season (Figure 7).
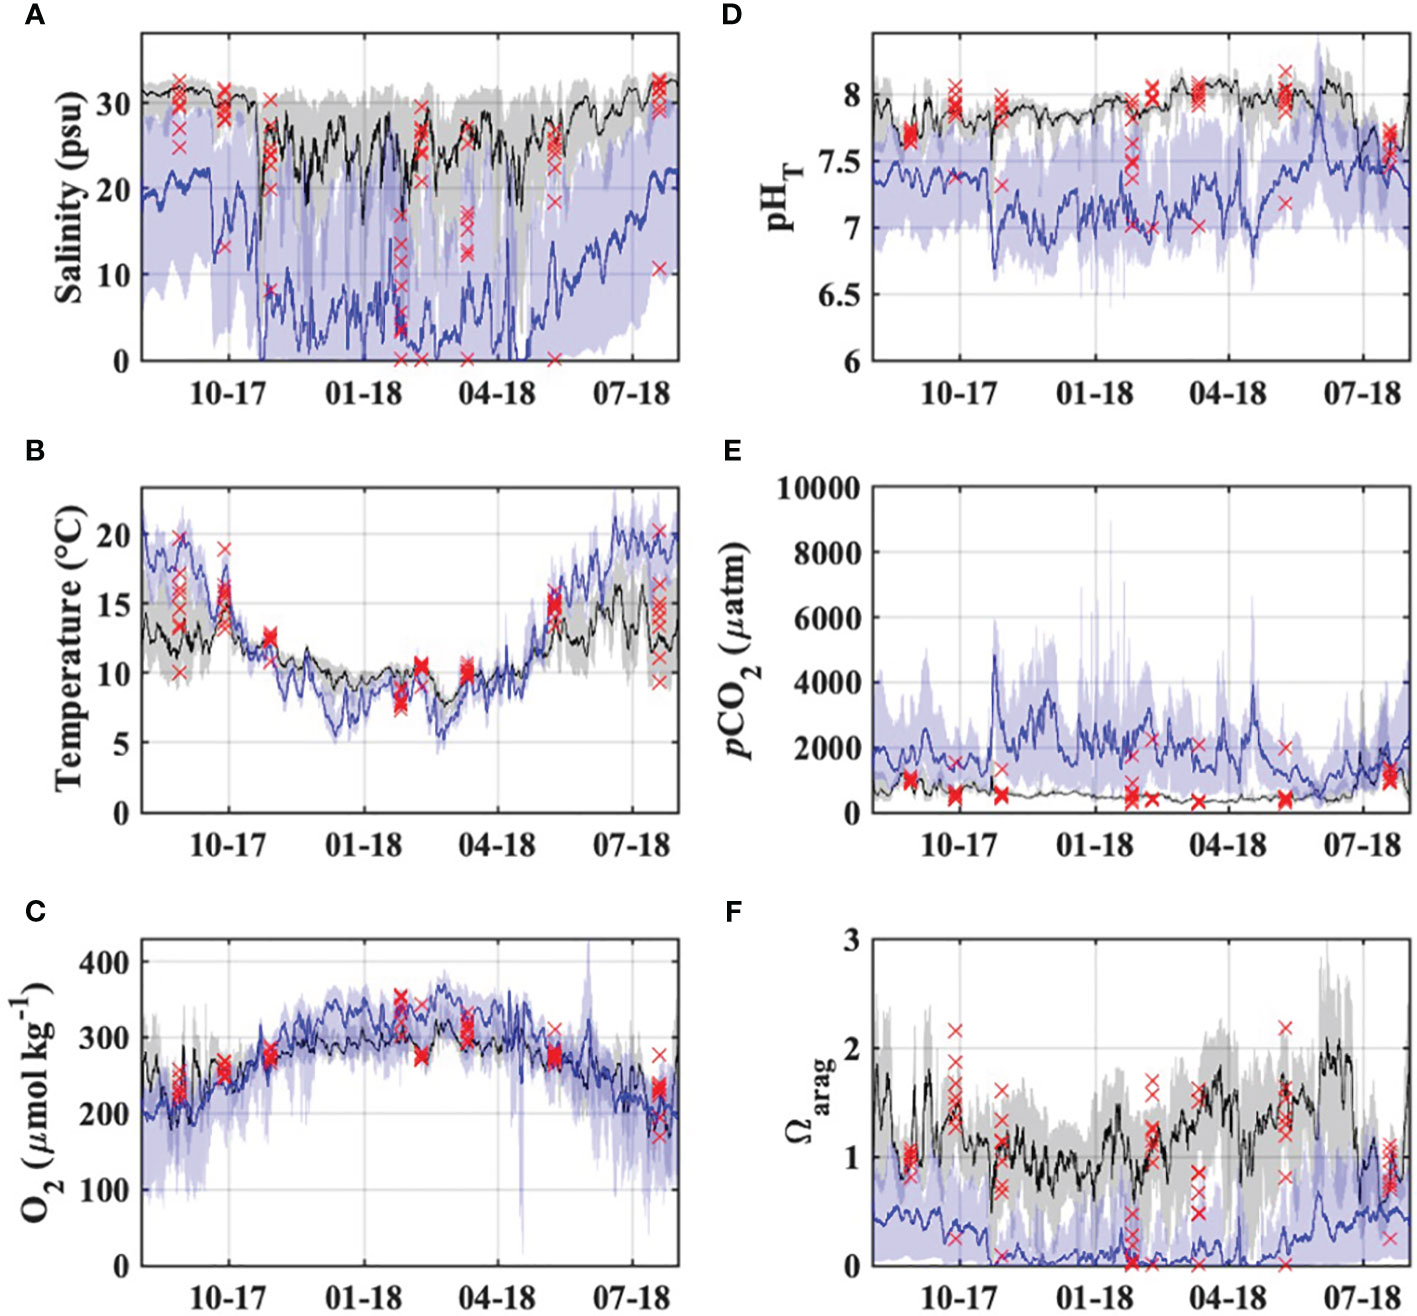
Figure 7 Observed (A) salinity, (B) temperature, (C) dissolved oxygen saturation, and (D–F) carbonate chemistry in the Tillamook Estuary from the synoptic surveys (red markers), Garibaldi Dock monitoring (black) and TB-01 monitoring (blue). Lines and shaded regions represent daily moving averages and full observed ranges, respectively.
The lowest pHT and Ωarag observations at the Garibaldi Dock were associated with short-duration events in the fall, winter, and spring associated with low salinities (< 10) that were coincident with spikes in river discharge and northward winds often associated with low pressure systems and precipitation events (Figure 7, Supplementary Figure S9; Bane et al., 2005), and longer duration events in the summer of 2018 associated with high salinity (>32), low temperatures (< 12°C), and low dissolved oxygen characteristic of freshly upwelled coastal ocean waters with a large metabolic CO2 signal. Both of these environmental conditions were also characterized by high (>1000 μatm) pCO2 values. During the study period, pCO2 values exceeded 410 μatm (i.e. modern atmospheric values) for 75% of observations, with the highest values during summer 2018 upwelling events. Waters at Garibaldi were undersaturated with respect to Ωarag (<1.0 units) in 35% of the observations, and only exceeded 1.5 units for 26% of the observed period. Discrete observations of pHT, Ωarag, and pCO2 from the estuary surveys showed generally good agreement with the Garibaldi mooring observations at comparable salinities (Figure 7).
The location of TB-01 in the oligo/mesohaline portion of the estuary, with stronger river discharge influence, resulted in lower salinity waters at the site. These waters were generally of lower pHT and Ωarag, and higher pCO2, when compared with Garibaldi, and displayed more seasonal temperature and dissolved oxygen variability (Figure 7). Waters were nearly always undersaturated with respect to Ωarag (99% of observations), and a strong source of CO2 to the atmosphere (99% of observations > 410 μatm). Diel variability of pHT, pCO2, and Ωarag at TB-01 was much higher than at Garibaldi, likely driven by strong tidal mixing and local metabolic processes as evidenced by the high variabilities of salinity and dissolved oxygen saturation.
The first-order variability of Tillamook Bay carbonate chemistry was driven by mixing between the coastal ocean and river end-members, evidenced by the close adherence of DIC and Alk to the reference mixing lines for each parameter (Figure 5). OA was found to drive larger decreases in Ωarag during both wet and dry seasons when compared with all processes responsible for departures of estuarine pHT, Ωarag, and pCO2 from reference mixing line values (i.e. the variabilities after accounting for conservative mixing) (Figures 8A–C). BGC impacts to estuarine chemistry were the most variable with respect to both magnitude and sign, but generally lowered pHT and Ωarag while raising pCO2 during the wet and dry seasons. The most frequent exceptions to this pattern occurred during the dry season, where apparent autotrophy (evidenced by O2 supersaturation; Figure 7C) drove increases in estuarine pHT and Ωarag while lowering pCO2. Coastal ocean dynamics contributed to relatively higher pHT and Ωarag, and lower pCO2 during the wet season, while upwelling during the dry season caused relatively large decreases of estuarine pHT and Ωarag, and increased pCO2. The majority of river influence on estuarine chemistry was via direct dilution of coastal ocean waters (Figure 5), with seasonal variability of the river end-member responsible for relatively small changes to estuarine carbonate chemistry (Figure 8). We note that seasonal variability in the ocean and river end-members implicitly includes the variability of anthropogenic signals in these same source waters, as characterized by Cant, DICenrich, and Alkenrich. Thermal effects on estuarine chemistry were also small, with the warming during the dry season causing decreased pHT, and increased Ωarag and pCO2. Both riverine carbon enrichments and OA reduced estuarine pHT and Ωarag, and raised pCO2, during the wet and dry seasons (Figure 8). Seasonal OA impacts to estuarine carbonate chemistry were always larger than the riverine carbon enrichment impacts, and similar in magnitude to coastal ocean variability and local BGC variability.
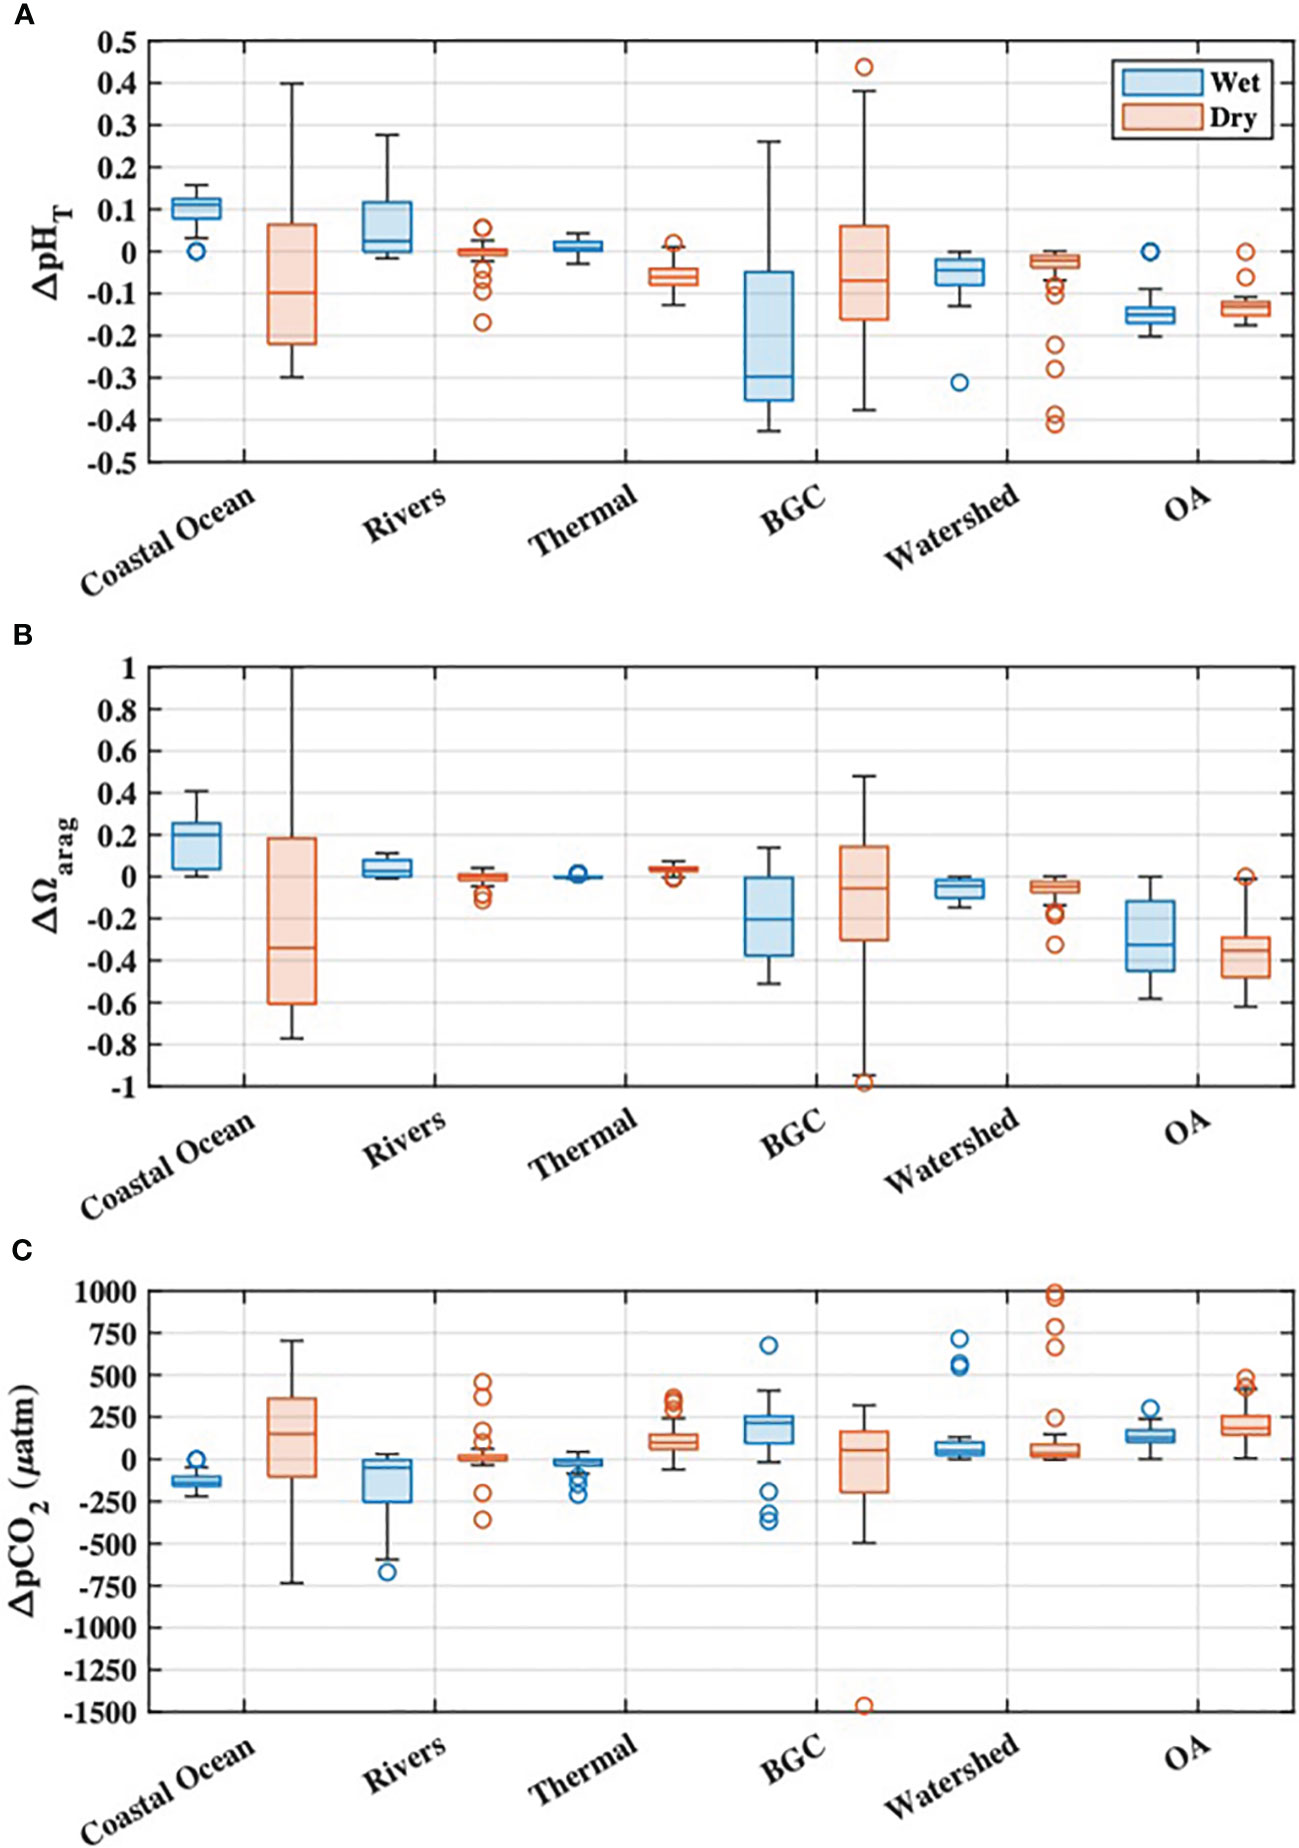
Figure 8 Mechanistic drivers of Tillamook Bay seasonal (A) pHT, (B) Ωarag, and (C) pCO2 calculated from synoptic survey observations. Impacts of riverine carbon enrichments (“Watershed”) and ocean acidification (“OA”) on estuarine chemistry are also shown.
OA was the dominant driver of estuarine pHT and Ωarag declines, and pCO2 increases, at salinities greater than ~13, below which riverine carbon enrichments became more important for coastal acidification impacts (Figures 9A–C). The present-day combined impacts of ocean acidification and riverine carbon enrichments on estuarine water quality were highly variable in both space and time, and always greater than those impacts from either driver alone (Figure 9). Declines in estuarine pHT were greatest at low salinities (sometimes exceeding one full pH unit) and highly variable (ranging from ~0 to 1.4 units), while polyhaline portions of the bay experienced more moderate and consistent declines of ~0.1 to ~0.2 units (Figures 9A, D, G). Changes to estuarine pCO2 were generally variable, with the largest increases at low and moderate salinities (Figures 9B, E, H). The largest Ωarag declines occurred in polyhaline portions of the estuary (Figures 9C, F, I) and were primarily driven by ocean acidification. Ωarag was generally undersaturated (< 1) in oligo- and mesohaline portions of the estuary (Figures 5E, 7F), and decreases in these waters were therefore relatively small when compared with Ωarag decreases at higher salinities. Overall, the total impacts of ocean acidification and riverine carbon enrichments at the Garibaldi Dock reduced pHT by 0.16 units, increased pCO2 by 192 µatm, and reduced median Ωarag by 0.47 units (Figures 9A–C). Total impacts at TB-01 reduced pHT by 0.23 units, increased pCO2 by 533 µatm, and reduced median Ωarag by 0.1 units (Figures 10A–C). Riverine carbon enrichments were the dominant driver of ΔpHT and ΔpCO2 at TB-01, while OA was generally less important for ΔΩarag. Impacts of riverine carbon enrichments were relatively small year-round at the Garibaldi Dock location, and only episodically important during periods of elevated river discharge (Figures 9, 10).
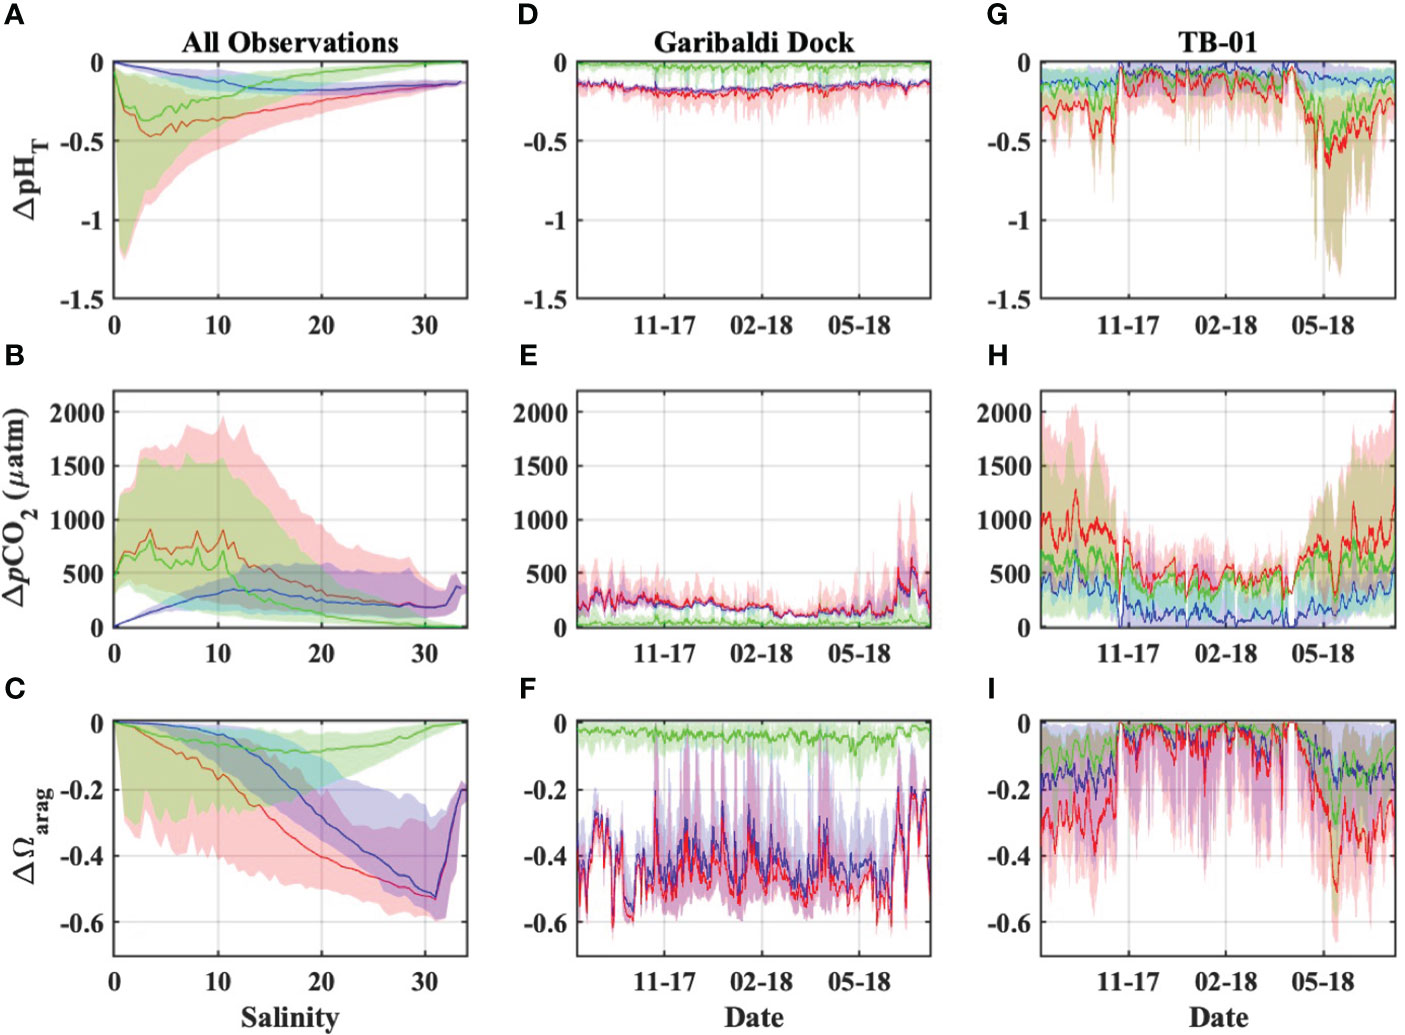
Figure 9 Estimated impacts to Tillamook Estuary carbonate chemistry due to OA (blue), riverine carbon enrichments (green), and the combination of both OA and riverine carbon enrichments (red). These impacts are presented as they vary (A–C) pseudo-spatially across the observed estuarine salinity spectrum using observations from both monitoring stations, and (D–I) temporally using observations from the Garibaldi Dock and TB-01 monitoring stations. Plots (A–C) display the medians (lines) and 90% inter-quantile ranges (shaded area) of water quality impacts.
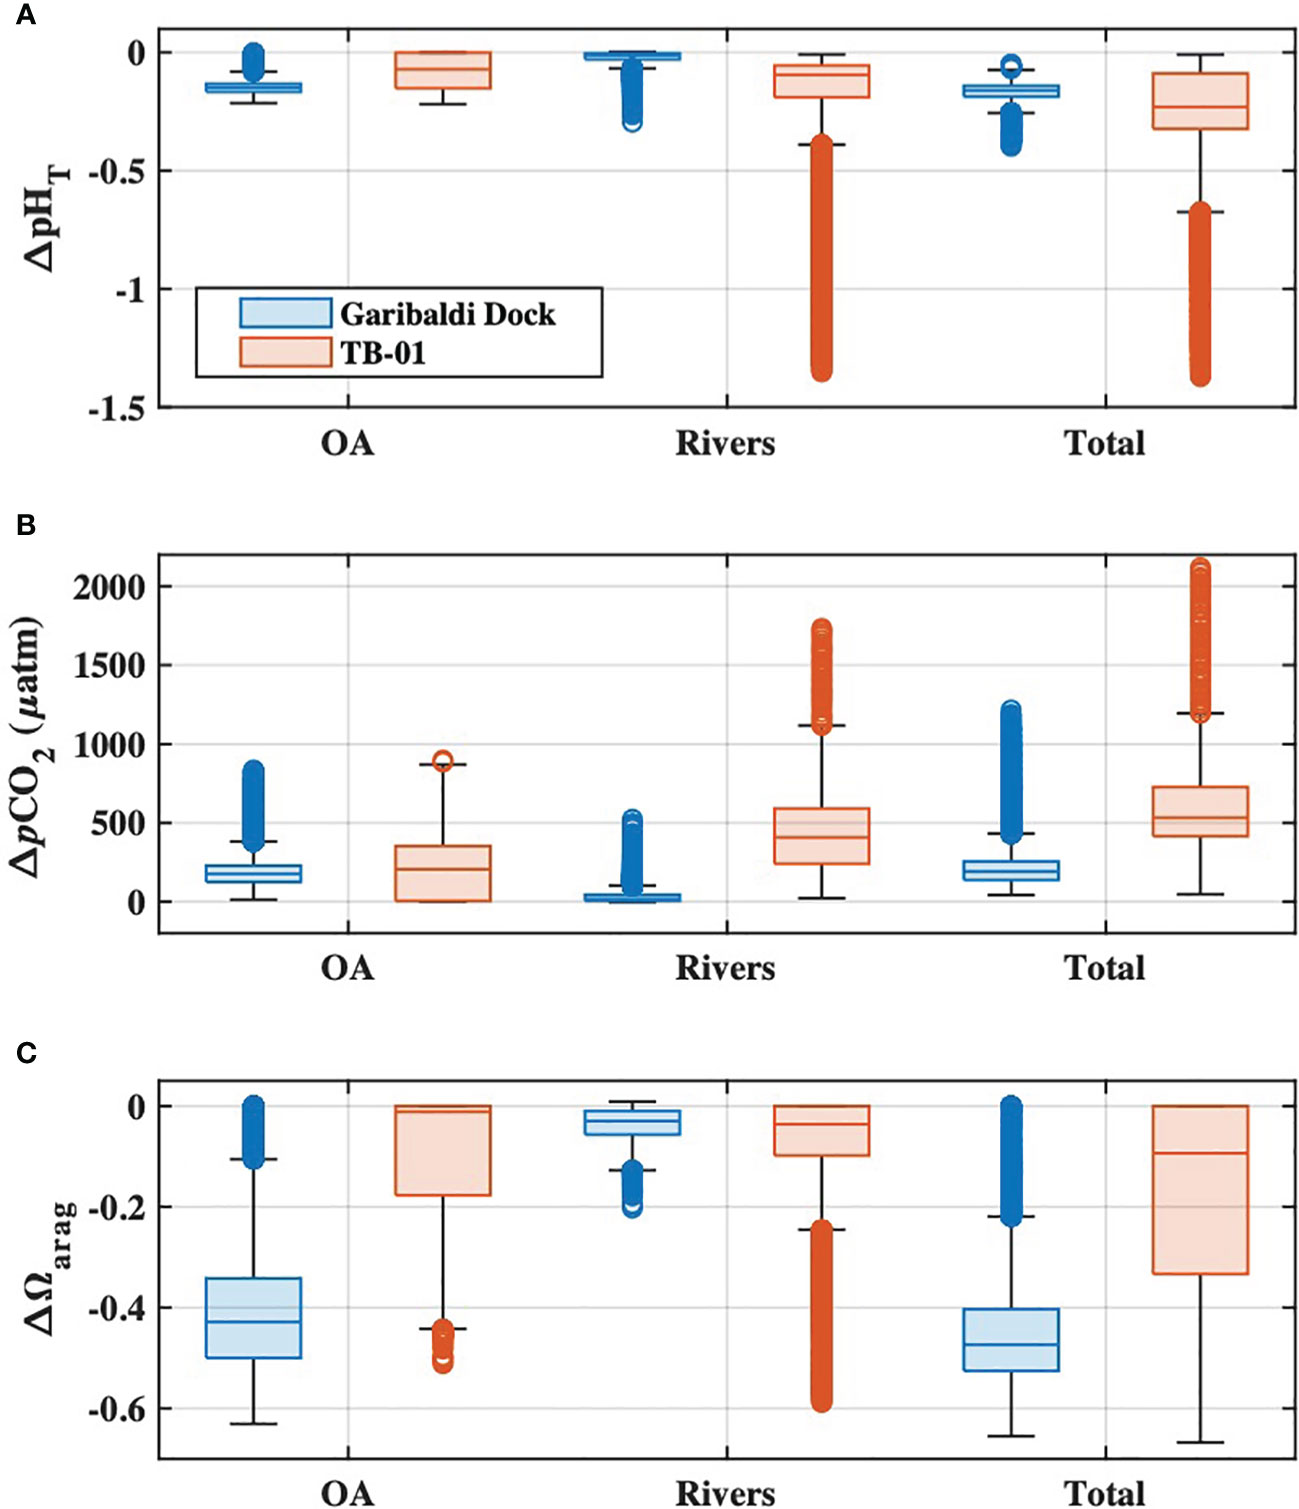
Figure 10 Boxplots of (A) pHT, (B), pCO2, and (C) Ωarag impacts at the Garibaldi Dock (blue) and TB-01 (red) monitoring sites due to ocean acidification (‘OA’), riverine carbon enrichments (‘Watershed’), and the combination of both drivers (‘Total’). Shaded regions of each boxplot represent the median and interquartile range, whiskers represent the full range of data (minus outliers), and the open circles represent outlier values.
At the whole-estuary scale, anthropogenic carbon loading was dominated by tidal exchange of coastal ocean Cant, with< 6% of the loading coming from riverine carbon enrichments on average (Figure 11). Average ocean Cant loading during the study period was 6.9 x 10⁶ mol d-1, while loading from DICenrich and Alkenrich averaged 3.7 x 10⁵ mol d-1 and 1.7 x 10⁵ mol d-1, respectively. Anthropogenic carbon loading to the estuary was greatest during the wet season, coincident with high river discharge and high coastal ocean Cant concentrations, and lowest during the dry season during upwelling periods and low river discharge.

Figure 11 Estimates of anthropogenic carbon loading to Tillamook Bay from coastal ocean Cant (blue), and riverine enrichments of DIC (green) and Alk (black) during the study period.
Previous studies in the California Current have shown that coastal upwelling can strongly control shelf (Hales et al., 2005; Feely et al., 2008; Harris et al., 2013) and estuarine (Barton et al., 2012; Hales et al., 2017; Fairchild and Hales, 2021) carbonate chemistry dynamics. Our study characterizes the dominant role of coastal ocean conditions in the anthropogenic acidification dynamics of Tillamook Bay, especially in the polyhaline lower estuary. The many low residence time estuaries in the Northeast Pacific are subject to similar oceanic influence (Hickey and Banas, 2003), thus creating concerns from a water quality perspective given that the lowest pHT and most corrosive upwelled waters occur in the most nearshore regions of the shelf (Feely et al., 2016). Estuarine ecosystems are therefore naturally exposed to some of the most extreme carbonate chemistry conditions experienced in the California Current system, even prior to any addition of metabolic carbon generated from estuarine net community metabolism. Freshly upwelled waters also have high DIC : Alk ratios and high sensitivity to further acidification, contributing to these systems being more vulnerable to local acidification and corrosive conditions (Cai et al., 2021) than open-ocean environments. While estuarine ecosystems have likely always experienced high natural variability and biologically-stressful conditions (Hales et al., 2017), periods of active upwelling may therefore be especially prone to accelerated anthropogenic acidification (Chan et al., 2017; Feely et al., 2018) on top of an already stressful natural baseline. Estuarine water quality during upwelling periods has already been shown to significantly impair Pacific oyster hatchery operations attributable to lower Ωarag (Barton et al., 2012), and upwelling events for this region are predicted to become stronger and longer in duration with ongoing climate change (Iles et al., 2012). Additionally, changes in the relative contributions of North Pacific and Equatorial Pacific waters to the California Current over the past 30 years have been shown to result in more acidified source waters (Meinvielle and Johnson, 2013), which are delivered to coastal and estuarine habitats during upwelling events. The interannual and decadal variability of future coastal acidification in California Current coastal and estuarine habitats will likely be significantly modulated by these coastal ocean upwelling dynamics, and increasingly worse due to atmospheric CO2 trends. Interpretation of long-term carbonate system changes in estuarine habitats would benefit from accounting for these relevant local upwelling dynamics (Turi et al., 2016).
Given the literature demonstrating anthropogenic enrichment of river DIC consistent with our observations, and the concurrent increases of downriver DIC with both NO3- levels and indices of human land use observed in our study, this evidence taken together suggests human activities in the watershed are responsible for some portion of the observed downriver changes in riverine carbonate chemistry. A concurrent study of nitrate isotopes and bacterial source tracking in the Tillamook watershed showed significant enrichment of δ15N-NO3 and markers for septic and ruminant bacteria at the same downriver sampling locations where we observed enriched DIC and NO3, and reduced pHT (A.G. Zimmer-Faust et al., submitted to Water Research). We are unaware of other studies characterizing anthropogenic land use effects on the carbonate chemistry of coastal rivers discharging to the California Current, but previous work has shown that DIC content of temperate streams is strongly related to watershed land use (Barnes and Raymond, 2009; Zhang et al., 2009; Kaushal et al., 2017). The strong negative relationship we observed between river discharge and downriver enrichments of DIC and Alk (Supplementary Figure S4) suggests dilution of a downriver source in the areas with increased human activity. Tillamook County contains 36,551 acres of farmland, 46% of which are treated with commercial fertilizers, lime and soil conditioners, and manure (USDA-NASS, 2012) which can affect river chemistry. While these numbers are county-wide, much of this agricultural activity is concentrated in the lower Tillamook Bay watershed captured by our study sites (Figure 1). The bacterial contamination issues previously documented in the estuary related to agricultural runoff, septic system discharges, and wastewater discharges also demonstrate a direct link between anthropogenic land use in the watershed and water quality in the estuary. It therefore seems likely that other water quality indices in Tillamook Bay, including pHT and other carbonate parameters measured in this study, are affected by these same land use and development practices. The majority of observed downriver DIC additions were in the form of HCO3- with smaller additions of CO2(aq), causing downriver DIC and Alk additions to nearly always fall above a 1:1 DIC to Alk ratio line (Supplementary Figure S8). The addition of HCO3- in temperate streams and rivers has generally been interpreted as resulting from weathering of carbonate and silicate minerals (Oh and Raymond, 2006; Barnes and Raymond, 2009; Joesoef et al., 2017), but has been shown to be anthropogenically enhanced by lime additions and acids produced by metabolic processing of agricultural fertilizers and manure (Oh and Raymond, 2006). The downriver DIC and Alk additions in the Tillamook watershed (primarily HCO3- with smaller amounts of CO2(aq)) would be consistent with the delivery of anerobic and aerobic metabolites to the lower rivers from areas with increased human land use, and is supported by the observations of elevated NO3- concentrations at downstream stations. The downriver DIC additions could also be explained by carbonate dissolution in the lower watershed, with co-occurring additions of metabolic CO2(aq) and/or organic acids. However, much of the lower Tillamook watershed consists of flood plains which may naturally deliver higher DIC and Alk loads via degradation of accumulated organic matter-rich soils to the rivers when compared with the upper forested watersheds. Attributing the totality of observed river water quality changes to specific anthropogenic mechanisms in the Tillamook watershed is not possible with the current dataset and is a topic of ongoing study. We therefore posit that the observed downriver changes in riverine carbonate chemistry represent upper bounds of the human influence on river chemistry in the Tillamook Bay watershed during our study, and are useful for understanding potential land-based impacts on the acidification dynamics of the estuary as discussed below. The land-based impacts presented in this study are, however, limited to direct impacts to riverine water quality (and resultant downstream changes in estuarine water quality), and further study is necessary to understand if autochthonous processing of anthropogenic nutrients and organic matter delivered by these waters is a significant driver of estuarine water quality impacts. Despite the short residence time of waters in Tillamook Bay, local biogeochemical processes were an important driver of observed carbonate chemistry (Figure 8) and suggest that anthropogenic modification of local metabolism could have an appreciable impact on estuarine water quality.
As our understanding of the complexity of acidification in estuarine systems continues to improve, accounting for changes to land-based delivery of carbon and alkalinity is necessary to accurately characterize water quality impacts in these systems. This is especially important, considering that altered river delivery of DIC and Alk have been shown to both improve and degrade water quality indicators of acidification (Van Dam and Wang, 2019; Da et al., 2021). Tillamook Bay is an example of contrasting perspectives on acidification impacts in an estuary: riverine-driven acidification was responsible for the most severe acidification impacts to water quality, but these were limited in spatial scope and the OA signal dominated acidification impacts at the whole-system scale. Acidification effects in Tillamook Bay were also spatially and temporally heterogeneous, and demonstrate the complexity of acidification dynamics in estuarine environments.
The importance of riverine carbon enrichments to acidification impacts in lower-salinity areas, and the temporal variability of ocean Cant entering the estuary due to seasonal upwelling, highlight the potential pitfalls of assuming estuarine waters will track atmospheric CO2 trajectories (Carstensen et al., 2018; Carstensen and Duarte, 2019; Cai et al., 2021). While water quality impacts in polyhaline waters of Tillamook Bay were dominated by OA, these impacts were greater than would be assumed in well-buffered ocean waters and were still influenced by enhanced riverine carbon delivery. Critically, the water quality impacts of riverine carbon enrichments alone in Tillamook Bay were shown to be as large, or larger, than those changes driven by OA in moderate and low salinity waters, with the combined effects of the two drivers being additive. Enhanced rates of acidification and water quality degradation in estuaries have been long known (Cai et al., 2011; Waldbusser et al., 2011; Sunda and Cai, 2012) and more recently shown to hasten the exceedance of water quality and organismal tolerance thresholds (Pacella et al., 2018; Cai et al., 2021). Our study builds upon this work by providing a methodological framework for characterizing the temporal and spatial dynamics of estuary acidification at scales relevant for endemic organisms (e.g. Bednarsek et al., 2019).
Despite the dominant role of OA to water quality impacts in Tillamook Bay, the variance in rates of acidification amongst estuaries (and susceptibility to changes in water quality) more generally is likely to be primarily determined by local watershed chemistry and biophysical (e.g. metabolic rates, estuarine residence and freshwater flushing times, stratification) drivers. While there is variability in oceanic Cant in coastal zones of the United States (Feely et al., 2018), this is often smaller than the anthropogenic changes to riverine DIC and Alk delivery in anthropogenically-altered watersheds studied to date (Raymond et al., 2008; Stets et al., 2014; Da et al., 2021). Acidification impacts in estuaries are modulated by the buffering characteristics of estuarine waters, and are a function of the DIC and Alk concentrations of the watershed end-member (see Cai et al., 2021 for a discussion). Further study is necessary to more broadly understand the characteristics of coastal systems that modulate responses to eutrophication and other land-based acidification drivers, and determine the vulnerability of these systems to coastal acidification.
Our methodology provides a transferable framework for parsing out the anthropogenic versus natural dynamics of acidification across broad estuarine salinity spectrums in similar systems. Application of the same methodology would be most appropriate in short residence time systems like Tillamook Bay, where end-member mixing is the dominant driver of within-estuary carbonate chemistry conditions. Our methodological framework would likely be inappropriate for application in long residence time estuaries such as the Chesapeake Bay, which are typically controlled by complex within-estuary biogeochemical processes (Shen et al., 2019) and more suited to coupled hydrodynamic-biogeochemical models (e.g. Li et al., 2023).
Characterizing the balance between river and land-based drivers of acidification versus ocean acidification allows one to look critically at estuarine spatial planning in ways to manage the most immediate impacts on estuarine resources. The scope of the potential efficacy of local management actions will depend upon properly matching these strategies to both the spatial and temporal “footprint” of acidification, as well as the magnitude of water quality impacts. To understand the efficacy of potential management actions and support relevant decision making, it is therefore important to characterize the impacts of acidification drivers that would be targeted by such actions.
OA is the result of anthropogenic CO2 emissions to the atmosphere on a global scale and will therefore require a coordinated international effort to reverse effects on ocean chemistry (Strong et al., 2014). In parallel with addressing global CO2 emissions, there has been interest expressed in the identification of targeted local management and policy actions which effectively ameliorate acidification impacts to coastal and estuarine water quality (Kelly et al., 2011; Strong et al., 2014; Weisberg et al., 2016). Many of the identified possible management actions for curtailing coastal acidification involve reduction of land-based nutrients and other pollutants associated with human land use and urban development, and in-situ carbon removal via phytoremediation or other “blue carbon” strategies. In Tillamook Bay, Cant delivery from the coastal ocean was responsible for the vast majority of anthropogenic carbon loading (Figure 11), making OA the greatest driver of acidification impacts at the whole-estuary scale and ultimately tying local water quality to global atmospheric CO2 emissions. This is likely true for other estuarine systems with low residence times and large tidal prisms, typical of the dozens of U.S. west coast estuaries with small mountainous river watersheds (Bricker et al., 2007). Considering the relatively small loading of anthropogenic riverine carbon to Tillamook Bay, and constraint of most of these land-based water quality impacts to areas with low salinity, reductions of riverine carbon loading alone will be insufficient for amelioration of acidification impacts in most of the estuary. Local management for acidification impacts to water quality in Tillamook Bay may therefore require active interventions, such as possible phytoremediation and other carbon removal strategies. The efficacy of seagrass phytoremediation in Tillamook may be challenged, however, by the already high anthropogenic carbon loading to the bay when compared to typical temperate seagrass carbon removal rates. Current areal rates of anthropogenic carbon loading to Tillamook Bay are ~202 mmol C m-2 d-1 on average, higher than typical temperate seagrass carbon removal rates of ~ 33 mmol C m-2 d-1 (Duarte et al., 2010) (though there is considerable variation in published seagrass areal net primary production). Studies focused on the role of seagrass as a phytoremediation strategy have found seagrasses can raise estuarine pH on the order of ~0.04 units (Koweek et al., 2018) to ~0.07 units (Ricart et al., 2021); much less than the median 0.16 unit pH impact currently experienced in Tillamook Bay. Expansion of seagrass beyond its present extent in Tillamook Bay may also be limited by present and future constraints on suitable habitat and seagrass physiology. Phytoremediation strategies are therefore likely to be most effective as part of a multi-pronged approach for coastal acidification amelioration in Tillamook Bay. Characterization of the anthropogenic carbon loading rates to Tillamook Bay and other estuaries can be used to inform benchmarks for these suites of carbon removal and amelioration strategies.
The largest water quality impacts in Tillamook Bay as estimated by this study occurred at lower salinities (<13) and were the result of enhanced riverine carbon delivery. These impacts were at times an order of magnitude larger than acidification impacts published for open ocean habitats (Figures 9, 10), and highlight both the increased vulnerability of estuaries to acidification, as well as the within-estuary heterogeneity of acidification impacts. Management strategies for riverine water quality would be most effective in ameliorating acidification in these low salinity and highly impacted areas. The low buffering capacity of waters in these low salinity areas, which presently exacerbates acidification impacts to water quality, also means that carbon removal strategies would result in proportionally large improvements in pH (Cai et al., 2021).
Utilizing existing water quality standards to manage for coastal acidification impacts has been proposed and discussed in the coastal management community for over a decade (Kelly et al., 2011), but the efficacy of this approach is challenged by the fact that conditions in coastal waters often fall within the acceptable range of pH criteria (Weisberg et al., 2016). Our findings in Tillamook Bay underline these difficulties. Despite the estimated acidification impacts in Tillamook Bay, all pH observations during the study period fall within the acceptable range of existing pH water quality standards (6.5-8.5 units) relevant for these waters. It has also been suggested that dissolved oxygen standards in Oregon may be protective for acidification impacts due to their relatively high threshold of 6.5 mg/L O2 (Tomasetti and Gobler, 2020). However, our observations show that the lowest pHT and Ωarag conditions in Tillamook Bay, as well as the largest acidification impacts to pHT and Ωarag, often occur when dissolved oxygen concentrations are greater than 6.5 mg/L (Supplementary Figure S10).
Tillamook Bay and similar estuarine systems are likely to face increasing OA pressures for decades to come under even the most optimistic climate change mitigation scenarios. Coastal upwelling systems will likely show a delayed response to atmospheric CO2 trends due to older water ventilation ages, and therefore water quality benefits from any future global efforts to slow atmospheric CO2 growth will not be fully realized in these systems for decades. The dominant influence of OA in Tillamook Bay now and into the future is illustrated by the fact that the additional Cant delivered to the estuary with only one additional year of OA progression (as of 2017) would exceed the current total anthropogenic carbon loading from the watershed (as observed during this study period). This underlines the importance of management and amelioration strategies capable of addressing impacts from global CO2 emissions – whether directly via altered estuarine gas fluxes in systems like the Chesapeake Bay (Da et al., 2021), or via delivery of acidified ocean waters such as seen in Tillamook Bay.
The datasets presented in this study can be found in the U.S. EPA’s ScienceHub repository, DOI: 10.23719/1529988.
SP: Conceptualization, Investigation, Methodology, Project administration, Writing – original draft. CB: Conceptualization, Investigation, Methodology, Project administration, Writing – review & editing. JK: Conceptualization, Investigation, Writing – review & editing. RL: Conceptualization, Project administration, Writing – review & editing. BH: Methodology, Writing – review & editing. TC: Investigation, Writing – review & editing. GW: Methodology, Writing – review & editing.
The author(s) declare financial support was received for the research, authorship, and/or publication of this article. Funding for this work was provided by the U.S. Environmental Protection Agency through the Office of Research and Development’s Regional Applied Research Effort (RARE) program, in partnership with EPA Region 10.
The authors would like to thank the Tillamook Estuaries Partnership for their assistance during the study planning process, Dr. Jody Stecher for assistance with field work, Elizabeth Rutila for GIS mapping support, and Dr. Nicholas Rosenau for providing critical feedback on a previous version of this manuscript. The views expressed in this article are those of the authors and do not necessarily represent the views or policies of the U.S. Environmental Protection Agency. Mention of products or services does not constitute an endorsement.
The authors declare that the research was conducted in the absence of any commercial or financial relationships that could be construed as a potential conflict of interest.
All claims expressed in this article are solely those of the authors and do not necessarily represent those of their affiliated organizations, or those of the publisher, the editors and the reviewers. Any product that may be evaluated in this article, or claim that may be made by its manufacturer, is not guaranteed or endorsed by the publisher.
The Supplementary Material for this article can be found online at: https://www.frontiersin.org/articles/10.3389/fmars.2024.1293955/full#supplementary-material
Ainsworth C. H., Samhouri J. F., Busch D. S., Cheung W. W. L., Dunne J., Okey T. a. (2011). Potential impacts of climate change on Northeast Pacific marine foodwebs and fisheries. ICES J. Mar. Sci. 68 (6), 1217–1229. doi: 10.1093/icesjms/fsr043
Bandstra L., Hales B., Takahashi T. (2006). High-frequency measurements of total CO2: Method development and first oceanographic observations. Mar. Chem. 100 (1–2), 24–38. doi: 10.1016/j.marchem.2005.10.009
Bane J. M., Levine M. D., Samelson R. M., Haines S. M., Meaux M. F., Perlin N., et al. (2005). Atmospheric forcing of the Oregon coastal ocean during the 2001 upwelling season. Journal of Geophysical Research: Oceans 110 (C10). doi: 10.1029/2004JC002653
Barnes R. T., Raymond P. A. (2009). The contribution of agricultural and urban activities to inorganic carbon fluxes within temperate watersheds. Chem. Geol. 266 (3–4), 318–327. doi: 10.1016/j.chemgeo.2009.06.018
Barton A., Hales B., Waldbusser G. G., Langdon C., Feely R. a. (2012). The Pacific oyster, Crassostrea gigas, shows negative correlation to naturally elevated carbon dioxide levels: Implications for near-term ocean acidification effects. Limnol. Oceanogr. 57 (3), 698–710. doi: 10.4319/lo.2012.57.3.0698
Barton A., Waldbusser G., Feely R., Weisberg S., Newton J., Hales B., et al. (2015). Impacts of coastal acidification on the Pacific Northwest shellfish industry and adaptation strategies implemented in response. Oceanography 25 (2), 146–159. doi: 10.5670/oceanog.2015.38
Bednaršek N., Feely R. A., Howes E. L., Hunt B., Kessouri F., León P., et al. (2019). Systematic review and meta-analysis towards synthesis of thresholds of ocean acidification impacts on calcifying pteropods and interactions with warming. Front. Mar. Sci. 6 (APR). doi: 10.3389/fmars.2019.00227
Borges A. V., Gypens N. (2010). Carbonate chemistry in the coastal zone responds more strongly to eutrophication than ocean acidification. Limnol. Oceanogr. 55 (1), 346–353. doi: 10.4319/lo.2010.55.1.0346
Bricker S., Longstaff B., Dennison W., Jones A., Boicourt K., Wicks C., et al. (2007). Effects of Nutrient Enrichment in the Nation's Estuaries: A Decade of Change, National Estuarine Eutrophication Assessment Update. NOAA Coastal Ocean Program Decision Analysis Series No. 26. National Centers for Coastal Ocean Science, Silver Spring, MD.
Busch D., Harvey C. J., McElhany P. (2013). Potential impacts of ocean acidification on the Puget Sound food web. ICES J. 70, 823–833. doi: 10.1093/icesjms/fst061
Busch D. S., McElhany P. (2016). Estimates of the direct effect of seawater pH on the survival rate of species groups in the California current ecosystem. PloS One 11 (8), 1–28. doi: 10.1371/journal.pone.0160669
Cai W. J., Feely R. A., Testa J. M., Li M., Evans W., Alin S. R., et al. (2021). Natural and anthropogenic drivers of acidification in large estuaries. Annu. Rev. Mar. Sci. 13, 23–55. doi: 10.1146/annurev-marine-010419-011004
Cai W.-J., Hu X., Huang W.-J., Murrell M. C., Lehrter J. C., Lohrenz S. E., et al. (2011). Acidification of subsurface coastal waters enhanced by eutrophication. Nat. Geosci. 4 (11), 766–770. doi: 10.1038/ngeo1297
Carstensen J., Chierici M., Gustafsson B. G., Gustafsson E. (2018). Long-term and seasonal trends in estuarine and coastal carbonate systems. Global Biogeochem. Cycles 32, 497–513. doi: 10.1002/2017GB005781
Carstensen J., Duarte C. M. (2019). Drivers of pH variability in coastal ecosystems [Review-article]. Environ. Sci. Technol. 53 (8), 4020–4029. doi: 10.1021/acs.est.8b03655
Chan F., Barth J. A., Blanchette C. A., Byrne R. H., Chavez F., Cheriton O., et al. (2017). Persistent spatial structuring of coastal ocean acidification in the California Current System. Sci. Rep. 7 (September 2016), 2526. doi: 10.1038/s41598-017-02777-y
Colbert D., McManus J. (2003). Nutrient biogeochemistry in an upwelling-influenced estuary of the Pacific Northwest (Tillamook bay, Oregon, USA). Estuaries 26 (5), 1205–1219. doi: 10.1007/BF02803625
Da F., Friedrichs M. A. M., St-Laurent P., Shadwick E. H., Najjar R. G., Hinson K. E. (2021). Mechanisms driving decadal changes in the carbonate system of a coastal plain estuary. J. Geophys. Res.: Oceans 126 (6), 1–23. doi: 10.1029/2021jc017239
Dickson A. G., Wesolowski D. J., Palmer D. A., Mesmer R. E. (1990). Dissociation constant of bisulfate ion in aqueous sodium chloride solutions to 250°C. J. Phys. Chem. 94 (20), 7978–7985. doi: 10.1021/j100383a042
Duarte C. M., Hendriks I. E., Moore T. S., Olsen Y. S., Steckbauer A., Ramajo L., et al. (2013). Is ocean acidification an open-ocean syndrome? Understanding anthropogenic impacts on seawater pH. Estuaries Coasts 36 (2), 221–236. doi: 10.1007/s12237-013-9594-3
Duarte C. M., Marba N., Gacia E., Fourqurean J. W., Beggins J., Barron C., et al. (2010). Seagrass community metabolism: Assessing the carbon sink capacity of seagrass meadows. Global Biogeochem. Cycles 24 (4), 1–8. doi: 10.1029/2010GB003793
Egleston E. S., Sabine C. L., Morel F. M. M. (2010). Revelle revisited: Buffer factors that quantify the response of ocean chemistry to changes in DIC and alkalinity. Global Biogeochem. Cycles 24 (1), 1–9. doi: 10.1029/2008GB003407
Evans W., Pocock K., Hare A., Weekes C., Hales B., Jackson J., et al. (2019). Marine CO2 patterns in the Northern Salish sea. Front. Mar. Sci. 5 (JAN). doi: 10.3389/fmars.2018.00536
Fairchild W., Hales B. (2021). High-resolution carbonate system dynamics of Netarts bay, OR from 2014 to 2019. Front. Mar. Sci. 7 (January). doi: 10.3389/fmars.2020.590236
Feely R. A., Alin S. R., Carter B., Bednaršek N., Hales B., Chan F., et al. (2016). Chemical and biological impacts of ocean acidification along the west coast of North America. Estuarine Coast. Shelf Sci. 183, 260–270. doi: 10.1016/j.ecss.2016.08.043
Feely R. A., Okazaki R. R., Cai W., Bednar N., Alin S. R., Byrne R. H., et al. (2018). The combined effects of acidification and hypoxia on pH and aragonite saturation in the coastal waters of the California current ecosystem and the northern Gulf of Mexico. Continent. Shelf Res. 152 (July 2017), 50–60. doi: 10.1016/j.csr.2017.11.002
Feely R. A., Sabine C. L., Hernandez-Ayon J. M., Ianson D., Hales B. (2008). Evidence for upwelling of corrosive “acidified” water onto the continental shelf. Science 320 (5882), 1490–1492. doi: 10.1126/science.1155676
Gazeau F., Parker L. M., Comeau S., Gattuso J. P., O’Connor W. A., Martin S., et al. (2013). Impacts of ocean acidification on marine shelled molluscs. Mar. Biol. 160 (8), 2207–2245. doi: 10.1007/s00227-013-2219-3
Gruber N., Sarmiento J. L., Stocker T. F. (1996). An improved method for detecting anthropogenic CO2 in the oceans. Global Biogeochem. Cycles 10 (4), 809–837. doi: 10.1029/96GB01608
Hales B., Chipman D. W., Takahashi T. T. (2004). High-frequency measurement of partial pressure and total concentration of carbon dioxide in seawater using microporous hydrophobic membrane contactors. Limnol. Oceanogr.: Methods 2, 356–364. doi: 10.4319/lom.2004.2.356
Hales B., Takahashi T., Bandstra L. (2005). Atmospheric CO2 uptake by a coastal upwelling system. Global Biogeochem. Cycles 19 (1), 1–11. doi: 10.1029/2004GB002295
Hales B., Suhrbier A., Waldbusser G. G., Feely R. A., Newton J. A. (2017). The carbonate chemistry of the “Fattening Line,” Willapa Bay, 2011–2014. Estuaries and Coasts 40 (1), 173–186. doi: 10.1007/s12237-016-0136-7
Hare A., Evans W., Pocock K., Weekes C., Gimenez I. (2020). Contrasting marine carbonate systems in two fjords in British Columbia, Canada: Seawater buffering capacity and the response to anthropogenic CO2 invasion. PloS One 15 (9 September), 1–26. doi: 10.1371/journal.pone.0238432
Harris K. E., DeGrandpre M. D., Hales B. (2013). Aragonite saturation state dynamics in a coastal upwelling zone. Geophys. Res. Lett. 40 (11), 2720–2725. doi: 10.1002/grl.50460
Hickey B. M., Banas N. S. (2003). Oceanography of the U. S. Pacific Northwest coastal ocean and estuaries with application to coastal ecology. Estuaries 26 (4), 1010–1031. doi: 10.1007/BF02803360
Hu X., Pollack J. B., Mccutcheon M. R., Montagna P. A., Ouyang Z. (2015). Long-Term Alkalinity Decrease and Acidi fi cation of Estuaries in Northwestern Gulf of Mexico. Environmental Science & Technology 49 (6), 3401–3409. doi: 10.1021/es505945p
Iles A. C., Gouhier T. C., Menge B. a., Stewart J. S., Haupt A. J., Lynch M. C. (2012). Climate-driven trends and ecological implications of event-scale upwelling in the California Current System. Global Change Biol. 18 (2), 783–796. doi: 10.1111/j.1365-2486.2011.02567.x
Joesoef A., Kirchman D. L., Sommerfield C. K., Cai W. (2017). Seasonal variability of the inorganic carbon system in a large coastal plain estuary. 14 (21), 4949–4963. doi: 10.5194/bg-14-4949-2017
Kaushal S. S., Duan S., Doody T. R., Haq S., Smith R. M., Newcomer Johnson T. A., et al. (2017). Human-accelerated weathering increases salinization, major ions, and alkalinization in fresh water across land use. Appl. Geochem. 83, 121–135. doi: 10.1016/j.apgeochem.2017.02.006
Kelly R. P., Foley M. M., Fisher W. S., Feely R. A., Halpern B. S., Waldbusser G. G., et al. (2011). Mitigating local causes of ocean acidification with existing laws. Science 332 (6033), 1036–1037. doi: 10.1126/science.1203815
Komar P. D., Mcmanus J., Styllas M. (2004). Sediment accumulation in Tillamook bay, Oregon : natural processes versus human impacts. The Journal of Geology 112, 455–469. doi: 10.1086/421074
Koweek D. A., Zimmerman R. C., Hewett K. M., Gaylord B., Giddings S. N., Nickols K. J., et al. (2018). Expected limits on the ocean acidification buffering potential of a temperate seagrass meadow. Ecol. Appl. 28 (7), 1694–1714. doi: 10.1002/eap.1771
Laurent A., Fennel K., Ko D. S., Lehrter J. (2018). Climate change projected to exacerbate impacts of coastal eutrophication in the Northern gulf of Mexico. J. Geophys. Res.: Oceans 123 (5), 3408–3426. doi: 10.1002/2017JC013583
Lee K., Kim T., Byrne R. H., Millero F. J., Feely R. A., Liu Y. (2010). The universal ratio of boron to chlorinity for the North Pacific and North Atlantic oceans. Geochim. Cosmochimica Acta 74 (6), 1801–1811. doi: 10.1016/j.gca.2009.12.027
Lewis E., Wallace D. (1998). “Program developed for CO2 system calculations,” in Ornl/Cdiac-105, 1–21. Available at: http://cdiac.esd.ornl.gov/oceans/co2rprtnbk.html.
Li M., Guo Y., Cai W. J., Testa J. M., Shen C., Li R., et al. (2023). Projected increase in carbon dioxide drawdown and acidification in large estuaries under climate change. Commun. Earth Environ. 4, 68. doi: 10.1038/s43247-023-00733-5
Marshall K. N., Kaplan I. C., Hodgson E. E., Hermann A., Busch D. S., McElhany P., et al. (2017). Risks of ocean acidification in the California Current food web and fisheries: ecosystem model projections. Global Change Biol. 23 (4), 1525–1539. doi: 10.1111/gcb.13594
Meinshausen M., Smith S. J., Calvin K., Daniel J. S., Kainuma M. L. T., Lamarque J.-F., et al. (2011). The RCP greenhouse gas concentrations and their extensions from 1765 to 2300. Climatic Change 109, 213. doi: 10.1007/s10584-011-0156-z
Meinvielle M., Johnson G. C. (2013). Decadal water-property trends in the California Undercurrent, with implications for ocean acidification. J. Geophys. Res.: Oceans 118 (12), 6687–6703. doi: 10.1002/2013JC009299
Millero F. J. (2010). Carbonate constants for estuarine waters. Millero 2001, 139–142. doi: 10.1071/MF09254
Murray J. W., Roberts E., Howard E., O’Donnell M., Bantam C., Carrington E., et al. (2015). An inland sea high nitrate-low chlorophyll (HNLC) region with naturally high pCO2. Limnol. Oceanogr. 60 (3), 957–966. doi: 10.1002/lno.10062
Shirzad F. F., Orlando S. P., Klein C. J., Holliday S. E., Warren M. A., Monaco M. E. (1988). Physical and hydrologic characteristics, the Oregon estuaries. National estuarine inventory ; Supplement 1. United States, Ocean Assessments Division., Strategic Assessment Branch, Rockville, MD. https://repository.library.noaa.gov/view/noaa/2853
Oh N., Raymond P. A. (2006). Contribution of agricultural liming to riverine bicarbonate export and CO 2 sequestration in the Ohio River basin. Global Biogeochemical Cycles 20, 1–17. doi: 10.1029/2005GB002565
Pacella S. R., Brown C. A., Waldbusser G. G., Labiosa R. G., Hales B. (2018). Seagrass habitat metabolism increases short-term extremes and long-term offset of CO 2 under future ocean acidification. Proc. Natl. Acad. Sci. United States America 115 (15), 3870–3875. doi: 10.1073/pnas.1703445115
Provoost P., van Heuven S., Soetaert K., Laane R. W. P. M., Middelburg J. J. (2010). Seasonal and long-term changes in pH in the Dutch coastal zone. Biogeosciences 7 (11), 3869–3878. doi: 10.5194/bg-7-3869-2010
Raymond P. A., Hamilton S. K. (2018). Anthropogenic influences on riverine fluxes of dissolved inorganic carbon to the oceans. Limnol. Oceanogr. Lett. 3 (3), 143–155. doi: 10.1002/lol2.10069
Raymond P. A., Oh N. H., Turner R. E., Broussard W. (2008). Anthropogenically enhanced fluxes of water and carbon from the Mississippi River. Nature 451 (7177), 449–452. doi: 10.1038/nature06505
Rheuban J. E., Doney S. C., McCorkle D. C., Jakuba R. W. (2019). Quantifying the effects of nutrient enrichment and freshwater mixing on coastal ocean acidification. J. Geophys. Res.: Oceans 124 (12), 9085–9100. doi: 10.1029/2019JC015556
Ricart A. M., Ward M., Hill T. M., Sanford E., Kroeker K. J., Takeshita Y., et al. (2021). Coast-wide evidence of low pH amelioration by seagrass ecosystems. Global Change Biol. 27 (11), 2580–2591. doi: 10.1111/gcb.15594
Riebesell U., Fabry V. J., Hansson L., Gattuso J. P. (2010). Guide to best practices for ocean acidification research and data reporting. European Commission, Directorate-General for Research and Innovation. Publications Office of the European Union. doi: 10.2777/66906
Shanks O. C., Nietch C., Simonich M., Younger M., Reynolds D., Field K. G. (2006). Basin-wide analysis of the dynamics of fecal contamination and fecal source identification in Tillamook Bay, Oregon. Appl. Environ. Microbiol. 72 (8), 5537–5546. doi: 10.1128/AEM.03059-05
Shen C., Testa J. M., Li M., Cai W. J., Waldbusser G. G., Ni W., et al. (2019). Controls on carbonate system dynamics in a coastal plain estuary: A modeling study. J. Geophys. Res.: Biogeosci. 124 (1), 61–78. doi: 10.1029/2018JG004802
State of Oregon Department of Environmental Quality (2023). Draft methodology for assessing ocean acidification and hypoxia impacts in Oregon: technical support document. Portland, OR. Available at: https://www.oregon.gov/deq/wq/Documents/ir2024oahTechPaper.pdf
Stets E. G., Kelly V. J., Crawford C. G. (2014). Long-term trends in alkalinity in large rivers of the conterminous US in relation to acidification, agriculture, and hydrologic modification. Sci. Total Environ. 488–489 (1), 280–289. doi: 10.1016/j.scitotenv.2014.04.054
Strong A. L., Kroeker K. J., Teneva L. T., Mease L. A., Kelly R. P. (2014). Ocean acidification 2.0: Managing our Changing Coastal Ocean Chemistry. BioScience 64 (7), 581–592. doi: 10.1093/biosci/biu072
Sullivan T. J., Snyder K. U., Gilbert E., Bischoff J. M., Wustenberg M., Moore J., et al. (2005). Assessment of water quality in association with land use in the Tillamook Bay Watershed, Oregon, USA. Water Air Soil pollut. 161 (1–4), 3–23. doi: 10.1007/s11270-005-2443-7
Sunda W. G., Cai W. (2012). Eutrophication induced CO 2 -acidification of subsurface coastal waters: interactive effects of temperature, salinity, and atmospheric P CO 2. Environ. Sci. Technol. 46 (19), 10651–10659. doi: 10.1021/es300626f
Tillamook Estuaries Partnership (2015) State of the Bays 2015: Health Report. Available at: http://www.tbnep.org/reports-and-publications.php.
Tomasetti S. J., Gobler C. J. (2020). Dissolved oxygen and pH criteria leave fisheries at risk. Science 368 (6489), 372–373. doi: 10.1126/science.aba4896
Turi G., Lachkar Z., Gruber N., Münnich M. (2016). Climatic modulation of recent trends in ocean acidification in the California Current System. Environ. Res. Lett. 11 (1). doi: 10.1088/1748-9326/11/1/014007
USDA-NASS (2012). Census of Agriculture County Profile Tillamook County – Oregon. Available at: https://agcensus.library.cornell.edu/wp-content/uploads/2012-Oregon-cp41057.pdf
Van Dam B. R., Wang H. (2019). Decadal-scale acidification trends in adjacent North Carolina estuaries: Competing role of anthropogenic CO 2 and riverine alkalinity loads. Front. Mar. Sci. 6 (MAR). doi: 10.3389/fmars.2019.00136
Waldbusser G. G., Voigt E. P., Bergschneider H., Green M. A., Newell R. I. E. (2011). Biocalcification in the Eastern Oyster (Crassostrea virginica) in Relation to Long-term Trends in Chesapeake Bay pH. Estuaries Coasts 34 (2), 221–231. doi: 10.1007/s12237-010-9307-0
Weisberg S. B., Bednaršek N., Feely R. A., Chan F., Boehm A. B., Sutula M., et al. (2016). Water quality criteria for an acidifying ocean: Challenges and opportunities for improvement. Ocean Coast. Manage. 126, 31–41. doi: 10.1016/j.ocecoaman.2016.03.010
Wheatcroft R. a., Goñi M. a., Richardson K. N., Borgeld J. C. (2013). Natural and human impacts on centennial sediment accumulation patterns on the Umpqua River margin, Oregon. Mar. Geol. 339, 44–56. doi: 10.1016/j.margeo.2013.04.015
Wise D. R., Johnson H. M. (2011). Surface-water nutrient conditions and sources in the United States Pacific northwest. J. Am. Water Resour. Assoc. 47 (5), 1110–1135. doi: 10.1111/j.1752-1688.2011.00580.x
Keywords: ocean acidification, climate change, CO2 emissions, water quality, estuary, assessment
Citation: Pacella SR, Brown CA, Kaldy JE, Labiosa RG, Hales B, Mochon Collura TC and Waldbusser GG (2024) Quantifying the combined impacts of anthropogenic CO2 emissions and watershed alteration on estuary acidification at biologically-relevant time scales: a case study from Tillamook Bay, OR, USA. Front. Mar. Sci. 11:1293955. doi: 10.3389/fmars.2024.1293955
Received: 14 September 2023; Accepted: 15 January 2024;
Published: 02 February 2024.
Edited by:
Robinson W. (Wally) Fulweiler, Boston University, United StatesReviewed by:
Jacob Carstensen, Aarhus University, DenmarkCopyright © 2024 Pacella, Brown, Kaldy, Labiosa, Hales, Mochon Collura and Waldbusser. This is an open-access article distributed under the terms of the Creative Commons Attribution License (CC BY). The use, distribution or reproduction in other forums is permitted, provided the original author(s) and the copyright owner(s) are credited and that the original publication in this journal is cited, in accordance with accepted academic practice. No use, distribution or reproduction is permitted which does not comply with these terms.
*Correspondence: Stephen R. Pacella, cGFjZWxsYS5zdGVwaGVuQGVwYS5nb3Y=
Disclaimer: All claims expressed in this article are solely those of the authors and do not necessarily represent those of their affiliated organizations, or those of the publisher, the editors and the reviewers. Any product that may be evaluated in this article or claim that may be made by its manufacturer is not guaranteed or endorsed by the publisher.
Research integrity at Frontiers
Learn more about the work of our research integrity team to safeguard the quality of each article we publish.