 Eugenio Ruiz-Castillo
 Josefa Verdugo
 Sergei Kirillov
 Igor Dmitrenko
 Wieter Boone
 Søren Rysgaard1
- 1Arctic Research Centre, Department of Biology, Aarhus University, Aarhus, Denmark
- 2Centre for Earth Observation Science, University of Manitoba, Winnipeg, MB, Canada
- 3Marine Robotics Centre, Flanders Marine Institute, Ostend, Belgium
We combined records from moorings, profilers, and CTD transects obtained in an Arctic fjord (Young Sound, Greenland) to assess the effects of local meltwater input at the beginning of ice melt while the fjord was still covered by ice. Results indicate that light penetrated below the ice and was available throughout the sampling period. Melting began at the mouth, where the ice and snow layers were thinner. At the mouth, meltwater triggered stratification and the onset of an under-ice phytoplankton bloom, as shown by an increase in chlorophyll-a (chl-a), fluorescence-CDOM, and oxygen saturation. Chl-a was highly correlated with salinity (−0.84) and temperature (0.88), indicating a strong association with the input of meltwater, while the maximums in chl-a and oxygen matched the distribution of the meltwater. At the mouth, in the area where the meltwater occurred, average chl-a increased from 0.27 mg m−3 to 0.40 mg m−3, and by the end of the record, it was three times greater than the surrounding waters. In the area of the patch of meltwater on 26–28 May, averaged oxygen increased by 4%–5% during the sampling period. Inside the fjord, patches of meltwater occurred and were advected from the mouth by an in-fjord flow. Within these patches of meltwater, chl-a and oxygen saturation increased, and by the end of the record, they were two times and 5% higher than the surrounding waters, respectively. This study shows that meltwater and stratification were more important than light for the onset of the under-ice bloom and suggests a significant portion of pelagic primary productivity occurs before ice breakup.
1 Introduction
In the Arctic, the environmental conditions have changed in the last few decades. Changes include a reduction in the sea ice thickness and concentration (Carmack et al., 2015; Kwok, 2018; Stroeve and Notz, 2018), freshening (Carmack et al., 2016; Proshutinsky et al., 2019), and longer melt seasons (Belchansky et al., 2004; Stroeve et al., 2014). These changes have driven an increase in the volume of meltwater in the water column (Yamamoto-Kawai et al., 2009; Korhonen et al., 2013; Rabe et al., 2014). In the last decade, considerable attention has been drawn to the evolution and effects of meltwater on physical and biological processes (e.g., Brown et al., 2020; Solomon et al., 2021). Meltwater input triggers stratification and thickens the halocline (Randelhoff et al., 2017). This stabilizes the upper part of the water column, enabling phytoplankton to remain in the euphotic layer, which promotes the development of phytoplankton blooms (Cherkasheva et al., 2014; Oziel et al., 2019) until nutrients are depleted. With a thicker halocline, the effects of wind-driven mixing/ventilation are limited to relatively shallow depths (Lincoln et al., 2016; Polyakov et al., 2020). This constrains upward entrainment of deeper and nutrient-rich waters into the euphotic layer, impeding further phytoplankton blooms and concomitant carbon drawdown (Slagstad et al., 2015; Brown et al., 2020).
The regional and short-term response to meltwater input during the transition period from ice-covered to ice-free conditions is less addressed and remains poorly understood. One of the main hindrances to this is the fact that melting begins while the water column is still covered by ice (Boone et al., 2017; Salganik et al., 2023). This imposes a physical barrier that hinders sampling of the water column with in situ measurements and obstructs remote sensing observations. Moreover, the input of meltwater into the ocean is largely affected by the different ice and snow conditions. The snow cover acts as an insulating layer that separates ice from the atmospheric heat, and thus, a thinner layer of snow might result in an earlier onset of melting (Wagner et al., 2022). Seasonal melting of snow starts earlier than ice (Geilfus et al., 2023), and, in permeable ice conditions, snow meltwater may drain into the water column and freshen the water under the ice cover (Fetter and Untersteiner, 1998). In principle, after the onset of meltwater input in spring, the environmental conditions such as light availability and stability of the water column are ideal for the development of under-ice phytoplankton blooms (Ardyna et al., 2020). However, due to the scarcity of under-ice records spanning throughout the melting period, the effects of meltwater on the water column structure and the triggering of phytoplankton blooms are not fully elucidated. The general view is that under-ice blooms develop once light conditions suffice to maintain phytoplankton growth. However, the evidence presented here indicates that meltwater input and consequent stratification play a more determinant role in the triggering of under-ice phytoplankton blooms. In this study, we focus on the beginning of the melting period (May–June), while the water is still covered by ice. We describe the onset of melting and address the effects of meltwater on the hydrography and the consequent impact on the development of under-ice phytoplankton blooms.
Our study area is Young Sound Fjord, located in northeast Greenland (Figures 1A–C). This fjord receives runoff from land-terminating glaciers located ~90 km from the mouth (Rysgaard et al., 2003). The width of the fjord varies from ~2 km in the inner part to 7–8 km at the mouth (Rysgaard et al., 2003). At the entrance of Young Sound, there is a 45-m sill that separates the relatively cold waters of the fjord from the warmer waters of the shelf (Boone et al., 2018). The water column in the fjord and shelf sea is highly stratified during the ice-free period (Rysgaard and Nielsen, 2006), while in winter stratification weakens in the top 40 m, leading to nearly homogenous hydrographic conditions (Rysgaard et al., 1999). On average, Young Sound is ice-covered 9–10 months a year between September–October and mid-July (Rysgaard et al., 1998; Rysgaard et al., 1999; Rysgaard et al., 2003).

Figure 1 Map of (A) Greenland and (B, C) Young Sound Fjord. In (A), the red box shows the location of Young Sound. In (B), the blue dots represent the location of the CTD casts carried out in the period 30 April–10 June, and the red square shows the area in (C). In (C), the light-blue diamonds indicate the location of the moorings. Photosynthetically active radiation (PAR) for the periods (D) 4–5 May, (E) 10–12 May, (F) 18–19 May, and (G) 26–28 May. In (D–G), red and black contours represent the 20- and 0.5-μmol photons m−2 s−1 of PAR, respectively. Average velocity (vectors) and the major and minor axes of the variability of the velocity (blue lines) at 12 m depth for the periods (H) 1–15 May and (I) 15 May–6 June.
2 Method
We used observations from conductivity, temperature, and depth (CTD) casts, moorings, and a profiler between 30 April and 10 June 2014 to assess the hydrographic variability and implications on phytoplankton blooms during the beginning of ice melting in Young Sound (Figures 1B, C). The location of the CTD casts and moorings was referenced to their relative distance to YS5 located at the sill, such that the distance at the sill equals 0 km and is negative toward the head of the fjord. Along the fjord, a CTD Sea-Bird 19plus (SBE-19+) was lowered through ice-drilled holes to sample temperature, salinity, dissolved oxygen, fluorescence (Seapoint), and photosynthetically active radiation (PAR, Biospherical, Licor). Most of the CTD casts (>95%) used in this study were carried out during daylight conditions between 8 and 18 h local time. Fluorescence from CTD casts was calibrated with in situ samples of chlorophyll-a (chl-a) that were obtained as part of the Greenland Ecosystem Monitoring and from the Arctic Science Partnership (ASP) sea ice campaign in Young Sound in 2014. In addition to the CTD casts, the YS5 time series of temperature and salinity were recorded with a CTD SBE-52 Moored profiler (SBE-52 MP), and a WetLab ECO triplet was used to record fluorescence (chl-a and colored dissolved organic matter (CDOM)). These time series covered the upper 30–35 m and had a temporal resolution of 30 min. Both instruments were mounted on a McLane ice-tethered profiler (see Boone et al., 2017). We estimated the chl-a concentration at YS5 using the calibrated fluorescence data from the CTD casts. Conservative temperature, absolute salinity, potential density, and oxygen saturation relative to the atmosphere were computed using the TEOS-10 functions (McDougall and Barker, 2011). The time series of currents in the water column were measured along the fjord at different mooring sites. At YS2 and YS3, currents were recorded using an RDI Sentinel-300 kHz ADCP at a temporal resolution of 10 min, while at YS5–YS6, currents were measured with a Nortek Aquadopp-600 kHz ADCP at a temporal resolution of 5 min. At the vicinity of the sill (YS5–YS6), only current data spanning between 2.5 m and 30 m were adequately recorded. Further details on the data sets can be found in Boone et al. (2017). The semidiurnal tide was filtered out from the velocity records by the use of a low-pass band Lanczos filter with a cut-off frequency of 30 h−1. Gaps in the records of absolute salinity, conservative temperature, chl-a, and fluorescence-CDOM were observed below 25 m and were probably caused by events of strong currents that hampered the profiler (Boone et al., 2017). For these records, the semidiurnal tide was removed using a running average window of 30 h. At YS5, filtered velocities were rotated (10°) to coincide with the along- (u(t)) and cross-fjord (v(t)) directions, where negative values indicate in-fjord flow and 90° to the left of the in-fjord direction referred to as southward. Positive values indicate out-fjord and northward flow. To assess the extension of the ice sheet, we use satellite images obtained from the Danish Meteorological Institute (https://ocean.dmi.dk/arctic/daneborg.uk.php).
3 Results
3.1 Ice-meltwater input and onset of stratification
Throughout May 2014, Young Sound was under ice, and the sea ice cover extended 30-40 km of the sill (YS5) into the Greenlandic shelf (Figure 2). Below the ice, three patches of fresher water bounded by the 32.35-g kg−1 isohaline appeared and deepened into the water column (Figures 3A–D). On 4–5 and 10–12 May, a patch of fresher water occurred at 2–11 km in the upper 5 m (Figures 3A, B). Afterward, the length and extension of this fresher patch increased, deepened to 20 m, and extended from −3 km to 14.5 km on 18–19 May (Figure 3C). By 26–28 May, the fresher water reached ~45 m depth, while the area it covered extended further into the fjord from −6 km to 14.5 km (Figure 3D). Interestingly, freshening within the patch occurred at the surface throughout the record. The lowest salinity on 4–5 May was 32.25 g kg−1 and decreased to below 32.15 g kg−1 by 26–28 May (Figures 3A–D). A second patch of fresher water appeared in the upper 5 m at −10 km on 18–19 May (Figure 3C). By 26–28 May, this patch deepened to ~25 m and extended from −15 km to −6 km (Figure 3D). At the surface, freshening within this patch occurred as well. The lowest salinity was below 32.35 g kg−1 on 18–19 May and was <32.25 g kg−1 on 26–28 May. Between −25 km and −15 km, a third patch of fresher water occurred on 26–28 May in the upper 10 m and had the lowest salinities below 32.25 g kg−1 at the surface. Decreases in salinity at the surface throughout the record indicate continued input of freshwater.
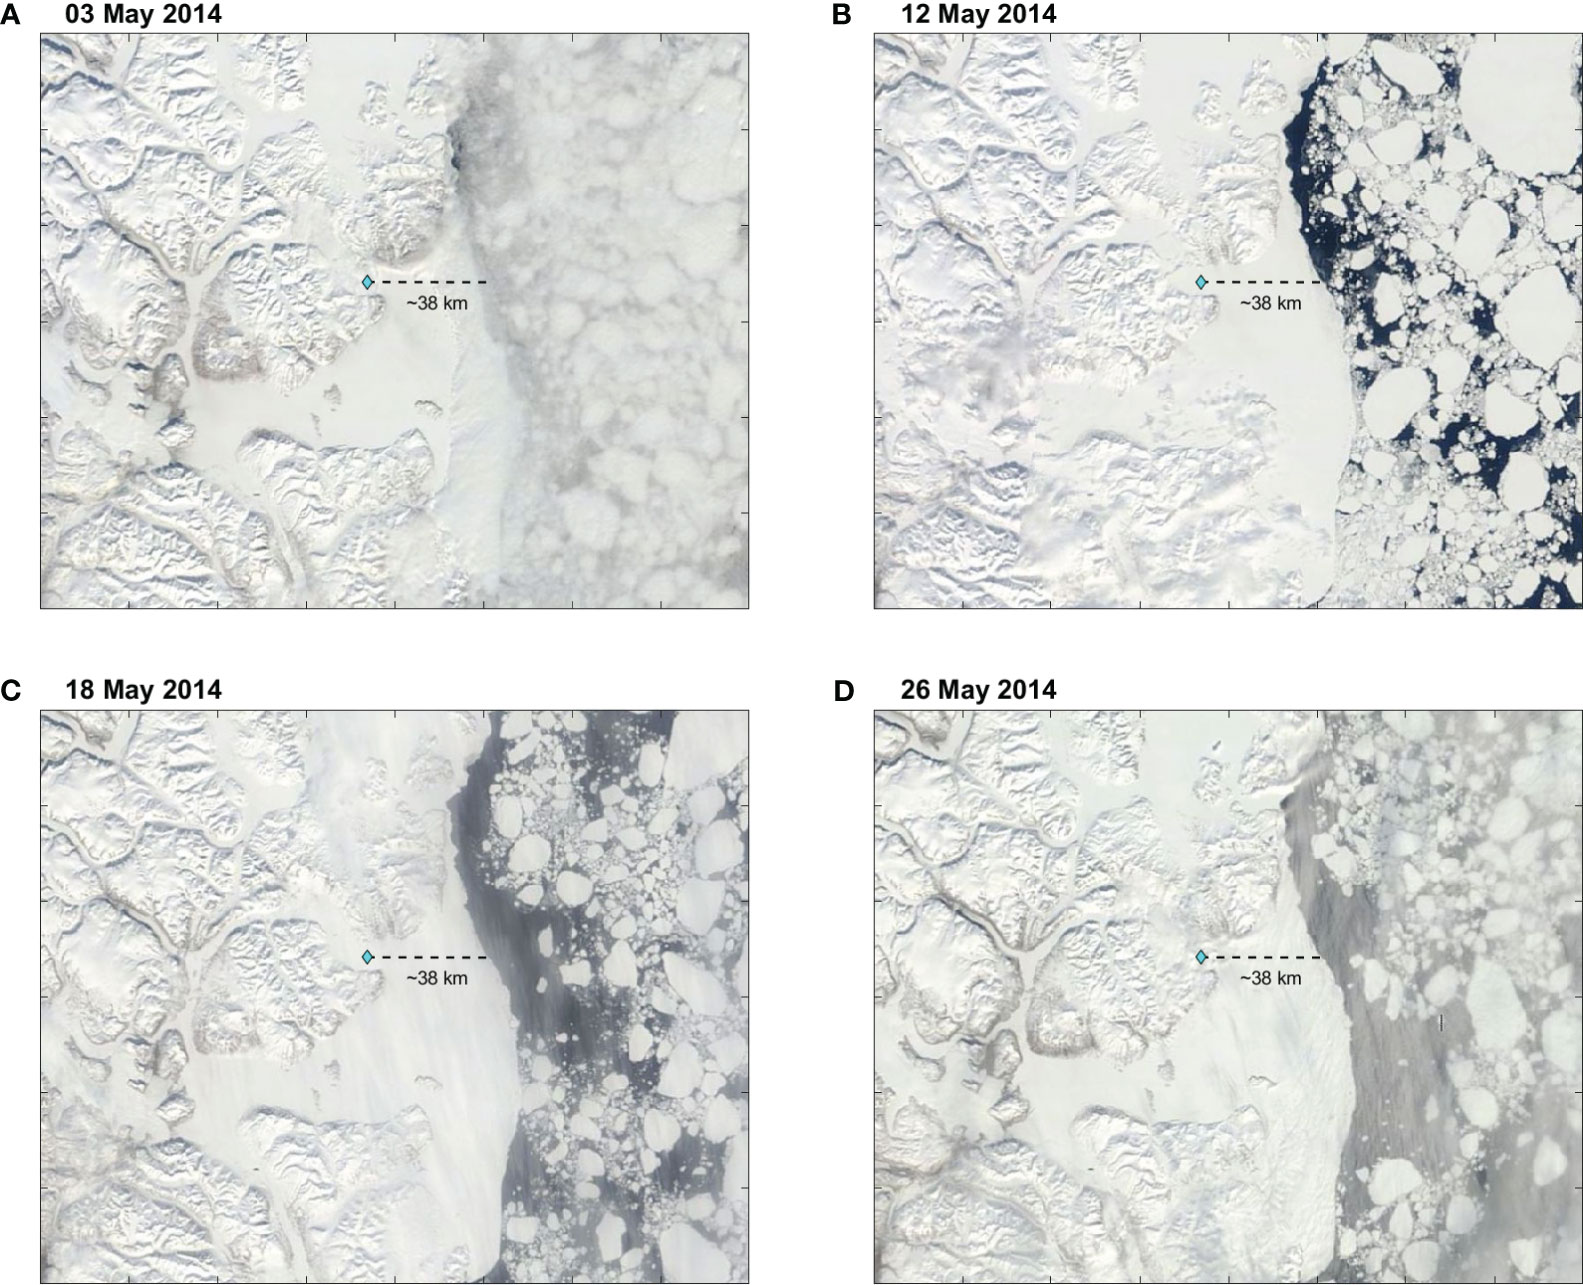
Figure 2 Satellite images of Northeast Greenland for (A) 03 May 2014, (B) 12 May 2014, (C) 18 May 2014, and (D) 26 May 2014. The light blue diamond indicates the location of the mooring at YS5. The dashed line shows the distance to the ice edge.
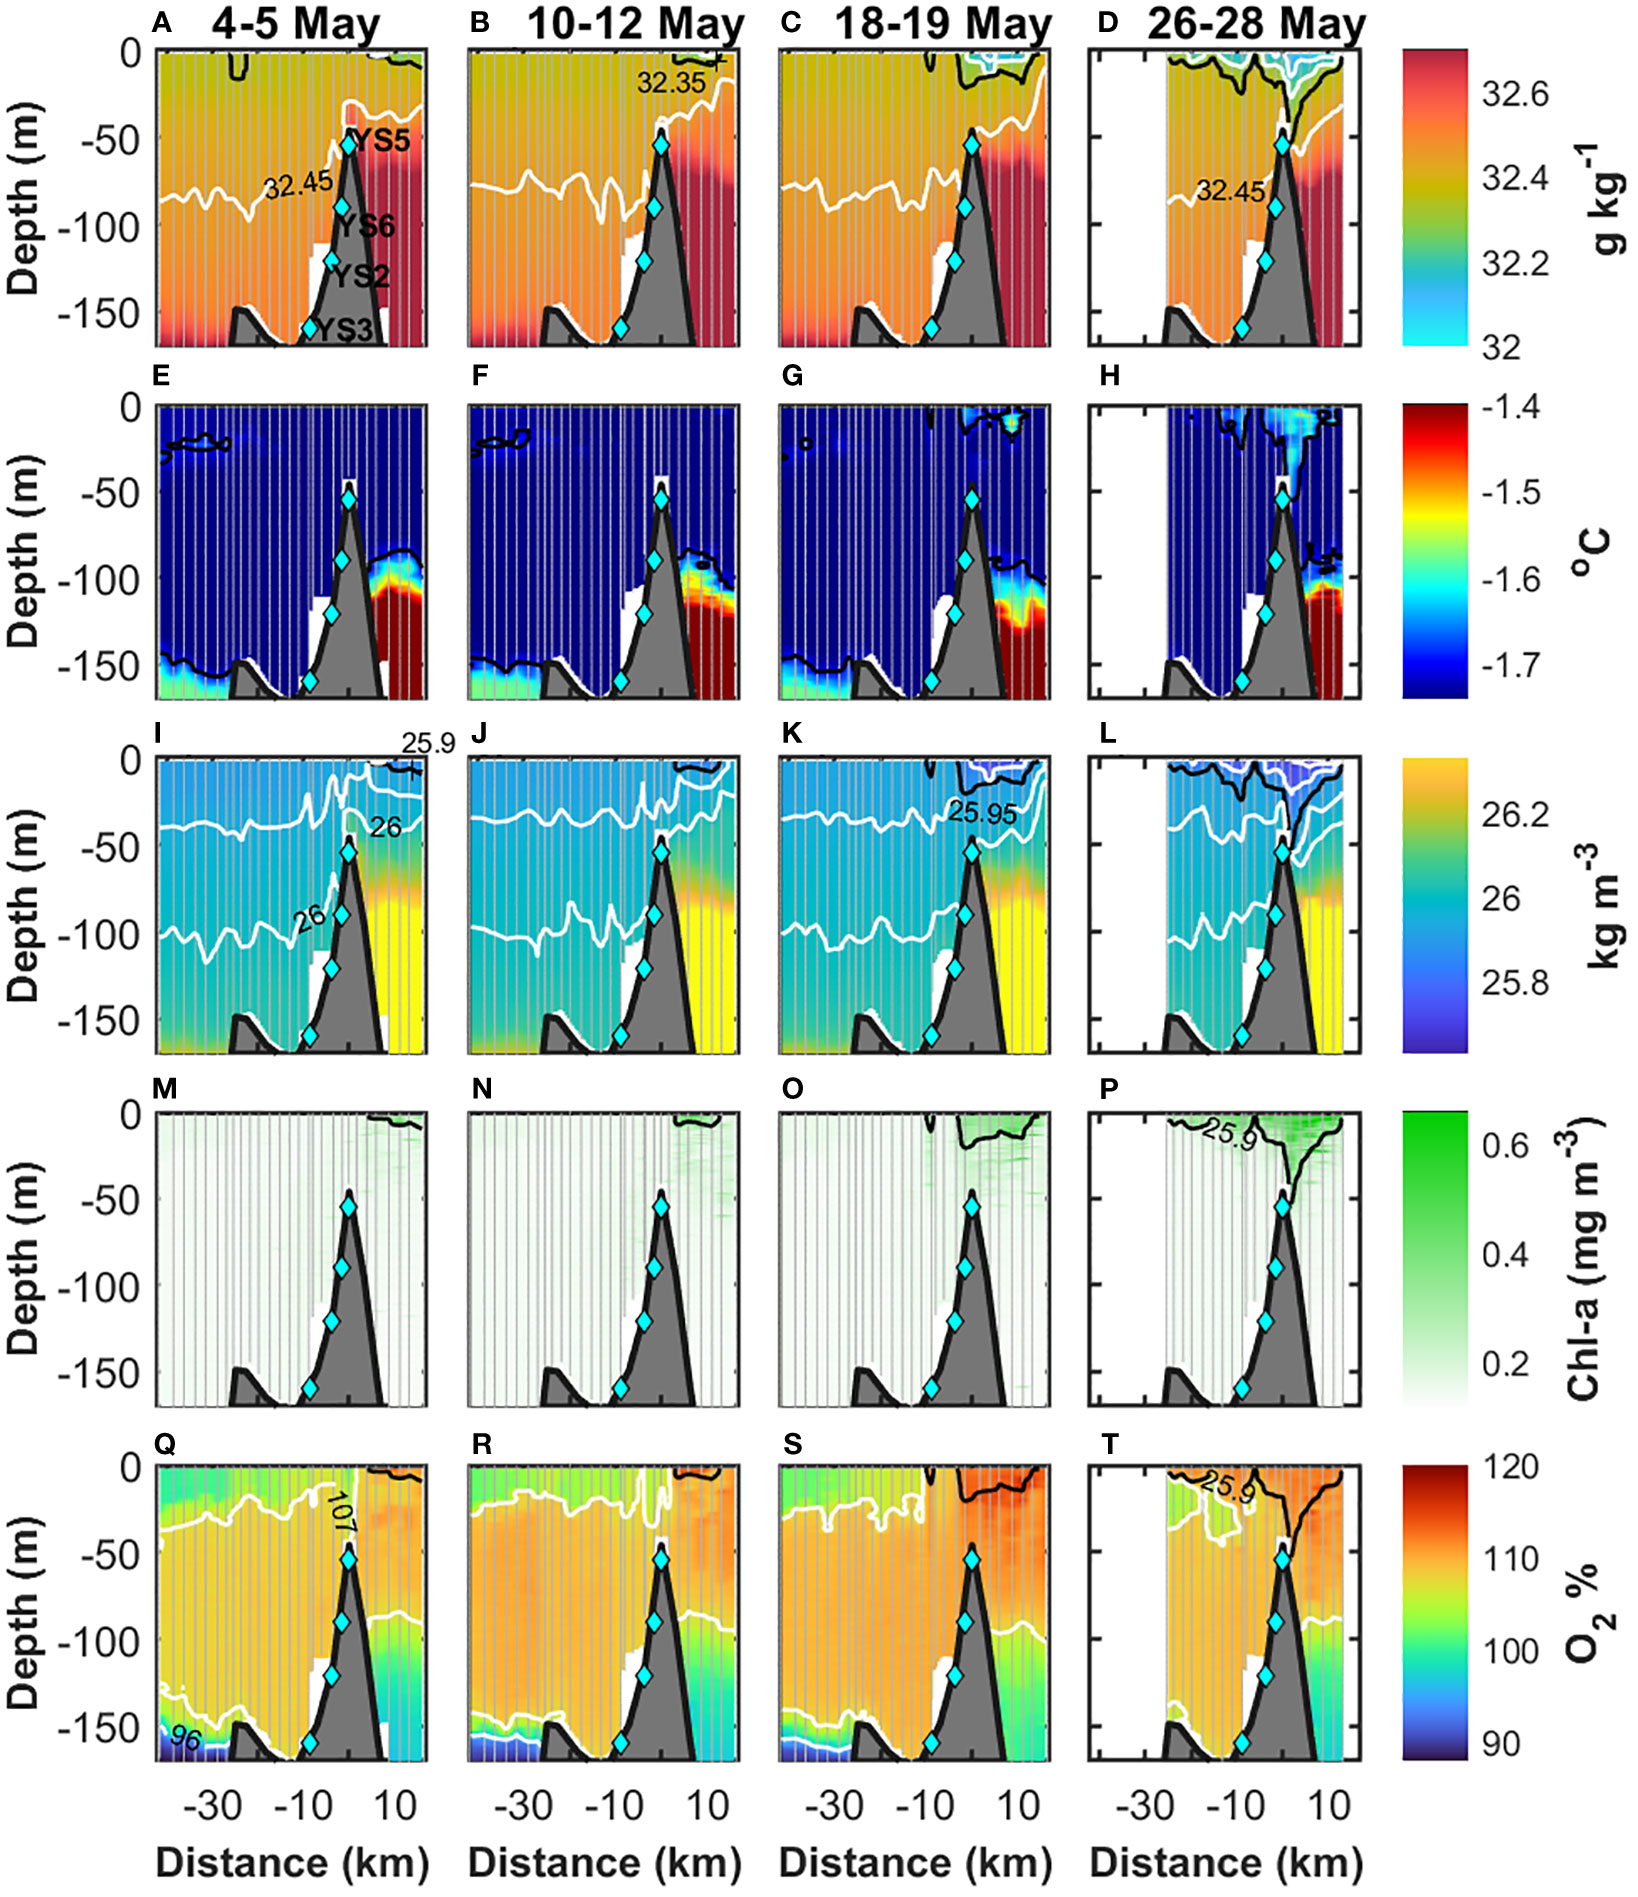
Figure 3 Along fjord sections of (A–D) absolute salinity, (E–H) conservative temperature, (I–L) potential density, (M–P) chlorophyll-a concentration, and (Q–T) oxygen saturation relative to the atmosphere. The period each section represents is indicated in the top row. In (A–D), the black and white contours represent the 32.35-g kg−1 and the 32.15-g kg−1, 32.25-g kg−1, and 32.45-g kg−1 isohalines, respectively. In (E–H), the black contour represents the −1.7 C isotherm. In (I–L), the black represents the 25.9-kg m−3 density contour and in white the 25.7 kg m−3, 25.8 kg m−3, 25.95 kg m−3, and 26 kg m−3. In (M–P), chl-a with the 25.9-kg m−3 density contour (black). In (Q–T), the white contours represent 96% and 107%, and the black contour is the 25.9-kg m−3 density. The light-blue diamonds indicate the location of the moorings.
Increases in temperature occurred where freshening was observed (Figures 3E–H). On 4–12 May, the temperature in the upper 50 m was near the freezing point (≤1.74°C) (Figures 3E, F). Later, by 26–28 May, the temperature inside the patches of fresher water at the mouth of Young Sound and at −10 km increased to an average of −1.65°C and −1.68°C, respectively (Figure 3H). The maximum temperatures were above −1.55°C at the mouth of Young Sound, while they reached −1.63°C at −10 km. Within the patch of fresher water located between −25 km and −15 km, changes in the average temperature were minimal (<0.01°C), although the maximum temperature observed was −1.69°C. Outside the patches of fresher water, the temperature in the upper 50 m remained relatively constant (~−1.74°C) throughout the record.
Density above the 25.95-kg m−3 contour showed the same patterns described in the sections of salinity (Figures 3I–L). The patches of relatively low salinity led to the occurrence of waters with relatively low density (<25.9 kg m−3). Within the three patches of lighter water, density decreased from 25.9 kg m−3 on 10–12 May to <25.8 kg m−3 on 26–28 May, with minimum values of 25.6 kg m-3. Below the 25.95-kg m−3 contour, changes in density within the fjord were negligible throughout the record (Figure 3). Nonetheless, the variability in the depth of the density contours suggests the passing of internal waves. Above the sill, the deepening of the fresher, warmer, and lighter waters on 26–28 May interrupted the continuous distribution of salinity, temperature, and density between the fjord and shelf sea seen between 4–5 and 18–19 May. Below 45 m depth, the sill isolated the fresher, colder, and lighter waters from inside the fjord from the waters with relatively high salinity (>32.7 g kg−1), temperature (>-1.5°C), and density (>26.4 kg m−3) from the shelf sea.
At the sill (YS5), in the period 1–15 May, the vertical distribution of salinity and temperature above the 25.95-kg m−3 density contour were nearly homogenous (Figure 4). Vertical differences in density (0.02 kg m−3) and salinity (0.03 g kg−1) were barely noticeable (Figure 4A), while differences in temperature (<0.001°C) were negligible (Figure 4B). After 15 May, substantial changes in salinity, temperature, and density occurred. In the upper 20 m, salinity decreased to below 32.35 g kg−1 with the freshest waters (<32.15 g kg−1) occupying the top 10 m (Figure 4A). Likewise, the temperature increased from −1.75°C to above −1.64°C with the warmest waters (−1.6°C) occurring in the upper 10 m (Figure 4B). Temperature and salinity were highly correlated (−0.91), indicating changes resulted from the same process. The input of fresher and warmer waters strengthened stratification after 15 May. The vertical difference in density on 18 May between the surface and 30 m was ~0.11 kg m−3, increased to 0.15 kg m−3 on 23 May, and reached maximum values above 0.2 kg m−3 on 25 and 31 May (Figures 4A, B).

Figure 4 Hövmoller diagrams at the YS5 mooring site of (A) absolute salinity, (B) conservative temperature, (C) chlorophyll-a concentration, (D) fluorescence-colored dissolved organic matter, (E) along-fjord velocity, and (F) cross-fjord velocity. In (A–F), black contours show the potential density. The dashed line indicates 15 May.
3.2 Under-ice variability of PAR, chl-a, oxygen saturation, and fluorescence-CDOM
In Young Sound, PAR was available under the ice in May (Figures 1D–G). The average (+/- std error) PAR at the surface (0–1 m depth) increased from 50 ± 0.5 µmol photons m−2 s−1 on 4–5 May to 118 ± 0.9 μmol photons m−2 s−1 on 10–12 May, decreased slightly to 111 ± 0.8 μmol photons m−2 s−1 on 18–19 May and was the highest (242 ± 1 μmol photons m−2 s−1) on 26–28 May. In general, PAR was greater than 20 μmol photons m−2 s−1 in the upper ~2–3 m throughout the record (Figures 1D–G). Noteworthy, in the top 3 m, PAR increased from an average of 21 ± 3 μmol photons m−2 s−1 on 4–5 May to 106 ± 19 μmol photons m−2 s−1 by 26–28 May. Throughout the record, 1% (0.5 μmol photons m−2 s−1) of PAR available on 4–5 May reached 15–25 m at the mouth and 5–25 m inside Young Sound. The highest values of chl-a occurred within the patches of fresher and lighter water (Figures 3M–P). In the patch located at the mouth of the fjord, the concentration of chl-a was on average 0.27 ± 0.004 mg m−3 on 4–5 May, increased to 0.35 ± 0.005 mg m−3 by 10–12 May, remained relatively constant until 18–19 May (0.34 ± 0.003 mg m−3) and by 26–28 May, the concentration of chl-a reached an average of 0.40 ± 0.005 mg m−3. In the second patch of fresher water located at −10 km, chl-a was 0.27 ± 0.002 mg m−3 on 18–19 May and increased to 0.33 ± 0.004 mg m−3 by 26–28 May. Within the patch between −25 km and −15 km, chl-a was 0.28 ± 0.002 mg m−3 on 26–28 May. Outside the patches of fresher water, the concentration of chl-a was on average 0.15 ± 0.0003 mg m−3 throughout the record. At YS5, the concentration of chl-a mirrored the variability in salinity and temperature (Figure 4C). The correlation of chl-a with salinity (−0.84) and temperature (0.88) was relatively high, which indicates a strong association with the input of the fresher and warmer waters. Before 15 May, the concentration of chl-a was minimum (~0.15 mg m−3), and from 15 May onwards, the concentration of chl-a increased. In the upper 30 m, chl-a was on average 0.26 mg m−3 and 0.34 mg m−3 on 17–18 and 25 May, respectively. The concentration decreased to 0.22 mg m−3 on 29 May and afterward, it increased gradually until the end of the record to 0.31 mg m−3. In the top 6 m, the average concentrations accounted for 0.33 mg m−3, 0.43 mg m−3, 0.31 mg m−3, and 0.42 mg m−3 on 17–18 May, 25 May, 29 May, and 7 June, respectively. Changes in the fluorescence-CDOM signal were noticeable after the increase in chl-a (Figure 4D). Before 15 May, the highest signal (>104) occurred below the 25.95-kg m−3 density contour. From 15 May onwards, the signal gradually increased above the 25.95-kg m−3 density contour and reached the top 30 m maximum values above 106 and 107 on 31 May and 2 June, respectively.
The variability of oxygen saturation relative to the atmosphere is shown in Figures 3Q–T. In Young Sound, oxygen saturation was above 107% between ~25 m and 150 m depth, while below 150 m it was below 96%. In the upper 25 m, the oxygen saturation was more variable. The highest values (107%–117%) were located at the mouth of Young Sound and gradually decreased toward the head of the fjord to 100%–102%. At the mouth, the maximum oxygen saturation was 114% and 115% on 4–5 and 10–12 May, respectively (Figures 3Q, R). Later, the maximum oxygen saturation increased to 117% on 18–19 May and slightly decreased to 116% on 26–28 May (Figures 3S, T). Inside the fjord, the most noticeable increases in oxygen occurred. Within the patch of fresher water at −10 km, the oxygen saturation rose from an average of 106% ± 0.14% on 10–12 May to 108% ± 0.3% and 111% ± 0.11% on 18–19 and 26–28 May, respectively. Likewise, in the patch of fresher water between −25 km and −15 km, oxygen saturation increased from 106% ± 0.14% on 18–19 May to 111% ± 0.18% on 26–28 May.
3.3 Circulation in Young Sound
In the period between 1 and 15 May, the average velocity field at 12 m shows that the waters in the vicinity of the sill (YS5–YS6) were out-fjord (Figure 1H). Nonetheless, the ellipses of variability indicate the flow was disorganized. The out-fjord flow was consistent in the upper 30 m at YS5 (Figure 4E). In contrast, in the cross-fjord direction the flow was in the northern direction above the 25.95-kg m−3 density contour, while below, velocities were southward (Figure 4F). At YS2, the average velocity was southward with the variability of the flow aligned to the along-fjord direction, while at YS3, the average velocity and variability were consistently in the out-fjord direction (Figure 1H). From 15 May until the end of the record, a drastic change in the direction of the flow occurred. At YS5, velocities turned in-fjord in the upper 20 m, i.e., where fresher and warmer waters were observed (Figures 4A–E). Likewise, the flow in the cross-fjord direction inverted and was southward (Figure 4F). The velocity field shows a coherent average in-fjord flow between YS5 and YS3 after 15 May, with the ellipses of variability aligned consistently to the average flow (Figure 1I).
4 Discussion
In May, during the late stages of the ice-covered period, fresher water appeared at the surface under the ice cover in Young Sound (Figures 2, 3), and, given that in May–June there was no significant river discharge, the supply of fresher water was melt of snow and sea ice (Boone et al., 2017). The input of meltwater began at the mouth where a coastal polynya occurred in the preceding months (Dmitrenko et al., 2015; Boone et al., 2017). The polynya began in late December, lasted until early March, and was followed by land-fast ice formation until the ice broke completely in July. At the mouth, the snow thickness (20–25 cm) was half of that inside the fjord (48–49 cm) (Kirillov et al., 2015). The ice thickness was ~95 cm, that is, about ~40 cm thinner than inside Young Sound (Kirillov et al., 2015). When melting began in May (Rysgaard and Nielsen, 2006; Kirillov et al., 2015; Boone et al., 2017), the thinner layer of snow and ice seemed to ease meltwater input to occur first at the entrance of Young Sound (Figures 3, 4) (e.g., Oziel et al., 2019; Salganik et al., 2023).
In Young Sound, the light conditions in May were favorable for phytoplankton blooms, as light is no longer a limiting factor (Rysgaard et al., 2001; Holding et al., 2019). The average PAR at the surface (0–1 m depth) was 50 ± 0.5 µmol photons m−2 s−1 on 4–5 May (Figure 1D). We can consider the euphotic layer to be down to where PAR accounts for 0.5 μmol photons m−2 s−1, that is, 1% of the light at the surface on 4–5 May. In Young Sound, this threshold indicates the euphotic layer was down to 15–25 m at the mouth and 5–25 m inside Young Sound (Figures 1D–G). Thus, we expect phytoplankton growth within these depths (e.g., Kühl et al., 2001; Rysgaard et al., 2001; Holding et al., 2019). The increase in chl-a after 15 May described the onset of an under-ice bloom at YS5 that was advected from the mouth of the fjord, as shown by the velocity record. In the period marked by the beginning of the in-fjord flow (15 May) and the occurrence of fresher water (16–17 May), the average velocity was 1.2 km day−1 (Figure 3). Thus, the concentration of chl-a along with the fresher water was advected from 1.2 km to 2.4 km west of the sill, i.e., where the meltwater source and the maximum of chl-a occurred (2–11 km on 10–12 May) (Figure 3). Interestingly, despite light conditions being favorable for blooms along Young Sound since early May, the bloom was triggered at the mouth by the input of meltwater, as indicated by the high correlation of chl-a with salinity (−0.84) and temperature (0.88) (Figures 4A–C), and the matching distribution of the highest chl-a with the lowest salinity and density (Figure 3). Meltwater input provided a stable water column for phytoplankton to be in the reach of light below the ice (Figures 2, 3) (e.g., Cherkasheva et al., 2014; Mundy et al., 2014; Oziel et al., 2019; Castagno et al., 2023). That is, stratification strengthened as shown by the increase in the vertical differences in the upper 30 m from 0.02 kg m−3 to >0.2 kg m−3 (Figure 3), which agrees with other studies where similar differences triggered and maintained phytoplankton blooms (Oziel et al., 2019; Ruiz-Castillo et al., 2019). Therefore, meltwater input and the concomitant stratification were more important than light availability for the triggering of the under-ice bloom. However, in Young Sound, the nutrient concentration in the upper part of the water column is extremely low (Holding et al., 2019; Søgaard et al., 2021), and therefore, the slight increase in the concentration of chl-a from 0.27 mg m−3 to 0.40 mg m−3 in 22–23 days suggests that low availability of nutrients constrained further phytoplankton growth. The variability in the fluorescence-CDOM signal at YS5 provides further evidence of the onset of a phytoplankton bloom event (Figure 4D). CDOM in the meltwater from the Greenland ice sheet is negligible (Stedmon et al., 2015), and there was no hydrographic evidence of upward entrainment from below the 25.95-kg m−3 isopycnal, suggesting changes in the fluorescence-CDOM signal were biologically driven (e.g., Sasaki et al., 2005; Suksomjit et al., 2009). As phytoplankton bloomed, phytoplankton mortality and bacterial production intensified the fluorescence-CDOM (e.g., Sasaki et al., 2005; Organelli et al., 2014). Furthermore, the effects of the onset of the under-ice bloom were visible on the oxygen supersaturation relative to the atmosphere (Figures 3Q–T). In the area of the patch of meltwater at the mouth of Young Sound on 26–28 May, the average oxygen saturation was 108% ± 0.16% on 4–12 May and increased to 113% ± 0.12% on 18–19 and remained relatively constant (112% ± 0.06%) until 26–28 May, respectively. Ice-meltwater cannot be the source as sea ice is oxygen-depleted (Rysgaard et al., 2008; Attard et al., 2018), and therefore, the increases in oxygen were biologically produced (e.g., Frajka-Williams et al., 2009).
Inside Young Sound, two patches of meltwater were observed at −10 km and −20 km (Figures 3A–D). At these locations, the thickness of the snow and ice were twice and ~1.4 greater than the thickness on the shelf side of the sill (Kirillov et al., 2015). The greater insulating effect of the snow coverage to atmospheric heat and a thicker ice layer suggest melting was not occurring yet inside Young Sound. Instead, the velocity records indicated the meltwater was advected by the in-fjord flow (Figure 1I) (Boone et al., 2017). Nonetheless, the sections of salinity show discontinuities in the patches of meltwater along Young Sound (Figure 3). We attribute these discontinuities to variations in the cross-fjord flow. For instance, at YS2, the average velocity showed a significant component of the flow heading into the northern edge of the fjord (Figure 1I). Potentially, the meltwater introduced by the in-fjord flow turned northward before reaching YS2, which might explain the absence of meltwater between 18 and 28 May at this mooring site (Figure 3). The meltwater propagated along the northern edge of the fjord and was not sampled by the CTD casts, which at the mouth were performed closer to the southern edge (Figure 1B). At YS3, the flow turned southward (Figure 1I) and seemed to transport the meltwater into this mooring site, which is consistent with the presence of meltwater on 18–28 May (Figures 3C, D). Inside Young Sound, the in-fjord advection of meltwater had further implications for the chl-a and oxygen saturation. In the area covered by meltwater on 26–28 May, the onset of under-ice blooms occurred, as shown by the concentration of chl-a and oxygen saturation being two times (28–33 mg m−3) and 5% higher than outside the patches of meltwater where chl-a and oxygen remained relatively constant at 0.15 mg m−3 and below 106%–107% (Figures 3Q–T). However, it is unclear whether the increases in chl-a and oxygen saturation occurred at the mouth and then were advected into Young Sound or if the increase in chl-a and oxygen occurred inside the fjord between YS5 and YS3 while the patches of meltwater were transported through relatively high light availability (>0.5 μmol photons m−2 s−1) (Figures 1D–G). Either way, enhancement of chl-a and oxygen were constrained by meltwater and concomitant stratified conditions, which emphasize the role of meltwater input on the onset of under-ice phytoplankton blooms.
Overall, we expect the amount of under-ice blooms in Arctic fjords and seas to increase in the last stages of the seasonal ice cover, i.e., during the transition period to summer ice-free conditions. Light is no longer a limiting factor; local-ice meltwater input stabilizes the water column for phytoplankton to be in the reach of light, and the euphotic layer is nutrient-repleted. This highlights the possibility that a substantial part of the phytoplankton blooms and consequent primary production in the high-Arctic takes place prior to ice break up. Particularly, productivity in under-ice blooms has been reported to be an order of magnitude greater than blooms in ice-free conditions in Young Sound (Holding et al., 2019; Søgaard et al., 2021) and Arctic Ocean (Arrigo et al., 2014). If the local ice meltwater input plays a determinant role in the seasonal triggering of blooms in the high Arctic, as described in this research, then the melting period and effects of under-ice meltwater on the physical structure of the water column need to be better understood (and sampled). With similar characteristics in the Arctic region, we expect the melt period to be a crucial moment for primary production and carbon drawdown. Without long-term observations spanning from ice-cover to ice-free conditions, the contribution of under-ice blooms to total pelagic primary production in the Arctic seems to have been greatly underestimated.
Data availability statement
The data presented in this study are deposited in the PANGAEA repository, https://doi.pangaea.de/10.1594/PANGAEA.964812 https://doi.pangaea.de/10.1594/PANGAEA.964811 https://doi.pangaea.de/10.1594/PANGAEA.964980 https://doi.pangaea.de/10.1594/PANGAEA.964808 https://doi.pangaea.de/10.1594/PANGAEA.964983.
Author contributions
ER-C: Conceptualization, Data curation, Formal Analysis, Investigation, Writing – original draft. JV: Conceptualization, Investigation, Writing – review & editing. SK: Investigation, Writing – review & editing. ID: Investigation, Writing – review & editing. WB: Investigation, Writing – review & editing. SR: Conceptualization, Investigation, Writing – review & editing.
Funding
The author(s) declare financial support was received for the research, authorship, and/or publication of this article. This study received financial support from the Arctic Research Centre, Aarhus University and the Aage V. Jensens Foundations (Grant No. 30122021).
Acknowledgments
The study forms a contribution to the Arctic Science Partnership (ASP). We would like to thank Egon Frandsen for the logistic assistance.
Conflict of interest
The authors declare that the research was conducted in the absence of any commercial or financial relationships that could be construed as a potential conflict of interest.
The author(s) declared that they were an editorial board member of Frontiers, at the time of submission. This had no impact on the peer review process and the final decision.
The Reviewer LM declared a past co-authorship with the authors SK, ID, and SR.
Publisher’s note
All claims expressed in this article are solely those of the authors and do not necessarily represent those of their affiliated organizations, or those of the publisher, the editors and the reviewers. Any product that may be evaluated in this article, or claim that may be made by its manufacturer, is not guaranteed or endorsed by the publisher.
References
Ardyna M., Mundy C. J., Mayot N., Matthes L. C., Oziel L., Horvat C., et al. (2020). Under-Ice Phytoplankton blooms: Shedding light on the “invisible” part of Arctic primary production. Front. Mar. Sci. 7. doi: 10.3389/fmars.2020.608032
Arrigo K. R., Perovich D. K., Pickart R. S., Brown Z. W., van Dijken G. L., Lowry K. E., et al. (2014). Phytoplankton blooms beneath the sea ice in the Chukchi sea. Deep Sea Res. II 105, 1–16. doi: 10.1002/2014JC010501
Attard M. K., Søgaard D. H., Piontek J., Lange B. A., Katlein C., Sørensen H. L., et al. (2018). Oxygen fluxes beneath Arctic land-fast ice and pack ice: towards estimates of ice productivity. Polar Biol. 41, 2119–2134.
Belchansky G. I., Douglas D. C., Platonov N. G. (2004). Duration of the arctic sea ice melt season: regional and interannual variability 1979-2001. J. Climate 17 (1), 67–80. doi: 10.1175/1520-0442(2004)017<0067:DOTASI>2.0.CO;2
Boone W., Rysgaard S., Carlson D. F., Meire L., Kirillov S., Mortensen J., et al. (2018). Coastal freshening prevents fjord bottom water renewal in Northeast Greenland: A Mooring study from 2003 to 2015. Geophys. Res. Lett. 45 (6), 2726–2733. doi: 10.1002/2017GL076591
Boone W., Rysgaard S., Kirillov S., Dmitrenko I., Bendtsen J., Mortensen J., et al. (2017). Circulation and fjord-shelf exchange during the ice-covered period in Young Sound-Tyrolerfjord, Northeast Greenland (74°N). Estuarine Coast. Shelf Sci. 194, 205–216. doi: 10.1016/j.ecss.2017.06.021
Brown K. A., Holding J., Carmack E. C. (2020). Understanding regional and seasonal variability is key to gaining a pan-arctic prespective on arctic ocean freshening. Front. Mar. Sci. 7. doi: 10.3389/fmars.2020.00606
Carmack E., Polyakov I., Padman L., Fer I., Hunke E., Hutchings J., et al. (2015). Toward quantifying the increasing tole of oceanic heat in Sea Ice Loss in the New Arctic. Bull. Am. Meterological Soc. 96 (12), 2079–2105. doi: 10.1175/BAMS-D-13-00177.1
Carmack E. C., Yamamoto-Kawai M., Haine T. W. N., Bacon S., Bluhm B. A., Lique C., et al. (2016). Freshwater and its role in the Arctic Marine system: sources, disposition, storage, export, and physical and biogeochemical consequences in the Arctic and global oceans. J. Geophysical Res. Biogeosciences. 121 (3), 675–717. doi: 10.1002/2015JG003140
Castagno A. P., Wagner T. J. W., Cape M. R., Lester C. W., Bailey E., Ales-de-Souza C., et al. (2023). Increased sea ice melt as a driver of enhanced Arctic phytoplankton blooming. Glob Change Biol. 00, 1–12. doi: 10.1111/gcb.16815
Cherkasheva A., Bracher A., Melsheimer C., Köberle C., Gerdes R., Nöthig E.-M., et al. (2014). Influence of the physical environment on polar phytoplankton blooms: A case study in the Fram Strait. J. Mar. Syst. 132, 196–207. doi: 10.1016/j.jmarsys.2013.11.008
Dmitrenko I. A., Kirillov S. A., Rysgaard S., Barber D. G., Babb D. G., Pedersen L. T., et al. (2015). Polynya impacts on water properties in a Northeast Greenland fjord. Estuarine Coast. shelf Sci. 153 (5), 10–17. doi: 10.1016/j.ecss.2014.11.027
Fetter F., Untersteiner N. (1998). Observations of melt ponds on Arctic sea ice. J. Geophysical Res. 103 (c11), 24821–24835. doi: 10.1029/98JC02034
Frajka-Williams E., Rhines P. B., Eriksen C. C. (2009). Physical controls and mesoscale variability in the Labrador Sea spring phytoplankton bloom observed by Seaglider. Deep Sea Res. Part 1 56 (12), 2144–2161. doi: 10.1016/j.dsr.2009.07.008
Geilfus N.-X., Delille B., Tison J.-L., Lemes M., Rysgaard S. (2023). Gas dynamics within landfast sea ice of an Arctic fjord (NE Greenland) during the spring-summer transition. Elementa: Sci. Anthropocene 11, 1, 56. doi: 10.1525/elementa.2022.00056
Holding J. M., Markager S., Juul-Pedersen T., Paulsen M. L., Møller E. F., Meire L., et al. (2019). Seasonal and spatial patterns of primary production in a high-latitude fjord affected by Greenland Ice sheet run-off. Biogeosciences 16 (19), 3777–3792. doi: 10.5194/bg-16-3777-2019
Kirillov S., Dmitrenko I., Babb D., Rysgaard S., Barber D. (2015). The effect of ocean heat flux on seasonal ice growth in Young Sound (Northeast Greenland). J. Geophysical Res. oceans 120 (7), 4803–4824. doi: 10.1002/2015JC010720
Korhonen M., Rudels B., Marnela M., Wisotzki A., Zhao J. (2013). Time and space variability of freshwater content, heat content and seasonal ice melt in the Arctic Ocean from 1991 to 2011. Ocean Sci. 9 (6), 1015–1055. doi: 10.5194/os-9-1015-2013
Kühl M., Glud R. N., Borum J., Roberts R., Rysgaard S. (2001). Photosynthetic performance of surface-associated algae below sea ice as measured with a pulse-amplitude-modulated (PAM) fluorometer and O2 microsensors. Mar. Ecol. Prog. Ser. 223, 1–14. doi: 10.3354/meps223001
Kwok R. (2018). Arctic sea ice thickness, volume, and multiyear ice coverage: losses and coupled variability, (1958-2018). Environ. Res. Lett. 13, 105005. doi: 10.1088/1748-9326/aae3ec
Lincoln B. J., Rippeth T. P., Lenn Y.-D., Timmermans M. L., Williams W. J., Bacon S. (2016). Wind-driven mixing at intermediate depths in an ice-free Arctic Ocean. Geophys. Res. Lett. 43 (18), 9749–9756. doi: 10.1002/2016GL070454
McDougall T. J., Barker P. M. (2011). Getting started with TEOS-10 and the gibbs seawater (GSW) oceanographic toolbox. 28, SCOR/IAPSO WG127, ISBN 978-0-646-55621-5.
Mundy C. J., Gosselin M., Gratton Y., Brown K., Galindo V., Campbell K., et al. (2014). Role of environmental factors on phytoplankton bloom initiation under landfast sea ice in Resolute Passage, Canada. Mar. Ecol. Prog. Ser. 497, 39–49. doi: 10.3354/meps10587
Organelli E., Bricaud A., Antoine D., Matsuoka A. (2014). Seasonal dynamics of light absorption by chromophoric dissolved organic matter (CDOM) in the NW Mediterranean Sea (BOUSSOLE site). Deep Sea Res. Part 1 91, 72–85. doi: 10.1016/j.dsr.2014.05.003
Oziel L., Massicotte P., Randelhoff A., Ferland J., Vladoiu A., Lacour L., et al. (2019). Environmental factors influencing the seasonal dynamics of spring algal blooms in and beneath sea ice in western Baffin Bay. Elem. Sci. Anth 7, 34. doi: 10.1525/elementa.372
Polyakov I. V., Rippeth T. P., Fer I., Baumann T. M., Carmack E. C., Ivanov V. V., et al. (2020). Intensification of near surface currents and shear in the Eastern Arctic Ocean. Geophys. Res. Lett. 47 (16), e2020GL089469. doi: 10.1029/2020GL089469
Proshutinsky A., Krishfield R., Toole J. M., Timmermans M.-L., Williams W., Zimmermann S., et al. (2019). Analysis of the beaufort gyre freshwater content in 2003-2018. J. Geophysical Res. 124 (12), 9658–9689. doi: 10.1029/2019JC015281
Rabe B., Karcher M., Kauker F., Schauer U., Toole J. M., Krishfiled R. A., et al. (2014). Arctic Ocean basin liquid freshwater storage trend 1992-2012. Geophysical Res. Letter 41 (3), 961–968. doi: 10.1002/2013GL058121
Randelhoff A., Fer I., Sundfjord A. (2017). Turbulent Upper-Ocean Mixing affected by meltwater layers during Arctic Summer. J. Phys. Oceanography 47 (4), 835–853. doi: 10.1175/JPO-D-16-0200.1
Ruiz-Castillo E., Sharples J., Hopkins J. (2019). Wind-driven strain extends seasonal stratification. Geophys. Res. Lett. 46 (22), 13244–13252. doi: 10.1029/2019GL084540
Rysgaard S., Kühl M., Glud R. N., Hansen J. W. (2001). Biomass, production and horizontal patchiness of sea ice algae in a high-Arctic fjord (Young Sound, NE Greenland). Mar. Ecol. Prog. Ser. 223, 15–26. doi: 10.3354/meps223015
Rysgaard S., Nielsen T. G. (2006). Carbon cycling in a high-arctic marine ecosystem-Young Sound, NE Greenland. Prog. Oceanography 71 (2-4), 426–445. doi: 10.1016/j.pocean.2006.09.004
Rysgaard S., Nielsen T. G., Hansen B. W. (1999). Seasonal variation in nutrients, pelagic primary production and grazing in a high-Arctic coastal marine ecosystem, Young Sound, Northeast Greenland. Mar. Ecol. Prog. Ser. 179, 13–25. doi: 10.3354/meps179013
Rysgaard S., Thamdrup B., Risgaard-Petersen N., Fossing H., Berg P., Christensen P. B., et al. (1998). Seasonal carbon and nutrient mineralization in a high-Arctic coastal marine sediment, Young Sound, Northeast Greenland. Mar. Ecol. Prog. Ser. 175, 261–276. doi: 10.3354/meps175261
Rysgaard S., Vang T., Stjernholm M., Rasmussen B., Windelin A., Kiilsholm S. (2003). Physical conditions, carbon transport, and climate change impacts in a northeast Greenland fjord. Arctic Antarctic Alpine Res. 35 (3), 301–312. doi: 10.1657/1523-0430(2003)035[0301:PCCTAC]2.0.CO;2
Rysgaard S., Guld R. N., Sejr M. K., Blicher M. E., Stahl H. J. (2008). Denitrification ativity and oxygen dynamics in Arctic sea ice. Polar Biol. 31, 527–537.
Salganik E., Katlein C., Lange B. A., Matero I., Lei R., Fong A. A., et al. (2023). Temporal evolution of under-ice meltwater layers and false bottoms and their impact on summer Arctic sea ice mass balance. Elementa: Sci. Anthropocene 11, 1, 35. doi: 10.1525/elementa.2022.00035
Sasaki H., Miyamura T., Saitoh S.-i., Ishizaka J. (2005). Seasonal variation of absorption by particles and colored dissolves organic matter (CDOM) in Funka Bay, southwestern Hokkaido, Japan. Estuarine Coastlan Shelf Sci. 64 (2-3), 447–458. doi: 10.1016/j.ecss.2005.03.008
Slagstad D., Wassmann P. F. J., Ellingsen I. (2015). Physical constrains and productivity in the future Arctic Ocean. Front. Mar. Sci. 2. doi: 10.3389/fmars.2015.00085
Søgaard D. H., Sorrell B. K., Sejr M. K., Andersen P., Rysgaard S., Hansen P. J., et al. (2021). An under-ice bloom of mixotrophic haptophytes in low nutrient and freshwater-influenced Arctic waters. Sci. Rep. 11, 2915. doi: 10.1038/s41598-021-82413-y
Solomon A., Heuzé C., Rabe B., Bacon S., Bertino L., Heimbach P., et al. (2021). Freshwater in the arctic ocean 2010-2019. Ocean Sci. 17 (4), 1081–1102. doi: 10.5194/os-17-1081-2021
Stedmon C. A., Granskog M. A., Dodd P. A. (2015). An approach to estimate the freshwater contribution from glacial melt and precipitation in East Greenland shelf waters using colored dissolved organic matter (CDOM). J. Geophysical Res. Oceans 120 (2), 1107–1117. doi: 10.1002/2014JC010501
Stroeve J. C., Markus T., Boisvert L., Miller J., Barret A. (2014). Changes in Arctic melt season and implications for sea ice loss. Geophysical Res. Lettters 41, 1216–1225. doi: 10.1002/2013GL058951
Stroeve J., Notz D. (2018). Changing state of Arctic Sea ice across all seasons. Environ. Res. letters. 13, 103001. doi: 10.1088/1748-9326/aade56
Suksomjit M., Nagao S., Ichimi K., Yamada T., Tada. K. (2009). Variation of dissolved organic matter and fluorescence characteristics before, during and after phytoplankton bloom. J. Oceanography 65, 835–846. doi: 10.1007/s10872-009-0069-x
Wagner D. N., Shupe M. D., Cox C., Persson O. G., Uttal T., Frey M. M., et al. (2022). Snowfall and snow accumulation during the MOSAiC winter and spring seasons. Cryosphere 16, 2373–2402. doi: 10.5194/tc-16-2373-2022
Keywords: under-ice phytoplankton bloom, meltwater input, stratification, Arctic fjord, Young Sound-Greenland
Citation: Ruiz-Castillo E, Verdugo J, Kirillov S, Dmitrenko I, Boone W and Rysgaard S (2024) The role of local-ice meltwater in the triggering of an under-ice phytoplankton bloom in an Arctic fjord. Front. Mar. Sci. 11:1291187. doi: 10.3389/fmars.2024.1291187
Received: 08 September 2023; Accepted: 02 January 2024;
Published: 31 January 2024.
Edited by:
Rolf Gradinger, UiT The Arctic University of Norway, NorwayReviewed by:
Philipp Assmy, Norwegian Polar Institute, NorwayLisa C. Matthes, Fisheries and Oceans Canada (DFO), Canada
Copyright © 2024 Ruiz-Castillo, Verdugo, Kirillov, Dmitrenko, Boone and Rysgaard. This is an open-access article distributed under the terms of the Creative Commons Attribution License (CC BY). The use, distribution or reproduction in other forums is permitted, provided the original author(s) and the copyright owner(s) are credited and that the original publication in this journal is cited, in accordance with accepted academic practice. No use, distribution or reproduction is permitted which does not comply with these terms.
*Correspondence: Eugenio Ruiz-Castillo, ZXJ1aXpjYXNAYmlvLmF1LmRr